Embed Size (px)
Citation preview
DEPARTAMENTO DE CIÊNCIAS DA VIDA
FACULDADE DE CIÊNCIAS E TECNOLOGIAUNIVERSIDADE DE COIMBRA
Year-round distribution suggests spatial
segregation of Cory’s Shearwaters (Calonectris
diomedea borealis), based on breeding
experience.
Rogério Velloso Missagia
2013
Ro
gér
ioV
ello
soM
issa
gia
Yea
r-ro
und d
istr
ibuti
on s
ugges
ts s
pat
ial
segre
gat
ion o
f C
ory
’s S
hea
rwat
ers,
bas
ed o
n b
reed
ing e
xper
ience
2013
DEPARTAMENTO DE CIÊNCIAS DA VIDA
FACULDADE DE CIÊNCIAS E TECNOLOGIAUNIVERSIDADE DE COIMBRA
Year-round distribution suggests spatial
segregation of Cory’s Shearwaters (Calonectris
diomedea borealis), based on breeding
experience.
Rogério Velloso Missagia
2013
Dissertação apresentada à Universidade de
Coimbra para cumprimento dos requisitos
necessários à obtenção do grau de Mestre em
Ecologia Aplicada, realizada sob a orientação
científica do Professor Doutor Jaime Albino
Ramos (Universidade de Coimbra) e do Doutor
Vítor Hugo Paiva (Universidade de Coimbra).

Acknowledgements
I would like to express my deepest gratitude to my supervisors, Dr. Jaime Albino
Ramos and Dr. Vítor Hugo Paiva, for their trust and support during this jouney. Never
have I met such dedicate and passionate researchers, and I hope to take some of these
values with me for the rest of my life. I will never forget your willingness and patience
to teach me. I mean it.
I would also like to thank Felipe Ceia, for the results from isotope analysis, and
Rahel Borrmann, for going out of her way to provide me with pictures from Berlengas. I
really appreciate all the hard work, and hope that someday I can repay the favor.
No words can describe my gratitude to my wonderful parents Rogério and
Zelinha, for all the unconditional love and encouragement not only during the last two
years, but through my whole life. To my baby sister, Rafaela (you’ll always be my baby
sister, get over it), for helping me laugh when I needed, and pushing me to work when I
was unmotivated. These are feelings that extend beyond my professional life, and make
me a better man. You three are my life, and I love you all very much.
To all my colleagues from the Master’s Program in Applied Ecology: Alex, Ana,
Anne Marie, Asgdom, Devathi, Emma, Jonathan, Juliana, Justyna, Lizzie, Maria
Fernanda, Mine, Nicolás, Olga, Pamela, Peya, Rebecca, Samir and Wasseem. You are
an outstanding group of people, thank you for all the help and experiences.

A small bird came toward the skiff from the north. He was a warbler and flying very low over the water.
The old man could see that he was very tired. The bird made the stern of the boat and rested there. Then
he flew around the old man’s head and rested on the line where he was more comfortable.
“How old are you?” the old man asked the bird. “Is this your first trip?”
The bird looked at him when he spoke. He was too tired even to examine the line and he teetered on it as
his delicate feet gripped it fast.
“It’s steady,” the old man told him. “It’s too steady. You shouldn’t be that tired after a windless night.
What are birds coming to?”
The hawks, he thought, that come out to sea to meet them. But he said nothing of this to the bird who
could not understand him anyway and who would learn about the hawks soon enough.
“Take a good rest, small bird,” he said. “Then go in and take your chance like any man or bird or fish.”
Ernest Hemingway, The old man and the Sea

Table of Contents
Abstract ---------------------------------------------------------------------------------------------- I
Resumo --------------------------------------------------------------------------------------------- III
List of Tables -------------------------------------------------------------------------------------- V
List of Figures ------------------------------------------------------------------------------------ VI
Chapter 1 – Introduction ------------------------------------------------------------------------ 1
1.1 – Top predators foraging over the marine environment ------------------------- 2
1.2 – Procellariiformes and the Marine Environment --------------------------------- 4
1.3 – Influence of environmental variables on seabirds ------------------------------ 6
1.4 – Foraging strategies of experienced and inexperienced ------------------------- 7
1.5 – Study rationale --------------------------------------------------------------------- 10
Chapter 2 – Methods ---------------------------------------------------------------------------- 11
2.1 – Study Species – Cory’s Shearwater (Calonectris diomedea borealis) ---- 12
2.2 – Study Area -------------------------------------------------------------------------- 14
2.2.1 – Berlengas Archipelago ------------------------------------------------ 14
2.2.2 – The Atlantic Ocean ---------------------------------------------------- 16
2.3 – Geolocators and Tracking -------------------------------------------------------- 19
2.4 – Tracking and Activity Analysis ------------------------------------------------- 21
2.5 – Stable isotope analysis ------------------------------------------------------------ 23
2.6 – Kernel Utilization Distribution -------------------------------------------------- 25
2.7 – Environmental predictors -------------------------------------------------------- 26
2.8 – Species distribution modelling -------------------------------------------------- 27
2.8.1 – Data processing and exploratory analysis -------------------------- 27
2.8.2 – Model construction ---------------------------------------------------- 28
2.8.3 – Model evaluation and calibration ------------------------------------ 29
Chapter 3 – Results------------------------------------------------------------------------------ 32
3.1 – Migratory profile ------------------------------------------------------------------ 33
3.2 – Activity analysis ------------------------------------------------------------------- 37
3.3 – Stable isotope analysis ------------------------------------------------------------ 40
3.4 – Species distribution modelling -------------------------------------------------- 44
Chapter 4 – Discussion ------------------------------------------------------------------------- 47
4.1 – Migratory profile of experienced and inexperienced birds ------------------ 48
4.2 – Activity levels---------------------------------------------------------------------- 52
4.3 – Comparison of foraging ecology related to experience ---------------------- 55
4.4 – Future scenarios ------------------------------------------------------------------- 57
4.5 – Conclusion ------------------------------------------------------------------------- 60
References ----------------------------------------------------------------------------------------- 61
I
Abstract
Individual experience is considered an important factor in seabirds’ ecology,
determining the differences in distribution and behaviour of experienced and
inexperienced individuals. Recent studies show that individuals with little experience
are generally more pelagic and foraging explorers than more experienced birds.
However, most part of these studies is focused on the breeding period of a given
species, with little information regarding the post-breeding season, when extensive
migrations and wintering processes take place.
This study analyzed the differences in spatial distribution and behaviour of
fourteen individuals belonging to a population of Cory’s Shearwaters (Calonectris
diomedea borealis) breeding on Berlenga Island, offshore the Portuguese coast. The
group was divided between experienced and inexperienced, based on individual
breeding success, and each bird was tracked for one year, from September, 2011 to
August, 2012, using geolocators (GLS). Carbon and nitrogen stable isotopes were
analyzed from primary feathers and breast feathers. The results were processed with
softwares for mapping and statistical analysis, and a modelling exercise was carried out,
in order to verify possible variations in distribution induced by climatic changes over
the next 100 years.
Results confirm that inexperienced birds present a more pelagic behaviour than
experienced birds, with extensive migratory routes, marked by several stopovers, and a
higher number of wintering grounds, while experienced individuals migrate through
shorter routes, and present few wintering areas. Different foraging strategies were also
encountered, with experienced individuals foraging close to coastal areas, while
inexperienced birds foraged more on pelagic areas. The main environmental variables
II
influencing the spatial distribution of experienced birds were distance to land and sea
surface temperature, while inexperienced individuals were influenced by wind speed
during winter and sea surface temperature. The results from the modelling exercise
show that global warming might exercise significant influence on the spatial distribution
of Cory’s Shearwaters, especially on experienced birds. These changes might generate
situations of high inter- and intra-specific competition, reducing breeding success and
disturbing the population dynamics of the species.
It is safe to conclude that individual experience is an important factor to
determine the spatial distribution and behaviour of pelagic seabirds such as Cory’s
Shearwaters. However, this factor should not be analyzed individually, but together
with any highly influential environmental variables.
Keywords: Spatial segregation, Breeding experience, Calonectris diomedea borealis.
III
Resumo
A experiência individual é considerada um fator importante na ecologia de aves
marinhas, determinando as diferenças na distribuição e no comportamento de indivíduos
experientes e inexperientes. Estudos recentes mostram que indivíduos com pouca
experiência geralmente são mais pelágicos e exploradores do que aves experientes. No
entanto, a maior parte desses estudos tem sido focada no período reprodutivo de
determinada espécie, com pouca informação relativa à época pós-reprodutiva, quando
ocorrem as grandes migrações e os processos de invernada.
Este estudo analisou as diferenças na distribuição e no comportamento de
quatorze indivíduos pertencentes a uma população de Cagarras (Calonectris diomedea
borealis) que se reproduz na Berlenga, costa ocidental portuguesa. O grupo foi dividido
entre indivíduos experientes e inexperientes, com base no sucesso reprodutivo de cada
um, e cada ave foi rastreada por um período de um ano, de Setembro de 2011 a Agosto
de 2012, através de geolocators (GLS). Análises de isótopos de carbono e azoto foram
efectuadas utilizando penas primárias e do peito. Os resultados foram processados com
sistemas de informação geográfica e análise estatística, e um exercício de modelação foi
feito com o intuito de verificar possíveis alterações induzidas por mudanças climáticas
nos próximos 100 anos.
Os resultados confirmam que aves inexperientes apresentam comportamento
mais pelágico e exploratório do que aves experientes, com rotas migratórias extensas e
várias paragens intermédias e maior número de zonas de invernada, enquanto indivíduos
experientes migram por rotas mais curtas e possuem pouca variação no destino final.
Diferenças nas estratégias de forrageamento também foram encontradas, com
indivíduos experientes a alimentarem-se junto a áreas costeiras, enquanto aves
IV
inexperientes se alimentaram em zonas pelágicas. As principais variáveis ambientais
que influenciaram a distribuição de aves experientes foram distância a zonas costeiras e
a temperatura superficial da água do mar (SST), enquanto indivíduos inexperientes
foram influenciados pelas características do vento e SST. O resultado da modelação
mostra que o aquecimento global pode exercer uma influência significativa na
distribuição das Cagarras, especialmente em aves experientes. Essas mudanças podem
gerar situações de elevada competição inter- e intra-específica, prejudicando o sucesso
reprodutivo e a dinâmica populacional da espécie.
Podemos concluir que a experiência individual é um fator importante para se
determinar a distribuição e o comportamento de aves marinhas pelágicas como as
Cagarras. No entanto, este fator não deve ser analisado isoladamente, mas em conjunto
com variáveis ambientais altamente influentes.
Palavras-chave: Segregação espacial, Experiência reprodutiva, Calonectris diomedea
borealis.
V
List of Tables
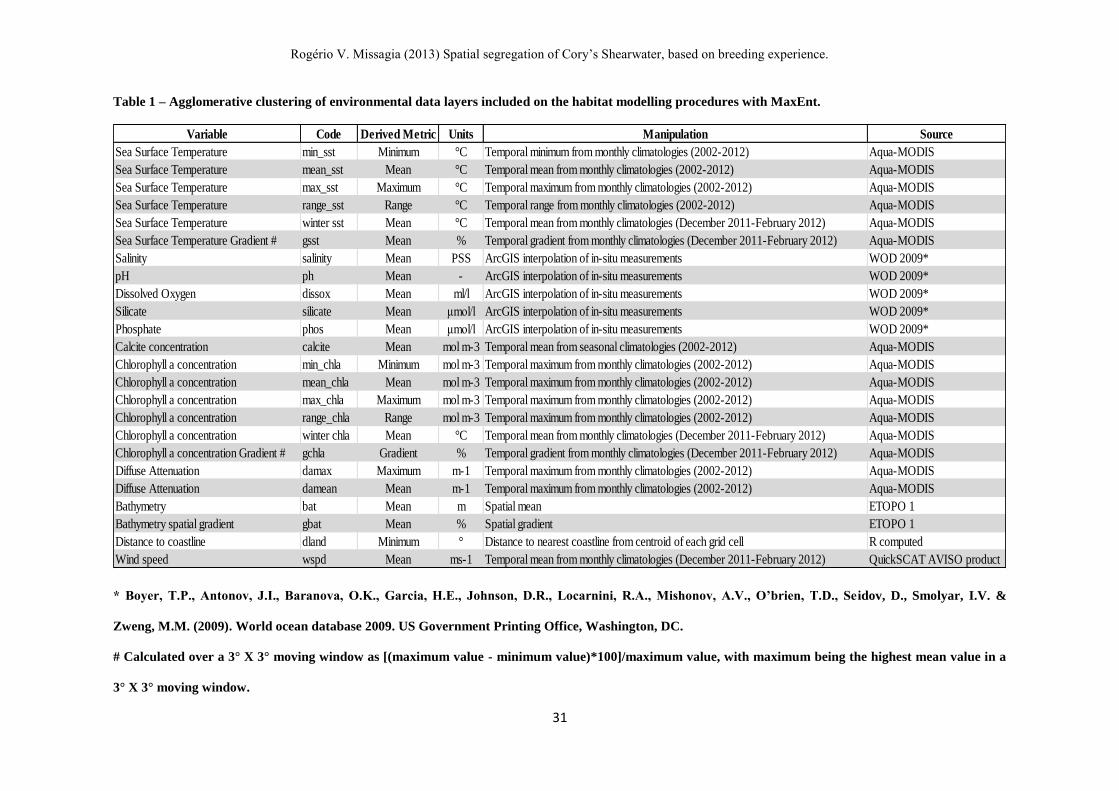
Table 1 – Agglomerative clustering of environmental data layers included on the
habitat modelling procedures with MaxEnt. -------------------------------------------------- 31
Table 2 – Tracking summary for 14 Cory’s Shearwaters from Berlenga Island, tracked
from September – 2011 to September – 2012. ------------------------------------------------ 35
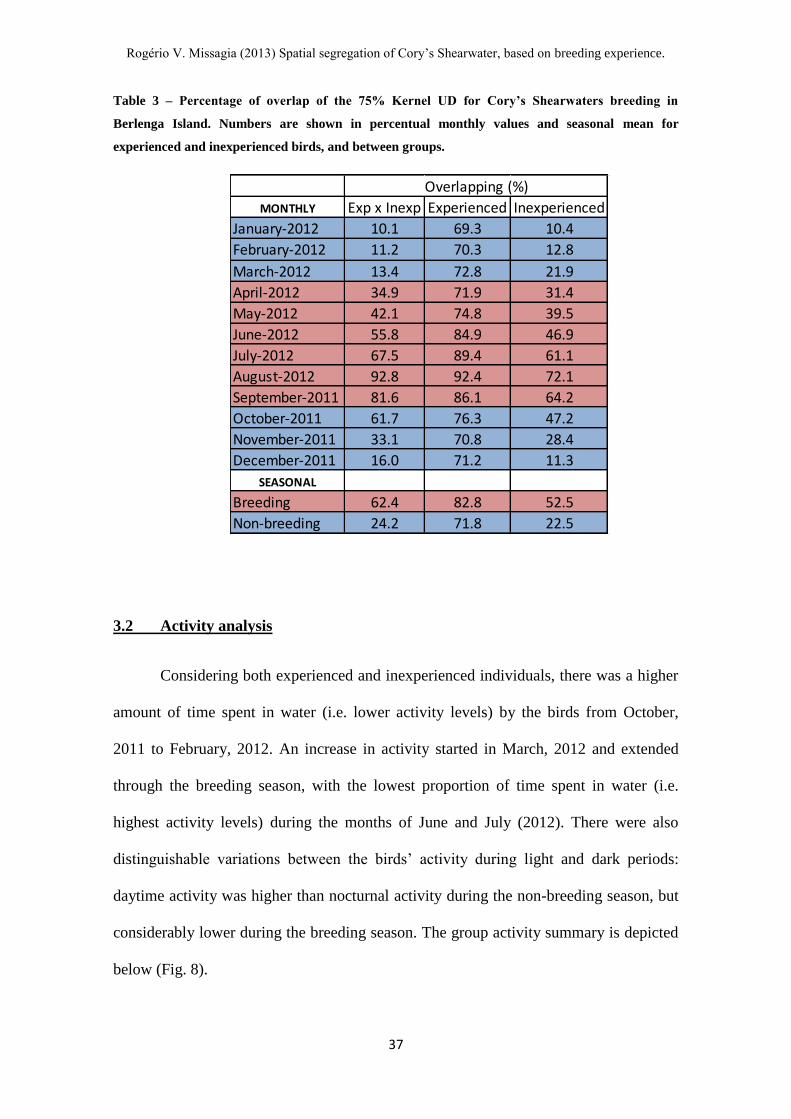
Table 3 – Percentage of overlap of the 75% Kernel UD for Cory’s Shearwaters
breeding in Berlenga Island. --------------------------------------------------------------------- 37
Table 4 – Relative contribution and permutation importance of environmental variables
applied to MaxEnt model for experienced and inexperienced birds. ---------------------- 44

VI
List of Figures
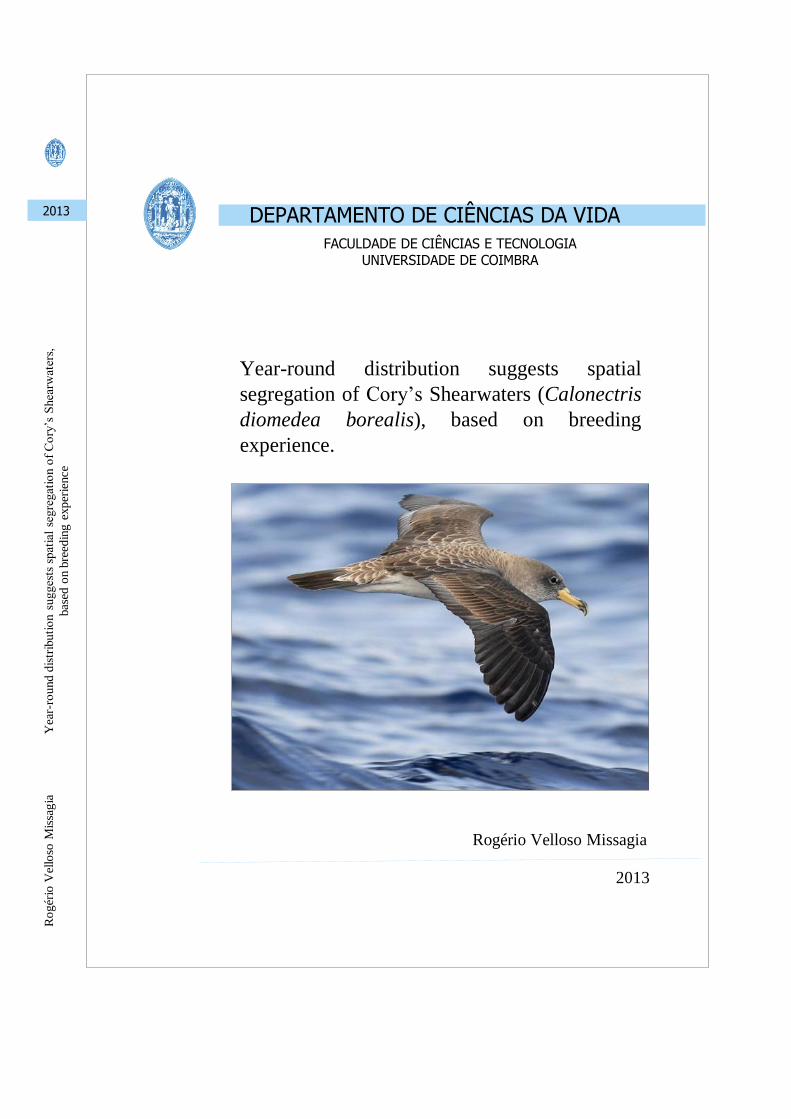
Figure 1 – Cory’s Shearwater (Calonectris diomedea borealis) in flight. --------------- 14
Figure 2 – General near-surface circulation patterns of the North Atlantic Ocean. ---- 17
Figure 3 – Near-surface circulation processes of the South Atlantic Ocean. ------------ 18
Figure 4 – Example of stratified profile focused on temperature values (°C), following
a section from Antarctica to Brazil. ------------------------------------------------------------ 19
Figure 5 – Geolocator model MK5 attached to a Cory’s Shearwater specimen. -------- 21
Figure 6 – Example of migratory profile analyzed in ArcGIS (bird 13).----------------- 33
Figure 7 – Kernel utilization distributions for Cory’s Shearwaters from September,
2011 to August, 2012. ---------------------------------------------------------------------------- 36
Figure 8 – Monthly (A), daily (24h), (B) daytime and (C) night-time activity profile for
14 Cory’s Shearwaters from Berlenga Island, expressed through proportion of time
spent in water. ------------------------------------------------------------------------------------- 38
Figure 9 – Differences in proportion of time spent in water (A), daily (24h), (B)
daytime and (C) night-time between experienced (light grey) and inexperienced (dark
grey) Cory’s Shearwaters. ----------------------------------------------------------------------- 39
Figure 10 – Stable isotope analysis for δ15C in sampled feathers of Cory’s Shearwaters
from Berlenga Island.----------------------------------------------------------------------------- 40
Figure 11 – Stable isotope analysis for δ15N in sampled feathers from Cory’s
Shearwaters from Berlenga Island. ------------------------------------------------------------- 41
Figure 12 – A) Isotopic niches for different experience levels of Cory’s Shearwaters
from Berlenga Island (Inexp = inexperienced, Exp = experienced), represented in
Bayesian Ellipses for overall non-breeding period (breast), breeding season (P1) and
wintering (S8). B) Standard ellipse areas (SEAc) for corresponding periods. ----------- 46
Figure 13 – Present and future foraging distribution of Cory’s Shearwaters from
Berlenga Island, based on the A2 scenario from the International Panel on Climate
Change. --------------------------------------------------------------------------------------------- 47

Chapter 1 – Introduction
© Paulo Henrique Silva

Rogério V. Missagia (2013) Spatial segregation of Cory’s Shearwater, based on breeding experience.
2
1.1 Top predators foraging over the marine environment
Marine environments are among the largest, most varied and complex
ecosystems on Earth (Verity et al., 2002). Although all ecosystems present some
fundamental similarities, there are some important differences (Larkin, 1996). For
example, terrestrial environments are subdivided into regional ecosystems based on
major vegetation characteristics, while oceans are subdivided into several lesser
ecosystems based on different characteristics of depth, oceanography, productivity and
populations of organisms that are linked in trophic food chains and webs (Sherman,
1993). Pelagic areas are deep and unproductive ecosystems (blue is the color of the
desert in the ocean), with liquid primary productivity ranging around 100g/m2/year, a
very low index when compared to other marine ecosystems, as coastal areas might reach
up to 500g/m2/year (Whittaker and Likens, 1973). However, marine top predators often
present foraging strategies that allows them to effectively explore these low productivity
areas, showing remarkable resilience and adaptability when searching for resources
(Boyd et al., 2006).
Different marine ecosystems may support distinctive invertebrate and vertebrate
communities in which top predators may specialize, becoming convenient indicators of
particular biomes (Hunt & Schneider, 1987, Weimerskirch, 2007). Furthermore, marine
productivity tends to be heterogeneously distributed, with high productive areas located
close to specific areas such as shelf edges or coastal upwellings (Ainley and
Boekelheide, 1990, Bakun, 1990, Crawford, 2007). Within these zones of high
productivity, preys are found in patches of different sizes, depending of the process
concentrating them and on the specific behaviour of the species. Marine top predators
such as seabirds cope with this situation by adopting specific foraging strategies
perfected by strong natural selection processes (Weimerskirch, 2007).
Rogério V. Missagia (2013) Spatial segregation of Cory’s Shearwater, based on breeding experience.
3
Marine apex predators are important top consumers in marine ecosystems, and
may exercise significant influence in ecological processes of marine environments
(Schreiber and Burger, 2001; Werner, 2010; Paiva et al., 2013). Previous studies
showed that the decline of the populations of top predators can have cascading effects
on lower trophic levels on both coastal and pelagic areas (Myers and Worm, 2003,
Scheffer et al., 2005, Heithaus et al., 2008). These conditions qualify marine apex
predators as good subjects for ecological studies, and favor the development of research
programs aimed at identifying and analyzing any trends that could lead to the better
understanding and management of marine ecosystems. The importance of this type of
knowledge is indisputable, and also critical to prevent extinctions, deregulation of
ecological processes and even disruption of ecosystem services (Block et al., 2011).
Among the marine top predators, seabirds are considered exceptional candidates
for ecological research, having received a lot of attention from the scientific community
(Votier et al., 2011). This is possibly related to the fact that seabirds are a cosmopolitan
group, marked by several favourable conditions such as: 1) Long-distance migratory
behaviour, with some species of seabirds travelling thousands of kilometers to reach
wintering grounds. 2) High breeding site fidelity, increasing the chance of tracking data
recovery. 3) Ground-nesting behaviour, facilitating any physical manipulation and
recapture, when necessary. 4) The relatively extensive literature related to the biology
and life history of several species (Warham, 1996, Schreiber and Burger, 2001).
Nevertheless, modern ecological studies continue to increase this knowledge base,
elucidating many important aspects of seabirds’ ecology, like foraging strategies (e.g.
Granadeiro et al., 1998, Paiva et al., 2010a, Thiebot et al., 2011, Votier et al., 2011;
Alonso et al., 2012), migration patterns (e.g. Catry et al., 2004a, Gonzalez-Solís et al.,
Rogério V. Missagia (2013) Spatial segregation of Cory’s Shearwater, based on breeding experience.
4
2007, Dias et al., 2010), and the future of the group under impeding climatic changes
(e.g. Smith et al., 1999, Barbraud and Weimerskirch, 2001, Crick, 2004).
1.2 Procellariiformes and the Marine Environment
The study of seabirds dates back to the 18th
century naturalists and explorers,
like Charles Darwin and Alfred Russell Wallace, renowned for their contributions in
different fields of natural sciences. Due to the technical and informational constraints of
the period, and to the life history of the group (below), the early research on pelagic
seabirds was restricted to morphological and taxonomic studies performed in single
specimens, paying no regards to populational or ecological studies. The first modern
systematic study of pelagic seabirds’ distribution was performed by P. Jespersen in
1924, as part of a marine biological survey (Tasker et al., 1984). In the following
decades, the estimated distribution was based on the sighting of species in ocean
transects, technique pioneered by V.C. Wynne-Edwards and showed in his 1935 work:
On the habits and distribution of birds on the North Atlantic (Warham, 1996).
The 1960s were marked by the emergence of modern techniques for tracking
animals, with the improvement of telemetric systems (Phillips, 2004; Haug, 2012),
making data collection in ecological research faster, more precise, and with higher
replicability and comparison potential. These advances were regarded as a turning point
in ecological studies with pelagic seabirds (Phillips et al., 2004), allowing scientists to
complement the existing knowledge (based on reproductive cycles) with the previously
inaccessible wintering and migratory data.
The Procellariformes is a well-represented order of seabirds well known for their
long migratory journeys. The order comprises four families: Pelecanoididae (diving
petrels), Diomedeidae (albatrosses), Hydrobatidae (storm petrels) and Procellariidae
(shearwaters). The group is also the most long-lived among birds (Bried, 2003, Werner,
Rogério V. Missagia (2013) Spatial segregation of Cory’s Shearwater, based on breeding experience.
5
2010), and present extreme life history strategies, like the laying of a single egg per
breeding season, followed by a long incubation and chick rearing period (Warham,
1990, Schreiber & Burger, 2001). Because of their biological traits, cosmopolitan
distribution and role as top predators in marine food chains; procellariiformes are
regarded as an indicator for changes and monitoring of ecological processes in marine
ecosystems (Werner, 2010, Paiva et al., 2013). However, most of the information
regarding the group is based on the reproductive phase of their life cycles, when the
birds have their distribution restricted to their breeding colonies, and are easier to handle
and track (Paiva et al., 2010, Haug, 2012). During the non-breeding season, seabirds are
not bound to return to their nests, and usually take on migratory routes that can cover
many thousands of kilometers into remote oceanic areas. Due to the inherent difficulty
in equipping and tracking seabirds for a long period of time, and through such distances,
information about the wintering period is still scarce (Wilson et al., 2002).
The migratory flexibility of seabirds is also a point of great concern, as growing
evidence suggests that the group is significantly vulnerable to the environmental
changes (Perón et al., 2012, Louzão et al., 2012). Species that possess a certain degree
of adaptability to these changes will allow the persistence of certain populations,
gaining time for natural selection to act, or for the restoration of more favorable
environmental conditions (Dias et al., 2010). The migratory fidelity of marine animals is
a relatively new topic of research, opposed to the considerable existing knowledge on
migratory flexibility of terrestrial animals (Catry et al., 2004b, Catry et al., 2011, Dias et
al., 2010).
Rogério V. Missagia (2013) Spatial segregation of Cory’s Shearwater, based on breeding experience.
6
1.3 Influence of environmental variables on seabirds
It is tempting to correlate the present and future distribution of marine top
predators mostly to the population dynamics of the prey they feed upon (Tremblay et
al., 2009). This premise is not wrong, since it has been proven before that apex
predators are well adapted to efficiently forage for resources, be it in high productivity
zones (Louzao et al., 2006, Morato et al., 2008), or in areas with low foraging potential
(Weimerskirch, 2007). However, these distributions are often correlated to a plethora of
other environmental aspects and oceanographic characteristics inherent to specific
marine ecosystems, which might add conditional layers to the otherwise simple
predator-prey relation.
The recent development of modern analytic tools and computer technology
allowed the improvement of studies centered on habitat selection and population
dynamics of several marine species. What started with simple correlation testing
between species distribution and a few directly measured oceanographic variables,
evolved into studies that incorporate several bio-physical variables and apply a range of
analytical tools such as classic hypothesis testing, statistical modelling, spatially explicit
approaches and multivariate analysis (Ballance et al. 2006, Tremblay et al. 2009).
Essentially, modern, technologically improved studies allow investigators to not only
discover which environmental variable affects certain species (if any), but also how
strong is the effect, to which extent it is applied (scale-wise), and if here are any
external influences by other variables. Making use of these techniques, recent
researches showed that seabirds are influenced by a number of environmental factors
like temperature (Paiva et al., 2010b), salinity (Ainley et al., 2005), wind conditions
(González-Solís et al., 2009) and distance to land (Briggs et al., 1987). Nevertheless, it
is virtually impossible to qualify a single factor as the most influencing in any scenario,
Rogério V. Missagia (2013) Spatial segregation of Cory’s Shearwater, based on breeding experience.
7
and scientific assumptions tend to consider groups of variables as the determinant of a
given hypothesis.
1.4 Foraging strategies of experienced and inexperienced
All animals need food in order to survive, and the manner in which different
species acquire this resource has been researched for many years. The early works on
the theme are based on mathematical models proposed to explain the patterns behind the
foraging behavior (Schoener, 1971, Pyke et al., 1977) and to this day are well supported
by data collected from modern studies. Learning processes in foraging strategies of
animals have been described before (Kamil and Roiblat, 1985) and are extensively
documented in a number of vertebrates (Galef and Giraldeau, 2001). These processes
are especially important for long-lived vertebrates – like seabirds – in which experience-
related variations in foraging strategies and breeding success may be particularly
marked.
The recent development of more accurate, lighter and cheaper trackers and
loggers made possible the research of spatial and temporal distribution of seabirds,
along with behavioral analyses and their relation with environmental characteristics that
might influence their habitat use (Wilson et al., 2002, Phillips et al., 2004). Information
gathered by these studies allowed scientists to draw comparisons between different
groups of individuals inside the same population, exploring the possible variations in
ecological aspects of groups divided by standards like sex (e.g. Lewis et al., 2002,
Ramos et al., 2009a) or age (Dias et al., 2010, Votier et al., 2011).
The differences in behavior between experienced and inexperienced are
important for a number of reasons. For example, seabirds are among the most long-lived
group of birds – with long periods of immaturity – which may result in populations with
Rogério V. Missagia (2013) Spatial segregation of Cory’s Shearwater, based on breeding experience.
8
many non-breeders (sometimes over 50% of the individuals). Therefore, the disparity in
feeding behavior between these groups may reduce the effects of intra-specific
competition between breeders and non-breeders during a period when food availability
may be lower (Schreiber and Burger, 2001, Thiebot et al., 2011), increasing the
survivability of both populational segments. Also, as younger birds tend to show greater
dispersion rates, they might possess a higher adaptive capacity towards climatic changes
(Kokko and Lopez-Sepulcre, 2006, Haug, 2012).
Different levels of experience can have significant influence in the behavior of a
species. When compared with breeding individuals, immature Northern Gannets (Morus
bassanus) may present a higher dispersal behavior when foraging, and can even move
between colonies during the breeding season of their first 2 – 3 years of life (Votier et
al., 2011). Breeders of a certain species tend to forage closer to the colony, which is
expected when taking into account the spatial and temporal constraints of the mature
birds during the breeding period, while providing for their offspring (Navarro et al.,
2007, Thiebot et al., 2011, Alonso et al., 2012). In a related study, younger Wandering
Albatrosses (Diomedea exulans) showed similar levels of success than older individuals
when searching for food, making use of different time-related strategies – immature
individuals tend to forage more intensely and land more prey during the night
(Weimerskirch, 2005).
Different experience levels can also affect the demographic characteristics of
certain seabirds, especially when acting alongside shifting environmental variables.
First time breeders of Black-browed Albatross (Talassarche melanophrys) showed
lower reproductive success and lower survival rates when compared with older, more
experienced individuals (Nevoux et al., 2007). That study suggests that inter-annual
environmental variations are closely related to this phenomenon, influencing both
Rogério V. Missagia (2013) Spatial segregation of Cory’s Shearwater, based on breeding experience.
9
groups in different ways – while experienced individuals showed more resilience to
harsh conditions, keeping the same survival rates throughout the reproductive season,
younger birds had increased mortality rates and lower reproductive success. However,
these differences were mitigated during more favourable environmental conditions.
The effects of environmental variation on experience-related characteristics of
seabirds are an important topic of research for modern ecologists, as the group faces
major climatic shifts, like the El Niño-Southern Oscillation Events (ENSO) (Schreiber
and Burger, 2001). The severe weather resulting from this type of event may cause the
death of many birds, a dire prospect when taken into account the vulnerability of
younger individuals, and their potential as future recruits and major determinants of
long-term population persistence (Votier et al., 2011). Until now, the majority of the
information on how birds’ experience influences their foraging strategies results from
data collected during the reproductive season (Thiebot et al., 2011, Votier et al., 2011).
To fully understand the experience-related ecology of seabirds, it is essential to explore
the same topic during the non-breeding periods. During this phase, birds are not
restricted to one area, and are subject to significant environmental variation, resultant
from extensive migratory events.
Rogério V. Missagia (2013) Spatial segregation of Cory’s Shearwater, based on breeding experience.
10
1.5 Study rationale
This study was part of an ongoing monitoring of a population of Cory’s
Shearwater (Calonectris diomedea borealis) breeding on Berlenga Island, offshore the
Portuguese west coast. However, few analyses were made regarding differences in
behaviour and distribution between individuals with different experience levels. In this
study we equipped Cory’s Shearwaters with GLS loggers during one full year and
analyzed carbon and nitrogen stable isotopes from feathers in order to compare the
following characteristics between experienced and inexperienced birds: 1) Daily
foraging behaviour. 2) Migratory profiles and the location of wintering grounds. 3)
Foraging strategies based on stable isotopes analysis. 4) Influence of environmental
variables on the at-sea spatial distribution throughout the year. 5) The at-sea distribution
under influence of climatic change for the next 100 years.
Based on the known ecology of other species of seabirds, we expect to find
significant variations between Cory’s Shearwaters with different experience levels,
especially regarding migratory processes, wintering grounds, and foraging strategies.
Variations between groups are also expected to be correlated to environmental
predictors, mainly productivity drivers such as chlorophyll-a, and physical aspects like
distance to land and wind profile. The final results of this work are expected to
contribute to explain the at-sea distribution of seabirds and other marine top predators,
while also helping establish “individual experience” as a very important characteristic
for population studies of pelagic seabirds.

Chapter 2 – Methods
© Rahel Borrmann
Rogério V. Missagia (2013) Spatial segregation of Cory’s Shearwater, based on breeding experience.
12
2.1 Study Species - Cory’s Shearwater (Calonectris diomedea borealis)
The Procellariformes is a well-represented order of seabirds that comprises four
families: Pelecanoididae (diving petrels), Diomedeidae (albatrosses), Hydrobatidae
(storm petrels) and Procellariidae (shearwaters). The group is known as the most long-
lived among birds (Bried, 2003, Werner, 2010) and present extreme life history
strategies, with the laying of a single egg per breeding season, followed by a long
incubation and chick rearing period (Warham, 1990, Schreiber and Burger, 2001).
During the chick rearing period, the parents take alternate foraging trips to provide food
for the brood and replenish their own nutritional reserves, often travelling tens to
hundreds of kilometres from the breeding site on a single journey (Magalhães, 2008).
The Cory’s Shearwater (Calonectris diomedea borealis, Fig. 1) is a colonial,
long-distance migrant seabird (Procellariiformes: Procellariidae) with breeding grounds
located on the northeast Atlantic and Mediterranean islands like Azores, Cape Verde,
Selvagens and Berlengas (Granadeiro, 1993, Navarro et al., 2007). Their reproductive
behaviour is characterized by great energetic investment from both parents, spread
through 8 months (March to April), with a long egg incubation period (54 days) and
long chick rearing (90 days), when the parents alternate duties of tending to the
offspring and foraging for food (Navarro et al., 2007).
The first three months of the reproductive cycle are known as the pre-laying
period; when the parents leave the nesting area to feed, replenishing the energy lost
during the migration from the non-breeding areas (see below) and stocking up on
nutritional reserves that will sustain them through the early stages of the reproductive
process (Werner, 2010, Paiva et al., 2013). The foraging strategy employed by the
species is based on a cycle between short (1 – 2 days) and long trips (3 – 9 days), with
Rogério V. Missagia (2013) Spatial segregation of Cory’s Shearwater, based on breeding experience.
13
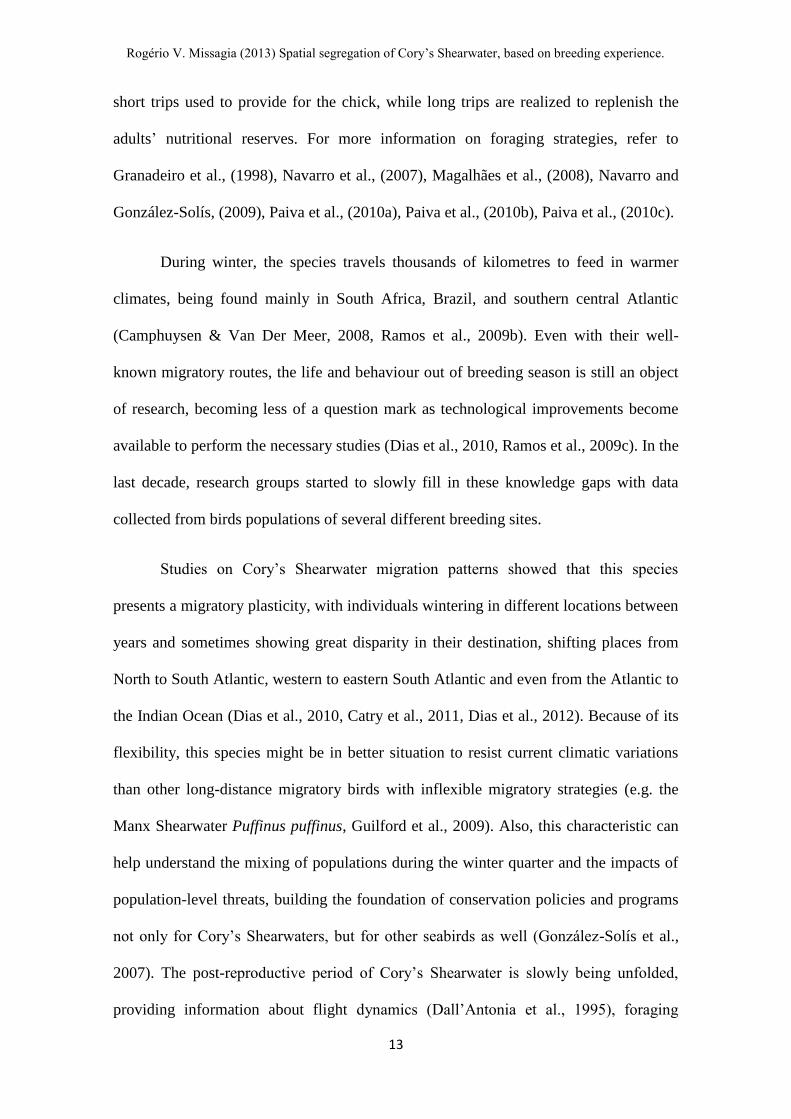
short trips used to provide for the chick, while long trips are realized to replenish the
adults’ nutritional reserves. For more information on foraging strategies, refer to
Granadeiro et al., (1998), Navarro et al., (2007), Magalhães et al., (2008), Navarro and
González-Solís, (2009), Paiva et al., (2010a), Paiva et al., (2010b), Paiva et al., (2010c).
During winter, the species travels thousands of kilometres to feed in warmer
climates, being found mainly in South Africa, Brazil, and southern central Atlantic
(Camphuysen & Van Der Meer, 2008, Ramos et al., 2009b). Even with their well-
known migratory routes, the life and behaviour out of breeding season is still an object
of research, becoming less of a question mark as technological improvements become
available to perform the necessary studies (Dias et al., 2010, Ramos et al., 2009c). In the
last decade, research groups started to slowly fill in these knowledge gaps with data
collected from birds populations of several different breeding sites.
Studies on Cory’s Shearwater migration patterns showed that this species
presents a migratory plasticity, with individuals wintering in different locations between
years and sometimes showing great disparity in their destination, shifting places from
North to South Atlantic, western to eastern South Atlantic and even from the Atlantic to
the Indian Ocean (Dias et al., 2010, Catry et al., 2011, Dias et al., 2012). Because of its
flexibility, this species might be in better situation to resist current climatic variations
than other long-distance migratory birds with inflexible migratory strategies (e.g. the
Manx Shearwater Puffinus puffinus, Guilford et al., 2009). Also, this characteristic can
help understand the mixing of populations during the winter quarter and the impacts of
population-level threats, building the foundation of conservation policies and programs
not only for Cory’s Shearwaters, but for other seabirds as well (González-Solís et al.,
2007). The post-reproductive period of Cory’s Shearwater is slowly being unfolded,
providing information about flight dynamics (Dall’Antonia et al., 1995), foraging

Rogério V. Missagia (2013) Spatial segregation of Cory’s Shearwater, based on breeding experience.
14
strategies, physiological traits (Ramos et al., 2009b) and general behaviour (Catry et al.,
2011).
Figure 1 – Cory’s Shearwater (Calonectris diomedea borealis) in flight.
2.2 Study Area
2.2.1 Berlengas archipelago
The Berlengas archipelago is located in the Portuguese coast, at approximately
10Km west of the town of Peniche, in the north Atlantic. The largest Island of the
archipelago is Berlenga Island (39°12’40’’49N, 09°30’29’’W), a granitic skerry that
reaches and altitude of 88m, with maximum length of 1,5Km on its widest, and a total
area of 78,8ha (Haug, 2012, Santos et al., 2012). Two groups of smaller Islets called
Estelas and Farilhões are also part of the archipelago and, together with Berlenga, are
the three main dry land extensions of the area.
Rogério V. Missagia (2013) Spatial segregation of Cory’s Shearwater, based on breeding experience.
15
In 1981, the Portuguese government attributed the status of natural reserve to the
area. Since then, the islands passed through successive improvements on total area
covered and conservation importance, which culminated in June 28th
2011, when the
Berlengas Natural Reserve (R.N.B.) was included in the World Network of Biosphere
Reserves (W.N.B.R.), under positive ruling of UNESCO (Santos et al., 2012). The
whole archipelago presents high biodiversity, with 76 fish species currently referenced
for the reserve area (Rodrigues et al., 2008). This, allied with the favourable
combination of bathymetric features and ocean and wind circulation (namely the
Azorean anti-cyclone and the Portuguese continental shelf upwelling), characterizes the
area as rich feeding and breeding grounds for several seabird species (Paiva et al.,
2010b, Werner, 2010). Presently, the archipelago hosts approximately 850 breeding
pairs of Cory’s Shearwaters, distributed among Farilhões Islets (500-550 pairs) and
Berlenga Island (300 pairs) (Lecoq et al., 2011).
Fieldwork was conducted in Berlenga Island, with logger retrieval during
September in 2011 (deployment of loggers), and end of August – September, 2012
(recovery of loggers). The birds on the colony are used to human interactions, and were
caught by hand from their burrows for logger retrieval during night-time, while nesting
and less prone to stress. The tracked individuals belong to a long-term study on the
species, and were previously ringed and monitored for information such as sex and
reproductive success, adding to the separation between experienced and inexperienced.
Rogério V. Missagia (2013) Spatial segregation of Cory’s Shearwater, based on breeding experience.
16
2.2.2 The Atlantic Ocean
Due to the migratory processes of Cory’s Shearwater, most tracking data
collected contains information that extends the study area to encompass a large portion
of the Atlantic Ocean, with individuals present in coastal areas of North America, South
America and Africa. Oceanographic characteristics over such large areas are under
influence of several environmental determinants, showing remarkable variation in
ecological aspects like temperature and productivity which, in turn, can play a major
role in marine species distribution and behaviour (Warham, 1996, Louzão et al., 2006,
Paiva et al., 2010c).
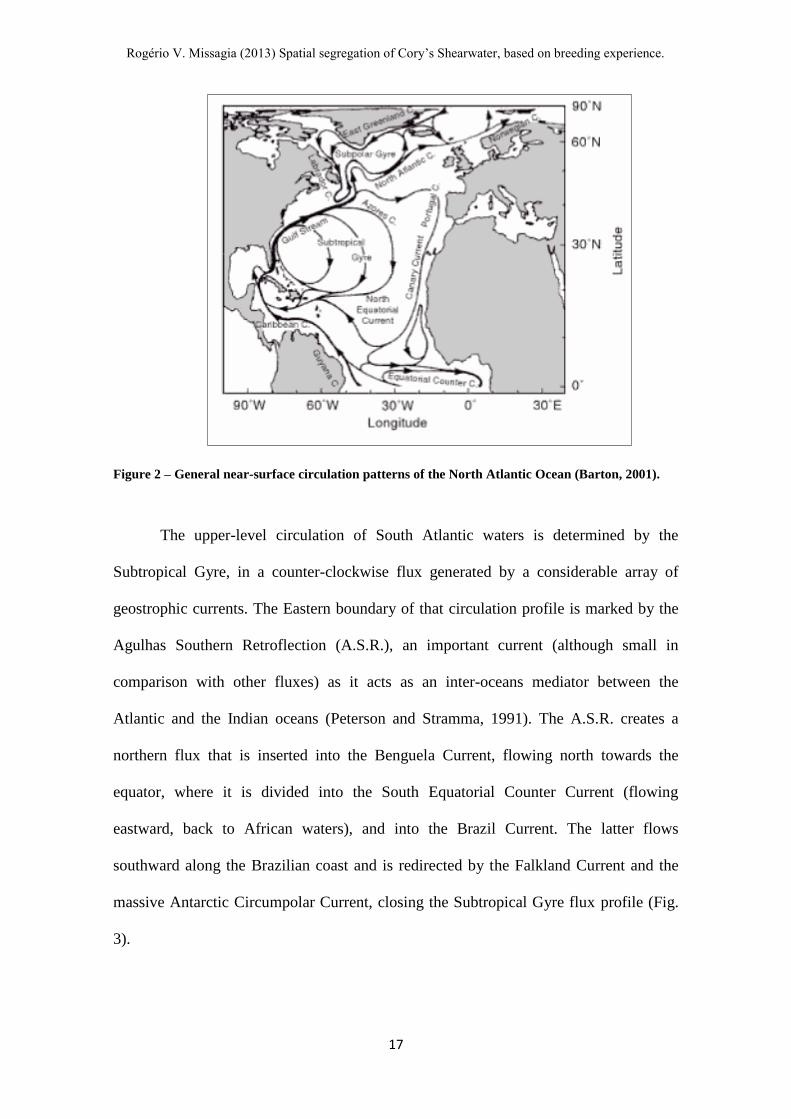
The North Atlantic Basin is under influence of a major circular current known as
the North Atlantic Gyre (Fig. 2). This wind-based gyre is formed by the western action
of the Gulf Stream towards East, feeding into the North Atlantic Current and the Azores
Current, closing the cycle into a large, clockwise rotating subtropical gyre (Barton,
2001). The water cycling present in the area is responsible for the displacement and
exchange of warm (and nutrient-poor) water extracted from subtropical areas by the
Gulf Stream, and cold water (nutrient-rich) injected into the system via the Arctic
Labrador Current (Barton, 2001, Soares, 2013).
The North Atlantic Gyre cycling profile is not the same throughout the year,
with seasonal variations occurring during summer. This effect is caused by the increase
of the sea surface temperature, and results in a significant shift of productivity values of
areas close to the Portuguese coast towards areas located in the Arctic Circle (Paiva et
al., 2010b, Soares, 2013). Consequences of these effects on the at-sea distribution and
behaviour of Cory’s Shearwater in the North Atlantic can be found throughout the
literature (e.g. Granadeiro et al., 1998, Paiva, 2009, Roscales et al., 2011), being
generally focused on the breeding period.
Rogério V. Missagia (2013) Spatial segregation of Cory’s Shearwater, based on breeding experience.
17
Figure 2 – General near-surface circulation patterns of the North Atlantic Ocean (Barton, 2001).
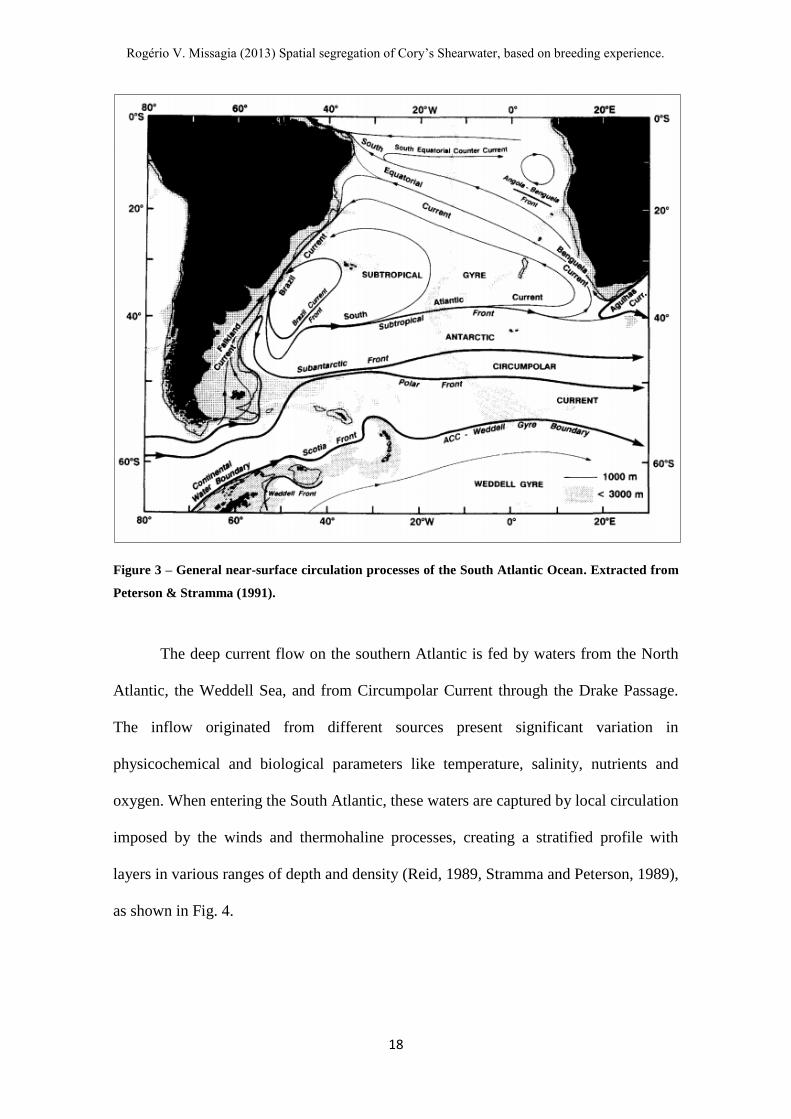
The upper-level circulation of South Atlantic waters is determined by the
Subtropical Gyre, in a counter-clockwise flux generated by a considerable array of
geostrophic currents. The Eastern boundary of that circulation profile is marked by the
Agulhas Southern Retroflection (A.S.R.), an important current (although small in
comparison with other fluxes) as it acts as an inter-oceans mediator between the
Atlantic and the Indian oceans (Peterson and Stramma, 1991). The A.S.R. creates a
northern flux that is inserted into the Benguela Current, flowing north towards the
equator, where it is divided into the South Equatorial Counter Current (flowing
eastward, back to African waters), and into the Brazil Current. The latter flows
southward along the Brazilian coast and is redirected by the Falkland Current and the
massive Antarctic Circumpolar Current, closing the Subtropical Gyre flux profile (Fig.
3).
Rogério V. Missagia (2013) Spatial segregation of Cory’s Shearwater, based on breeding experience.
18
Figure 3 – General near-surface circulation processes of the South Atlantic Ocean. Extracted from
Peterson & Stramma (1991).
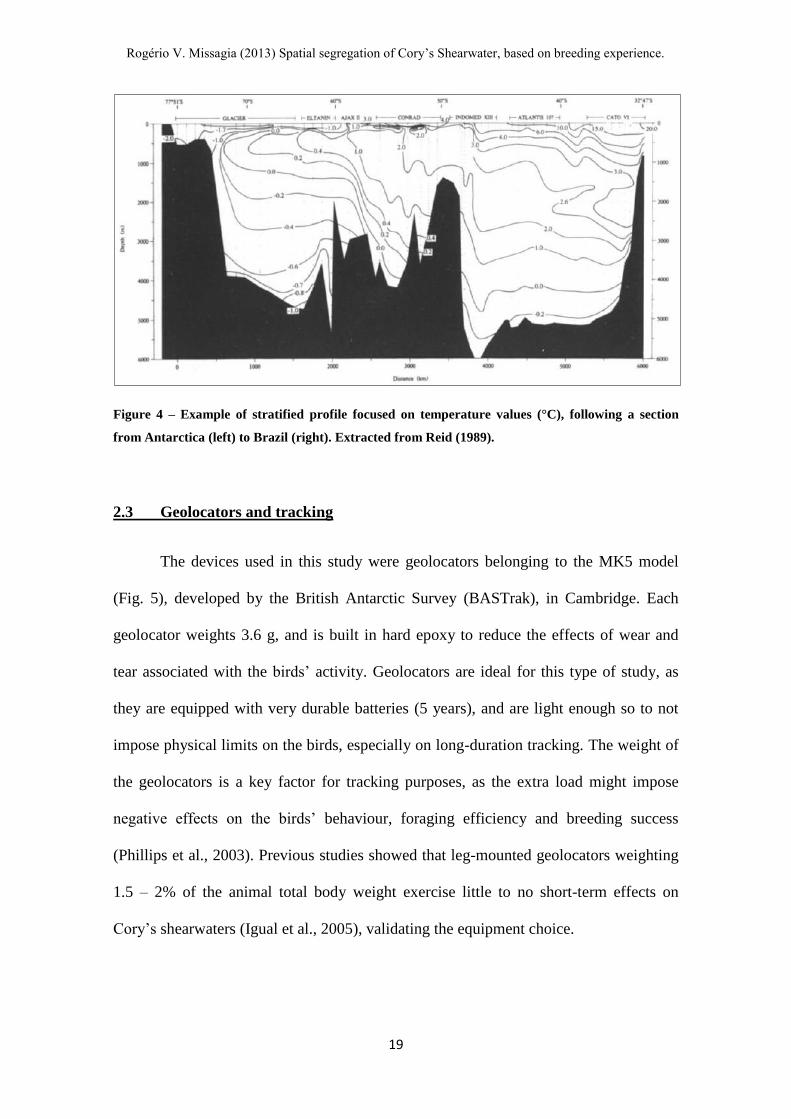
The deep current flow on the southern Atlantic is fed by waters from the North
Atlantic, the Weddell Sea, and from Circumpolar Current through the Drake Passage.
The inflow originated from different sources present significant variation in
physicochemical and biological parameters like temperature, salinity, nutrients and
oxygen. When entering the South Atlantic, these waters are captured by local circulation
imposed by the winds and thermohaline processes, creating a stratified profile with
layers in various ranges of depth and density (Reid, 1989, Stramma and Peterson, 1989),
as shown in Fig. 4.
Rogério V. Missagia (2013) Spatial segregation of Cory’s Shearwater, based on breeding experience.
19
Figure 4 – Example of stratified profile focused on temperature values (°C), following a section
from Antarctica (left) to Brazil (right). Extracted from Reid (1989).
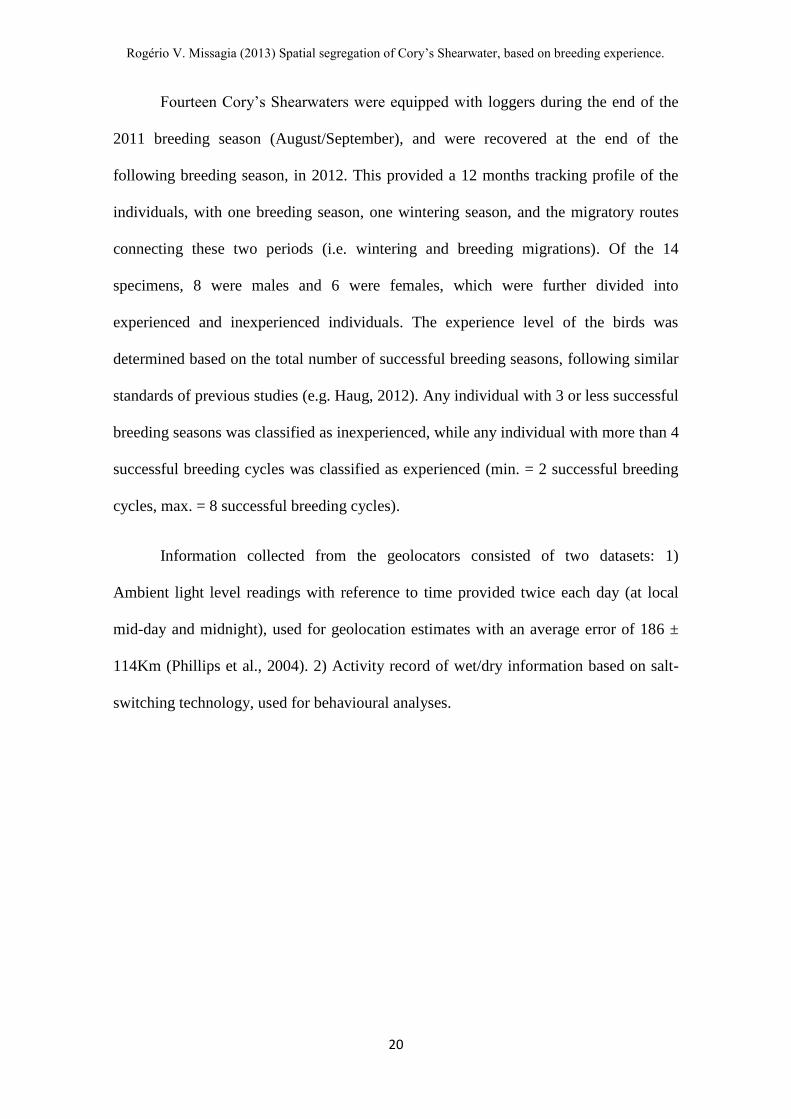
2.3 Geolocators and tracking
The devices used in this study were geolocators belonging to the MK5 model
(Fig. 5), developed by the British Antarctic Survey (BASTrak), in Cambridge. Each
geolocator weights 3.6 g, and is built in hard epoxy to reduce the effects of wear and
tear associated with the birds’ activity. Geolocators are ideal for this type of study, as
they are equipped with very durable batteries (5 years), and are light enough so to not
impose physical limits on the birds, especially on long-duration tracking. The weight of
the geolocators is a key factor for tracking purposes, as the extra load might impose
negative effects on the birds’ behaviour, foraging efficiency and breeding success
(Phillips et al., 2003). Previous studies showed that leg-mounted geolocators weighting
1.5 – 2% of the animal total body weight exercise little to no short-term effects on
Cory’s shearwaters (Igual et al., 2005), validating the equipment choice.
Rogério V. Missagia (2013) Spatial segregation of Cory’s Shearwater, based on breeding experience.
20
Fourteen Cory’s Shearwaters were equipped with loggers during the end of the
2011 breeding season (August/September), and were recovered at the end of the
following breeding season, in 2012. This provided a 12 months tracking profile of the
individuals, with one breeding season, one wintering season, and the migratory routes
connecting these two periods (i.e. wintering and breeding migrations). Of the 14
specimens, 8 were males and 6 were females, which were further divided into
experienced and inexperienced individuals. The experience level of the birds was
determined based on the total number of successful breeding seasons, following similar
standards of previous studies (e.g. Haug, 2012). Any individual with 3 or less successful
breeding seasons was classified as inexperienced, while any individual with more than 4
successful breeding cycles was classified as experienced (min. = 2 successful breeding
cycles, max. = 8 successful breeding cycles).
Information collected from the geolocators consisted of two datasets: 1)
Ambient light level readings with reference to time provided twice each day (at local
mid-day and midnight), used for geolocation estimates with an average error of 186 ±
114Km (Phillips et al., 2004). 2) Activity record of wet/dry information based on salt-
switching technology, used for behavioural analyses.
Rogério V. Missagia (2013) Spatial segregation of Cory’s Shearwater, based on breeding experience.
21
Figure 5 – Geolocator model MK5 attached to a Cory’s Shearwater specimen. Photo by Rahel
Borrmann (2013).
2.4 Tracking and activity analysis
Information extracted from the trackers was first decompressed with the use of
Decompressor® software (BASTrak, Cambridge). For geolocation purposes, latitudes
were estimated based on the day/night lengths, while the longitude was estimated from
the absolute time of local midday/midnight, providing two daily positions for each
individual. The light intensity data extracted from the loggers usually present abnormal
readings, related to unpredictable shading of the light sensors by the seabird, or by other
physical barriers. To remediate this aspect, the light data was processed in TransEdit2®
software (BASTrak, Cambridge), where such inconsistencies were corrected and a
confidence value was attributed to each reading, ranging from 1 (low confidence value)
to 9 (high confidence value), depending on the profile and homogeneity of the curves.
Light transitions found in the limits of both equinoxes (20th
March and 22nd
September)
were given fixed confidence level values: C.L. = 7 for ± 15 days from the equinox date,
C.L. = 5 for ± 10 days and C.L. = 3 for ± 5 days from the each equinox. This decision

Rogério V. Missagia (2013) Spatial segregation of Cory’s Shearwater, based on breeding experience.
22
reflects the impossibility to determine latitudes with reasonable accuracy during the
light period variations associated with the phenomenon (Catry et al., 2011).
The data generated after the TransEdit2® processing was then arranged into a
general positioning table for the 14 birds. This table was used to determine 4 crucial
dates for the behavioural analysis of each bird: (1) departure from breeding colony (end
of breeding season), (2) arrival date on wintering area, (3) departure date from wintering
area and (4) arrival on breeding colony (next reproductive cycle. The ArcGIS 10
software was utilized in this process, and the following criteria were adopted:
- Departure date from colony was extracted from the first position outside
of Berlengas as part of a continuous outward migration to the wintering area. Departure
from wintering area followed the same reasoning.
- Arrival dates were established as the first position to appear in the area of
interest (breeding colony or wintering area), following the migration route.
The activity data provided by the loggers was based in salt-switching
technology, and showed when the bird was in contact with seawater, and for how long.
The nature of the “wet activity” could not be determined, however, and is considered to
encompass any non-flying at-sea behaviour performed by the bird, such as foraging or
resting on the water surface. Data collected from the loggers was processed in R
Software version 2.14.1 with the R Studio IDE (integrated development environment)
version 0.97.332, used to calculate the proportion of time spent in water in a specific
date, and the average of time spent in water per month.
Rogério V. Missagia (2013) Spatial segregation of Cory’s Shearwater, based on breeding experience.
23
2.5 Stable isotope analysis
Along with direct tracking techniques, the analysis of stable isotopes (S.I.A.) is
considered as a valuable tool for modern ecologists, and has been used in research of
aspects like habitat selection, dietary preference and foraging strategies. Stable isotopes
do not decay over time (unlike their unstable radiogenic counter-parts, therefore the
name), varying in mass, and among several biologically important elements like
Hydrogen (H), Carbon (C), Nitrogen (N), Oxygen (O) and Sulfur (O) (Inger and
Bearhop, 2008). The very small differences in mass presented by these isotopes are
responsible for subtle changes in their behaviour during the chemical reactions involved
in the formation of different tissues of birds, making the isotopic ratio of these elements
found in blood, feathers, and other tissues, an excellent indicator of diet, distribution
and behavioural patterns of seabirds.
It is important to note that different tissues are synthesized and replaced at
different rates, making crucial the proper knowledge of biological traits and life history
of the animal in question. For example, avian blood plasma can turn over very quickly,
providing an isotopic signature of few days prior to sampling. On the other side, the
synthesis and replacement process of tissues like feathers or claws can extend from
weeks to months, providing information on feeding habits and spatial distribution over a
wider period of time.
For this study, Stable Isotope Analysis (S.I.A.) of δ15
N (15
N/14
N) and δ13
C
(13
C/12
C) were performed. The ratios of nitrogen (N) are used to determine the trophic
positioning of the animal. The reason for this is that during the assimilation of dietary
proteins, the 14
N is lost to nitrogenous waste products, while 15
N is assimilated into
consumer tissues in higher quantity (Inger and Bearhop, 2008). Carbon (C) ratios are
Rogério V. Missagia (2013) Spatial segregation of Cory’s Shearwater, based on breeding experience.
24
used to determine the foraging habitat of the consumer, as the δ13
C follows a gradient
from high to low values from the coast to more pelagic areas. This happens due to the
organic enrichment present in coastal zones, which is gradually diluted in offshore
waters (Inger and Bearhop, 2008, Paiva et al., 2010b, Haug, 2012).
Isotopic signatures were determined from collected feathers of 14 individuals.
The utilization of feathers for S.I.A. is based on the long-duration aspect of this study,
as the isotopic signatures found in these samples reflect the feeding habits of each
individual during the moulting phase. During this time, the new feathers are irrigated
with blood, and keep an isotopic imprint that can be used for analysis months later.
Since events of breeding, migration and moult are time-exclusives in Procellariiformes
birds, with no overlaps between them (Warham, 1996), the S.I.A. of the feathers of
Cory’s Shearwaters is expected to indicate aspects of their foraging behaviour at-sea,
during the wintering period.
The feathers collected for S.I.A. were the P1 and S8 – representatives of the
preceding summer (breeding) and wintering seasons, respectively – and breast feathers
as an overall diet picture for the all-year period (Ramos et al., 2011, Ceia et al., 2013).
Prior to S.I.A., the feathers were cleansed of any surface contaminants with successive
rinses of a 2:1 chloroform-methanol solution, dried at 60°C for 24 h and then
homogenized. The carbon and nitrogen isotopic composition of the samples were
determined using a Flash EA1112 Series elemental analyser coupled on-line via
Finningan conflo II interface to a Thermo Delta VS mass spectrometer. Isotope ratios
are presented in the usual δ notation based on the PeeDee Belemnite (PDB) for carbon
and atmospheric N2 (AIR) for nitrogen, and expressed as ‰. δ13
C or δ15
N =
[(Rsample/Rstandard) − 1] × 1000, where R = 13
C/12
C or 15
N/14
N, respectively.
Rogério V. Missagia (2013) Spatial segregation of Cory’s Shearwater, based on breeding experience.
25
Replicate measurements of internal laboratory standards (acetanilide) indicate precision
< 0.2‰ for both δ13
C and δ15
N.
To compare stable isotope results between groups of different experience level,
we utilized a Multivariate Analysis of Variance (MANOVA) test for each sample type
(P1, S8 and breast), further pooling the results into different time periods (breeding,
wintering and all year). Furthermore, we adopted the Stable Isotopes Bayesian Ellipses
in R (S.I.B.E.R.) framework. This technique allows for easier visualization and
comparison between different sample sizes, and helped us determine differences in
niche positioning between groups, along with eventual interaction. The area of the
standard ellipse (SEAc, an ellipse that has 95% probability of containing a subsequently
sampled datum) was adopted to compare the niche segregation between experienced
and inexperienced birds, including any possible overlaps. All metrics were calculated
utilizing R Software version 2.14.1, with addition of SIAR package and SIBER functions
contained within the platform.
2.6 Kernel utilization distribution
The Kernel Utilization Distribution (K.U.D.) is a technique widely employed in
ecological studies to estimate the home range of groups of birds (or other animals),
based on the probability density over each observation point in a sample (Worton, 1989,
Seaman and Powell, 1996). In this study, the K.U.D. was calculated using the processed
tracking data from each bird, to determine the respective distribution throughout the
non-breeding season, and any possible differences between experienced and
inexperienced birds. To achieve these results, R Software version 2.14.1 was utilized,
along with the adehabitat and adehabitatHR packages, all under the R Studio I.D.E.
version 0.97.332.

Rogério V. Missagia (2013) Spatial segregation of Cory’s Shearwater, based on breeding experience.
26
The smoothing factor (h) is an important parameter to be considered when
making use of Kernel estimation methods, as it determines the detail level of the data
plotted, and can alter the general shape of the distribution, influencing posterior analysis
(Seaman and Powell, 1996, Kappes et al., 2011, Haug, 2012). Considering the large-
scale tracking profile provided by each bird as they crossed oceans or even hemispheres,
a smoothing factor (h) = 1° (i.e. 111Km) was decided to be ideal, showing better
representation of the distribution and falling into accord with the average error of the
loggers (185 ± 115Km). The possible overlapping of kernels was also calculated for the
wintering season among experienced and inexperienced birds, and between the groups.
For this, the function kerneloverlap of the adehabitat package was utilized in the R
environment, and allowed the analysis of spatial segregation between birds with
different levels of experience. All kernels were expressed in standard home range
distributions (Worton, 1989), considering the utilization distributions of 95% (UD95,
home range) and 50% (UD50, foraging area).
2.7 Environmental predictors
To model seabird species occurrence, we used 24 environmental variables
(Table 1) that are either known, or suspected, to be ‘usually’ correlated with seabird
distribution and abundance (e.g. Louzao et al., 2006; Tremblay et al., 2009).
Oceanographic data were (mostly) extracted from the Environmental Research Division,
Southwest Fisheries Science Center and US National Marine Fisheries Service
(http://coastwatch.pfel.noaa.gov/coastwatch/ CWBrowserWW180.jsp).
Physical variables (distance to land, mean bathymetry, and bathymetry gradient)
were extracted using the cell value nearest to the centroid of each grid cell and were
considered invariant throughout the period of our study. Dynamic oceanographic data
Rogério V. Missagia (2013) Spatial segregation of Cory’s Shearwater, based on breeding experience.
27
(sea surface temperature, sst; chlorophyll -a concentration, chla and wind speed, wspd)
were extracted as monthly averages from Aqua MODIS, Pathfinder AVHRR satellite
imagery and AVISO QuickSCAT products, and varied among months.
Because seabirds may respond to spatial gradients of oceanographic variables
(Louzão et al., 2006, Tremblay et al., 2009, Wakefield et al., 2009), we also calculated
spatial sst and chla gradients as (maximum value x minimum value) x 100/maximum
value, with maximum being the highest and minimum the lowest seasonal mean sst or
chla value over a moving 3 x 3 grid cell window. This dimensionless metric expresses
the magnitude of change in each habitat variable, scaled to the maximum value. The
spatial gradients of chlorophyll a (gchla) and sea surface temperature (gsst) indicate the
presence of frontal systems, whereas the gradient of bathymetry (gbat) reflects the
presence of topographic features (e.g. shelf break or seamount).
All remaining environmental predictors hosted at the World Ocean Database
(see WOD variables at Table 1; Boyer et al., 2009) were extracted and processed to
match the spatial extent of the former predictos and temporally extended until 2012
(Tyberghein et al., 2009). All former environmental predictors were interpolated and
aggregated to fit a 1º grid mask for habitat modelling.
2.8 Species distribution modelling
2.8.1 Data processing and exploratory analysis
All geolocations were binned into a spatial grid with cell size 1º to match the
spatial resolution of remotely sensed environmental data. Every grid cell received an
additional binary detection/non-detection value of ‘1’ (hereafter referred to as
‘presence’), whereas grid cells that were surveyed but, where no target seabird species
were observed were coded as ‘0’ (hereafter referred to as ‘absence’). Our models used
Rogério V. Missagia (2013) Spatial segregation of Cory’s Shearwater, based on breeding experience.
28
latitude and longitude as predictor variables (Table 1) and therefore implicitly included
some spatial structure and ‘correct’ for possible autocorrelation.
2.8.2 Model construction
Model construction, training and testing was performed with Maximum Entropy
(MaxEnt) modelling based on presence-only data (version 3.3.3 (http://www.cs.
princeton.edu/~schapire/maxent/ [accessed 18 October 2012]). MaxEnt is a general-
purpose method for characterizing probability distributions from incomplete
information. In estimating the probability distribution defining a species’ distribution
across a study area, MaxEnt formalizes the principle that the estimated distribution must
agree with everything that is known (or inferred from the environmental conditions
where the species has been observed) but should avoid making any assumptions that are
not supported by the data. The approach is thus to find the probability distribution of
maximum entropy (the distribution that is most spread-out or closest to uniform) subject
to constraints imposed by the information available regarding the observed distribution
of the species and environmental conditions across the study area.
The MaxEnt method does not require absence data for the species being
modeled; instead it uses background environmental data for the entire study area. The
method can utilize both continuous and categorical variables and the output is a
continuous prediction (i.e. a cumulative probability ranging from 0 to 1 that indicates
relative suitability). MaxEnt has been shown to perform well in comparison with
alternative methods (Elith et al., 2006, Pearson et al., 2006, Phillips et al., 2006, Oppel
et al., 2012).

Rogério V. Missagia (2013) Spatial segregation of Cory’s Shearwater, based on breeding experience.
29
Two MaxEnt models were executed, one for each category of experience. In
each model, environmental variables were firstly subjected to a cross-correlation
analysis, in order to avoid problems with parameter estimations (Zuur et al., 2007). One
of each pairwise highly correlated variables (i.e. rs > 0.7; Tabachnick and Fidell, 1996)
was excluded from the model.
2.8.3 Model evaluation and calibration
We divided the tracking data into training and test data by randomly setting
aside approximately 30% of the geolocations for spatial evaluation of the models
(Araújo and Guisan, 2006, Austin, 2007). We ran MaxEnt on the presence-only
positions 100 times. We calculated the mean of the 100 MaxEnt predictions to obtain an
average prediction and coefficient of variation of predictions (Édren et al., 2010). The
settings of the MaxEnt program were logistic output format, resulting in values between
0 and 1 for each grid cell, where higher values indicate more similar climatic conditions,
duplicates removed, and 100 replicate runs of random (bootstrap) subsamples with 30 as
random test percentage. The results were summarized as the average of the 100 models.
There are three main results of MaxEnt; jackknife chart, Receiver Operating
characteristics Curve (ROC) and probability map. Jackknife chart was used to evaluate
the contribution of each environmental layer to the final result. The ROC curve
measured the model’s accuracy, based on the Area Under the ROC curve (AUC), which
in turn estimates the likelihood that a randomly selected presence point is located in a
raster cell with a higher probability value for species occurrence than a randomly
generated point (Phillips et al. 2006). Generated models are generally interpreted as
excellent for test AUC > 0.90, good for 0.80 < AUC < 0.90, acceptable for 0.70 < AUC
< 0.80, bad for 0.60 < AUC < 0.70 and invalid for 0.50 < AUC < 0.60 (Araújo et al.
Rogério V. Missagia (2013) Spatial segregation of Cory’s Shearwater, based on breeding experience.
30
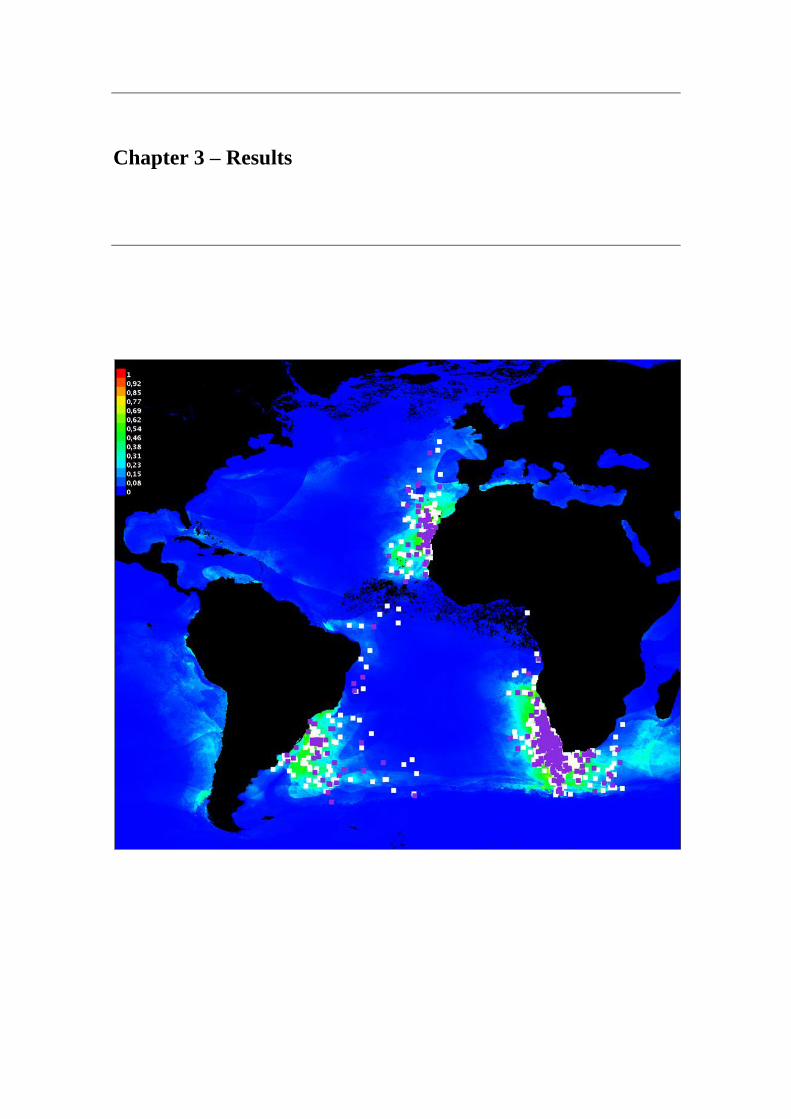
2005). Finally, the probability map shows the spatial distribution of predicted presence
probability.
Two sets of results from the modelling were considered for this study: 1) A
species distribution map for the wintering season. 2) The variable contribution table,
showing which environmental predictor had greater influence on the results.
To expand the results on the species distribution, another model was made. This
model took into account the A2 scenario for global climate change from the
Intergovernmental Panel on Climate Change (I.P.C.C., accessible at www.ipcc.ch), a
conservative one, predicting an increase of 0.18°C on the sea surface temperature (SST)
per decade. Following these predictions, we calculated the possible alterations on
species distribution that would occur in the next 10, 50 and 100 years.
Rogério V. Missagia (2013) Spatial segregation of Cory’s Shearwater, based on breeding experience.
31
Table 1 – Agglomerative clustering of environmental data layers included on the habitat modelling procedures with MaxEnt.
* Boyer, T.P., Antonov, J.I., Baranova, O.K., Garcia, H.E., Johnson, D.R., Locarnini, R.A., Mishonov, A.V., O’brien, T.D., Seidov, D., Smolyar, I.V. &
Zweng, M.M. (2009). World ocean database 2009. US Government Printing Office, Washington, DC.
# Calculated over a 3° X 3° moving window as [(maximum value - minimum value)*100]/maximum value, with maximum being the highest mean value in a
3° X 3° moving window.
Variable Code Derived Metric Units Manipulation Source
Sea Surface Temperature min_sst Minimum °C Temporal minimum from monthly climatologies (2002-2012) Aqua-MODIS
Sea Surface Temperature mean_sst Mean °C Temporal mean from monthly climatologies (2002-2012) Aqua-MODIS
Sea Surface Temperature max_sst Maximum °C Temporal maximum from monthly climatologies (2002-2012) Aqua-MODIS
Sea Surface Temperature range_sst Range °C Temporal range from monthly climatologies (2002-2012) Aqua-MODIS
Sea Surface Temperature winter sst Mean °C Temporal mean from monthly climatologies (December 2011-February 2012) Aqua-MODIS
Sea Surface Temperature Gradient # gsst Mean % Temporal gradient from monthly climatologies (December 2011-February 2012) Aqua-MODIS
Salinity salinity Mean PSS ArcGIS interpolation of in-situ measurements WOD 2009*
pH ph Mean - ArcGIS interpolation of in-situ measurements WOD 2009*
Dissolved Oxygen dissox Mean ml/l ArcGIS interpolation of in-situ measurements WOD 2009*
Silicate silicate Mean μmol/l ArcGIS interpolation of in-situ measurements WOD 2009*
Phosphate phos Mean μmol/l ArcGIS interpolation of in-situ measurements WOD 2009*
Calcite concentration calcite Mean mol m-3 Temporal mean from seasonal climatologies (2002-2012) Aqua-MODIS
Chlorophyll a concentration min_chla Minimum mol m-3 Temporal maximum from monthly climatologies (2002-2012) Aqua-MODIS
Chlorophyll a concentration mean_chla Mean mol m-3 Temporal maximum from monthly climatologies (2002-2012) Aqua-MODIS
Chlorophyll a concentration max_chla Maximum mol m-3 Temporal maximum from monthly climatologies (2002-2012) Aqua-MODIS
Chlorophyll a concentration range_chla Range mol m-3 Temporal maximum from monthly climatologies (2002-2012) Aqua-MODIS
Chlorophyll a concentration winter chla Mean °C Temporal mean from monthly climatologies (December 2011-February 2012) Aqua-MODIS
Chlorophyll a concentration Gradient # gchla Gradient % Temporal gradient from monthly climatologies (December 2011-February 2012) Aqua-MODIS
Diffuse Attenuation damax Maximum m-1 Temporal maximum from monthly climatologies (2002-2012) Aqua-MODIS
Diffuse Attenuation damean Mean m-1 Temporal maximum from monthly climatologies (2002-2012) Aqua-MODIS
Bathymetry bat Mean m Spatial mean ETOPO 1
Bathymetry spatial gradient gbat Mean % Spatial gradient ETOPO 1
Distance to coastline dland Minimum ° Distance to nearest coastline from centroid of each grid cell R computed
Wind speed wspd Mean ms-1 Temporal mean from monthly climatologies (December 2011-February 2012) QuickSCAT AVISO product

Chapter 3 – Results
Rogério V. Missagia (2013) Spatial segregation of Cory’s Shearwater, based on breeding experience.
33
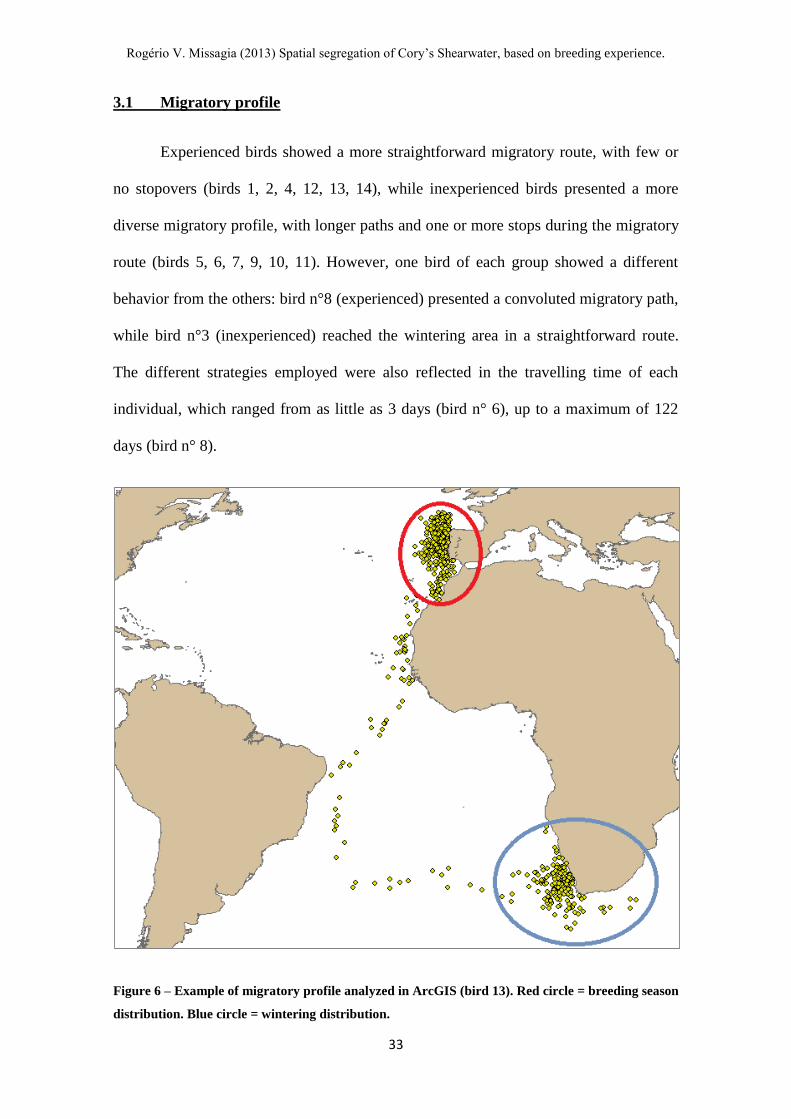
3.1 Migratory profile
Experienced birds showed a more straightforward migratory route, with few or
no stopovers (birds 1, 2, 4, 12, 13, 14), while inexperienced birds presented a more
diverse migratory profile, with longer paths and one or more stops during the migratory
route (birds 5, 6, 7, 9, 10, 11). However, one bird of each group showed a different
behavior from the others: bird n°8 (experienced) presented a convoluted migratory path,
while bird n°3 (inexperienced) reached the wintering area in a straightforward route.
The different strategies employed were also reflected in the travelling time of each
individual, which ranged from as little as 3 days (bird n° 6), up to a maximum of 122
days (bird n° 8).
Figure 6 – Example of migratory profile analyzed in ArcGIS (bird 13). Red circle = breeding season
distribution. Blue circle = wintering distribution.
Rogério V. Missagia (2013) Spatial segregation of Cory’s Shearwater, based on breeding experience.
34
There was considerable variation in the migratory schedule of the tracked birds
(Table 2). Departure dates from the breeding colony ranged from late August (bird n° 8,
experienced, departed on 29/08/2011) to late November (bird n° 6, inexperienced,
departed on 23/11/2011). The birds arrived on the wintering grounds from mid-October
(bird n° 12, experienced, arrival on 14/10/2011) to early January (bird n° 11,
inexperienced, arrival on 01/01/2012). Departure from wintering grounds showed
considerable less variance, encompassing a smaller time-span: the earliest birds began
the return trip in late February (birds n° 1 and n° 6, experienced and inexperienced,
departed on 22/02/2012) while the latest birds began the return journey in mid-March
(bird n° 11, inexperienced, departed on 14/03/2012). The birds arrived on the breeding
colony from late February (bird n° 6, inexperienced, arrival on 29/02/2012) to mid-
April (bird n° 11, inexperienced, arrival on 10/04/2012). Table 2 shows the migratory
schedule for each of the fourteen birds.
The wintering grounds were in both the North and South Atlantic, generally in
coastal areas. The coast of South Africa was the wintering location for 5 experienced
birds (birds n° 1, 2, 4, 8, 13), with 2 of the group wintering in other areas (bird n° 12,
Cape Verde and bird n° 14, South Brazil). The wintering grounds of inexperienced birds
varied, with individuals wintering in South Africa (birds n° 5 and n° 9), South Brazil
(birds n° 3 and n° 11) and Newfoundland (bird n° 6). Two inexperienced birds
presented mixed wintering grounds (bird n° 7 in South Atlantic and South Brazil, and n°
11 in Newfoundland and North Brazil).
Rogério V. Missagia (2013) Spatial segregation of Cory’s Shearwater, based on breeding experience.
35
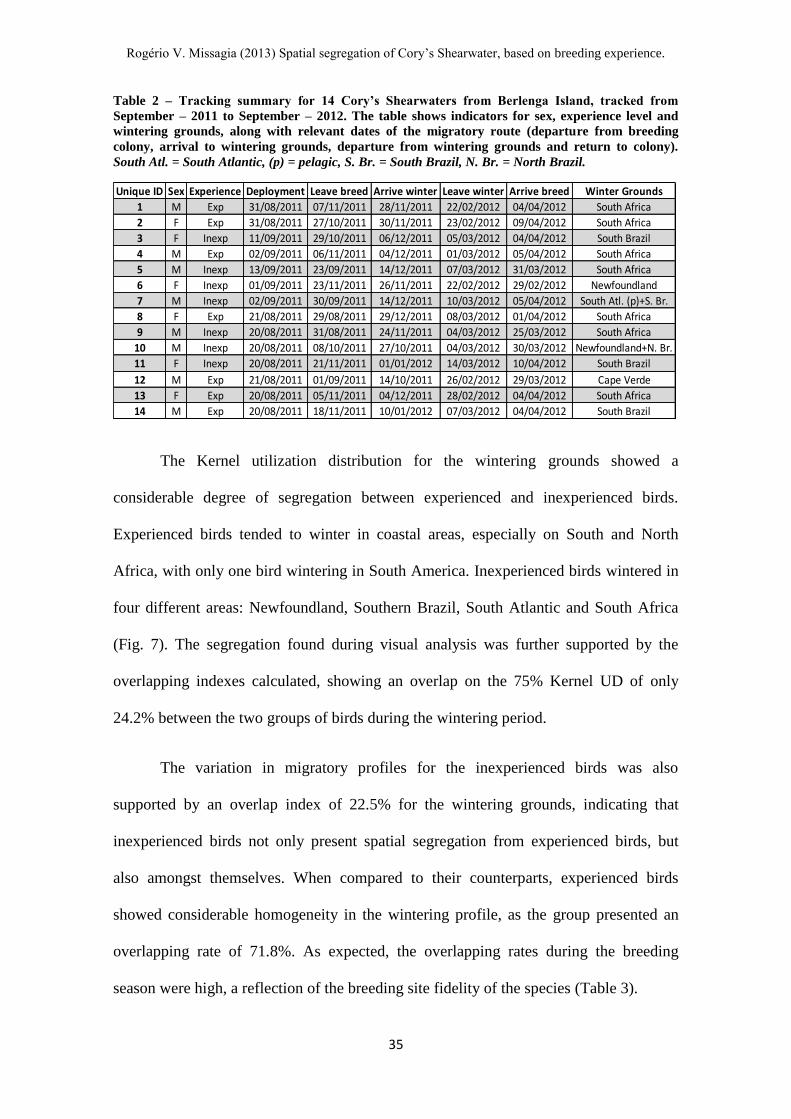
Table 2 – Tracking summary for 14 Cory’s Shearwaters from Berlenga Island, tracked from
September – 2011 to September – 2012. The table shows indicators for sex, experience level and
wintering grounds, along with relevant dates of the migratory route (departure from breeding
colony, arrival to wintering grounds, departure from wintering grounds and return to colony).
South Atl. = South Atlantic, (p) = pelagic, S. Br. = South Brazil, N. Br. = North Brazil.
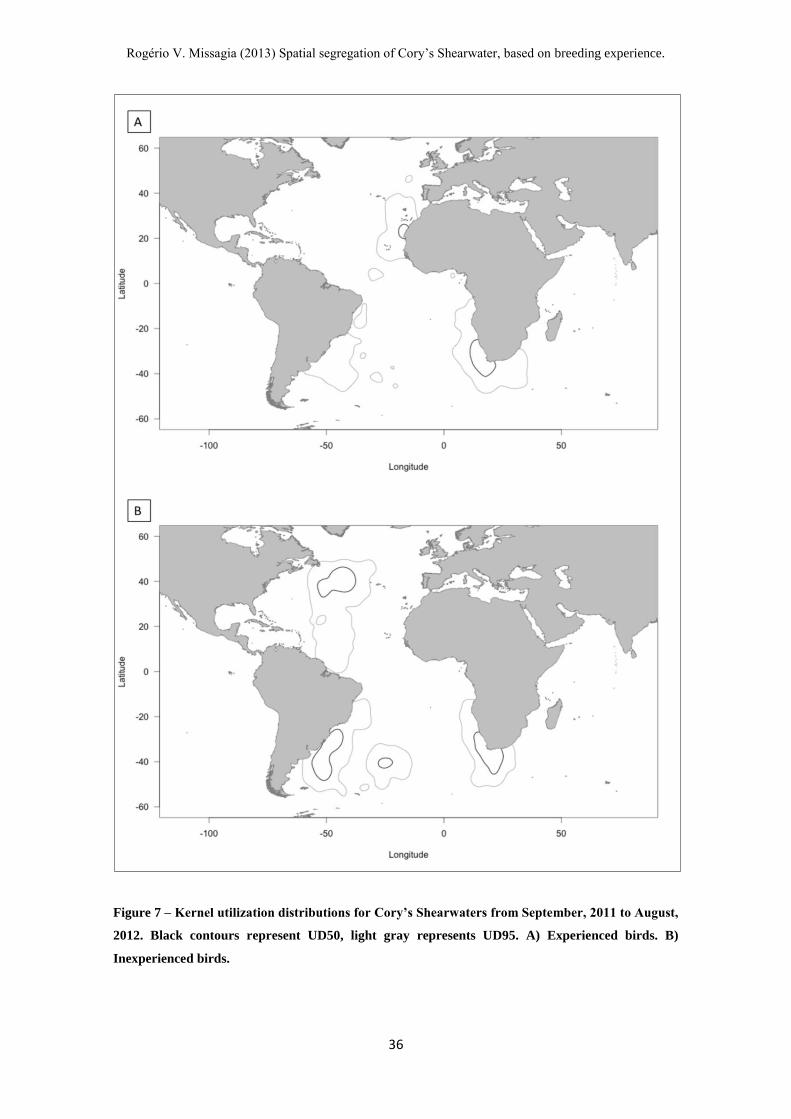
The Kernel utilization distribution for the wintering grounds showed a
considerable degree of segregation between experienced and inexperienced birds.
Experienced birds tended to winter in coastal areas, especially on South and North
Africa, with only one bird wintering in South America. Inexperienced birds wintered in
four different areas: Newfoundland, Southern Brazil, South Atlantic and South Africa
(Fig. 7). The segregation found during visual analysis was further supported by the
overlapping indexes calculated, showing an overlap on the 75% Kernel UD of only
24.2% between the two groups of birds during the wintering period.
The variation in migratory profiles for the inexperienced birds was also
supported by an overlap index of 22.5% for the wintering grounds, indicating that
inexperienced birds not only present spatial segregation from experienced birds, but
also amongst themselves. When compared to their counterparts, experienced birds
showed considerable homogeneity in the wintering profile, as the group presented an
overlapping rate of 71.8%. As expected, the overlapping rates during the breeding
season were high, a reflection of the breeding site fidelity of the species (Table 3).
Unique ID Sex Experience Deployment Leave breed Arrive winter Leave winter Arrive breed Winter Grounds
1 M Exp 31/08/2011 07/11/2011 28/11/2011 22/02/2012 04/04/2012 South Africa
2 F Exp 31/08/2011 27/10/2011 30/11/2011 23/02/2012 09/04/2012 South Africa
3 F Inexp 11/09/2011 29/10/2011 06/12/2011 05/03/2012 04/04/2012 South Brazil
4 M Exp 02/09/2011 06/11/2011 04/12/2011 01/03/2012 05/04/2012 South Africa
5 M Inexp 13/09/2011 23/09/2011 14/12/2011 07/03/2012 31/03/2012 South Africa
6 F Inexp 01/09/2011 23/11/2011 26/11/2011 22/02/2012 29/02/2012 Newfoundland
7 M Inexp 02/09/2011 30/09/2011 14/12/2011 10/03/2012 05/04/2012 South Atl. (p)+S. Br.
8 F Exp 21/08/2011 29/08/2011 29/12/2011 08/03/2012 01/04/2012 South Africa
9 M Inexp 20/08/2011 31/08/2011 24/11/2011 04/03/2012 25/03/2012 South Africa
10 M Inexp 20/08/2011 08/10/2011 27/10/2011 04/03/2012 30/03/2012 Newfoundland+N. Br.
11 F Inexp 20/08/2011 21/11/2011 01/01/2012 14/03/2012 10/04/2012 South Brazil
12 M Exp 21/08/2011 01/09/2011 14/10/2011 26/02/2012 29/03/2012 Cape Verde
13 F Exp 20/08/2011 05/11/2011 04/12/2011 28/02/2012 04/04/2012 South Africa
14 M Exp 20/08/2011 18/11/2011 10/01/2012 07/03/2012 04/04/2012 South Brazil
Rogério V. Missagia (2013) Spatial segregation of Cory’s Shearwater, based on breeding experience.
36
Figure 7 – Kernel utilization distributions for Cory’s Shearwaters from September, 2011 to August,
2012. Black contours represent UD50, light gray represents UD95. A) Experienced birds. B)
Inexperienced birds.
Rogério V. Missagia (2013) Spatial segregation of Cory’s Shearwater, based on breeding experience.
37
Table 3 – Percentage of overlap of the 75% Kernel UD for Cory’s Shearwaters breeding in
Berlenga Island. Numbers are shown in percentual monthly values and seasonal mean for
experienced and inexperienced birds, and between groups.
3.2 Activity analysis
Considering both experienced and inexperienced individuals, there was a higher
amount of time spent in water (i.e. lower activity levels) by the birds from October,
2011 to February, 2012. An increase in activity started in March, 2012 and extended
through the breeding season, with the lowest proportion of time spent in water (i.e.
highest activity levels) during the months of June and July (2012). There were also
distinguishable variations between the birds’ activity during light and dark periods:
daytime activity was higher than nocturnal activity during the non-breeding season, but
considerably lower during the breeding season. The group activity summary is depicted
below (Fig. 8).
MONTHLY Exp x Inexp Experienced Inexperienced
January-2012 10.1 69.3 10.4
February-2012 11.2 70.3 12.8
March-2012 13.4 72.8 21.9
April-2012 34.9 71.9 31.4
May-2012 42.1 74.8 39.5
June-2012 55.8 84.9 46.9
July-2012 67.5 89.4 61.1
August-2012 92.8 92.4 72.1
September-2011 81.6 86.1 64.2
October-2011 61.7 76.3 47.2
November-2011 33.1 70.8 28.4
December-2011 16.0 71.2 11.3
SEASONAL
Breeding 62.4 82.8 52.5
Non-breeding 24.2 71.8 22.5
Overlapping (%)
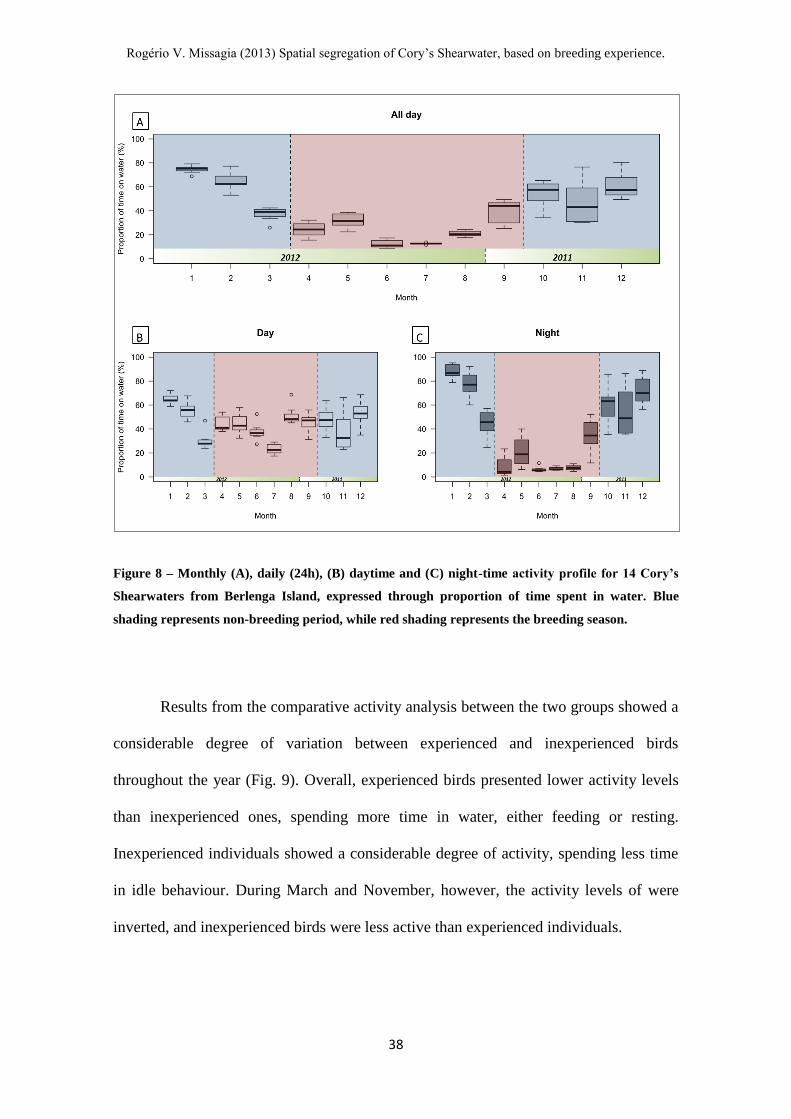
Rogério V. Missagia (2013) Spatial segregation of Cory’s Shearwater, based on breeding experience.
38
Figure 8 – Monthly (A), daily (24h), (B) daytime and (C) night-time activity profile for 14 Cory’s
Shearwaters from Berlenga Island, expressed through proportion of time spent in water. Blue
shading represents non-breeding period, while red shading represents the breeding season.
Results from the comparative activity analysis between the two groups showed a
considerable degree of variation between experienced and inexperienced birds
throughout the year (Fig. 9). Overall, experienced birds presented lower activity levels
than inexperienced ones, spending more time in water, either feeding or resting.
Inexperienced individuals showed a considerable degree of activity, spending less time
in idle behaviour. During March and November, however, the activity levels of were
inverted, and inexperienced birds were less active than experienced individuals.
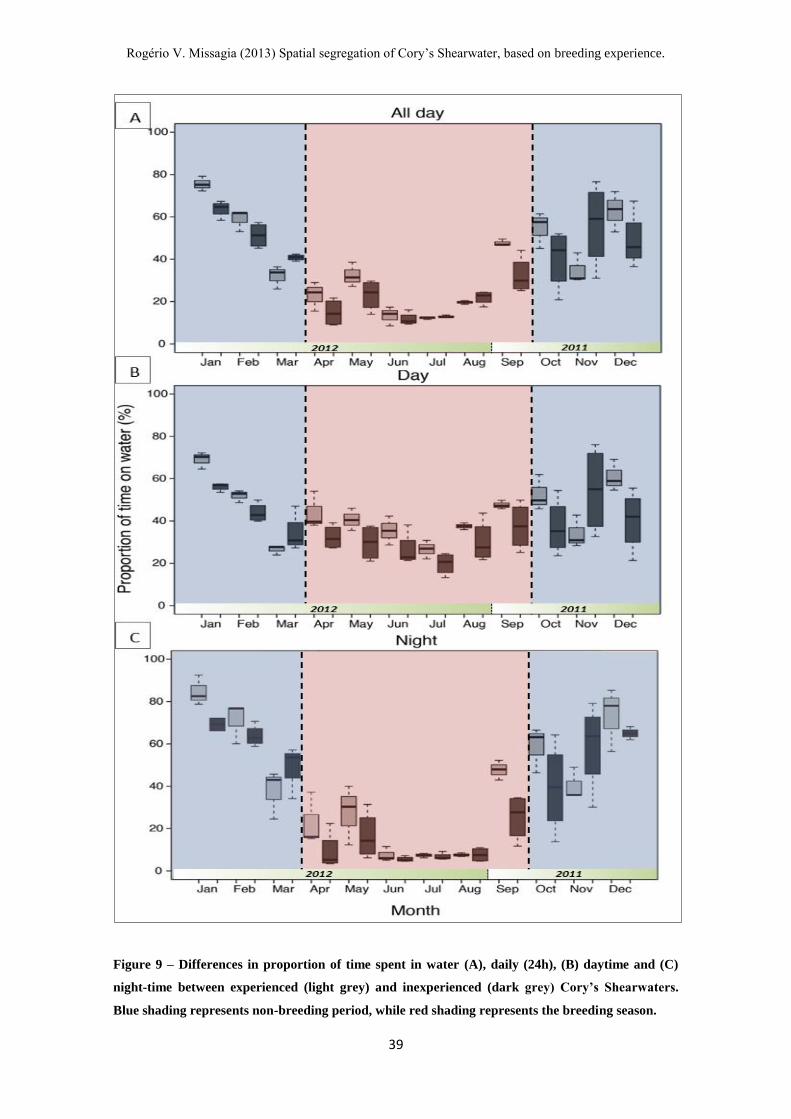
Rogério V. Missagia (2013) Spatial segregation of Cory’s Shearwater, based on breeding experience.
39
Figure 9 – Differences in proportion of time spent in water (A), daily (24h), (B) daytime and (C)
night-time between experienced (light grey) and inexperienced (dark grey) Cory’s Shearwaters.
Blue shading represents non-breeding period, while red shading represents the breeding season.
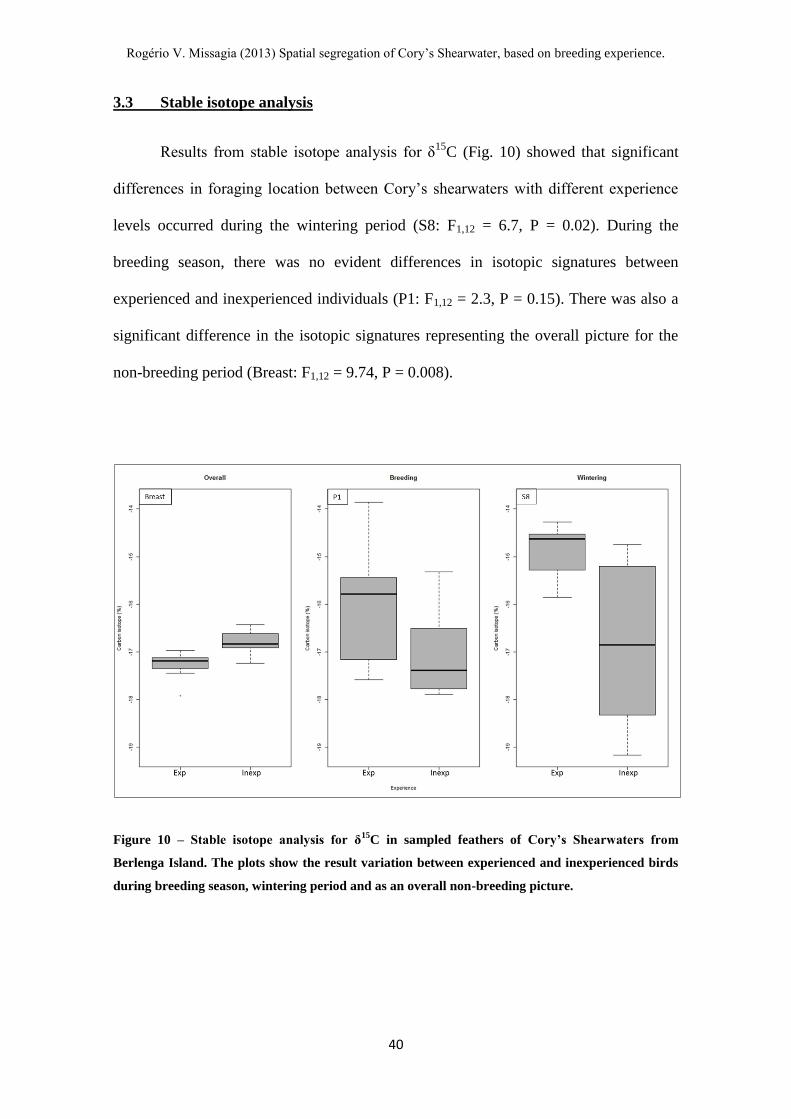
Rogério V. Missagia (2013) Spatial segregation of Cory’s Shearwater, based on breeding experience.
40
3.3 Stable isotope analysis
Results from stable isotope analysis for δ15
C (Fig. 10) showed that significant
differences in foraging location between Cory’s shearwaters with different experience
levels occurred during the wintering period (S8: F1,12 = 6.7, P = 0.02). During the
breeding season, there was no evident differences in isotopic signatures between
experienced and inexperienced individuals (P1: F1,12 = 2.3, P = 0.15). There was also a
significant difference in the isotopic signatures representing the overall picture for the
non-breeding period (Breast: F1,12 = 9.74, P = 0.008).
Figure 10 – Stable isotope analysis for δ15
C in sampled feathers of Cory’s Shearwaters from
Berlenga Island. The plots show the result variation between experienced and inexperienced birds
during breeding season, wintering period and as an overall non-breeding picture.
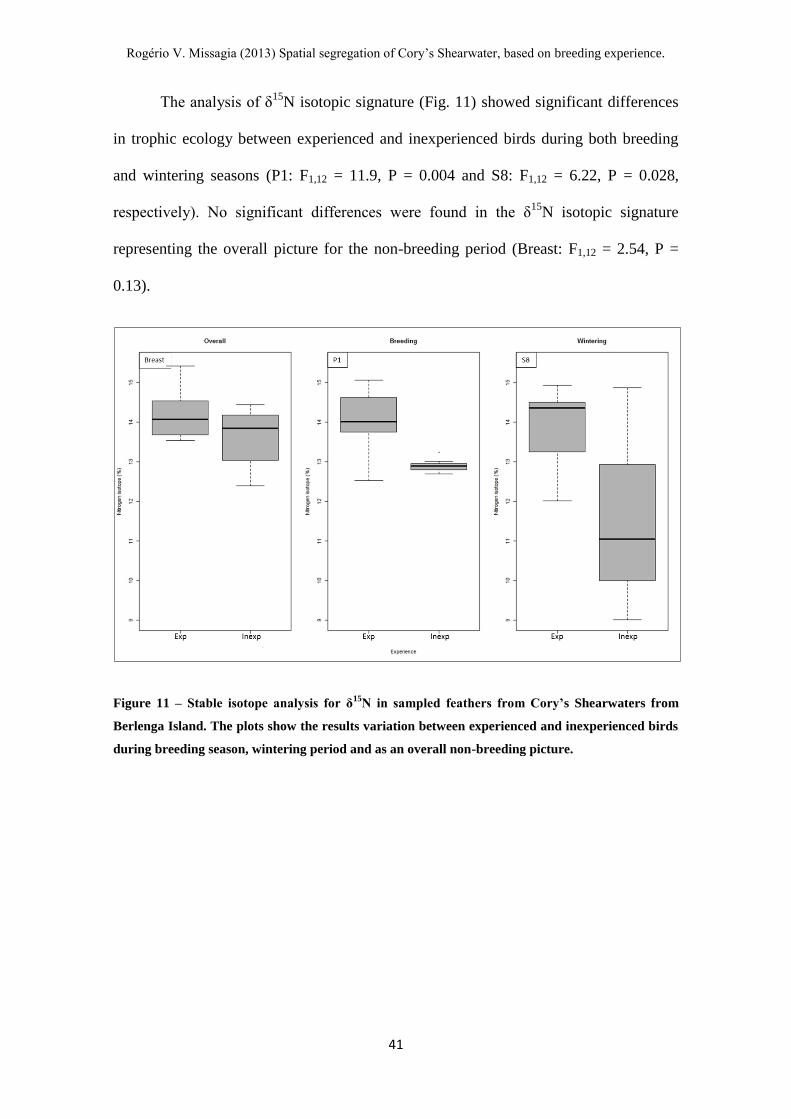
Rogério V. Missagia (2013) Spatial segregation of Cory’s Shearwater, based on breeding experience.
41
The analysis of δ15
N isotopic signature (Fig. 11) showed significant differences
in trophic ecology between experienced and inexperienced birds during both breeding
and wintering seasons (P1: F1,12 = 11.9, P = 0.004 and S8: F1,12 = 6.22, P = 0.028,
respectively). No significant differences were found in the δ15
N isotopic signature
representing the overall picture for the non-breeding period (Breast: F1,12 = 2.54, P =
0.13).
Figure 11 – Stable isotope analysis for δ15
N in sampled feathers from Cory’s Shearwaters from
Berlenga Island. The plots show the results variation between experienced and inexperienced birds
during breeding season, wintering period and as an overall non-breeding picture.
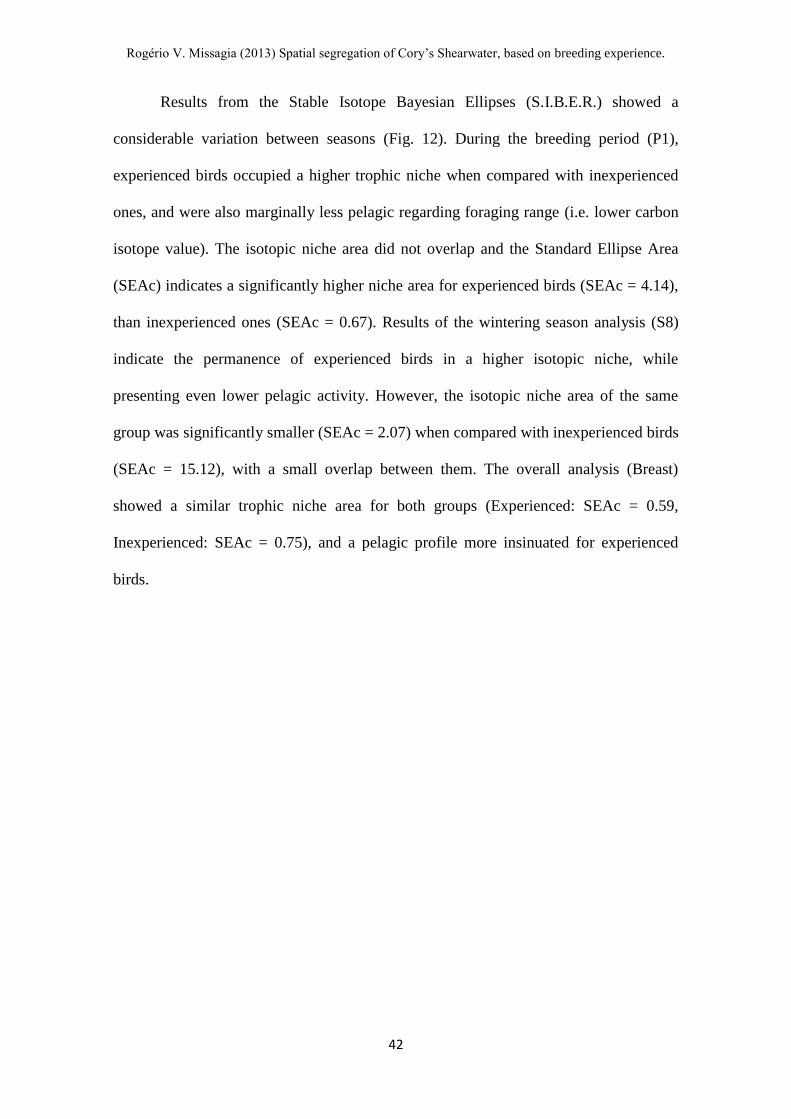
Rogério V. Missagia (2013) Spatial segregation of Cory’s Shearwater, based on breeding experience.
42
Results from the Stable Isotope Bayesian Ellipses (S.I.B.E.R.) showed a
considerable variation between seasons (Fig. 12). During the breeding period (P1),
experienced birds occupied a higher trophic niche when compared with inexperienced
ones, and were also marginally less pelagic regarding foraging range (i.e. lower carbon
isotope value). The isotopic niche area did not overlap and the Standard Ellipse Area
(SEAc) indicates a significantly higher niche area for experienced birds (SEAc = 4.14),
than inexperienced ones (SEAc = 0.67). Results of the wintering season analysis (S8)
indicate the permanence of experienced birds in a higher isotopic niche, while
presenting even lower pelagic activity. However, the isotopic niche area of the same
group was significantly smaller (SEAc = 2.07) when compared with inexperienced birds
(SEAc = 15.12), with a small overlap between them. The overall analysis (Breast)
showed a similar trophic niche area for both groups (Experienced: SEAc = 0.59,
Inexperienced: SEAc = 0.75), and a pelagic profile more insinuated for experienced
birds.

Rogério V. Missagia (2013) Spatial segregation of Cory’s Shearwater, based on breeding experience.
43
Figure 12 – A) Isotopic niches for different experience levels of Cory’s Shearwaters from Berlenga Island (Inexp = inexperienced, Exp = experienced),
represented in Bayesian Ellipses for overall non-breeding period (Breast), breeding season (P1) and wintering (S8). B) Standard ellipse areas (SEAc) for
corresponding periods.
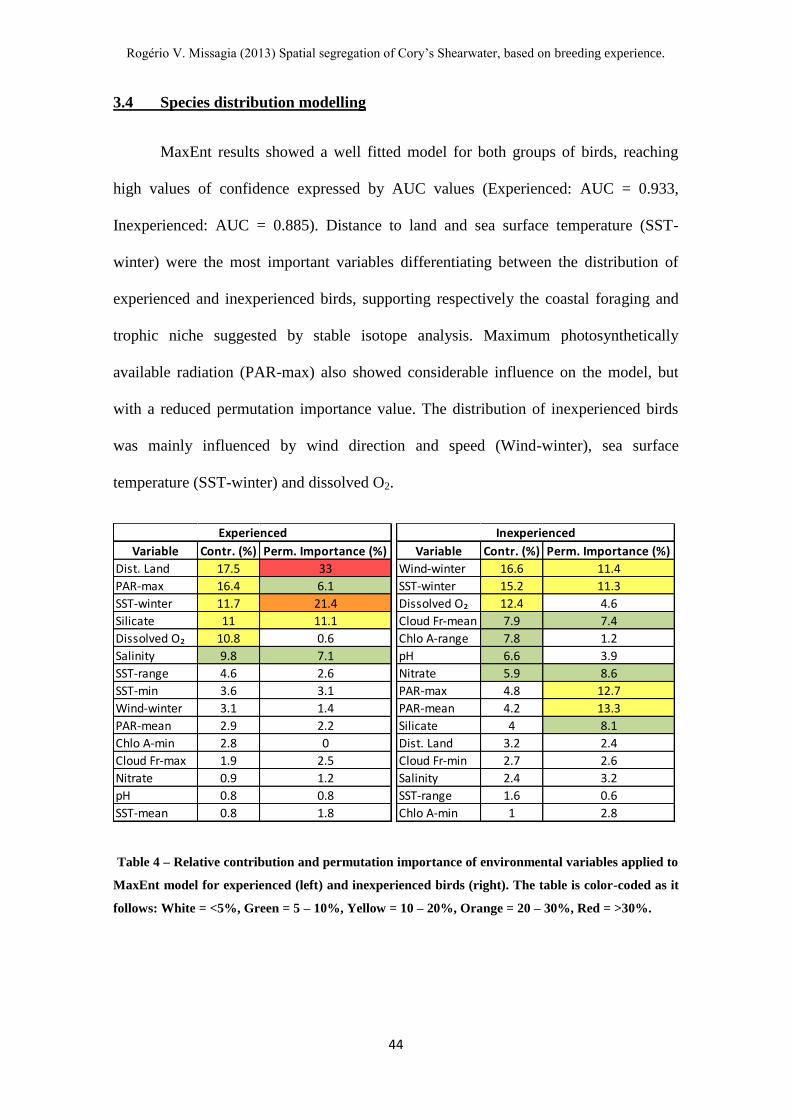
Rogério V. Missagia (2013) Spatial segregation of Cory’s Shearwater, based on breeding experience.
44
3.4 Species distribution modelling
MaxEnt results showed a well fitted model for both groups of birds, reaching
high values of confidence expressed by AUC values (Experienced: AUC = 0.933,
Inexperienced: AUC = 0.885). Distance to land and sea surface temperature (SST-
winter) were the most important variables differentiating between the distribution of
experienced and inexperienced birds, supporting respectively the coastal foraging and
trophic niche suggested by stable isotope analysis. Maximum photosynthetically
available radiation (PAR-max) also showed considerable influence on the model, but
with a reduced permutation importance value. The distribution of inexperienced birds
was mainly influenced by wind direction and speed (Wind-winter), sea surface
temperature (SST-winter) and dissolved O2.
Table 4 – Relative contribution and permutation importance of environmental variables applied to
MaxEnt model for experienced (left) and inexperienced birds (right). The table is color-coded as it
follows: White = <5%, Green = 5 – 10%, Yellow = 10 – 20%, Orange = 20 – 30%, Red = >30%.
Variable Contr. (%) Perm. Importance (%)
Dist. Land 17.5 33
PAR-max 16.4 6.1
SST-winter 11.7 21.4
Silicate 11 11.1
Dissolved O₂ 10.8 0.6
Salinity 9.8 7.1
SST-range 4.6 2.6
SST-min 3.6 3.1
Wind-winter 3.1 1.4
PAR-mean 2.9 2.2
Chlo A-min 2.8 0
Cloud Fr-max 1.9 2.5
Nitrate 0.9 1.2
pH 0.8 0.8
SST-mean 0.8 1.8
Experienced
Variable Contr. (%) Perm. Importance (%)
Wind-winter 16.6 11.4
SST-winter 15.2 11.3
Dissolved O₂ 12.4 4.6
Cloud Fr-mean 7.9 7.4
Chlo A-range 7.8 1.2
pH 6.6 3.9
Nitrate 5.9 8.6
PAR-max 4.8 12.7
PAR-mean 4.2 13.3
Silicate 4 8.1
Dist. Land 3.2 2.4
Cloud Fr-min 2.7 2.6
Salinity 2.4 3.2
SST-range 1.6 0.6
Chlo A-min 1 2.8
Inexperienced
Rogério V. Missagia (2013) Spatial segregation of Cory’s Shearwater, based on breeding experience.
45
Future predictions of spatial distribution of Cory’s Shearwaters were made
considering variations restricted to the sea surface temperature (SST), with scaling
based on the A2 scenario from IPCC. The resulting model suggests the occurrence of a
poleward shift caused by the proposed increase on sea surface temperature, and shows
the consequent differences in the spatial distribution of experienced and inexperienced
birds (Fig. 13).
Within the first 10 years, populations would move away from their known
habitats and into previously unexplored, more pelagic areas. Experienced birds would
start to make use of South Atlantic pelagic areas, while inexperienced birds would
spread towards the Arctic Circle. In 50 years, experienced birds would reach the both
the Arctic and Antarctic Circle, while inexperienced birds would essentially be
distributed throughout the whole North and South Atlantic oceans, including both Polar
Circles and the Mediterranean Sea. From this point, up to 100 years in the future, the
variations on spatial distribution shift would continue to be intensified.
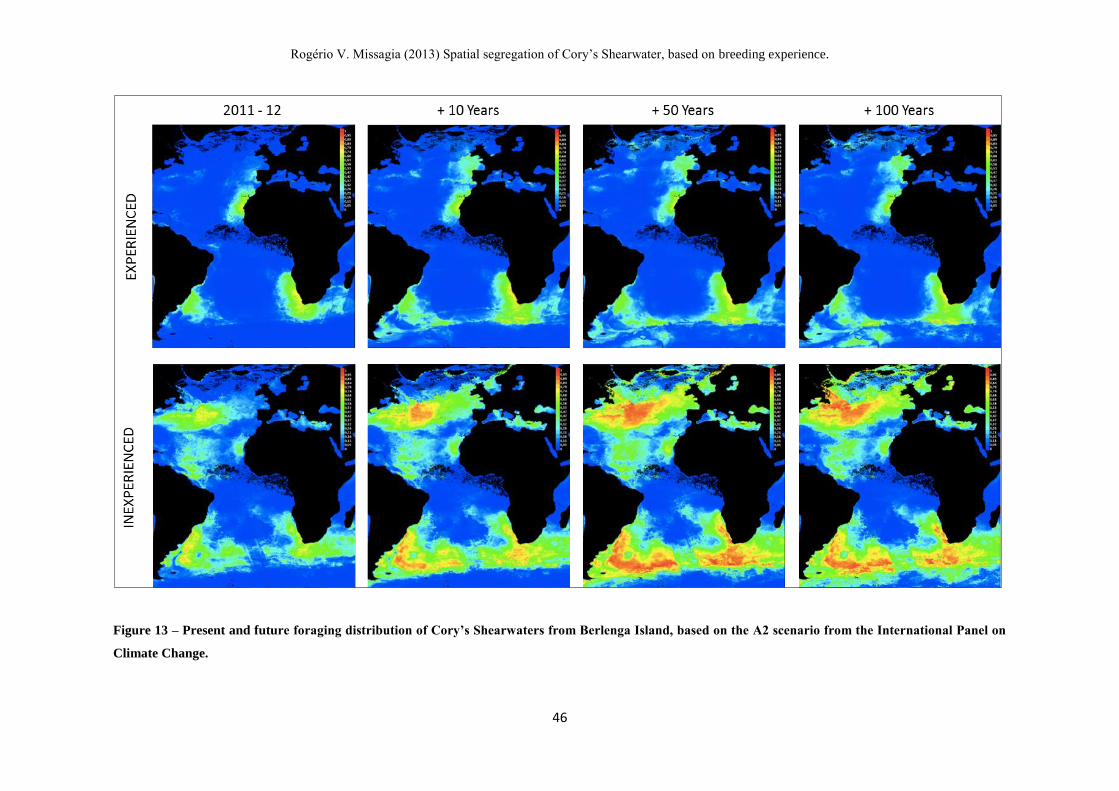
Rogério V. Missagia (2013) Spatial segregation of Cory’s Shearwater, based on breeding experience.
46
Figure 13 – Present and future foraging distribution of Cory’s Shearwaters from Berlenga Island, based on the A2 scenario from the International Panel on
Climate Change.

Chapter 4 – Discussion
© Rahel Borrmann
Rogério V. Missagia (2013) Spatial segregation of Cory’s Shearwater, based on breeding experience.
48
4.1 Migratory profile of experienced and inexperienced birds
There was a clear difference on the migratory profile presented by experienced
and inexperienced birds regarding their outgoing route and wintering grounds.
Inexperienced birds wintering routes were marked by large detours and stopovers in
foraging areas located in Newfoundland, North of Brazil and South Atlantic. Following
the same tendency, wintering grounds of inexperienced birds also varied, and were
sometimes located in different hemispheres (e.g. birds 5 and 6). In comparison,
experienced birds showed a considerable uniformity in their migratory profile, with
straightforward routes and less variation in their migratory grounds.
Both the flexibility and fidelity of Cory’s Shearwaters to wintering areas have
been analyzed before (e.g. Dias et al., 2010), showing that individuals can shift their
routes, stopover areas and wintering destinations between years. Normally, the areas
used as stopovers are of high productivity, and may have been chosen as wintering
grounds in previous migrations. However, the relation between wintering
flexibility/fidelity and the experience level of the birds has not been fully explored, and
the spatial variation encountered between the groups is commonly (and correctly)
attributed to differences in environmental predictors such as sea-surface temperature
and marine productivity, or even morphological differences between populations
separated geographically (e.g. Catry et al., 2011).
Our results indicate the existence of another plausible explanatory factor, related
with the experience levels of each bird. It is known that young Cory’s Shearwaters
(non-breeders) spend most of the time at the sea, as many other species of seabirds
(Warham, 1996). During this period, young birds can gather information on the
conditions and foraging opportunities of different sites, gradually building a
Rogério V. Missagia (2013) Spatial segregation of Cory’s Shearwater, based on breeding experience.
49
“knowledge base” for migratory destinations and even establishing one (or several)
“preferred” migratory strategies (Dias et al., 2010). Even though the inexperienced birds
tracked in this study were already in reproductive age, the suggested learning period is
still apparent in their migratory profile, and might continue to exercise influence as they
make the transition into experienced breeders.
Previous studies showed that wind parameters may have a significant local-scale
influence on foraging strategies of seabirds, as well as on the choice of migratory routes
for wintering areas (Weimerskirch et al., 2005, González-Solís et al., 2009, Paiva et al.,
2010d, Soares, 2013). Wind currents flow clockwise in the Northern hemisphere and
counter-clockwise in the Southern hemisphere, leading researchers to hypothesize a
figure-eight migratory route for other shearwater species (Warham, 1996, González-
Solís et al., 2007). This premise can be supported by our study, since some of the
tracked individuals presented a migratory route that resembles the proposed eight-figure
(birds 1, 3, 11 and 12). The results of habitat modelling (i.e. MaxEnt results) determined
the wind speed during winter as the primary environmental predictor influencing the
distribution of inexperienced birds, supporting the role of experience level in the
migratory profile of Cory’s Shearwaters even further, since the effective use of wind
currents can enable and/or facilitate the exploratory behavior of birds during their early
years and through the first breeding seasons.
As more successful breeders, experienced birds tend to leave the colony at later
dates, after the chick-rearing period, while inexperienced – and most likely unsuccessful
– breeders leave at early dates. This gives inexperienced birds the extra amount of time
to explore different foraging areas, unlike experienced birds, that must adopt direct
migratory routes to wintering grounds, essentially compensating for the time invested in
a successful breeding. The straightforward migratory profile presented by experienced
Rogério V. Missagia (2013) Spatial segregation of Cory’s Shearwater, based on breeding experience.
50
birds can also be related to the gradual gathering of information on the conditions and
foraging opportunities of different sites. Experienced birds may possess established or
“preferred” migratory strategies, chosen based on early exploratory years, and
correlated with the overall foraging potential of the wintering grounds in question.
Therefore, experienced birds proved to be less exploratory and less pelagic than
inexperienced ones, foraging in coastal areas, closer to land. This characteristic was also
supported by the habitat modelling analysis, which showed the distance to land as the
primary variable determining the distribution of experienced Cory’s Shearwaters during
wintering period. As expected, wind parameters scored low values for explaining the
distribution of experienced birds, when compared with distance to land (3.1% and
17.5%, respectively).
The migratory schedule of the tracked birds covered a large time-span, with
timing between individuals ranging from a few days to months of difference in certain
occasions. Differences in migratory schedule of seabirds have been found to exist
between individuals of a same population and between populations of different breeding
colonies (e.g. Kubetzki et al., 2009), with the same phenomenon being also described in
Cory’s Shearwaters (e.g. Catry et al., 2011). Most of these differences are attributed to
factors like geographical location, variations in the morphology and taxonomy of each
bird or population. Individual success (or failure) in a given breeding attempt could also
act as a determinant, since unsuccessful breeders don’t have to provide for their
offspring, and can leave the colony at earlier dates. However, no clear correlations
between migratory schedule and experience level have been identified in previous
studies, and our analysis supports this premise, since, despite individual variance, no
significant differences were found on the migratory schedule of experienced and
inexperienced individuals.
Rogério V. Missagia (2013) Spatial segregation of Cory’s Shearwater, based on breeding experience.
51
As mentioned above, the choice of wintering grounds is closely related to the
foraging potential of different areas, which can be influenced by certain environmental
variables like primary productivity, bathymetry and sea-surface temperature. Despite
the high variability on the migratory profiles of inexperienced birds, the general picture
showed that two areas were most sought after as wintering grounds by the whole group:
South of Brazil, influenced by the Southern branch of the Brazil Current (4 birds) and
South Africa, influenced by the Benguela and Agulhas Current (7 birds). These areas
are known for being associated with major upwelling phenomena, presenting high
chlorophyll -a concentrations and high rates of primary production (Longhurst, 1998,
Camphuysen and Van der Meer, 2001, González-Solís et al., 2007, Paiva et al., 2010a.),
and provide high quality foraging grounds for several seabirds and other marine
animals. The fact that none of these areas were exclusive to either experienced or
inexperienced individuals indicates that, even though the choice of migratory routes can
be affected by different experience levels, its influence on the final destination of each
bird is most likely reduced.
The effects of different migratory strategies are a topic of discussion, being
generally correlated with resource availability or levels of intra and inter-specific
competition (Lewis et al., 2001, Dias et al., 2010, Catry et al., 2011). The results for
Kernel utilization distribution showed a clear segregation between experienced and
inexperienced birds throughout the year, which fits into a possible scenario where the
intra-specific competition in the species would be attenuated. However, the nature of the
data collected in this study prevents further analysis on the subject, as any assumptions
regarding the reduction of inter-specific competition or the magnitude of such effects
require a more detailed and localized monitoring.
Rogério V. Missagia (2013) Spatial segregation of Cory’s Shearwater, based on breeding experience.
52
4.2 Activity levels
The daily activity levels showed by the fourteen individuals throughout the year
follow general predictions of activity for seabirds. This means that, as a whole, the birds
spent more time in the water during the non-breeding season (from September to
March), when they are free of the highly demanding breeding constraints (e.g. providing
for the chicks). The lack of these breeding constraints allows the birds to spend more
time resting on the surface of the water, and likely foraging through the ‘sit-and-wait’
technique (Schreiber and Burger, 2001), essentially recovering from the energetically
expensive events that took place in the previous months, such as migration and breeding
(in the case of the successful breeders). Recently, a lot of interest has arisen on the
possibility that events happening during the non-breeding season could affect the
condition and performance of individuals during the breeding period, the “carry-over
effect” (Catry et al., 2011). Considering this possibility, the high amount of time spent
in the water showed by the experienced birds during the non-breeding season might
reflect positively on their reproductive success, since the low activity levels allows them
to efficiently replenish any spent nutritional reserves, in preparation for the energetically
demanding upcoming months.
Still considering the whole group, results showed clear variation between daily
and nocturnal activity levels. During the breeding season, activity levels were lower
during the day, when the birds were foraging and providing not only for the chicks, but
also for themselves. During the night, the proportion of time spent in the water was very
low, which might induce the conclusion of high activity levels. However, these values
are in fact the reflection of the nesting behaviour presented by the adults during the
night period (Warham, 1996), and do not represent any activity parameters.
Interestingly enough, these trends were inverted during the migration and wintering
Rogério V. Missagia (2013) Spatial segregation of Cory’s Shearwater, based on breeding experience.
53
periods, with birds spending more time in the water during the night. Even though the
activity data collected is not detailed enough to specify the type of behaviour performed
in the water, the possibilities are not many, being mostly limited to either foraging or
resting on the water surface. Previous studies have shown that seabirds tend to fly and
hunt for prey during the day, and spend part of the night resting on the sea surface (e.g.
Garthe et al., 1999, Weimerskirch and Guionnet, 2002, Catry et al., 2004a), a pattern
that should be considered as the most probable for the studied individuals. Nevertheless,
nocturnal foraging should not be excluded as a possibility, since some species of petrels
and shearwaters are known for hunting prey in the dark, taking advantage of the
moonlight and of vertical migration performed by some fish species (Ballance and
Pitman, 1999, Mougeot and Bretagnolle, 2000). This is a difficult premise to confirm,
however, and any correlations between nocturnal activity and foraging should be
handled carefully.
The activity data also showed a considerable difference between the activity
levels of experienced and inexperienced birds, with experienced individuals spending
more time in the water throughout the day (and night) than inexperienced ones. This
trend was found in almost every month (the only exceptions being November and
March), happening equally in both breeding and wintering periods. To explain this
pattern, it is important to take into account the different migratory strategies of
experienced and inexperienced Cory’s Shearwaters (section 4.1), which suggests the
possibility of an exploratory period occurring during the first years of life of any given
bird, adding to the gradual increase of their knowledge regarding the best wintering
grounds (i.e. with higher foraging potential). In this case, the differences in activity
found between experienced and inexperienced individuals could be explained by the
combination of two factors: 1) The already established, high-productivity wintering
Rogério V. Missagia (2013) Spatial segregation of Cory’s Shearwater, based on breeding experience.
54
grounds and foraging areas of experienced birds, which allows them to spend less time
flying and foraging (i.e. essentially out of the water). 2) The increased exploratory
behaviour (and consequently, flight time) of inexperienced individuals, which reduces
the amount of time spent on the water surface. It is important to highlight that, despite
being largely based on the migratory behaviour of each group during the non-breeding
period, this reasoning might be also validated during the breeding season. In a previous
study, Haug (2012) analyzed the differences on foraging strategies of Cory’s
Shearwaters belonging to the same colony in Berlenga Island during the breeding
period, and reported a general tendency for longer foraging trips performed by
inexperienced birds (in both distance and time), while experienced birds tended to
forage in more coastal areas, therefore flying for shorter distances. This type of
variation could be compared to the one found during the migratory events of the non-
breeding period, when experienced birds migrate using straightforward, shorter routes
and inexperienced birds migrate following longer paths, with many stopover areas, and
allow us to draw a correlation between activity levels and experience, focused in a
smaller scale.
Even though results indicate a general correlation between total activity and
foraging/migratory behaviour, the data pool used is still small and restricted to a short
span of time. The continuous monitoring of the group, along with analysis of future
patterns presented by birds with different experience levels might improve the
applicability and confidence of such trends.
Rogério V. Missagia (2013) Spatial segregation of Cory’s Shearwater, based on breeding experience.
55
4.3 Comparison of foraging ecology related to experience
The analysis of different foraging strategies presented by experienced and
inexperienced seabirds became more important in recent years, but few studies actually
tackled the problem with solid supporting data. In our study, the results found by the
stable isotope analysis showed significant differences on the foraging ecology of
experienced and inexperienced individuals. When focused into a specific time period,
results from the Carbon isotope analysis indicates that experienced birds forage closer
to land during both breeding and wintering seasons, while inexperienced birds tend to
forage in more pelagic areas. These results support the conclusions made based on
tracking and activity patterns, and fall into accord with data from isotopic analyses
realized during the breeding season of Cory’s Shearwaters in Berlenga Island by Haug
(2012).
As showed above, the role of experience on the migratory behaviour and activity
of Cory’s Shearwaters was significant, making it easy to establish a connection between
isotopic profile and experience levels. However, other factors might influence the
segregation found within the group, such as environmental conditions and the individual
history of each bird. Previous research on Black Browed Albatrosses (Talassarche
melanophrys) showed that environmental variations may mask any age or experience-
related differences in demographic traits, shifting the spatial distribution and even
causing fluctuations on the survival rates and breeding success of both experienced and
inexperienced birds (Nevaux et al., 2007), with similar patterns being found in other
species of seabirds like Great Skuas (Catharacta skua, Ratcliffe et al., 1998) and Blue
Petrels (Halobaena caerulea, Barbraud and Weimerskirch, 2005). Results from the
habitat modelling analysis (MaxEnt) performed during this study are correlated to this
premise, showing that environmental variables affected the distribution of the tracked
Rogério V. Missagia (2013) Spatial segregation of Cory’s Shearwater, based on breeding experience.
56
birds during the year (see Table 4). Therefore, even though our results from the isotopic
analyses may support the experience-related foraging segregation in Cory’s
Shearwaters, they should not be considered an exclusive influencing factor, but part of
much more complex group of variables.
Considering the Carbon signatures, an interesting variation was expressed in
breast feathers, which showed an inversion of the foraging pattern found in the
signature of other sampled tissues, and classified experienced birds as being more
pelagic than inexperienced ones. The reasoning for the analysis of breast feathers is
based on the fact that, since moulting happens continuously during the non-breeding
season, these feathers may be considered a more homogeneous sample, showing an
overall picture of the foraging behaviour during the period, instead of focusing on a
specific time (Ceia et al., 2013). However, the results of this analysis contradict the
premises regarding the experience-related foraging differences on the species, and
might indicate that, under this context, breast feathers are not as effective as a tissue
sample for Carbon isotope analyses when compared with primary or secondary feathers
(which isotopic signature can be more accurately delimited in time). The continuity of
this type of monitoring could help elucidate the validity of breast feathers as sampling
tissue in studies comparing the behavioural differences between experienced and
inexperienced birds.
Results from Nitrogen stable isotope analysis indicate that experienced birds
forage on higher trophic level prey than inexperienced ones during both breeding and
wintering seasons, while the latter hunted for prey located on lower levels of the food
chain. Similar results were found by Haug (2012), but were focused on the breeding
season of individuals breeding in the same colony were this study was carried out, not
showing any data on the non-breeding period. Still on the same study, Haug suggests
Rogério V. Missagia (2013) Spatial segregation of Cory’s Shearwater, based on breeding experience.
57
that the diet of inexperienced individuals can become gradually similar to those
presented by experienced birds in consecutive seasons, hinting at the possible learning
process suggested by Dias (2010).
The S.I.B.E.R. analysis also showed interesting results regarding the isotopic
niche areas for birds of different experience levels. During the breeding season,
experienced birds possessed a much larger niche area than inexperienced ones, while
during the wintering period, the situation was reversed. This phenomenon might be
related to the different migratory profiles presented by the groups, since, for being
significantly more exploratory and pelagic during the non-breeding season (refer to
section 4.1), inexperienced birds would have the opportunity to forage in several
different areas, sometimes separated by thousands of kilometers, and inhabited by
different kinds of prey. The breeding site fidelity presented by the species would
mitigate this situation, overlapping the foraging area of experienced and inexperienced
birds into a much more restricted area, where the constant variety of prey might benefit
individuals with more developed foraging strategies (i.e. experience) and effectively
reducing the isotopic niche area of inexperienced birds.
4.4 Future scenarios
Much has been discussed regarding the impact of climate change on the
distribution of seabirds. The general consensus points towards the prejudicial effects
and fluctuations of highly influential environmental predictors, like sea surface
temperature, dissolved oxygen and productivity rates (Schreiber and Burger, 2001, Irons
et al., 2008). To verify this hypothesis, we performed a modelling exercise on the
MaxEnt platform, considering a possible temperature increase of 0.18°C per decade for
the next 100 years, the A2 scenario proposed by the IPCC (one of the more conservative
Rogério V. Missagia (2013) Spatial segregation of Cory’s Shearwater, based on breeding experience.
58
scenarios of future climate change). The results suggest that changes in the environment
after the first decade should cause an increase on the global spatial distribution of
Cory’s Shearwaters, with experienced and inexperienced birds foraging in areas
previously ignored. In a recent study, Péron (2012) analyzed the foraging distribution of
King Penguins (Aptenodytes patagonicus), highlighting the influence of increases on
sea surface temperature. In this case, temperature increase acted as one of the main
drivers of foraging distribution on the species, inducing birds to search for resources in
higher latitudes, which characterizes a poleward shift scenario. It is not unreasonable to
consider the possibility of a similar scenario occurring in Cory’s Shearwaters, since sea
surface temperature (SST) was considered one of the three most influential
environmental predictors affecting the spatial distribution of both experienced and
inexperienced individuals (Table 4).
Considering the inherent differences in distribution and migratory behavior
presented by birds with different levels of experience throughout the year, we can also
assume that experienced birds would be more affected by shifts in distribution than
inexperienced ones, since these birds already engage in migratory events that takes them
to more pelagic areas. Therefore, the close relation found between the distribution of
experienced birds and distance to land suggests that the expansion of their foraging
grounds could greatly affect their foraging success, along with any other consequently
related aspect, like survival rates and breeding success. Many reasons could be
responsible for this, including: 1) The increase of intra and inter-specific competition
for resources, resulting from the probable overlap with foraging grounds typical of other
marine animals, especially in the South Atlantic and Arctic and Antarctic Circles. 2)
The necessity of feeding in areas with low foraging potential, due to unfavorable
environmental conditions or other productivity issues. 3) The increased energetic cost of
Rogério V. Missagia (2013) Spatial segregation of Cory’s Shearwater, based on breeding experience.
59
longer foraging trips, which would not be effectively compensated due to the low prey
availability. 4) The increased distance between the foraging grounds and breeding
colony during the breeding period, potentially reducing the breeding success of this
population.
It is important to notice that, even though the modelled distribution is based
around conservative, albeit solid projections for temperature increase, the final scenario
loses reliability proportional to the number of years predicted. Also, previous studies
showed that Cory’s Shearwaters present a remarkable foraging plasticity, and may be
among the species of seabirds better adapted to endure climatic variations (Dias et al.,
2010, Paiva et al., 2010a). Because of these factors, and taking into account the nature
of data collected in this study, the final distributions projected should be considered
mere guidelines for future projects, instead of an established trend for this population.
Further monitoring might provide the necessary data to build a more solid model for the
species.
Rogério V. Missagia (2013) Spatial segregation of Cory’s Shearwater, based on breeding experience.
60
4.5 Conclusions
This study provided significant insights regarding the effects of different
experience levels on the spatial distribution and foraging ecology of Cory’s Shearwaters
during both breeding and wintering seasons. Inexperienced individuals presented a
much more pelagic behaviour than experienced ones, with an annual spatial distribution
marked by long migratory processes, several wintering grounds, and feeding strategy
based on prey located on lower trophic levels. Experienced individuals yearly
distribution was based mainly around coastal areas, with straightforward migratory
routes, few foraging areas, and diet based on higher trophic level prey. Modelling
exercises added valuable information to these results, identifying the main
environmental variables responsible for the differences found. These factors allow us to
conclude that experience plays an important role determining the occurrence of spatial
segregation in the species, showing it as a trait that should not be considered by itself,
but added to a much bigger pool of influencing factors. Furthermore, this study allowed
us a glimpse of what might be the gradual learning of foraging strategies in
inexperienced Cory’s Shearwaters, along with the supposed effects of this period of
foraging behaviour of the group.
Modelling predictions showed us that climate change might have a significant
influence on the spatial distribution of the species, exercising greater influence on
experienced individuals. Nevertheless, the true effects of such large-scale events cannot
be calculated with high precision, making the continuity of populational and
environmental studies even more important for the conservation of this and other
marine taxa.


References
62
Ainley, D.G. and Boekelheide, R.J. (1990). Seabirds of the Farallon Islands: Ecology,
dynamics, and structure of an upwelling-system community. Stanford
University Press. Palo Alto, USA. 450 p.
Ainley, D.G., Spear, L.B., Tynan, C.T., Barth, J.A., Pierce, S.D., Ford, R.G. and
Cowles, T.J. (2005). Physical and biological variables affecting seabird
distributions during the upwelling season of the northern California Current.
Deep Sea Research Part II: Topical Studies in Oceanography 52:123-143.
Alonso, H., Granadeiro, J.P., Paiva, V.H., Dias, A.S., Ramos, J.A., and Catry, P. (2012).
Parent–offspring dietary segregation of Cory’s shearwaters breeding in
contrasting environments. Marine Biology 159: 1197–1207.
Araújo, M. B., Pearson, R.G., Thuiller, W. and Erhard, M. (2005). Validation of species
– climate impact models under climate change. Global Change Biology 11:
1504-1513.
Araújo, M.B. and Guisan, A. (2006). Five (or so) challenges for species distribution
modelling. Journal of Biogeography 33: 1677-1688. DOI: 10.1111/j.1365-
2699.2006.01584.x.
Austin, M. (2007). Species distribution models and ecological theory: A critical
assessment and some possible new approaches. Ecological Modelling 200: 1-
19. DOI: 16/j.ecolmodel.2006.07.005.
Bakun, A. 1990. Global climate change and intensification of coastal ocean upwelling.
Science 247: 198-201.
Ballance, L.T. and Pitman, R.L. (1999). Foraging ecology of tropical seabirds. In:
Adams, N.J. and Slotow, R.H. (Eds). Proc. 22nd Int. Ornithol. Congr., Durban:
2057-2071. Johannesburg: BirdLife South Africa.
Ballance, L.T., Pitman, R.L. and Fiedler, P.C. (2006). Oceanographic influences on
seabirds and cetaceans of the eastern tropical Pacific: A review. Progress in
Oceanography 69: 360-390. DOI: 10.1016/j.pocean.2006.03.013.
Barbraud, C. and Weimerskirch, H. (2001). Emperor penguins and climate change.
Nature 411: 183-816.
Barbraud, C. and Weimerskirch, H. (2005). Environmental conditions and breeding
experience affect costs of reproduction in Blue Petrels. Ecology 86 (3): 682-
692.
63
Barton, E.D. (2001). Canary and Portugal Currents. In: Steele, J., Turekian, K., Thorpe,
S. (Eds.), Encyclopedia of Ocean Sciences 1: 380-389. Academic Press. DOI:
10.1006/rwos.2001.0360.
Block, B. A., Jonsen, I. D., Jorgensen, S. J., Winship, A. J., Shaffer, S. A., Bograd, S. J.,
Hazen, E.L., Foley, D.G., Breed, G.A., Harrison, A.L., Ganong, J.E.,
Swithenbank, A., Castleton, M., Dewar, H., Mate, B.R., Shillinger, G.L.,
Schaefer, K.M., Benson, S.R., Weise, M.J., Henry, R.W., and Costa, D.P.
(2011). Tracking apex marine predator movements in a dynamic ocean. Nature
000: 1-5.
Boyd, I., Wanless, S. and Camphuysen, C.J. (2006). Top predators in marine
ecosystems: their role in monitoring and management. Cambridge University
Press. Cambridge, UK. 378 p.
Boyer, T.P., Antonov, J.I., Baranova, O.K., Garcia, H.E., Johnson, D.R., Locarnini,
R.A., Mishonov, A.V., O’brien, T.D., Seidov, D., Smolyar, I.V. and Zweng,
M.M. (2009). World ocean database 2009. US Government Printing Office,
Washington, DC.
Bried, J., Pontier, D and Jouventin, P. (2003). Mate fidelity in monogamous birds: a re-
examination of the Procellariiformes. Animal Behaviour 65: 235-246.
DOI:10.1006/anbe.2002.2045.
Briggs, K.T., Tyler, W.M.B., Lewis, D.B. and Carlson, D.R. (1987). Bird communities
at sea off California: 1975 to 1983. Allen Press. Lawrence, USA. 78 p.
Camphuysen, K.C.J. and Van Deer Meer, J. (2001). Pelagic distribution, moult and
(sub-)specific status of Cory’s Shearwaters Calonectris diomedea borealis
wintering off Southern Africa. Marine Ornithology 29: 89-96.
Catry, P., Phillips, R.A., Phalan, B., Silk, J.R.D., and Croxall, J.P. (2004a). Foraging
strategies of Grey-headed Albatrosses Thalassarche chrysostoma: integration
of movements, activity and feeding events. Marine Eco. Prog. Ser. 280: 261-
273.
Catry, P., Encarnação, V., Araújo, A., Fearon, P., Fearon, A., Armelin, M. and
Delaloye, P. (2004b). Are long-distance migrant passerines faithful to their
stopover sites? J. Avian Biol. 35 (2): 170-181.
64
Catry, P., Dias, M.P., Phillips, R.A. and Granadeiro, J.P. (2011). Different means to the
same end: long-distance migrant seabirds from two colonies differ in
behaviour, despite Common wintering grounds. PLoS ONE 6 (10).
DOI:10.1371/journal.pone.0026079.
Ceia, F.R., Paiva, V.H., Garthe, S., Fidalgo, V., Morais, L., Baeta1, A., Marques, J.C.
and Ramos, J.A. (2013). Annual and seasonal consistency in the feeding
ecology of an opportunistic species, the Yellow-legged Gull (Larus
michahellis). Marine Ecol. Prog. Ser. (submitted).
Crawford, R.J.M. (2007). Food, fishing and seabirds in the Benguela upwelling system.
Journal of Ornithology 148: 253-260. DOI 10.1007/s10336-007-0228-z.
Crick, H.Q.P. (2004). The impact of climate change on birds. Ibis 146 (1): 48-56.
Dall’Antonia, L., Dall’Antonia, P., Benvenuti, S., Ioalè, P., Massa, B. and Bonadonna,
F. (1995). The homing behaviour of Cory’s Shearwaters (Calonectris
diomedea) studied by means of a direction recorder. J. Exp. Biol. 198: 359-362.
Dias, M.P., Granadeiro, J.P., Phillips, R.A., Alonso, H., and Catry, P. (2010). Breaking
the routine: individual Cory's shearwaters shift winter destinations between
hemispheres and across ocean basins. Proc. R. Soc. B. Published online. DOI:
10.1098/rspb.2010.2114.
Dias, M. P., Granadeiro, J.P., and Catry, P. (2012). Do seabirds differ from other
migrants in their travel arrangements? On route strategies of Cory's Shearwater
during its trans-equatorial journey. PLoS ONE 7 (11). DOI:
10.1371/journal.pone.0049376.
Edrén, S.M.C., Wisz, M.S., Teilmann, J., Dietz, R. and Söderkvist, J. (2010). Modelling
spatial patterns in harbour porpoise satellite telemetry data using maximum
entropy. Ecography 33: 698–708.
Elith, J., Graham, C.H., Anderson, R.P., Dudik, M., Ferrier, S., Guisan, A., Hijmans,
R.J., Huettmann, F., Leathwick, J.R., Lehmann, A., Li, J., Lohmann, L.G.,
Loiselle, B.A., Manion, G., Moritz, C., Nakamura, M., Nakazawa, Y., Overton,
J.M., Peterson, A.T., Phillips, S.J., Richardson, K., Scachetti-Pereira, R.,
Schapire, R.E., Soberon, J., Williams, S., Wisz, M.S. and Zimmermann, N.E.
(2006). Novel methods improve prediction of species’ distributions from
occurrence data. Ecography 29: 129-151.
65
Elith, J., Phillips, S.J., Hastie, T., Dudík, M., Chee, Y.E. and Yates, C.J. (2011). A
statistical explanation of MaxEnt for ecologists. Diversity and Distributions 17:
43–57.
Galef, B.G, Jr. and Girauldeau, L.-A. (2001). Social influences on foraging in
vertebrates: causal mechanisms and adaptive functions. Animal Behaviour 61:
3-15. DOI: 10.1006/anbe.2000.1557.
Garthe, S., Grémillet, D. and Furness, R.W. (1999). At-sea activity and foraging
efficiency in chick-rearing Northern Gannets Sula bassana: a case study in
Shetland. Marine Ecol. Prog. Ser. 185: 93-99.
González-Solís, J., Croxall, J.P., Oro, D., Ruiz, X. (2007). Trans-equatorial migration
and mixing in the wintering areas of a pelagic seabird. Front. Ecol. Environ. 5
(6): 297–301. DOI: 10.1890/1540-9295(2007)5[297:TMAMIT]2.0.CO;2.
González-Solís J., Felicísimo A., Fox J.W., Afanasyev V., Kolbeinsson Y. and Muñoz
J. (2009). Influence of sea surface winds on shearwater migration detours.
Marine Ecol. Prog. Ser. 391: 221–230.
Graham, C.H., Elith, J., Hijmans, R.J., Guisan, A., Peterson, T.A., Loiselle, B.A. and
the “Predicting Species Distributions Working Group”. (2007) The influence of
spatial errors in species occurrence data used in distribution models. J. Appl.
Ecol. 45: 239–247.
Granadeiro, J.P. (1993). Variation in measurements of Cory’s Shearwater between
populations and sexing by discriminant analysis. Ringing and Migration 14:
103-112.
Granadeiro, J. P., Nunes, M., Silva, M.C., and Furness, R.W. (1998). Flexible foraging
strategy of Cory’s shearwater, Calonectris diomedea, during the chick-rearing
period. Animal Behaviour 56: 1169–1176.
Guilford, T., Meade, J., Willis, J., Phillips, R.A., Boyle, D., Roberts, S., Collett, M.,
Freeman, R. and Perrins, C.M. (2009). Migration and stopover in a small
pelagic seabird, the Manx Shearwater (Puffinus puffinus): insights from
machine learning. Proc. R. Soc. B 276: 1215-1223. DOI:
10.1098/rspb.2008.1577.
Haug, F.D. (2012). The role of breeding experience on the foraging specialization of a
pelagic marine predator, the Cory's sheawater (unpublished Master’s thesis,
Universidade de Coimbra, Portugal). 68 p.
66
Heithaus, M.R., Frid, A., Wirsing, A.J., and Worm, B. (2008). Predicting ecological
consequences of marine top predator declines. Trends in Ecology and
Evolution 23 (4): 202-210.
Hunt, G.L. and Schneider, D.C. (1987). Scale-dependent processes in the physical and
biological environment of marine birds. In: Croxall, J.P. Seabirds feeding
biology and role in marine ecosystems. 408 p.
Igual, J.M., Forero, M.G., Tavecchia, G., González-Solís, J., Martínez-Abraín, A.,
Hobson, K.A., Ruiz, X. and Oro, D. (2005). Short-term effects of data-loggers
on Cory’s Shearwater (Calonectris diomedea). Marine Biology 146:619–624.
Inger, R. and Bearhop, S. (2008). Applications of stable isotope analyses to avian
ecology. Ibis 150:447–461. DOI: 10.1111/j.1474-919x.2008.00839.x.
Irons, D.B., Anker-Nilssen, T., Gaston, A.J., Birds, G.V., Falk, K., Gilchrist, G., Hario,
M., Hjernquist, M., Krasnov, Y.V., Mosbech, A., Olsen, B., Petersen, A., Reid,
J.B., Robertson, G.J., Strøm, H. and Wohl, K.D. (2008). Fluctuations in
circumpolar seabird populations linked to climate oscillations. Global Change
Biology 14: 1455-1463. DOI: 10.1111/j.1365-2486.2008.01581.x.
Kamil, A.C. and Roiblat, H.L. (1985). The ecology of foraging behaviour: implications
for animal learning and memory. Annual Review of Psychology 36: 141-169.
Kappes, M.A., Weimerskirch, H., Pinaud, D. and Le Corre, M. (2011). Variability of
resource partitioning in sympatric tropical boobies. Marine Ecol. Prog. Ser.
441: 281-294. DOI: 10.3354/meps09376.
Kokko, H. and López-Sepulcre, A. (2006). From individual dispersal to species ranges:
perspectives for a changing world. Science 313: 789-791. DOI:
10.1126/science.1128566.
Kubetzki, U., Garthe, S., Fifield, D., Mendel, B. and Furness, R. W. (2009) Individual
migratory schedules and wintering areas of Northern Gannets. Marine Ecol
Prog Ser 391: 257-265.
Larkin, P.A.(2009). Concepts and issues in marine ecosystem management. Reviews in
Fish biology and fisheries 6: 139-164.
Lecoq, M., Ramírez, I., Geraldes, P. and Andrade, J. (2011). First complete census of
Cory’s Shearwaters Calonectris diomedea borealis breeding at Berlengas
Islands (Portugal), including the small islets of the archipelago. Airo 21: 31-34.
67
Lewis, S. Sherratt, T.N., Hamer, K.C. and Wanless, S. (2001). Evidence of intra-
specific competition for food in a pelagic seabird. Nature 412: 816-819.
Lewis, S., Benvenuti, S., Dall’Antonia, L., Griffiths, R., Money, L., Sherratt, T.N.,
Wanless, S. and Hamer, K.C. (2002). Sex-specific foraging behaviour in a
monomorphic seabird. Proc. R. Soc. London B 269: 1687-1693. DOI:
10.1098/rspb.2002.2083.
Longhurst, A. (1998). Ecological Geography of the Sea. Academic Press. San Diego,
California - USA. 398 p.
Louzão, M., Hyrenbach, K.D., Arcos, J.M., Abelló, P., de Sola, L.G. and Oro, D.
(2006). Oceanographic habitat of an endangered mediterranean procellariiform:
implications for marine protected áreas. Ecological Applications 16 (5): 1683-
1695. DOI: 10.1890/1051-0761(2006)016[1683:OHOAEM]2.0.CO;2.
Louzão, M., Bécares, J., Rodríguez, B., Hyrenbach, K., Ruiz A., et al. (2009)
Combining vessel-based surveys and tracking data to identify key marine areas
for seabirds. Marine Ecol. Prog. Ser. 391: 183–197.
Louzão, M., Aumont, O., Hothorn, T., Wiegand, T., and Weimerskirch, H. (2013).
Foraging in a changing environment: habitat shifts of an oceanic predator over
the last half century. Ecography, 36 (1): 57–67. DOI:10.1111/j.1600-
0587.2012.07587.x.
Myers, R.A. and Worm, B. (2003). Rapid worldwide depletion of predatory fish
communities. Nature 423: 280-283.
Magalhães, M.C., Santos, R.S. and Hamer, K.C. (2008). Dual-foraging of Cory’s
Shearwaters in the Azores: feeding locations, behaviour at sea and implications
for food provisioning of chicks. Marine Ecol. Prog. Ser. 359: 283-293. DOI:
10.3354/meps07340.
Morato, T., Machete, M., Kitchingman, A., Tempera, F., Lai, S., Menezes, G., Pitcher,
T.J. and Santos, R.S. (2008). Abundance and distribution of seamounts in the
Azores. Marine Ecol. Prog. Ser. 357: 17-21. DOI: 10.3354/meps07268.
Mougeot, F. and Bretagnolle, V. (2000). Predation risk and moonlight avoidance in
nocturnal seabirds. J. Avian Biol. 31: 376–386.
Navarro, J., González-Solís J. and Viscor, G. (2007). Nutritional and feeding ecology in
Cory’s Shearwater Calonectris diomedea during breeding. Marine Ecol. Prog.
Ser. 351: 261-271. DOI: 10.3354/meps07115.
68
Navarro, J. and González-Solís J. (2009). Environmental determinants of foraging
strategies in Cory’s Shearwaters Calonectris diomedea. Marine Ecol. Prog.
Ser. 378: 259-267. DOI: 10.3354/meps07880.
Nevaux, M., Weimerskirch, H. and Barbraud, C. (2007). Environmental variation and
experience-related differences in the demography of the long-lived black-
browed albatross. J. Anim. Ecol. 76: 159-167. DOI: 10.1111/j.1365-
2656.2006.01191.x.
Oppel, S., Meirinho, A., Ramírez, I., Gardner, B., O’Connell, A. F., Miller, P.I.and
Louzão, M. (2012). Comparison of five modelling techniques to predict the
spatial distribution and abundance of seabirds. Biological Conservation 156:
94–104. DOI: 10.1016/j.biocon.2011.11.013.
Paiva, V.H. (2009). Foraging tactics, activity at sea and sea area usage by Cory´s
Shearwaters (Calonectris diomedea borealis) in the North Atlantic. University
of Coimbra.
Paiva, V.H., Geraldes, P., Ramírez, I., Meirinho, A., Garthe, S., and Ramos, J.A.
(2010a). Foraging plasticity in a pelagic seabird species along a marine
productivity gradient. Marine Ecol. Prog. Ser. 398: 259–274.
Paiva, V.H., Geraldes, P., Ramírez, I., Meirinho, A., Garthe, S. and Ramos, J.A.
(2010b). Oceanographic characteristics of areas used by Cory’s shearwaters
during short and long foraging trips in the North Atlantic. Marine Biology 157:
1385-1399. DOI: 10.1007/s00227-010-1417-5.
Paiva, V.H., Xavier, J., Geraldes, P., Ramirez, I., Garthe, S. and Ramos, J.A. (2010c).
Foraging ecology of Cory’s shearwaters in different oceanic environments of
the North Atlantic. Marine Ecol. Prog. Ser. 410:257–268. DOI:
10.3354/meps08617.
Paiva, V.H., Guilford, T., Meade, J., Geraldes, P., Ramos, J.A. and Garthe, S. (2010d).
Flight dynamics of Cory’s shearwater foraging in a coastal environment.
Zoology 113: 47–56.
Paiva, V.H., Geraldes, P., Marques, V., Rodriguez, R., Garthe, S., and Ramos, J.A.
(2013). Effects of environmental variability on different trophic levels of the
North Atlantic food web. Marine Ecol. Prog. Ser., 477: 15–28.
DOI:10.3354/meps10180.
69
Pearson, R.G., Thuiller, W., Araújo, M.B., Martinez-Meyer, E., Brotons, L., McClean,
C., Miles, L., Segurado, P., Dawson, T.P. and Lees, D. (2006). Model-based
uncertainty in species' range prediction, Journal of Biogeography, 33, 1704-
1711.
Perón, C., Weimerskirch, H. and Bost, C. (2012). Projected poleward shift of king
penguins' (Aptenodytes patagonicus) foraging range at the Crozet Islands,
southern Indian Ocean. Proc. R. Soc. B 279: 2515–2523.
DOI:10.1098/rspb.2011.2705.
Peterson, R.G. and Stramma, L. (1991). Upper-level circulation in the South Atlantic
Ocean. Prog. Oceanog. 26: 1-73.
Phillips, R.A., Xavier, J.C. and Croxall, J.P. (2003). Effects of satelitte transmitters on
albatrosses and petrels. The Auk 120: 1082-1090.
Phillips, R.A., Silk, J.R.D., Croxall, J.P., Afanasyev, V. and Briggs, D.R. (2004).
Accuracy of geolocation estimates for flying seabirds. Marine Ecol. Prog. Ser.
266: 265-272.
Phillips, S.J., Anderson, R.P. and Schapire, R.E. (2006). Maximum entropy modeling of
species geographic distributions. Ecological Modelling 190, 231–259.
Pyke, G.H., Pulliam, H.R. and Charnov, E.L. (1977). Optimal foraging: A selective
review of theory and tests. The Quarterly Review of Biology 52 (2): 137-154.
Ramos, J.A., Granadeiro, J.P., Phillips, R.A. and Catry, P. (2009a). Flight morphology
and foraging behaviour of male and female Cory’s Shearwaters. The Condor
111 (3): 424-432. DOI: 10.1525/cond.2009.090008.
Ramos, R., Militão, T., González-Solís, J. and Ruiz, X. (2009b). Moulting strategies of a
long-distance migratory seabird, the Mediterranean Cory’s Shearwater
Calonectris diomedea diomedea. Ibis 151: 151-159.
Ramos, R., González-Solís, J., Croxall, J.P., Oro, D. and Ruiz, X. (2009c).
Understanding oceanic migrations with intrinsic biogeochemical markers.
PLoS ONE 4 (7). DOI: 10.1371/journal.pone.0006236.
Ramos, R., Ramírez, F., Carrasco, J.L. and Jover, L. (2011). Insights into the
spatiotemporal component of feeding ecology: an isotopic approach for
conservation management sciences. Diversity and Distributions 17: 338–349.
Ratcliffe, N., Furness, R.W. and Klomp, N.I. (1998). Influences of breeding experience
on the reproductive performance of Great Skuas. J. Avian Biol. 29: 293-298.
70
Reid, J.L. (1989). On the total geostrophic circulation of the South Atlantic Ocean:
Flow patterns, tracers, and transports. Prog. Oceanog. 23: 149-244.
Rodrigues, N.V., Maranhão P., Oliveira, P. and Alberto J. (2008). Guia de espécies
submarinas, Portugal–Berlengas. Instituto Politécnico de Leiria. Leiria,
Portugal. 231 p.
Roscales, J.L., Gómez-Díaz, E., Neves, V. and González-Solís, J. (2011). Trophic
versus geographic structure in stable isotope signatures of pelagic seabirds
breeding in the Northeast Atlantic. Marine Ecol. Prog. Ser. 434: 1-13. DOI:
10.3354/meps09211.
Santos, A.J.F.R., Azeiteiro, U.M., de Sousa, F. and Alves, F. (2012). The role of
knowledge and the way of life of local inhabitants in sustainable development:
an exploratory study on the impact of the Natural Reserve of the Berlengas
Islands (Portugal) on the life of its local fishing community. J. Int. Coas. Zon.
Man. 12 (4): 429-436.
Scheffer, M., Carpenter, S., and de Young, B. (2005). Cascading effects of overfishing
marine systems. Trends in Ecology and Evolution 20 (11): 579-581.
Schoener, T.W. (1971). Theory of feeding strategies. Ann. Rev. Ecol. Syst. 2: 369-404.
Schreiber E.A. and Burger J. (2001) Biology of Marine Birds. CRC Press. Boca Raton,
Florida, USA. 744 p.
Seaman, D.E. and Powel, R.A. (1996). An evaluation of the accuracy of Kernel Density
Estimators for home-range analysis. Ecology 77 (7): 2075-2085.
Sherman. K. (1993) Large marine ecosystems as global units for marine resource
management – an ecological perspective. In: Sherman, K., Alexander, L.M.
and Gold, B.D. (Eds). Large Marine Ecosystems V: Stress, Mitigation and
Sustainability. AAAs Press. Washington, DC, USA. 408 p.
Smith, R.C., Ainley, D., Baker, K., Domack, E., Emslie, S., Fraser, B., Kennett, J.,
Leventer, A., Mosley-Thompson, E., Stammerjohn, S., and Vernet, M. (1999).
Marine Ecosystem Sensitivity to Climate Change: Historical observations and
paleoecological records reveal ecological transitions in the Antarctic Peninsula
region. BioScience 49 (5): 393-404.
Soares, M.I.P. (2013). Foraging ecology strategies of Cory’s Shearwater in Porto Santo
Island (unpublished Master’s thesis, Universidade de Coimbra, Portugal). 68 p.
Stramma, L and Peterson, R.G. (1989). The South Atlantic Current. Journal of Physical
Oceanography 20: 846-859.
71
Tabachnick, B. G., and L. S. Fidell. (1996). Using multivariate statistics. HarperCollins.
New York, NY, USA. 970 p.
Tasker, M.L., Jones, P.H., Dixon, T., Blake, B.F. (1984). Counting seabirds at sea from
ships: a review of methods employed and a suggestion for a standardized
approach. The Auk 101: 567–577.
Thiebot, J., Lescroël, A., Pinaud, D., Trathan, P.N., and Bost, C. (2011). Larger
foraging range but similar habitat selection in non-breeding versus breeding
sub-Antarctic penguins. Antarctic Science 23 (2): 117-126.
Tremblay, Y., Bertrand, S., Henry, R.W., Kappes, M.A., Costa, D.P. and Shaffer, S.A.
(2009). Analytical approaches to investigating seabird-environment
interactions: a review. Marine Ecol. Prog. Ser. 391, 153-163.
Tyberghein, L., Verbruggen, H., Pauly, K., Troupin, C., Mineur, F., De Clerck, O.
(2009). Bio-ORACLE: a global environmental dataset for marine species
distribution modeling. Global Ecology and Biogeography 21 (2): 272–281.
DOI: 10.1111/j.1466-8238.2011.00656.x.
Verity, P.G., Smetacek, V. and Smayda, T.J. (2002). Status, trends and the future of the
marine pelagic ecosystem. Environmental Conservation 29: 207-237.
Votier, S.C., Grecian, W.J., Patrick, S., Newton, J. (2011) Inter-colony movements, at-
sea behaviour and foraging in an immature seabird: results from GPS-PPT
tracking, radio-tracking and stable isotope analysis. Marine Biology 158: 355-
362.
Wakefield, E.D., Phillips, R.A. and Matthiopoulos, J. (2009). Quantifying habitat use
and preferences of pelagic seabirds using individual movement data: a review.
Marine Ecol. Prog. Ser. 391: 165-182. DOI: 10.3354/meps08203.
Warham, J. (1990). The Petrels. Their Ecology and Breeding Systems. Academic Press.
London, UK. 440 p.
Warham J. (1996). The Behaviour, Population Biology and Physiology of the Petrels.
Academic Press. London, UK 616 p.
Weimerskirch, H. and Guionnet, T. (2002). Comparative activity pattern during
foraging of four albatross species. Ibis 144: 40-50.
Weimerskirch, H., Le Corre, M., Ropert-Coudert, Y., Kato, A. and Marsac, F. (2005).
The three-dimensional flight of red-footed boobies: adaptations to foraging in a
tropical environment? Proc. Biol. Sci. 272: 53-61.
72
Weimerskirch, H. (2007). Are seabirds foraging for unpredictable resources? Deep Sea
Research Part II: Topical Studies in Oceanography 54: 211–223.
Werner, A.C. (2010). Pre-breeding period in Cory’s shearwater: bird quality and
foraging behavior (unpublished Master’s thesis, Universidade de Coimbra,
Portugal). 82 p.
Whittaker, R.H. and Likens, G.E. (1973). Primary production: the biosphere and man.
Human Ecology 1 (4): 357-369.
Wilson, R.P., Grémillet, D., Syder, J., Kierspel, M.A.M., Garthe, S., Weimerskirch, H.,
Schäfer-Neth, C., Scolaro, J.A., Bost, C., Plötz, J. and Nel, D. (2002). Remote-
sensing systems and seabirds: their use, abuse and potential for measuring
marine environmental variables. Marine Ecol. Prog. Ser. 228: 241-261.
Worton, B.J. (1989). Kernel methods for estimating the utilization distribution in home-
range studies. Ecology 70 (1): 164-168.
Zuur, A.F., Ieno, E.N. and Smith, G.M. (2007). Analysing Ecological Data. Springer
Series: Statistics for Biology and Health. New York, NY, USA. 672 p.