Embed Size (px)
Citation preview
Estimation Models for the Adoption and
Use of Information Technology:
Internet-Related Technologies at Firm Level in the
Portuguese and European Context
por,
Tiago André Gonçalves Félix de Oliveira
(Mestre)
Dissertação apresentada como requisito
parcial para obtenção do grau de
Doutor em Gestão de Informação
pelo
Instituto Superior de Estatística e Gestão de Informação
da
Universidade Nova de Lisboa
2010

Copyright © by
Tiago André Gonçalves Félix de Oliveira
All rights reserved

i
Estimation Models for the Adoption and
Use of Information Technology:
Internet-Related Technologies at Firm Level in the
Portuguese and European Context
Tese orientada por,
Professora Doutora Maria do Rosário Fraga de Olivei ra Martins
2010

ii

iii
Abstract
Nowadays it is consensual that information technology (IT) has a significant effect in the
productivity of firms. However, this contribution can only be accomplished if, and when, the
new IT are widely spread and used. Understanding the determinants of adoption and use
is a fundamental question, not only for economists, but also for society in general.
With this dissertation we intend to contribute to a better understanding of the determinants
of adoption and use of IT, particularly Internet-related technologies, at firm level; for that
we developed eight studies. The first one (Chapter 2) is a review of literature of IT
adoption models at firm level. We also developed four studies in the Portuguese context.
The first was a comparison between the determinants of adoption of a simple technology
(web site) and a complex technology (e-commerce) (Chapter 3). The second was a
comparison of the determinants of web site adoption in small and large firms (Chapter 4).
In the third study, we analysed the factors that explain three levels of adoption (Internet,
web site and e-commerce) in small firms (Chapter 5). In the last study in the Portuguese
context, we developed a model for understanding Internet business solutions (Chapter 6).
For the European context, we developed three studies. In the first study we characterized
e-business by clusters in EU27 context (Chapter 7). In the second, we compared the
determinants of e-business adoption in tourism and telecommunications industries, by a
model that combined two theoretical models (technology, organization, and environment
(TOE) model and the Iacovou et al. model) (Chapter 8). In the last study (Chapter 9) of the
dissertation, we presented an in depth understanding of business-to-business (B2B) e-
commerce adoption and usage in 27 European countries. The research was informed by
contextualist theory to organize our proposed research model.
In epistemological terms, we adopted a posture characteristic of positivism. With regard to
research methodologies we used the deductive method. The theoretical framework of
initial studies was base on the TOE framework. The penultimate study combined TOE and
Iacovou et al. models, and the last study used the theory of contextualist.

iv
We concluded that the TOE framework is a solid theoretical basis, with consistent
empirical support, and the potential of application to information systems (IS) adoption.
This model is a good theoretical starting point for our work. The first important result is that
Internet, web site and e-commerce adoption decisions are taken at different stages.
Moreover, the factors have distinct effects on the different stage. The size of the firms is a
variable that has a controversial impact on IT adoption decision, because some empirical
studies indicate that there is a positive relationship, while other studies have evidence
against this positive relationship. In our context it is an important factor. Moreover,
comparing “directly” large and small firms, we conclude that these two groups behave
differently and large firms tend to have advantages in early stages (Internet and web site),
but they face critical challenges in later ones (e-commerce, B2B e-commerce, and e-
business). Based on European data, the industry context seems to be more important than
the country context. Furthermore, the relative importance of all drivers for e-business
adoption in the telecommunications industry differs from the tourism industry, the only
exception is competitive pressure. A new conceptual approach to IT adoption models
based on contextualist theory seems to be a valid approach, namely on the B2B e-
commerce adoption and usage.
Keywords: Information technology (IT); IT adoption; technology-organization-environment
(TOE); Internet; web site; e-commerce; e-business; B2B e-commerce; positivism; Europe;
Portugal.

v
Resumo
Actualmente é consensual que as tecnologias de informação (TI) têm um efeito
significativo na produtividade das empresas. Contudo, esta contribuição pode apenas ser
conseguida se, e quando, as novas TI estiverem largamente difundidas e em uso.
Compreender os determinantes da adopção e uso é uma questão fundamental, não
apenas para economistas, mas também para a sociedade em geral.
Com esta dissertação pretendemos contribuir para uma melhor compreensão dos
determinantes da adopção e uso das TI, particularmente tecnologias relacionadas com a
Internet, ao nível das empresas, para tal desenvolvemos oito estudos. O primeiro
(Capítulo 2) é uma revisão da literatura dos modelos de adopção de TI ao nível da
empresa. Desenvolvemos também quatro estudos no contexto português. O primeiro
apresentou uma comparação entre os determinantes de adopção de uma tecnologia
simples (web site) e uma tecnologia complexa (e-commerce) (Capítulo 3). O segundo
comparou os determinantes de adopção do web site entre as pequenas e grandes
empresas (Capítulo 4). No terceiro estudo, analisámos os factores que explicam três
níveis de adopção (Internet, web site e e-commerce) nas pequenas empresas (Capítulo
5). No último estudo no contexto português, desenvolvemos um modelo para
compreender as soluções de negócio através da Internet (Capítulo 6). Para o contexto
europeu, desenvolvemos três estudos. No primeiro estudo caracterizámos o e-business
por clusters no contexto dos 27 países da EU (Capítulo 7). No segundo, comparámos os
determinantes de adopção de e-business nos sectores do turismo e das
telecomunicações, através de um modelo que combinou dois modelos teóricos (o modelo
de tecnologia, organização e ambiente (TOE) e o modelo de Iacovou et al.) (Capítulo 8).
No último estudo (Capítulo 9) da dissertação, apresentámos uma análise exaustiva da
adopção e uso do B2B e-commerce em 27 países europeus. O modelo de investigação
proposto foi baseado na teoria do contextualismo.
Em termos epistemológicos, adoptámos uma postura característica do positivismo. No
que diz respeito às metodologias de investigação usámos o método dedutivo. Os estudos

vi
iniciais basearam-se no contexto TOE. O penúltimo estudo combinou o modelo TOE e o
modelo de Iacovou et al., o último estudo usou a teoria do contextualismo.
Concluímos que o contexto TOE é uma base teórica sólida, com apoio empírico
consistente, e um potencial de aplicação à adopção de sistemas de informação (SI). Este
modelo é um bom ponto de partida teórico para o nosso trabalho. O primeiro resultado
importante é que as decisões de adopção da Internet, do Web site e do e-commerce são
realizadas em diferentes fases. Além disso, os factores têm efeitos distintos nas diferentes
fases. A dimensão das empresas é uma variável que tem um impacto controverso na
decisão de adopção de TI, porque alguns estudos empíricos indicam que existe uma
relação positiva, ao passo que outros estudos apresentam evidências contra esta relação
positiva. No nosso contexto é um factor importante. Além disso, comparando
“directamente” pequenas e grandes empresas, concluímos que estes dois grupos se
comportam de forma diferente, as grandes empresas tendem a ter vantagens nas fases
inicias (Internet e web site), mas enfrentam desafios críticos em fases mais avançadas (e-
commerce, B2B e-commerce e e-business). Com base em dados europeus, o sector de
actividade parece ser mais importante que o país a que a empresa pertence. Além disso,
a importância relativa de todos os determinantes para a adopção de e-business no sector
das telecomunicações difere do sector do turismo, a única excepção é a pressão
competitiva. Uma nova abordagem conceptual aos modelos de adopção de TI com base
na teoria do contextualismo parece ser uma abordagem válida, nomeadamente em
termos de adopção e uso do B2B e-commerce.
Palavras-chave : Tecnologias de informação (TI); adopção de TI; tecnologia-organização-
ambiente (TOE); Internet; web site; e-commerce; e-business; B2B e-commerce;
positivismo; Europa; Portugal.

vii
Publications
List of publication resulting from this dissertation
Papers:
Oliveira, T. and M. F. Martins (2010) "Firms Patterns of e-Business Adoption: Evidence for
the European Union- 27," The Electronic Journal Information Systems Evaluation
(13) 1, pp. 47-56. Selected from ECIME 2009.
Oliveira, T. and M. F. Martins (2010) “Understanding e-business adoption across
industries in European countries,” Industrial Management & Data Systems (110) 9,
pp. 1337-1354.
Oliveira, T. & Martins, M. F. (2011) Information Technology Adoption Models at Firm Level:
Review of Literature. The Electronic Journal Information Systems Evaluation (in
press). Selected from ECIME 2010.
Oliveira, T. and M. F. Martins “Determinant Factors of Internet Business Solutions
Adoption the Case of Portuguese firms,” Applied Economics Letters (conditional
accepted – minor revision).
Oliveira, T. and G. Dhillon “Understanding B2B e-Commerce Adoption and Usage in
Europe: Findings from 27 European Countries,” Journal of the Association for
Information Systems (submitted).
ISI Proceedings:
Oliveira, T. and M. F. O. Martins (2008) A comparison of web site adoption in small and
large Portuguese firms, in Ice-B 2008: Proceedings of the International Conference
on E-Business, pp. 370-377.

viii
Oliveira, T. and M. F. Martins (2009) Deteminants of Information Technology Adoption in
Portugal, in Ice-B 2009: Proceedings of the International Conference on E-Business,
Milan, pp. 264-270.
Oliveira, T. and M. F. Martins (2009) Firms Patterns of e-Business Adoption: Evidence for
the European Union-27, in D. Remenyi, J. Ljungberg, and K. Grunden (Eds.)
Proceedings of the 3rd European Conference on Information Management and
Evaluation, Gothenburg, pp. 371-379.
Martins, M. and T. Oliveira (2009) Determinants of e-Commerce Adoption by Small Firms
in Portugal, in D. Remenyi, J. Ljungberg, and K. Grunden (Eds.) Proceedings of the
3rd European Conference on Information Management and Evaluation, Gothenburg,
pp. 328-338.
Oliveira, T. and M. F. Martins (2010) Information Technology Adoption Models at firm
Level: Review of Literature, in D. Remenyi, J. Ljungberg, and K. Grunden (Eds.)
Proceedings of the 4th European Conference on Information Management and
Evaluation, Lisbon, pp. 312-323.
Others proceedings:
Oliveira, T. (2008) Bivariate probit model with sample selection - Determinants of the
Adoption of Electronic Commerce (EC). Modelo Probit Bivariado com Selecção -
Factores Determinantes da Adopção do Comércio Electrónico (CE), in SPE edition
M. M. Hill, M. A. Ferreira, J. G. Dias, M. d. F. Salgueiro et al. (Eds.) Actas do XV
Congresso Anual da Sociedade Portuguesa de Estatística, Lisboa, pp. 401-414.
Oliveira, T. and M. F. Martins (2010) Estimation Model for the Adoption and Use of
Information Technology in the Portuguese and European Context, in, vol. II Á.
Rocha, C. F. Sexto, L. P. Reis, and M. P. Cota (Eds.) Actas de la 5ª Conferencia
Ibérica de Sistemas y Tecnologías de Información, Santiago de Compostela, pp.
434-437.

ix
Acknowledgments
To Professor Maria do Rosário Fraga de Oliveira Martins, advisor of this dissertation, for
suggesting the topic for this work, for all the scientific guidance, for the availability shown
while accompanying this research, for the stimulus, support and timely criticism, which
were priceless.
To Professor Gurpreet Dhillon, for the availability and kindness shown throughout these
last few months of frequent contact and for the suggestions and critiques, which
contributed to the enrichment of chapter 9.
To The National Institute of Statistics (INE) for providing us with the Portuguese data, and
the e-Business W@tch survey 2006 for providing us with the European data.
To ISEGI, Universidade NOVA de Lisboa, for providing a challenging scientific
environment, encouraging research, and making my life easy in so many ways. In
particular: to Sara, Bação, Roberto and José, with whom I’ve always had the opportunity to
discuss several questions related to the topic in an enriching way.
To Isabel and John for helping me improve my English.
To my parents for the patience, understanding and support. Especially during my journey,
during this stage for being deprived of the already few hours which we had together, for
the achievement of this goal.
To my family, for the care and motivation.
To Sara, for the company and patience that she showed along the many years of study
and work.
To all those who supported me, gave me incentive and helped me I leave here my sincere
thanks.

x
Para:
a Mãe
o Pai
a Sara

xi
Index
Chapter 1 - Introduction .......................... ................................................................................. 1
1.1. Motivation ................................................................................................................ 1
1.2. Adoption theories in information systems ................................................................ 2
1.3. Research focus ....................................................................................................... 2
1.4. Goals ....................................................................................................................... 4
1.5. Methods .................................................................................................................. 5
1.5.1. Theoretical frameworks ..................................................................................... 6
1.5.2. Quantitative research methods ......................................................................... 6
1.6. Path of research ...................................................................................................... 7
Chapter 2 – Information technology adoption models at firm level: review of
literature ........................................ ............................................................................................ 9
2.1. Introduction ............................................................................................................. 9
2.2. Models of IT adoption .............................................................................................. 9
2.2.1. DOI ................................................................................................................. 10
2.2.2. Technology, organization, and environment context ....................................... 11
2.3. Empirical literature of the TOE framework ............................................................. 13
2.3.1. Studies that used only the TOE framework ..................................................... 13
2.3.2. Studies that used the TOE framework combined with other theories ............... 16
2.4. Conclusions ........................................................................................................... 20
Chapter 3 – Determinants of web site and e-commerce adoption in Portugal ................... 21
3.1. Introduction ........................................................................................................... 21
3.2. Theorical framework and conceptual model .......................................................... 22
3.2.1. Technology Context ........................................................................................ 22
3.2.2. Organization Context ...................................................................................... 23
3.2.3. Environment Context ...................................................................................... 24
3.3. Data and methodology .......................................................................................... 25
3.3.1. Data ................................................................................................................ 25
3.3.2. Methodology ................................................................................................... 25
3.4. Estimation results .................................................................................................. 28
3.5. Conclusions ........................................................................................................... 30
Chapter 4 – A comparison of web site adoption in sm all and large Portuguese firms ...... 33

xii
4.1. Introduction ........................................................................................................... 33
4.2. Theoretical framework and conceptual model ....................................................... 34
4.2.1. Technology context ......................................................................................... 35
4.2.2. Organization context ....................................................................................... 37
4.2.3. Environment context ....................................................................................... 38
4.2.4. Controls .......................................................................................................... 38
4.3. Data and methodology ....................................................................................... 39
4.3.1. Data ............................................................................................................ 39
4.3.2. Methodology ................................................................................................... 39
4.4. Estimation results .............................................................................................. 41
4.5. Conclusions ........................................................................................................... 43
Chapter 5 – Determinants of e-commerce adoption by small firms in Portugal................. 45
5.1. Introduction ........................................................................................................... 45
5.2. Conceptual framework and hypothesis .................................................................. 46
5.2.1. Technology context ......................................................................................... 47
5.2.2. Organization context ....................................................................................... 48
5.2.3. Environment context ....................................................................................... 49
5.3. Data and methodology .......................................................................................... 50
5.3.1. Data ................................................................................................................ 50
5.3.2. Methodology ................................................................................................... 51
5.4. Estimation results .................................................................................................. 54
5.5. Discussion and conclusions ................................................................................... 57
Chapter 6 – Determinant factors of Internet busines s solutions adoption the case of
Portuguese firms .................................. .................................................................................. 59
6.1. Introduction ........................................................................................................... 59
6.2. Factors affecting IBS: a review of literature ........................................................... 61
6.3. Data ...................................................................................................................... 63
6.4. Econometric specification ...................................................................................... 64
6.5. Estimation results .................................................................................................. 69
6.6. Conclusions ........................................................................................................... 72
Chapter 7 – Firms patterns of e-business adoption: evidence for the European
Union-27 .......................................... ........................................................................................ 75
7.1. Introduction ........................................................................................................... 75
7.2. e-Business adoption by firms: literature review ...................................................... 76

xiii
7.3. Data ...................................................................................................................... 78
7.4. Methodology and results ....................................................................................... 79
7.4.1. Factor analysis results .................................................................................... 79
7.4.2. Cluster analysis results ................................................................................... 81
7.5. Conclusions and future research ........................................................................... 84
Chapter 8 – Understanding e-business adoption acros s industries in European
countries ......................................... ........................................................................................ 87
8.1. Introduction ........................................................................................................... 87
8.2. Theories and literature review ............................................................................... 88
8.2.1. Research model and hypotheses .................................................................... 90
8.2.1.1 Perceived benefits ..................................................................................... 91
8.2.1.2. Technology and organizational readiness ................................................. 92
8.2.1.3. Environmental and external pressure ....................................................... 93
8.2.1.4. Controls .................................................................................................... 94
8.4. Methods ................................................................................................................ 94
8.4.1. Sample ........................................................................................................... 94
8.4.2. Factor analysis and reliability test ................................................................... 96
8.4.3. Data analysis and results ................................................................................ 98
8.5. Discussion and implications ................................................................................. 100
8.5.1. Theoretical implications ................................................................................. 103
8.6. Conclusions ......................................................................................................... 103
8.7. Limitations and future studies .............................................................................. 104
Chapter 9 – Understanding B2B e-commerce adoption a nd usage in Europe:
findings from 27 European countries ............... ................................................................... 105
9.1. Introduction ......................................................................................................... 105
9.2. Informing literature and research model .............................................................. 105
9.2.1. Context dimension ........................................................................................ 106
9.2.2. Content dimension ........................................................................................ 109
9.2.3. Process dimension ........................................................................................ 110
9.2.4. Controls ........................................................................................................ 112
9.2.5. Research model ............................................................................................ 112
9.3. Methods and data analysis .................................................................................. 113
9.3.1. Validity and reliability .................................................................................... 114
9.3.2. B2B e-commerce adoption and usage .......................................................... 116

xiv
9.3.3. Cluster analysis of countries ......................................................................... 118
9.3.4. B2B e-commerce adoption and usage by group of countries ........................ 120
9.4. Discussion ........................................................................................................... 122
9.4.1. Implications for B2B strategic choices in Europe ........................................... 122
9.4.2. Defining strategic option within and amongst clusters ................................... 123
9.4.3. Social responsibility with respect to B2B variations ....................................... 124
9.4.4. Contributions ................................................................................................. 125
9.4.5. Limitations and further research .................................................................... 125
9.5. Conclusions ......................................................................................................... 126
Chapter 10 – Conclusions .......................... .......................................................................... 127
10. 1. Summary of findings ......................................................................................... 127
10.2. Contributions ..................................................................................................... 129
10.3. Limitations and further research ........................................................................ 130
References ........................................ .................................................................................... 133
Appendix A ........................................ .................................................................................... 151
Appendix B ........................................ .................................................................................... 153
Appendix C ........................................ .................................................................................... 157
Appendix D ........................................ .................................................................................... 159
Appendix E ........................................ .................................................................................... 161
Appendix F ........................................ .................................................................................... 163
Appendix G ........................................ ................................................................................... 165

xv
List of tables
Table 2.1: Some studies based on DOI theory [Rogers, 1995] .................................................. 11
Table 2.2: Some studies based only on Tornatzky and Fleischer [1990] ................................... 13
Table 2.3: Some studies that combine Tornatzky and Fleischer [1990] with other
theoretical models ..................................................................................................................... 18
Table 3.1: Estimated results...................................................................................................... 29
Table 4.1: Estimated coefficients for web site adoption model .................................................. 42
Table 4.2: Estimated marginal effects for web site adoption model ........................................... 42
Table 5.1: Estimation results ..................................................................................................... 55
Table 5.2: Marginal effects for the logistic regression model ..................................................... 57
Table 6.1: Description of variables ............................................................................................ 68
Table 6.2: Summary statistics ................................................................................................... 68
Table 6.3: Internet business solution estimation model ............................................................. 69
Table 6.4. Marginal effects for Internet business solutions ........................................................ 70
Table 7.1: Factor and validity analysis ...................................................................................... 80
Table 7.2: Description of variables used in CA .......................................................................... 81
Table 7.3: Description of adoptions and auxiliary variables ....................................................... 82
Table 7.4: Summary statistics for CA ........................................................................................ 82
Table 8.1: Respondent’s position .............................................................................................. 95
Table 8.2: Factor analysis ......................................................................................................... 97
Table 8.3: Description of independent variables ........................................................................ 98
Table 8.4: Logistic regression for e-business adoption in all industries ..................................... 99
Table 8.5: Marginal effects of logistic regression for e-business in all industries ..................... 100
Table 9.1: Factor and validity analysis and description of multi-item indicators used in FA ..... 115
Table 9.2: Description of independent variables ...................................................................... 117
Table 9.3: Results of logistic regression for B2B e-commerce adoption and ordered logistic
regression for B2B e-commerce usage ................................................................................... 118
Table 9.4: Results of the logistic regression for B2B e-commerce adoption and ordered
logistic regression for B2B usage in each group of countries .................................................. 121
Table 5.3: MCA for IT infrastructures and IT skills ................................................................... 157
Table 6.5: MCA for IT infrastructures and IT skills ................................................................... 159
Table 9.5: Sample characteristics ........................................................................................... 163

xvi

xvii
List of figures
Figure 1.1. Research focus ......................................................................................................... 2
Figure 1.2. Topics covered in this dissertation to address IT adoption ........................................ 3
Figure 2.1. Diffusion of innovations [Rogers, 1995] ................................................................... 11
Figure 2.2. Technology, organization, and environment framework [Tornatzky and
Fleischer, 1990] ........................................................................................................................ 12
Figure 2.3. Iacovou et al. [1995] model ..................................................................................... 18
Figure 3.1. Conceptual framework for web site and e-commerce adoption ............................... 22
Figure 3.2. Stage of adoption by firms ...................................................................................... 26
Figure 4.1. Conceptual framework for web site adoption ........................................................... 35
Figure 5.1. Conceptual Framework for Internet, web site, and e-commerce adoption ............... 47
Figure 5.2. e-commerce involvement by size and industry: Internet (dash), web site (grey)
and e-commerce (black) ........................................................................................................... 51
Figure 5.3. The different phases of IT adoption (Internet, web site, and e-commerce
adoption) ................................................................................................................................... 52
Figure 6.1. Comparison of Rogers adopter curve with adopter curve from this study ................ 64
Figure 6.2. The adoption of IBS by firms ................................................................................... 65
Figure 7.1. Characteristics of four e-business groups ............................................................... 84
Figure 7.2. Technology readiness index versus e-business adoption ........................................ 85
Figure 7.3. Technology integration index versus e-business adoption ...................................... 85
Figure 7.4. Size versus e-business adoption ............................................................................. 85
Figure 7.5. Expected benefits and obstacles of e-business versus e-business adoption ........... 85
Figure 7.6. Internet penetration index versus e-business adoption............................................ 85
Figure 8.1. Tornatzky and Fleischer [1990] model and Iacovou et al. [1995] model ................. 90
Figure 8.2. Research model ...................................................................................................... 91
Figure 9.1. Research model based on three essential dimensions of strategic change of
Pettigrew and Whipp [1991] .................................................................................................... 112
Figure 9.2. Dependent variables ............................................................................................. 116
Figure 9.3. Pattern of ICT adoption and usage by EU-27 countries (excluding Bulgaria and
Malta) ..................................................................................................................................... 119
Figure 9.4. Factors that help to move for a higher ICT readiness group .................................. 124
Figure 7.7. R2 of different methods ......................................................................................... 161
Figure 7.8. Dendrogram of Ward’s methods ........................................................................... 161
Figure 9.5. Dendrogram of Ward’s method ............................................................................. 165

xviii

xix
Abbreviations
AITSF – Access to the IT System of the Firm
AUC – Area under the Curve
B2B – Business-to-Business
B2C – Business-to-Customer
CA – Cluster Analysis
CATI - Computer-Aided Telephone Interview
CFA – Confirmatory Factor Analyses
CP – Competitive Pressure
DOI – Diffusion of Innovations
EBOEB – Expected Benefits and Obstacles of e-business
ECOMP – E-commerce Competitive Pressure
EDI – Electronic Data Interchange
ERP – Enterprise Resource Planning
EU – European Union
EU15 – 15 European Union countries
EU27 – 27 European Union countries
FA – Factor Analysis
IBS – Internet Business Solutions
ICT – Information and Communication Technology(ies)
IEN – Internet and e-mail Norms
INE – National Institute of Statistics
IOSs – Interorganizational Systems
IP – Internet Penetration
IPSIP – Improved Products or Services or Internal Processes
IT – Information Technology(ies)
ITTP – IT Training Programs
IS – Information Systems
IUTICE – The Use of Communication and Information Technologies in Firms
KMO – Kaiser-Meyer-Olkin
KMS – Knowledge Management Systems
KR-20 – Kuder-Richardson Formula 20

xx
LAN – Local Area Network
MCA – Multiple Correspondence Analyses
MRP – Material Requirements Planning
OLS – Ordinary Least Squares
PBEC – Perceived Benefits of Electronic Correspondence
PLS – Partial Least Squares
SA – Security Applications
SAS – Statistical Analysis System
SEM – Structural Equation Modelling
SER – Service Sector
SIZE – Firm Size
SMEs – Small and Medium-sized Enterprises
TAM – Technology Acceptance Model
TI – Technology Integration
TOE – Technology, Organization, and Environment
TPB – Theory of Planned Behaviour
TR – Technology Readiness
UTAUT – Unified Theory of Acceptance and Use of Technology
VIF – Variance Inflation Factor
WAN – Wide Area Network
WEBP – Web site Competitive Pressure

xxi
As Day [1998] wrote:
“The goal of scientific research is publication… A scientific
experiment, no matter how spectacular the results, is not
completed until the results are published.”

xxii

Chapter 1- Introduction
1
Chapter 1 - Introduction
1.1. Motivation
Today, information technology (IT) is universally regarded as an essential tool in
enhancing the competitiveness of a country’s economy. Hence, the XVII Portuguese
Constitutional Government recognized the importance of explicitly defining a
technology plan for Portugal. As pointed out in that programme, "Our backwardness in
terms of IT use negatively penalizes our overall competitiveness index" [Portuguesa,
2005]. In this context, it is extremely important to identify the drivers of Portuguese
firms to adopt and use IT. This is not only a problem of Portuguese firms. The
European Commission [Communities, 2005] claims that more efforts are needed to
improve e-business in European firms if the Lisbon targets of competitiveness are to be
achieved. Under the pressure of their main international competitors, European firms
need to find new opportunities to reduce costs and improve performance. IT is an
important tool to increase firms’ competitiveness, but this can only be achieved if firms
adopt and use IT. Thus, it is fundamental to understand IT adoption by Portuguese and
European firms. In order to understand the determinants of adoption of IT, particularly
Internet-related technologies, in the Portuguese and European context, this study will
use a quantitative approach. In this dissertation, there are four main motivating factors:
• The issue of IT adoption is a key theme in the current Portuguese national
(“Technology Shock”) and European (“i2010”) context;
• There is consensus today that IT has significant effects on the productivity of
firms [Black and Lynch, 2001, Brynjolfsson and Hitt, 2000]. These effects will
only be realized if, and when, IT are widely spread and used [Pohjola, 2003]. It
is fundamental to understand the determinants of adoption of IT;
• The importance of IT adoption in the national and global economy;
• An understanding of which factors contribute the most to IT adoption in Portugal
and throughout Europe will not only enable the development of policies to
promote it but also the development of an overview of the rationale behind IT
adoption.

Chapter 1- Introduction
2
1.2. Adoption theories in information systems
There are several theories of adoption in information systems (IS) [Wade, 2009]. The
most used theories are: technology acceptance model (TAM) [Davis et al., 1989],
theory of planned behaviour (TPB) [Ajzen, 1985, Ajzen, 1991], unified theory of
acceptance and use of technology (UTAUT) [Venkatesh et al., 2003], diffusion of
innovations (DOI) [Rogers, 1995], technology, organization, and environment (TOE)
theory [Tornatzky and Fleischer, 1990], institutional theory, and the Iacovou et al.
[1995] model. In this dissertation, in Chapter 2, we will develop only DOI, TOE,
institutional theory, and Iacovou et al. [1995] model because they are the only ones
that operate at the firm level. The TAM, TPB, and UTAUT are at the individual level.
1.3. Research focus
The focus of this dissertation is on understanding the drivers for IT adoption,
particularly Internet-related technologies, such as: Internet, web site, e-commerce,
business-to-business (B2B) e-commerce, and e-business adoption (the inside of the
dashed rectangle of Figure 1.1). We are interested in developing the first two phases of
the process. The impact of IT adoption (firms’ performance) is not the issue of interest.
Figure 1.1. Research focus
We define the following Internet-related technologies adoption:
• Internet, if firms have access to the Internet;
• web site, if firms own a web site;
• e-commerce, if firms are doing sales online.
• B2B e-commerce, if firms are buying and selling products and services amongst
businesses as defined by Teo and Ranganathan [2004];

Chapter 1- Introduction
3
• E-business, if firms are doing “transactions along the value chain (including
purchasing from upstream suppliers and selling products and services to
downstream customers) by using the Internet platform (e.g. TCP/IP, HTTP,
XML) in conjunction with the existing IT infrastructure” as defined by Zhu et al.
[2006a, page 601].
• Internet business solutions (IBS) was defined according to Varian et al.’s [2002]
terminology and is a set of IT that includes: firms that have web site, customer
development/e-marketing, customer service & support, and digital e-commerce.
To understand IT adoption, particularly Internet-related technologies adoption, it is
critical to study different contexts, industries, firm size, and theoretical frameworks. We
expect that this dissertation will contribute to improving knowledge in IT adoption.
Figure 1.2 presents the different topics covered in our approach. We develop four
studies for the Portuguese context and three more for the 27 European Union countries
(EU27) contexts.
Figure 1.2 . Topics covered in this dissertation to address IT adoption

Chapter 1- Introduction
4
1.4. Goals
The main goal of this dissertation is to understand IT adoption, particularly Internet-
related technologies adoption, by firms. For that we separate our aims by chapter. In
Chapter 2 we will review the main IT adoption models at firm level that have been
proposed in the literature.
In the third chapter we analyse determinants of web site and e-commerce adoption in
Portugal. The main purposes are the following: to examine the importance of TOE-
related factors as fundamental determinants of web site and e-commerce adoption; to
analyse the extent to which there are significant differences in the factors driving these
two types of IT.
In the fourth chapter we compare web site adoption in small and large Portuguese
firms. The two main purposes are the following: to examine the importance of TOE-
related factors as fundamental determinants of web site adoption for small and large
firms, and to compare the relative importance of such factors.
In the fifth chapter we concentrate our attention on small firms. The main purposes are
the following: to examine the importance of TOE-related factors as fundamental
determinants of Internet (first phase), web site (second phase), and e-commerce (third
phase) adoption; to analyse the extent to which the drivers of TOE factors vary with the
phase of adoption.
In the sixth chapter we explore the determinant factors of IBS adoption for Portuguese
firms. The purposes are the following: to develop an integrated model of IBS adoption,
taking into account the sample selection issue; to determine the major drivers of IBS
adoption at the two adoption stages and the extent to which their magnitudes differ with
the stage of the adoption.
In the seventh chapter we analyse firms’ patterns of e-business adoption: evidence for
the EU27. The main objectives are: to identify distinct clusters of e-business adoption;
to characterize the pattern of e-business adoption by firms across these clusters; and
to understand the extent to which industry e-business adoption characteristics are
more or less important than country-specific characteristics.

Chapter 1- Introduction
5
In the eighth chapter we analyse e-business adoption across sectors in Europe. Recent
findings reveal that in the European context the most important is characterizing e-
business adoption is the industry and its specific characteristics, and not the country to
which the firms belong [Oliveira and Martins, 2010a]. For this reason, it is important to
understand e-business adoption by industry throughout the EU 27 context. The
purpose is to identify the factors that explain the variation in e-business adoption by
two different industries (telecommunications (telco), and tourism).
In the ninth chapter we analyze B2B e-commerce adoption and usage in Europe. By
2012, there will be more than 1 billion online buyers worldwide, making B2C e-
commerce transactions worth $1.2 trillion. Although, B2B e-commerce, which has been
identified as an emerging trend [Claycomb et al., 2005], it will be ten times larger,
totaling $12.4 trillion worldwide in 2012 [IDC, 2008]. This is one of our reasons for
focusing this chapter only on B2B e-commerce. The other reason is that several
studies [Gibbs and Kraemer, 2004, Hsu et al., 2006, Zhu et al., 2006a, Zhu and
Kraemer, 2005, Zhu et al., 2006b] tend to aggregate B2B and B2C e-commerce,
believing that both have the same drivers, which may not be correct. The purpose of
this study is to understand B2B e-commerce adoption and usage in European
countries, and for this we use an adaptation of the theory of contextualist by Pettigrew
and Whipp [1991] to organize our initial theoretical/conceptual model.
1.5. Methods
The diversified nature of the objectives and conceptual frameworks of this dissertation
demand a combination of several methodological approaches. In philosophical
perspectives, based on Caldeira [2000] and taking into account the main
characteristics of positivism, realism and interpretivism, we can consider that this work
presents characteristics very consistent with those of positivism. With regard to
research methodologies we used the deductive approaches [Saunders et al., 2009].
The theoretical framework and quantitative approach will be described below.

Chapter 1- Introduction
6
1.5.1. Theoretical frameworks
The first five studies are based on the TOE framework (Chapters 3 through 7). Chapter
8 is based on a combination of TOE, the Tornatzky and Fleischer [1990] model, and
the Iacovou et al. [1995] model. The last study (Chapter 9) is based on the theory of
contextualist by Pettigrew and Whipp [1991]. We suggest a new research model to
understand B2B e-commerce adoption and usage.
1.5.2. Quantitative research methods
In Chapter 3 we use Portuguese data (firms with more than 9 employees, n=2,626) to
analyse web site and e-commerce adoption. Taking into account the fact that e-
commerce adoption is observed only for those firms that own a web site, we use a
bivariate probit model with sample selectivity. The hypothesis of uncorrelated errors
(ρ=0) is not rejected, so we estimate two sequential models [Greene, 2008], one probit
regression for web site adoption and another probit regression for e-commerce
adoption only for firms that adopt web site.
In Chapter 4 we also use Portuguese data (large firms with more than 249 employees
n=637, and small firms with fewer than 50 employees n=3,155). In this study we have a
binary decision if firms decided to adopt a web site or not. For that we use a probit
regression. We estimate one probit regression for small firms and another for large
firms, and we compare the marginal effects of both regressions.
In Chapter 5 we analyse only small Portuguese firms (firm with fewer than 50
employees, n=3,155) and we have a decision at three adoption stages (Internet, web
site, and e-commerce). For that we use a sequential logistic regression and we
compare the marginal effects of the three regressions.
In Chapter 6 we also use Portuguese data (firms with more than 9 employees,
n=2,626) to define two adoption stages: first stage - web site adoption decision, and
second stage - level of IBS adoption decision. Once more we conclude that the errors
are not correlated, so we specify two sequential regressions. We estimate one probit
regression for web site adoption with all firms and one ordered probit regression for the

Chapter 1- Introduction
7
level of IBS only with firms that had adopted web site. We also compute the marginal
effects for both regressions.
In Chapter 7 we use EU27 data (n=6,964). As a first step, we group the items to reduce
the number of variables of the survey; for that we apply a factor analysis (FA). Then, to
determine homogenous groups of firms in terms of e-business adoption, we apply a
cluster analysis (CA). At the end, we compare the clusters’ patterns using statistical
tests.
In Chapter 8 we also use EU27 data (telco n=1,019 and tourism n=1,440). As a first
step, we also perform an FA. We estimate three different logistic regressions to test the
research model: one for the full sample and two for industries (telco and tourism). We
also compute marginal effects of independent variables and use a two-tailed test to
estimate if there are statistically significant differences across industries.
In the last study, we also use EU27 data (n=6,973) and we perform an FA. The
dependent variables are B2B e-commerce adoption and usage. For B2B e-commerce
adoption we apply a logistic regression. For B2B e-commerce usage, which is an
ordered variable, an ordered logistic regression is developed. CA is used to identify
how many groups of countries are with similar information communication technology
(ICT) patterns. At the end, we also estimate a logistic regression for B2B e-commerce
adoption and an ordered logistic regression for B2B e-commerce usage for all groups
of countries obtained by cluster analysis. This analysis allows us to validate our
research model in different contexts of ICT readiness.
1.6. Path of research
This dissertation gathers the findings of several research projects, reported separately,
including journals with double blind review process, one proceeding in a national
conference, six proceedings in international conferences (five indexed in ISI web of
knowledge conferences), two paper in an international journal, and two more papers
currently submitted in international journals.

Chapter 1- Introduction
8
Chapter 2 addresses the literature review of adoption and use theories in IS, where we
explain the adoption theories used in IS at firm level, and also make an in-depth
analysis of the TOE framework.
In the initial stage we presented a statistical approach for understanding web site and
e-commerce adoption for Portuguese firms with 2005 data [Oliveira, 2008]. It was the
first scientific contribution within this dissertation. This was the first step to make
Chapter 3, the final work was presented in Milan in an International Conference on e-
Business (ICE-B 2009) [Oliveira and Martins, 2009a].
Chapter 4 was presented in Porto in an International Conference on e-Business (ICE-B
2008) [Oliveira and Martins, 2008]. Chapter 5 was presented in Gothenburg in the 3rd
European Conference on Information Management and Evaluation (ECIME 2009)
[Martins and Oliveira, 2009]. Chapter 6 is the last paper with Portuguese data, and has
been in the submission process since September 2008.
Chapter 7 is the first within the EU27 context. It was also presented in ECIME 2009
[Oliveira and Martins, 2009b] and selected for Electronic Journal of Information
Systems Evaluation [Oliveira and Martins, 2010a]. Based on the findings of this
chapter, we made Chapter 8. This work was accepted for publication in Industrial
Management & Data Systems [Oliveira and Martins, 2010b].
As a result of the doctoral program coursework, the author met Professor Gurpreet
Dhillon, showing him the initial draft of Chapter 9, and asked him to accept the
challenge of improving this chapter. This work is in the review process in an
international journal.
In the last chapter are the conclusions, i.e. the summary of conclusions presented in
Chapters 2 to 9. The majority of the chapters were accepted or are in the submission
process to conferences and/or journals, which can be considered a positive indication
of quality of the work developed.

Chapter 2 – Information technology adoption models at firm level: review of literature
9
Chapter 2 – Information technology adoption models at
firm level: review of literature
2.1. Introduction
These days, information technology (IT) is universally regarded as an essential tool in
enhancing the competitiveness of the economy of a country. It is commonly accepted
today that IT has significant effects on the productivity of firms. These effects will only
be fully realized if, and when, IT are widely spread and used. It is crucial, therefore, to
understand the determinants of IT adoption and the theoretical models that have arisen
addressing IT adoption. There are not many reviews of literature about the comparison
of IT adoption models at the individual level, and to the best of our knowledge there are
a smaller number at the firm level. This review will fill this gap.
In this study, we review theories for adoption models at the firm level used in
information systems (IS) literature and discuss two prominent models, presented in
Section 2. The two models reviewed are: diffusion of innovation (DOI) [Rogers, 1995];
and the technology, organization, and environment (TOE) framework [Tornatzky and
Fleischer, 1990], since most studies on IT adoption at the firm level are derived from
theories such as these two [Chong et al., 2009]. Section 3 presents an extensive
analysis of the TOE framework, analysing the studies that used only this theory and the
studies that combine the TOE framework with other theories such as: DOI, institutional
theory, and the Iacovou et al. [1995] model. In the last section, we present the
conclusions.
2.2. Models of IT adoption
There are many theories used in IS research [Wade, 2009]. We are interested only in
theories about technology adoption. The most used theories are the technology
acceptance model (TAM) [Davis, 1986, Davis, 1989, Davis et al., 1989], theory of
planned behaviour (TPB) [Ajzen, 1985, Ajzen, 1991], unified theory of acceptance and
use of technology (UTAUT) [Venkatesh et al., 2003], DOI [Rogers, 1995], and the TOE

Chapter 2 – Information technology adoption models at firm level: review of literature
10
framework [Tornatzky and Fleischer, 1990]. We will develop only the DOI, and
especially the TOE framework, because they are the only ones that are at the firm
level. The TAM, TPB and UTAUT are at the individual level.
2.2.1. DOI
DOI is a theory of how, why, and at what rate new ideas and technology spread
through cultures, operating at the individual and firm level. DOI theory sees innovations
as being communicated through certain channels over time and within a particular
social system [Rogers, 1995]. Individuals are seen as possessing different degrees of
willingness to adopt innovations, and thus it is generally observed that the portion of
the population adopting an innovation is approximately normally distributed over time
[Rogers, 1995]. Breaking this normal distribution into segments leads to the
segregation of individuals into the following five categories of individual innovativeness
(from earliest to latest adopters): innovators, early adopters, early majority, late
majority, laggards [Rogers, 1995]. The innovation process in organizations is much
more complex. It generally involves a number of individuals, perhaps including both
supporters and opponents of the new idea, each of whom plays a role in the
innovation-decision.
Based on DOI theory at firm level [Rogers, 1995], innovativeness is related to such
independent variables as individual (leader) characteristics, internal organizational
structural characteristics, and external characteristics of the organization (Figure 2.1).
(a) Individual characteristics describes the leader attitude toward change. (b) Internal
characteristics of organizational structure includes observations according to Rogers
[1995] whereby: “centralization is the degree to which power and control in a system
are concentrated in the hands of a relatively few individuals”; “complexity is the degree
to which an organization’s members possess a relatively high level of knowledge and
expertise”; “formalization is the degree to which an organization emphasizes its
members’ following rules and procedures”; “interconnectedness is the degree to which
the units in a social system are linked by interpersonal networks”; “organizational slack
is the degree to which uncommitted resources are available to an organization”; “size is
the number of employees of the organization”. (c) External characteristics of
organizational refers to system openness.

Chapter 2 – Information technology adoption models at firm level: review of literature
11
Individual (leader)
characteristics
Attitude toward change
Internal characteristics of
organizational structure
Centralizaion
Complexity
Formalization
Interconnectedness
Organizational slack
size
Organizational
innovativeness
External characteristics of
the organization
System openness
Figure 2.1. Diffusion of innovations [Rogers, 1995]
Since the early applications of DOI to IS research, the theory has been applied and
adapted in various ways. Some examples are presented in Table 2.1.
Table 2.1: Some studies based on DOI theory [Rogers, 1995] IT Adoption Author(s)
Material requirements planning (MRP) [Cooper and Zmud, 1990] IS adoption (uses at least one major software application: accounting; inventory control;
sales; purchasing; personnel and payroll; CAD/CAM; EDI; MRP), and extent of IS (number of personal computers and the number of software applications)
[Thong, 1999]
Intranet [Eder and Igbaria, 2001] Web site [Bradford and Florin, 2003]
Enterprise resource planning (ERP) [Beatty et al., 2001] E-procurement [Li, 2008]
E-business [Zhu et al., 2006a] E-business [Hsu et al., 2006]
2.2.2. Technology, organization, and environment co ntext
The TOE framework was developed in 1990 [Tornatzky and Fleischer, 1990]. It
identifies three aspects of an enterprise's context that influence the process by which it
adopts and implements a technological innovation: technological context,
organizational context, and environmental context (Figure 2.2). (a) Technological
context describes both the internal and external technologies relevant to the firm. This

Chapter 2 – Information technology adoption models at firm level: review of literature
12
includes current practices and equipment internal to the firm [Starbuck, 1976], as well
as the set of available technologies external to the firm [Hage, 1980, Khandwalla, 1970,
Thompson, 1967]. (b) Organizational context refers to descriptive measures about the
organization such as scope, size, and managerial structure. (c) Environmental context
is the arena in which a firm conducts its business—its industry, competitors, and
dealings with the government [Tornatzky and Fleischer, 1990].
Figure 2.2. Technology, organization, and environment framework [Tornatzky and Fleischer, 1990]
The TOE framework as originally presented, and later adapted in IT adoption studies,
provides a useful analytical framework that can be used for studying the adoption and
assimilation of different types of IT innovation. The TOE framework has a solid
theoretical basis, consistent empirical support (see Tables 2.2 and 2.3), and the
potential of application to IS innovation domains, though specific factors identified
within the three contexts may vary across different studies.
This framework is consistent with the DOI theory, in which Rogers [1995] emphasized
individual characteristics, and both the internal and external characteristics of the
organization, as drivers for organizational innovativeness. These are identical to the
technology and organization context of the TOE framework, but the TOE framework
also includes a new and important component, environment context. The environment
context presents both constraints and opportunities for technological innovation. The
TOE framework makes Rogers’ innovation diffusion theory better able to explain intra-
firm innovation diffusion [Hsu et al., 2006]. Thus, the next Section analyses the studies
that adopted TOE framework.

Chapter 2 – Information technology adoption models at firm level: review of literature
13
2.3. Empirical literature of the TOE framework
We thoroughly analyse the TOE framework and present an exhaustive description of
studies that draw on this theory. Section 3.1 discusses the relevant papers that used
only the TOE framework as a theoretical model (Table 2.2), while Section 3.2 includes
some papers that combined the TOE framework with other theoretical models (Table
2.3).
2.3.1. Studies that used only the TOE framework
Several authors used only the TOE framework to understand different IT adoptions,
such as: electronic data interchange (EDI) [Kuan and Chau, 2001]; open systems
[Chau and Tam, 1997]; web site [Oliveira and Martins, 2008]; e-commerce [Liu, 2008,
Martins and Oliveira, 2009, Oliveira and Martins, 2009a]; enterprise resource planning
(ERP) [Pan and Jang, 2008]; business to business (B2B) e-commerce [Teo et al.,
2006]; e-business [Lin and Lin, 2008, Oliveira and Martins, 2010a, Zhu et al., 2003,
Zhu and Kraemer, 2005, Zhu et al., 2006b]; knowledge management systems (KMS)
[Lee et al., 2009]. The variables analysed, methods used, data, and context of
empirical studies are presented in Table 2.2.
Table 2.2: Some studies based only on Tornatzky and Fleischer [1990]
IT Adoption Analysed Variables Methods Data, and context Author(s)
EDI
Technological context � perceived direct benefits; perceived indirect benefits.
Organizational context � perceived financial cost;
perceived technical competence.
Environmental context � perceived industry pressure; perceived government pressure.
Factor analysis (FA), and Logistic regression
Letter with questionnaires
was sent; 575 small firms
Hong Kong
[Kuan and Chau, 2001]
Open systems
Characteristics of the “Open Systems Technology” Innovation � perceived Benefits; perceived barriers; perceived Importance of compliance to standards,
interoperability, and Interconnectivity.
Organizational technology � complexity of IT infrastructure; satisfaction with existing systems;
formalization of system development and management.
External environment � market uncertainly
T-test, FA, logistic
regression
Face-to-face interview, 89
firms
Hong Kong
[Chau and Tam,
1997]
Web site Technological context � technology readiness;
technology integration; security applications.
Multiple correspondenc
e analyses
3155 small and 637 large firms
[Oliveira and
Martins,

Chapter 2 – Information technology adoption models at firm level: review of literature
14
Table 2.2: Some studies based only on Tornatzky and Fleischer [1990]
IT Adoption Analysed Variables Methods Data, and context Author(s)
Organizational context � perceived benefits of electronic correspondence; IT training programmes; access to the
IT system of the firm; Internet and e-mail norms.
Environmental context � web site competitive pressure
Controls � Services sector.
(MCA), and probit model
Portuguese 2008]
Web site
E-commerce
Technological context � technology readiness; technology integration; security applications.
Organizational context � perceived benefits of electronic correspondence; IT training programmes; access to the
IT system of the firm; Internet and e-mail norms.
Environmental context � web site competitive pressure; e-commerce competitive pressure.
Controls � Services sector.
MCA, and probit model
2626 firms
Portuguese
[Oliveira and
Martins, 2009a]
Internet
Web site
E-commerce
Technological context � technology readiness; technology integration; security applications.
Organizational context � perceived benefits of electronic correspondence; IT training programmes; access to the
IT system of the firm; Internet and e-mail norms.
Environmental context � Internet competitive pressure; web site competitive pressure; e-commerce competitive
pressure.
Controls � Services sector.
MCA, and logit model
3155 small firms
Portuguese
[Martins and
Oliveira, 2009]
e-commerce development level (0-14)
Technological � support from technology; human capital; potential support from technology.
Organizational � management level for information; firm
size.
Environmental � user satisfaction; e-commerce security.
Controls � firm property.
FA and ordinary least squares (OLS)
e-mail survey, online survey and telephone
interview during 2006;
156 firms.
Shaanxi, China
[Liu, 2008]
ERP
Technological context � IT infrastructure; technology readiness.
Organizational context � size; perceived barriers.
Environmental context � production and operations
improvement; enhancement of products and services; competitive pressure; regulatory policy.
FA, and Logistic
regression
Face-to-face interview, 99
firms
Taiwan
[Pan and Jang, 2008]
Deployment of B2B e-commerce:
B2B firms versus non-B2B firms
Technological inhibitors � unresolved technical issues; lack of IT expertise and infrastructure; lack of
interoperability.
Organizational inhibitors � difficulties in organizational change; problems in project management; lack of top management support; lack of e-commerce strategy;
difficulties in cost-benefit assessment.
Environmental inhibitors � unresolved legal issues; fear and uncertainty.
FA, t-tests and discrimination
analysis
249 firms
North America and Canada
[Teo et al., 2006]
E-business
Technology competence � IT infrastructure; e-business know-how.
Organizational context � firm scope, firm size.
Environmental context � consumer readiness;
competitive pressure; lack of trading partner readiness.
Controls (industry and country effect)
Confirmatory factor analysis
(CFA), second-order
factor modelling,
logistic regression,
and cluster
analysis (CA)
Telephone interview during 2000; 3552 firms
European
(Germany, UK, Denmark,
Ireland, France, Spain, Italy, and
Finland)
[Zhu et al., 2003]

Chapter 2 – Information technology adoption models at firm level: review of literature
15
Table 2.2: Some studies based only on Tornatzky and Fleischer [1990]
IT Adoption Analysed Variables Methods Data, and context Author(s)
E-Business usage
Technological context �technology competence.
Organizational context � size; international scope; financial commitment.
Environmental context � competitive pressure;
regulatory support.
e-Business functionalities � front-end functionality; back-end integration.
CFA, second-order factor
modelling, and structural equation modelling
(SEM)
Telephone interview during 2002, 624 firms
across 10 countries
Developed (Denmark,
France, Germany, Japan, Singapore, U.S.) and developing (Brazil, China,
Mexico and Taiwan) countries
[Zhu and Kraemer,
2005]
E-Business initiation
E-Business adoption
E-Business routinization
Technological context �technology readiness; technology integration.
Organizational context � firm size; global scopes;
trading globalization; managerial obstacles.
Environmental context � competition intensity; regulatory environment.
CFA, and SEM
Telephone interview during 2002, 1857 firms
across 10 countries
Developed (Denmark,
France, Germany, Japan, Singapore, U.S.) and developing (Brazil, China,
Mexico and Taiwan) countries
[Zhu et al.,
2006b]
E-business
Technological context � technology readiness; technology integration; security applications.
Organizational context � perceived benefits of electronic correspondence; IT training programmes; access to the
IT system of the firm; Internet and e-mail norms.
Environmental context � web site competitive pressure
Controls � Services sector.
T-test, FA, and CA
Telephone interview during 2006, 6964 firms
across 27 countries
UE27 countries
[Oliveira and
Martins, 2009b, Oliveira
and Martins, 2010a]
Internal integration of e-business
External diffusion of use
of e-business
Technological context � IS infrastructure; IS expertise.
Organizational context � organizational compatibility; expected benefits of e-business.
Environmental context � competitive pressure; trading
partner readiness.
CFA, and SEM
e-mail survey during 2006;
163 large firms
Taiwan
[Lin and Lin, 2008]
KMS
Technology aspect � Organizational IT competence; KMS characteristics (compatibility, relative advantage
and complexity).
Organizational aspect � top management commitment; hierarchical organizational structure.
Environmental aspect � With external vendors; among
internal employees.
Not empirical work
Not empirical work.
Chinese
[Lee et al., 2009]

Chapter 2 – Information technology adoption models at firm level: review of literature
16
2.3.2. Studies that used the TOE framework combined with
other theories
Some authors used the TOE framework with other theories to understand IT adoption
[Chong et al., 2009, Gibbs and Kraemer, 2004, Hsu et al., 2006, Li, 2008, Soares-
Aguiar and Palma-Dos-Reis, 2008, Thong, 1999, Zhu et al., 2006a]. In Table 2.3 we
can see that DOI, institutional theory, and the Iacovou et al. [1995] model were used in
combination with the TOE framework to better understand IT adoption decisions.
Studies combining the TOE framework and DOI theories include the following. Thong
[1999] joins CEO characteristics from DOI to the TOE framework. Chong et al. [2009]
add innovation attributes (relative advantage, compatibility, and complexity) from DOI
and an additional new factor in the adoption study called information sharing culture
characteristics to the TOE framework. Zhu et al. [Zhu et al., 2006a] combined relative
advantage, compatibility, cost, and security concern from DOI with the TOE framework.
Additional theories include those listed below.
Institutional theory
Institutional theory emphasizes that institutional environments are crucial in shaping
organizational structure and actions [Scott, 2001, Scott and Christensen, 1995].
According to the institutional theory, organizational decisions are not driven purely by
rational goals of efficiency, but also by social and cultural factors and concerns for
legitimacy. Institutions are transported by cultures, structures, and routines and operate
at multiple levels. The theory claims that firms become more similar due to isomorphic
pressures and pressures for legitimacy [Dimaggio and Powell, 1983]. This means that
firms in the same field tend to become homologous over time, as competitive and
customer pressures motivate them to copy industry leaders. For example, rather than
making a purely internally driven decision to adopt e-commerce, firms are likely to be
induced to adopt and use e-commerce by external isomorphic pressures from
competitors, trading partners, customers, and government.
Several recent studies have taken an institutional approach to e-commerce or EDI
diffusion and assimilation [Chatterjee et al., 2002, Purvis et al., 2001, Teo et al., 2003].

Chapter 2 – Information technology adoption models at firm level: review of literature
17
It is well known that mimetic, coercive, and normative institutional pressures existing in
an institutionalized environment may influence organizations’ predisposition toward an
IT-based interorganizational system [Teo et al., 2003]. Mimetic pressures are observed
when firms adopt a practice or innovation imitating competitors [Soares-Aguiar and
Palma-Dos-Reis, 2008]. Coercive pressures are a set of formal or informal forces
exerted on organizations by other organizations upon which the former organizations
depend [Dimaggio and Powell, 1983]. Normative pressures come from dyadic
relationships where companies share some information, rules, and norms. Sharing
these norms through relational channels amongst members of a network facilitates
consensus, which, in turn, increases the strength of these norms and their potential
influence on organizational behaviour [Powell and DiMaggio, 1991].
Some studies combine the TOE framework with the institutional theory [Gibbs and
Kraemer, 2004, Li, 2008, Soares-Aguiar and Palma-Dos-Reis, 2008]. The institutional
theory adds to the environmental context of the TOE framework external pressures,
which include pressure from competitors and pressure exerted by trading partners.
Iacovou et al. [1995] model
Iacovou et al. [1995] analysed interorganizational systems (IOSs) characteristics that
influence firms to adopt IT innovations in the context of EDI adoption. Their framework
is well suited to explain the adoption of an IOS. It is based on three factors: perceived
benefits, organizational readiness, and external pressure (see Figure 2.3). Perceived
benefits is a different factor from the TOE framework, whereas organizational
readiness is a combination of the technology and organization context of the TOE
framework. Hence, IT resources is similar to technology context and financial
resources is similar to organizational context. The external pressure in the Iacovou et
al. [1995] model adds the trading partners to the external task environmental context of
the TOE framework as a critical role of IOSs adoptions.

Chapter 2 – Information technology adoption models at firm level: review of literature
18
Figure 2.3. Iacovou et al. [1995] model
Hsu et al. [2006] used the DOI theory, the TOE framework, and the Iacovou et al.
[1995] model to explain e-business use. Their model proposed four constructs
(perceived benefits, organizational readiness, external pressure, and environment).
Organization readiness, is consistently used in all three frameworks in the literature.
Environment is from the TOE framework. Perceived benefits and external pressure are
from the Iacovou et al. [1995] model.
Table 2.3: Some studies that combine Tornatzky and Fleischer [1990] with other theoretical models
Theoretical Model IT Adoption Analysed variables Methods Data, and
Context Author(s)
TOE and DOI
Uses at least one major software
application: accounting;
inventory control; sales; purchasing;
personnel and payroll; CAD/CAM;
EDI; MRP.
Number of personal
computers and software
applications
CEO characteristics � CEO's innovativeness; CEO's IS knowledge.
IS characteristics � relative advantage of IS;
compatibility of IS; complexity of IS.
Organizational characteristics � business size; Employees' IS knowledge; information intensity.
Environmental characteristic � competition.
T-tests, FA, discrimina-
tory analysis,
and partial least
squares (PLS)
Letter with questionnaires
sent during 2005, 166 small firms;
Singapore
[Thong, 1999]
TOE and DOI
Collaborative commerce (c-
commerce)
Innovation attributes � relative advantage; compatibility; complexity.
Environmental � expectations of market trends;
competitive pressure.
Information sharing culture � trust; information distribution; information interpretation.
Organizational readiness � top management
support; feasibility; project champion characteristics
FA, and OLS
e-mail survey; 109 firms
Malaysian
[Chong et al., 2009]
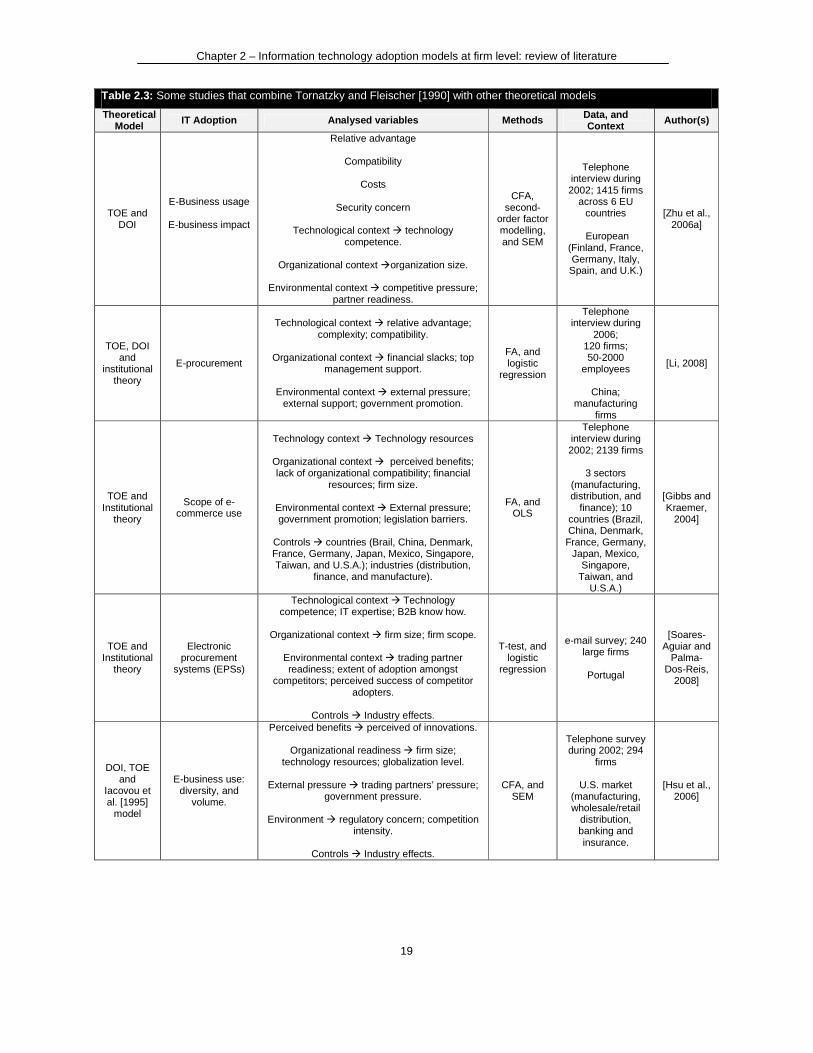
Chapter 2 – Information technology adoption models at firm level: review of literature
19
Table 2.3: Some studies that combine Tornatzky and Fleischer [1990] with other theoretical models
Theoretical Model IT Adoption Analysed variables Methods Data, and
Context Author(s)
TOE and DOI
E-Business usage
E-business impact
Relative advantage
Compatibility
Costs
Security concern
Technological context � technology competence.
Organizational context �organization size.
Environmental context � competitive pressure;
partner readiness.
CFA, second-
order factor modelling, and SEM
Telephone interview during 2002; 1415 firms
across 6 EU countries
European
(Finland, France, Germany, Italy, Spain, and U.K.)
[Zhu et al., 2006a]
TOE, DOI and
institutional theory
E-procurement
Technological context � relative advantage; complexity; compatibility.
Organizational context � financial slacks; top
management support.
Environmental context � external pressure; external support; government promotion.
FA, and logistic
regression
Telephone interview during
2006; 120 firms; 50-2000
employees
China; manufacturing
firms
[Li, 2008]
TOE and Institutional
theory
Scope of e-commerce use
Technology context � Technology resources
Organizational context � perceived benefits; lack of organizational compatibility; financial
resources; firm size.
Environmental context � External pressure; government promotion; legislation barriers.
Controls � countries (Brail, China, Denmark, France, Germany, Japan, Mexico, Singapore, Taiwan, and U.S.A.); industries (distribution,
finance, and manufacture).
FA, and OLS
Telephone interview during 2002; 2139 firms
3 sectors
(manufacturing, distribution, and
finance); 10 countries (Brazil, China, Denmark, France, Germany,
Japan, Mexico, Singapore,
Taiwan, and U.S.A.)
[Gibbs and Kraemer,
2004]
TOE and Institutional
theory
Electronic procurement
systems (EPSs)
Technological context � Technology competence; IT expertise; B2B know how.
Organizational context � firm size; firm scope.
Environmental context � trading partner readiness; extent of adoption amongst
competitors; perceived success of competitor adopters.
Controls � Industry effects.
T-test, and logistic
regression
e-mail survey; 240 large firms
Portugal
[Soares-Aguiar and
Palma-Dos-Reis,
2008]
DOI, TOE and
Iacovou et al. [1995]
model
E-business use: diversity, and
volume.
Perceived benefits � perceived of innovations.
Organizational readiness � firm size; technology resources; globalization level.
External pressure � trading partners’ pressure;
government pressure.
Environment � regulatory concern; competition intensity.
Controls � Industry effects.
CFA, and SEM
Telephone survey during 2002; 294
firms
U.S. market (manufacturing, wholesale/retail
distribution, banking and insurance.
[Hsu et al., 2006]

Chapter 2 – Information technology adoption models at firm level: review of literature
20
2.4. Conclusions
In this chapter, we made a review of literature of IT adoption models at the firm level.
Most empirical studies are derived from the DOI theory and the TOE framework. As the
TOE framework includes the environment context (not included in the DOI theory), it
becomes better able to explain intra-firm innovation adoption; therefore, we consider
this model to be more complete. The TOE framework also has a solid theoretical basis,
consistent empirical support, and the potential of application to IS adoption. For this
reason an extensive analysis of the TOE framework was undertaken, analysing
empirical studies that use only the TOE model, and empirical studies that combine this
model with the DOI theory, the institutional theory, and the Iacovou et al. [1995] model,
and concluding that the same context in a specific theoretical model can have different
factors.
In terms of further research, we think that for more complex new technology adoption it
is important to combine more than one theoretical model to achieve a better
understanding of the IT adoption phenomenon.

Chapter 3 - Determinants of web site and e-commerce adoption in Portugal
21
Chapter 3 – Determinants of web site and e-commerce
adoption in Portugal
3.1. Introduction
Literature on information technology (IT) adoption and diffusion at firm level [Hong and
Zhu, 2006] suggests that when analyzing this topic, one should consider the nature of
the IT. For simple technologies, like the Internet or web site, the adoption process is
expected to be inexpensive and easy and probably will not bring about fundamental
changes to the firm. However, for advanced technologies, especially those related to
online transactions, the adoption process may be complicated and costly. That is
perhaps why, in 2006, even though most firms in Portugal are Internet adopters (83%),
only 35% owned a web site and a limited part of them, 7%, have adopted e-commerce.
These national figures are clearly below the 15 European Union countries (EU15)
mean level, where 94% of firms are Internet users, 66% own a web site and 16% have
adopted e-commerce practices.
The two main purposes of this study are the following:
� To examine the importance of technology-organization-environment (TOE) related
factors as fundamental determinants of web site and e-commerce adoption;
� To analyze the extent to which there are significant differences in the factors
driving these two types of IT.
To achieve these research objectives, we used a rich data set of 2,626 firms that are
representative of Portuguese firms with more than 10 employees in 2006, (excluding
the financial service sector).
In this study, as suggested by Hong and Zhu (2006), we defined e-commerce as any
application of web technologies that enables revenue generating business activities
over the Internet.

Chapter 3 - Determinants of web site and e-commerce adoption in Portugal
22
3.2. Theorical framework and conceptual model
The TOE model [Tornatzky and Fleischer, 1990] identifies three aspects that may
possibly influence web site and e-commerce adoption: technological context
(technology readiness, technology integration and security applications); organizational
context (firm size, perceived benefits of electronic correspondence, IT training
programs, access to the IT system of the firm, Internet and e-mail norms and main
perceived obstacle); and environmental context (competitive pressure). In accordance
with the TOE theory, we developed in the next subsection a conceptual framework for
web site and e-commerce adoption (see Figure 3.1).
Technology context
Web site
Adoption
Organization context
E-commerce
Adoption
If
adopted
Environment context
Controls
Internet and e-mail norms
Access to the IT system of
the firm
Perceived benefits of
electronic correspondence
IT training programs
Firm size (S1, S2 and S3)
Security applications
Technology integration
Technology readinessWeb site competitive
pressure
Type of industry
H1a
H2a
H10a
H8a
H7a
H6a
H5a
H4a
H3a
E-commerce competitive
pressureH10b
H1b
H2b
H3b
H4b
H5b
H6b
H7b
H8b
Main perceived obstacleH9b
Figure 3.1. Conceptual framework for web site and e-commerce adoption
3.2.1. Technology Context
Technology readiness can be defined as technology infrastructure and IT human
resources. Technology infrastructure establishes a platform on which Internet
technologies can be built; IT human resources provide the knowledge and skills to
develop web applications [Zhu and Kraemer, 2005]. Theoretical assertions are
supported by several empirical studies [Hong and Zhu, 2006, Iacovou et al., 1995,

Chapter 3 - Determinants of web site and e-commerce adoption in Portugal
23
Kwon and Zmud, 1987, Zhu et al., 2003, Zhu and Kraemer, 2005, Zhu et al., 2006b,
Zhu et al., 2004].
H1a and H1b. The level of technology readiness is positively associated with web
site and e-commerce adoption
Evidence from the literature suggests that integrated technologies help improve firm
performance by reduced cycle time, improved customer service, and lowered
procurement costs [Barua et al., 2004]. As a complex technology, e-commerce
demands close coordination of various components along the value chain.
Correspondingly, a greater integration of existing applications and the Internet platform
represent a greater capacity of conducting business over the Internet [Al-Qirim, 2007,
Mirchandani and Motwani, 2001, Premkumar, 2003].
H2a and H2b. The level of technology integration is positively associated with
web site and e-commerce adoption
The lack of security may slow down technological progress. For example, for Portugal
in 2002 this was the greatest barrier to Internet use [Martins and Oliveira, 2005] and in
China it is one of the most important barriers to the adoption of e-commerce [Tan and
Ouyang, 2004].
H3a and H3b. Security applications is positively associated with web site and e-
commerce adoption
3.2.2. Organization Context
Firm size is one of the most commonly studied determinants of IT adoption [Lee and
Xia, 2006]. Several empirical studies indicate that there is a positive relationship
between the two variables [Pan and Jang, 2008, Premkumar et al., 1997, Thong, 1999,
Zhu et al., 2003]
H4a and H4b. Firm size is positively associated with web site and e-commerce
adoption
Empirical studies consistently found that perceived benefits have a significant impact in
IT adoption [Beatty et al., 2001, Gibbs and Kraemer, 2004, Iacovou et al., 1995].
H5a and H5b. Perceived benefits of electronic correspondence is positively
related with web site and e-commerce adoption

Chapter 3 - Determinants of web site and e-commerce adoption in Portugal
24
We used IT training programs as a proxy of employees’ education level, because in our
survey we do not have this variable. The presence of skilled labour in a firm increases
its ability to absorb and make use of an IT innovation, and therefore it is an important
determinant of IT diffusion [Caselli and Coleman, 2001, Hollenstein, 2004, Kiiski and
Pohjola, 2002].
H6a and H6b. IT training programs are positively associated with web site and e-
commerce adoption
The fact that workers can have access to the IT system from outside of the firm reveals
that the organization is prepared to integrate its technologies [Mirchandani and
Motwani, 2001].
H7a and H7b. The level of access to the IT system from outside of the firm is
positively associated with web site and e-commerce adoption
Regulatory environment has been acknowledged as a critical factor influencing
innovation diffusion [Zhu et al., 2003, Zhu and Kraemer, 2005, Zhu et al., 2006b, Zhu et
al., 2004]. Firms often refer inadequate legal protection for online business activities,
unclear business laws, and security and privacy as concerns in using web technologies
[Kraemer et al., 2006].
H8a and h8b. The presence of Internet and e-mail norms is positively associated
with web site and e-commerce adoption
Research into IT adoption and implementation suggests that when the technology is
complex, as is the case for e-commerce, the main perceived obstacles are particularly
relevant because in this case, the adoption process may be complicated and costly
[Hong and Zhu, 2006].
H9b. Main perceived obstacle is negatively associated with e-commerce adoption
3.2.3. Environment Context
Competitive pressure refers to the degree of pressure felt by the firm from competitors
within the industry. Porter and Millar (1985) analyzed the strategic rationale underlying
competitive pressure as an innovation-diffusion driver. They suggested that, by using a
new innovation, firms might be able to alter the rules of competition, affect the industry

Chapter 3 - Determinants of web site and e-commerce adoption in Portugal
25
structure, and leverage new ways to outperform rivals, thus changing the competitive
landscape. This analysis can be extended to IT adoption. Empirical evidence suggests
that competitive pressure is a powerful driver of IT adoption and diffusion [Al-Qirim,
2007, Gibbs and Kraemer, 2004, Hollenstein, 2004, Iacovou et al., 1995, Mehrtens et
al., 2001, Zhu et al., 2003].
H10a. The level of web site competitive pressure is positively associated with
web site adoption
H10b. The level of e-commerce competitive pressure is positively associated with
e-commerce adoption
3.3. Data and methodology
3.3.1. Data
The data used in this study were provided by National Institute of Statistics (INE) and
result from the survey on the Use of Communication and Information Technologies in
Firms (IUTICE) in 2006. We used a sample of 2,626 firms with more than 9 employees
that is statistically representative of the whole private business sector in Portugal at
January 2006, excluding the financial sector.
3.3.2. Methodology
In our model we examine the influence of several TOE factors on the adoption decision
at two adoption stages (see Figure 3.2).

Chapter 3 - Determinants of web site and e-commerce adoption in Portugal
26
Figure 3.2. Stage of adoption by firms
We estimated the following probit model, for stage adoption i:
P(yi=1/x i)=Φ(x iβi) for i=1,2 (3.1)
Where y1=1 is web site adoption, y2=1 is e-commerce adoption, x i is the vector of the
explanatory variables, βi the vector of unknown parameters to be estimated, and Φ(.) is
the normal cumulative distribution.
Within our context, the e-commerce adoption decision (stage 2) should be modelled
jointly with the decision on web site adoption (stage 1), taking into account the fact that
e-commerce adoption decision is observed only for those firms who own a web site. As
it is usual in statistical analysis, we use a bivariate probit model with sample selectivity
that estimates simultaneously the system of two nonlinear equations, in our case, two
probit models taking into account sample selection. If the hypothesis of uncorrelated
errors (ρ=0) is not rejected then we can proceed as usual by specifying two sequential
models [Greene, 2008]. This means that we can compute, without the existence of
selectivity bias, one binary model (probit or logit) for web site adoption with all firms and
another binary model (probit or logit) for e-commerce only with firms that had adopted
web site.
The probit or logit model has been used in the IT literature to study the following
adoptions: computer-mediated communication technologies [Premkumar, 2003],
Internet [Martins and Oliveira, 2007], web site [Oliveira and Martins, 2008] and e-
business [Pan and Jang, 2008, Zhu et al., 2003].

Chapter 3 - Determinants of web site and e-commerce adoption in Portugal
27
Definition of explanatory variables
A technology readiness (TR) index was built by aggregating 8 items on technologies
used by the firm (on a yes/no scale): computers, e-mail, intranet, extranet, own
networks that are not the Internet (own exclusive networks), wired local area network
(LAN), wireless LAN, wide area network (WAN), and one item standing for the
existence of IT specific skills in the firm (on a yes/no scale) [Zhu et al., 2004]. The first
8 items represent the penetration of traditional information technologies, which formed
the technological infrastructure [Kwon and Zmud, 1987]. The last item represents IT
human resources [Mata et al., 1995]. To aggregate these 9 items measured in yes/no
scale, we used multiple correspondence analyses (MCA). The MCA is a method of
“multidimensional exploratory statistic” that is used to reduce the dimension when the
variables are binary [Johnson and Wichern, 1998]. The first dimension explains 38% of
inertia. In the negative side of the first axis we have variables that represent firms that
do not use IT infrastructures and do not have workers with IT skills. On the positive
side we have the variables that represent the use of infrastructures and workers with IT
skills. This resulting variable reflects the technology readiness.
Technology integration (TI) was measured by the number of IT systems for managing
orders that are automatically linked with other IT systems of the firm. The variable
ranges from 0 to 5. This variable reflects how well the IT systems are connected on a
common platform.
Security applications (SA) was measured by the number of existing security
applications in the firms. The variable ranges from 0 to 6. Firm size was measured by
three binary variables: small firms (S1) (10 up to 49 employees); medium-size firms (S2)
(50 up to 249 employees); large firms (S3) (more than 249 employees).
Perceived benefits of electronic correspondence (PBEC) was measured by the shift
from traditional postal mail to electronic correspondence as the main standard for
business communication, in the last 5 years (on a yes/no scale).
IT training programs (ITTP) is also binary variable (yes/no) related to the existence of
professional training in computer/informatics, available to workers in the firm.

Chapter 3 - Determinants of web site and e-commerce adoption in Portugal
28
Access to the IT system of the firm (AITSF) was measured by the number of places
from which workers access the firms information systems. The variable ranges from 0
to 4.
Internet and e-mail norms (IEN) was measured by whether firms have defined norms
about Internet and e-mail (on a yes/no scale).
Main perceived obstacles was measured by five dummy variables reflecting the main
problems faced in the implementation of e-commerce solution.
Web site competitive pressure (WEBP) and e-commerce competitive pressure
(ECOMP) are computed as the percentage of firms in each of the 9 industries that had
already adopted a web site/e-commerce two years before the time of the survey, i.e. in
2004. As in Zhu et al. [Zhu et al., 2003] the rationale underlying our model is that an
observation of the firm on the adoption behaviour of its competitors influences its own
adoption decision.
To control for type of industry we used a binary variable (yes/no), representing the
service sector (SER).
We made an analysis of reliability for variables that were obtained by multi-item
indicators. We used the standardized Kuder-Richardson Formula 20 (KR-20)
estimated, which is a special form of coefficient alpha that is applicable when items are
dichotomous [Kuder and Richardson, 1937]. The KR-20 obtained are: for technology
readiness (KR-20 = 0.78), technology integration (KR-20 = 0.92), security applications
(KR-20 = 0.71) and access to the IT system of the firm (KR-20 = 0.73). All of KR-20 are
higher than the generally accepted level of adequacy of 0.60 [Nunnally and Bernstein,
1994]. These results suggest that all of the factors are considered to be satisfactory for
the reliability of multi-item scale.
3.4. Estimation results
Initially we estimated a bivariate probit model with sample selectivity. No support was
found to the existence of selectivity in our sample, at the usual 5% significance level (p-
value=0.12). Since the two adoption decisions are uncorrelated, we can estimate our

Chapter 3 - Determinants of web site and e-commerce adoption in Portugal
29
model with two single probit models. Table 3.1 reports the estimation results. We also
estimated two logit models. As expected, the results are analogous.
Goodness-of-fit is assessed in three ways. First, to analyze the joint statistical
significance of the explanatory variables we computed the likelihood ratio test.
Secondly, we use the Hosmer-Lemeshow test [Hosmer and Lemeshow, 2000], which
compares the fitted expected values of the model to the actual values. For web site
adoption and for e-commerce adoption, there is no support to reject both models.
Finally, the discrimination power of the model is evaluated using the area under the
ROC curve, which is equal to 83% and 75% for web site and e-commerce adoption,
respectively. This reveals an excellent discrimination for both models [Hosmer and
Lemeshow, 2000]. The three statistical procedures reveal a substantive model fit, a
satisfactory discriminating power and there is evidence to accept an overall
significance of the model.
Table 3.1: Estimated results
Explanatory variables Probit (sequential equations)
Web site (y 1) E-commerce (y 2) Coef. Coef.
Technology context - Technology readiness (TR) 0.699*** -0.055 - Technology integration (TI) 0.008 0.087*** - Security applications (SA) 0.087*** 0.040 Organization context Firm size (S1 is reference variable): - medium-size firms (S2) 0.064 -0.056 - large firms (S3) 0.263*** 0.158 - Perceived benefits of electronic correspondence (PBEC) 0.166** 0.168** - IT training (ITTP) 0.274*** 0.112 - Access to the IT system of the firm (AITSF) 0.170*** 0.099** - Internet and e-mail norms (IEN) 0.152** 0.024 Main perceived obstacle +: - Goods and services are not susceptible of being sold through the Internet nc -0.707***
Competitive pressure - site competitive pressure (WEBP) 0.021*** nc - e-commerce competitive pressure (ECOMP) nc 0.029*** Controls - service sector (SER) -0.122* 0.299*** Constant -1.367*** -1.792*** Sample size n1=2,626 n2=1,773 Note: nc means that the variable is not considerate; * p-value<0.10; ** p-value<0.05; *** p-value<0.01; +the other main perceived obstacles are not statistically significant in the model.
Hypotheses H1a-H10a and H1b-H10b were tested analyzing the sign and the statistical
significance of the coefficients of the two adoption decision models. As can be seen
from Table 3.1, for the web site adoption decision model all the coefficients have the
expected signs and the only explanatory variable that is not statistically significant is
technology integration. We can identify eight relevant drivers of web site adoption;
technology readiness and security application reflecting the technological context; firm

Chapter 3 - Determinants of web site and e-commerce adoption in Portugal
30
size, perceived benefits of electronic correspondence, IT training programs, access to
the IT system of the firm and Internet and e-mail norms, representing the organization
context; web site competitive pressure characterizing the environmental context. We
can conclude that hypothesis H1a, H3a, H4a, H5a, H6a, H7a, H8a and H10a are
confirmed and no support was found for H2a. For the e-commerce adoption model, the
estimated coefficients also have the anticipated signs: technology integration has a
positive effect on the e-commerce adoption probability; perceived benefits of electronic
correspondence, access to the IT system of the firm and e-commerce competitive
pressure are also important drivers of e-commerce adoption. Moreover, our results
indicate that goods and/or services provided by the company that are not susceptible of
being sold through the Internet is the most important obstacle of e-commerce adoption.
As a whole, the results substantiate all hypotheses formulated for the e-commerce
adoption model except H1b, H3b, H4b, H6b and H8b.
3.5. Conclusions
In this study we have proposed a conceptual model based on TOE theoretical
framework to analyze the determinants of two different adoption decisions. At the basic
level, we considered the adoption of a simple information technology, the web site and
at the more advanced level, a complex technology is contemplated: e-commerce.
While IT adoption models have been widely discussed and studied in theory and
practice, few empirical publications exist for southern European countries like Portugal.
We examined 2,626 firms representative of the Portuguese private economic sectors
(except the financial one) and the major findings are the following: (1) from our
empirical results, by statistical tests, we conclude that the two adoption decisions are
taken at different stages; (2) the relevant facilitators and inhibitors of web site and e-
commerce adoption decision found in our study for Portuguese firms are, in general,
similar to those obtained in other IT adoption studies [Al-Qirim, 2007, Hong and Zhu,
2006, Zhu et al., 2006b]; (3) in particular, our results suggest that organizational factors
like perceived benefits and access to firms IT system contribute to both adoption
decision process. Similarly, competitive pressure, an environmental factor, significantly
influences both adoption decisions, meaning that competitive pressure is an important
innovation-diffusion driver in these two stages of adoption; (4) other variables have
limited influence: technology readiness as a component of technological factors, firm

Chapter 3 - Determinants of web site and e-commerce adoption in Portugal
31
size, IT training programs and Internet and e-mails norms as organizational factors,
had a significant effect on web site adoption decision but had no effect on e-commerce
adoption. This indicates that once a firm decides to own a web site, these variables
become less important for e-commerce purpose. On the other hand, technology
integration has a relevant impact on e-commerce adoption decision but is not important
within the web site adoption model, meaning that for e-commerce adoption
technologies that help improve firm performance by reduced cycle time, improved
customer service, and lowered procurement costs are needed [Barua et al., 2004].
In terms of policy implications, the above findings suggest that a key factor is the
improvement of IT skills at the basic and higher levels. This can be achieved by
lowering, through different types of policy instruments, the IT training cost, and by
promoting a closer relationship between firms, associations and education institutions.
With the cost of infrastructure technology decreasing, the lack of qualified IT human
resources is probably one of the major constraints for Portuguese firms’ technology
readiness improvement.
Our study also has important implications for managers who are involved in processes
of introducing simple and complex IT innovations into their organizations. First,
managers should be aware that technology readiness constitutes both physical
infrastructure and intangible knowledge such as IT skills. This urges top leaders to
foster managerial skills and human resources that possess knowledge of these new
information technologies. Secondly, our study sought to help firms become more
effective in moving from a traditional channel to the Internet by identifying the profile of
early web site and e-commerce adopters. For non-adopters, it provides a mechanism
for self-evaluation. For firms that are already web site adopters, in the development of
strategies for e-commerce adoption, it is fundamental to recognize that e-commerce
requires enhanced technology integration between the existing applications and the
Internet platform.
The cross-sectional nature of this study does not allow knowing how this relationship
will change over time. To solve this limitation the future research should involve panel
data.

Chapter 3 - Determinants of web site and e-commerce adoption in Portugal
32

Chapter 4 - A comparison of web site adoption in small and large Portuguese firms
33
Chapter 4 – A comparison of web site adoption in sm all
and large Portuguese firms
4.1. Introduction
New information technology (IT), such as Internet enables firms to do businesses in a
different way [Porter, 2001]. In order to strength the potential of the Internet, firms are
establishing their presence on the Web: in 2005, the overall percentage of enterprises in
the European Union (EU) with a web site is 61%, but notably higher for larger firms (90%)
than for small firms (56%). Significantly differences also exist between Member States:
while the leader countries, Sweden and Denmark, are already reaching the saturation level
for large firms (97%), countries like Portugal (75%) and Latvia (65%) are far away from this
adoption level. For small firms, this difference is greater: the web site adoption level is 80%
for Sweden compared with the 33% level for Portugal [Eurostat, 2006]. Do Portuguese
small firm managers realize the strategic value of owning a web-site in the same manner
as large firm managers? Or have they encountered specific barriers to its implementation?
Some studies have been done to understand the differences in IT adoption among
European Countries [Zhu et al., 2003] and much research attempted to comprehend the
relationship between firms size and IT adoption decision [Lee and Xia, 2006]. Some
authors [Grandon and Pearson, 2004, Premkumar, 2003] suggested that the research
findings on large businesses cannot be generalized to small and medium-sized enterprises
(SMEs) because of the unique characteristics of SMEs as for example the lack of business
and IT strategy, limited access to capital resources and poor information skills. While there
exist an interesting and growing literature addressing the determinants of IT adoption in
the specific context of SMEs [Harindranath et al., 2008, Parker and Castleman, 2007] and
a limited research for micro firms [Clayton, 2000], only a reduced number of studies
[Daniel and Grimshaw, 2002] attempt to compare directly the approaches of small and
large firms to this new domain. Our work seeks to fill this gap in the literature, by analysing
the relative importance of the factors that enable or inhibit web site adoption by small firms
compared with large firms. The two main purposes of this study are the following:
� To examine the importance of technology-organisation-environment (TOE) related
factors as fundamental determinants of web site adoption;

Chapter 4 - A comparison of web site adoption in small and large Portuguese firms
34
� To analyze if the relative importance of such factors is different for small and large
firms.
To achieve these research objectives we used a rich data set of 637 large firms and 3,155
small firms that are representative of Portuguese economy. The understanding of the
determinants of web site adoption, at firm level, may be a useful tool in addressing the
right type of policy measures to stimulate the use of Internet business solutions, with the
aim of enhancing the competitiveness and productivity of Portuguese firms [Bertschek et
al., 2006, Black and Lynch, 2001, Bresnahan et al., 2002, Brynjolfsson and Hitt, 2000,
Dedrick et al., 2003, Konings and Roodhooft, 2002, Martins and Raposo, 2005, Zhu and
Kraemer, 2002]. This is particularly needed in the case of Portugal which, for several
reasons, has been suffering from a serious lack of competitiveness in comparison to other
industrialized economies. Our work has two important contributions: the first is related to
the very limited research on comparing the determinants of IT adoption in small and large
firms. Secondly, we present useful results for Portugal where there are few published
studies on the subject [Parker and Castleman, 2007]. The next section presents the
theoretical framework based on TOE approach. Then, the proposed hypotheses are tested
using an econometric model. Finally, we present major findings and conclusions.
4.2. Theoretical framework and conceptual model
In this study we used the TOE framework, developed by Tornatzky and Fleisher (1990)
and applied in many empirical studies related to IT innovations. The TOE model identifies
three aspects that influence the adoption and implementation of technical innovations by
firms: technological characteristics including factors related to internal and external
technologies of firms; organizational factors relating to firm size and scope, characteristics
of the managerial structure of the firm, quality of human resources; and environmental
factors that incorporate industry competitiveness features. This theoretical background is
the one used by Kuan and Chau [2001] and Premkumar and Ramamurthy [1995] to
explain electronic data interchange (EDI) adoption and by Thong [1999] to explain
information systems (IS) adoption and Hong and Zhu [2006] to explain e-commerce
adoption. Empirical findings from these studies confirmed that TOE methodology is a

Chapter 4 - A comparison of web site adoption in small and large Portuguese firms
35
valuable framework to understand the IT adoption decision. In accordance with TOE
theory, we developed in the next subsection a conceptual framework for web site adoption
(see Figure 4.1).
Technology Context
Web site
Adoption
Organization Context
Environment context
Controls
Internet and E-mail Norms
Access to the IT System of
the Firm
Perceived Benefits of
Electronic Correspondence
IT Training Programs
Internal Security Applications
Technology Integration
Technology Readiness
Industry
H1
H2
H7
H6
H5
H4
H3
web site competitive
pressure
H8
Figure 4.1 . Conceptual framework for web site adoption
4.2.1. Technology context
Technology readiness can be defined as technology infrastructure and IT human
resources. Technology readiness “is reflected not only by physical assets, but also by
human resources that are complementary to physical assets” [Mata et al., 1995].
Technology infrastructure establishes a platform on which Internet technologies can be
built; IT human resources provide the knowledge and skills to develop web applications
[Zhu and Kraemer, 2005]. Theoretical assertions on the impact of Technology readiness

Chapter 4 - A comparison of web site adoption in small and large Portuguese firms
36
on IT adoption are supported by several empirical studies, based on data sets
representative of all sizes of firms [Hong and Zhu, 2006, Zhu et al., 2003, Zhu et al.,
2006b]. These results were also confirmed within the specific context of SMEs [Al-Qirim,
2007, Dholakia and Kshetri, 2004, Kuan and Chau, 2001, Mehrtens et al., 2001].
Therefore, in general we expected that firms with greater technology readiness are in a
better position to adopt web sites. However, as suggested by others authors [Daniel and
Grimshaw, 2002, Parker and Castleman, 2007, Premkumar, 2003], this factor will probably
affect in a different way small and large firms.
H1: The level of technology readiness is positively associated with web site adoption
but the impact will vary between large and small firms
Before the Internet, firms had been using technologies to support business activities along
their value chain, but many were ‘‘islands of automation’’— they lacked integration across
applications [Hong and Zhu, 2006]. The characteristics of the Internet may help eradicate
the incompatibilities and rigidities of legacy information systems (IS) and accomplish
technology integration among various applications and databases. Evidence from the
literature suggests that integrated technologies may enhance firm performance by
reducing cycle time, improving customer service, and lowering procurement costs [Barua
et al., 2004]. We define technology integration as the systems for managing orders that
are automatically linked with other IT systems of the firm. This type of factor where also
identified by Al-Qirim [2007] for the specific case of SMEs. Therefore, we expect firms with
a higher level of technology integration to be those who adopt web sites sooner. However,
probably there will be significantly differences between small and large firms [Daniel and
Grimshaw, 2002]. These reflections lead to the following hypothesis:
H2: The level of technology integration is positively associated with web site
adoption, but the impact will vary between small and large firms
The lack of security may slow down technological progress. For example, for Portugal in
2002 this was the greatest barrier to Internet use [Martins and Oliveira, 2005] and in China
it is one of the most important barriers to the adoption of e-commerce [Tan and Ouyang,
2004]. We expect firms with a higher level of internal security applications to be more
probable web site adopters. Within this context, there is no empirical evidence suggesting
a same behaviour between small and large firms. Therefore we stipulate the following:

Chapter 4 - A comparison of web site adoption in small and large Portuguese firms
37
H3: Internal security applications are positively associated with web site adoption,
but the impact will probably vary between small and large firms
4.2.2. Organization context
Empirical studies consistently found that perceived benefits have a significant impact in IT
adoption. This result is validated for medium to large firms [Beatty et al., 2001], for SMEs
[Iacovou et al., 1995, Kuan and Chau, 2001] and for all size firms [Gibbs and Kraemer,
2004]. However, as suggested by Daniel and Grimshaw [2002] small firms and large firms
perceived these benefits in a different. We examine perceived benefits of electronic
correspondence and we postulate that:
H4: Perceived benefits of electronic correspondence is positively related with web
adoption, but the impact will vary between small and large firms
The presence of skilled labour in a firm increases its ability to absorb and make use of an
IT innovation, and therefore is an important determinant of IT diffusion [Caselli and
Coleman, 2001, Hollenstein, 2004, Kiiski and Pohjola, 2002]. Since the successful
implementation of new IT usually requires complex skills, we expect firms with more IT
training programs to be more likely to adopt web site. However, there will probably be
differences between firms due to the limited IT budgets of small firms. We postulate the
following:
H5: IT training programs are positively associated with web site adoption, but the
impact will vary between small and large firms
The fact that workers can have access to the IT system from outside of the firm reveals
that the organisation is prepared to integrate its technologies. However, this factor is
expected to influence in a different way small firms, where the number of employees is
small and their presence at the place of work is more important than for large firms. We
postulate that:
H6: The level of access to the IT system from outside of the firm is positively
associated with web site adoption, but the impact will vary between small and large
firms

Chapter 4 - A comparison of web site adoption in small and large Portuguese firms
38
Regulatory environment has been acknowledged as a critical factor influencing innovation
diffusion [Zhu et al., 2003, Zhu et al., 2006b, Zhu et al., 2004]. Firms often refer
inadequate legal protection for online business activities, unclear business laws, and
security and privacy as concerns in using web technologies [Kraemer et al., 2006]. We
postulate that for small firms, this concern will probably be different from their large
counterparts.
H7: The presence of Internet and e-mail norms is positively associated with web site
adoption, but the impact will vary between small and large firms
4.2.3. Environment context
Empirical evidence suggests that competitive pressure is a powerful driver of IT adoption
and diffusion [Gibbs and Kraemer, 2004, Hollenstein, 2004, Zhu et al., 2004] and this fact
is also verified in small business research [Al-Qirim, 2007, Dholakia and Kshetri, 2004,
Grandon and Pearson, 2004, Iacovou et al., 1995, Kuan and Chau, 2001]. Therefore, we
expect the probability of adopting a web site to be positively influenced by the proportion of
web site adopters in the industry or sector to which the specific firm is affiliated. However,
some studies suggested that competitive pressure will be more significant in causing small
firms to adopt an IT than for larger firms, since they need to protect their competitive
position [Daniel and Grimshaw, 2002]. Therefore, we assume that:
H8: The level of web site competitive pressure is positively associated with web site,
but the impact will vary between small and large firms
4.2.4. Controls
We control, as usual, for industry or economic sector effects. We used a dummy variable
to control for data variation that would not be captured by the explanatory variables
mentioned before.

Chapter 4 - A comparison of web site adoption in small and large Portuguese firms
39
4.3. Data and methodology
4.3.1. Data
The data used in this study were provided by National Institute of Statistics (INE) and
result from the survey on the Use of Communication and Information Technologies in
Firms (IUTICE) in 2006. In our study we defined that small firms have less than 50
employees and large firms have more than 250 employees. Our sample consists on 3,155
small and 637 large firms and is representative of the Portuguese private sector excluding
the financial one.
4.3.2. Methodology
We estimated the following Probit Model:
P(y=1/x)=Ф(xβ) (4.1)
Where y=1 if firm decided to adopt a web site, and zero otherwise, x is the vector of
explanatory variables, β the vector of unknown parameters to be estimated, and Φ(.) is the
standard normal cumulative distribution. To analyse and compare the influence of each
factor on the probability of being a web site adopter, we need to compute the marginal
effect of xj. This effect is obtained, for the continuous variables, using the formula given by:
( ) ( )1 /j
j
P yx φ β∂ = =∂
xxβ (4.2)
For the binary explanatory variables it is given by:
( ) ( ) ( )1/| , 1 | , 0j j
j
P yx xx
∆ = = Φ = − Φ =∆x
xβ x xβ x (4.3)
where φ(.) is the density standard normal distribution.
The vector of explanatory variables (x) includes:
A technology readiness (TR) index that was built by aggregating 8 items on technologies
used by the firm (on a yes/no scale): computers, e-mail, intranet, extranet, own networks

Chapter 4 - A comparison of web site adoption in small and large Portuguese firms
40
that are not the Internet (own exclusive networks), wired local area network [Lange et al.],
wireless LAN, wide area network (WAN), and one item standing for existence of IT specific
skills in the firm (on a yes/no scale) [Zhu et al., 2004]. The first 8 items represent the
penetration of traditional information technologies, which formed the technological
infrastructure [Kwon and Zmud, 1987]. The last item represents IT human resources [Mata
et al., 1995]. To aggregate the items we used multiple correspondence analyses (MCA).
The MCA is a method of “multidimensional exploratory statistic” that is used to reduce the
dimension when the variables are binary. For more details see [Johnson and Wichern,
1998]. The first dimension explains 50% of inertia. In the negative side of the first axis we
have variables that represent firms that do not use IT infrastructures and do not have
workers with IT skills. On the positive side we have the variables that represent the use of
infrastructures and workers with IT skills. Cronbach’s α, the most widely used measure for
assessing reliability (Chau, 1999), is equal to 0.88, indicating adequate reliability.
Reliability measures the degree to which items are free from random error, and therefore
yield consistent results.
Technology integration (TI) was measured by the number of IT systems for managing
orders that are automatically linked with other IT systems of the firm (see Appendix A).
The variable ranges from 0 to 5. This variable reflects how well the IT systems are
connected on a common platform.
Internal security applications (ISA) was measured by the numbers of the use of internal
security applications in the firms (see Appendix A). The variable range from 0 to 6.
Perceived benefits of electronic correspondence (PBEC) was measured by the shift from
traditional postal mail to electronic correspondence as the main standard for business
communication, in the last 5 years (on a yes/no scale).
IT training programs (ITTP) is also a binary variable (yes/no) related to the existence of
professional training in computer/informatics, available to workers in the firm.
Access to the IT system of the firm (AITSF) was measured by the number of places from
which workers access the firms information systems (see Appendix A). The variable
ranges from 0 to 4.

Chapter 4 - A comparison of web site adoption in small and large Portuguese firms
41
Internet and e-mail norms (IEN) was measured by whether firms have defined norms
about Internet and e-mail (on a yes/no scale).
Web site competitive pressure (WEBP) is computed as the percentage of firms in each of
the 9 industries that had already adopted a web site two years before the time of the
survey, i.e. in 2004. As in Zhu et al. (2003) the rationality underlying our model is that an
observation of the firm on the adoption behaviour of its competitors influences its own
adoption decision.
Services (SER) is a binary variable (yes/no) equal one if firm belong to the service sector.
4.4. Estimation results
The web site adoption model is estimated using maximum likelihood. The estimation
results for small and large firms are presented in Table 4.1.
Goodness-of-fit is assessed in three ways. First, we used log likelihood ratio test, which
reveals that our models are globally statistic significant. Secondly the discrimination power
of the model is evaluated using the area under the receiver operating characteristic (ROC)
curve, which is equal to 90.9% and 78.0% for small and large firms, respectively. Finally,
the R2 shows that the percentage explained by the model is 41.9% for small firms and
15.7% for large firms. The three statistical procedures reveal a substantive model fit, a
satisfactory discriminating power and there is evidence to accept an overall significance of
the model.
Hypotheses H1-H8 were tested analysing the sign, the magnitude, the statistical
significance of the coefficients and the marginal effects. As can be seen from Table 4.1, for
small firms, the estimation results suggested that all the coefficients have the expected
signs and the only independent variable that is not statistically significant is the access to
the IT system of the firm (AITSF). We can identify seven relevant drivers of web site
adoption for small firms: technology readiness (TR), technology integration (TI) and
internal security application (ISA) reflecting the technological context; perceived benefits of
electronic correspondence (PBEC), IT training programs (ITTP) and Internet and e-mail

Chapter 4 - A comparison of web site adoption in small and large Portuguese firms
42
norms (IEN), representing the organization context; web site competitive pressure
(WEBP), concerning the environmental context. For large firms, we identify four significant
factors influencing web site adoption decision: technology readiness (TR), IT training
programs (ITTP), access to the IT system of firms (AITSF) and web site competitive
pressure (WEBP). In both cases, as expected, the economic sector is a relevant factor
(SER).
Table 4.1: Estimated coefficients for web site adoption model Small firms Large firms
Technological context - Technology readiness (TR) 1.044*** 0.346* - Technology integration (TI) 0.069*** -0.028 - Internal security applications (ISA) 0.170*** 0.038 Organizational context
- Perceived benefits of electronic correspondence (PBEC) 0.293*** -0.039 - IT training programs (ITTP) 0.235*** 0.644*** - Access to the IT system of the firm (AITSF) 0.044 0.278*** - Internet and e-mail norms (IEN) 0.379*** 0.165 Environmental context
- Web site competitive pressure (WEBP) 0.011*** 0.017*** Controls
- Services (SER) 0.185*** 0.306** Constant -1.742*** -1.041***
Sample size 3,155 637 LL -1038.5 -223.3 R2 0.419 0.157 AUC 0.909 0.779
Note: * p-value<0.10; ** p-value<0.05; *** p-value<0.01.
The estimated marginal effects for the determinants of web site adoption model, for small
and large firms, are reported in Table 4.2.
Table 4.2: Estimated marginal effects for web site adoption model Small firms Large firms
Technological context
- Technology readiness (TR) 0.252*** 0.064*
- Technology integration (TI) 0.017*** -0.005
- Internal security applications (ISA) 0.041*** 0.007
Organizational co ntext
- Perceived benefits of electronic correspondence (PBEC) 0.079*** -0.007
- IT training programs (ITTP) 0.061*** 0.144***
- Access to the IT system of the firm (AITSF) 0.011 0.051***
- Internet and e-mail norms (IEN) 0.100*** 0.032
Environmental context
- Web site competitive pressure (WEBP) 0.003*** 0.003***
Controls
- Services (SER) 0.044*** 0.056**
Note: * p-value<0.10; ** p-value<0.05; *** p-value<0.01.

Chapter 4 - A comparison of web site adoption in small and large Portuguese firms
43
Their comparison reveals that, as expected, most of the marginal effects vary between
small and large firms. The exception is the web site competitive pressure impact that is the
same for small and large firms. Therefore hypotheses H1-H7 are validated and H8 is not
confirmed.
There are three additional aspects to be noted here. Firstly, the technological context is
much more relevant for small firms than for large firms. Secondly, within organizational
context, perceived benefits and Internet e-mail norms are more important to determine
web site adoption for small firms than for their larger counterparts. Finally, the access to
the IT system of the firm is relevant only for large firms. As a whole, our results are in
accordance with those reported in studies comparing IT adoption in large and small firms
[Daniel and Grimshaw, 2002]. However, the limited number of research in this specific
domain difficult the generalization of the results.
4.5. Conclusions
Within the context of an increased use of Internet business solutions, such as web sites,
this study fills a gap in the literature by comparing the relative importance of the factors
influencing the adoption of web sites for small and large firms. The theoretical framework
incorporates most of the facilitators and inhibitor factors identified in other studies. The
research model evaluates, for small and large firms, the impact of three technological
factors, four organizational factors and one environmental factor on the web site adoption
decision. Using a representative sample of Portuguese small and large firms, the
estimation results for this comparative study reveal that the important determinants of web
site adoption decision vary with size of a firm. Other studies in this domain [Daniel and
Grimshaw, 2002, Premkumar, 2003] also suggested that the problems, opportunities, and
management issues encountered by small business in the IT area are different from those
faced by their larger counterparts. However, our study provides a more in depth analysis
since it identifies those factors that more or less relevant for large/small firms and
quantifies its impact on web site adoption decision. These findings have practical
implications for managers and policy makers. Firstly, policy makers should be conscious
that the motivations towards the IT adoption are different for small and large firms.
Therefore, government initiatives, such as the Technological Plan, for Portugal, must be

Chapter 4 - A comparison of web site adoption in small and large Portuguese firms
44
different for small and large firms, namely those related to procurement incentives.
Secondly, managers should be aware that technology readiness constitutes both physical
infrastructure and intangible knowledge such as IT skills. This urges top leaders (mainly in
small firms) to foster managerial skills and human resources that possess knowledge of
these new information technologies. Therefore, there is a business opportunity for IT firms
to establish the service that support the small size firms in the technological context. In our
opinion this is particularly important in Portugal given the relative importance of small
businesses in the economy (Vicente and Martins, 2008). Finally, our study sought to help
firms become more effective in moving from a traditional channel to the Internet by
identifying the profile of early web site adopters.
As in most empirical studies, our work is limited in several ways. The cross-sectional
nature of this study does not allow knowing how this relationship will change over time. To
solve this limitation the future research should involve panel data. Another limitation of our
work is that it only investigates web site adoption decision. To provide a more balanced
view of firms’ IT adoption decision, other Internet business solutions, such as e-commerce
should also be examined.

Chapter 5 - Determinants of E-commerce adoption by Small Firms in Portugal
45
Chapter 5 – Determinants of e-commerce adoption by
small firms in Portugal
5.1. Introduction
Small firms play a significant role in Portuguese economy. In 2005 they comprised 99.0%
of the enterprises and accounted for 66.8% of the total employment and 37.7% of the
added value [INE, 2007]. Nonetheless, the productivity of Portuguese small firms is one of
the lowest in the European Union [OECD, 2006]. With regard to information technology
use amongst Portuguese small firms, in 2006 computer penetration rate was high for firms
with 10 to 49 workers (90%), but relatively low for micro-firms, i.e, those with fewer than 10
workers (55%). The adoption of Internet related technologies by small firms is still
relatively low when compared with large firms (i.e, those with more than 250 workers):
60% of the small firms have adopted the Internet compared with 100% for large firms; 25%
owned a web site (75%, for large firms) and only 3.8% sell and purchase products and
services over the Internet, compared with 48% for their larger counterpart [UMIC, 2007].
The main purposes of this study are the following: (1) to examine the importance of
technology-organization-environment (TOE) related factors as fundamental determinants
of Internet (first phase), web site (second phase) and e-commerce (third phase) adoption;
(2) to analyze the extent to which the pattern of TOE factors varies with the phase of
adoption. To achieve these research objectives, we used a rich data set of 3,155 firms that
are representative of Portuguese firms with fewer than 50 employees in 2006, (excluding
the financial service sector). The understanding of the determinants of Internet, web site
and e-commerce adoption, at firm level, may be a useful tool in addressing the right type
of policy measures in order to stimulate the use of e-commerce. This is particularly needed
in the case of Portugal, which suffers from a serious lack of competitiveness in comparison
to other industrialized economies. This article is intended as a contribution to the empirical
literature on the determinants of e-commerce adoption by small firms, for two main
reasons. First, we study the determinants of the adoption decision at different stages of e-

Chapter 5 - Determinants of E-commerce adoption by Small Firms in Portugal
46
commerce involvement, a topic that is still quite limited. Second, we take Portugal as a
country of application for which there are few published studies on the subject.
5.2. Conceptual framework and hypothesis
We propose a framework in which firms gain experience and knowledge in a sequence of
stages (Daniel and Grimshaw, 2002, Dholakia and Kshetri, 2004). In the first stage of a
project the firm gains experience, which it can use to move on to the second stage, at
which point it will gain further experience. Stage models have been used in only a limited
number of studies related to Internet and e-commerce adoption (Daniel and Grimshaw,
2002, Martin and Matlay, 2001). The stage model states that the engagement with e-
commerce is sequential and progressive. The sequence begins with the use of e-
mail/Internet, and progresses through web site development to the buying, selling and
payment mechanism of e-commerce. We suggest a three-phased involvement approach
to e-commerce adoption: Internet (has an Internet connection), web site (owns a web site)
and e-commerce (sells on the Internet). The analysis of the major determinants of e-
commerce adoption decision is based on the TOE model [Tornatzky and Fleischer, 1990].
We identify three features that may influence Internet, web site, and e-commerce adoption:
technological context (technology readiness, technology integration, and security
applications); organization context (firm size, perceived benefits of electronic
correspondence, IT training programmes, access to the IT system of the firm, Internet and
e-mail norms, and main perceived obstacle); and environment context (competitive
pressure). In accordance with the TOE theory, we develop a conceptual framework for
Internet, web site, and e-commerce adoption (see Figure 5.1).

Chapter 5 - Determinants of E-commerce adoption by Small Firms in Portugal
47
Figure 5.1 . Conceptual Framework for Internet, web site, and e-commerce adoption
5.2.1. Technology context
Technology readiness can be defined as technology infrastructure and IT human
resources [Mata et al., 1995]. Technology infrastructure establishes a platform on which
Internet technologies can be built; IT human resources provide the knowledge and skills to
develop web applications [Zhu and Kraemer, 2005]. Theoretical assertions are supported
by several empirical studies [Armstrong and Sambamurthy, 1999, Hong and Zhu, 2006,
Iacovou et al., 1995, Kwon and Zmud, 1987, Pan and Jang, 2008, Zhu, 2004b, Zhu et al.,
2003, Zhu and Kraemer, 2005, Zhu et al., 2006b].
H1b and H1c. The level of technology readiness is positively associated with web
site and e-commerce adoption
Before the Internet became available, firms had been using technologies to support
business activities along their value chain, but many were ‘‘islands of automation’’- they
lacked integration across applications [Hong and Zhu, 2006]. Evidence from the literature
suggests that integrated technologies help improve firm performance through reduced
cycle time, improved customer service, and lowered procurement costs [Barua et al.,
2004]. As a complex technology, e-business demands close coordination of various

Chapter 5 - Determinants of E-commerce adoption by Small Firms in Portugal
48
components along the value chain. Correspondingly, a greater integration of existing
applications and the Internet platform represent a greater capacity for conducting business
over the Internet [Al-Qirim, 2007, Mirchandani and Motwani, 2001, Premkumar, 2003, Zhu
et al., 2006b].
H2b and H2c. The level of technology integration is positively associated with web
site and e-commerce adoption
The lack of security may down technological progress. For example, for Portugal in 2002
this was the greatest barrier to Internet use [Martins and Oliveira, 2005], and in China it is
one of the most important barriers to the adoption of e-commerce [Tan and Ouyang,
2004].
H3b and H3c. Security applications are positively associated with web site and e-
commerce adoption
5.2.2. Organization context
Firm size is one of the most commonly studied determinants of IT adoption [Lee and Xia,
2006]. Several empirical studies indicate that there is a positive relationship between the
variables [Pan and Jang, 2008, Premkumar et al., 1997, Thong, 1999, Zhu et al., 2003].
H4a and H4b. Firm size is positively associated with web site and e-commerce
adoption
Empirical studies have consistently found that perceived benefits have a significant impact
on IT adoption [Beatty et al., 2001, Gibbs and Kraemer, 2004, Iacovou et al., 1995, Kuan
and Chau, 2001, Lin and Lin, 2008].
H5a, H5b and H5c. Perceived benefits of electronic correspondence are positively
related with Internet, web site, and e-commerce adoption
The presence of skilled labour in a firm increases its ability to absorb and make use of an
IT innovation, and therefore is an important determinant of IT diffusion [Caselli and
Coleman, 2001, Hollenstein, 2004, Kiiski and Pohjola, 2002].
H6a, H6b and H6c. IT training programs are positively associated with Internet, web
site, and e-commerce adoption

Chapter 5 - Determinants of E-commerce adoption by Small Firms in Portugal
49
The fact that workers can have access to the IT system from outside of the firm reveals
that the organization is prepared to integrate its technologies [Mirchandani and Motwani,
2001].
H7b and H7c. The level of access to the IT system from outside of the firm is
positively associated with web site and e-commerce adoption
Regulatory environment has been acknowledged as a critical factor influencing innovation
diffusion [Zhu et al., 2003, Zhu and Kraemer, 2005, Zhu et al., 2006b, Zhu et al., 2004].
Firms often mention inadequate legal protection for online business activities, unclear
business laws, security, and privacy as concerns in using web technologies [Kraemer et
al., 2006]. We used Internet and email norms as a proxy for regulatory environment.
H8a, H8b and H8c. The presence of Internet and e-mail norms is positively
associated with Internet, web site, and e-commerce adoption
Perceived obstacles are particularly important because the adoption process may be
complicated and costly [Hong and Zhu, 2006, Pan and Jang, 2008, Zhu et al., 2006b].
H9c. The main perceived obstacle is negatively associated with e-commerce
adoption
5.2.3. Environment context
Competitive pressure refers to the degree of pressure felt by the firm from competitors
within the industry. Porter and Millar (1985) analysed the strategic rationale underlying
competitive pressure as an innovation-diffusion driver. They suggested that, by using a
new innovation, firms might be able to alter the rules of competition, affect the industry
structure, and leverage new ways to outperform rivals, thus changing the competitive
landscape. This analysis can be extended to IT adoption. Empirical evidence suggests that
competitive pressure is a powerful driver of IT adoption and diffusion [Al-Qirim, 2007,
Gibbs and Kraemer, 2004, Hollenstein, 2004, Iacovou et al., 1995, Mehrtens et al., 2001,
Zhu et al., 2003].
H10a. The level of Internet competitive pressure is positively associated with Internet
adoption

Chapter 5 - Determinants of E-commerce adoption by Small Firms in Portugal
50
H10b. The level of web site competitive pressure is positively associated with web
site adoption
H10c. The level of e-commerce competitive pressure is positively associated with e-
commerce adoption
5.3. Data and methodology
5.3.1. Data
This study follows a field survey methodology. The sample unit in this questionnaire is the
firm. The base of sampling is firm population that operates in Portugal, with fewer than 50
employees and with start-up dates before 2005. Our database was developed by the
National Institute of Statistics (INE). The survey was conducted in the 1st semester of 2006
by a department specialized in data collection. The first contact with firms was by mail
and/or e-mail. To collect the data, INE used two different methods: paper questionnaire
(via mail) and electronic questionnaire (via web). The questionnaire design was made by
Eurostat following a discussion with all members. This questionnaire (Appendix B) was
adopted for Portugal by professionals involved in the project whose goal was to adapt it to
the national reality. Concerning cases of total or partial absence of response to a specific
question, no other treatment was applied other than confirmation with the firm. In fact,
according to the methodological recommendations of Eurostat, the situation of an operator
that “did not answer” or “does not know” the answer to a specific question should never
imply its imputation based on the answers of the other operators. For situations of no
answer to the questionnaire, we corrected the predicted (initial) sample, assuming that the
non -respondent units are non-selected units. In this way, the calculation of the weighting
factor is based on the sample obtained which is based on the number of responding firms.
We used a sample of 3,155 firms with fewer than 50 employees which is stratified by
economic sector (NACE classification), number of employees, and turnover.
Data presented in Figure 5.2 support the three-phased involvement approach. For
example, in the real estate and business activities, although 51.9% of firms with fewer than

Chapter 5 - Determinants of E-commerce adoption by Small Firms in Portugal
51
5 employees have adopted the Internet and 17.7% owned a web site, only about 1% sell
products and services over the Internet. However, significant differences exist in the level
of e-commerce involvement when firms are analysed by size and economic activities (9
industries are considered).
Figure 5.2 . e-commerce involvement by size and industry: Internet (dash), web site (grey) and e-commerce
(black)
5.3.2. Methodology
In our conceptual framework we examine the influence of several TOE factors on the
adoption decision at three adoption stages, as can be seen in see Figure 5.3.

Chapter 5 - Determinants of E-commerce adoption by Small Firms in Portugal
52
( ) ( )= = Λ1 1/P y 1 1 1x x β
( ) ( )= = Λ2 1/P y 2 2 2x x β
( ) ( )= = Λ3 1/P y 3 3 3x x β
Figure 5.3 . The different phases of IT adoption (Internet, web site, and e-commerce adoption)
Since the dependent variable is binary (to adopt or not), a logistic regression model is
developed. Similar models have been used in the information systems (IS) literature to
study electronic data interchange (EDI) adoption [Kuan and Chau, 2001] , IT outsourcing
[Bajwa et al., 2004], and e-business adoption [Pan and Jang, 2008, Zhu et al., 2003]. We
estimated the following logistic regression model, for phase adoption i, given by:
P(yi=1/x i)=Λ(x iβi) for i=1,2,3 (5.1)
Where y1 is Internet adoption, y2 is web site adoption, y3 is e-commerce adoption, x i is the
vector of the explanatory variables, βi the vector of unknown parameters to be estimated,
and Λ(.) is the logistic cumulative distribution. To analyse and compare the influence of
each factor on the probability of being an adopter, we need to compute the marginal effect
of each explanatory variable, xj. For the continuous variables, this effect is obtained using
the formula:
( ) ( )λ β∂ = =∂1/
jj
P yx
xxβ (5.2)
For the binary explanatory variables it is obtained with:
( ) ( ) ( )∆ = = Λ = − Λ =∆1|
, x 1 , x 1x j jj
P y xxβ | x xβ | x
(5.3)
Where λ(.) is the density logistic distribution. In equations (5.2) and (5.3) we dropped the
index i for simplicity. For more details see [Greene, 2008].

Chapter 5 - Determinants of E-commerce adoption by Small Firms in Portugal
53
Definition of explanatory variables (see Appendix B for further details).
� A technology readiness index was constructed by aggregating 8 items on
technologies used by the firm (on a yes/no scale): computers, e-mail, intranet,
extranet, own networks that are not the Internet (own exclusive networks), wired
local area network (LAN), wireless LAN, wide area network (WAN), and one item
standing for the existence of IT specific skills in the firm (on a yes/no scale). The
first 8 items represent the penetration of traditional information technologies, which
formed the technological infrastructure [Kwon and Zmud, 1987]. The last item
represents IT human resources [Mata et al., 1995]. To aggregate these 9 items
measured on a yes/no scale, we used multiple correspondence analyses (MCA).
The MCA is a method of “multidimensional exploratory statistic” that is used to
reduce the dimension when the variables are binary [Johnson and Wichern, 1998].
The first dimension explains 43% of inertia. In the negative side of the first axis we
have variables that represent firms that do not use IT infrastructures and do not
have workers with IT skills. On the positive side we have the variables that
represent the use of infrastructures and workers with IT skills. This resulting
variable reflects the technology readiness (Appendix C).
� Technology integration was measured by the number of IT systems for managing
orders that are automatically linked with other IT systems of the firm. The variable
ranges from 0 to 5. This variable reflects how well the IT systems are connected on
a common platform.
� Security applications was measured by the number of existing security applications
in the firms. The variable ranges from 0 to 6.
� Firm size was measured by three binary variables: (S1) micro firms (1 to 4
employees); (S2) very small firms (5 to 9 employees); (S3) small firms (10 to 49
employees).
� Perceived benefits of electronic correspondence was measured by the shift from
traditional postal mail to electronic correspondence as the main standard for
business communication, in the last five years (on a yes/no scale).
� IT training programmes is also a binary variable (yes/no) related to the existence of
professional training in computer/informatics, available to workers in the firm.

Chapter 5 - Determinants of E-commerce adoption by Small Firms in Portugal
54
� Access to the IT system of the firm was measured by the number of places from
which workers access the firms’ information systems. The variable ranges from 0 to
4.
� Internet and e-mail norms was measured by whether firms have defined norms
about Internet and e-mail (on a yes/no scale).
� Main perceived obstacles was measured by five dummy variables reflecting the
main problems faced in the implementation of e-commerce solution.
� Internet competitive pressure, web site competitive pressure, and e-commerce
competitive pressure are computed as the percentage of firms in each of the nine
industries that had already adopted Internet/ web site/e-commerce two years
before the time of the survey, i.e. in 2004. As in Zhu et al. (2003) the rationale
underlying our model is that an observation of the firm on the adoption behaviour of
its competitors influences its own adoption decision.
To control for type of industry we used a binary variable (yes/no), representing the service
sector.
5.4. Estimation results
For each dependent variable (Internet adoption decision; web site adoption decision; e-
commerce adoption decision), a logistic regression model was estimated by maximum
likelihood. The postulated hypotheses were tested analysing the sign and the statistical
significance of the estimated coefficients. Positive and significant coefficients imply that the
corresponding variable is an adopter facilitator. Negative and significant coefficients
indicate that the corresponding variables are adopter inhibitors.
For Internet adoption decision we considered only non technological factors in order to
avoid perfect colinearity between the dependent and explanatory variables.
As can be seen from Table 5.1, for the three adoption decision models, all the coefficients
have the expected signs. We can identify three organizational drivers of Internet adoption:
firm size, perceived benefits of electronic correspondence, and IT training programmes,
and one environmental driver: Internet competitive pressure. We conclude that hypotheses
H4a, H5a, H6a, and H10a are confirmed.

Chapter 5 - Determinants of E-commerce adoption by Small Firms in Portugal
55
Table 5.1: Estimation results
Dependent variable (1/0) Internet adoption Web site adoption
E-commerce
adoption
Coeff. p-value Coef. p-value Coef. p-value
Technology readiness nc 1.235*** 0.000 -0.030 0.917
Technology integration nc 0.125*** 0.001 0.147** 0.011
Security applications nc 0.163*** 0.000 -0.006 0.945
Firm size:
S1 (1-4 employees) reference reference reference reference reference reference
S2 (5-9 employees) 1.043*** 0.000 0.388** 0.012 0.449 0.192
S3 (10-49 employees) 2.243.*** 0.000 0.656*** 0.000 0.307 0.309
Perceived benefits of electronic
correspondence 4.043*** 0.000 0.481*** 0.001 0.195 0.397
IT training programmes 3.534*** 0.000 0.302** 0.027 0.256 0.303
Access to the IT system of the firm nc 0.167** 0.045 0.218* 0.056
Internet and e-mail norms nc 0.524*** 0.000 -0.102 0.670
Main perceived obstacles:
- Security problems and uncertainty about
the legal framing of Internet sales (PO1) nc nc reference reference
- Goods and/or services are not susceptible
to being sold through the Internet (PO2) nc nc -1.889*** 0.000
- Customers are not ready to buy through the
Internet (PO3) nc nc -0.622* 0.094
- Costs of the Internet sales system (PO4) nc nc -0.508 0.262
- None of these (PO5) nc nc -0.597 0.108
Internet competitive pressure 0.008* 0.084 nc nc
Web site competitive pressure nc 0.022*** 0.000 nc
E-commerce competitive pressure nc nc 0.057*** 0.007
Service Sector 0.793*** 0.000 0.405*** 0.001 0.534* 0.073
Constant -1.778*** 0.000 -3.016*** 0.000 -2.393*** 0.000
Sample size n = 3,155 n = 1,881 n = 801
LR 26 1240.80Χ = 0.000 2
11 605.54Χ = 0.000 215 93.70Χ = 0.000
Log likelihood -1507.72 - -980.27 - -294.93 -
Note: nc means that the variable is not considered in the analysis * p-value<0.10; ** p-value<0.05; *** p-value<0.01.
We identify nine relevant drivers of web site adoption: technology readiness, technology
integration and security application reflecting the technological context; firm size,
perceived benefits of electronic correspondence, IT training programmes, access to the IT
system of the firm, and Internet and e-mail norms, representing the organization context;

Chapter 5 - Determinants of E-commerce adoption by Small Firms in Portugal
56
web site competitive pressure characterizing the environmental context. We conclude that
all stipulated hypotheses for web site adoption decision are confirmed.
For e-commerce adoption, there are only three coefficients that are statistically significant
at the 5% level, suggesting that technology integration, main perceived obstacles, and e-
commerce competitive pressures are the only relevant factors. Moreover, our results
indicate that goods and/or services provided by the company that are not susceptible to
being sold through the Internet is the most important obstacle of e-commerce adoption. As
a whole, the results not support hypotheses H1c, H3c, H4c, H6c, and H8c.
To analyse the extent to which the results vary with the adoption phase (our second
research goal), we compared the size of the impact of each significant variable at the three
adoption phases. For this purpose, we used the estimated marginal effects computed from
equations (2) and (3) that are presented in Table 5.2.
There are two important things to be noted here. Firstly, the importance of the variables
varies with the phase of adoption. Secondly, for those factors that affect more than one
decision, the magnitude of the impact also varies with the phase of adoption. For example,
as can be seen in Table 5.2, technology integration, although being significant for web site
and e-commerce adoption decision, its marginal effect is twice as large for web site than
for e-commerce adoption decision. Our findings suggest an interesting and somewhat
expected result: the relative importance of technological and organizational factors
decreases with the adoption phase. Moreover, the environmental factor, although relevant
in both phases, has a greater impact in the last adoption phase.

Chapter 5 - Determinants of E-commerce adoption by Small Firms in Portugal
57
Table 5.2: Marginal effects for the logistic regression model
Variables Marginal effects
Internet Web site E-commerce
Technology readiness nc 0.300 ns
Technology integration nc 0.030 0.015
Security applications nc 0.040 ns
Firm size (S1 is the reference class):
S2 (5-9 employees) 0.149 0.095 ns
S3 (10-49 employees) 0.298 0.159 ns
Perceived benefits of electronic correspondence 0.306 0.119 ns
IT training programs 0.323 0.074 ns
Access to the IT system of the firm nc 0.041 0.022
Internet and e-mail norms nc 0.128 ns
Main perceived obstacles (Security problems and uncertainty
about the legal framing of Internet sales is the reference
class):
- Goods and/or services are not susceptible of being sold
through the Internet (PO2) nc nc -0.235
- Customers are not ready to buy through the Internet (PO3) nc nc -0.053
- Costs of the Internet sales system (PO4) nc nc ns
- None of these (PO5) nc nc ns
Internet competitive pressure 0.001 nc nc
Web site competitive pressure nc 0.005 nc
E-commerce competitive pressure nc nc 0.006
Service Sector (Manufacturing is the reference) 0.141 0.097 0.049
Note: nc means that the variable is not considered in the analysis, and ns means that the variable is not
statistically significant.
5.5. Discussion and conclusions
In this study we have proposed a conceptual model based on TOE framework to analyse
the determinants of three different adoption decisions by small firms. At the basic level, we
considered the adoption of a very simple information technology, the Internet; at a medium
level, we examine web site adoption and at the more advanced level, a complex
technology is contemplated: e-commerce. While e-commerce adoption models have been
widely discussed and studied in theory and practice, few empirical studies exist for
southern European countries, such as Portugal. The major findings of our study are the

Chapter 5 - Determinants of E-commerce adoption by Small Firms in Portugal
58
following: (1) the environmental factor significantly influences the three adoption decisions,
meaning that competitive pressure is an important innovation-diffusion driver in these three
stages of adoption; (2) organizational factors like size, perceived benefits, and access to
firms’ IT system contribute to both Internet and web site adoption decisions, but had no
impact on e-commerce adoption; technology readiness and security applications as
components of technological factors, Internet and e-mails norms as organizational factors,
had a significant effect on web site adoption decision but had no effect on e-commerce
adoption. This indicates that once a firm decides to own a web site, these variables
become less important for e-commerce purposes; (3) Portuguese small firms’ behaviour
regarding e-commerce adoption is not very different from their New England counterparts’
[Dholakia and Kshetri, 2004]. Even with an economic environment as different as is the
one between Portugal and New England, small firms tend to have commonalities; this
conclusion confirms the idea that the problems, opportunities, and management issues
encountered by small businesses in the e-commerce area are common and cross borders.
In terms of policy implications, the above findings suggest that a key factor is the
improvement of IT skills at the basic and higher levels. This can be achieved by lowering,
through different types of policy instruments, the IT training cost, and by promoting a
closer relationship between firms, associations, and education institutions. With the cost of
infrastructure technology decreasing, the lack of qualified IT human resources is probably
one of the major constraints for Portuguese small firms’ technology readiness
improvement.
The cross-sectional nature of this study does not allow determining how this relationship
will change over time. To solve this limitation, future research should involve panel data.

Chapter 6 - Determinant factors of internet business solutions adoption the case of Portuguese firms
59
Chapter 6 – Determinant factors of Internet busines s
solutions adoption the case of Portuguese firms
6.1. Introduction
The empirical evidence from both aggregate and microeconomic level studies suggest that
information technologies (IT) played a major role in the resurgence in the growth of United
States (US) output and productivity after 1995 [Bertschek, 2003, Jorgenson, 2002, Stiroh,
2003]. Other studies show that IT investments contributed to the capital deepening and
growth in most OECD countries in the 1990s, though with considerable variation across
countries [Pilat, 2004]. Probably of the many technologies that fall under the IT umbrella,
Internet is the one that has the biggest impact in terms of costs savings and profitability in
business [Litan and Rivlin, 2001]. The use of Internet by businesses create value either
through finding ways of reducing costs or, on the demand side, by improving the match
between buyer preferences and the goods they purchase [Borenstein and Saloner, 2001].
The net impact study published by Varian et al. [2002] estimated that the adoption of
Internet business solutions (IBS) had yield to US organizations from the first year of
implementation through 2001, cumulative cost savings of $155.2 billion and increased
revenues of $444 billion. Their study also found that the adoption of IBS in the United
Kingdom, Germany and France has resulted in a current, cumulative cost savings 9 billion
of Euros to organizations deploying them. It is easy, then, to understand why Internet
Policy is playing a major role in many governments’ agendas. The European Council,
recognizing that the contribution of IT to growth in Europe is still too low (namely compared
with the US) and that much more could be expected, set in March 2000, the so-called
Lisbon Strategy aimed at making the European Union (EU) the most competitive and
dynamic knowledge based economy by 2010. But to generate growth, Internet connectivity
needs to be translated in economic activities. IBS are defined as the initiatives that
combine the Internet with networking, software and computing hardware technologies to
enhance or improve existing business processes or to create new business opportunities
[Varian et al., 2002, Wade et al., 2004]. The IBS allows firms to increase revenue
generation through externally focused initiatives such as expansion into new markets and
development of new products and services [Varian et al., 2002, Wade et al., 2004]. In this

Chapter 6 - Determinant factors of internet business solutions adoption the case of Portuguese firms
60
study, we are only concerned with customer-facing solutions. The purpose of our study is
the following:
1. To develop an integrated model of IBS adoption, taking into account the sample
selection issue. We define a model with two adoption stages: firstly, firm decides to
adopt or not a web site; at the second stage, those who adopted have to decide on
the level of IBS to be used.
2. To identify by means of econometric analysis (ordered probit with selectivity) if
sample selection bias is a relevant feature; to determine the major determinants of
IBS adoption at the two adoption stages and the extent to which their magnitude
differ with the stage of the adoption.
Although the Internet boom has drastically affecting way of doing business in all OECD
countries [OECD, 2004], the available empirical evidence for Portugal is scarce in the
literature. Even if there are some interesting studies on this subject [Dholakia and Kshetri,
2004, Giunta and Trivieri, 2007, Jeon et al., 2006, Lucchetti and Sterlacchini, 2004], there
are few publications for the Portuguese economy. We aim to fill this gap by investigating
the determinants of IBS adoption by Portuguese firms. Our empirical study is based on a
rich data set of 2,626 firms that are representative of the Portuguese business sector with
more than 9 employees in 2006 (excluding the financial service sector).
Our findings are particularly useful within the actual context where the Portuguese
Government is encouraging (since 2005) the adoption of IT by firms (the so-called
Technological Plan). A crucial prerequisite to launching effective strategies for developing
and expanding IBS is to identify the key determinants of its successful adoption. This is
particularly relevant for the case of Portugal, a country that, for different reasons, has been
suffering for several years a serious lack of competitiveness in comparison with other EU
economies.
Our paper is intended as a contribution to the empirical literature on the determinants of IT
adoption, for two main reasons. Firstly, we study the determinants of IBS adoption using
an integrated model and taking into account for selectivity. This topic is still quite limited in
the literature [Battisti et al., 2007]. Secondly, we take Portugal as a country of application,
for which there are few published studies on the subject [Parker and Castleman, 2007].
Chapter 6 - Determinant factors of internet business solutions adoption the case of Portuguese firms
61
The paper is organised as follows. The next section presents the theoretical framework.
Section 3 describes the data. Section 4 presents the econometric specification. In Section
5 we estimated and tested our model using on ordered probit model with selectivity and
two sequential models: one probit and one ordered probit. Finally, we present major
conclusion and policy implication of our results.
6.2. Factors affecting IBS: a review of literature
In the last few years there is a growing interest in the economic literature about IT use and
its determinant factors [Giunta and Trivieri, 2007]. However, as mentioned before, the
determination of the extent of use by adopting firms after first adoption has not been
subjected to widespread research, even if it is a relevant feature [Varian et al., 2002, Wade
et al., 2004]. In this section, we summarize the main determinant factors influencing IBS
adoption that we used as explanatory variables in the econometric analyses. According to
Dholakia and Kshetri [2004], were classified these determinants into internal and external
factors. The internal factors considered are related to technological context (technology
readiness, security applications, access to the IT system of the firm) and to organisational
context (firm size, human capital and absorptive capacity, perceived benefits of electronic
correspondence and Internet and e-mail norms). The external factors are those related to
web site and e-commerce competitive pressure [Jeon et al., 2006].
Technology readiness
IT human resources [Arvanitis and Hollenstein, 2001, Battisti et al., 2007, Caselli and
Coleman, 2001, Giunta and Trivieri, 2007, Hollenstein, 2004, Kiiski and Pohjola, 2002] and
technology infrastructure are important to explain IT adoption. Combining both we
construct a new variable labelled technology readiness. Technology readiness “is reflected
not only by physical assets, but also by human resources that are complementary to
physical assets” [Mata et al., 1995]. Technology infrastructure establishes a platform on
which Internet technologies can be built; IT human resources provide the knowledge and
skills to develop web applications [Zhu and Kraemer, 2005]. Theoretical assertions are
supported by several empirical studies, for example, Zhu et al. [2006b]. Therefore, firms
with greater technology readiness are in a better position to adopt IBS.

Chapter 6 - Determinant factors of internet business solutions adoption the case of Portuguese firms
62
Security applications
Technological progress may be hindered by the lack of security. For example, for Portugal
in 2002 this was the greatest barrier to Internet use [Martins and Oliveira, 2005] and in
China it is one of the most important barriers to the adoption of e-commerce [Tan and
Ouyang, 2004]. We expect firms with a higher level of security applications to be more
probable IBS adopters.
Access to the IT system of the firm
The fact that workers can have access to the IT system from outside of the firm reveals
that the organisation is prepared to integrate its technologies [Mirchandani and Motwani,
2001]. Hence, firms that are able to provide more access to the IT system to workers are
more probable to be IBS adopters.
Firm size
Firm size is one of the most commonly studied determinants of IBS adoption [Battisti et al.,
2007, Dholakia and Kshetri, 2004, Giunta and Trivieri, 2007, Hollenstein, 2004, Honjo,
2004, Lee and Xia, 2006, Lucchetti and Sterlacchini, 2004]. Large firms are more likely to
undertake innovation both because appropriability (the benefits of the new IT) is higher for
larger firms and because the availability of funds for these firms is greater. However, larger
firms have multiple levels of bureaucracy and this can impede decision-making processes
about new ideas and projects. In addition, IT adoption often requires close collaboration
and coordination, mainly for the extent of IT adoption, that can be easily achieved in small
firms [Martins and Oliveira, 2008].
Human capital and absorptive capacity
To measure human capital and absorptive capacity we used IT training programs and the
number of IT workers with a university degree. The presence of skilled labour in a firm
increases its ability to absorb and make use of an IT innovation, and therefore is an
important determinant of IBS [Arvanitis and Hollenstein, 2001, Battisti et al., 2007, Caselli
and Coleman, 2001, Giunta and Trivieri, 2007, Hollenstein, 2004, Kiiski and Pohjola,
2002]. Since the successful implementation of IBS usually requires complex skills, we
expect firms with IT training programs and having more IT workers with a university to be
more likely to adopt IBS.

Chapter 6 - Determinant factors of internet business solutions adoption the case of Portuguese firms
63
Perceived benefits of electronic correspondence
Empirical studies consistently found that perceived benefits have a significant impact in IT
and IBS adoption [Beatty et al., 2001, Gibbs and Kraemer, 2004, Hollenstein, 2004,
Iacovou et al., 1995, Kuan and Chau, 2001]. We anticipate that firms who adopt IBS are
those who further recognize the perceived benefits of electronic correspondence.
Internet and e-mail norms
Regulatory environment has been acknowledged as a critical factor influencing innovation
diffusion [Borenstein and Saloner, 2001, Zhu et al., 2003, Zhu et al., 2006b, Zhu et al.,
2004]. Firms often refer inadequate legal protection for online business activities, unclear
business laws, and security and privacy as concerns in using web technologies [Kraemer
et al., 2006]. In our context we believe that firms that have implemented Internet and e-
mail norms are more confident on how to use this type of IT.
External factors
Empirical evidence suggests that industry competitive pressure is a powerful driver of IT
adoption and diffusion [Battisti et al., 2007, Gibbs and Kraemer, 2004, Hollenstein, 2004,
Iacovou et al., 1995, Zhu et al., 2003]. We expect the probability of adopting IBS to be
positively influenced by the proportion of adopters in the industry or sector to which the
specific firm is affiliated.
6.3. Data
We used a sample of 2,626 firms with more than 9 employees that is statistically
representative of the whole private business sector in Portugal at January 2006, excluding
the financial sector. The sample is stratified by economic sector (NACE classification),
number of employees and turnover. Based on a special agreement between our Institution
(ISEGI) and the National Institute of Statistics, we had the right to use the data from the
National survey on the Use of IT by Firms. This is a very rich questionnaire that provided
all of the information we need to attain our research objectives.

Chapter 6 - Determinant factors of internet business solutions adoption the case of Portuguese firms
64
6.4. Econometric specification
In our theoretical framework, we classified firms into five categories based on their IBS
intensity, according to Varian et al. [2002] terminology, and using Rogers’ [2003] adopter
categories, that are: firms that don’t have web site - laggards; firms that have web site –
late majority; firms that have web site and customer development/e-marketing – early
majority; firms that have web site, customer development/e-marketing and customer
service & support – early adopters; firms that have web site, customer development/e-
marketing, customer service & support and digital e-commerce – pioneers. In Figure 6.1
we compare theoretical Rogers adopter curve with the adopter curve of our study [Beatty
et al., 2001, Rogers, 2003]. As can be seen, our curve is in accordance with the adoption
curve proposed by Rogers [2003].
Figure 6.1 . Comparison of Rogers adopter curve with adopter curve from this study
Source: [Rogers, 2003]
As suggested by the literature [Daniel and Grimshaw, 2002, Dholakia and Kshetri, 2004,
Martin and Matlay, 2001, Reid and Smith, 2000] the adoption process has stages and the
influence patterns of internal and external factors vary with the stage of adoption. In our
model we define two adoption stages: first stage: web site adoption decision and second
stage: level of IBS adoption decision (see Figure 6.2).

Chapter 6 - Determinant factors of internet business solutions adoption the case of Portuguese firms
65
Figure 6.2. The adoption of IBS by firms
The level of IBS adoption decision should be modelled jointly with the decision on web site
adoption because the level of IBS is censored when no web site adoption is observed. It is
obvious that if we restrict our analysis only to those firms who adopted web site, probably
sample selection bias will be introduced [Greene, 2008, Heckman, 1979]. For this reason,
we employ techniques that control sample selection bias and, in addition, as the data
employed in the present study report the level of IBS as an ordinal variable, the standard
sample selection model [Heckman, 1979] has been extended to accommodate ordinality
[Dubin and Rivers, 1990, Greene, 2008].
To account for the ordinal character of the level of IBS, we use an ordered probit model
along the lines suggested by McKelvey and Zavoina [1975], which is based on the
following specification: *2i 2 2i= +iy ε2ix β (6.1)
Where, y2* is a latent variable represented by y2i with the following structure:
*2i 0
*0 2i 1
2i
*2i 1 1 2 1
0 if 0
1 if=
...
if and 0 ....j j
y
yy
J y
µµ µ
µ µ µ µ− −
≤ =
≤ ≤ > < < < <
(6.2)
The variable of theoretical interest y2i* is a continuous unobserved index of the level of IBS.
The observed rating categories, y2i, are assumed to represent an ordered partitioning of

Chapter 6 - Determinant factors of internet business solutions adoption the case of Portuguese firms
66
this continuous scale where, y2i is the observed rating category for the ith firm, ββββ2 is a
vector of coefficients, x2i is a vector of explanatory variables for the ith individual, e2i is a
standard normal random error and the µj are threshold parameters. Higher ββββ2 values
indicate greater probability of higher level of IBS adoption. For four response levels (i.e.
rating categories, J + 1 = 4), the probabilities are given by:
2 2 2
2 1 2 2 2 2
2 2 2 2 1 2 2
2 2 2 2
( 0) ( )
( 1) ( ) ( )
( 2) ( ) ( )
( 3) 1 ( )
i i
i i i
i i i
i i
P y
P y
P y
P y
µµ µ
µ
= = Φ −= = Φ − − Φ −= = Φ − − Φ −= = − Φ −
x β
x β x β
x β x β
x β
(6.3)
where, Φ(·) is the cumulative normal distribution function. In the ordered probit model with
selection, the correlation (denoted by ρ) between the error terms of the decision to adopt
web site and the level of IBS equations can be obtained. A test for the existence of
selectivity bias can then be performed by testing whether ρ differs from zero [Dubin and
Rivers, 1990].
Thus, the ordered probit model with selectivity is specified as:
*1i 1= iy ε+1i 1x β
(6.4)
Where, y1i* is a latent variable represented by y1i with the following structure:
*1
1i *1
0 if 0=
1 if 0
i
i
yy
y
µµ
≤ =
> = (6.5)
Further, y2i satisfies the ordered probit specification of Equation (6.2) and [y2i] is observed
if and only if y1i = 1. The variable y1i* is a continuous unobserved variable measuring the
propensity to obtain a rating, i.e. web site adopted. Also, x1i is a vector of explanatory
variables and β1 is the associated vector of coefficients. Lastly, we assume that the
random errors ε1 and ε2 follow a bivariate standard normal distribution with correlation, ρ. If
the hypothesis of uncorrelated errors (ρ=0) is not rejected then we can proceed as usual
by specifying two sequential models. This means that we can compute, without existence

Chapter 6 - Determinant factors of internet business solutions adoption the case of Portuguese firms
67
of selectivity bias, one probit model for web site adoption with all firms and one ordered
probit model for the level of IBS only with firms that had adopted web site.
Definition of the explanatory variables
A technology readiness index was built by aggregating 8 items on technologies used by
the firm (dummy variables) and one item standing for existence of IT specific skills in the
firm (dummy variable). To aggregate the items measured in yes/no scale, we used multiple
correspondence analyses (MCA). For further details see Appendix D. Security applications
was measured by the number of existing security applications and ranges from 0 to 6.
Access to the IT system of the firm was measured by the number of places from which
workers access the firm information systems. Firm size was measured by three dummies:
small firms (10 up to 49 employees); medium-size firms (50 up to 249 employees); large
firms (more than 249 employees). The base group is represented by small firms. Human
capital and absorptive capacity was measured by two variables: IT training programs is
related to the existence of professional training in computer/informatics available to
workers in the firm (dummy variable); the number of IT workers with a university degree
divided by ten. Perceived benefits of electronic correspondence was measured by the shift
from traditional postal mail to electronic correspondence as the main standard for business
communication, in the last 5 years (dummy variable). Internet and e-mail norms was
measured by whether firms have defined norms about Internet and e-mail (dummy
variable). Web site competitive pressure and e-commerce competitive pressure are
computed as the percentage of firms in each of the 9 industries that had already adopted a
web site/e-commerce two years before the time of the survey, i.e. in 2004. The rationality
underlying our model is that an observation of the firm on the adoption behaviour of its
competitors influences its own adoption decision [Battisti et al., 2007, Hollenstein, 2004,
Zhu et al., 2003]. To control for economic specific behaviour, we used a dummy variable
that is equal to one if the firm belongs to the service sector (real estate, renting and
business activities and other services) and zero otherwise. For a complete description of
the variables used in the econometric analysis and for a summary statistics see Tables 6.1
and 6.2, respectively.

Chapter 6 - Determinant factors of internet business solutions adoption the case of Portuguese firms
68
Table 6.1: Description of variables
Description Explained variables WEB Dummy =1 if firms have web site and zero otherwise LIBS Level of IBS (0- if firm only have web site; 1 – if firms have web site with customer
development/e-marketing; 2 - if firms have web site with customer development/e-marketing and customer service & support; 3 - if firms have web site with customer development/e-marketing, customer service & support and digital e-commerce).
Explanatory variables TR MCA index of technology readiness SA Number of security applications ITSF Number of access to the IT system of the firm Firm Size:
- S1 Dummy =1 if firms have 10-49 employees and zero otherwise - S2 Dummy =1 if firms have 50-249 and zero otherwise - S3 Dummy =1 if firms have more than 249 and zero otherwise Human capital and absorptive capacity: - ITTP Dummy =1 if firms have IT training programs and zero otherwise - ITWD/10 Number of IT workers with a university degree divided by 10
PBEC Dummy =1 if firms have perceived benefits of electronic correspondence and zero otherwise
IEN Dummy =1 if firms have Internet and e-mail norms and zero otherwise Competitive Pressure: - WEBP Percentage of firms in each of the 9 industries that had already adopted a web site in
2004 - EP Percentage of firms in each of the 9 industries that had already adopted a e-
commerce in 2004 Industry type
- SER Dummy =1 if firms belong to the service sector and zero otherwise - MAN Dummy =1 if firms belong to the manufacturing sector and zero otherwise
Table 6.2: Summary statistics
Variable All firms (n=2 ,626) Firms wi th web site (n=1 ,773)
Mean SD Min Max Mean SD Min Max Web site (WEB) 0.675 0.468 0.000 1.000 1.000 0.000 1.000 1.000 Level of IBS (LIBS) 0.504 0.859 0.000 3.000 0.747 0.955 0.000 3.000 - Level 0 0.675 0.468 0.000 1.000 1.000 0.000 1.000 1.000 - Level 1 0.315 0.465 0.000 1.000 0.467 0.499 0.000 1.000 - Level 2 0.134 0.340 0.000 1.000 0.198 0.399 0.000 1.000 - Level 3 0.055 0.228 0.000 1.000 0.082 0.274 0.000 1.000 Technology Readiness (TR) 0.000 0.613 -1.838 0.862 0.212 0.488 -1.282 0.862 Security applications (SA) 3.811 1.687 0.000 6.000 4.288 1.411 0.000 6.000 Access to the IT system of the firm (ITSF) 1.535 0.904 0.000 4.000 1.720 0.970 0.000 4.000 Firm Size:
- Small size firms (S1) 0.350 0.477 0.000 1.000 0.265 0.442 0.000 1.000 - Medium size firms (S2) 0.408 0.492 0.000 1.000 0.428 0.495 0.000 1.000 - Large firms(S3) 0.243 0.429 0.000 1.000 0.307 0.461 0.000 1.000 Human capital and absorptive: - IT training programs (ITTP) 0.579 0.494 0.000 1.000 0.695 0.460 0.000 1.000 - IT workers with a degree (ITWD/10) 0.268 2.092 0.000 66.9 0.375 2.492 0.000 69.9 Perceived benefits of electronic correspondence (PBEC)
0.311 0.463 0.000 1.000 0.382 0.486 0.000 1.000
Internet and e-mail norms (IEN) 0.652 0.477 0.000 1.000 0.758 0.428 0.000 1.000 Competitive Pressure - Web site competitive pressure (WEBP) 49.398 12.928 23.810 85.000 51.414 12.446 23.810 85.000 - E-commerce competitive pressure (EP) 9.036 5.189 0.032 1.231 0.134 0.229 0.000 27.500 Industry type - Service (SER) 0.576 0.494 0.000 1.000 0.605 0.489 0.000 1.000 - Manufacturing or other non service(MAN) 0.424 0.494 0.000 1.000 0.395 0.489 0.000 27.500

Chapter 6 - Determinant factors of internet business solutions adoption the case of Portuguese firms
69
6.5. Estimation results
The ordered probit model with and without selectivity was estimated, as usual, using
maximum likelihood methods. The estimation results are presented in Table 6.3.
Table 6.3: Internet business solution estimation model
Ordered probit with selectivity
Sequential equations
Probit Ordered probit
Web site Level of IBS Web si te Level of IBS Technology Readiness (TR) 0.710*** 0.230* 0.709*** 0.279*** Security applications (SA) 0.088*** 0.081*** 0.088*** 0.088*** Access to the IT system of the firm (ITSF) 0.170*** 0.032 0.171*** 0.040 Firm Size:
- Medium size firms (S2) 0.068 -0.116 0.068 -0.111 - Large firms(S3) 0.264*** -0.234*** 0.267*** -0.220*** Human capital and absorptive capacity:
- IT training programs (ITTP) 0.277*** 0.059 0.276*** 0.080 - IT workers witha degree (ITWD/10) -0.005 0.022** -0.004 0.021** Perceived benefits of electronic correspondence (PBEC) 0.172** -0.060 0.168** -0.050
Internet and e-mail norms (IEN) 0.154** 0.176** 0.155** 0.191*** Industry type - Service (SER) -0.128* 0.106 -0.125* 0.101
Competitive Pressure - Web site competitive pressure (WEBP) 0.021*** - 0.021*** -
- E-commerce competitive pressure (EP) 0.039*** - 0.041*** Constant -1.360*** - -1.361*** - _cut1 - 0.955** - 1.124*** _cut2 - 1.780*** - 1.952*** _cut3 - 2.360*** - 2.535*** Likelihood ratio test of independent equations (ρ=0) -0.154 - Sample size 2,626 2,626 1,173 Log- likelihood -3,144.82 -1,215.56 -1,929.40
Chi-squared 222 744.20***Χ = 2
11 880.04***Χ = 211 195.91***Χ =
Note: We used STATA software to estimate the ordered probit with selectivity [Miranda and Rabe-Hesketh, 2006], probit and ordered probit; * p-value<0.10; ** p-value<0.05; *** p-value<0.01.
The columns two and three of Table 6.3 report the estimation results for ordered probit
with selectivity. We used a likelihood ratio test which tests the null hypothesis of
uncorrelated errors (H0: ρ=0). No support was found to reject this hypothesis, at the usual
5% significance level (p-value=0.52). This result suggests that the web site and the level of
IBS adoption decisions can be estimated sequentially, without the existence of selectivity
bias. This means that the probability of being a web site adopter does not necessarily
mean being a more advanced adopter. As many firms with web presence do not actually
adopt IBS extent we expect that the first stage adoption is less likely to bring fundamental
changes to the firm. This point has rarely been tested in practice and was also
emphasized by Hong and Zhu [2006].

Chapter 6 - Determinant factors of internet business solutions adoption the case of Portuguese firms
70
The last two columns of Table 6.3 report the estimation results for the sequential probit
model: one single probit (with all firms) and one ordered probit (with only firms that use
web site). It is on these sets of results that we concentrate the remaining part of the paper.
The variables in these models are not highly correlated with other regressors. As can be
seen from Table 6.3, for the web site adoption decision all the coefficients have the
expected signs and the only explanatory variable that is not statistically significant is IT
workers with an university degree (ITWD/10). We can identify eight relevant drivers of web
site adoption: technology readiness (TR), Security application (SA), firm size, perceived
benefits of electronic correspondence (PBEC), IT training programs (ITTP), access to the
IT system of the firm (AITSF) and Internet and e-mail norms (IEN) reflecting the internal
factors; web site competitive pressure (WEBP) characterizing the external pressure
factors. For the level of IBS adoption, the estimated coefficients that are statistically
significant are: technology readiness (TR), security applications (SA), firm size (S3), IT
workers with a university degree (ITWD/10), Internet and e-mail norms (IEN) and e-
commerce competitive pressure (EP). As a whole, the results are in accordance with the
theory and with those found in the literature that is illustrated in Section 6.2.
To policy purposes, it is useful to compute the so-called marginal effects (for more details
of marginal effects see Greene [2008]). The estimated marginal effects, at the mean of the
explanatory variables, for the significant determinants of IBS model are reported in Table
6.4.
Table 6.4. Marginal effects for Internet business solutions
Probit Ordered probit
WEB LIBS=0 LIBS=1 LIBS=2 LIBS=3
Technology Readiness (TR) 0.2376 -0.1110 0.0378 0.0370 0.0362
Security applications (SA) 0.0296 -0.0349 0.0119 0.0116 0.0114
Access to the IT system of the firm (ITSF) 0.0574 ns ns ns ns
- Medium size firms (S2) ns ns ns ns ns
- Large firms(S3) 0.0855 0.0869 -0.0315 -0.0286 -0.0268
- IT training programs (ITTP) 0.0935 ns ns ns ns
- IT workers with a degree (ITWD/10) ns -0.0084 0.0029 0.0028 0.0027
Perceived benefits of electronic correspondence
(PBEC) 0.0552 ns ns ns ns
Internet and e-mail norms (IEN) 0.0527 -0.0754 0.0276 0.0248 0.0230
- Service (SER) -0.0417 ns ns ns ns
- Web site competitive pressure (WEBP) 0.0069 - - - -
- E-commerce competitive pressure (EP) - -0.0163 0.0056 0.0054 0.0053
Note: ns mean that the variable is not significant.

Chapter 6 - Determinant factors of internet business solutions adoption the case of Portuguese firms
71
There are several differences between the first and second stages of adoption results,
confirming the idea that the impact of the explanatory variables is not the same for web
site adoption and the level of IBS adoption. Firstly, the variable large firms (S3) have the
opposite effect, meaning that large firms (S3) are more likely to adopt a web site, but small
firms that adopted a web site are the ones that adopted more levels of IBS. For example, a
large firm displays an 8.6% greater predicted probability of having a web site than a small
firm. The level of IBS adoption reveals that a large firm has a 2.7% less predicted
probability of being a pioneer (WEBF=3). This means that small firms use higher levels of
IBS as a strategy to achieve customers. This result is consistent with Martins and Oliveira
[2008] who suggested that small firm adopters may possess certain advantages that allow
them to use the Internet more intensively and with Lee and Xia [2006], who stated that
while large organizations tend to have advantage in the early stages, they face critical
challenges in the latter ones. Secondly, the variables used to measured human capital and
absorptive capacity have significant different impacts at the two adoption stages. The
coefficients related to IT training programs (ITTP) are statistical significant only in web site
adoption, while the variable IT workers with an university degree (ITWD/10) is only
statistically significant for the level of IBS adoption decision. This reveals that for more
advanced level of adoption a solid human capital background is necessary. Another
difference is in the marginal effects of the variable technology readiness (TR); it has a
stronger effect in web site adoption than in the level of IBS adoption decision. For
example, the marginal effect for technology readiness (TR) in web site adoption is 23.8%,
meaning that when the index of technology readiness (TR) increases 1 unit, the probability
of being web site adopter increases 23.8%. The same effect for the level of IBS adoption
shows that for early adopters (WEBF=2) and pioneers (WEBF=3) the predicted probability
is about 3.7%. This means that technology readiness is more important for firms that
adopted web site than for those who have adopted higher levels of IBS.
The security applications (SA), Internet and e-mail norms (IEN) and respectively
competitive pressure are the unique variables that are statistically significant and have
identical impacts in both models. This reveals that the impact of security, legacy system
and competitive pressure is the same at both adoption stage levels.

Chapter 6 - Determinant factors of internet business solutions adoption the case of Portuguese firms
72
6.6. Conclusions
In this study we proposed a conceptual model to analyse the determinants of IBS adoption
decisions by firms, that is estimated using a ordered Probit model with sample selection.
IBS adoption is of major importance because it enables firms to increase revenue
generation through externally focused initiatives such as expansion into new markets and
development of new products and services [Varian et al., 2002, Wade et al., 2004].
The idea behind our paper was to offer a contribution to the empirical literature on a topic,
namely IT adoption by firms, which for integrated IBS models yet seem limited. Moreover,
only few empirical publications exist for southern European countries as Portugal. In
contrast with most studies on IT adoption, which are based on small samples of firms
mostly located a specific area, our study examined 2,626 firms representative of the
Portuguese private economic sectors (except the financial one).
The adopter curve in our study is identical to the one proposed in the innovation theory
[Beatty et al., 2001, Rogers, 2003]. Based on the ordered probit model with selectivity, no
support was found for sample selection. Hence, for this sample of Portuguese firms, the
web site and the level of IBS can be estimated separately and sequentially. In line with
other findings about the adoption of basic and more advance IT [Battisti et al., 2007,
Battisti and Stoneman, 2003, Battisti and Stoneman, 2005, Hollenstein, 2004, Martins and
Oliveira, 2008, Oliveira et al., 2008], we conclude that to be an IT adopter (web site) does
not mean being an extensive IT user (the level of IBS). Our empirical results also validate
the internal and external factors framework for identifying the facilitators and inhibitors of
IBS adoption. Moreover, our results demonstrated that, as suggested by other authors
[Daniel and Grimshaw, 2002, Dholakia and Kshetri, 2004, Martin and Matlay, 2001, Reid
and Smith, 2000] the influence patterns of factors vary with the stage of adoption. The
major findings are the following. Firstly, our results suggest that the unique factors that are
important and have identical effects in both models are security applications (SA), Internet
and e-mail norms (IEN) and competitive pressure. This reveals that security, legacy
system and competitive pressure are transversal to both adoption decision processes.
Secondly, other variables have limited influence: perceived benefits of electronic
correspondence (PBEC), IT training programs (ITTP) and access to the IT system of the
firm (AITSF), had a significant effect on web site adoption decision but had no effect on the

Chapter 6 - Determinant factors of internet business solutions adoption the case of Portuguese firms
73
level of IBS adoption. This indicates that once a firm decides to own a web site, these
variables become less important to determine the level of IBS adoption. On the other
hand, IT workers with a university degree (ITWD/10) have a relevant impact on the level of
IBS adoption decision but are not important within the web site adoption model. This
reveals that for more advanced levels of IBS adoption solid background of human capital
of firms in IT is necessary. In addition, large firms (S3) are more likely to use a web site
and less likely to use higher levels of IBS, that is, large firms are the first to adopt web site;
however, small firms (S1) that adopted web site have higher level of IBS adoption
(pioneers). This means that small firms use more advanced levels of IBS as a strategy to
achieve customers. This is in accordance with the idea that large organizations tend to
have advantage in the early stages, but they face critical challenges in the latter ones [Lee
and Xia, 2006].
Our findings have practical implications for managers and policy makers at the national
and European Union (EU) level. In terms of policy implications, the above findings suggest
that European and national actions aimed at increasing IT use by firms (e-Europe action
plan1; i2010 initiative; technological plan), should be based on a well-aimed policy mix. A
key factor, at the national level, is the improvement of IT skills at the basic and higher
levels. This can be achieved by lowering, through different types of policy instruments, the
IT training cost, and by promoting a closer relationship between firms, associations and
education institutions. In our opinion, the improvement of the legal and regulatory
environment is a task that pertains to the European Commission. With the cost of
infrastructure technology decreasing, the lack of qualified IT human resources is probably
one of the major constraints for Portuguese firm’s technology readiness improvement.
Our study also has important implications for managers who are involved in processes of
introducing IT innovations into their organizations. Managers should be aware that
technology readiness constitutes both physical infrastructure and intangible knowledge
such as IT skills. This urges top leaders to foster managerial skills and human resources
that possess knowledge of these new information technologies.
1 For further details on this plans see for example: http://ec.europa.eu/information_society/eeurope/2005/index_en.htm, http://ec.europa.eu/information_society/eeurope/i2010/index_en.htm and http://www.planotecnologico.pt/.

Chapter 6 - Determinant factors of internet business solutions adoption the case of Portuguese firms
74
As in most empirical studies, our work is limited in some ways. The cross-sectional nature
of this study does not allow us to know how this relationship will change over time. Neither
it permits to analyse unobserved random effects. To solve this limitation the future
research should involve panel data.

Chapter 7 – Firms patterns of e-business adoption: evidence for the European Union-27
75
Chapter 7 – Firms patterns of e-business adoption:
evidence for the European Union-27
7.1. Introduction
The development of e-business capability is crucial since it is swiftly chaining the way that
companies buy, sell, and deal with customers, becoming a more integral part of its
business strategies [Abu-Musa, 2004]. E-business adoption becomes a significant
research topic because it enables the firm to execute electronic transactions along value
chain activities [Straub and Watson, 2001, Zhu and Kraemer, 2002]. It represents a new
way to integrate Internet-based technologies with core business potentially affecting the
whole business [Zhu, 2004a].
The European Commission [2005] claims that more efforts are needed to improve e-
business in European firms if the Lisbon targets of competitiveness are to be
accomplished. European firms, under the pressure of their main international competitors,
need to find new opportunities to reduce costs and improve performance. For this reason,
it is fundamental to identify the patterns of e-business adoption among firms in European
Union (EU) members.
To the best of our knowledge, very limited empirical research has been performed to
identify the patterns of e-business adoption among firms in EU27 using the technology,
organization and environment (TOE) contexts. This study fills this gap. The main
objectives of this study are the following:
• To identify distinct clusters of e-business adoption;
• To characterize the pattern of e-business adoption by firms across these clusters;
• To understand the extent to which industry e-business adoption characteristics are
more or less relevant than country specific characteristics.
The paper is organized as follows. The next section presents the literature review of the
factors affecting e-business adoption. After we describe the data used. Then, we define

Chapter 7 – Firms patterns of e-business adoption: evidence for the European Union-27
76
the methodology used and present the results obtained. Finally, we present conclusions
and future research.
7.2. e-Business adoption by firms: literature revie w
Several authors [Hong and Zhu, 2006, Kuan and Chau, 2001, Lin, 2008, Oliveira and
Martins, 2008, Pan and Jang, 2008, Thong, 1999, Zhu et al., 2003, Zhu et al., 2006b] used
the TOE framework, developed by Tornatzky and Fleisher [1990], to analyse information
technology (IT) adoption by firms. Based on the TOE framework, we stipulate that three
aspects may possibly influence e-business adoption: technological context (technology
readiness and technology integration); organizational context (firm size, expected benefits
and obstacles of e-business and improved products or services or internal processes); and
environmental context (Internet penetration and competitive pressure).
Technology context
Technology readiness can be defined as technology infrastructure and IT human
resources. Technology readiness “is reflected not only by physical assets, but also by
human resources that are complementary to physical assets” [Mata et al., 1995].
Technology infrastructure establishes a platform on which Internet technologies can be
built; IT human resources provide the knowledge and skills to develop web applications
[Zhu and Kraemer, 2005]. Theoretical assertions are supported by several empirical
studies [Armstrong and Sambamurthy, 1999, Hong and Zhu, 2006, Iacovou et al., 1995,
Kwon and Zmud, 1987, Pan and Jang, 2008, Zhu, 2004b, Zhu et al., 2003, Zhu and
Kraemer, 2005, Zhu et al., 2006b].
Evidence from the literature suggests that technology integration helps improve firm
performance by reduced cycle time, improved customer service, and lowered procurement
costs [Barua et al., 2004]. E-business demands close coordination of various components
along the value chain. Correspondingly, a greater integration of existing applications and
the Internet platform represent a greater capacity of conducting business over the Internet
[Al-Qirim, 2007, Mirchandani and Motwani, 2001, Premkumar, 2003, Zhu et al., 2006b].

Chapter 7 – Firms patterns of e-business adoption: evidence for the European Union-27
77
Organization context
Firm size is one of the most commonly studied determinants of IT adoption [Lee and Xia,
2006]. Large firms are more likely to undertake innovation. Three major arguments support
the positive role of firm size in determining IT adoption: appropriability (the benefits of the
new IT), the greater availability of funds and the quicker capture of economies of scale.
However, larger firms have multiple levels of bureaucracy and this can impede decision-
making processes about new ideas and projects. Moreover, IT adoption often requires
close collaboration and coordination that can be easily achieved in small firms.
Empirical studies consistently found that perceived benefits have a significant impact in IT
adoption [Beatty et al., 2001, Gibbs and Kraemer, 2004, Iacovou et al., 1995, Kuan and
Chau, 2001, Lin and Lin, 2008]. Perceived obstacles are particularly relevant because the
adoption process may be complicated and costly [Pan and Jang, 2008, Zhu et al., 2006b].
Improved products or services or internal process that are enabled by or related to a
subset of IT, namely e-business technologies [Koellinger, 2008].
Environment context
Internet penetration measures the adoption and diffusion of computer and Internet of
individual and household in the population of each country. It is a important factor for
decision makers of e-business adoption because it reflects the potential market [Zhu et al.,
2003].
Competitive pressure refers to the degree of pressure felt by the firm from competitors
within the industry. Porter and Millar [1985] analyzed the strategic rationale underlying
competitive pressure as an innovation-diffusion driver. They suggested that, by using a
new innovation, firms might be able to alter the rules of competition, affect the industry
structure, and leverage new ways to outperform rivals, thus changing the competitive
landscape. This analysis can be extended to IT adoption. Empirical evidence suggests that
competitive pressure is a powerful driver of IT adoption and diffusion [Al-Qirim, 2007,

Chapter 7 – Firms patterns of e-business adoption: evidence for the European Union-27
78
Battisti et al., 2007, Dholakia and Kshetri, 2004, Gibbs and Kraemer, 2004, Grandon and
Pearson, 2004, Hollenstein, 2004, Iacovou et al., 1995, Mehrtens et al., 2001, Zhu et al.,
2003].
7.3. Data
Our data source is the e-Business W@tch [w@tch, 2006a, w@tch, 2006b], which collects
data concerning the use of information communication technology (ICT) and e-business in
European enterprises. The data, collected by means of representative surveys of firms that
used computers, are related to EU27 members and had a scope of 12,439 telephone
interviews with decision-makers in enterprises. Interviews were carried out in March and
April 2006, using computer-aided telephone interview (CATI) technology. The sample
drawn was a random sample of companies from the respective sector population in each
of the countries.
According to the methodological recommendations of Eurostat, the situation of an operator
that “did not answer” or “does not know” the answer to a specific question should not imply
its imputation, in any case, based on the answer of the other operators. Consequently, we
obtained a smaller sample that we compared, by a proportion test, with the original one.
The proportion test for the variable e-business adoption reveals that the only country
where statistically significant differences exist is Bulgaria. For this reason we excluded it
from our analysis.
We also used, as additional information, the Eurostat data (Survey on ICT Usage in
Households and by Individuals 2006) to compute the Internet penetration index by country.
We excluded Malta because no data were available. The final sample includes 6,694 firms
belonging to the EU27 members excluding Malta and Bulgaria. About 80 percent (79.0%)
of the data was collected from owners, managing directors, heads of IT and other senior
members of IT, suggesting the high quality of the data source.

Chapter 7 – Firms patterns of e-business adoption: evidence for the European Union-27
79
7.4. Methodology and results
As a first step, we group the items to reduce the number of variables of the survey; for that
we applied a factor analysis (FA). Then, to determine homogenous groups of firms in
terms of e-business adoption, we applied cluster analysis (CA).
7.4.1. Factor analysis results
We performed a FA of multi-item indicators to reduce the number of variables of the
survey and to evaluate the validity. We used the principal component technique with
varimax rotation (see Table 7.1) to extract four eigen-value, which were all greater than
one. The first 4 factors explain 72.4% of variance contained in the data. The Kaiser-Meyer-
Olkin (KMO) measures the adequacy of sample; KMO general is 0.91, which reveals that
the matrix of correlation is appropriate for the FA. The KMO for individual variables is also
adequate. All the factors have a loading greater than 0.50 (except TI4). This indicates that
our analysis is based on a well-explained factor structure. The four factors found are:
expected benefits and obstacles of e-business, Internet penetration, technology readiness
and technology integration. These factors are in accordance with the literature review.

Chapter 7 – Firms patterns of e-business adoption: evidence for the European Union-27
80
Table 7.1: Factor and validity analysis
Items measure d F1 F2 F3 F4 Expected benefits and obstacles of e -business (EBOEB) Why did your company decided to engage in e-business activities? (0-not at all; 1-not important; 2-important)
EB1 - Because your customers expected it from you 0.91 0.01 0.11 0.06 EB2 - Because your company believes that e-business will help to get an edge over your competitors
0.90 -0.04 0.13 0.05
EB3 - Because your competitors also engage in e-business 0.88 -0.02 0.08 0.04 EB4 - Because your suppliers expected it from you 0.87 -0.03 0.10 0.05 Important obstacles for not practising e-business in your company? (0-not at all; 1-not important; 2-important)
EO1 - My company is too small to benefit from any e-business activities -0.93 -0.02 -0.11 -0.04 EO2 - E-business technologies are too expensive to implement -0.94 -0.03 -0.08 -0.02 EO3 - Our systems are not compatible with those of suppliers or customers -0.94 -0.03 -0.06 -0.01 EO4 - We are concerned about potential security risks and privacy issues -0.94 -0.03 -0.05 -0.01 EO5 - We think that there are important unsolved legal issues involved -0.95 -0.04 -0.05 -0.01 EO6 - It is difficult to find reliable IT suppliers -0.95 -0.03 -0.06 -0.01 Internet penetration (IP) IP1 - Individuals using computer in the European Union 0.02 0.98 0.05 -0.05 IP2 - Individuals using Internet in the European Union 0.01 0.98 0.05 -0.05 IP3 - Households with Internet access at home 0.03 0.97 0.03 -0.03 IP4 - Households with computer (International Benchmarking) 0.02 0.97 0.01 -0.01 IP5 - Households using a broadband connection to the Internet (International Benchmarking) 0.05 0.92 0.01 0.00
IP6 - Individuals using Internet commerce in the European Union -0.04 0.92 0.06 0.00 Technology readiness (TR) TR1 - Sum of the following network applications: a Local Area Network (LAN); Wireless LAN; Voice-over-IP; Fixed line connections; Wireless-Local-Area-Networks or W-LANs, Mobile communication networks; Virtual Private Network (VPN)
0.18 0.08 0.75 0.16
TR2 - Sum of the following technologies: Internet; intranet; web site; 0.24 0.08 0.68 0.08 TR3 - Sum of the following questions ICT skills: your company currently employ ICT practitioners; your company regularly send employees to ICT training programmes
0.14 0.01 0.66 0.18
TR4 - Sum of the following security applications: secure server technology, for example SSL, TLS or a comparable technical standard; digital signature or public key infrastructure; a firewall
0.22 0.11 0.66 0.08
TR5 - Sum of the following online applications other than e-mail: to share documents between colleagues or to perform collaborative work in an online environment; to track working hours or production time; to collaborate with business partners to forecast product or service demand; to collaborate with business partners in the design of new products or services; to manage capacity or inventories; to send e-invoices to customers in the public sector; to send e-invoices to customers in the private sector; to receive e-invoices from suppliers.
0.23 0.05 0.55 0.32
TR6 - Percentage of employees that have access to the Internet 0.12 0.17 0.55 -0.25 Technology Integration ( TI) Does your company use any of the following systems or applications for managing information in the company (0- do not know what this is; 1-no; 2-yes)?
TI1 - a SCM system, that is a Supply Chain Management System 0.08 -0.07 0.06 0.68 TI2 - an EDM system, that is an Enterprise Document Management System 0.08 -0.15 0.11 0.65 TI3 - an ERP system, that is Enterprise Resource Planning System 0.06 -0.06 0.27 0.65 TI4 - Knowledge Management software 0.06 0.03 0.21 0.49 Eigen value 8.72 5.57 2.73 1.80 Percentage of variance explained 33.55 21.43 10.50 6.94 Note: variables are marked according to factor loading
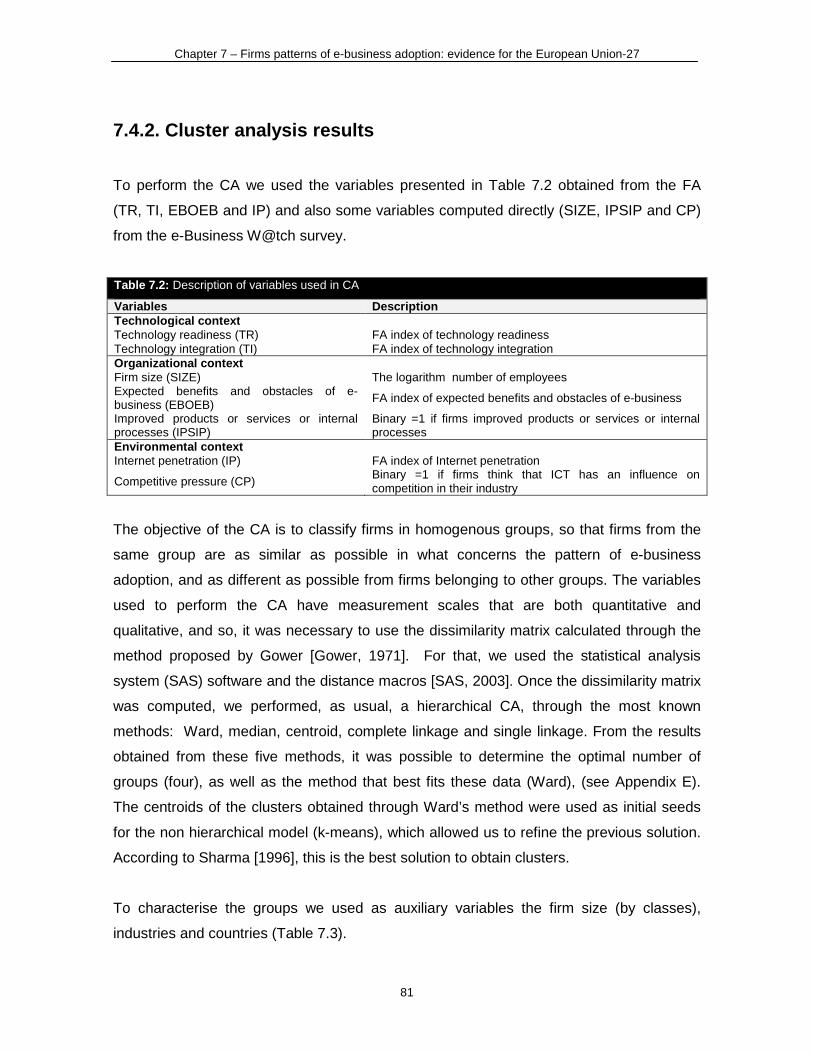
Chapter 7 – Firms patterns of e-business adoption: evidence for the European Union-27
81
7.4.2. Cluster analysis results
To perform the CA we used the variables presented in Table 7.2 obtained from the FA
(TR, TI, EBOEB and IP) and also some variables computed directly (SIZE, IPSIP and CP)
from the e-Business W@tch survey.
Table 7.2: Description of variables used in CA
Variables Description Technological context Technology readiness (TR) FA index of technology readiness Technology integration (TI) FA index of technology integration Organizational context Firm size (SIZE) The logarithm number of employees Expected benefits and obstacles of e-business (EBOEB) FA index of expected benefits and obstacles of e-business
Improved products or services or internal processes (IPSIP)
Binary =1 if firms improved products or services or internal processes
Environmental context Internet penetration (IP) FA index of Internet penetration
Competitive pressure (CP) Binary =1 if firms think that ICT has an influence on competition in their industry
The objective of the CA is to classify firms in homogenous groups, so that firms from the
same group are as similar as possible in what concerns the pattern of e-business
adoption, and as different as possible from firms belonging to other groups. The variables
used to perform the CA have measurement scales that are both quantitative and
qualitative, and so, it was necessary to use the dissimilarity matrix calculated through the
method proposed by Gower [Gower, 1971]. For that, we used the statistical analysis
system (SAS) software and the distance macros [SAS, 2003]. Once the dissimilarity matrix
was computed, we performed, as usual, a hierarchical CA, through the most known
methods: Ward, median, centroid, complete linkage and single linkage. From the results
obtained from these five methods, it was possible to determine the optimal number of
groups (four), as well as the method that best fits these data (Ward), (see Appendix E).
The centroids of the clusters obtained through Ward’s method were used as initial seeds
for the non hierarchical model (k-means), which allowed us to refine the previous solution.
According to Sharma [1996], this is the best solution to obtain clusters.
To characterise the groups we used as auxiliary variables the firm size (by classes),
industries and countries (Table 7.3).

Chapter 7 – Firms patterns of e-business adoption: evidence for the European Union-27
82
Table 7.3: Description of adoptions and auxiliary variables
Variables Description Adoption E-business (EB) Binary =1 if firm adopts e-purchasing or e-selling e-purchasing adoption (e1) Binary =1 if firm adopts e-purchasing e-selling adoption (f4) Binary =1 if firm adopts e-selling Auxiliary Size by classes (micro, small, medium and large) Four binary variable for each size Industry (manufacture, construction, tourism and telecommunications)
Four binary variables for each industry
EU27 members (excluding Malta and Bulgaria) Twenty-five binary variables for each country
Summary statistics for variables in each cluster are provided in Table 7.4. Clusters
patterns were compared using chi-squared tests for binary variables and Kruskal-Wallis
test for quantitative variables. All variables, except auxiliary variables related to countries,
present statistically significant differences across clusters, suggesting that our cluster
analysis generated groups of firms that are statistically distinct according to the variables
characterising e-business adoption.
Table 7.4: Summary statistics for CA
All Cluster
Statistic Test (p-value)
1 2 3 4 Number of firms 6,964 1,699 1,150 1,509 2,606 Percentage of firms 100.0% 24.4% 16.5% 21.7% 37.4% TOE Variables Technology readiness (TR) 0.000 -0.482 -0.041 -0.215 0.457 991.69 (<0.001) Technology integration (TI) 0.000 -0.140 0.090 -0.155 0.141 83.76 (<0.001) Firm size (SIZE) 2.733 2.406 2.948 2.473 3.003 183.69 (<0.001) Expected benefits and obstacles of e-business (EBOEB) 0.000 -0.480 -0.205 0.141 0.322
710.83 (<0.001)
Improved products or services or internal processes (IPSIP) 0.539 0.000 1.000 0.000 1.000
3207.97 (<0.001)
Internet penetration (IP) 0.000 0.071 0.017 0.002 -0.055 52.43 (<0.001) Competitive pressure (CP) 0.591 0.000 0.000 1.000 1.000 2,848.98 (<0.001) Adoption variables e-purchasing adoption 0.619 0.448 0.602 0.606 0.746 149.59 (<0.001) e-selling adoption 0.310 0.169 0.250 0.307 0.430 242.62 (<0.001) E-business 0.693 0.516 0.666 0.693 0.820 139.10 (<0.001) Auxiliary variables Micro 0.423 0.489 0.357 0.493 0.368 64.84 (<0.001) Small 0.306 0.312 0.339 0.279 0.302 8.04 (0.045) Medium 0.211 0.167 0.241 0.180 0.245 42.24 (<0.001) Large 0.060 0.033 0.063 0.048 0.084 49.06 (<0.001) Manufacture 0.512 0.504 0.647 0.427 0.507 62.33 (<0.001) Construction 0.169 0.265 0.127 0.192 0.112 159.74 (<0.001) Tourism 0.181 0.166 0.149 0.233 0.175 31.48 (<0.001) Telecommunications 0.138 0.065 0.077 0.148 0.206 185.11 (<0.001) Note: We also analyze summary statistics by cluster for each country but we do not identify any pattern. In addition, several countries (Netherlands, Sweden, Germany, Ireland, Luxembourg, Italy, Slovakia, Cyprus and Latvia) did not have statistically differences by clusters.

Chapter 7 – Firms patterns of e-business adoption: evidence for the European Union-27
83
A description of each of the clusters, drawn from Table 7.4 is given below:
Cluster 1 (lowest e-business adoption). These firms had the lowest level of technology
readiness compared to the other three clusters; their expected benefits of e-business are
the lowest, but they had the highest level of Internet penetration index. They are therefore
referred to here as lowest e-business adoption group, that is, firms who are at the very
start of their e-business adoption but are currently operating in countries with a high
Internet penetration. The competitive pressure they faced is low. Most of the firms within
this group are micro and small firms without improved products or services and the most
common activity sector is the construction. This cluster contains 24.4% of the whole
sample firms.
Cluster 2 (medium e-business adoption with technology integration). The firms in this
cluster were making some use of integrated technologies and most of them are improving
their products or internal processes. They were presenting a medium level of technology
readiness but a low competitive pressure. Firms in cluster 2 are small and medium size
firms coming from manufacturing industry and having a medium level of e-business
adoption. This cluster includes 16.5% of the firms.
Cluster 3 (medium e-business adoption with high competitive pressure). Firms in this
cluster had the lowest index of technology integration and a low level of technology
readiness. Contrarily to firms in cluster 2, most of them do not improve their services or
internal processes, but all of them are facing competitive pressure. In this group the most
common firms are micro firms coming from the tourism industry. This cluster contains
21.7% of firms.
Cluster 4 (highest e-business adoption). Firms in cluster 4 were found to have high levels
of all variables, except for the Internet penetration. Cluster 4 incorporates firms that
operate in the telecommunications industry and had medium or large size. This is the
biggest cluster with 37.4% of firms.
The findings suggest that the four clusters identified represent a set of e-business patterns
(Figure 7.1) that are much more related to industry sector and firm size than to countries.
Micro and small firms from the construction sector can be viewed as laggards and big

Chapter 7 – Firms patterns of e-business adoption: evidence for the European Union-27
84
firms from telecommunications as the pioneers. Moreover, our results also suggested a
positive relationship between e-purchase and e-selling adoption.
Figure 7. 1. Characteristics of four e-business groups
7.5. Conclusions and future research
This study sought to explore the patterns of e-business adoption by European firms. Four
distinct clusters of e-business adoption were found. The major conclusions are the
following. Firstly, in general, firms with high levels of TOE factors have also enhanced
levels of e-business (Figure 7.2, 7.3, 7.4 and 7.5). Secondly, the two clusters (cluster 3
and 4) that have the highest level of e-business adoption incorporate firms all of them with
the higher level of competitive pressure (CP). This reveals the importance of
environmental factors to improve e-business adoption. Thirdly, the comparison of e-
business patterns, between cluster 3 and cluster 2 (figures 7.1, 7.2 and 7.3), suggest that
the technology context is more important for the manufacture industry than for the tourism
industry. Finally, the Internet penetration index, which is the specific variable for each
country, has a different behaviour from e-business adoption. This index does not follow the
trends of e-business adoption as can be seen in Figure 7.6. Additionally, the variables
- Lowest e-business adoption - Lowest TR and EBOEB - Low TI - Without IPSIP and CP - Highest IP - Micro and small size firms - Construction
- Highest e-business adoption - Highest TR, TI and EBOEB - All firms have IPSIP and CP - Lowest IP - Medium and large size firms - Telecommunications
- Medium e-business adoption - Low TR - Lowest TI - Medium IP - High EBOEB - All firms have CP - Without IPSIP - Micro size firms - Tourism
- Low e-business adoption - Medium TR and TI, - Low EBOEB - All firms have IPSIP - Without CP - High IP - Small and medium size firms - Manufacture

Chapter 7 – Firms patterns of e-business adoption: evidence for the European Union-27
85
related to countries do not have statistically significant differences across clusters. These
reveal that in the European context the most important to characterise e-business adoption
is the industry and their specific characteristics and not the country to which the firms
belong.
Figure 7.2. Technology readiness index versus e-
business adoption
Figure 7.3 . Technology integration index versus e-
business adoption
Figure 7.4. Size versus e-business adoption Figure 7.5. Expected benefits and obstacles of e-
business versus e-business adoption
Figure 7.6. Internet penetration index versus e-
business adoption

Chapter 7 – Firms patterns of e-business adoption: evidence for the European Union-27
86
In terms of future research, it would be interesting to study one model that determines e-
business adoption for each industry in the European context. It would be also important to
compare the impacts of TOE variables in different industries (manufacture, construction,
tourism and telecommunications).

Chapter 8 - Understanding e-business adoption across industries in European countries
87
Chapter 8 – Understanding e-business adoption acros s
industries in European countries
8.1. Introduction
Electronic business (e-business), or the use of Internet-based technologies to conduct
business, is recognized as a significant area for information technology (IT) innovation and
investment [Willcocks et al., 2000]. As defined in Zhu et al. [2006a, page 601], “e-business
refers to conducting transactions along the value chain (including purchasing from
upstream suppliers and selling products and services to downstream customers) by using
the Internet platform (e.g. TCP/IP, HTTP, XML) in conjunction with the existing IT
infrastructure”. In this study we used the same definition of e-business. Firms using e-
business obtain substantial returns through efficiency improvements, inventory reduction,
sales increase, customer relationship enhancement, new market penetration, and financial
returns [Amit and Zott, 2001, Barua et al., 2004, Lederer et al., 2001, Raymond and
Bergeron, 2008, Zhu and Kraemer, 2002]. The development of e-business capability is
crucial because it is not only rapidly changing the way that companies buy, sell, and deal
with customers, but also becoming a more central part of their business strategies [Abu-
Musa, 2004]. E-business adoption becomes a noteworthy research topic because it
enables the firm to perform electronic transactions along value chain activities [Straub and
Watson, 2001, Zhu and Kraemer, 2002] and it represents a new way to incorporate
Internet-based technologies with core business, thereby potentially affecting the whole
business [Zhu, 2004a].
The European commission [2005] claims that more efforts are needed to improve e-
business in European firms if the Lisbon targets of competitiveness are to be achieved.
Under the pressure of their main international competitors, European firms need to find
new opportunities to reduce costs, improve performance and the extent to which there are
common behaviours across them. For these reasons, it is important to understand why
firms adopt e-business or do not. Some studies analyse e-business adoption [Lin and Lin,

Chapter 8 - Understanding e-business adoption across industries in European countries
88
2008, Zhu et al., 2003, Zhu and Kraemer, 2005, Zhu et al., 2006b] but do not compare the
different drivers’ importance for e-business adoption across industries.
Recent findings reveal that in the European context the most important aspect to
characterize e-business adoption is the industry and its specific characteristics rather than
the country the firms belong to [Oliveira and Martins, 2010a]. For this reason, it is
important to understand e-business adoption by industry within the 27 European Union
countries (EU 27) context. The telecommunications (telco) industry is the most advanced
sector in e-business adoption. This might serve as input for promoting e-business
technologies to less e-business-intensive industries. Tourism as a whole is one of the
fastest growing industries worldwide. In recent years, growth rates in tourism have been
higher than those of the overall world economy. From a global perspective, the European
Union (EU) is still the most tourism-intensive region worldwide [W@tch, 2007]. For these
reasons, we focus on these two industries. In the EU context, e-business adoption differs
across these industries. In 2006, for the telco industry, e-business adoption was 82%; and
for the tourism industry, it was 53% [W@tch, 2006c].
The purpose of this paper is to identify the factors that explain e-business adoption in two
different industries (telco and tourism). Specifically, we want to understand what factors
are important to explain e-business adoption in each industry, and to understand if the
magnitude of these factors varies across these industries in the EU27 context. To the best
of our knowledge, very limited empirical research has been undertaken to evaluate the
determinants of e-business adoption across different industries; this study fills this gap. To
achieve our purpose we developed a research model that is a combination of the
Tornatzky and Fleischer [1990] model and the Iacovou et al. [1995] model. The paper is
organized as follows: first, we present the theories and literature review; then we describe
the research model and hypotheses; finally, we estimate and test our model, discuss our
results, and offer the main conclusions and implications.
8.2. Theories and literature review
A review of the literature suggests that the technology, organization and environment
(TOE) framework [Tornatzky and Fleischer, 1990] may provide a useful starting point for

Chapter 8 - Understanding e-business adoption across industries in European countries
89
studying e-business adoption [Lin and Lin, 2008, Zhu and Kraemer, 2005]. The TOE
framework identifies three features of a firm’s context that may influence adoption of
technological innovation: (1) the technological context describes both the existing
technologies in use and new technologies relevant to the firm; (2) the organizational
context refers to characteristics of the organization such as scope and size; (3) the
environmental context is the arena in which a firm conducts its business, referring to its
industry, competitors, and dealings with the government. The TOE framework explains
adoption of innovation, as can be seen in the left side of Figure 8.1. The TOE framework
has been examined in a number of empirical studies on various information systems (IS)
domains. It was used to explain electronic data interchange (EDI) adoption [Kuan and
Chau, 2001]. Thong [1999] explained IS adoption and use. Pan and Jang [2008] explained
enterprise resource planning (ERP) adoption. This framework was also used to explain e-
business adoption [Zhu et al., 2003, Zhu and Kraemer, 2005] and use [Lin and Lin, 2008,
Zhu and Kraemer, 2005, Zhu et al., 2006b]. Empirical findings from these studies
confirmed that the TOE methodology is a valuable framework in which to understand the
adoption of IT innovation.
Over time, innovations become more complex and cross the limits of individual firms. More
and more interorganizational systems (IOSs) become significant in the business world. For
instance, electronic data interchange (EDI) and B2B e-commerce are innovations that
entail integration between multiple businesses. Five years after TOE, Iacovou et al. [1995]
analysed IOSs characteristics that influence firms to adopt IT innovations. They studied
EDI adoption. Their framework is well suited to explain the adoption of an IOS. It is based
on three factors: perceived benefits; organizational readiness, and external pressure (see
right-hand side of Figure 8.1). Perceived benefits is a different factor from the TOE
framework that will be added into our research model, whereas organization readiness is a
combination of the technology and organization context of the TOE model. Hence, IT
resources is similar to technology context and financial resources is similar to
organizational context. The external pressure in the Iacovou et al. [1995] model adds the
trading partners to the external task environmental context of the TOE as a critical role of
IOSs adoptions.

Chapter 8 - Understanding e-business adoption across industries in European countries
90
Figure 8.1. Tornatzky and Fleischer [1990] model and Iacovou et al. [1995] model
The present research combines features of the two earlier models, resulting in an
integrated framework for e-business adoption. The research model proposed here
comprises three dimensions, which are:
• perceived benefits;
• technology and organizational readiness;
• environmental and external pressure.
The perceived benefits dimension comes from the Iacovou et al. [1995] model. The
technology and organizational readiness is a combination of technology and organizational
context from the Tornatzky and Fleischer [1990] framework and organizational readiness
from the Iacovou et al. [1995] model. The environmental and external pressure is also a
combination from both earlier studies.
8.2.1. Research model and hypotheses
We developed a conceptual framework for e-business adoption (see Figure 8.2) in which
the dependent variable is the e-business adoption and we stipulated six hypotheses.

Chapter 8 - Understanding e-business adoption across industries in European countries
91
Figure 8.2. Research model
8.2.1.1 Perceived benefits
Perceived benefits and obstacles of e-business. Perceived benefits refers to the
anticipated advantages that e-business adoption can provide to the organization. Better
managerial understanding of the relative advantage of an innovation increases the
likelihood of the allocation of the managerial, financial, and technological resources
necessary to use that innovation [Iacovou et al., 1995, Rogers, 2003]. Earlier studies
argue that firms using e-business may obtain benefits such as sales increase, new market
penetration, and cost reduction [Zhu and Kraemer, 2002, Zhu et al., 2004]. Other empirical
studies also validate that positive perception of the benefits of an innovation provides an
incentive for its use [Beatty et al., 2001, Gibbs and Kraemer, 2004, Grover and Teng,
1994, Hsu et al., 2006, Iacovou et al., 1995, Kuan and Chau, 2001, Lin and Lin, 2008,
Premkumar et al., 1994, Son et al., 2005]. It is necessary to understand perceived
benefits, as well as perceived obstacles, because the adoption process may be
complicated and costly [Hong and Zhu, 2006, Pan and Jang, 2008, Zhu et al., 2006b]. The
adoption of e-business requires a substantial degree of technical and organizational
competence for smooth transition [Hong and Zhu, 2006]; these barriers can result in
resistance from users. As a consequence, it is essential to reduce the perceived barriers.
Cho [2006] concluded that firms that perceive fewer obstacles to the adoption of a
technology will be more likely to adopt the IT. Other empirical studies have found that
obstacles are a significant barrier: to e-business adoption and use [Zhu et al., 2006b]; to e-

Chapter 8 - Understanding e-business adoption across industries in European countries
92
commerce migration [Hong and Zhu, 2006]; to ERP adoption [Pan and Jang, 2008]; and to
e-markets adoption [Johnson, 2010]. We postulate the following:
H1: Higher benefits combined with lower obstacles is a positive predictor of e-business
adoption.
8.2.1.2. Technology and organizational readiness
Technology readiness can be defined as technology infrastructure and IT human
resources [Zhu et al., 2006b]. Technology infrastructure establishes a platform on which
Internet technologies can be built; IT human resources provide the knowledge and skills to
develop web applications [Zhu and Kraemer, 2005]. E-business can become an integral
part of the value chain only if firms have infrastructures and technical skills. These factors
may enable the technological capacity of the firm to adopt e-business. However, firms that
do not have robust technology infrastructure and wide IT expertise may not wish to risk the
adoption of e-business, implying that firms with greater technology readiness are in a
better position to adopt e-business. Several empirical studies have identified technological
readiness as an important determinant of IT adoption [Armstrong and Sambamurthy, 1999,
Hong and Zhu, 2006, Iacovou et al., 1995, Kwon and Zmud, 1987, Pan and Jang, 2008,
Zhu, 2004a, Zhu et al., 2003, Zhu and Kraemer, 2005, Zhu et al., 2006b]. Therefore, we
postulate the following:
H2. The level of technology readiness is a positive predictor of e-business adoption.
Technology integration. Before the Internet, firms had been using technologies to support
business activities along their value chain, but many were ‘‘islands of automation’’ – they
lacked integration across applications [Hong and Zhu, 2006]. Evidence from the literature
suggests that integrated technologies help improve firm performance through reduced
cycle time, improved customer service, and lowered procurement costs [Barua et al.,
2004]. As a complex technology, e-business demands close coordination of various
components along the value chain. Correspondingly, a greater integration of existing
applications and the Internet platform represent a greater capacity for conducting business
over the Internet [Al-Qirim, 2007, Mirchandani and Motwani, 2001, Premkumar, 2003, Zhu
et al., 2006b]. We therefore postulate the following:
H3. The level of technology integration is a positive predictor of e-business adoption.

Chapter 8 - Understanding e-business adoption across industries in European countries
93
Firm size is one of the most commonly studied determinants of IT adoption [Lee and Xia,
2006]. Some empirical studies indicate that there is a positive relationship between the two
variables [Grover, 1993, Hsu et al., 2006, Pan and Jang, 2008, Premkumar et al., 1997,
Soares-Aguiar and Palma-Dos-Reis, 2008, Thong, 1999, Zhu et al., 2003]. However,
larger firms have multiple levels of bureaucracy and this can impede decision-making
processes regarding new ideas and projects [Hitt et al., 1990, Whetten, 1987]. Moreover,
e-business adoption often requires close collaboration and coordination that can be easily
achieved in small firms. There is also empirical evidence against this positive relationship
[Dewett and Jones, 2001, Harris and Katz, 1991, Martins and Oliveira, 2008, Oliveira,
2008, Zhu et al., 2006a, Zhu and Kraemer, 2005, Zhu et al., 2006b]. The actual adoption
of e-business may entail radical change in firms’ business processes and organization
structures, which might be hindered by the structural inertia of large firms [Damanpour,
1992]. In the opinion of Zhu and Kraemer [2005], size is often associated with inertia; that
is, large firms tend to be less agile and less flexible than small firms. The possible
structural inertia associated with large firms may slow down e-business adoption. Hence,
we postulate the following:
H4. Firm size is a negative predictor of e-business adoption.
8.2.1.3. Environmental and external pressure
Competitive pressure refers to the degree of pressure felt by the firm from competitors
within the industry. Porter & Millar [1985] analysed the strategic rationale underlying
competitive pressure as an innovation-diffusion driver. They suggested that, by using a
new innovation, firms might be able to alter the rules of competition, affect the industry
structure, and leverage new ways to outperform rivals, thus changing the competitive
landscape. This analysis can be extended to IT adoption. Empirical evidence suggests that
competitive pressure is a powerful driver of IT adoption and diffusion [Al-Qirim, 2007,
Battisti et al., 2007, Dholakia and Kshetri, 2004, Gibbs and Kraemer, 2004, Grandon and
Pearson, 2004, Hollenstein, 2004, Iacovou et al., 1995, Lai et al., 2007, Mehrtens et al.,
2001, Zhu et al., 2003]. Therefore, we assume that:
H5: Competitive pressure is a positive predictor of e-business adoption.

Chapter 8 - Understanding e-business adoption across industries in European countries
94
Trading partner collaboration is an important factor because the value of e-business can
be maximized only when many trading partners are using it [Iacovou et al., 1995]. As
suggested by empirical evidence, the success of e-business depends on the trading
partners’ readiness to jointly use the Internet to perform value chain activities [Barua et al.,
2004]. In a trading community with greater partner readiness, individual adopters reveal
higher levels of e-business usage due to network effects [Shapiro and Varian, 1999].
Some empirical researches suggest that trading partner is an important determinant for
EDI, e-procurement and e-business adoption and use [Iacovou et al., 1995, Lai et al.,
2007, Lin and Lin, 2008, Soares-Aguiar and Palma-Dos-Reis, 2008, Zhu et al., 2006a, Zhu
et al., 2003]. Thus, we expect that:
H6: Trading partner collaboration is a positive predictor of e-business adoption.
8.2.1.4. Controls
In this study, we need to control for type of industry and country effects. It is usual in IS
literature to use dummy variables to control these effects [Bresnahan et al., 2002, Soares-
Aguiar and Palma-Dos-Reis, 2008, Zhu et al., 2006a, Zhu et al., 2003]. We used dummy
variables to control for data variation that would not be captured by the explanatory
variables mentioned above.
8.4. Methods
8.4.1. Sample
Our data source is e-Business W@tch [2006a, w@tch, 2006b], which collects data on the
use of information communication technology (ICT) and e-business in European firms.
Pilot interviews were conducted with 23 companies in Germany in February 2006, in order
to test the questionnaire (structure, comprehensibility of questions). The sample drawn
was a random sample of firms from the respective industry population in each of the
countries, with the objective of fulfilling minimum strata with respect to company size class
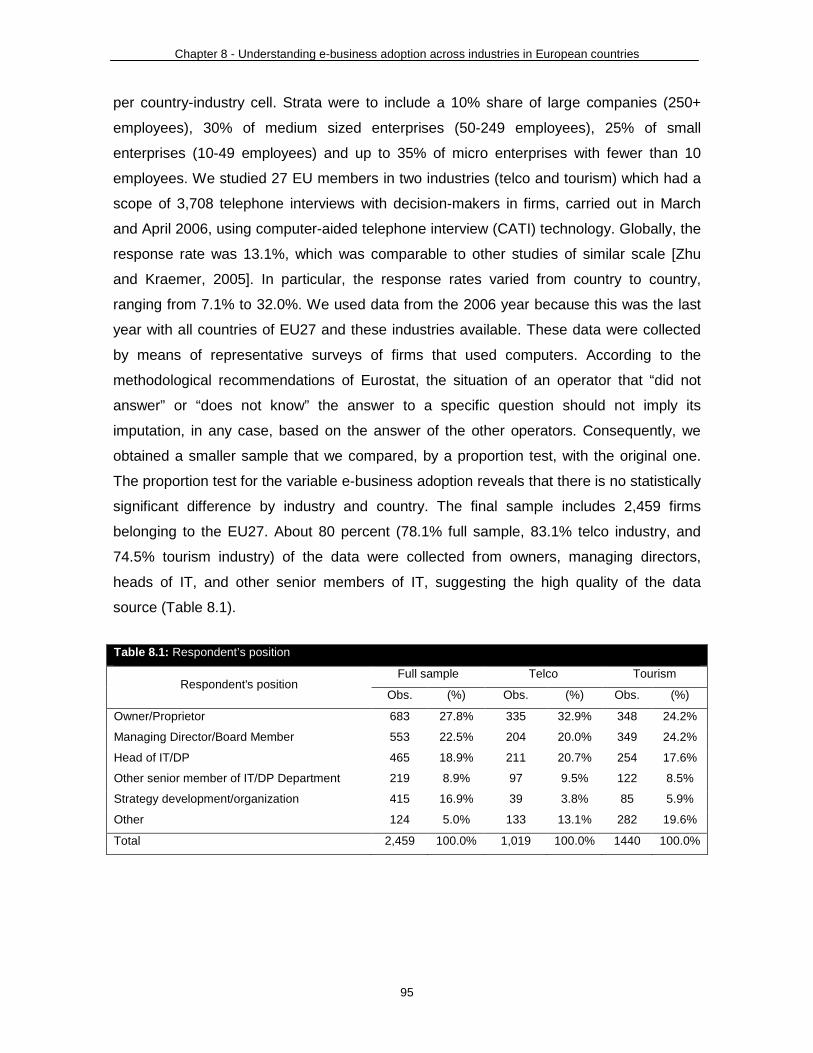
Chapter 8 - Understanding e-business adoption across industries in European countries
95
per country-industry cell. Strata were to include a 10% share of large companies (250+
employees), 30% of medium sized enterprises (50-249 employees), 25% of small
enterprises (10-49 employees) and up to 35% of micro enterprises with fewer than 10
employees. We studied 27 EU members in two industries (telco and tourism) which had a
scope of 3,708 telephone interviews with decision-makers in firms, carried out in March
and April 2006, using computer-aided telephone interview (CATI) technology. Globally, the
response rate was 13.1%, which was comparable to other studies of similar scale [Zhu
and Kraemer, 2005]. In particular, the response rates varied from country to country,
ranging from 7.1% to 32.0%. We used data from the 2006 year because this was the last
year with all countries of EU27 and these industries available. These data were collected
by means of representative surveys of firms that used computers. According to the
methodological recommendations of Eurostat, the situation of an operator that “did not
answer” or “does not know” the answer to a specific question should not imply its
imputation, in any case, based on the answer of the other operators. Consequently, we
obtained a smaller sample that we compared, by a proportion test, with the original one.
The proportion test for the variable e-business adoption reveals that there is no statistically
significant difference by industry and country. The final sample includes 2,459 firms
belonging to the EU27. About 80 percent (78.1% full sample, 83.1% telco industry, and
74.5% tourism industry) of the data were collected from owners, managing directors,
heads of IT, and other senior members of IT, suggesting the high quality of the data
source (Table 8.1).
Table 8.1: Respondent’s position
Respondent's position Full sample Telco Tourism
Obs. (%) Obs. (%) Obs. (%)
Owner/Proprietor 683 27.8% 335 32.9% 348 24.2%
Managing Director/Board Member 553 22.5% 204 20.0% 349 24.2%
Head of IT/DP 465 18.9% 211 20.7% 254 17.6%
Other senior member of IT/DP Department 219 8.9% 97 9.5% 122 8.5%
Strategy development/organization 415 16.9% 39 3.8% 85 5.9%
Other 124 5.0% 133 13.1% 282 19.6%
Total 2,459 100.0% 1,019 100.0% 1440 100.0%

Chapter 8 - Understanding e-business adoption across industries in European countries
96
8.4.2. Factor analysis and reliability test
As a first step, we performed a factor analysis (FA) of multi-item indicators to reduce the
number of variables of the survey and to evaluate the validity, which is a very common
analysis in innovation studies [Eid and Trueman, 2004, Oliveira and Martins, 2010a,
Premkumar et al., 1994, Tan et al., 2009, Thong, 1999, To and Ngai, 2006, Wei et al.,
2009]. We used the principal component technique with varimax rotation (see Table 8.2) to
extract four eigen-values, which were all greater than one. The first four factors explain
71.3% of the variance contained in the data. The Kaiser-Meyer-Olkin (KMO) measures the
adequacy of the sample; general KMO is 0.96 (KMO ≥ 0.90 is excellent [Sharma, 1996]),
which reveals that the matrix of correlation is adequate for the FA. The KMO for individual
variables is also adequate. All of the factors have a loading greater than 0.50 (except
indicator TI4). This indicates that our analysis employs a well-explained factor structure.
The four factors found are: perceived benefits and obstacles of e-business, technology
readiness, trading partner collaboration, and technology integration. The factors obtained
are in accordance with the literature review.
Reliability measures the stability of the scale based on an assessment of the internal
consistency of the items measuring the construct. It is assessed by calculating the
composite reliability for each composite independent variable. Most of the constructs have
a composite reliability over the cut off of 0.70, as suggested by Nunnally [1978]. Perceived
benefits and obstacles of e-business, technology readiness and trading partner
collaboration have a Cronbach’s alpha value respectively of 0.98, 0.77 and 0.82. The last
dimension, technology integration, comprises four items and has a Cronbach’s alpha value
of 0.61 which may be adequate for exploratory research. We decided to retain this
dimension as it relates to the important issue of technology integration in e-business
adoption. Thus, constructs developed by this measurement model could be used to test
the conceptual model and the associated hypotheses.

Chapter 8 - Understanding e-business adoption across industries in European countries
97
Table 8.2: Factor analysis
Items measured Factor 1 Factor 2 Factor 3 Factor 4
Perceived benefits and obstacles of e -business
Why did your company decide to engage in e-business activities? (0-not at all; 1-not
important; 2-important)
EB1 - Because your customers expected it from you 0.90 0.12 0.08 0.06
EB2 - Because your company believes that e-business will help to get an edge over
your competitors 0.90 0.11 0.09 0.06
EB3 - Because your competitors also engage in e-business 0.86 0.07 0.05 0.05
EB4 - Because your suppliers expected it from you 0.83 0.10 0.10 0.07
Important obstacles for not practicing e-business in your company? (0-not at all; 1-not
important; 2-important)
EO1 - My company is too small to benefit from any e-business activities -0.93 -0.10 -0.08 -0.03
EO2 - E-business technologies are too expensive to implement -0.94 -0.08 -0.06 -0.02
EO3 – The technology is too complicated -0.94 -0.08 -0.07 -0.02
EO4 - Our systems are not compatible with those of suppliers or customers -0.94 -0.06 -0.05 -0.01
EO5 - We are concerned about potential security risks and privacy issues -0.95 -0.05 -0.05 -0.02
EO6 - We think that there are important unsolved legal issues involved -0.95 -0.06 -0.06 -0.01
EO7 - It is difficult to find reliable IT suppliers -0.95 -0.07 -0.06 -0.01
Technology readiness
TR1 - Sum of the following network applications: a Local Area Network (LAN);
Wireless LAN; Voice-over-IP; Fixed line connections; Wireless-Local-Area-Networks
or W-LANs, Mobile communication networks; Virtual Private Network (VPN)
0.15 0.76 0.18 0.11
TR2 - Sum of the following questions ICT skills: your company currently employ ICT
practitioners; your company regularly send employees to ICT training programmes 0.12 0.72 0.06 0.19
TR3 - Sum of the following security applications: secure server technology, for
example SSL, TLS or a comparable technical standard; digital signature or public key
infrastructure; a firewall
0.20 0.67 0.21 0.08
TR4 - Sum of the following technologies: Internet; intranet; web site; 0.26 0.62 0.31 0.04
TR5 - Percentage of employees that have access to the Internet 0.06 0.55 0.25 -0.18
Trading partner collaboration
Does your company use online applications other than e-mail, to support any of the
following business functions (0-no, and not use Internet; 1-no; 2-yes)?
TP1 - To collaborate with business partners in the design of new products or services 0.13 0.17 0.89 0.04
TP2 - To collaborate with business partners to forecast product or service demand 0.13 0.15 0.88 0.11
Technology Integration
Does your company use any of the following systems or applications for managing
information in the company (0- do not know what this is; 1-no; 2-yes)?
TI1 - an EDM system, that is an Enterprise Document Management System 0.05 0.07 0.13 0.71
TI2 - an ERP system, that is Enterprise Resource Planning System 0.06 0.19 0.09 0.71
TI3 - a SCM system, that is a Supply Chain Management System 0.07 0.00 0.08 0.69
TI4 - Knowledge Management software 0.05 0.30 0.01 0.48

Chapter 8 - Understanding e-business adoption across industries in European countries
98
8.4.3. Data analysis and results
The independent variables are in accordance with our research model, which is a
combination of the Tornatzky and Fleischer [1990] model and the Iacovou et al. [1995]
model. Perceived benefits and obstacles of e-business, technology readiness, trading
partner collaboration, and technology integration were obtained by factor analysis. All the
other variables were obtained directly by the questionnaire. The dependent variable is e-
business adoption, a binary variable which has value equal to one if firms adopt e-
business and zero otherwise (Table 8.3).
Table 8.3: Description of independent variables
Variables Description
Perceived benefits
Perceived benefits and obstacles of e-
business FA index of perceived benefits and barriers of e-business
Technology and organization readiness
Technology readiness FA index of technology readiness
Technology integration FA index of technology integration
Firm size The logarithm number of employees
Environment and external pressure
Competitive pressure Dummy equal to one if firms think that ICT has an influence on
competition in your industry
Trading partner collaboration FA index of Trading partner
Controls
Country Twenty seven country dummies for 27 countries
Industry Two dummies for 2 industries
We began our analysis by checking the multi-collinearity, for which we calculated the
variance inflation factor (VIF) for the regression coefficients. The VIF ranged from a low of
1.06 to a high of 2.51. The values are below the threshold of 10, indicating that there is no
problem of multi-collinearity amongst the variables [Hair et al., 1998].
Since the dependent variable is binary (to adopt or not), we applied logistic regression to
test the research model, and used the significance of the regression coefficients to support
the hypotheses. We also computed marginal effects of independent variables. We

Chapter 8 - Understanding e-business adoption across industries in European countries
99
estimated three different regressions: one for the full sample, and one for each industry
(Table 8.4).
Table 8.4: Logistic regression for e-business adoption in all industries
Independent variables Full sample Telco Tourism
Coef. P-value Coef. P-value Coef. P-value
Perceived benefits and
obstacles of e-business 0.737*** 0.000 0.704*** 0.000 0.788*** 0.000
Technology readiness 0.788*** 0.000 0.727*** 0.000 0.857*** 0.000
Technology integration 0.141** 0.032 0.257** 0.026 0.087 0.288
Firm size 0.004 0.931 -0.066 0.371 0.025 0.651
Competitive pressure 0.527*** 0.000 0.482** 0.029 0.590*** 0.000
Trading partner collaboration 0.638*** 0.000 0.547*** 0.000 0.677*** 0.000
Sample size 2,459 1,019 1,440
Area under the curve (AUC) 0.834 0.820 0.847
Note: we also include dummies for the 27 countries in all regressions and industries dummies for
regressions of all industries; ; * p-value<0.10; ** p-value<0.05; *** p-value<0.01.
The goodness-of-fit for all regressions was assessed in three ways. First, to analyse the
joint statistical significance of the independent variables we computed the likelihood ratio
(LR) test, which is statistically significant (p-value<0.001 for each regression). This implies
a strong relationship between the dependent variable and the independent variables for
each regression. Secondly, we used the Hosmer-Lemeshow test [Hosmer and Lemeshow,
1980, Lemeshow and Hosmer, 1982], which reveals that there are no differences between
fitted values of the model and the actual values, for any of the three regressions (p-values
are respectively 0.38, 0.15, and 0.56). Finally, the discrimination power of the model is
evaluated in two ways. We use the area under the curve (AUC), which is equal to 83%,
82%, and 85% respectively for e-business adoption in full sample, telco, and tourism
industries. This reveals an excellent discrimination for all regressions [Hosmer and
Lemeshow, 2000]. We also computed the prediction accuracy: 81.2%, 84.5%, and 80.1%
respectively. The adoption by random choices ([adopters/(adopters + non-adopters)]2+
[non-adopters/(adopters + non-adopters)]2) would result in 64.0%, 71.8%, and 59.6%
respectively for each regression, which are much less than in the case of our regressions.
Thus we conclude that the logistic regressions have much higher discriminating power
than the random choice model. The three statistical procedures reveal a substantive model
fit, a satisfactory discriminating power, and there is evidence to accept an overall
significance of the models.

Chapter 8 - Understanding e-business adoption across industries in European countries
100
For the full sample regression, perceived benefits and obstacles of e-business, technology
readiness, technology integration, trading partner collaboration, and competitive pressure
are positively associated with e-business. All hypotheses (H1-H6) are confirmed except H4
(firm size). The same result is obtained for telco. For the tourism industry, the H1, H2, H5
and H6 are confirmed.
In deep analysis we computed the statistically significant marginal effects to test the
differences between telco and tourism industries (Table 8.5). Results reveal that marginal
effects for perceived benefits and obstacles of e-business, technology readiness, and
trading partner collaboration are significantly different between these two industries. In
other words, competitive pressure is the unique driver that has the same marginal effect in
both industries for e-business adoption.
Table 8.5: Marginal effects of logistic regression for e-business in all industries
Independent variables Marginal effects Telco vs. Tourism
Full Telco Tourism Two tailed test p-value
Perceived benefits and
obstacles of e-business 0.099*** 0.067*** 0.127***
-3.900 0.000
Technology readiness 0.106*** 0.069*** 0.139*** -3.253 0.001
Technology integration 0.019** 0.024** ns - -
Firm size ns ns ns - -
Competitive pressure† 0.076*** 0.051* 0.100*** -1.281 0.200
Trading partner 0.086*** 0.052*** 0.109*** -3.208 0.001
Note: we also include dummies for the 27 countries in all regressions and industry dummies for
regressions of all industries , ns – not significant; * p-value<0.10; ** p-value<0.05; *** p-value<0.01;
variables with “†” are binary.
8.5. Discussion and implications
The purpose of this paper was to identify the factors that explain e-business adoption and
to understand the extent to which the magnitude of these factors varies across the two
industries (telco and tourism industry) in the EU27 context. Our empirical results generally
support the model. In the perceived benefits dimension, the perceived benefits and
obstacles of e-business (H1) is a statistically significant facilitator for e-business adoption
in both industries (Table 8.4). Therefore, for managers who think that e-business

Chapter 8 - Understanding e-business adoption across industries in European countries
101
technologies are too expensive to implement, with the cost of technology decreasing, this
obstacle is transposed. Also, policy makers should regulate the Internet to make it a
reliable commerce platform (e.g., dealing with fraud and credit card misuse), and promote
the diffusion of the Internet amongst end-users. This measure solves two more obstacles
of e-business, which are: potential security risks and privacy issues, and legal issues
involved. Moreover, the marginal effects are different between telco and tourism industries
(Table 8.5). The tourism industry is the one where this variable is more important, perhaps
because in the telco industry the firms are more informed of the perceived benefits and
obstacles of e-business.
In the technology and organization readiness dimension, the technology readiness (H2) is
also a statistically significant facilitator for e-business adoption for all regressions. This
means that managers and policy makers should be aware that technology readiness is
constituted both by physical infrastructures and intangible knowledge, such as IT skills. For
managers, investments in physical infrastructure and the hiring of employees with IT skills
should be made; for current employees training programmes should be promoted. Policy
makers should promote the construction of infrastructures and reduce tax laws to stimulate
firms to provide IT training programmes to employees. This is in accordance with the
European Commission [2008] that claims that the importance of ICT skills – i.e.
professional skills, user skills, and e-business skills – for the competitiveness and growth
of the European economy has been confirmed in several high-level documents and
initiatives of the European Commission. The tourism industry reveals a statistically
significant higher relative importance (marginal effects) of technology readiness for e-
business adoption when compared with the telco industry. One possible explanation is that
tourism workers have less ICT skill and the tourism firms have fewer ICT infrastructures;
consequently, due to the lack of technology readiness, this variable is more important for
the tourism industry. Technology integration (H3) is a statistically significant facilitator only
in the telco industry (Table 8.4). One possible explanation is that as telco firms have higher
levels of IT knowhow, only these firms can take advantage of technology integration, i.e.,
improving firm performance, improving customer service, and lowering procurement costs
[Barua et al., 2004]. In particular, managers in the tourism industry need to improve
knowhow in IT workers, to take advantage of technology integration, which can provide
more flexible dynamic packaging (bundling products with flexibility). Dynamic package
depicts what is probably the most sophisticated and challenging e-business format in

Chapter 8 - Understanding e-business adoption across industries in European countries
102
tourism in terms of technology requirements [W@tch, 2007]. Firm size (H4) is not
statistically significant for e-business adoption in both industries. This result is in
accordance with literature where firm size is a “controversial” predictor for IT adoption.
This means that in the telco and tourism industries the advantage of the availability of
funds being greater for large firms [Iacovou et al., 1995, Rogers, 2003] does not prevail,
nor does the disadvantage of larger firms having multiple levels of bureaucracy, which can
impede decision-making processes regarding new ideas and projects [Hitt et al., 1990,
Whetten, 1987]. This reveals that e-business is not a phenomenon dominated by large
firms, this is special important for managers that think their firm is too small to benefit from
any e-business activities.
In the environment and external pressure dimension, the competitive pressure (H5) is a
statistically significant facilitator for e-business adoption in both industries (Table 8.4), and
there is no statistically significant difference in terms of magnitude of importance (Table
8.5). Hence, gaining competitive advantage is still one of the most important drivers of e-
business adoption; furthermore, managers should be aware that competitive pressure (H6)
has the same importance for e-business adoption across the industries, which reveals the
same level of competition in the online market. Trading partner collaboration is a
statistically significant facilitator for both industries (Table 8.4). Consequently, managers
and policy makers should encourage the formation of networks with other players and the
sharing of resources in order to satisfy the needs of diverse and ever faster changing
customer requirements. This, in turn, could increase the competiveness of the whole
network [W@tch, 2007]. Our analysis indicates a statistically significant higher magnitude
of trading partner collaboration for e-business adoption in the tourism industry when
compared to telco (Table 8.5). One possible explanation is that the trading partners are
less collaborative in the tourism industry than in the telco industry [W@tch, 2007].
There is at least one variable from each dimension that is statistically significant in e-
business adoption for the two industries; in the other words the main drivers of e-business
adoption across industries are perceived benefits and obstacles of e-business adoption,
technology readiness, competitive pressure, and trading partner; moreover, all three
dimensions proposed are relevant for e-business adoption across different industries in the
EU context. As the telco industry is the most intensive adopter and user of e-business
[W@tch, 2007], it can serve as an example for other industries, and there is a business

Chapter 8 - Understanding e-business adoption across industries in European countries
103
opportunity for this industry to provide e-business solutions for firms belonging to other
industries.
8.5.1. Theoretical implications
Whilst there are many theoretical studies of e-business adoption, comparisons across
industries are lacking. To promote e-business adoption and their comparison across
industries, it is critical to clarify the factors that explain e-business adoption, and to conduct
a deep analysis to understand if different industries have the same drivers for e-business
adoption. Based on the Tornatzky and Fleischer [1990] model and the Iacovou et al.
[1995] model, we define our research model to investigate the factors affecting the e-
business adoption across the telco and tourism industries. To the best of our knowledge,
this study is one of the first that examines adoption of e-business with a multi-industries
comparison of EU27 countries using a research model that combines these two models.
Using empirical data from 2,459 firms belonging to the EU27, from two different industries,
we found strong support for our research model, the three dimensions proposed are
important for both industries. Moreover, we also found differences in the relative
importance of drivers for e-business adoption for the different industries. Our results reveal
that to better understand e-business adoption it is not sufficient to use industry as a control
variable. It is more adequate to estimate a model for each industry. This is one of the first
research efforts to provide concrete empirical support for the theories of e-business
adoption in the EU27 context comparing two different industries. As the sample was not
limited to data from a single country, this helps to strengthen the generalization of the
model and findings.
8.6. Conclusions
E-business adoption enables the firm to perform electronic transactions along value chain
activities [Straub and Watson, 2001, Zhu and Kraemer, 2002]. To promote e-business
adoption, it is critical to clarify the factors that explain this adoption, and make a deep
analysis to understand if different industries have the same drivers for e-business

Chapter 8 - Understanding e-business adoption across industries in European countries
104
adoption. These have special importance, since recent findings reveal that in Europe the
most relevant factor to characterize e-business adoption is the industry and its specific
characteristics, and not the country that the firms belong to [Oliveira and Martins, 2010a].
In this paper, we have established and empirically tested the prediction model of the six
determinants of e-business. In general, our hypotheses are confirmed, our research model
seems appropriate. The perceived benefits and obstacles of e-business, technology
readiness, competitive pressure, and trading partner collaboration are the drivers that are
important for all industries. Through the comparison of the industries, we can verify that
there are statistically significant differences between the telco and tourism industries. The
relative importance of all drivers for e-business adoption in the telco differs from the
tourism. The only exception is competitive pressure, where there is no difference between
these industries.
8.7. Limitations and future studies
As in most empirical studies, our work is limited in some ways. Firstly, the cross-sectional
nature of this study does not allow knowing how this relationship will change over time. To
solve this limitation, future research should involve panel data. Secondly, our study
investigates only adoption decisions. To provide a more balanced view of firms’ adoption
and assimilation of e-business into the core business activities, the extent of e-business
migration from traditional platform to the Internet should also be examined, as suggested
by Hong & Zhu [2006]. Thirdly, we did not include the government regulation variables in
our model because these variables are not available in this questionnaire. A new
questionnaire should therefore be constructed for in further research. Fourthly, in the
tourism industry the rate of adoption between business-to-business (B2B) and business-
to-consumer (B2C) is different. Further research is needed to understand the different
drivers of B2B and B2C, and across industries. Finally, we fully encourage confirmatory
studies of our research model; and urge future researchers to test it in different contexts. It
should be applied to other IT adoptions in order to be refined. Others studies with new
samples should be used for the validation of our model. Samples of specific context or
industry, such as manufacturing or service, should be gathered to further examine the
applicability of this model.
Chapter 9 – Understanding B2B e-Commerce Adoption and Usage in Europe: Findings from 27 European
Countries
105
Chapter 9 – Understanding B2B e-commerce adoption
and usage in Europe: findings from 27 European
countries
9.1. Introduction
The European Commission [2005] claims that more efforts are needed to improve the
business process in European firms if the Lisbon treaty targets of competitiveness are to
be achieved. Under the pressure of their main international competitors, European firms
need to find new opportunities to reduce costs, improve performance and identify the
extent to which there are common behaviours across them. Currently the European Union
(EU) has 27 members with different patterns of e-business readiness [Castaings and
Tarantola, 2008]. To the best of our knowledge, very limited empirical research has been
undertaken to evaluate the determinants of business-to-business (B2B) e-commerce
usage within this context. This study aims to fill this gap, particularly since B2B e-
commerce has been identified as an emerging trend [Claycomb et al., 2005] that is
expected to grow ten times, totalling $12.4 trillion worldwide by 2012 [IDC, 2008].
In order to study B2B usage amongst 27 European countries (hereafter referred to as
EU27), we use Pettigrew and Whipp’s [1991] contextualist theory of organizational change
as a meta theorizing framework. Our research suggests a fresh understanding of B2B e-
commerce usage amongst countries, besides providing guidelines to policymakers and
practitioners. The paper is organized as follows. First we present the theories and
literature review. Then, we describe the research model and hypothesis. Finally, we
evaluate and test our model, discuss the key findings and present the main conclusions.
9.2. Informing literature and research model
B2B e-commerce adoption can be analyzed along three dimensions – the context, content
and process of change (based on Pettigrew and Whipp [1991]). This is largely because

Chapter 9 – Understanding B2B e-Commerce Adoption and Usage in Europe: Findings from 27 European
Countries
106
variables in the context affect the content of B2B adoption, which in turn affect the
processes in place, that allow for adequate adoption. B2B e-commerce usage therefore
ought to be studied by including an analysis of the internal and external context, the
process and the content [Magnusson, 2004]. The context explains why and where B2B e-
commerce adoption and usage is initiated [Pettigrew, 1985], and that there are internal
and external factors that affect B2B e-commerce adoption and usage in the firms
[Serafeimidis and Smithson, 2000]. The content is a crucial factor in any information
technology (IT) adoption study and is an understanding of what is being adopted. In our
case, it explains the benefits and obstacles in using B2B e-commerce [Stockdale and
Standing, 2006]. The process is how the change is implemented [Pettigrew, 1985]. In our
case, it explains how B2B e-commerce is implemented by firms, why the firms need
technology readiness/resource and the extent of the integration of technology across
different processes.
9.2.1. Context dimension
In the context dimension includes internal factors like firm size and education level of
employees and managers and external factors such as competitive pressure and trading
partner collaboration.
Internal context
Firm size is one of the most commonly studied determinants of IT adoption [Lee and Xia,
2006]. Different firm sizes have different characteristics with regard to B2B e-commerce
adoption and usage. Large firms have financial advantages although they have multiple
levels of bureaucracy, which can impede decision making processes concerning new
ideas and projects [Hitt et al., 1990, Whetten, 1987]. Smaller firms have ‘behavioral
advantage’ whereby it is easier to get the close collaboration and coordination that is
required for B2B e-commerce adoption and usage. The education level of workers in a firm
is also an important factor. As the presence of skilled labor in a firm increases, its ability to
absorb and make use of an IT innovation also increases [Martins and Oliveira, 2007].
Therefore, education level is an important determinant of B2B e-commerce adoption and

Chapter 9 – Understanding B2B e-Commerce Adoption and Usage in Europe: Findings from 27 European
Countries
107
usage, since usually the successful implementation of B2B e-commerce requires complex
skills.
In information systems (IS) and organizational research literatures, the importance of size
as a predictor of IT adoption and the direction and nature of the causal influence of size
has been persistently controversial [Ettlie and Rubenstein, 1987]. Some empirical studies
indicate that there is a positive relationship between the two variables [Grover, 1993, Hsu
et al., 2006, Pan and Jang, 2008, Premkumar et al., 1997, Soares-Aguiar and Palma-Dos-
Reis, 2008, Thong, 1999, Zhu et al., 2003]. However, there is also empirical evidence
suggesting otherwise [Dewett and Jones, 2001, Harris and Katz, 1991, Martins and
Oliveira, 2008, Oliveira, 2008, Zhu et al., 2006a, Zhu and Kraemer, 2005, Zhu et al.,
2006b]. The actual adoption of B2B e-commerce may entail bringing about a radical
change in firms’ business processes and organization structures, which might be hindered
by the structural inertia of large firms [Damanpour, 1992]. In our study, firm size is defined
by the logarithm number of employees in the organization. Because our model has other
exploratory variables such as process dimension (technology readiness and technology
integration) that large firms may possess, the notion of structural inertia leads us to expect
that large firm size may deter B2B adoption and usage. Hence, we postulate the following:
H1a: Firm size is a negative predictor for B2B e-commerce adoption
H1b: Firm size is a negative predictor for B2B e-commerce usage
The overall capacity of the organization to evaluate technological opportunities (for
example B2B) in the areas of its activity depends primarily on human capital and
knowledge of the organization [Cohen and Levinthal, 1989]. The profound changes that IT
requires, needs workers with higher level education. In this study, education level is
measured by the percentage share of employees having a college or university degree in
the firm. It is expected to exert a positive impact on the adoption and usage of IT [Battisti
et al., 2007, Bresnahan et al., 2002, Brynjolfsson and Hitt, 2000, Giunta and Trivieri, 2007,
Hollenstein, 2004, Martins and Oliveira, 2007]. We hypothesize the following:
H2a: Workers’ educational level is a positive predictor for B2B e-commerce adoption
H2b: Workers’ educational level is a positive predictor for B2B e-commerce usage

Chapter 9 – Understanding B2B e-Commerce Adoption and Usage in Europe: Findings from 27 European
Countries
108
External context
Competitive pressure refers to the degree of pressure felt by the firm from competitors
within the industry. Pressure from competitors has been identified as an important driving
force in the external context [Premkumar et al., 1997]. Porter & Millar [1985] identified the
strategic rationale underlying competitive pressure as an innovation-diffusion driver. They
suggested that, by incorporating an innovation, firms might be able to alter the rules of
competition, affect the industry structure, and leverage new ways to outperform rivals- thus
changing the competitive landscape. This analysis can be extended to B2B e-commerce
adoption and usage. Trading partner collaboration is an important factor because the value
of B2B e-commerce can be maximized only when many trading partners are using B2B e-
commerce [Iacovou et al., 1995].
Competitive pressure is a recognizable driving force for new technology usage; it tends to
stimulate companies to seek competitive edge by using innovations [Gatignon and
Robertson, 1989]. This study defines competitive pressure as the notion of firms that
information communication technology (ICT) has an influence on competition in their
sector. Several studies have identified competitive pressure as a powerful determinant of
degree of computerization [Dasgupta et al., 1999]; adoption and usage of
interorganizational systems [Grover, 1993]; electronic data interchange (EDI) adoption
[Iacovou et al., 1995] or EDI usage [Ramamurthy et al., 1999]; e-commerce adoption
[Dholakia and Kshetri, 2004] or e-commerce usage [Gibbs and Kraemer, 2004]; e-
procurement systems [Soares-Aguiar and Palma-Dos-Reis, 2008]; and e-business
adoption [Zhu et al., 2003] or e-business usage [Lin and Lin, 2008, Zhu et al., 2006a, Zhu
and Kraemer, 2005]. Furthermore, B2B facilitates inter-firm collaboration to improve
transactional efficiencies, expand existing channels, and maximize advantages from new
opportunities. Firms that are first-movers in deploying B2B have tended to derive the
greatest advantages. Hence, highly competitive pressure promotes the implementation
and operation of most successful B2B adoption and usage. Therefore, we hypothesize
that:
H3a: Competitive pressure is a positive predictor for B2B e-commerce adoption
H3b: Competitive pressure is a positive predictor for B2B e-commerce usage

Chapter 9 – Understanding B2B e-Commerce Adoption and Usage in Europe: Findings from 27 European
Countries
109
In this study, trading partner collaboration is defined as cooperation between business
partners to design and forecast products or service. As suggested by empirical evidence,
the success of B2B e-commerce depends on the trading partners’ readiness to jointly use
the Internet to perform value chain activities [Barua et al., 2004]. In a trading community
with greater partner readiness, individual adopters reveal higher levels of e-business
usage due to network effects [Shapiro and Varian, 1999]. Some empirical researches
suggest that trading partner is an important determinant for EDI, e-procurement and e-
business adoption and usage [Iacovou et al., 1995, Lin and Lin, 2008, Soares-Aguiar and
Palma-Dos-Reis, 2008, Zhu et al., 2006a, Zhu et al., 2003]. Thus, we expect that:
H4a: Trading partner collaboration is a positive predictor for B2B e-commerce
adoption
H4b: Trading partner collaboration is a positive predictor for B2B e-commerce usage
9.2.2. Content dimension
The content of change aims to answer the question – what are the benefits and obstacles
to usage of B2B e-commerce? Perceived benefits refer to the anticipated advantages that
B2B e-commerce adoption and usage can provide to an organization. Better managerial
understanding of the relative advantage of an innovation increases the likelihood of the
allocation of the managerial, financial and technological resources necessary to use that
innovation [Iacovou et al., 1995, Rogers, 1995]. Perceived obstacles are particularly
important because these can be critical in making the adoption and usage process seem
more complicated and costly [Hong and Zhu, 2006, Pan and Jang, 2008, Zhu et al.,
2006b].
Previous studies argue that firms using B2B e-commerce may obtain such benefits as
sales increase, new market penetration and cost reduction [Zhu and Kraemer, 2002, Zhu
et al., 2004]. Consequently, the success of B2B e-commerce adoption and usage depends
of the perceived benefits by management. Other empirical studies also validate the fact
that positive perceptions of benefits of an innovation provide an incentive for use of an
innovation [Beatty et al., 2001, Gibbs and Kraemer, 2004, Grover and Teng, 1994, Hsu et
al., 2006, Iacovou et al., 1995, Kuan and Chau, 2001, Lin and Lin, 2008, Premkumar et al.,
1994, Son et al., 2005]. Therefore, the following hypotheses are generated:

Chapter 9 – Understanding B2B e-Commerce Adoption and Usage in Europe: Findings from 27 European
Countries
110
H5a: Perceived benefit is a positive predictor for B2B e-commerce adoption
H5b: Perceived benefit is a positive predictor for B2B e-commerce usage
In our study, perceived obstacles refer to the anticipated impediments to adoption of e-
business in an organization. The adoption of B2B e-commerce requires a substantial
degree of technical and organizational competence for smooth transition [Hong and Zhu,
2006]; and these perceived barriers can result in resistance from users. As a
consequence, it is essential to reduce the perceived barriers. The greater the top
management's support, the easier it is for the organization to overcome difficulty and
complexity of IT adoption [Bajwa et al., 2004, Cho, 2006, Hwang et al., 2004, Nah and
Delgado, 2006, Premkumar and Ramamurthy, 1995, Umble et al., 2003]. Cho [2006]
concluded that firms that perceive fewer obstacles to the adoption of a technology will be
more likely to adopt the IT. Other empirical studies found that obstacles are a significant
barrier to e-business adoption and usage [Zhu et al., 2006b], e-commerce migration [Hong
and Zhu, 2006], and to ERP adoption [Pan and Jang, 2008]. So we hypothesize the
following:
H6a: Perceived obstacles is a positive predictor for B2B e-commerce adoption
H6b: Perceived obstacles is a positive predictor for B2B e-commerce usage
9.2.3. Process dimension
The process dimension refers to technology readiness of firms and the extent to which a
technology is integrated in the firm across different processes. Technology readiness can
be defined as technology infrastructure and IT human resources [Mata et al., 1995].
Technology infrastructure establishes a platform on which Internet technologies can be
applied to institute a web presence for the business. IT human resources provide the
knowledge and skills to develop web applications [Zhu and Kraemer, 2005]. Before the
Internet, firms had been using technologies to support business activities along their value
chain, but many were ‘‘islands of automation’’ – as in they lacked integration across
applications [Weill and Broadbent, 1998]. Evidence from literature suggests that integrated
technologies help improve firm performance through reduced cycle time, improved
customer service and lowered procurement costs [Barua et al., 2004]. As a complex
technology, B2B e-commerce demands close coordination of various components along

Chapter 9 – Understanding B2B e-Commerce Adoption and Usage in Europe: Findings from 27 European
Countries
111
the value chain. Correspondingly, a greater integration of existing applications and the
Internet platform represent a greater capacity for conducting business over the Internet [Al-
Qirim, 2007, Mirchandani and Motwani, 2001, Premkumar, 2003, Zhu et al., 2006b].
B2B e-commerce can become an integral part of the value chain only if firms have the
requisite infrastructure and technical skills. These factors can facilitate and enable the
technological capacity of the firm to adopt and use B2B e-commerce. However, firms that
do not have robust technology infrastructure and wide IT expertise, may not want to risk
the adoption of B2B e-commerce. This means that firms with greater technology readiness
are in better position to adopt and use B2B e-commerce. Several empirical studies have
identified technological readiness as an important determinant of IT adoption [Armstrong
and Sambamurthy, 1999, Hong and Zhu, 2006, Iacovou et al., 1995, Kwon and Zmud,
1987, Pan and Jang, 2008, Zhu, 2004b, Zhu et al., 2003, Zhu and Kraemer, 2005, Zhu et
al., 2006b]. Therefore, we postulate the following:
H7a: Higher level of technology readiness is a positive predictor for B2B e-
commerce adoption
H7b: Higher level of technology readiness is a positive predictor for B2B e-
commerce usage
Like Hong and Zhu (2006), we also define technology integration as the extent to which
various technologies and applications are represented on the web platform. Technology
integration enables firms to continuously improve and innovate by identifying and sharing
information across products/services/business units to enhance organizational knowledge
and readiness [Barua et al., 2004]. Therefore, the success of B2B e-commerce adoption
and usage depends of the level of technology integration. Some empirical studies have
found that technology integration is positively related to e-business adoption and usage
[Zhu et al., 2006b] and also to e-commerce adoption [Hong and Zhu, 2006]. Hence, we
postulate the following:
H8a: Higher level of technology integration is a positive predictor for B2B e-
commerce adoption
H8b: Higher level of technology integration is a positive predictor for B2B e-
commerce usage

Chapter 9 – Understanding B2B e-Commerce Adoption and Usage in Europe: Findings from 27 European
Countries
112
9.2.4. Controls
In cross-sectional studies, control variables need to be incorporated to better explain
variation in adoption and usage. In this study we need to control the type of industry and
country effects. It is usual in IS literature to use dummy variables to control these effects
[Bresnahan et al., 2002, Soares-Aguiar and Palma-Dos-Reis, 2008, Zhu et al., 2006a, Zhu
et al., 2003]. We used dummy variables to control data variation that could not be captured
by the explanatory variables mentioned above.
9.2.5. Research model
We developed a conceptual model based on an adaptation of the theory of contextualist
by Pettigrew and Whipp [1991] and IT adoption literature for explaining B2B e-commerce
adoption and usage (see Figure 9.1).
Internal
Process
Outcomes
B2B adoption
B2B usage (volume)H7a, b
ContentH8a, b
Perceived obstacles
of e-business
Perceived benefits of
e-business
Technology
readiness
Technology
integration
Firm size
Education level
Competitive
pressure
Trading partner
collaborationH1a, b H3a, b
H2a, b H4a, b
ExternalContext
H6a, b
H5a, b
Controls
Country
Industry
Figure 9.1. Research model based on three essential dimensions of strategic change of Pettigrew
and Whipp [1991]
The dependent variables are the B2B e-commerce adoption and usage (volume). We
stipulate eight hypotheses, that emerge from the literature review for each (i.e., H1a-H8a
for B2B e-commerce adoption and H1b-H8b for B2B e-commerce usage, i.e. volume): four
for context dimension (firm size, education level, competitive pressure and trading partner

Chapter 9 – Understanding B2B e-Commerce Adoption and Usage in Europe: Findings from 27 European
Countries
113
collaboration); two for the content dimension (perceived benefits of e-business and
perceived obstacles of e-business); and two more for process dimension (technology
readiness and technology integration).
9.3. Methods and data analysis
Our data source is e-Business W@tch [2006a, w@tch, 2006b], which collects data on the
use of ICT and e-business in European firms. Pilot interviews were conducted with 23
companies in Germany in February 2006, in order to test the questionnaire (structure,
comprehensibility of questions). A random sample of firms was drawn from the respective
sector populations in each of the countries. The objective was to fulfill minimum strata with
respect to company size class per country sector cell. Strata were to include a 10% share
of large companies (250+ employees), 30% of medium sized enterprises (50-249
employees), 25% of small enterprises (10-49 employees), and up to 35% of micro
enterprises with less than 10 employees. We studied EU27 members in eight sectors (food
and beverages, footwear, pulp and paper, ICT manufacturing, consumer electronics,
construction, tourism and telecommunications) which had a scope of 12,343 telephone
interviews which were conducted with decision-makers in firms using computer-aided
telephone interview (CATI) technology. The response rates varied from country to country,
ranging from 7.1% to 32.0%. We used data from 2006 because it was the last year with
EU27 data available. This data was collected by means of representative surveys of firms
that used computers. According to the methodological recommendations of Eurostat, the
situation of an operator that “did not answer” or “does not know” the answer to a specific
question should not imply its imputation based on the answer of the other operators.
Consequently, we obtained a smaller sample that we compared through a proportion test,
with the original one. The proportion test for the variable B2B e-commerce adoption by
industry reveals that Bulgaria is the only country with statistically significant differences.
For this reason we excluded it from our analysis. We also excluded Malta for the reasons
that we will see in the cluster of countries section. The final sample includes 6,973 firms
belonging to the EU27 members excluding Bulgaria and Malta. About 80 percent (79.0%)
of the data was collected from owners, managing directors, heads of IT, and other senior
members of IT, confirming the high quality of the data source (Appendix F).

Chapter 9 – Understanding B2B e-Commerce Adoption and Usage in Europe: Findings from 27 European
Countries
114
9.3.1. Validity and reliability
As a first step, we performed a factor analysis (FA) of multi-item indicators to reduce the
number of variables of the survey and to evaluate the validity. We used the principal
component technique with varimax rotation (see Table 9.1) to extract four eigenvalues,
which were all greater than one. The first four factors explain 70.1% of variance contained
in the data. Kaiser-Meyer-Olkin (KMO) measures the adequacy of sample; general KMO is
0.96 (KMO ≥ 0.90 is excellent [Sharma, 1996]), which reveals that the matrix of correlation
is adequate for FA. The KMO for individual variables is also adequate. All the factors have
a loading greater than 0.50 (except item TI4). This indicates that our analysis employs a
well-explained factor structure. The four factors found are: perceived benefits and
obstacles of e-business, Internet penetration, technology readiness and technology
integration. The factors obtained are in accordance with the literature review. However,
there are two variables (perceived benefits and perceived obstacles) that were aggregated
during the factor analysis. This reveals that content dimension does not have two different
variables – perceived benefits and perceived obstacles, but only one that aggregates
these two variables. The perceived obstacles of e-business constitute the negative aspect,
while perceived benefits of e-business relate to the positive.
Reliability measures the stability of the scale based on an assessment of the internal
consistency of the items measuring the construct. It is assessed by calculating the
composite reliability for each composite independent variable. Most of the constructs have
a composite reliability over the cut off of 0.70, as suggested by Nunnally [1978]. Perceived
benefits and obstacles of e-business, technology readiness and trading partner
collaboration have a Cronbach’s alpha value of 0.98, 0.77 and 0.81 respectively. The last
dimension - technology integration, comprises four items and has a Cronbach’s alpha
value of 0.59, which may be adequate for exploratory research, which is in the early
stages of basic research. Nunnally [1978] suggests that reliabilities of 0.50 to 0.60 to
suffice. We decided to retain this dimension as it relates to the important issue of
technology integration in B2B e-commerce adoption and usage. Thus, constructs
developed by this measurement model could be used to test the conceptual model and the
associated hypotheses.

Chapter 9 – Understanding B2B e-Commerce Adoption and Usage in Europe: Findings from 27 European
Countries
115
Table 9.1: Factor and validity analysis and description of multi-item indicators used in FA
Items measure F1 F2 F3 F4
Perceived benefits and obstacles of e -business
Why did your company decide to engage in e-business activities? (0-not at all; 1-not
important; 2-important)
EB1 - Because your customers expected it from you 0.90 0.10 0.09 0.07
EB2 - Because your company believes that e-business will help to get an edge over
your competitors 0.89 0.11 0.10 0.06
EB3 - Because your competitors also engage in e-business 0.87 0.07 0.08 0.05
EB4 - Because your suppliers expected it from you 0.86 0.08 0.10 0.06
Important obstacles for not practising e-business in your company? (0-not at all; 1-not
important; 2-important)
EO1 - My company is too small to benefit from any e-business activities -0.92 -0.11 -0.09 -0.04
EO2 - E-business technologies are too expensive to implement -0.94 -0.09 -0.07 -0.02
EO3 – The technology is too complicated -0.94 -0.09 -0.06 -0.02
EO4 - Our systems are not compatible with those of suppliers or customers -0.94 -0.07 -0.06 -0.01
EO5 - We are concerned about potential security risks and privacy issues -0.94 -0.06 -0.05 -0.01
EO6 - We think that there are important unsolved legal issues involved -0.95 -0.07 -0.06 -0.01
EO7 - It is difficult to find reliable IT suppliers -0.95 -0.07 -0.05 -0.01
Technology readiness
TR1 - Sum of the following network applications: a Local Area Network (LAN);
Wireless LAN; Voice-over-IP; Fixed line connections; Wireless-Local-Area-Networks
or W-LANs, Mobile communication networks; Virtual Private Network (VPN)
0.17 0.75 0.16 0.15
TR2 - Sum of the following questions ICT skills: your company currently employs ICT
practitioners; your company regularly sends employees to ICT training programmes 0.13 0.70 0.05 0.20
TR3 - Sum of the following security applications: secure server technology, for
example SSL, TLS or a comparable technical standard; digital signature or public key
infrastructure; a firewall
0.21 0.65 0.20 0.06
TR4 - Sum of the following technologies: Internet; intranet; web site; 0.23 0.62 0.33 0.07
TR6 - Percentage of employees that have access to the Internet 0.10 0.53 0.22 -0.28
Trading partner collaboration
Does your company use online applications other than e-mail, to support any of the
following business functions (0- no, and not use Internet; 1-no; 2-yes)?
TPC1 To collaborate with business partners to forecast product or service demand 0.15 0.15 0.88 0.05
TPC2 To collaborate with business partners in the design of new products or services 0.15 0.14 0.88 0.08
Technology integration
Does your company use any of the following systems or applications for managing
information in the company (0-do not know what this is; 1-no; 2-yes)?
TI1 - an EDM system, that is an Enterprise Document Management System 0.07 0.06 0.12 0.68
TI2 - a SCM system, that is a Supply Chain Management System 0.08 0.02 0.11 0.68
TI3 - an ERP system, that is Enterprise Resource Planning System 0.05 0.28 0.06 0.66
TI4 - Knowledge Management software 0.05 0.25 0.04 0.47
Eigen value 9.50 2.40 1.88 1.75
Percen tage of variance explained 43.18 10.93 8.53 7.06
Note: variables are marked according to factor loading

Chapter 9 – Understanding B2B e-Commerce Adoption and Usage in Europe: Findings from 27 European
Countries
116
9.3.2. B2B e-commerce adoption and usage
The dependent variables are B2B e-commerce adoption and usage (Figure 9.2). B2B e-
commerce adoption is a binary variable, which is equal to one if firms adopt B2B e-
commerce, otherwise it is zero. Since the dependent variable is binary (to adopt or not), a
logistic regression is developed. Similar regressions have been used in the IS literature to
study open system adoption [Chau and Tam, 1997], EDI adoption [Kuan and Chau, 2001] ,
IT outsourcing [Bajwa et al., 2004] and e-business adoption [Pan and Jang, 2008, Zhu et
al., 2003]. For firms that adopt B2B e-commerce (4,347 firms), we analyzed B2B e-
commerce usage, which is an ordered variable that ranges between 0 to 4 according to
the online orders volume percentage (Figure 9.2). An ordered logistic regression is
developed (we have 108 missing observations for B2B e-commerce usage). This is
because the dependent variable is also ordered. The ordered logistic regression is not
common in IS areas, but it is adequate for an ordered dependent variable.
Figure 9.2. Dependent variables
The independent variables are in accordance with our research model. As we have seen,
the perceived benefits and obstacles of e-business, technology readiness, trading partner
collaboration and technology integration were obtained by factor analysis. All the others
variables were obtained directly by the questionnaire. The description of independent
variables is in Table 9.2.

Chapter 9 – Understanding B2B e-Commerce Adoption and Usage in Europe: Findings from 27 European
Countries
117
Table 9.2: Description of independent variables Variables Description
Context
Firm size The logarithm number of employees
Education level The percentage share of employees with a college or university degree in the firm
Competitive pressure Dummy =1 if firms think that ICT has an influence on competition in their sector
Trading partner collaboration FA index of trading partner collaboration
Content
Perceived benefits and
obstacles of e-business FA index of perceived benefits and obstacles of e-business
Process
Technology readiness FA index of technology readiness
Technology integration FA index of technology integration
Controls
Country Twenty five dummies for 25 countries
Industry Eight dummies for 8 industries
In this section we analyze determinants of B2B e-commerce adoption and usage across
EU27 (excluding Bulgaria and Malta). For doing this, we use logistic regression and
ordered logistic regression respectively. Goodness-of-fit for both regressions is analyzed,
and B2B e-commerce adoption is assessed in three ways. First, to analyse the joint
statistical significance of the independent variables, we computed the likelihood ratio (LR)
test, which is statistically significant (p-value<0.001). This implies a strong relationship
between the dependent variable and the independent variables for each model. Secondly,
we used the Hosmer-Lemeshow [1980] test, which reveals that there are no differences
between fitted values of the model and the actual values (p-values is 0.224). Finally, the
discrimination power of the model has been evaluated in two ways. We use the area under
curve (AUC), which is equal to 0.798. This reveals an excellent discrimination power for
B2B e-commerce adoption [Hosmer and Lemeshow, 2000]. We also computed the
prediction accuracy, which is 73.0%. The adoption by random choices
([adopters/(adopters + non-adopters)]2 + [non-adopters/(adopters + non-adopters)]2) would
result in 53.1% for B2B e-commerce adoption, which is much less than in the case of our
regressions. Thus we conclude that the logistic regression has much higher discriminating
power than the random choice. We also analysed goodness-of-fit for B2B e-commerce
usage by computing the joint statistical significance of the independent variables - the LR
test, which is statistically significant (p-value<0.001). The statistical procedures reveal a

Chapter 9 – Understanding B2B e-Commerce Adoption and Usage in Europe: Findings from 27 European
Countries
118
substantive model fit and a satisfactory discriminating power, and there is evidence to
encourage the acceptance of an overall significance of the regressions.
As can be seen in Table 9.3, for B2B e-commerce adoption and usage, the education
level, competitive pressure, trading partner collaboration, perceived benefits and obstacles
of e-business, technology readiness and technology integration confirm their roles as
significant adoption and usage facilitators; whereas the significantly negative coefficients
show that firm size inhibits B2B adoption and usage. All of the stipulated hypotheses are
supported, which reveals that the research model proposed with three dimensions
(context, content and process) is adequate.
Table 9.3: Results of logistic regression for B2B e-commerce adoption and ordered logistic
regression for B2B e-commerce usage
Independent variables
B2B e-commerce adoption
(logistic regression)
B2B e-commerce usage
(ordered logistic regression)
Coef. P-value Coef. P-value
Firm size -0.044** 0.043 -0.200*** 0.000
Education level 0.002** 0.039 0.003*** 0.008
Competitive pressure 0.199*** 0.002 0.265*** 0.000
Trading partner collaboration 0.541*** 0.000 0.277*** 0.000
Perceived benefits and
obstacles of e-business 0.649*** 0.000 0.458*** 0.000
Technology readiness 0.521*** 0.000 0.450*** 0.000
Technology integration 0.087** 0.010 0.100*** 0.001
Country dummies Included Included
Industry dummies Included Included
Sample size 6,973 4,239
Note: * p-value<0.10; ** p-value<0.05; *** p-value<0.01.
9.3.3. Cluster analysis of countries
To understand the pattern of ICT adoption across the EU27 members, we used data from
the 2006 EU information society statistics (ISS) firm survey, provided by Eurostat. We
measured the ICT readiness index using two score variables related to ICT adoption and
usage [Castaings and Tarantola, 2008] for each country. Since some data was missing in
the case of Malta, we excluded Malta. We considered only 25 members in our final data
set, because we also excluded Bulgaria as explained in the research methods section.

Chapter 9 – Understanding B2B e-Commerce Adoption and Usage in Europe: Findings from 27 European
Countries
119
Cluster analysis was used to identify how many groups of countries exist with similar ICT
patterns. We began by performing a hierarchical cluster analysis that suggests an optimal
number of clusters equal to three (see Appendix G). The results were validated by a non-
hierarchical method (k-means). According to Sharma [1996], this is the best solution to
obtain clusters. The three clusters of countries are depicted in Figure 9.3. The first group
can be identified as the ‘high ICT readiness group’. It contains eleven countries coming
from the EU15: Denmark, Netherlands, Ireland, Germany, Finland, Sweden, Austria,
France, Belgium, United Kingdom (UK) and Luxemburg. It excludes the southern
European countries. The second, labeled ‘medium ICT readiness group’, contains eleven
countries: Greece, Italy, Estonia, Czech Republic (CZ), Spain, Slovakia, Slovenia,
Lithuania, Cyprus, Portugal and Poland. It includes Southern European countries and
some of the recent EU27 members. Finally, the ‘low ICT readiness group’ includes Latvia,
Hungary, and Romania, all of them recent EU27 members. The classification obtained by
the first two groups is similar to that obtained by Cuervo and Menendez [2006] for digital
divide in EU15, with the difference of France and Belgium, which do not belong to the
higher level group defined by Cuervo and Menendez.
FinlandSweden
Denmark
Netherlands
Belgium
Germany
France
UK
Austria
Luxembourg
Ireland
SloveniaSpain
Italy
CZ Estonia
Slovakia
Greece
Portugal
Poland
Lithuania
Cyprus
HungaryLatvia
Romania
EU 27
0
5
10
15
20
25
30
35
40
45
30 40 50 60 70 80 90
ICT
use
ICT adoption
Figure 9.3. Pattern of ICT adoption and usage by EU-27 countries (excluding Bulgaria and Malta)

Chapter 9 – Understanding B2B e-Commerce Adoption and Usage in Europe: Findings from 27 European
Countries
120
9.3.4. B2B e-commerce adoption and usage by group o f countries
In this section we will analyse the determinants of B2B e-commerce adoption and usage
for each group of countries obtained in the previous section. Goodness-of-fit for both
regressions were analysed. For B2B e-commerce adoption we computed LR test, which is
statistically significant (p-value<0.001 for each group of countries); Hosmer-Lemeshow
[1980] test, which is not rejected (p-values are 0.251, 0.198 and 0.334, respectively for
high, medium and low ICT readiness group); AUC which is equal to 0.770, 0.793 and
0.785 respectively for B2B e-commerce adoption in high, medium, and low ICT readiness
groups of countries. The prediction accuracy, which is 76.0%, 70.3% and 70.3%
respectively; and the adoption by random choices ([adopters/(adopters + non-adopters)]2 +
[non-adopters/(adopters + non-adopters)]2) would result in 60.9%, 50.1% and 50.2%
respectively for B2B e-commerce in each group, which are much less than in the case of
our regressions. Thus we were able to conclude that the logistic regression has much
higher discriminating power than the random choice. We also analysed goodness-of-fit for
B2B e-commerce usage. The LR test is statistically significant (p-value<0.001 for each
group of countries). The statistical procedures reveal a substantive model fit, a satisfactory
discriminating power and there is evidence to accept an overall significance of the models.
As we can see in Table 9.4, for B2B e-commerce adoption within the internal context, firm
size is the only significant inhibitor in the high ICT readiness group (p-value<0.01),
education level is only significant in the medium ICT readiness group (p-value<0.1); within
the external context, competitive pressure is significant for the high and medium ICT
readiness groups (p-value<0.05 in both), trading partner collaboration is significant for the
three groups (p-value<0.01 in all). For the content dimension, perceived benefits and
obstacles of e-business is significant for all groups (p-value<0.01 in all). Within the process
dimension, technology readiness is significant for all groups (p-value<0.01 in all), and
technology integration is only significant for the high ICT readiness group (p-value<0.05).
To summarize, in the high ICT readiness group, only H2a (education level) is not
supported; in the medium ICT readiness group H1a (firm size) and H8a (technology
integration) are not supported; and in the low ICT readiness group H1a (firm size), H2a

Chapter 9 – Understanding B2B e-Commerce Adoption and Usage in Europe: Findings from 27 European
Countries
121
(education level), H3a (competitive pressure) and H8a (technology integration) are not
supported.
Table 9.4: Results of the logistic regression for B2B e-commerce adoption and ordered logistic
regression for B2B usage in each group of countries
Independent variables
B2B e-commerce adoption by
group of ICT readiness
(logistic regression)
B2B e-commerce usage by group
of ICT readiness
(ordered logistic regression)
High Medium Low High Medium Low
Firm size -0.090*** -0.004 -0.035 -0.211*** -0.177*** -0.212***
Education level 0.002 0.003* 0.005 0.002 0.005** 0.009**
Competitive pressure 0.186** 0.218** 0.129 0.292*** 0.309*** -0.324
Trading partner collaboration 0.521*** 0.521*** 0.633*** 0.269*** 0.278*** 0.335***
Perceived benefits and
obstacles of e-business 0.685*** 0.616*** 0.688*** 0.516*** 0.372*** 0.528***
Technology readiness 0.571*** 0.477*** 0.500*** 0.462*** 0.431*** 0.468***
Technology integration 0.132** 0.054 0.109 0.056 0.121** 0.296***
Country dummies Included Included Included Included Included Included
Industry dummies Included Included Included Included Included Included
Sample size 3,346 2,916 711 2,293 1,478 368
Note: * p-value<0.10; ** p-value<0.05; *** p-value<0.01.
For B2B e-commerce usage, we found different relationships (as can be seen in Table
9.4). Within the internal context, firm size is a significant inhibitor for all groups (p-value
<0.01 in all); this variable is a greater inhibitor for B2B e-commerce usage than for B2B e-
commerce adoption. Education level is significant in the medium and low ICT readiness
groups (p-value<0.05 in both). Within the external context, competitive pressure is
significant for high and medium ICT readiness groups (p-value<0.01 in both), trading
partner collaboration is significant for the three groups (p-value<0.01 in all). For the
content dimension, perceived benefits and obstacles of e-business is significant for all
groups (p-value<0.01 in all). Within the process dimension, technology readiness is
significant for all groups (p-value<0.01 in all), and technology integration is significant for
medium and low ICT readiness group (p-value<0.05 and p-value<0.01 respectively). In
summary, we found that only H2b (education level) and H8b (technology integration) is not
supported in the high ICT readiness group; all hypothesis are supported in medium ICT
readiness group; and only H3b (competitive pressure) is not supported in the low ICT
readiness group.

Chapter 9 – Understanding B2B e-Commerce Adoption and Usage in Europe: Findings from 27 European
Countries
122
There are variables that hold diverse significance depending on B2B e-commerce
adoption or usage. On one hand, larger firm size is inhibitor for B2B e-commerce usage,
while on the other hand, higher education level is facilitator for B2B e-commerce usage.
This reveals that when firms are in more advance level of B2B, the firms with higher
education level of employees and low size are facilitators. There is one variable from each
dimension that is statistically significant in B2B e-commerce adoption and usage for all
groups of countries. This is the trading partner collaboration in the context dimension,
perceived benefits and obstacles of e-business in the content dimension, and technology
readiness in the process dimension. This reveals that: the main drivers of B2B e-
commerce adoption and usage are trading partner collaboration, perceived benefits and
obstacles of e-business and technology readiness. Moreover, all three dimensions
proposed are relevant for B2B e-commerce adoption and usage in different contexts.
9.4. Discussion
9.4.1. Implications for B2B strategic choices in Eu rope
To increase B2B e-commerce adoption and usage in Europe, our study reveals that it is
important to enhance the following variables: education level, competitive pressure, trading
partner collaboration, perceived benefits and obstacles of e-business, technology
readiness and technology integration. Our study also reveals that a small firm has
advantage in B2B e-commerce adoption and usage when compared to a large firm,
provided the other variables analyzed in our model are on the same level. This reveals a
business opportunity for small firms in the EU27 context for adoption and usage of B2B e-
commerce. This is extremely important since there are 20 million small and medium
enterprises (SMEs) in the EU27, representing 99% of businesses [Audretsch et al., 2009].
This fact makes them a key driver for economic growth, innovation, employment and social
integration [Comission, 2010].

Chapter 9 – Understanding B2B e-Commerce Adoption and Usage in Europe: Findings from 27 European
Countries
123
9.4.2. Defining strategic option within and amongst clusters
Based on the cluster analysis in the EU27, there are three distinct groups that present
specific patterns of ICT readiness. The ‘high ICT readiness group’ includes the EU15
members, except the southern European countries. The ‘medium ICT readiness group’
includes Southern European countries and recent EU27 members (excluding Latvia,
Hungary, and Romania); this classification is similar to that obtained by Cuervo and
Menendez [2006] for the digital divide in the EU15. The ‘low ICT readiness group’ includes
only recent EU27 members (Latvia, Hungary, and Romania). This result implies that the
twelve recent EU27 members (excluding Malta and Bulgaria, which are missing in the data
used) are not in the same level of ICT readiness. For this reason, different policies should
be developed for each ICT readiness group.
In the context dimension, education level of employees is only important for the medium
ICT readiness group to explain B2B e-commerce adoption and is not important for B2B e-
commerce usage in the high ICT readiness group. This means that the higher education
level of employees is needed for firms that want to use B2B e-commerce intensively; this
is particularly relevant in the medium and low ICT readiness groups where the population
has a lower education level when compared to the high ICT readiness group (especially
with Nordic countries), where the level of education of the population is the highest
[Eurostat, 2009]. Also in the context dimension, competitive pressure is not important for
B2B e-commerce adoption and usage in the low ICT readiness group. In our opinion,
when the level of B2B e-commerce increases in this group, perhaps the competitive
pressure will become more important for this group.
In the process dimension, technology integration is important only for B2B e-commerce
usage in low and medium ICT readiness groups. This means that in these contexts when
firms want to achieve a higher level of B2B e-commerce (usage), the use of technology
integration is necessary. In Figure 9.4, we present the main drivers of B2B e-commerce,
independently of the context and the variables that need to be enhanced to help it move to
a higher level of B2B e-commerce.

Chapter 9 – Understanding B2B e-Commerce Adoption and Usage in Europe: Findings from 27 European
Countries
124
Figure 9.4. Factors that help to move for a higher ICT readiness group
For B2B e-commerce adoption, firm size (context dimension) is a statistically significant
inhibitor only for the full sample and high ICT readiness group. Firm size is a strong
inhibitor in all ICT readiness groups for e-business usage. This means that B2B e-
commerce is not a phenomenon dominated by large firms, especially in the high ICT
readiness group and for B2B e-commerce usage. Small firms have the advantage of close
collaboration, coordination and less bureaucracy. In addition, in the high ICT readiness
group, there commonly exist more available technology and services providers, which help
to lower the adoption risk. This is the reason why small firms probably have advantages in
adopting B2B e-commerce. On the contrary, for eight European countries Zhu et al. [2003]
found that in 1999, larger firm size was a facilitator of e-business adoption. This difference
can be due to the decreasing costs of IT over time. Moreover, when firms adopt B2B e-
commerce, small firm size is a facilitator for B2B e-commerce usage in all ICT readiness
groups.
9.4.3. Social responsibility with respect to B2B va riations
The international digital divide is largely the consequence of the social and economic
inequities between countries. Countries with lower income and lower educational
attainment tend to reveal lower rates of ICT access and usage when compared with higher
income and better education attainment countries [Cuervo and Menendez, 2006, Kiiski
and Pohjola, 2002, Pohjola, 2003]. Special attention must be paid to countries in the low
ICT readiness group to avoid a more pronounced digital divide across EU27 members.
Our study suggests that is necessary to increase the education level of the population and
consequently the employees’ readiness for IT adoption. It is also essential to promote the
increased level of technology integration used by firms. For the medium ICT readiness
group, it is also important to increase the level of competitive pressure.

Chapter 9 – Understanding B2B e-Commerce Adoption and Usage in Europe: Findings from 27 European
Countries
125
9.4.4. Contributions
B2B e-commerce has become an increasingly important topic for both researchers and
practitioners [Teo and Ranganathan, 2004]. To promote B2B adoption and usage it is
critical to clarify the factors that explain these and conduct a deep analysis to understand if
different levels of adoption and usage have the same drivers for B2B e-commerce. We
developed a new approach based of the contextualist of Pettigrew and Whipp [1991] to
study the factors that explain B2B e-commerce adoption and usage. Based on a large
sample of EU27 members, we tested our conceptual model and developed a
measurement model satisfying various reliability and validity conditions. In general, our
hypotheses are confirmed. Our research model is seemingly appropriate. As the sample
was not limited to data from a single country, this helps to strengthen the generalization of
the model and findings. The major contributions of this study are the following:
• Firstly, we demonstrated and showed that our model is useful for identifying
facilitators and inhibitors of B2B adoption and usage.
• Secondly, we identified seven drivers of B2B e-commerce adoption and
usage, six facilitators and one inhibitor (firm size).
• Thirdly, based on Eurostat country-wise data, we found three different groups
of ICT readiness.
• Finally, trading partner collaboration in the context dimension, perceived
benefits and obstacles of e-business in the content dimension and
technology readiness in the process dimension are important drivers for B2B
e-commerce adoption and usage in all ICT readiness groups.
Our findings reveal that all three proposed dimensions are fundamental and intricate, such
as in the contextualist theory of Pettigrew and Whipp [1991].
9.4.5. Limitations and further research
As in most empirical studies, our work has some limitations. Firstly, the cross-sectional
nature of this study does not allow us to predict how this relationship will change over time.

Chapter 9 – Understanding B2B e-Commerce Adoption and Usage in Europe: Findings from 27 European
Countries
126
To overcome this limitation, future research should involve panel data. Secondly, we did
not include the government regulation variables in our model because data were not
available for these variables. Any further research should include these variables.
While explicitly not explored in this research there is a tendency in IS research [Gibbs and
Kraemer, 2004, Hsu et al., 2006, Zhu et al., 2006a, Zhu and Kraemer, 2005, Zhu et al.,
2006b] to aggregate B2B and B2C e-commerce together. Clearly further research is
needed to understand the different drivers between B2B and B2C e-commerce. Future
research can also seek additional information to evaluate the impact of B2B adoption and
usage on a firm’s turnover, market share and productivity. Finally, confirmatory studies of
our research model, in different contexts, need to be undertaken. Other studies and
samples should be used for the validation of our model.
9.5. Conclusions
In this paper we have analyzed B2B e-commerce adoption and usage at firm level in
EU27. We concluded that different countries belonging to EU27 do not have the same
level of ICT adoption and diffusion. In fact there are three different levels or clusters, all
with their own set of challenges with respect to B2B e-commerce adoption and usage.
Identification and appreciation of the different clusters helps in fine tuning policy initiatives,
both at the macro and micro level. While such a call may seem obvious, it has not been
adequately addressed in the literature. More often than not, the focus has been on defining
grand strategic choices for countries, without understanding particular nuances or
differences. This is particularly true of policy initiatives that get formulated at a federal level
(such as the European Union) with regions having to implement or adopt them. Typically a
lack of such appreciation can lead to regional imbalances in technology adoption, which
risk failure or complete abandonment of the initiative.

Chapter 10 – Conclusions
127
Chapter 10 – Conclusions
10. 1. Summary of findings
There is consensus today that information technology (IT) has significant effects on the
productivity of firms [Black and Lynch, 2001, Brynjolfsson and Hitt, 2000]. These effects
will only be realized if, and when, IT come into widespread use [Pohjola, 2003]. It is
essential to understand the determinants of adoption of IT. For both the Portuguese
(“Technology Shock”) and the European context (“i2010”) IT adoption is a key theme. With
the general aim of better understanding IT adoption at firm level, studies in the Portuguese
and the European context were developed. For the Portuguese context, we compared
simple versus complex technologies (Chapter 3); small versus large firms (Chapter 4);
stages of adoption in small firms (Chapter 5); and we analysed Internet business solutions
(IBS) (Chapter 6). For the European context, we analysed the main characteristics of e-
business adoption (Chapter 7). We also made an e-business adoption model that
combined two theoretical models (Tornatzky and Fleischer [1990] model and the Iacovou
et al. [1995] model), and we compared e-business adoption by industries
(telecommunications (telco) versus tourism) (Chapter 8). In the end, we developed a
model for Business-to-business (B2B) e-commerce adoption and usage based on the
contextualist theory of Pettigrew and Whipp [1991]. We also found three distinct groups of
European countries that present specific patterns of ICT readiness (“low, medium, and
high ICT readiness group”), and we also tested the developed model in these different
contexts (Chapter 9).
First, we made a literature review about IT adoption models at firm level (Chapter 2). We
concluded that the TOE framework is a solid theoretical basis, with consistent empirical
support, and the potential of application to information systems (IS) adoption. This model
is a good theoretical starting point for our work.
One important result (based on Chapters 3 and 5) is that Internet, web site and e-
commerce adoption are taken at different stages. Moreover, the factors have distinct
effects on the different stages. In addition, this conclusion was validated for all size firms in

Chapter 10 – Conclusions
128
the Portuguese context. To complement the idea of different stages of adoption, Chapter 6
reveals that web site and the level of IBS are also taken at different stages, this means
that to be an IT adopter (web site) does not mean being an extensive IT user (the level of
IBS).
For the Portuguese and the European context, technology readiness is an important driver
of IT adoption. Technology readiness is constituted “not only by physical assets, but also
by human resources that are complementary to physical assets” [Mata et al., 1995]. This
urges top leaders to promote ICT infrastructures, managerial skills, and human resources
that possess knowledge of these new information technologies.
The size of the firms is a variable that has a controversial impact on the IT adoption
decision, because some empirical studies indicate that there is a positive relationship
[Grover, 1993, Hsu et al., 2006, Pan and Jang, 2008, Premkumar et al., 1997, Soares-
Aguiar and Palma-Dos-Reis, 2008, Thong, 1999, Zhu et al., 2003], while other studies
report evidence against this positive relationship [Dewett and Jones, 2001, Harris and
Katz, 1991, Martins and Oliveira, 2007, Oliveira, 2008, Zhu et al., 2006a, Zhu and
Kraemer, 2005, Zhu et al., 2006b]. In our context, it is an important factor. Moreover,
comparing “directly” large and small firms, we conclude that small firms behave differently
from their counterparts (Chapter 4). We also conclude that for more advanced levels of
adoption, such as: level of IBS (Chapter 6) or B2B e-commerce usage (Chapter 9), small-
size firms have an advantage when compared to a large firm, providing the other variables
analysed are at the same level. On the other hand, large firms in the initial stage of
adoption, such as: Internet adoption (Chapter 5) and web site adoption (Chapters 3, 5, and
6) have advantages. This is in accordance with the idea that large firms tend to have
advantages in early stages, but they face critical challenges in the latter ones [Lee and
Xia, 2006].
Perceived benefits is in general an important facilitator of IT adoption for all contexts and
levels of adoption (Chapters 3, 4, 5, 6, 8, and 9, except in Chapter 5 for e-commerce
adoption), which reveals the importance of understanding the benefits of the new
technology.

Chapter 10 – Conclusions
129
Based on the European data, the industry context seems to be more important than the
country context (Chapter 7). Furthermore, the relative importance of all drivers for e-
business adoption in the telco industry differs from that in the tourism industry (Chapter 8).
The only exception is competitive pressure, where there is no difference between these
two industries, which reveals the same level of competition in the online market across
these industries. Competitive pressure is also important in the Portuguese and the
European contexts, and the stage of IT adoption (Chapters 3, 5, 6, and 9). It is also
important for small and large firms (Chapter 4).
Trading partner collaborations is an important driver for e-business adoption in the telco
and tourism industries (Chapter 8), and for B2B e-commerce adoption and usage (Chapter
9) in the European context. Consequently, managers and policy makers should support
the creation of networks with other players and the sharing of resources in order to satisfy
the needs of diverse and ever faster changing customer requirements. This, in turn, could
increase the competiveness of the whole network [W@tch, 2007].
Education level, in the Portuguese context, is important on the level of IBS adoption
decision but was not important in the web site adoption model (Chapter 6). In the EU27,
education level is only important for the medium ICT readiness group to explain B2B e-
commerce adoption and in the medium and low ICT readiness group to explain B2B e-
commerce usage (Chapter 9). This means that the higher education level of employees is
needed for firms that wish to adopt IT intensively. This is particularly pertinent in the
medium and low ICT readiness groups where the population has a lower education level
when compared to the high ICT readiness group (especially with Nordic countries), where
the level of education of the population is the highest [Eurostat, 2009].
10.2. Contributions
Chapters 3, 4, 5, and 6 used Portuguese data and they are important contributions to the
literature, since there are few published studies on the subject [Parker and Castleman,
2007]. In Chapters 3 and 6 we used an integrated model, and we took selectivity into
account, a topic that is still quite limited in the literature [Battisti et al., 2007]. Chapter 4 is
related to the scarcity of studies on comparing the determinants of web site adoption in

Chapter 10 – Conclusions
130
small and large firms. The contribution of Chapter 5 is also related to the very limited
research on comparing the determinants of Internet, web site, and e-commerce adoption
in small firms.
To the best of our knowledge, there are few studies that identify the patterns of e-business
adoption amongst firms in the EU27 using the TOE framework. Chapter 7 contributed to fill
this gap.
In Chapter 8, the purpose is to identify the factors that explain the variation in e-business
adoption by two different industries (telco and tourism) in the EU27 context. To our
knowledge, there has been no research in this area; this chapter addresses this gap.
Another contribution is that we develop a research model that is a combination of the
Tornatzky and Fleischer [1990] model and the Iacovou et al. [1995] model to achieve our
purpose.
The purpose of Chapter 9 is to understand B2B e-commerce adoption and usage in
European countries, and for this we use an adaptation of the theory of contextualist by
Pettigrew and Whipp [1991] to organize our initial theoretical/conceptual model; this new
approach is our main contribution. All of the stipulated hypotheses are supported, which
reveals that the research model proposed with three dimensions (context, content, and
process) is adequate.
10.3. Limitations and further research
As in most empirical studies, our work is limited in some ways. Firstly, the cross-sectional
nature of this study does not allow knowing how this relationship will change over time. To
solve this limitation, future research should involve panel data. Also, we did not include the
government regulation variables in our model because these variables are not available in
this questionnaire. A new questionnaire should be made in further research.
In terms of future research, it would be interesting to study one model that determines e-
business adoption for each industry in the European context. It would also be important to
compare the impacts of TOE variables in different industries (manufacture, construction,

Chapter 10 – Conclusions
131
tourism, and telecommunications). In the tourism industry the rate of adoption between
business-to-business (B2B) and business-to-consumer (B2C) is very different, and further
research is needed to understand the different drivers between B2B and B2C, and across
industries. As we saw, several studies [Gibbs and Kraemer, 2004, Hsu et al., 2006, Zhu et
al., 2006a, Zhu and Kraemer, 2005, Zhu et al., 2006b] tend to aggregate B2B and B2C e-
commerce, considering that both have the same drivers. Further research is needed to
understand the different drivers between B2B and B2C e-commerce. Another direction for
future research is to provide additional information to evaluate the impact of B2B adoption
and usage on a firm’s turnover, market share, and productivity. Finally, we encourage
confirmatory studies of our research model developed in Chapters 8 and 9. It should be
tested in other contexts and applied to other IT adoptions to be refined. Other studies and
samples should be used for the validation of our models. Samples of specific context or
industry, such as manufacturing or service, should be gathered to further examine the
applicability of these models.

Chapter 10 – Conclusions
132

References
133
References
Abu-Musa, A. A. (2004) "Auditing e-business: new challenges for external auditors,"
Journal of American Academy of Business (4) 1, pp. 28–41.
Ajzen, I. (1985) From intentions to actions: A theory of planned behavior. Berlin: Springer.
Ajzen, I. (1991) "The Theory of Planned Behavior," Organizational Behavior and Human
Decision Processes (50pp. 179-211.
Al-Qirim, N. (2007) The adoption of eCommerce communications and applications
technologies in small businesses in New Zealand, in Electronic Commerce Research
and Applications, vol. 6, pp. 462-473.
Amit, R. and C. Zott (2001) "Value creation in e-business," Strategic Management Journal
(22) 6-7, pp. 493-520.
Armstrong, C. P. and V. Sambamurthy (1999) "Information technology assimilation in
firms: The influence of senior leadership and IT infrastructures," Information Systems
Research (10) 4, pp. 304-327.
Arvanitis, S. and H. Hollenstein (2001) "The Determinants of the Adoption of Advanced
Manufacturing Technology. An Empirical Analysis Based on Firm-level Data for
Swiss Manufacturing.," Economics of Innovation and New Technology (3pp. 377-
414.
Audretsch, D., R. v. d. Horst, T. Kwaak, and R. Thurik (2009) First Section of the Annual
Report on EU Small and Medium-sized Enterprises, in EIM Business & Policy
Research Brussels
Bajwa, D. S., J. E. Garcia, and T. Mooney (2004) "An integrative framework for the
assimilation of enterprise resource planning systems: Phases, antecedents, and
outcomes," Journal of Computer Information Systems (44) 3, pp. 81-90.
Barua, A., P. Konana, A. B. Whinston, and F. Yin (2004) "Assessing internet enabled
business value: An exploratory investigation," MIS Quarterly (28) 4, pp. 585-620.

References
134
Battisti, G., H. Hollenstein, P. Stoneman, and M. Woerter (2007) "Inter and Intra firm
Diffusion of ICT in the United Kingdom (UK) and Switzerland (CH) : An
Internationally Comparative Study Based on Firm-level Data," Economics of
Innovation and New Technology (16) 8, pp. 669 - 687.
Battisti, G. and P. Stoneman (2003) "Inter- and intra-firm effects in the diffusion of new
process technology," Research Policy (32pp. 1641-1655.
Battisti, G. and P. Stoneman (2005) "The intra-firm diffusion of new process technologies,"
International Journal of Industrial Organization (23) 1-2, pp. 1-22.
Beatty, R. C., J. P. Shim, and M. C. Jones (2001) "Factors influencing corporate web site
adoption: a time-based assessment," Information & Management (38) 6, pp. 337-
354.
Bertschek, I. (2003) Information Technology and Productivity Gains and Cost Savings in
Companies, in D. C. Jones (Ed.) New Economy Handbook, Amesterdam, pp. 213-
228.
Bertschek, I., H. Fryges, and U. Kaiser (2006) "B2B or Not to Be: Does E-commerce
Increase Labor Productivity?," International Journal of the Economics of Business
(13) 3, pp. 387-405.
Black, S. E. and L. M. Lynch (2001) "How to compete: The impact of workplace practices
and information technology on productivity," Review of Economics and Statistics (83)
3, pp. 434-445.
Borenstein, S. and G. Saloner (2001) "Economics and electronic commerce," Journal of
Economic Perspectives (15) 1, pp. 3-12.
Bradford, M. and J. Florin (2003) "Examining the role of innovation diffusion factors on the
implementation success of enterprise resource planning systems," International
Journal of Accounting Information Systems (4) 3, pp. 205-225.
Bresnahan, T. F., E. Brynjolfsson, and L. M. Hitt (2002) "Information technology, workplace
organization, and the demand for skilled labor: Firm-level evidence," Quarterly
Journal of Economics (117) 1, pp. 339-376.

References
135
Brynjolfsson, E. and L. M. Hitt (2000) "Beyond Computation: Information Technology,
Organizational Transformation and Business Performance," Journal of Economic
Perspectives (14) 4, pp. 23-48.
Caldeira, M. (2000) "Critical Realism: A philosophical perpective for case study research in
social sciences," Episteme (5-6pp. 73-78.
Caselli, F. and W. J. Coleman (2001) "Cross-country technology diffusion: The case of
computers," American Economic Review (91) 2, pp. 328-335.
Castaings, W. and S. Tarantola (2008) "The 2007 European e-Business Readiness Index,"
JRC Scientific and Technical Reports pp. 1-35.
Chatterjee, D., R. Grewal, and V. Sambamurthy (2002) "Shaping up for e-commerce:
Institutional enablers of the organizational assimilation of Web technologies," MIS
Quarterly (26) 2, pp. 65-89.
Chau, P. Y. K. and K. Y. Tam (1997) "Factors affecting the adoption of open systems: An
exploratory study," MIS Quarterly (21) 1, pp. 1-24.
Cho, V. (2006) "Factors in the adoption of third-party B2B portals in the textile industry,"
Journal of Computer Information Systems (46) 3, pp. 18-31.
Chong, A. Y. L., K. B. Ooi, B. S. Lin, and M. Raman (2009) "Factors affecting the adoption
level of c-commerce: an empirical study," Journal of Computer Information Systems
(50) 2, pp. 13-22.
Claycomb, C., K. Iyer, and R. Germain (2005) "Predicting the level of B2B e-commerce in
industrial organizations," Industrial Marketing Management (34) 3, pp. 221-234.
Clayton, K. (2000) "Microscope on micro businesses," Australian CPA (2) 70, pp. 46–7.
Cohen, W. M. and D. H. Levinthal (1989) "Innovation and learning: the two faces of R&D,"
Economic Journal (99pp. 569–596.
Comission, E. (2010) "Small and medium-sized enterprises (SMEs),"
http://ec.europa.eu/enterprise/policies/sme/index_en.htm (19/02/2010).

References
136
Commission, E. (2005) "Information Society Benchmarking Report,"
http://ec.europa.eu/information_society/eeurope/i2010/docs/benchmarking/051222%
20Final%20Benchmarking%20Report.pdf (29 Jan, 2009).
Commission, E. (2008) "The European e-Business Report 2008 - The impact of ICT and e-
business on firms, sectors and the economy," 6th Synthesis Report of the Sectoral e-
Business Watch pp. 1-304.
Communities, C. o. t. E. (2005) i2010 - A European Information Society for growth and
employment.
Cooper, R. B. and R. W. Zmud (1990) "Information Technology Implementation Research -
a Technological Diffusion Approach," Management Science (36) 2, pp. 123-139.
Cuervo, M. R. V. and A. J. L. Menendez (2006) "A multivariate framework for the analysis
of the digital divide: Evidence for the European Union-15," Information &
Management (43) 6, pp. 756-766.
Damanpour, F. (1992) "Organizational Size and Innovation," Organization Studies (13) 3,
pp. 375-402.
Daniel, E. M. and D. J. Grimshaw (2002) "An exploratory comparison of electronic
commerce adoption in large and small enterprises," Journal of Information
Technology (17) 3, pp. 133-147.
Dasgupta, S., D. Agarwal, A. Ioannidis, and S. Gopalakrishnan (1999) "Determinants of
information technology adoption: an extension of existing models to firms in a
developing country," Journal of Global Information Management (7) 3, pp. 30–53.
Davis, F. D. (1986) A technology acceptance model for empirically testing new end-user
information systems: Theory and results, Sloan School of Management,
Massachusetts Institute of Technology.
Davis, F. D. (1989) "Perceived Usefulness, Perceived Ease of Use, and User Acceptance
of Information Technology," MIS Quarterly (13) 3, pp. 319-340.

References
137
Davis, F. D., R. P. Bagozzi, and P. R. Warshaw (1989) "User Acceptance of Computer-
Technology - a Comparison of 2 Theoretical-Models," Management Science (35) 8,
pp. 982-1003.
Day, R. A. (1998) How to Write and Publish a Scientific Paper, 5 edition. Phoneix: Oryx
Press.
Dedrick, J., V. Gurbaxani, and K. L. Kraemer (2003) "Information technology and
economic performance: A critical review of the empirical evidence," Acm Computing
Surveys (35) 1, pp. 1-28.
Dewett, T. and G. R. Jones (2001) "The role of information technology in the organization:
a review, model, and assessment," Journal of Management (27) 3, pp. 313-346.
Dholakia, R. R. and N. Kshetri (2004) "Factors Impacting the Adoption of the Internet
among SMEs," Small Business Economics (23pp. 311-322.
Dimaggio, P. J. and W. W. Powell (1983) "The Iron Cage Revisited - Institutional
Isomorphism and Collective Rationality in Organizational Fields," American
Sociological Review (48) 2, pp. 147-160.
Dubin, J. A. and D. Rivers (1990) Selection Bias in Linear Regression, Logit and Probit
Models, in J. Fox and J. S. Long (Eds.) Modern Methods of Data Analysis, Newbury
Park: CA: Sage Publications.
Eder, L. B. and M. Igbaria (2001) "Determinants of intranet diffusion and infusion," Omega-
International Journal of Management Science (29) 3, pp. 233-242.
Eid, R. and M. Trueman (2004) "Factors affecting the success of business-to-business
international Internet marketing (B-to-B IIM): an empirical study of UK companies,"
Industrial Management & Data Systems (104) 1-2, pp. 16-30.
Ettlie, J. E. and A. H. Rubenstein (1987) "Firm Size and Product Innovation," Journal of
Product Innovation Management (4) 2, pp. 89-108.
Eurostat (2006) The internet and other computer networks and their use by European
enterprises to do eBusiness, in Statistics in focus, pp. 1-7.

References
138
Eurostat (2009) Europe in figures, in Eurostat yearbook 2009. Edited by S. books.
Luxembourg: European Comission.
Gatignon, H. and T. S. Robertson (1989) "Technology Diffusion - an Empirical-Test of
Competitive Effects," Journal of Marketing (53) 1, pp. 35-49.
Gibbs, L. J. and K. L. Kraemer (2004) "A Cross-Country Investigation of the Determinants
of Scope of E-commerce Use: An Institutional Approach," Electronic Markets ( 14) 2,
pp. 124-137.
Giunta, A. and F. Trivieri (2007) "Understanding the determinants of information
technology adoption: evidence from Italian manufacturing firms," Applied Economics
(39) 10-12, pp. 1325-1334.
Gower, J. C. (1971) "A general coefficient of similarity and some of its properties,"
Biometrics (27pp. 857-872.
Grandon, E. E. and J. M. Pearson (2004) "Electronic commerce adoption: an empirical
study of small and medium US businesses," Information & Management (42) 1, pp.
197-216.
Greene, W. H. (2008) Econometric Analysis, Sixth edition. New Jersey: Prentince-Hall,
Inc.
Grover, V. (1993) "An Empirically Derived Model for the Adoption of Customer-Based
Interorganizational Systems," Decision Sciences (24) 3, pp. 603-640.
Grover, V. and T. C. Teng (1994) "Facilitating the implementation of customer-based inter-
organizational systems: an empirical analysis of innovation and support factors,"
Information Systems Journal (4) 1, pp. 61–89.
Hage, J. (1980) Theories of Organizations: Forms, Process and Transformation. New
York: John Wiley & Sons.
Hair, J. F., R. E. Anderson, R. L. Tatham, and W. C. Black (1998) Multivariate Data
Analysis. Upper Saddle River, NJ: Prentice-Hall.

References
139
Harindranath, G., R. Dyerson, and D. Barnes (2008) "ICT Adoption and Use in UK SMEs:
a Failure of Initiatives?," Electronic Journal of Information Systems Evaluation (11) 2,
pp. 91-96.
Harris, S. E. and J. L. Katz (1991) "Firm Size and the Information Technology Investment
Intensity of Life Insurers," MIS Quarterly (15) 3, pp. 333-352.
Heckman, J. J. (1979) "Sample Selection Bias as a Specification Error," Econometrica (47)
1, pp. 153-161.
Hitt, M. A., R. E. Hoskisson, and R. D. Ireland (1990) "Mergers and Acquisitions and
Managerial Commitment to Innovation in M-Form Firms," Strategic Management
Journal (11pp. 29-47.
Hollenstein, H. (2004) "Determinants of the adoption of Information and Communication
Technologies (ICT). An empirical analysis based on firm-level data for the Swiss
business sector," Structural Change and Economic Dynamics (15pp. 315-342.
Hong, W. Y. and K. Zhu (2006) "Migrating to internet-based e-commerce: Factors affecting
e-commerce adoption and migration at the firm level," Information & Management
(43) 2, pp. 204-221.
Honjo, Y. (2004) "Growth of new start-up firms: evidence from the Japanese
manufacturing industry," Applied Economics (36) 4, pp. 343-355.
Hosmer, D. W. and S. Lemeshow (1980) "A goodness-of-fit test for the multiple logistic
regression model," Communications in Statistics (A10pp. 1043-1069.
Hosmer, D. W. and S. Lemeshow (2000) Applied Logistic Regression 2nd edition: Willey.
Hsu, P. F., K. L. Kraemer, and D. Dunkle (2006) "Determinants of e-business use in US
firms," International Journal of Electronic Commerce (10) 4, pp. 9-45.
Hwang, H. G., C. Y. Ku, D. C. Yen, and C. C. Cheng (2004) "Critical factors influencing the
adoption of data warehouse technology: a study of the banking industry in Taiwan,"
Decision Support Systems (37) 1, pp. 1-21.

References
140
Iacovou, C. L., I. Benbasat, and A. S. Dexter (1995) "Electronic data interchange and small
organizations: Adoption and impact of technology," MIS Quarterly (19) 4, pp. 465-
485.
IDC (2008) "IDC Finds More of the World's Population Connecting to the Internet in New
Ways and Embracing Web 2.0 Activities "
http://www.idc.com/getdoc.jsp?containerId=prUS21303808).
INE (2007) Empresas em Portugal 2005: Instituto Nacional de Estatística. Tema D:
Economia e Finanças.
Jeon, B. N., K. S. Han, and M. J. Lee (2006) "Determining factors for the adoption of e-
business: the case of SMEs in Korea," Applied Economics (38) 16, pp. 1905-1916.
Johnson, M. (2010) "Barriers to innovation adoption: a study of e-markets," Industrial
Management & Data Systems (110) 2, pp. 157-174.
Johnson, R. and D. Wichern (1998) Applied Multivariate Data Statistical Analysis. New
Jersey: Prentice Hall.
Jorgenson, D. W. (2002) Econometrics Volume 3: Economic Growth in the Information
Age. Vol. 3. London: MIT Press.
Khandwalla, P. (1970) Environment and the organization structure of firms, in McGill
University. Montreal: Faculty of Management.
Kiiski, S. and M. Pohjola (2002) "Cross-country diffusion of the Internet," Information
Economics and Policy (14) 2, pp. 297-310.
Koellinger, P. (2008) "The relationship between technology, innovation, and firm
performance - Empirical evidence from e-business in Europe," Research Policy (37)
8, pp. 1317-1328.
Konings, J. and F. Roodhooft (2002) "The effect of e-business on corporate performance:
Firm level evidence for Belgium," Economist-Netherlands (150) 5, pp. 569-581.
Kraemer, K. L., J. Dedrick, N. Melville, and K. Zhu (2006) Global E-Commerce: Impacts of
National Environments and Policy. Cambridge, UK.

References
141
Kuan, K. K. Y. and P. Y. K. Chau (2001) "A perception-based model for EDI adoption in
small businesses using a technology-organization-environment framework,"
Information & Management (38) 8, pp. 507-521.
Kuder, G. F. and M. W. Richardson (1937) "The theory of estimation of test reliability,"
Psychometrika (28pp. 221-238.
Kwon, T. H. and R. W. Zmud (1987) Unifying the fragmented models of information
systems implementation. In critical issues in Information Systems Research (Boland
RJ and Hirschheim RA, Eds), in J. Wiley (Ed.), New York, pp. 227-251.
Lai, F., J. Wang, C. T. Hsieh, and J. C. Chen (2007) "On network externalities, e-business
adoption and information asymmetry," Industrial Management & Data Systems (107)
5-6, pp. 728-746.
Lange, T., M. Ottens, and A. Taylor (2000) "SMEs and Barriers to Skills Development: a
Scottish Perspective," Journal of Industrial Training (24pp. 5-11.
Lederer, A. L., D. A. Mirchandani, and K. Sims (2001) "The search for strategic advantage
from the World Wide Web," International Journal of Electronic Commerce (5) 4, pp.
117-133.
Lee, G. and W. D. Xia (2006) "Organizational size and IT innovation adoption: A meta-
analysis," Information & Management (43) 8, pp. 975-985.
Lee, O. K., M. Wang, K. H. Lim, and Z. Peng (2009) "Knowledge Management Systems
Diffusion in Chinese Enterprises: A Multistage Approach Using the Technology-
Organization-Environment Framework," Journal of Global Information Management
(17) 1, pp. 70-84.
Lemeshow, S. and D. W. Hosmer (1982) "The use of goodness-of-fit statistics in the
development of logistic regression models," American Journal of Epidemiology
(115pp. 92-106.
Li, Y. H. (2008) "An Empirical Investigation on the Determinants of E-procurement
Adoption in Chinese Manufacturing Enterprises," 2008 International Conference on

References
142
Management Science & Engineering (15th), Vols I and Ii, Conference Proceedings
pp. 32-37.
Lin, C.-Y. (2008) "Determinants of the adoption of technological innovations by logistics
service providers in China," International Journal of Technology Management and
Sustainable Development (7) 1, pp. 19-38.
Lin, H. F. and S. M. Lin (2008) "Determinants of e-business diffusion: A test of the
technology diffusion perspective," Technovation (28) 3, pp. 135-145.
Litan, R. E. and A. M. Rivlin (2001) "Projecting the economic impact of the Internet,"
American Economic Review (91) 2, pp. 313-317.
Liu, M. (2008) "Determinants of e-commerce development: an empirical study by firms in
Shaanxi, China," 2008 4th International Conference on Wireless Communications,
Networking and Mobile Computing, Vols 1-31 pp. 9177-9180.
Lucchetti, R. and A. Sterlacchini (2004) "The adoption of ICT among SMEs: Evidence from
an Italian survey," Small Business Economics (23) 2, pp. 151-168.
Magnusson, M. (2004) "An integrated framework for e-commerce adoption in small to
medium-sized enterprises," Innovations Through Information Technology (1pp. 585-
588.
Martin, L. M. and H. Matlay (2001) ""Blanket" approaches to promoting ICT in small firms:
some lessons from the DTI ladder adoption model in the UK," Internet Research-
Electronic Networking Applications and Policy (11) 5, pp. 399-410.
Martins, M. and T. Oliveira (2007) Determinants of information technology diffusion: A
study at the firm level for Portugal, in D. Remenyi (Ed.) Proceedings of the
European Conference on Information Management and Evaluation, Nr Reading:
Academic Conferences Ltd, pp. 357-365.
Martins, M. and T. Oliveira (2009) Determinants of e-Commerce Adoption by Small Firms
in Portugal, in D. Remenyi, J. Ljungberg, and K. Grunden (Eds.) Proceedings of the
3rd European Conference on Information Management and Evaluation, Nr Reading:
Academic Conferences Ltd, pp. 328-338.

References
143
Martins, M. F. O. and T. Oliveira (2008) "Determinants of Information Technology
Diffusion: a Study at the Firm Level for Portugal," The Electronic Journal Information
Systems Evaluation (11) 1, pp. 27-34.
Martins, M. R. F. and P. Raposo (2005) "Measuring the Productivity of Computers: A Firm
Level Analysis for Portugal," Electronic Journal of Information Systems Evaluation
(8) 4, pp. 197-204.
Martins, M. R. O. F. and T. Oliveira. (2005) Characterisation of Portuguese Organizations
regarding Investment in Information and Communication Technologies – Application
of Multivariate Data Analysis Techniques. The 12th European Conference on
Information Technology Evaluation, Turku, Finland, 2005, pp. 315-325.
Mata, F., W. Fuerst, and J. Barney (1995) "Information technology and sustained
competitive advantage: A resource-based analysis," MIS Quarterly (19) 4, pp. 487–
505.
McKelvey, R. D. and W. Zavoina (1975) "A Statistical Model for the Analysis of Ordinal
level Dependent Variables," Joyrnal of Mathematcal Sociology (4pp. 103-120.
Mehrtens, J., P. B. Cragg, and A. M. Mills (2001) "A model of Internet adoption by SMEs,"
INFORMATION & MANAGEMENT (39pp. 165-176.
Miranda, A. and S. Rabe-Hesketh (2006) "Maximum likelihood estimation of endogenous
switching and sample selection models for binary, ordinal, and count variables " The
Stata Journal (6) 3, pp. 285-308.
Mirchandani, D. A. and J. Motwani (2001) "Understanding small business electronic
commerce adoption: An empirical analysis," Journal of Computer Information
Systems (41) 3, pp. 70-73.
Nah, F. F. H. and S. Delgado (2006) "Critical success factors for enterprise resource
planning implementation and upgrade," Journal of Computer Information Systems
(46pp. 99-113.
Nunnally, J. and I. Bernstein (1994) Psychometric Theory. New York: McGraw-Hill.
Nunnally, J. C. (1978) Psychometric Theory. New York: McGraw-Hill.

References
144
OECD (2004) The Economic Impact of ICT - Measurement, Evidence and Implications.
Paris: OECD.
OECD (2006) Structural and Demographic Business Statistics database: 1996-2003.
Paris: OECD.
Oliveira, T. (2008) Bivariate probit model with sample selection - Determinants of the
Adoption of Electronic Commerce (EC). Modelo Probit Bivariado com Selecção -
Factores Determinantes da Adopção do Comércio Electrónico (CE), in SPE edition
M. M. Hill, M. A. Ferreira, J. G. Dias, M. d. F. Salgueiro et al. (Eds.) Actas do XV
Congresso Anual da Sociedade Portuguesa de Estatística Lisboa, pp. 401-414.
Oliveira, T. and M. F. Martins (2009a) Deteminants of Information Technology Adoption in
Portugal, in Ice-B 2009: Proceedings of the International Conference on E-Business,
Milan, pp. 264-270.
Oliveira, T. and M. F. Martins (2009b) Firms Patterns of e-Business Adoption: Evidence for
the European Union-27, in D. Remenyi, J. Ljungberg, and K. Grunden (Eds.)
Proceedings of the 3rd European Conference on Information Management and
Evaluation, Nr Reading: Academic Conferences Ltd, pp. 371-379.
Oliveira, T. and M. F. Martins (2010a) "Firms Patterns of e-Business Adoption: Evidence
for the European Union- 27," The Electronic Journal Information Systems Evaluation
(13) 1, pp. 47-56.
Oliveira, T. and M. F. Martins (2010b) "Understanding e-business adoption across
industries in European countries," Industrial Management & Data System (110) 9,
pp. 1337-1354.
Oliveira, T., M. F. Martins, and S. Dias (2008) "Profile of Portuguese Companies in Terms
of Internet Diffusion. Perfil das Empresas Portuguesas em Termos de Difusão da
Internet," TEXTOS para la CiberSociedad (14) in press.
Oliveira, T. and M. F. O. Martins (2008) A comparison of web site adoption in small and
large Portuguese firms, in Ice-B 2008: Proceedings of the International Conference
on E-Business, pp. 370-377.
References
145
Pan, M. J. and W. Y. Jang (2008) "Determinants of the adoption of enterprise resource
planning within the technology-organization-environment framework: Taiwan's
communications," Journal of Computer Information Systems (48) 3, pp. 94-102.
Parker, C. M. and T. Castleman (2007) "New directions for research on SME-eBusiness:
insights from an analysis of journal articles from 2003 to 2006," Journal of
Information Systems and Small Business (1pp. 21-40.
Pettigrew, A. and R. Whipp (1991) Managing Change for Competitive Success. Oxford:
Blackwell.
Pettigrew, A. M. (1985) The Awakening Giant: Continuity and Change in Imperial Chemical
Industries. Oxford: Basil Blackwell.
Pilat, D. (2004) The ICT Produtivity Paradox: Insights From Micro Data. Paris: OECD.
Pohjola, M. (2003) The Adoption and Diffusion of Information and Communication
Technology across Countries: Patterns and Determinants. Vol. 4. New York: Elsevier
Academic Press.
Porter, M. E. (2001) "Strategy and the Internet," Harvard Business Review (79) 3, pp. 62-
78.
Porter, M. E. and V. E. Millar (1985) "How Information Gives You Competitive Advantage,"
Harvard Business Review (63) 4, pp. 149-160.
Portuguesa, G. d. R. (2005) "Program of the XVII Constitutional Government. Programa do
XVII Governo Constitucional,"
http://www.portugal.gov.pt/PT/GC17/GOVERNO/PROGRAMAGOVERNO/Pages/pro
grama_p003.aspx (2009/01/26, 2009).
Powell, W. and P. DiMaggio (1991) The New Institutionalism in Organizational Analysis.
Chicago: Univ. of Chicago Press.
Premkumar, G. (2003) "A meta-analysis of research on information technology
implementation in small business," Journal of Organizational Computing and
Electronic Commerce (13) 2, pp. 91-121.

References
146
Premkumar, G. and K. Ramamurthy (1995) "The role of interorganizational and
organizational factors on the decision mode for adoption of interorganizational
systems," Decision Sciences (26) 3, pp. 303-336.
Premkumar, G., K. Ramamurthy, and M. Crum (1997) "Determinants of EDI adoption in
the transportation industry," European Journal of Information Systems (6) 2, pp. 107-
121.
Premkumar, G., K. Ramamurthy, and N. Sree (1994) "Implementation of electronic data
interchange: an innovation diffusion perspective," Journal of Management
Information Systems (11) 2, pp. 157-186.
Purvis, R. L., V. Sambamurthy, and R. W. Zmud (2001) "The assimilation of knowledge
platforms in organizations: An empirical investigation," Organization Science (12) 2,
pp. 117-135.
Ramamurthy, K., G. Premkumar, and M. R. Crum (1999) "Organizational and
interorganizational determinants of EDI diffusion and organizational performance: A
causal model," Journal of Organizational Computing and Electronic Commerce (9) 4,
pp. 253-285.
Raymond, L. and F. Bergeron (2008) "Enabling the business strategy of SMEs through e-
business capabilities: a strategic alignment perspective," Industrial Management &
Data Systems (108) 5-6, pp. 577-595.
Reid, G. C. and J. A. Smith (2000) "What makes a new business start-up successful?,"
Small Business Economics (14) 3, pp. 165-182.
Rogers, E. M. (1995) Diffusion of Innovations, Fourth Edition edition. New York: Free
Press.
Rogers, E. M. (2003) Diffusion of Innovations, Fifth Edition edition. New York: Free Press.
SAS (2003) The Distance Macro, 8.2 edition: SAS Institute Inc.
Saunders, M., P. Lewis, and A. Thornhill (2009) Research Methods for Business Students,
5th edition. Essex: FT Prentice-Hall.

References
147
Scott, W. R. (2001) Institutions and Organizations, 2 edition. Thousand Oaks, CA: Sage
Publications.
Scott, W. R. and S. Christensen (1995) The Institutional Construction of Organizations:
International and Longitudinal Studies. Thousand Oaks, CA: Sage Publications.
Serafeimidis, V. and S. Smithson (2000) "Information systems evaluation in practice: a
case study of organizational change," Journal of Information Technology (15) 2, pp.
93-105.
Shapiro, C. and H. R. Varian (1999) Information Rules: A Strategic Guide to the Network
Economy. Boston: Harvard Business School Press.
Sharma, S. (1996) Applied Multivariate Techniques. New York: John Wiley & Sons, Inc.
Soares-Aguiar, A. and A. Palma-Dos-Reis (2008) "Why do firms adopt e-procurement
systems? Using logistic regression to empirically test a conceptual model," Ieee
Transactions on Engineering Management (55) 1, pp. 120-133.
Son, J. Y., S. Narasimhan, and F. J. Riggins (2005) "Effects of relational factors and
channel climate on EDI usage in the customer-supplier relationship," Journal of
Management Information Systems (22) 1, pp. 321-353.
Starbuck, W. H. (1976) Organizations and their environments. Chicago: Rand McNally.
Stiroh, K. J. (2003) Growth and Innovation in the New Economy, in, vol. 1 D. C. Jones
(Ed.) New Economy Handbook, Amsterdam: Elsevier, pp. 723-751.
Stockdale, R. and C. Standing (2006) "An interpretive approach to evaluating information
systems: A content, context, process framework," European Journal of Operational
Research (173) 3, pp. 1090-1102.
Straub, D. W. and R. T. Watson (2001) "Research commentary: Transformational issues in
researching IS and net-enabled organizations," Information Systems Research (12)
4, pp. 337-345.

References
148
Tan, K. S., S. C. Chong, B. S. Lin, and U. C. Eze (2009) "Internet-based ICT adoption:
evidence from Malaysian SMEs," Industrial Management & Data Systems (109) 1-2,
pp. 224-244.
Tan, Z. and W. Ouyang (2004) "Diffusion and Impacts of the Internet and E-commerce in
China," Electronic Markets (14) 1, pp. 25-35.
Teo, H. H., K. K. Wei, and I. Benbasat (2003) "Predicting intention to adopt
interorganizational linkages: An institutional perspective," MIS Quarterly (27) 1, pp.
19-49.
Teo, T. S. H. and C. Ranganathan (2004) "Adopters and non-adopters of business-to-
business electronic commerce in Singapore," Information & Management (42) 1, pp.
89-102.
Teo, T. S. H., C. Ranganathan, and J. Dhaliwal (2006) "Key dimensions of inhibitors for
the deployment of web-based business-to-business electronic commerce," Ieee
Transactions on Engineering Management (53) 3, pp. 395-411.
Thompson, J. D. (1967) Organizations In Action. New York: McGraw-Hill.
Thong, J. Y. L. (1999) "An Integrated Model of Information Systems Adoption in Small
Businesses," Journal of Management Information Systems (15) 4, pp. 187-214.
To, M. L. and E. W. T. Ngai (2006) "Predicting the organisational adoption of B2C e-
commerce: an empirical study," Industrial Management & Data Systems (106) 8, pp.
1133-1147.
Tornatzky, L. and M. Fleischer (1990) The Process of Technology Innovation. Lexington,
MA: Lexington Books.
Umble, E. J., R. R. Haft, and M. M. Umble (2003) "Enterprise resource planning:
Implementation procedures and critical success factors," European Journal of
Operational Research (146) 2, pp. 241-257.
UMIC (2007) A Sociedade de Informação em Portugal 2007.

References
149
Varian, H., R. E. Litan, A. Elder, and J. Shutter (2002) The Net Impact Study, pp. 1-60:
Cisco Systems.
Venkatesh, V., M. G. Morris, G. B. Davis, and F. D. Davis (2003) "User acceptance of
information technology: Toward a unified view," MIS Quarterly (27) 3, pp. 425-478.
w@tch, e.-b. (2006a) "e-Business Decision Maker Survey in European enterprises,"
http://www.ebusiness-watch.org/about/documents/eBiz_Questionnaire_2006.xls).
w@tch, e.-b. (2006b) "The e-Business Survey 2006 – Methodology Report,"
http://www.ebusiness-watch.org/about/documents/DMS2006_Methodology.pdf).
W@tch, e.-B. (2006c) "e-Business Survey 2006: e-Business in 10 sectors of the EU
economy " http://www.ebusiness-watch.org/statistics/table_chart_reports.htm).
W@tch, e.-b. (2007) "The European e-Business Report," European Commission).
Wade, M. (2009) "Resource-based view of the firm,"
http://www.fsc.yorku.ca/york/istheory/wiki/index.php/Resource-
based_view_of_the_firm).
Wade, M., D. Johnston, and R. McClean (2004) "Exploring the net impact of internet
business solution adoption on SME performance," International Journal of Electronic
Business (2) 4, pp. 336-350.
Wei, T. T., G. Marthandan, A. Y. L. Chong, K. B. Ooi et al. (2009) "What drives Malaysian
m-commerce adoption? An empirical analysis," Industrial Management & Data
Systems (109) 3-4, pp. 370-388.
Weill, P. and M. Broadbent (1998) Leveraging the New Infrastructure: How Market
Leaders Capitalize on Information Technology. Cambridge: Harvard Business
School Press.
Whetten, D. A. (1987) "Organizational growth and decline process," Annual Review of
Sociology (13pp. 335-358.
Willcocks, L., C. Sauer, and Associates (2000) Managing the Infrastructure. London:
Random House.

References
150
Zhu, K. (2004a) "The complementarity of information technology infrastructure and e-
commerce capability: A resource-based assessment of their business value," Journal
of Management Information Systems (21) 1, pp. 167-202.
Zhu, K. (2004b) "Information transparency of business-to-business electronic markets: A
game-theoretic analysis," Management Science (50) 5, pp. 670-685.
Zhu, K., S. T. Dong, S. X. Xu, and K. L. Kraemer (2006a) "Innovation diffusion in global
contexts: determinants of post-adoption digital transformation of European
companies," European Journal of Information Systems (15) 6, pp. 601-616.
Zhu, K., K. Kraemer, and S. Xu (2003) "Electronic business adoption by European firms: a
cross-country assessment of the facilitators and inhibitors," European Journal of
Information Systems (12) 4, pp. 251-268.
Zhu, K. and K. L. Kraemer (2002) "e-Commerce metrics for net-enhanced organizations:
Assessing the value of e-commerce to firm performance in the manufacturing
sector," Information Systems Research (13) 3, pp. 275-295.
Zhu, K. and K. L. Kraemer (2005) "Post-adoption variations in usage and value of e-
business by organizations: Cross-country evidence from the retail industry,"
Information Systems Research (16) 1, pp. 61-84.
Zhu, K., K. L. Kraemer, and S. Xu (2006b) "The process of innovation assimilation by firms
in different countries: A technology diffusion perspective on e-business,"
Management Science (52) 10, pp. 1557-1576.
Zhu, K., K. L. Kraemer, S. Xu, and J. Dedrick (2004) "Information technology payoff in e-
business environments: An international perspective on value creation of e-business
in the financial services industry," Journal of Management Information Systems (21)
1, pp. 17-54.

Appendix A
151
Appendix A
Technological integration
Did your firm's IT systems for managing orders link automatically with any of the following
IT systems during January 2006? (Yes No)
a) Internal system for re-ordering replacement supplies
b) Invoicing and payment systems
c) Your system for managing production, logistics or service operations
d) Your suppliers’ business systems (for suppliers outside your firm group)
e) Your customers’ business systems (for customers outside your firm group)
Internal security applications
Did your firm use the following internal security applications, during January 2006? (Yes
No)
a) Virus checking or protection software
b) Firewalls (software or hardware)
c) Secure servers (support secured protocols such as http)
d) Off-site data backup
e) Subscription of a security service (e.g. antivirus or network intrusion alert)
f) Anti-spam filters (unsolicited e-mails)
Access to the IT system of the firm
Did any of those people access the firm's computer system from the following places
during January 2006? (Yes No)
a) From home
b) From customers or other external business partners’ premises
c) From other geographically dispersed locations of the same firm or firm group
d) During business travels, e.g. from the hotel, airport etc.

Appendix A
152

Appendix B
153
Appendix B
A1. Dependent variables
A.1.1.Internet Adoption
Did your firm have access to the Internet during January 2006? (Yes No)
A.1.2 Web site adoption
Did your firm have a Web Site / Home Page during January 2006? (Yes No)
A.1.3. E-commerce adoption
Did your firm perform sales via the Internet during 2005 (excluding manually typed e-
mails)? (Yes No)
A2. Independent variables
A2.1. Technology Readiness
A2.1.1. IT Infrastructures
Did your firm have the following information and communication technologies during
January 2006? (Yes No)
a) Computers
b) e-mail
c) Intranet
d) Extranet
e) Own networks that are not the Internet (own exclusive networks)
f) Wired LAN
g) Wireless LAN
h) WAN

Appendix B
154
A2.1.2. IT skills
Did the firm have working personnel exclusively devoted to Information and
Communication Technologies in January 2006? (Yes No)
A2.2. Technological integration
Did your firm's IT systems for managing orders link automatically with any of the
following IT systems during January 2006? (Yes No)
a) Internal system for re-ordering replacement supplies
b) Invoicing and payment systems
c) Your system for managing production, logistics or service operations
d) Your suppliers’ business systems (for suppliers outside your firm group)
e) Your customers’ business systems (for customers outside your firm group)
A2.3. Security applications
Did your firm use the following security applications, during January 2006? (Yes No)
a) Virus checking or protection software
b) Firewalls (software or hardware)
c) Secure servers (support secured protocols such as http)
d) Off-site data backup
e) Subscription of a security service (e.g. antivirus or network intrusion alert)
f) Anti-spam filters (unsolicited e-mails)
A2. 4. Firm size
How many employees did your firm have during January 2006?
a) 1 up to 4 employees
b) 5 up to 9 employees
c) 10 up t 49 employees
A2. 5. Perceived benefits of electronic correspondence
Did electronic correspondence become the main medium of business communication,
substituting traditional postal mail (e.g. for sending invoices, direct mail, etc. to
customers and other firms), in the last 5 years? (Yes No)

Appendix B
155
A2. 6. IT training programs
Did the company develop training programs (on its premises or elsewhere) related to
computers / informatics targeted at its working personnel in 2005? (Yes No)
A2. 7. Access to the IT system of the firm
Did any of those people access the firm's computer system from the following places
during January 2006? (Yes No)
a) From home
b) From customers or other external business partners’ premises
c) From other geographically dispersed locations of the same firm or firm group
d) During business travels, e.g. from the hotel, airport etc.
A2. 8. Internet and e-mail norms
Did the company have defined norms about Internet and e-mail use in January 2006? (Yes
No)
A2. 9. Main perceived obstacle
Concerning the sale of goods and/or services through the Internet, indicate what is the
main barrier/difficulty encountered by your firm in 2005 (tick only one):
a) Security problems related to the payment and uncertainty about the legal framing of
Internet sales (contracts, terms of delivery and warranty).
b) The goods and/or services provided by the company are not susceptible of being
sold through the Internet.
c) Customers are not ready to buy through the Internet.
e) Development and maintenance costs of the Internet sales system.
f) Other
A2.10.Type of industry
What was the main activity of firms in January 2006?

Appendix B
156

Appendix C
157
Appendix C
MCA is a statistical technique designed to represent associations in a low-dimension
space. It is used to reduce the dimension when the variables are binary. We applied an
MCA to reduce the dimension of the questions about IT Infrastructures and IT Skills. The
first dimension’s inertia is 43%. As can be seen from Table 4, on the negative side of the
first axis we have variables that represent firms that do not use IT infrastructures and do
not have workers with IT skills. On the positive side we have the variables that represent
the use of infrastructures and workers with IT skills. The coordinates of this axis are used
to compute the variable “Technology Readiness”.
Table 5.3: MCA for IT infrastructures and IT skills
Var (-) Dim 1 AC2 RC3 Var (+) Dim AC RC
No computers -0.971 0.079 0.446 Computers 0.460 0.037 0.446
No e-mail -0.849 0.079 0.531 E-mail 0.626 0.059 0.531
No intranet -0.424 0.034 0.500 Intranet 1.179 0.096 0.500
No Wired LAN -0.398 0.032 0.569 Wired LAN 1.430 0.116 0.569
No extranet -0.300 0.019 0.412 Extranet 1.371 0.088 0.412
No own networks -0.249 0.014 0.375 Own networks 1.507 0.084 0.375
No wireless LAN -0.237 0.013 0.377 Wireless LAN 1.591 0.085 0.377
No WAN -0.191 0.009 0.406 WAN 2.123 0.097 0.406
No IT skills -0.120 0.003 0.234 IT skills 1.953 0.057 0.234
Note: 1Dim – Dimension; 2 AC – Absolute Contribution; 3 RC – Relative Contribution.

Appendix C
158

Appendix D
159
Appendix D
The MCA is a method of “multidimensional exploratory statistic” that is used to reduce the
dimension when the variables are binary. For more details see [Johnson and Wichern,
1998]. We applied a MCA for question about IT Infrastructures and IT Skills. The first
dimension explains 38% of inertia. As can be seen from Table 5, in the negative side of
the first axis we have variables that represent firms that do not use IT infrastructures and
do not have workers with IT skills. On the positive side we have the variables that
represent the use of infrastructures and workers with IT skills. This axis is labelled
“Technology Readiness”.
Table 6.5: MCA for IT infrastructures and IT skills
Var (-) Dim 1 AC2 RC3 Var (+) Dim 1 AC1 RC1
No computers -3.000 0.055 0.189 WAN 0.861 0.090 0.512
No e-mail -2.441 0.075 0.266 IT skills 0.762 0.068 0.381
No wired LAN 4 -1.094 0.114 0.565 Wireless LAN 0.748 0.067 0.379
No intranet -0.943 0.087 0.438 Own network 0.623 0.054 0.351
No WAN5 -0.595 0.062 0.512 Extranet 0.609 0.049 0.298
No own network -0.563 0.049 0.351 Wired LAN 0.516 0.054 0.565
No wir eless LAN -0.507 0.045 0.379 Intranet 0.464 0.043 0.438
No IT skills -0.500 0.045 0.381 E-mail 0.109 0.003 0.266
No extranet -0.490 0.039 0.298 Computers 0.063 0.001 0.189 1Dim – Dimension ; 2AC – Absolute Contribution ; 3RC – Relative Contribution ; 4LAN – Local Area Network; 5WAN – Wide Area Network.

Appendix D
160

Appendix E
161
Appendix E
Ward's methods
Firms Figure 7.7. R2 of different methods Figure 7.8 . Dendrogram of Ward’s methods

Appendix E
162

Appendix F
163
Appendix F
Table 9.5: Sample characteristics
Country Obs. (%) Respondent's position Obs. (%)
Austria 268 3.84% Owner/Proprietor 2,070 29.69%
Belgium 227 3.26% Managing Director/Board Member 1,436 20.59%
Cyprus 97 1.39% Head of IT/DP 1,373 19.69%
Czech Republic 397 5.69% Other senior member of IT/DP Department 627 8.99%
Denmark 214 3.07% Strategy development/organization 336 4.82%
Estonia 162 2.32% Other 1,131 16.22%
Finland 384 5.51% Total 6,973 100%
France 521 7.47%
Germany 522 7.49%
Greece 223 3.20% Industry Obs. (%)
Hungary 372 5.33% Food and beverages 890 12.76%
Ireland 219 3.14% Footwear 482 6.91%
Italy 395 5.66% Pulp and Paper 701 10.05%
Latvia 146 2.09% ICT Manufacture 1,069 15.33%
Lithuania 199 2.85% Consumer electronics 387 5.55%
Luxembourg 66 0.95% Construction 1,189 17.05%
Netherlands 278 3.99% Tourism 1,273 18.26%
Poland 348 4.99% Telecommunications 982 14.08%
Portugal 232 3.33% Total 6,973 100%
Romania 193 2.77%
Slovakia 182 2.61%
Slovenia 289 4.14%
Spain 392 5.62%
Sweden 234 3.36%
UK 413 5.92%
Total 6,973 100%

Appendix F
164

Appendix G
165
Appendix G
Ward's method
Country
Figure 9.5. Dendrogram of Ward’s method

![Wrongful adoption”: ¿hipótesis emergente de ... · “W RONGFUL ADOPTION ”: ¿ HIPÓTESIS EMERGENTE DE RESPONSABILIDAD PATRIMONIAL EN C OLOMBIA? [439] R EVISTA DE D E R ECHO](https://img.document.onl/doc/110x75/605fd20b134a3b44ab169a6d/wrongful-adoptiona-hiptesis-emergente-de-aoew-rongful-adoption-a-.jpg)