Embed Size (px)
Citation preview

UNIVERSIDADE DE BRASÍLIA
INSTITUTO DE CIÊNCIAS BIOLÓGICAS
DEPARTAMENTO DE ZOOLOGIA
Estrutura de taxocenoses de lagartos em áreas de Cerrado e de
Savanas Amazônicas do Brasil
Daniel Oliveira Mesquita
Brasília-DF
2005

Universidade de Brasília
Instituto de Ciências Biológicas
Departamento de Zoologia
Estrutura de taxocenoses de lagartos em áreas de Cerrado e de
Savanas Amazônicas do Brasil
Orientador: Guarino Rinaldi Colli, Ph. D.
Tese apresentada ao Instituto de Ciências Biológicas
da Universidade de Brasília como parte dos
requisitos necessários para a obtenção do Título de
Doutor em Biologia Animal
Brasília-DF
2005

Trabalho realizado com o apoio financeiro da Coordenação de Aperfeiçoamento de Pessoal
de Nível Superior (CAPES), como parte dos requisitos para a obtenção do título de Doutor
em Biologia Animal pelo Programa de Pós-graduação em Biologia Animal da Universidade
de Brasília.
APROVADO POR:
Prof. Ph. D. Guarino Rinaldi Colli
(Orientador)
Prof. Dr. Marcio Roberto Costa Martins
(Membro da Banca Examinadora)
Prof. Dr. Marcos Di-Bernardo
(Membro da Banca Examinadora)
Prof. Ph. D. Miguel Ângelo Marini
(Membro da Banca Examinadora)
Prof. Dr. Raimundo Paulo Barros Henriques
(Membro da Banca Examinadora)
Agradecimentos
Aos meus pais, tios e avós por todo apoio e incentivo.
Ao meu orientador Guarino Rinaldi Colli pelo apoio e pela oportunidade dada para a
realização deste trabalho.
A todos os meus colegas de sala Helga, Ayrton, Mariana Zatz, Gabriel, Alison,
Mariana Mira, Fred, Vívian, Reuber, Fernanda, Lilia, Maria Adelaida, Chuck, Verônica,
Paula, Gustavo, Adrian, Leonora e Ruscaia que muito contribuíram para a realização deste
trabalho.
A todos meus colegas de Norman, principalmente Adrian Garda e Don Shepard, que
fizeram de minha passagem pelos EUA algo bastante prazeroso.
Aos Profs. Laurie Vitt e Janalee Caldwell, por terem me aceitado no doutorado
sanduíche e muito contribuído para o resultado final da tese.
Às pessoas que participaram das coletas: Ajax, Fred, Cris, Gabriel, Adrian,
Alexandra, Alison, Ayrton, Joana, Laurie Vitt, Janalee Caldwell, Don Shepard, Guarino,
Kátia e Santos.
Ao Prof. Alexandre F. Bamberg de Araújo, pelas conversas e pelo incentivo.
Aos Professores Miguel Marini e Laurie Vitt, pela participação na defesa de
qualificação.
Aos Professores Miguel Marini, Marcio Martins, Marcos Di-Bernardo, Raimundo
Henriques pela participação da banca examinadora.
Aos Professores Vera Lúcia e Fernando Bauab pela atenção prestada.
À Alexandra pela paciência que teve comigo nessa correria.
Aos colegas Eddie, Girlene, Renato, José Roberto, Tati, Marcos, Darse, Darse Jr.,
Catarina, Milton, Olímpia, Socorro, Dora, Léo, Dailton (in memorian), Dí, Bonito (in
memorian), Renê, Renata, Raíssa, Sandra, Marcelo, Blue, André, Eduardo, Evandro entre
outros.
A todos os colegas da UnB.
À CAPES pela bolsa Sanduíche e de doutorado.
À FINATEC, PROBIO-MMA (“Estrutura e Dinâmica da Biota de Isolados Naturais e
Antrópicos do Cerrado”, “Paisagens e Biodiversidade: Uma Perspectiva Integrada Para
Inventário e Conservação da Serra do Cachimbo” e “Inventário da Biodiversidade do Vale e
Serra do Rio Paranã e do Sul do Tocantins”), National Geografic Society (4994-3),
Conservation International (“Proposta de Levantamento da Herpetofauna da Micro Região do

Jalapão” e “Subsídios à Conservação da Biodiversidade na Bacia do Rio Paranã”), PIE-CNPq
(“Biogeografia e Diversidade Faunística das Savanas Amazônicas”), MacArthur Foundation
(“Faunistic Survey of Brazilian Amazonia”), WWF - Fundo Mundial para Natureza (9579-
009, SR 022-94), Fundação O Boticário de Proteção à Natureza (“Herpetofauna das Savanas
Amazônicas: Subsídios Para sua Preservação”) e ao Programa de Pós-Graduação em Biologia
Animal, pelo apoio financeiro.
VITAE
PRODUÇÃO BIBLIOGRÁFICA Artigos completos publicados em periódicos * 1 MESQUITA, Daniel Oliveira; COLLI, Guarino Rinaldi; VITT, Laurie Joseph. Ecological release in lizard assemblages of Neotropical savannas. Oikos, v. 00, n. 00, p. 00-00, submetido. * 2 MESQUITA, Daniel Oliveira; COLLI, Guarino Rinaldi; FRANÇA, Frederico Gustavo Rodrigues; VITT, Laurie Joseph. Ecology of a Cerrado lizard assemblage in the Jalapão region of Brazil. Copeia, v. 00, n. 00, p. 00-00, submetido. * 3 VITT, Laurie Joseph; CALDWELL, Janalee Paige; COLLI, Guarino Rinaldi; MESQUITA, Daniel Oliveira; GARDA, Adrian Antônio; FRANÇA, Frederico Gustavo Rodrigues. Variation in habitat structure on small geographic scales affects structure of Cerrado lizard assemblages. Journal of Tropical Ecology, v. 00, n. 00, p. 00-00, submetido. * 4 MESQUITA, Daniel Oliveira; COSTA, Gabriel Corrêa; ZATZ, Mariana Gonzaga. Ecological aspects of the casque-headed frog Aparasphenodon brunoi (Anura, Hylidae) in a restinga habitat in southeastern Brazil. Phyllomedusa, v. 3, n. 1, p. 51-60, 2004. * 5 COLLI, Guarino Rinaldi; COSTA, Gabriel Correa; GARDA, Adrian Antônio; MESQUITA, Daniel Oliveira; KOPP, Kátia; PÉRES JR, Ayrton Klier; VALDUJO, Paula Hanna; VIEIRA, Gustavo Henrique C; WIEDERHECKER, Helga Correa. A critically endangered new species of Cnemidophorus (Squamata, Teiidae) from Cerrado enclave in southwestern Amazonia, Brazil. Herpetologica, v. 59, n. 1, p. 76-88, 2003. * 6 COLLI, G R; CALDWELL, J P; COSTA, G C; GAINSBURY, A M; GARDA, A A; MESQUITA, Daniel Oliveira; R FILHO, C M M; SOARES, A H B; SILVA, V N; VALDUJO, P H; VIEIRA, G H C; VITT, L J; WERNECK, F P; WIEDERHECKER, H C; ZATZ, M G. A new species of Cnemidophorus (Squamata, Teiidae) from the Cerrado biome in central Brazil. Occasional Papers Of The Oklahoma Museum Of Natural History, v. 14, p. 1-14, 2003. * 7 MESQUITA, Daniel Oliveira; BRITES, V L C. Aspectos taxonômicos e ecológicos da população de Bothrops alternatus DUMÉRIL, BIBRON & DUMÉRIL, 1854 (Serpentes, Viperidae) das regiões do Triângulo e Alto Paranaíba, Minas Gerais. Biologia Geral e Experimental, v. 3, n. 2, p. 33-38, 2003. * 8 MESQUITA, Daniel Oliveira; COLLI, Guarino Rinaldi. Geographical variation in the ecology of populations of some Brazilian species of Cnemidophorus (Squamata, Teiidae). Copeia, v. 2003, n. 2, p. 285-298, 2003. * 9 MESQUITA, Daniel Oliveira; WIEDERHECKER, H C. Influência da massa corporal e da temperatura no deslocamento e na vocalização de três espécies de anuros do Cerrado. Biologia Geral e Experimental, v. 3, n. 2, p. 21-24, 2003. * 10 MESQUITA, Daniel Oliveira; COLLI, G R. The ecology of Cnemidophorus ocellifer (Squamata, Teiidae) in a neotropical savanna. Journal of Herpetology, v. 37, n. 3, p. 498-509, 2003. * 11 COLLI, G R; MESQUITA, Daniel Oliveira; RODRIGUES, P V V; KITAYAMA, K. The ecology of the gecko Gymnodactylus geckoides amarali in a neotropical savanna. Journal of Herpetology, v. 37, n. 4, p. 694-706, 2003. * 12 VITT, Laurie Joseph; CALDWELL, Janalee Paige; COLLI, Guarino Rinaldi; GARDA, Adrian Antônio; MESQUITA, Daniel Oliveira; FRANÇA, Frederico Gustavo Rodrigues; BALBINO, Santos Fernandes. Um guia fotográfico dos répteis e anfíbios da região do Jalapão no Cerrado brasileiro. Norman, Oklahoma: Special Publications in Herpetology. San Noble Oklahoma Museum of Natural History, 2002. (Guia Fotográfico). * 13 MESQUITA, Daniel Oliveira; BRITES, Vera Lucia de Campos. Estudio de las marcas naturales de
Bothrops alternatus Duméril, Bibron & Duméril, 1854 (Serpentes, Crotalinae). Acta Zoologica Lilloana, v. 46, n. 1, p. 138-140, 2002. 14 MESQUITA, Daniel Oliveira; COLLI, Guarino Rinaldi; PÉRES JR, Ayrton Klier; VIEIRA, Gustavo H C. Mabuya guaporicola. Natural History. Herpethological Review, v. 31, n. 4, p. 240-241, 2000. 15 VIEIRA, Gustavo H C; MESQUITA, Daniel Oliveira; COLLI, Guarino Rinaldi; PÉRES JR, Ayrton Klier. Micrablepharus atticolus. Natural history. Herpethological Review, v. 31, n. 4, p. 241-242, 2000. Artigos resumidos publicados em periódicos * 1 COSTA, Gabriel Corrêa; MESQUITA, Daniel Oliveira; FRANÇA, Frederico Gustavo Rodrigues. Crocodilurus amazonicus (Jacarerana). Diet. Herpetological Review, v. 00, n. 00, p. 00-00, no prelo. * 2 FRANÇA, Frederico Gustavo Rodrigues; MESQUITA, Daniel Oliveira; GARDA, Adrian Antônio. Phalotris labiomaculatus. (falsa coral). Geographic Distribution. Herpetological Review, v. 36, n. 1, p. 00-00, no prelo. 3 MESQUITA, Daniel Oliveira; COLLI, Guarino Rinaldi. Aspectos da ecologia de Gymnodactylus geckoides de um Cerrado no Brasil central. Publicação Extra do Museo Nacional, Montevideo-Uruguay, v. 50, p. 85-85, 1999. 4 MESQUITA, Daniel Oliveira; BRITES, Vera Lucia de Campos. Aspectos ecológicos da população de Bothrops alternatus (Serpentes, Crotalinae) da Zona Geográfica do Triângulo e Alto Paranaíba-MG. Publicação Extra do Museo Nacional, Montevideo-Uruguay, v. 50, p. 84-84, 1999. 5 MESQUITA, Daniel Oliveira; BRITES, Vera Lucia de Campos. Folidose, biometria e cromatismo da população de Bothrops alternatus (Serpentes, Crotalinae) da Zona Geográfica do Triângulo e Alto Paranaíba-MG. Publicação Extra do Museu Nacional de Historia Natural, Montevideo-Uruguay, v. 50, p. 84-84, 1999. * Trabalhos publicados durante o doutorado.
There are places I’ll remember
All my life though some have changed
Some forever not for better
Some have gone and some remain
All these places have their moments
With lovers and friends I still can recall
Some are dead and some are living
In my life I’ve loved them all
Lennon/McCartney
ÍNDICE
Introdução ....................................................................................................................................1
Materiais e métodos .....................................................................................................................5
Capítulo 1.....................................................................................................................................10
Capítulo 2.....................................................................................................................................12
Capítulo 3.....................................................................................................................................14
Capítulo 4.....................................................................................................................................16
Discussão .....................................................................................................................................18
Referências bibliográficas............................................................................................................21
Apêndice 1 ...................................................................................................................................27
Apêndice 2 ...................................................................................................................................76
Apêndice 3 ...................................................................................................................................117
Apêndice 4 ...................................................................................................................................151
1
INTRODUÇÃO
As comunidades são usualmente definidas como associações entre populações que
coexistem em determinado local. Por uma questão metodológica, um grupo de espécies
filogeneticamente relacionadas que coexistem em determinada área geográfica é chamado de
taxocenose (“assemblage”) (Ricklefs e Miller, 1999). A estrutura das taxocenoses é resultante da
área geográfica onde as populações ocorrem, das suas interações, padrões do uso de recursos e
relações evolutivas (Ricklefs e Miller, 1999). Há poucos anos, ecólogos acreditavam que fatores
locais (ecológicos) eram os principais determinantes da estrutura das taxocenoses (Dunham,
1983). Hoje em dia, fatores históricos têm recebido especial atenção em estudos sobre estrutura
das taxocenoses e se considera que, se as informações históricas forem ignoradas, pode-se chegar
a conclusões totalmente equivocadas sobre os determinantes da estrutura de uma taxocenose
(Losos, 1996).
Em uma taxocenose, divergências em algum aspecto ecológico (por exemplo, no uso de
microhábitat) entre espécies filogeneticamente aparentadas, indicam a prevalência de fatores
ecológicos sobre fatores históricos. Por outro lado, a ausência de divergências ecológicas entre
espécies próximas indica a prevalência de fatores históricos (Brooks e McLennan, 1991; Brooks
e Mclennan, 1993). Da mesma forma, padrões similares na estrutura de diferentes taxocenoses
sugerem que fatores históricos são predominantes, enquanto que a variação destes padrões entre
taxocenoses de ambientes similares indicam a prevalência de fatores ecológicos (Brooks e
McLennan, 1991; Cadle e Greene, 1993). Entretanto, deve ser tomado um cuidado especial com
o real parentesco de espécies-irmãs em uma taxocenose. Por mais próximas que pareçam ser, ao

2
se considerar a topologia que une as espécies de uma taxocenose, elas podem ser de linhagens
distintas quando se considera a filogenia do gênero (Losos, 1996).
A ausência de espécies que se alimentam de invertebrados em uma taxocenose de
serpentes na Caatinga foi considerada como resultado da competição com mamíferos insetívoros
(Vitt e Vangilder, 1983). Posteriormente, Cadle e Greene (1993), analisando dados de tamanho
do corpo, hábitat, horário de atividade e dieta de 21 taxocenoses de serpentes neotropicais,
chegaram a conclusões diferentes por verificar que as principais linhagens de serpentes que se
alimentam de invertebrados se concentram na América Central e do Norte. Assim, a ausência de
serpentes que se alimentam de invertebrados na Caatinga se deve à ausência de membros de
certas linhagens (fator histórico) e não à presença de competidores (fator ecológico).
Na ilha de Grand Cayman, na América Central, onde existia previamente Anolis
conspersus, foi introduzida A. sagrei. Comparações do uso de microhábitat antes da introdução
de A. sagrei indicaram que, em locais com vegetação aberta onde A. sagrei é abundante agora, A.
conspersus utiliza poleiros mais altos, e em áreas com vegetação fechada, onde A. sagrei não
ocorre, não foi detectada nenhuma diferença evidente na altura do poleiro utilizado (Losos et al.,
1993). Estes resultados indicam a importância das relações interespecíficas (fator ecológico),
mostrando que as mesmas podem ser importantes na estruturação das taxocenoses.
Vários trabalhos sobre taxocenoses de lagartos foram realizados recentemente na Região
Neotropical. Em uma restinga, no estado do Rio de Janeiro, foi estudada uma taxocenose de
lagartos através de dados morfométricos, de dieta e de microhábitat, sendo que a estruturação da
taxocenose através dos dados morfométricos mostrou uma separação de dois grupos dentro da
assembléia: um de espécies bromelícolas e outro de “corredoras de areia” (Araújo, 1991). Na
Caatinga, Vitt (1995) descreveu a taxocenose de lagartos utilizando dados de horário de

3
atividade, temperatura corporal, hábitat, microhábitat e padrões de utilização de recursos (dieta),
e concluiu que a filogenia tem um papel de maior importância na estruturação da taxocenose do
que as interações entre as espécies. Vitt e Carvalho (1998a) realizaram um trabalho semelhante
em uma floresta de transição na Amazônia, encontrando evidências da maior influência de
fatores históricos, principalmente na utilização de microhábitats. No Cerrado, foi estudada uma
taxocenose de lagartos na região de Alto Araguaia, estado do Mato Grosso, com apenas nove
espécies, sendo encontrada uma divergência no uso de microhábitat entre tropidurídeos e
policrotídeos, e sobreposição entre teiídeos e gymnoftalmídeos, mas a diferença de tamanho
entre os dois últimos taxóns promoveu divergência na dieta (Vitt, 1991). Araújo (1992) realizou
um estudo de estrutura morfométrica em três taxocenoses de lagartos no Cerrado e duas de
Restingas do sudeste brasileiro, tendo encontrado uma forte relação entre as interações
ecológicas entre espécies e seus atributos morfológicos, mostrando a importância da estrutura
morfométrica como instrumento para estudos de estrutura de taxocenoses de lagartos. Em uma
taxocenose de lagartos de Savana Amazônica, em Roraima, foram encontradas apenas oito
espécies, separadas em três guildas alimentares: herbívoros, forrageadores ativos e forrageadores
“senta e espera”, sendo que o principal determinante destas guildas não foi a composição da
dieta, mas a forma de aquisição das presas (Vitt e Carvalho, 1995). Entretanto, nos trabalhos
realizados no Cerrado e Savanas Amazônicas, os autores não levaram em conta a influência de
fatores históricos.
Uma explicação para a formação das Savanas Amazônicas é a “Hipótese dos Refúgios
Pleistocênicos” e um dos seus princípios básicos é que, durante períodos glaciais de precipitação
reduzida, grandes extensões da Amazônia foram cobertas por savanas, restringindo a floresta a
manchas isoladas (Ab'Sáber, 1982; Bigarella e Andrade-Lima, 1982; Eden, 1974; Huber, 1982),
4
sendo assim, as Savanas Amazônicas representariam resquícios de uma extensa savana que se
estendeu do Brasil central até as Guianas (Prance, 1978). Atualmente, as Savanas Amazônicas
ocorrem como ilhas dispersas no interior das áreas florestais da Amazônia e cobrem cerca de
150.000 Km2, cerca de 2% do território brasileiro (Pires, 1973). Eiten (1978) observou que
muitas espécies vegetais típicas do Cerrado são dominantes nas Savanas Amazônicas, porém
estas sempre apresentam baixa diversidade e endemismo. As taxocenoses de lagartos também
apresentam baixa diversidade, porém com uma grande quantidade de endêmicos ou espécies que,
na Amazônia, só ocorrem nestas áreas abertas (Ávila-Pires, 1995; Colli, 1996; Vitt e Carvalho,
1995).
Usualmente, ilhas apresentam uma diversidade menor quando comparadas com áreas
contínuas, mas geralmente suas espécies ocorrem em maiores densidades que em áreas
contínuas. Este fenômeno foi inicialmente descrito para taxocenoses de aves e chamado de
compensação da densidade (“density compensation”) (Crowell, 1962; Pianka, 1994; Ricklefs e
Miller, 1999). Nestas condições, as espécies das ilhas podem expandir seu hábitat, ocupando
hábitats normalmente ocupados por outras espécies. Este fenômeno também foi descrito
inicialmente para taxocenoses de aves e foi chamado de expansão de nicho (“niche expansion”)
(MacArthur et al., 1972; Pianka, 1994; Ricklefs e Miller, 1999). Estes dois fenômenos são
conjuntamente referidos como “liberação ecológica” (“ecological release”) (Pianka, 1994;
Ricklefs e Miller, 1999) e também já foram relatados em taxocenoses de anfíbios e répteis.
Rodda e Dean-Bradley (2002) encontraram fortes evidências de que anfíbios e répteis
(principalmente lagartos) apresentam uma maior densidade e biomassa em ilhas menores do que
em ilhas maiores e em áreas contínuas. Por outro lado, um estudo correlacionando o tamanho de
ilhas com a densidade de populações animais mostrou uma correlação positiva, sugerindo que a
5
compensação da densidade pode ser pouco comum (Connor et al., 2000). De acordo com a
hipótese de "liberação ecológica", espera-se que várias dimensões do nicho, do corpo,
microhábitat, dieta e a abundância, sejam maiores em espécies de Savanas Amazônicas quando
comparadas com espécies próximas do Cerrado.
Os objetivos deste trabalho são (1) comparar as taxocenoses de lagartos de Cerrado e
Savanas Amazônicas, para testar a hipótese de "liberação ecológica", levando-se em conta a
importância de fatores locais (ecológicos) e regionais (históricos) na estruturação dessas
taxocenoses; descrever as taxocenoses de lagartos das regiões do Cerrado no Jalapão (2) e da
Savana Amazônica em Monte Alegre (3), através da combinação de dados ecológicos e
morfológicos com a filogenia das espécies, com o objetivo de examinar a influência da história
na estrutura da mesma; e (4) determinar a relação entre a composição, diversidade de espécies
(abundância relativa) e estrutura de taxocenoses com a estrutura do hábitat em duas áreas
facilmente distinguíveis e quase contíguas na região do Jalapão.
MATERIAIS E MÉTODOS
Foram utilizados animais coletados em cinco áreas contínuas do Cerrado (GOIÁS:
Alvorada do Norte e São Domingos; TOCANTINS: Mateiros, Paranã e Dianópolis), cinco isolados
periféricos do Cerrado (RONDÔNIA: Vilhena, Pimenta Bueno e Guajará-Mirim; PARÁ: Novo
Progresso e Carajás) e cinco Savanas Amazônicas (PARÁ: Alter do Chão e Monte Alegre;
AMAZONAS: Humaitá; RORAIMA: Boa Vista; AMAPÁ: Amapá). Os animais das áreas de Cerrado
(solados e não isolados) foram coletados pelo autor da dissertação, seu orientador, o Dr. Guarino
R. Colli e a equipe do Laboratório de Herpetologia da Universidade de Brasília. Os animais

6
coletados nas áreas de Savanas Amazônicas (exceto em Monte Alegre, que foram coletados pelo
autor) foram coletados pelo Dr. Guarino R. Colli (Orientador), durante seu doutorado. Todos os
espécimes coletados estão depositados na Coleção Herpetológica da Universidade de Brasília
(CHUNB). A diferença entre Savanas Amazônicas e isolados periféricos do Cerrado foi proposta
por Eiten (1978), sendo baseada principalmente em similaridade de espécies vegetais.
Usualmente, as Savanas Amazônicas são mais pobres, quando comparadas com todos os tipos de
áreas de Cerrado (isolados e não isolados) (Eiten, 1972; Eiten, 1978). Aqui, todos os enclaves
estão sendo considerados como ilhas, para se testar a hipótese de “liberação ecológica”.
A amostragem foi feita com armadilhas de interceptação e queda, sendo 25 conjuntos em
cada área, consistindo de 4 baldes dispostos em 3 linhas de 5 m, formando ângulos de 120º a
partir de um mesmo ponto central e ligados por uma lona plástica fixada com grampos em
estacas de madeira. Também foram realizadas coletas manuais com o auxílio de uma espingarda
calibre 36. No momento da coleta foram anotados dados referentes a horário de atividade,
temperatura corporal e microhábitat.
A largura do nicho (microhábitat) foi calculada através do inverso do índice de
diversidade de Simpson (Simpson, 1949) e, para examinar a sobreposição de microhábitats foi
utilizada a equação de sobreposição de nicho, segundo Pianka (1973).
Através de um paquímetro digital foram obtidas medidas de comprimento rostro-anal,
altura e largura do corpo, comprimento, altura e largura da cabeça, e comprimento dos membros
anterior e posterior. Posteriormente, os estômagos dos animais foram removidos e seus
conteúdos analisados através de uma lupa, sendo as presas identificadas até ordem e, quando
possível, categorias inferiores. Quando as presas estavam inteiras, seu comprimento e largura
foram medidos com um paquímetro digital e seu volume estimado pela fórmula do volume de
7
um elipsóide. Também foi calculada a largura de nicho e a sobreposição da dieta entre as
espécies utilizando-se os mesmos procedimentos descritos anteriormente para o microhábitat.
Foram feitas comparações entre taxocenoses. Quando uma espécie, ou espécies próximas,
ocorreram em taxocenoses de biomas diferentes, elas tiveram aspectos da sua ecologia, como
largura do nicho de microhábitat e dieta, comparados. Nestas comparações, as diferenças entre
Cerrado e Savanas Amazônicas foram utilizadas como modelo para se testar a hipótese de
"liberação ecológica". Esta hipótese prediz que em ilhas (Savanas Amazônicas e isolados de
Cerrado), onde a diversidade é menor, as espécies tendem a expandir seu hábitat e ocorrer em
maior abundância, devido ao espaço vago que em áreas contínuas (Cerrado) estaria ocupado por
outras espécies. Portanto, espera-se que estes parâmetros ecológicos sejam maiores nas espécies
de isolados que nas espécies de Cerrado. Para comparar as comunidades através das variáveis
morfométricas, foram utilizadas as distâncias Euclidianas das variáveis transformadas para
logaritmo (para satisfazer as premissas de normalidade). Para cada taxocenose, foi calculada a
média da distância do vizinho mais próximo e estas foram comparadas. Baseando na hipótese de
"liberação ecológica", espera-se que em ilhas (Savanas Amazônicas e isolados do Cerrado), a
média das distâncias ao vizinho mais próximo seja maior que em áreas contínuas (Cerrado).
Nestas comparações, foi levada em conta a influência de fatores históricos nos padrões
encontrados. Quando as variações do meio influenciam fortemente as espécies mais aparentadas,
modificando os padrões de coexistência, espera-se que fatores locais sejam mais importantes
para a explicação dos padrões encontrados. Se as espécies aparentadas não apresentarem
divergência na ecologia, espera-se que sua ecologia seja bastante conservativa e independente de
fatores externos, sendo assim, fatores históricos seriam mais importantes para a manutenção do

8
padrão em questão (Brooks e McLennan, 1991; Brooks e Mclennan, 1993; Losos, 1994; Losos,
1996). Estes tópicos fazem parte do primeiro capítulo da dissertação.
Ainda, os dados de microhábitat, horário de atividade, temperatura corporal, tamanho do
corpo, e largura do nicho (microhábitat e dieta), foram mapeados em uma árvore filogenética das
espécies que compõem a taxocenose para realizar comparações entre as espécies. Quando
ocorrem divergências entre aspectos ecológicos e as espécies não são próximas
filogeneticamente, temos o indício da prevalência de fatores históricos sobre fatores locais e,
quando as espécies são próximas, espera-se que fatores locais sejam mais importantes para a
relação em questão (Brooks e McLennan, 1991; Cadle e Greene, 1993; Brooks e Mclennan,
1993). Se as interações em nível local forem os principais determinantes na estruturação da
taxocenose, espera-se que os aspectos ecológicos estejam mapeados aleatoriamente na filogenia
das espécies (Vitt, 1995). Para determinar a importância da história na estrutura da taxocenose,
foi utilizada uma análise de ordenação canônica filogenética (Giannini, 2003) juntamente com
permutações de Monte Carlo (9,999) no CANOCO 4.5 para Windows. Esta análise consiste de
uma ordenação canônica para identificar pontos de divergência dentro de uma matriz filogenética
reduzida que melhor explica os padrões ecológicos (Giannini, 2003). Estas análises foram feitas
para duas áreas, uma de Cerrado no estado do Tocantins (Jalapão) e uma para as Savanas
Amazônicas (Monte Alegre, PA), e fazem parte respectivamente do segundo e terceiro capítulos
da dissertação.
Na região do Jalapão, foram utilizadas armadilhas de queda (“pitfall”) para determinar a
relação entre a composição de espécies (abundância relativa) e a estrutura da taxocenose e do
hábitat em dois tipos de fitofisionomias do Cerrado, facilmente distinguíveis e contínuas, um
ambiente aberto (Cerrado Típico) e outro parcialmente fechado (Cerrado Denso). Para
9
caracterizar o hábitat, em cada transecto de armadilhas de queda (num raio de 6 m do balde
central), foram medidas as seguintes variáveis estruturais e da vegetação: 1) massa do folhiço, 2)
percentual de solo exposto, 3) percentual de cobertura de copa, 4) número de árvores (5 cm de
diâmetro) ao redor, 5) número de buracos no chão, 6) número de cupinzeiros, 7) distância da
árvore mais próxima, 8) circunferência do tronco como medida do tamanho da árvore, e 9)
número de troncos caídos. Foi realizada uma Análise de Correspondência Canônica (CCA; ver
Ter Braak, 1986), uma ordenação multivariada que associa diretamente a variação na taxocenose
(nesse caso a ocorrência dos lagartos) às características do hábitat. Foram utilizadas as variáveis
estruturais e da vegetação para caracterizar o hábitat em cada armadilha e abundância relativa
dos lagartos como medida de estrutura de taxocenose. Nestas análises foi investigado se existe
associação entre características específicas do hábitat e a ocorrência das espécies de lagartos. A
CCA foi realizada com o CANOCO 4.5 para Windows. Estes tópicos fazem parte do quarto
capítulo da dissertação.

10
CAPÍTULO 1
“Liberação ecológica” em taxocenoses de lagartos em savannas Neotropicais
Foram comparadas as taxocenoses de lagartos do Cerrado e de Savanas Amazônicas para
testar a hipótese de “liberação ecológica”, levando em conta a influência de fatores históricos. A
hipótese de “liberação ecológica” prediz que dimensões do nicho e abundância devem ser
maiores em espécies das Savanas Amazônicas e em fragmentos isolados do Cerrado, quando
comparados com áreas não isoladas do Cerrado. Foi calculada a largura de nicho de microhábitat
e dieta com dados de seis populações do Cerrado do Brasil central e 14 de fragmentos isolados
do Cerrado e de áreas de Savanas Amazônicas. Os dados morfológicos foram comparados
através da média das distâncias Euclidianas e a abundância dos lagartos foi estimada através do
número de lagartos capturados nas armadilhas de queda por um período prolongado. Não foi
encontrada evidência de “liberação ecológica” quando utilizados os dados de uso de microhábitat
nestas áreas, sugerindo que os fatores históricos são mais importantes que fatores ecológicos na
estruturação dessas taxocenoses. Entretanto, os dados dos estômagos individuais indicaram que a
“liberação ecológica” ocorre nessas áreas para Tropidurus, mas não para Ameiva ameiva, Anolis,
Cnemidophorus e Micrablepharus. Esses resultados sugerem que diferentes linhagens
respondem de maneira diferente às pressões ambientais, sendo tropidurídeos mais afetados por
fatores ecológicos que policrotídeos, teiídeos e gimnoftalmídeos. A análise dos dados
morfológicos e de abundância não evidenciaram que ocorra “liberação ecológica” nestas áreas. A
ecologia das espécies é bastante conservativa, variando pouco de taxocenose para taxocenose.

11
Entretanto, o aumento na largura de nicho de algumas espécies (Tropidurus) indicou que a
“liberação ecológica” pode ocorrer.
O presente capítulo, sintetizado no parágrafo acima foi finalizado durante o doutorado-
sanduíche, realizado em Norman, OK, USA, de março a agosto de 2004, e submetido para a
publicação na revista OIKOS em janeiro de 2005. O manuscrito intitulado “Ecological release in
lizard assemblages of Neotropical savannas”, de autoria de Daniel Oliveira Mesquita, Guarino
Rinaldi Colli e Laurie J. Vitt, está anexado no Apêndice 1.

12
CAPÍTULO 2
Ecologia de uma taxocenose de lagartos na região do Jalapão no Brasil
A taxocenose de lagartos da região do Jalapão, uma das últimas grandes regiões não
perturbadas no Cerrado, localizada no estado do Tocantins, foi descrita através da combinação de
dados ecológicos e morfológicos com a filogenia das espécies, com o objetivo de examinar a
influência da história na estrutura da mesma. A taxocenose de lagartos da região do Jalapão
contém 14 espécies. A largura de nicho de microhábitat foi baixa para todas as espécies. A
sobreposição de nicho, baseado nos dados de microhábitat, variou de praticamente nenhuma até
quase total e parece estar relacionada com a distância filogenética. A análise de
pseudocomunidades mostrou que a média da sobreposição de microhábitat e de dieta não diferiu
estatisticamente de zero, indicando a ausência de estrutura. A sobreposição de presas foi alta
entre os gimnoftalmídeos e teiídeos. O gráfico dos escores dos fatores dos dois primeiros
componentes principais mostrou os grupos correspondendo às famílias de lagartos, sugerindo
uma forte associação entre morfologia e filogenia. Uma inspeção detalhada do cladograma
mostrou similaridades entre as espécies mais aparentadas, sugerindo uma maior importância da
história na taxocenose, quando comparada com a ecologia. A ordenação filogenética canônica
não mostrou nenhum efeito filogenético no uso de microhábitat e na composição da dieta dos
lagartos. Os resultados contraditórios da ordenação filogenética canônica sugerem que os efeitos
históricos potenciais são de difícil detecção porque os táxons mais basais (famílias) são sub-
representados. Portanto, as amostragens de dados ecológicos em taxocenoses pobres em espécies

13
filogeneticamente próximas podem dificultar a detecção do efeito histórico através de análises
dos aspectos ecológicos das taxocenoses baseadas em métodos filogenéticos.
O presente capítulo, sintetizado no parágrafo acima também foi finalizado durante o
doutorado-sanduíche, realizado em Norman, OK, USA, de março a agosto de 2004, e submetido
para a publicação na revista Copeia em janeiro de 2005. O manuscrito intitulado “Ecology of a
Cerrado lizard assemblage in the Jalapão region of Brazil”, de autoria de Daniel Oliveira
Mesquita, Guarino Rinaldi Colli, Frederico Gustavo Rodrigues França e Laurie J. Vitt, está
anexado no Apêndice 2.

14
CAPÍTULO 3
Ecologia de uma taxocenose de lagartos de Savanas Amazônicas na região de Monte Alegre,
Pará, Brasil
Foi descrita a taxocenose de lagartos de uma Savana Amazônica na região de Monte
Alegre, estado do Pará, através de dados ecológicos, morfológicos e de história de vida,
avaliando a importância da filogenia na taxocenose. A taxocenose amostrada contém sete
espécies. A largura de nicho de microhábitat foi baixa para todas as espécies e a sobreposição de
nicho, baseado no uso de microhábitat, variou de quase nenhuma até quase completa, sendo os
menores valores entre espécies mais distantes filogeneticamente e entre os teiídeos. A atividade
dos lagartos ocorreu das 9:00 h até as 17:00 h e, geralmente, os forrageadores ativos foram mais
comumente observados durantes as horas mais quentes do dia, enquanto os forrageadores senta e
espera foram mais comuns no entardecer. O teste de Tukey nas temperaturas corporais
identificou dois grupos estatisticamente homogêneos, um com os teiídeos e outro com as outras
espécies. A análise de pseudocomunidades mostrou que a média de sobreposição de uso de
microhábitat pelos lagartos não foi diferente de zero, indicando ausência de estrutura. Os maiores
índices de sobreposição de dieta ocorreram entre os teiídeos. A análise de pseudocomunidades
mostrou que a média de sobreposição de composição de dieta não foi diferente de zero,
indicando ausência de estrutura. O gráfico com as médias dos escores por espécie dos dois
primeiros componentes principais mostrou clusters correspondentes às famílias de lagartos. Uma
inspeção detalhada das variáveis ecológicas mapeadas na filogenia das espécies e comparações
15
com espécies próximas que ocorrem em outros biomas, indicaram que a história das espécies é
extremamente importante para a manutenção do padrão encontrado na taxocenose de Monte
Alegre, principalmente em Teioidea, o que foi corroborado pelos resultados da ordenação
filogenética canônica.
O presente capítulo, sintetizado no parágrafo acima, foi finalizado em janeiro de 2005 e
submetido para a publicação na revista Biotropica em fevereiro de 2005. O manuscrito intitulado
“Ecology of an Amazonian Savanna lizard assemblage in Monte Alegre, Brazil”, de autoria de
Daniel Oliveira Mesquita, Gabriel Corrêa Costa e Guarino Rinaldi Colli, está anexado no
Apêndice 3.
16
CAPÍTULO 4
Riqueza e diversidade de lagartos determinadas pelas características do hábitat em uma escala
microgeográfica: implicações para conservação no Cerrado brasileiro
Foram utilizadas armadilhas de queda para determinar a relação entre a composição,
diversidade de espécies e estrutura de taxocenoses com a estrutura do hábitat em dois fragmentos
facilmente distinguíveis e quase contíguos na região do Jalapão, estado do Tocantins no Cerrado
brasileiro. Um hábitat era relativamente aberto (Cerrado Típico) e o outro era parcialmente
fechado (Cerrado Denso); eles diferiram significativamente em cinco das nove variáveis de
hábitat e o hábitat mais aberto manteve durante o dia as temperaturas dos diversos microhábitats
mais altas que as do hábitat mais fechado. A análise de componentes principais mostrou que o
hábitat mais fechado apresentou uma combinação de mais troncos caídos, buracos e folhiço que
o hábitat mais aberto. Um total de 531 indivíduos de 12 espécies de lagartos foi amostrado. As
curvas de acumulação de espécies mostraram que após 23 dias de amostragem contínua o
número assintótico de espécies foi de 10 para o hábitat mais aberto e 12 para o mais fechado. A
estrutura de taxocenose dos lagartos também foi diferente entre hábitats. Uma análise de
correspondência canônica (CCA) comparando as variáveis do hábitat em cada ponto de
armadilhas com as espécies amostradas mostrou que as espécies são extremamente relacionadas
com características do microhábitat. Os resultados indicaram que a estrutura do microhábitat
pode causar um forte impacto na composição de espécies de lagartos, na diversidade e na
17
estrutura de taxocenoses. Portanto, os programas de conservação que visam à manutenção da
biodiversidade deveriam considerar os microhábitats que as espécies utilizam.
O presente capítulo, sintetizado no parágrafo acima também foi finalizado durante o
doutorado-sanduíche, realizado em Norman, OK, USA, de março a agosto de 2004, e submetido
para a publicação na revista Journal of Tropical Ecology em outubro de 2004. O manuscrito
intitulado “Lizard species richness and diversity are determined by habitat characteristics at a
microgeographic scale: implications for conservation in the Brazilian Cerrado”, de autoria de
Laurie J. Vitt, Guarino Rinaldi Colli, Janalee P. Caldwell, Daniel Oliveira Mesquita, Adrian
Antônio Garda e Frederico Gustavo Rodrigues França, está anexado no Apêndice 4.

18
DISCUSSÃO
A hipótese de “liberação ecológica” prediz que em ilhas, onde a diversidade de espécies é
menor, as espécies devem ser mais generalistas (maior largura de nicho) que em áreas
continentais, onde a diversidade é maior (Crowell, 1962; Ricklefs e Miller, 1999; Pianka, 1994).
Esta hipótese decorre da teoria da competição. Em locais com reduzida competição
interespecífica, as espécies devem expandir seu nicho (microhábitat, dieta e morfologia) em
resposta ao reduzido número de competidores (Crowell, 1962; Losos e Queiroz, 1997). A
hipótese de “liberação ecológica” foi inicialmente desenvolvida em comparações entre
continente e ilhas. O modelo “áreas não isoladas do Cerrado vs. áreas isoladas e Savanas
Amazônicas” foi utilizado para testar a hipótese. As predições foram que, se a “liberação
ecológica” ocorre, a largura de nicho (dieta e microhábitat) e aspectos da morfologia dos lagartos
das ilhas deveriam ser maiores que nas áreas contínuas do Cerrado. Não foram encontradas
diferenças na largura de nicho de microhábitat das espécies entre os enclaves e o Cerrado.
Entretanto, baseando-se na dieta (estômagos individuais) das espécies, os resultados
parcialmente suportam a hipótese, sendo que a teoria de “liberação ecológica” parece ser
aplicável para Tropidurus, mas não para Ameiva ameiva, Anolis, Cnemidophorus, e
Micrablepharus.
A compensação da densidade é um fenômeno usualmente definido como um aumento na
densidade das espécies de ilhas em resposta ao reduzido número de espécies, quando
comparados com as populações de áreas continentais (MacArthur et al., 1972; Pianka, 1994;
Ricklefs e Miller, 1999). A hipótese da compensação da densidade também é derivada da teoria
da competição e a maioria das explicações parte da premissa de que em taxocenoses mais

19
simples (ilhas) os recursos são mais abundantes, resultando em reduzida competição quando
comparado com áreas continentais, permitindo que as espécies ocorram em altas densidades
(Crowell, 1962; MacArthur et al., 1972). Os dados não suportaram esta hipótese. As espécies não
são mais abundantes nas áreas isoladas que nas áreas não isoladas.
Os fatores ecológicos (e.g., competição e predação) têm sido considerados como os mais
importantes fatores afetando as relações entre as espécies nas taxocenoses (Wiens, 1977;
Diamond, 1978; Wilbur, 1972; Dunham, 1983). Mais recentemente, a história tem sido
identificada como um fator que muito contribui para a estrutura das taxocenoses e, se ignorada,
conclusões completamente equivocadas podem ser adotadas (Losos, 1994; Losos, 1996; Brooks
e McLennan, 1991; Cadle e Greene, 1993). Embora exita dúvida que a competição e predação
influenciam a estrutura das taxocenoses (Losos et al., 1993; Spiller e Schoener, 1989; Case e
Bolger, 1991), a origem das diferenças ecológicas parece ter raízes muito antigas na história
evolutiva das espécies (Losos, 1996; Losos, 1995; Vitt et al., 2003; Vitt et al., 1999; Webb et al.,
2002). A hipótese de “liberação ecológica” prediz que os fatores ecológicos devam ser mais
importantes que os históricos na determinação da estrutura das taxocenoses, e isso seria
perceptível com o aumento da densidade nas áreas isoladas juntamente com expansão de nicho.
Entretanto, as espécies têm a ecologia bastante conservativa, e isso é refletido na pouca variação
de largura de nicho, morfologia e abundância entre as populações (ver Mesquita e Colli, 2003;
Vitt e Colli, 1994; Vitt et al., 1998), enfatizando a importância da história evolutiva das espécies
na estrutura das taxocenoses. As pressões ambientais parecem promover respostas diferenciadas
entre táxons diferentes. Os resultados indicaram que Ameiva ameiva, Cnemidophorus (Teiidae),
Anolis (Polychrotidae) e Micrablepharus (Gymnophthalmidae) apresentam aspectos da dieta
mais conservados, e lagartos do gênero Tropidurus (Tropiduridae) são mais afetados pelos

20
fatores ecológicos, corroborando resultados prévios (ver Vitt et al., 1997a; Vitt, 1993; Vitt et al.,
1997b; Mesquita e Colli, 2003). A ecologia e abundância das espécies são bastante
conservativas, variando pouco de taxocenose para taxocenose, evidenciando a importância da
história das espécies. Entretanto, diferenças na dieta em tropidurídeos sugerem que os fatores
ecológicos também são importantes para a manutenção da estrutura das taxocensoses.
A influência da história também fica evidenciada quando são feitas comparações em uma
única taxocenose. Uma análise detalhada nos dados ecológicos com uma perspectiva histórica
sugere que os lagartos da região do Jalapão são fortemente influenciados pela história
filogenética. Se a interação entre as espécies determina os aspectos ecológicos dos lagartos do
Jalapão, esses traços deveriam estar mapeados aleatoriamente na filogenia das espécies e este
não é o caso. Mesmo com os resultados contraditórios da ordenação filogenética canônica (ver
capítulo 2), foram demonstradas inúmeras evidências de que a história das espécies desempenha
um importante papel nas estrutura das taxocenoses. Além disso, a aplicação de métodos
filogenéticos para interpretação de relações entre espécies em uma taxocenose ainda são
incipientes (e.g.,Webb et al., 2002). Ainda, os resultados encontrados na análise da taxocenose
de Savana Amazônica de Monte Alegre, PA, corroboram estes resultados. Finalmente, várias
análises em nível local (e.g., Vitt e Zani, 1996; Vitt e Zani, 1998b; Vitt et al., 2000; Giannini,
2003) e uma em nível global (Vitt et al., 2003) indicaram que várias porções da estrutura de
taxocenoses de lagartos têm base histórica.
Levando-se em conta outro aspecto da estrutura das taxocenoses, os resultados
apresentam uma ampla implicação para a biologia da conservação em geral, mais
especificamente para a conservação e manejo do Cerrado. Primeiro, como qualquer ser vivo, os
lagartos são importantes componentes dos ecossistemas naturais. Segundo, eles são excelentes
21
modelos para se examinar os padrões de ocorrência e abundância relativa em escalas
microgeográficas, porque eles são facilmente coletados, identificados e monitorados. Finalmente,
como mostrado aqui (Capítulo 4), muitas espécies dependem de aspectos específicos da
vegetação e do hábitat onde vivem. A habilidade de se identificar as características do
microhábitat, essencial para a presença de várias espécies, nos providencia informações
necessárias para desenvolver estratégias para conservação e manejo dos ecossistemas. Neste
exemplo, a remoção de árvores, folhiço, trocos caídos, e cupinzeiros pode ter um impacto
imediato na diversidade de lagartos e na estrutura das taxocenoses. Como mostrado aqui, as
espécies animais não estão distribuídas uniformemente no Cerrado, sendo que variações
microgeográficas na estrutura do microhábitat afetam a composição e a abundância relativa das
espécies. Consequentemente, as taxocenoses são fortemente afetadas pela modificação do
hábitat, mesmo aquelas controladas pelas agências de proteção ambiental, como o corte seletivo
de madeira e subseqüente replantio.
REFERÊNCIAS BIBLIOGRÁFICAS
AB'SÁBER, A. N. 1982. The paleoclimate and paleoecology of Brazilian Amazonia, p. 41-59. In:
Biological Diversification in the Tropics. G. T. Prance (ed.). Columbia University Press,
New York.
ARAÚJO, A. F. B. 1991. Structure of a white sand-dune lizard community of coastal Brazil.
Revta. Brasil. Biol. 51:857-865.
—. 1992. Estrutura morfométrica de comunidades de lagartos de áreas abertas do litoral sudeste
e Brasil central, p. 191. Universidade de Campinas, Campinas.

22
ÁVILA-PIRES, T. C. S. 1995. Lizards of Brazilian Amazonia (Reptilia: Squamata). Zoologische
Verhandelingen, Leiden. 1995:3-706.
BIGARELLA, J. J., e D. ANDRADE-LIMA. 1982. Paleoenvironmental changes in Brazil, p. 27-40.
In: Biological Diversification in the Tropics. G. T. Prance (ed.). Columbia University
Press, New York.
BOURNE, G. R., A. C. COLLINS, A. M. HOLDER, e C. L. MCCARTHY. 2001. Vocal communication
and reproductive behavior of the frog Colostethus beebei in Guyana. J. Herpetol. 35:272-
281.
BROOKS, D. R., e D. A. MCLENNAN. 1991. Phylogeny, Ecology, and Behavior, a Research
Program in Comparative Biology. The University of Chicago Press, Chicago.
BROOKS, D. R., e D. A. MCLENNAN. 1993. Historical ecology: examining phylogenetic
components of community evolution, p. 267-280. In: Species Diversity in Ecological
Communities, Historical and Geographical Perspectives. R. E. Ricklefs e D. Schluter
(eds.). The University of Chicago Press, Chicago, Illinois.
CADLE, J. E., e H. W. GREENE. 1993. Phylogenetic patterns, biogeography, and the ecological
structure of Neotropical snake assemblages, p. 281-293. In: Species Diversity in
Ecological Communities: Historical and Geographical Perspectives. R. E. Ricklefs e D.
Schluter (eds.). University of Chicago Press, Chicagi.
CASE, T. J., e D. T. BOLGER. 1991. The role of interspecific competition in the biogeography of
island lizards. TREE. 6:135-139.
COLLI, G. R. 1996. Amazonian savanna lizards and the historical biogeography of Amazonia, p.
137. University of California, Los Angeles.

23
CONNOR, E. F., A. C. COURTNEY, e J. M. YODER. 2000. Individuals-area relationships: the
relationship between animal population density and area. Ecology. 81:734-748.
CROWELL, K. L. 1962. Reduced interspecific competition among the birds of Bermuda. Ecology.
43:75-88.
DIAMOND, J. M. 1978. Niche shifts and the rediscovery of interspecific competition. Am. Sci.
66:322-331.
DUNHAM, A. E. 1983. Realized niche overlap, resource abundance, and interespecific
competition, p. 261-280. In: Lizard Ecology: Studies of a Model Organism. R. B. Huey,
E. R. Pianka, e T. H. Schoener (eds.). Harvard University Press, Cambridge,
Massachusetts.
EDEN, M. J. 1974. Paleoclimatic influences and the development of savanna in Southern
Venezuela. J. Biogeogr. 1:95-109.
EITEN, G. 1972. The Cerrado vegetation of Brazil. Bot. Rev. 38:201-341.
—. 1978. Delimitation of the Cerrado concept. Vegetatio. 36:169-178.
GIANNINI, N. P. 2003. Canonical phylogenetic ordination. Syst. Biol. 52:684-695.
HUBER, O. 1982. Significance of savanna vegetation in the Amazon Territory of Venezuela, p.
221-244. In: Biological Diversification in the Tropics. G. T. Prance (ed.). Columbia
University Press, New York.
LOSOS, J. B. 1994. Historical contingency and lizard community ecology, p. 319-333. In: Lizard
Ecology: Historical and Experimental Perspectives. L. J. Vitt e E. R. Pianka (eds.).
Princeton University Press, Princeton, New Jersey.
—. 1995. Community evolution in greater antillean Anolis lizards: phylogenetic patterns and
experimental tests. Phil. Trans. R. Soc. London B. 349:69-75.

24
—. 1996. Phylogenetic perspectives on community ecology. Ecology. 77:1344-1354.
LOSOS, J. B., J. C. MARKS, e T. W. SCHOENER. 1993. Habitat use and ecological interactions of an
introduced and a native species of Anolis lizard on Grand Cayman, with a review of the
outcomes of anole introductions. Oecologia. 95:525-532.
LOSOS, J. B., e K. QUEIROZ. 1997. Evolutionary consequences of ecological relaease in
Caribbean Anolis lizards. Biol. J. Linn. Soc. 61:459-483.
MACARTHUR, R. H., J. M. DIAMOND, e J. R. KARR. 1972. Density compensation in island faunas.
Ecology. 53:330-342.
MESQUITA, D. O., e G. R. COLLI. 2003. Geographical variation in the ecology of populations of
some Brazilian species of Cnemidophorus (Squamata, Teiidae). Copeia. 2003:285-298.
PIANKA, E. R. 1973. The structure of lizard communities. Annu. Rev. Ecol. Syst. 4:53-74.
—. 1994. Evolutionary Ecology. HarperCollins College Publishers, New York, NY.
PIRES, J. M. 1973. Tipos de vegetação da Amazônia. Publ. Av. Mus. Par. Em. Goel. 20:179-202.
PRANCE, G. T. 1978. The origin and evolution of the Amazon flora. Interciencia. 3:207-222.
RICKLEFS, R. E., e G. L. MILLER. 1999. Ecology. Freeman, W H and Company, New York, NY.
RODDA, G. H., e K. DEAN-BRADLEY. 2002. Excess density compensation of island herpetofaunal
assemblages. J. Biogeogr. 29:623-632.
SIMPSON, E. H. 1949. Measurement of diversity. Nature. 163:688.
SPILLER, D. A., e T. W. SCHOENER. 1989. Effect of a major predator on grouping of an orb-
weaving spider. J. An. Eco. 58:509-523.
TER BRAAK, C. J. F. 1986. Canonical correspondence analysis: a new eigenvector technique for
multivariate direct gradient analysis. Ecology. 76:1167–1179.
VITT, L. J. 1991. An introduction to the ecology of Cerrado lizards. J. Herpetol. 25:79-90.

25
—. 1993. Ecology of isolated open-formation Tropidurus (Reptilia: Tropiduridae) in Amazonian
lowland rain forest. Can. J. Zool. 71:2370-2390.
—. 1995. The ecology of tropical lizards in the Caatinga of northeast Brazil. Occ. Pap.
Oklahoma Mus. Nat. Hist. 1:1-29.
VITT, L. J., J. P. CALDWELL, P. A. ZANI, e T. A. TITUS. 1997a. The role of habitat shift in the
evolution of lizard morphology: evidence from tropical Tropidurus. Proceedings of the
National Academy of Sciences of the United States of America. 94:3828-3832.
VITT, L. J., e C. M. CARVALHO. 1995. Niche partitioning in a tropical wet season: lizards in the
Lavrado area of Northern Brazil. Copeia. 1995:305-329.
VITT, L. J., e G. R. COLLI. 1994. Geographical ecology of a neotropical lizard: Ameiva ameiva
(Teiidae) in Brazil. Can. J. Zool. 72:1986-2008.
VITT, L. J., E. R. PIANKA, W. E. COOPER, JR., e K. SCHWENK. 2003. History and the global
ecology of squamate reptiles. Am. Nat. 162:44-60.
VITT, L. J., S. S. SARTORIUS, T. C. S. ÁVILA-PIRES, M. C. ESPÓSITO, e D. B. MILES. 2000. Niche
segregation among sympatric Amazonian teiid lizards. Oecologia. 122:410-420.
VITT, L. J., e L. D. VANGILDER. 1983. Ecology of a snake community in northeastern Brazil.
Amphibia-Reptilia. 4:273-296.
VITT, L. J., e P. A. ZANI. 1996. Organization of a taxonomically diverse lizard assemblage in
Amazonian Ecuador. Can. J. Zool. 74:1313-1335.
—. 1998a. Ecological relationships among sympatric lizards in a transitional forest in the
Northern Amazon of Brazil. J. Trop. Ecol. 14:63-86.
—. 1998b. Prey use among sympatric lizard species in lowland rain forest of Nicaragua. J. Trop.
Ecol. 14:537-559.

26
VITT, L. J., P. A. ZANI, T. C. S. ÁVILA-PIRES, e M. C. ESPOSITO. 1998. Geographical ecology of
the gymnophthalmid lizard Neusticurus ecpleopus in the Amazon rainforest. Can. J. Zool.
76:1671-1680.
VITT, L. J., P. A. ZANI, J. P. CALDWELL, M. C. D. ARAUJO, e W. E. MAGNUSSON. 1997b. Ecology
of whiptail lizards (Cnemidophorus) in the Amazon region of Brazil. Copeia. 1997:745-
757.
VITT, L. J., P. A. ZANI, e M. C. ESPOSITO. 1999. Historical ecology of Amazonian lizards:
implications for community ecology. Oikos. 87:286-294.
WEBB, C. O., D. D. ACKERLEY, M. A. MCPEEK, e M. J. DONOGHUE. 2002. Phylogenies and
community ecology. Annu. Rev. Ecol. Syst. 33:475-505.
WIENS, J. A. 1977. On competition and variable environments. Am. Sci. 65:590-597.
WILBUR, H. M. 1972. Competition, predation, and the structure of the Ambystoma-Rana sylvatica
community. Ecology. 53:3-21.
27
APÊNDICE 1- manuscrito submetido para a publicação na revista OIKOS em fevereiro de 2005.
Ecological release in lizard assemblages of Neotropical savannas
Daniel Oliveira Mesquita1, Guarino Rinaldi Colli1 and Laurie J. Vitt2
1Departamento de Zoologia, Instituto de Ciências Biológicas, Universidade de Brasília, 70910-
900 Brasília - DF, Brazil, Tel/fax: 55-61-307-2265 ext: 21, email: [email protected]
2Sam Noble Oklahoma Museum of Natural History and Zoology Department, University of
Oklahoma, Norman, OK 73072 USA
28
We compare lizard assemblages of Cerrado and Amazon savannas testing the ecological
release hypothesis, accounting for historical factors. The ecological release hypothesis predicts
that niche dimensions and abundance should be greater in species from Amazon savannas and
isolated Cerrado patches when compared with non isolated areas in central Cerrado. We
calculated microhabitat and diet niche breadths with data from six central Cerrado populations
and 14 from isolated Cerrado patches and Amazon savanna areas. Morphological data were
compared using average Euclidean distances and lizard abundance was estimated using the
number of lizards captured in pitfall traps over an extended time period. We found no evidence
of ecological release with respect to microhabitat use, suggesting that historical factors are more
important than ecological factors. However, data from individual stomachs indicate that
ecological release occurs in these areas for Tropidurus but not for Ameiva ameiva, Anolis,
Cnemidophorus, and Micrablepharus. These results suggest that different lineages respond
differently to environmental pressures, with tropidurids being more affected by ecological factors
than polychrotids, teiids, and gymnophthalmids. We found no evidence that ecological release
occurs in these areas using morphological data. Based on abundance data, our results indicate
that the ecological release (density compensation) hypothesis is not supported: lizard species are
not more abundant in isolated areas than in non isolated areas. The ecology of species is highly
conservative, varying little from assemblage to assemblage. Nevertheless, increases in niche
breadth for some species indicate that ecological release occurs as well.
29
Introduction
Communities are usually defined as associations among populations that coexist in an
easily defined place. Most community studies focus on assemblages, groups of phylogenetically
related species that coexist in a specific geographic area (Ricklefs and Miller 1999). Primary
determinants of assemblage structure are species interactions, resource use patterns, and
historical relationships among taxa comprising the assemblage (Begon, et al. 1990, Pianka 1994,
Ricklefs and Miller 1999). Historically, ecological factors have received the most attention from
ecologists who argued that competition and predation were the main causes of assemblage
organization (Wiens 1977, Mitchell 1979, Dunham 1983). More recently, historical factors have
received special attention (Losos 1994, 1996, Vitt, et al. 1999, Webb, et al. 2002). Evidence of
historical factors includes lack of divergence in ecological traits (e. g., microhabitat use, diet)
among closely related species independent of the assemblage in which they reside. Divergence in
ecological traits among closely related species is viewed as evidence of the importance of
ecological factors (Brooks and McLennan 1991, Losos 1996). Clearly, both historical and
ecological factors contribute to structure in present-day animal assemblages (Brooks and
McLennan 1991, Cadle and Greene 1993, Losos 1994, 1996, Vitt 1995).
Islands generally contain fewer species compared with continental areas, but often,
species are more abundant on islands. This phenomenon was described initially for bird
assemblages and called “density compensation” (Crowell 1962, Pianka 1994, Ricklefs and Miller
1999). In addition, island species often expand their habitat niche breadth in response to a lower
number of competitors, occupying habitats that are occupied by other species in continental
areas, a phenomenon known as “niche expansion” (MacArthur, et al. 1972, Pianka 1994,
30
Ricklefs and Miller 1999). In combination, both processes (density compensation and niche
expansion) are referred to as “ecological release” (Pianka 1994, Ricklefs and Miller 1999).
Ecological release has been documented for amphibian and reptile assemblages. Rodda and
Dean-Bradley (2002) found strong evidence that amphibians and reptiles (mainly lizards) have
higher biomass and density in small islands than in continental areas. Conversely, a study
correlating island size with density of animal populations suggested that density compensation
might be less common than previously thought (Connor, et al. 2000). A study on Anolis lizards
in the Antilles tested the hypothesis that lizards from small islands (few species) should exhibit a
generalized morphology and greater microhabitat niche breadth compared with lizards from
large islands (more species). However, results did not confirm these predictions. Lizards on
small islands did not have a generalized morphology and did not have greater microhabitat niche
breadth (Losos and Queiroz 1997).
We set out to test the ecological release hypothesis using lizard assemblages from the
Cerrados of Brazil. Cerrado lizard assemblages are ideal for testing this hypothesis because the
Cerrado contains a vast core area (the “mainland”) and numerous variously sized enclaves
(“islands”) embedded in Amazon rainforest.
We compare lizard assemblages of Cerrado and Amazon enclaves testing the ecological
release hypothesis, considering both ecological and historical factors. Based on the ecological
release hypothesis, we predict that niche dimensions (e. g., microhabitat, diet and morphology)
should be greater and abundance should be higher in species of Amazon isolated enclaves when
compared with species in non isolated areas in the central Cerrado.

31
Materials and methods
Study sites
The Cerrado covers about 2,000,000 km2, about 25% of Brazil and is located in the
central region of Brazil, with some isolated patches in northern Brazil (Oliveira and Marquis
2002). The region receives annually 1,500-2,000 mm of highly predictable and strongly seasonal
precipitation, from October to April. Monthly temperatures average 20 to 22 C (Nimer 1989).
The Cerrado biome harbors forests, where arboreal species predominate; savannas, with trees
and shrubs dispersed in an herbaceous stratum; and grasslands, with herbaceous species and
some shrubs. Tree trunks are tortuous, with thick corky barks and hard, coriaceous leaves
(Ribeiro and Walter 1998). We sampled several isolated and non isolated Cerrado areas. Among
the non isolated areas, we sampled in a gradient of sandy Cerrado and rocky field in Alvorada do
Norte, Goias State (14º 36’ S, 46º 24’ W) in August 2003 and March 2004, Dianópolis,
Tocantins State (11º 42’ S, 46º 48’ W) in September 2003, Mateiros, Tocantins State (10º 11’ S,
46º 40’ W) in February 2002, Paranã, Tocantins State (12º 54’ S, 47º 42’) in September 2003 and
April 2004; in a dry forest in São Domingos, Goias State (13º 24’ S, 46º 19’ W) in August and
December 2003; and in a latosoil Cerrado in Paracatu, Minas Gerais State (17º 24’ S, 47º 18’ W)
in October-December 2001. Among the isolated Cerrado areas, we sampled in a gradient of
sandy Cerrado and rocky field in Serra do Cachimbo, Novo Progresso, Pará State (8º 42’ N, 55º
20’ W) in July 2002, in two different habitats in Guajará-Mirim, Rondônia State (10º 48’ S, 65º
22’ W), a rocky field and a sandy Cerrado, in December 2000-January 2001, in two diferrent
areas in Vilhena, Rondônia State (12º 43’ S, 60º 07’ W), a sandy Cerrado and a latosoil Cerrado,
in in August 1998 and September–October 1999, and in three different areas in Pimenta Bueno,
32
Rondônia State (12º 30’ S, 60º 49’ W), a latosoil Cerrado, a transitional forest, and a sandy
Cerrado, in July-August 2000.
Amazon savannas occur like scattered islands inside the Amazon Forest and cover about
150,000 km2, or 2% of Brazil (Pires 1973). The precipitation is highly seasonal and annual
precipitation averages 1,700 mm (Eidt 1968). Vegetation is dominated by typical species of the
Cerrado, but diversity is usually lower (Eiten 1978). Among the Amazon savannas, we sampled
in two different areas with sandy soils, in Macapá (0º 02’ N, 51º 03’ W) and Tartarugalzinho (1º
26’ N, 1º 04’ W), in Amapá State, in September-October 1991, which we considered as a single
assemblage because of the similarity in vegetation structure and composition of the lizard fauna,
a rocky field in Serra dos Carajás, Paraupebas, Pará State (6º 10’ N, 51º 20’ W) in July-August
1992, a latosoil area in Humaitá, Amazonas State (7º 31’ S, 63º 02’ W), in October-November
1991 and June-July 2003, in a sandy soil area in in Alter do Chão, Pará State (7º 40’ S, 39º 12’
W), in August 1992, in a gradient of sandy soils and rocky fields in Monte Alegre, Pará State (2º
6’ S, 54º 20’ W), in December 2002, and in sandy soil area in Boa Vista, Roraima State (2º 49’
N, 60º 40’ W), in September 1992. The separation between Amazonian savannas and isolated
Cerrado areas was proposed by Eiten (1978), and is based mainly on plant species similarities.
Usually, the Amazonian savannas are poorest when compared with all kind of Cerrado areas
(isolated and noon isolated) (Eiten 1972, 1978). Here, we are considering all enclaves as islands,
to test the ecological release hypothesis.
All specimens examined are deposited in the Coleção Herpetológica da Universidade de
Brasília (CHUNB). Collecting sites are indicated in Fig. 1.
33
Species composition and microhabitat
We captured lizards with drift fences, by hand, or using a shotgun. In the lab, we
humanely killed live lizards with an injection of Tiopental® and fixed them with 10% formalin.
We recorded microhabitat for each lizard collected. We used the following microhabitat
categories: clear ground, grass, hole, inside termite nest, leaf, leaf litter, log, rock, shrub, stick,
tree trunk, under leaf, under leaf litter, under log, under manure, under rock, tree bark, under tree
bark, and wall. We computed microhabitat niche breadths (B) using the inverse of Simpson's
(1949) diversity index:
B =1
pi2
i =1
n
∑,
where p is the proportion of microhabitat category i and n is the number of categories.
We made comparisons among assemblages using differences among isolated and non isolated
areas as a model to test the ecological release hypothesis. We compared average microhabitat
niche breadth of species among assemblages. If ecological release occurs in isolated areas, we
expect average niche breadth to be higher than in non isolated areas
Diet composition
We analyzed stomach contents under a stereoscopic microscope, identifying prey items to
ordinal level. We recorded length and width (0.01 mm) of intact items with Mitutoyo® electronic
calipers, and estimated prey volume (V) as an ellipsoid:
V =43
πw2
⎛ ⎝
⎞ ⎠
2 l2
⎛ ⎝
⎞ ⎠ ,

34
where w is prey width and l is prey length. We calculated numeric and volumetric percentages of
each prey category for pooled and individual stomachs. From these percentages, we computed
niche breadths (B) for pooled and individual stomachs, using the inverse of Simpson's diversity
index (Simpson 1949), as described above. We excluded from the volumetric analyses prey
items that were too fragmented to allow a reliable estimation of their volumes. Average niche
breadths of all species from each assemblage were compared between isolated and non isolated
areas, as a test of the ecological release hypothesis. We also made comparisons with just closely
related species, to minimize the effect of history. Because analyses with pooled stomachs
provided only a single diet niche breadth value for each species, we made comparisons among
closely related species of different assemblages with data generated for individual stomach
means. We used averages of numeric and volumetric niche breadths for both individual and
pooled stomachs. This balances the cost of acquiring prey (energy expended capturing each prey
item) with energy gains associated with individual prey types. Throughout the text, this average
is referred as diet niche breadth.
Morphometry
Using Mitutoyo® electronic calipers, we recorded morphometric variables to the nearest
0.01 mm, including: snout-vent length (SVL), body width (at its broadest point), body height (at
its highest point), head width (at its broadest point), head height (at its highest point), head length
(from the tip of the snout to the commissure of the mouth), hindlimb length, forelimb length, and
tail length (from the cloaca to the tip of the tail). To maximize the availability of data, we
estimated intact tail length of lizards with broken or regenerated tails using a regression equation
35
relating tail length to SVL, calculated from lizards with intact tails, separately for populations
and species. When the regression was not statistically significant, we used the average of intact
tails. We log-transformed (base 10) all morphometric variables prior to analyses to meet
requirements of normality (Zar 1998).
To compare the assemblages using morphometry, we calculated a matrix of Euclidean
distance among all pairs of species at each locality using the following formula:
( )2
19
1
2⎥⎦
⎤⎢⎣
⎡−= ∑
=kjkikij XXD ,
where Dij is the Euclidean distance between species i and j, and Xik and Xjk are averages of log-
transformed morphometric variables k for species i and j. From the matrix of distances for each
assemblage, we calculated the average neighbor distance and compared them between isolated
and versus isolated areas. Based on the ecological release hypothesis, we expected average
neighbor distance to be greater in isolated than in non isolated areas.
Abundance
We used pitfall traps with drift fences to estimate abundance of lizards. Each trap consists
of four buckets, with one in the center and the others in the extremities, connected with plastic, at
angles of 120° from each other. In most areas, 100 buckets were used in each sampled area.
When more than 100 buckets were used in an area, we corrected abundance data by dividing the
original data by one plus the additional proportion of buckets.
Our density estimates consisted of the average number of lizards per species per day
collected in the buckets. We compared abundances among assemblages, ignoring species. We
36
then used data from the four most widely distributed genera (Ameiva, Cnemidophorus, Anolis,
and Micrablepharus) to make comparisons among sampled areas. Next, we performed
regressions, on a species by species basis, to determine the relationship between lizard
abundance and number of species in the assemblages. The ecological release hypothesis predicts
that in isolated areas, where diversity is lower, species should occur at higher densities (density
compensation).We expect that, if ecological release occurs in these areas, species in isolated
areas should be more abundant than in non isolated areas, having expanded their niches to
include microhabitats used by lizard species that are missing.
Statistical analysis
We carried out statistical analyses using SYSTAT 11.0 and SAS 8.1 for Windows, with a
significance level of 5% to reject null hypotheses. Throughout the text, means appear ± 1 SD.
Results
Species composition and microhabitat
We collected 51 lizard species in the 20 study sites (Appendix 1). Lizards in non isolated
areas were significantly richer than isolated areas (Table 1). Isolated areas richness varied from
11 species in Vilhena to two species in the rock field at Guajará-Mirim (Appendix 1). Among
non isolated areas, richness was greatest in dry forest at São Domingos and in latosoil cerrado in
Paracatu-MG, with 16 lizard species. The lowest richness was in the gradient of sandy cerrado
and rocky field in Alvorada do Norte, with eight species (Appendix 1). The most diverse lizard
37
clade was Teiidae, with 11 open vegetational species and three typical forest species, followed
by Gymnophthalmidae (8/4), Tropiduridae (7/0), Gekkonidae (6/1), Polychrotidae (5/1), and
Scincidae (5/0) (Appendix 1).
Microhabitat niche breadths were generally low, ranging from 1.00, in several species to
5.04 in Gymnodactylus geckoides from São Domingos (Appendix 2). Average niche breadth
among species in each assemblage varied from 1.32 in the sand Cerrado in Jalapão to 2.74 in the
rock field of Guajará-Mirim-RO (Appendix 2). No differences were detected in average niche
breadths between isolated vs. non isolated areas (Table 1). Further, there was no significant
association between average niche breadth and number of species in each assemblage (R = 0.311,
F1,11 = 0.178, P = 0.301) (Fig. 2). To minimize historical effects, we conducted separate analyses
on populations of closely related species of the four most widely widespread genera (Ameiva,
Cnemidophorus, Anolis and Tropidurus). No differences were detected in average microhabitat
niche breadths of isolated vs. non isolated areas considering only these four genera (Table 1).
Likewise, there was no significant relationship between microhabitat niche breadths and number
of species in each assemblage for these genera, except for Ameiva ameiva (Fig. 2). Even if the
results for Ameiva are significant, the comparisons between average microhabitat niche breadths
of isolated vs. non isolated are not, leading us to believe that ecological release does not occur,
considering this species. These results indicate that ecological release in microhabitat use does
not occur in the studied assemblages.

38
Diet composition
We analyzed the contents of 3,583 lizard stomachs and recognized 38 prey categories.
Based on pooled stomachs, Mabuya nigropunctata from the transitional forest in Pimenta
Bueno-RO and Kentropyx paulensis from the latosoil Cerrado in Paracatu had the smallest diet
niche breadth and Kentropyx striata from Roraima had the greatest niche breadth (Appendix 3).
Based on individual stomachs, the smallest diet niche breadth was observed in Mabuya
nigropunctata from the transitional forest in Pimenta Bueno-RO and in Kentropyx paulensis
from the latosoil Cerrado in Paracatu-MG; and the greatest niche breadth was observed in
Ameiva ameiva from the sandy Cerrado in Vilhena-RO (Appendix 3).
Based on pooled stomachs, there was no difference in average niche breadths between
isolated vs. non isolated areas (Table 1) and the relationship between dietary niche breadths and
number of species in the assemblage was not significant (Fig. 3). Considering only the five most
widespread genera (Ameiva, Cnemidophorus, Micrablepharus, Anolis and Tropidurus), there
was no evidence of ecological release (Table 2), and there was no relationship between diet niche
breadths and number of species of each assemblage for these five genera (Fig. 3).These results
indicate that, based on pooled stomachs, ecological release do not occur in these areas.
Based on individual stomachs niche breadths was higher in isolated relative to non
isolated areas (Table 1), and there was also a significant relationship between dietary niche
breadths and number of species in the assemblage (R = 0.471, F1,18 = 5.128, P = 0.036) (Fig. 4).
Considering the five most widely widespread genera (Ameiva, Cnemidophorus, Micrablepharus,
Anolis and Tropidurus), we did not find statistical differences in diet niche breadths on isolated
vs. non isolated areas, except for Tropidurus (Table 2). Linear regression analyses failed to
detected significant relationship between diet niche breadths and number of species of each

39
assemblage for these four genera (Fig. 4). These results indicate that, based on individual
stomachs of all species, ecological release should occur, and that among the four most widely
widespread genera, it occurs only in Tropidurus.
Morphometry
We found significant differences in average nearest neighbor Euclidean distance among
populations (ANOVA F19,640 = 6.877, P < 0.0001). The smallest average distance was in in the
rock field assemblage at Guajará Mirim ( x = 0.66 ± 0.00) and the sandy Cerrado in Amapá ( x =
0.66 ± 0.29). The largest was in the lizard assemblage in transitional forest in Pimenta Bueno ( x
= 1.95 ± 1.15). We found no significant differences in average nearest neighbor Euclidean
distance of lizard assemblages between isolated and non isolated areas (Table 1), and no
significant relationship between nearest neighbor Euclidean distance and number of species in
each assemblage (R = 0.169, F1,18 = 0.526, P = 0.447) (Fig. 5). These results indicate that
ecological release does not occur in these areas.
Abundance
Based on all assemblages combined, the rarest lizard species were Enyalius cf bilineatus,
Kentropyx paulensis, and Bachia cacerensis, and the most abundant species were
Cnemidophorus cf ocellifer, Tropidurus cf oreadicus, and Ameiva ameiva. Based on each
assemblage, the rarest lizards were Enyalius cf bilineatus and Kentropyx paulensis, from
Paracatu-MG, and Bachia cacerensis, from the sandy Cerrado in Vilhena, and the most abundant

40
lizards were Cnemidophorus cryptus, from Monte Alegre, and Cnemidophorus cf ocellifer, from
Paranã (Appendix 4). The assemblage with lowest lizard abundance was Humaitá-AM, and those
with the highest abundances were Paranã and Monte Alegre. Based on abundance relative to
number of species in each assemblage, lizards were less abundant in Paracatu and Humaitá and
more abundant in Alvorada do Norte, the sandy cerrado in Pimenta Bueno, Dianópolis, Paranã,
and Monte Alegre (Appendix 4).
There was no significant difference in lizard abundance between isolated and non isolated
areas (Table 1). Because richer assemblages have higher probabilities than poorer assemblages to
exhibit higher lizard abundances, we repeated the analyses with number of species in each
assemblage as a covariate. Likewise, we did not find a significant difference in abundance of
lizards between isolated and non isolated areas (ANCOVA F1,9 = 0.312, P = 0.590).
To further refine our analyses, we compared the abundances of Ameiva, Anolis,
Cnemidophorus and Micrablepharus, but in no genus there was a significant difference in lizard
abundance between isolated and non isolated habitats (Table 1). A significant negative
correlation existed between number of species in assemblages and abundance of Micrablepharus
(P = 0.039, r = 0.834) (Fig. 6). Our results indicate that the density compensation hypothesis
appears not to be applicable to Cerrado lizard assemblages, with lizard species being equally
abundant in isolated and non isolated areas.

41
Discussion
Species composition and microhabitat
The ecological release hypothesis predicts that on islands, where species diversity is
lower, species should be more generalized (have wider niche breadths) than in continental areas
where diversity is higher (Crowell 1962, Pianka 1994, Ricklefs and Miller 1999). The ecological
release hypothesis is a consequence of competition theory. In places with reduced interspecific
competition, species should expand their use of microhabitats in response to fewer competitors
(Crowell 1962, Losos and Queiroz 1997). The ecological release hypothesis was initially
developed based on island-continent comparisons. We applied the model to non isolated Cerrado
areas (“mainland”) vs. isolated enclaves (“islands”) to test the hypothesis. Our prediction was
that, if ecological release occurs in these areas, microhabitat niche breadths of lizards from
isolated areas should be higher than in non isolated areas. However, our results do not support
these predictions. We found no difference in average microhabitat niche breadth between
isolated vs. non isolated areas both considering all species or the most widespread genera
(Ameiva, Cnemidophorus, Anolis and Tropidurus). Moreover, there was no significant
correlation between microhabitat niche breadth and number of species in assemblages. Our
results showed that ecological release in microhabitat niche breadth did not occur in these areas.
Ecological factors (e. g., competition and predation) have been considered the most
important factors affecting relationships among species in assemblages (Wilbur 1972, Wiens
1977, Diamond 1978, Dunham 1983). More recently, history has been identified as a factor
contributing to community structure and if ignored, erroneous conclusions can result (Brooks
and McLennan 1991, Cadle and Greene 1993, Losos 1994, 1996). Although we have no doubt
42
that competition and predation influence assemblage structure (Spiller and Schoener 1989, Case
and Bolger 1991, Losos, et al. 1993), origins of some ecological differences in assemblages have
their roots deep in the evolutionary history of species (Losos 1995, 1996, Vitt, et al. 1999, 2003,
Webb, et al. 2002). The ecological release hypothesis maintains that ecological factors should be
more important than history in determining assemblage structure, and this should be detectable
as increases in density in isolated areas along with niche expansion. We were unable to support
this. Lizard species are highly conservative in their ecological traits, and this is reflected in low
variation among populations in niche breadth (see Vitt and Colli 1994, Vitt, et al. 1998, Mesquita
and Colli 2003), emphasizing the importance of the evolutionary history of species in
assemblage structure.
Diet composition
Food has been considered a primary niche axis in studies of coexistence of sympatric
species (Pianka 1973, 1986) and the center of attention in studies of species interactions
(Schoener 1968, Dunham 1983, Spiller and Schoener 1994). Considering the ecological release
hypothesis, the low number of species in isolated areas should promote reduced competition and
consequently allow the species to eat a larger spectrum of prey resulting in larger diet niche
breadths (MacArthur, et al. 1972, Pianka 1994, Ricklefs and Miller 1999). Our results partially
support this hypothesis. The results based on pooled stomachs indicate that ecological release
does not occur in these areas. However, based on individual stomachs, the ecological release
hypothesis appears to be applicable for Tropidurus, but not Ameiva ameiva, Anolis,
Cnemidophorus, and Micrablepharus. In the analyses of the pooled stomachs, we used the sum

43
of all items of all individuals of same species in an assemblage. In analyses of individual
stomachs, we have one value of niche breadth per individual, permitting us to calculate the mean
and standart deviation for each individual and posteriorly for all individuals in the assemblage.
Thus we believe that results from individual stomachs are more appropriated for these
comparisons.
Environmental pressures appear to promote differential evolutionary responses among
different taxa. Our results indicate that Ameiva ameiva, Cnemidophorus (Teiidae), Anolis
(Polychrotidae) and Micrablepharus (Gymnophthalmidae) are more conservative in diets.
Comparisons among several populations from different assemblages, with different numbers of
syntopic lizard species and differences in potential competitors and predators, show that diets of
these lizards do not vary considerably. Consequently, historical effects are stronger than
ecological factors (e. g. Brooks and McLennan 1991, Miles and Dunham 1993, Losos 1994,
1996). Apparently, teiids, gymnophthalmids and polychrotids are more conservative in diets than
tropidurids. Teiids occur from Argentina through the United States, gymnophthalmids occur
throughout South America extending north through most of Central America and polychrotids
occur from southeastern United States through Central America and most of South America
(Pough, et al. 1998, Zug, et al. 2001). Despite this wide distribution, ecological traits among
species are conservative (see Pianka 1970, Vitt, et al. 1997, 1998, Mesquita and Colli 2003). For
example, studies on the South American teiids Ameiva ameiva and lizards of genus
Cnemidophorus reveal striking similarities in ecological traits among sites in different biomes
(Vitt and Colli 1994, Mesquita and Colli 2003). Similar results were found for the
gymnophthalmid Neusticurus ecpleopus, which has a wide distribution in Amazon rainforest
(Vitt, et al. 1998) and for Anolis nitens tandai in Amazon forest (Vitt, et al. 2001).
44
On the contrary, tropidurids appear much more variable in their ecological traits. Closely
related tropidurids from several populations in Brazil differ in diets and morphology in response
to use of different microhabitats (Vitt 1981, 1993, Vitt, et al. 1997). Our results suggest that
different lineages show differential responses to environmental pressures; tropidurids were more
affected by ecological factors than teiids, polychrotids and gymnophthalmids, corroborating
previous results (see Vitt 1993, Vitt, et al. 1997a, 1997b, Mesquita and Colli 2003). In addition,
our results suggest that both historical and ecological factors are important for maintenance of
assemblage structure.
Morphometry
The first attempt to use morphological analyses to assess ecological relationships was
described by Hutchinson (1959). Subsequent studies used birds (Schoener 1965, Ricklefs and
Travis 1980), lizards (Ricklefs, et al. 1981, Pianka 1986, Pounds 1988), snakes (Vitt and
Vangilder 1983), and other taxa (Findley 1973, 1976, Gatz Jr. 1979). The advantage of
morphological analyses is that they are easily comparable with other studies (Ricklefs and Miller
1999). Conversely, morphology is relatively fixed and might render it difficult to detect subtle
aspects of ecological variation (Pianka 1994, Ricklefs and Miller 1999). Nevertheless, individual
taxa respond differently to evolutionary pressures (Vitt 1981, Losos, et al. 1993, Losos 1995,
Vitt, et al. 1997). Several recent studies reveal strong associations between morphology and
ecology (Ricklefs, et al. 1981, Vitt 1981, Vitt and Vangilder 1983, Pounds 1988, Losos, et al.
1993, Losos 1994), indicating that morphological analyses are a powerful tool, particularly when
used in conjunction with other data. On islands, rapid morphological evolution resulting from

45
habitat change occurs in Anolis lizards (Pounds 1988, Losos, et al. 1993, Losos 1995), indicating
that under the right circumstances, rapid evolutionary response can occur.
The ecological release hypothesis predicts that in isolated areas, due to habitat expansion
(see Crowell 1962, MacArthur, et al. 1972), morphology of lizards should be more generalized
than in non isolated areas, and this should be reflected as higher average neighbor Euclidean
distance in isolated areas than in non isolated areas. However, in spite of differences in average
neighbor Euclidean distance among assemblages, there were no differences between isolated and
non isolated areas. Morphological data do not support the ecological release hypothesis. These
conclusions are consistent with conclusions based on studied of Anolis lizards on Caribbean
Islands (Losos and Queiroz 1997). Our results suggest that morphology of lizards is very
conservative among assemblages, being little affected by ecological factors, emphasizing the
importance of history of species.
Abundance
Density compensation is a phenomenon usually defined as increased density of island
species in response to a reduction in the number of species compared with mainland populations
(MacArthur, et al. 1972, Pianka 1994, Ricklefs and Miller 1999). This phenomenon was
described initially for birds (Crowell 1962, MacArthur, et al. 1972, Case, et al. 1979), but was
also described for other taxa, like lizards (Case 1975, Wright 1979, Rodda and Dean-Bradley
2002), small mammals (Webb 1965), bats (Stevens and Willig 2000) and invertebrates (Janzen
1973, Dean and Ricklefs 1979, Faeth and Simberloff 1981, Faeth 1984). When density
compensation occurs, abundance of island species can be extremely exaggerated. For example,
46
the tiny leaf litter gecko Sphaerodactylus macrolepis reaches densities greater than 50,000 per
hectare in coccoloba forest in the Virgin Islands, a density substantially higher than that reported
for any mainland lizard (Rodda, et al. 2001).
The density compensation hypothesis is derived from competition theory and most
explanations rest on the premise that, in simple assemblages, resources are more abundant
resulting in less competition when compared with mainland areas, permitting species to occur at
higher densities (Crowell 1962, MacArthur, et al. 1972). Several explanations not based in
competition theory have been provided to explain the occurrence of density compensation in
islands. The increase of animal populations could be related to predation and parasitism, which
may be reduced in islands (Grant 1966, MacArthur, et al. 1972, Case 1975, Rodda and Dean-
Bradley 2002). Gene flow, which is restricted between islands and mainland, could promote high
levels of local adaptations, and consequently higher densities (Emlem 1978, 1979). Climate
tends to be more moderate on islands also, affecting population size by increased survivorship
(Case 1975). Another explanation proposed to explain density compensation is the “fence”
effect. Population density may be higher on islands because isolating mechanisms obstruct
escape of individuals that would otherwise emigrate (Krebs, et al. 1969, MacArthur, et al. 1972,
Emlem 1979).
Our density data do not support the density compensation hypothesis for lizards in the
Cerrado and in Amazon savannas. Species are not more abundant in isolated areas than in non
isolated areas. Until recently, ecological factors have been focused as the most important factors
affecting assemblage structure (Wilbur 1972, Wiens 1977, Diamond 1978). Nowadays, special
attention has been given to history of the species (Brooks and McLennan 1991, Losos 1996,
Webb, et al. 2002). Although we have no doubt that ecological factors exert influence in
47
assemblage structure, most ecological differences appear to be originated long ago in history of
species (Spiller and Schoener 1989, Case and Bolger 1991, Losos, et al. 1993, Losos 1995, Vitt,
et al. 1999, 2003). The density compensation hypothesis maintains that ecological factors should
be more important than history in determining assemblage structure, and this should be
detectable as increases in density in isolated areas. However, lizard abundance was similar in
isolated and non isolated areas, showing that the low number of competitors and predators on
islands (the number of competitors and predators should decrease proportionally with the number
of species) do not promote density compensation, emphasizing the importance of the
evolutionary history of species in assemblage structure.
Our results suggest that both historical and ecological factors are important for the
maintenance of assemblage structure, and that different lineages respond differently to
environmental pressures, with tropidurids being more affected by ecological factors than teiids,
polychrotids and gymnophthalmids. Further, the ecology and abundance of many species in
Neotropical savannas is highly conservative, with little inter-assemblage variation, evidencing
the importance of lineage history. In addition, dietary differences among tropidurids suggest that
ecological factors (e. g. predation and competition) are also important for the maintenance of
assemblage structure.
Acknowledgements - We thank Alison Gainsbury, Adrian Garda, Ayrton Péres Jr., Cristiane
Batista, Daniel Diniz, Frederico França, Gabriel Costa, Gustavo Vieira, Helga Wiederhecker,
Janalee Caldwell, Kátia Colli, Mariana Zatz and S. Balbino for help with the fieldwork. This
work was supported by a doctorate’s fellowship from Coordenação de Aperfeiçoamento de
Pessoal de Nível Superior – CAPES to DOM, a research fellowship from Conselho Nacional de

48
Desenvolvimento Científico e Tecnológico - CNPq to GRC (# 302343/88-1). Programa Nacional
de Diversidade Biológica-PRONABIO (project “Estrutura e dinâmica de isolados naturais e
antrópicos de Cerrado: lições para biologia da conservação”), Fundação o Boticário de Proteção
à Natureza (project “Herpetofauna das savanas amazônicas: subsídios para sua preservação”) and
Conservation International do Brasil (project “Proposta de levantamento da herpetofauna da
micro-região do Jalapão”) funded the research.
References
Begon, M., Harper, J. L. and Townsend, C. R. 1990. Ecology: Individuals, Populations and
Communities. - Blackwell Sci. Publ.
Brooks, D. R. and McLennan, D. A. 1991. Phylogeny, Ecology, and Behavior, a Research
Program in Comparative Biology. – Univ. Chicago Press.
Cadle, J. E. and Greene, H. W. 1993. Phylogenetic patterns, biogeography, and the ecological
structure of Neotropical snake assemblages. - In: Ricklefs, R. E. and Schluter, D. (eds.),
Species Diversity in Ecological Communities: Historical and Geographical Perspectives.
Univ. Chicago Press, pp. 281-293.
Case, T. J. 1975. Species numbers, density compensation, and colonization ability of lizards on
islands in the Gulf of California. - Ecology 56: 3-18.
Case, T. J. and Bolger, D. T. 1991. The role of interspecific competition in the biogeography of
island lizards. - TREE 6: 135-139.
Case, T. J., Gilpin, N. E. and Diamond, J. M. 1979. Overexploitation, interference competition,
and excess density compensation in insular faunas. - Am. Nat. 113: 843-854.

49
Connor, E. F., Courtney, A. C. and Yoder, J. M. 2000. Individuals-area relationships: the
relationship between animal population density and area. - Ecology 81: 734-748.
Crowell, K. L. 1962. Reduced interspecific competition among the birds of Bermuda. - Ecology
43: 75-88.
Dean, J. M. and Ricklefs, R. E. 1979. Do parasites of lepidoptera larvae compete for hosts? No! -
Am. Nat. 113: 302-306.
Diamond, J. M. 1978. Niche shifts and the rediscovery of interspecific competition. - Am. Sci.
66: 322-331.
Dunham, A. E. 1983. Realized niche overlap, resource abundance, and interespecific
competition. - In: Huey, R. B., Pianka, E. R. and Schoener, T. H. (eds.), Lizard Ecology:
Studies of a Model Organism. Harvard Univ. Press, pp. 261-280.
Eidt, R. C. 1968. The climatology of South America. - In: Fitkau, E. J., Illies, J., Klinge, H.,
Schwabe, G. H. and Sioli, H. (eds.), Biogeography and Ecology in South America. Dr.
W. Junk N. V. Publishers, pp. 54-81.
Eiten, G. 1972. The Cerrado vegetation of Brazil. - Bot. Rev. 38: 201-341.
Eiten, G. 1978. Delimitation of the Cerrado concept. - Vegetatio 36: 169-178.
Emlem, J. T. 1978. Density anomalies and regulatory mechanisms in the land bird populations
on the Florida peninsula. - Am. Nat. 112: 265-286.
Emlem, J. T. 1979. Land bird densities on Baja California islands. - Auk 96: 152-167.
Faeth, S. H. 1984. Density compensation in vertebrates and invertebrates: a review and an
experiment. - In: Strong Jr., D. R., Simberloff, D., Abele, L. G. and Thistle, A. B. (eds.),
Ecological Communities: Conceptual Issues and the Evidence. Princeton Univ. Press, pp.
491-509.

50
Faeth, S. H. and Simberloff, D. 1981. Experimental isolation of oak host plants: effects on
mortality, survivorship, and abundances of leaf-mining insects. - Ecology 62: 625-635.
Findley, J. S. 1073. Phenetic packing as a measure of faunal diversity. - Am. Nat. 107: 580-584.
Findley, J. S. 1976. The structure of bat communities. - Am. Nat. 110: 129-139.
Gatz Jr., A. J. 1979. Community organization in fishes as indicated by morphological features. -
Ecology 60: 711-718.
Grant, P. R. 1966. The density of land birds on Tres Marias Islands in Mexico. I. Numbers and
biomass. - Can. J. Zool. 44: 805-815.
Hutchinson, G. H. 1959. Homage to Santa Rosalia or why are there so many kinds of animals? -
Am. Nat. 95: 145-159.
Janzen, D. H. 1973. Sweep samples of tropical foliage insects: effects of seasons, vegetation
types, elevation, time of day, and insularity. - Ecology 54: 687-708.
Krebs, C. J., Keller, B. L. and Tamarin, R. H. 1969. Microtus population biology: demographic
changes in fluctuating populations of M. ochrogaster and M. pennsylvanicus in southern
Indiana. - Ecology 50: 587-607.
Losos, J. B. 1994. Historical contingency and lizard community ecology. - In: Vitt, L. J. and
Pianka, E. R. (eds.), Lizard Ecology: Historical and Experimental Perspectives. Princeton
Univ. Press, pp. 319-333.
Losos, J. B. 1995. Community evolution in greater antillean Anolis lizards: phylogenetic patterns
and experimental tests. - Phil. Trans. R. Soc. London B 349: 69-75.
Losos, J. B. 1996. Phylogenetic perspectives on community ecology. - Ecology 77: 1344-1354.

51
Losos, J. B., Marks, J. C. and Schoener, T. W. 1993. Habitat use and ecological interactions of
an introduced and a native species of Anolis lizard on Grand Cayman, with a review of
the outcomes of anole introductions. - Oecologia 95: 525-532.
Losos, J. B. and Queiroz, K. 1997. Evolutionary consequences of ecological relaease in
Caribbean Anolis lizards. - Biol. J. Linn. Soc. 61: 459-483.
MacArthur, R. H., Diamond, J. M. and Karr, J. R. 1972. Density compensation in island faunas. -
Ecology 53: 330-342.
Mesquita, D. O. and Colli, G. R. 2003. Geographical variation in the ecology of populations of
some Brazilian species of Cnemidophorus (Squamata, Teiidae). - Copeia 2003: 285-298.
Miles, D. B. and Dunham, A. E. 1993. Historical perspectives in ecology and evolutionary
biology: the use of phylogenetic comparative analyses. - Annu. Rev. Ecol. Syst. 24: 587-
619.
Mitchell, J. C. 1979. Ecology of Southeastern Arizona whiptail lizards (Cnemidophorus:
Teiidae): population densities, resource partitioning, and niche overlap. - Can. J. Zool.
57: 1487-1499.
Nimer, E. 1989. Climatologia da região centro-oeste. - In: Climatologia do Brasil. Fundação
Instituto Brasileiro de Geografia e Estatística - IBGE, pp. 393-421.
Oliveira, P. S. and Marquis, R. J. 2002. The Cerrados of Brazil: Ecology and Natural History of a
Neotropical Savanna. - Columbia Univ. Press.
Pianka, E. R. 1970. Comparative autecology of the lizard Cnemidophorus tigris in different parts
of its geographic range. - Ecology 51: 703-720.
Pianka, E. R. 1973. The structure of lizard communities. - Annu. Rev. Ecol. Syst. 4: 53-74.

52
Pianka, E. R. 1986. Ecology and Natural History of Desert Lizards: Analyses of the Ecological
Niche and Community Structure. - Princeton Univ. Press.
Pianka, E. R. 1994. Evolutionary Ecology. - HarperCollins College. Publ.
Pires, J. M. 1973. Tipos de vegetação da Amazônia. - Publ. Av. Mus. Par. Em. Goel. 20: 179-
202.
Pough, F. H., Andrews, R. M., Cadle, J. E., Crump, M. L., Savitzky, A. H. and Wells, K. D.
1998. Herpetology. - Prentice Hall.
Pounds, J. A. 1988. Ecomorphology, locomotion, and microhabitat structure: patterns in a
tropical mainland Anolis community. - Ecol. Monog. 58: 299-320.
Ribeiro, J. F. and Walter, B. M. T. 1998. Fitofisionomias do bioma Cerrado. - In: Sano, S. M.
and Almeida, S. P. (eds.), Cerrado: Ambiente e Flora. EMBRAPA-CPAC, pp. 89-166.
Ricklefs, R. E., Cochran, D. and Pianka, E. R. 1981. A morphological analysis of the structure of
communities of lizards in desert habitats. - Ecology 62: 1474-1483.
Ricklefs, R. E. and Miller, G. L. 1999. Ecology. - Freeman, W H and Company.
Ricklefs, R. E. and Travis, J. 1980. A morphological approach to the study of avian community
organization. - Auk 97: 321-338.
Rodda, G. H., Campbell, E. W. and Fritts, T. H. 2001. A high validity sensus technique for
herpetofaunal assemblages. - Herpetol. Rev. 32: 24-30.
Rodda, G. H. and Dean-Bradley, K. 2002. Excess density compensation of island herpetofaunal
assemblages. - J. Biogeogr. 29: 623-632.
Schoener, T. W. 1965. The evolution of bill size differences among sympatric congeneric species
of birds. - Evolution 19: 189-213.
53
Schoener, T. W. 1968. The Anolis lizards of Bimini: resourse partitioning in a complex fauna. -
Ecology 49: 704-726.
Simpson, E. H. 1949. Measurement of diversity. - Nature 163: 688.
Spiller, D. A. and Schoener, T. W. 1989. Effect of a major predator on grouping of an orb-
weaving spider. - J. An. Eco. 58: 509-523.
Spiller, D. A. and Schoener, T. W. 1994. Effects of top and intermediate predators in a terrestrial
food web. - Ecology 75: 182-196.
Stevens, R. D. and Willig, M. R. 2000. Density compensation in new world bat communities. -
Oikos 89: 367-377.
Vitt, L. J. 1981. Lizard reproduction: habitat specificity and constraints on relative clutch mass. -
Am. Nat. 117: 506-514.
Vitt, L. J. 1993. Ecology of isolated open-formation Tropidurus (Reptilia: Tropiduridae) in
Amazonian lowland rain forest. - Can. J. Zool. 71: 2370-2390.
Vitt, L. J. 1995. The ecology of tropical lizards in the Caatinga of northeast Brazil. - Occ. Pap.
Oklahoma Mus. Nat. Hist. 1: 1-29.
Vitt, L. J., Caldwell, J. P., Zani, P. A. and Titus, T. A. 1997a. The role of habitat shift in the
evolution of lizard morphology: evidence from tropical Tropidurus. - Proc. Natl. Acad.
Sci. 94: 3828-3832.
Vitt, L. J. and Colli, G. R. 1994. Geographical ecology of a neotropical lizard: Ameiva ameiva
(Teiidae) in Brazil. - Can. J. Zool. 72: 1986-2008.
Vitt, L. J., Pianka, E. R., Cooper, W. E., Jr. and Schwenk, K. 2003. History and the global
ecology of squamate reptiles. - Am. Nat. 162: 44-60.
54
Vitt, L. J., Sartorius, S. S., Ávila-Pires, T. C. S. and Esposito, M. C. 2001. Life on the leaf litter:
The ecology of Anolis nitens tandai in the Brazilian Amazon. - Copeia 2001: 401-412.
Vitt, L. J. and Vangilder, L. D. 1983. Ecology of a snake community in northeastern Brazil. -
Amphibia-Reptilia 4: 273-296.
Vitt, L. J., Zani, P. A., Ávila-Pires, T. C. S. and Esposito, M. C. 1998. Geographical ecology of
the gymnophthalmid lizard Neusticurus ecpleopus in the Amazon rainforest. - Can. J.
Zool. 76: 1671-1680.
Vitt, L. J., Zani, P. A., Caldwell, J. P., Araujo, M. C. D. and Magnusson, W. E. 1997b. Ecology
of whiptail lizards (Cnemidophorus) in the Amazon region of Brazil. - Copeia 1997: 745-
757.
Vitt, L. J., Zani, P. A. and Esposito, M. C. 1999. Historical ecology of Amazonian lizards:
implications for community ecology. - Oikos 87: 286-294.
Webb, C. O., Ackerley, D. D., McPeek, M. A. and Donoghue, M. J. 2002. Phylogenies and
community ecology. - Annu. Rev. Ecol. Syst. 33: 475-505.
Webb, W. L. 1965. Small mammal populations on islands. - Ecology 46: 479-488.
Wiens, J. A. 1977. On competition and variable environments. - Am. Sci. 65: 590-597.
Wilbur, H. M. 1972. Competition, predation, and the structure of the Ambystoma-Rana sylvatica
community. - Ecology 53: 3-21.
Wright, S. J. 1979. Competition between insectivorous lizards and birds in Central Panamá. -
Am. Zool. 19: 1145-1156.
Zar, J. H. 1998. Biostatistical Analysis. - Prentice-Hall, Inc.
Zug, G. R., Vitt, L. J. and Caldwell, J. P. 2001. Herpetology: An Introductory Biology of
Amphibians and Reptiles. - Academic Press.

55
Table 1. Summary of ecological traits of lizard assemblages from 20 isolated and non isolated
open vegetation areas from Brazil. Sample sizes are in parentheses.
Variable Isolated Non isolated Comparisons All species richness 5.786 ± 2.778
(6) 12.000 ± 3.847
(14) F1,18 = 16.744
P = 0.001 Microhabitat niche breadth 1.959 ± 0.428
(9) 1.879 ± 0.463
(4) F1,11 = 0.093
P = 0.766 Diet niche breadth (pooled) 3.386 ± 1.057
(14) 2.722 ± 0.561
(6) F1,18 = 2.072
P = 0.167 Diet niche breadth (individual) 1.503 ± 0.267
(14) 1.233 ± 0.135
(6) F1,18 = 5.422
P = 0.032 Nearest neighbor Euclidean distance 1.151 ± 0.395
(14) 1.119 ± 0.224
(6) F1,18 = 0.032
P = 0.859 Abundance of shared species 4.744 ± 5.328
(7) 7.905 ± 3.083
(5) F1,10 = 1.399
P = 0.264 Ameiva ameiva Microhabitat niche breadth 2.194 ± 0.626
(9) 1.643 ± 0.593
(4) F1,11 = 2.206
P = 0.166 Abundance 1.406 ± 1.699
(7) 0.541 ± 0.398
(4) F1,10 = 1.215
P = 0.296 Cnemidophorus Microhabitat niche breadth 1.974 ± 0.367
(5) 1.442 ± 0.565
(4) F1,7 = 2.949 P = 0.130
Abundance 3.130 ± 3.492 (2)
2.525 ± 2.583 (5)
F1,5 = 0.067 P = 0.806
Anolis Microhabitat niche breadth 2.286 ± 1.818
(2) 1.823 ± 1.164
(2) F1,2 = 0.092 P = 0.790
Abundance 1.568 ± 1.820 (3)
1.374 ± 1.693 (2)
F1,3 = 0.014 P = 0.913
Tropidurus Microhabitat niche breadth 2.446 ± 0.823
(5) 2.812 ± 0.862
(4) F1,7 = 0.422 P = 0.537
Micrablepharus Abundance 1.610 ± 0.787
(2) 1.054 ± 0.839
(4) F1,4 = 0.605 P = 0.480
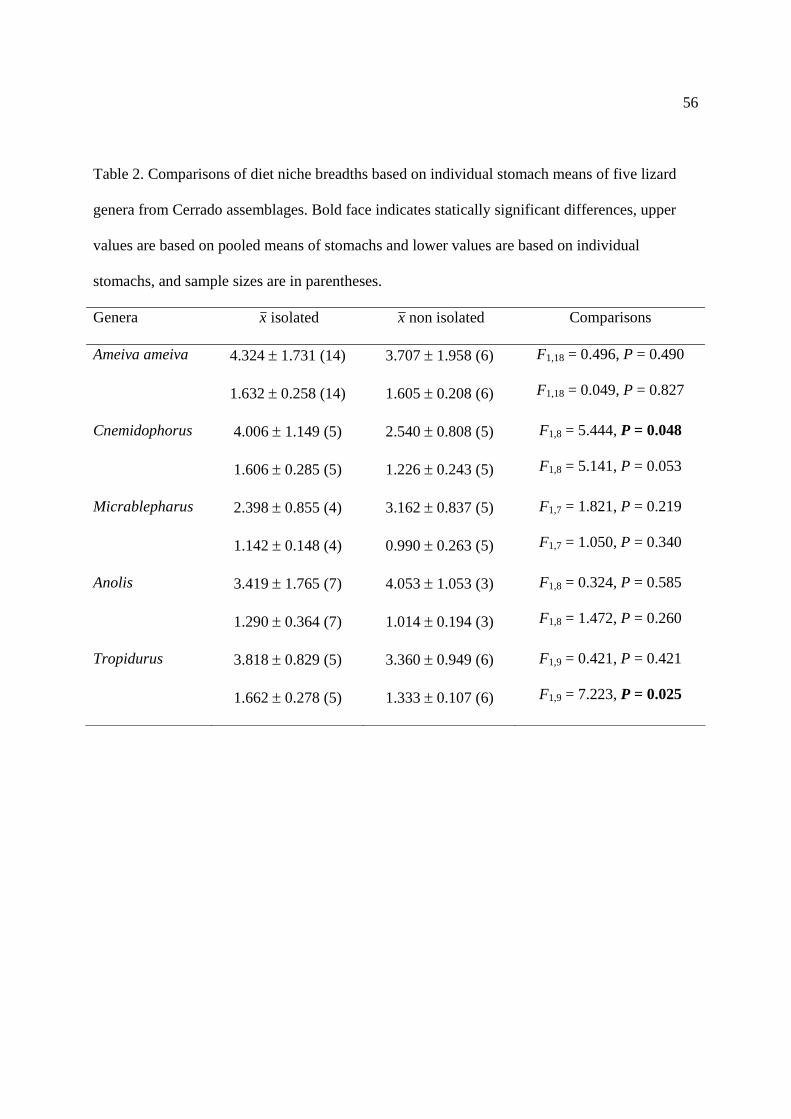
56
Table 2. Comparisons of diet niche breadths based on individual stomach means of five lizard
genera from Cerrado assemblages. Bold face indicates statically significant differences, upper
values are based on pooled means of stomachs and lower values are based on individual
stomachs, and sample sizes are in parentheses.
Genera x isolated x non isolated Comparisons
Ameiva ameiva 4.324 ± 1.731 (14)
1.632 ± 0.258 (14)
3.707 ± 1.958 (6)
1.605 ± 0.208 (6)
F1,18 = 0.496, P = 0.490
F1,18 = 0.049, P = 0.827
Cnemidophorus 4.006 ± 1.149 (5)
1.606 ± 0.285 (5)
2.540 ± 0.808 (5)
1.226 ± 0.243 (5)
F1,8 = 5.444, P = 0.048
F1,8 = 5.141, P = 0.053
Micrablepharus 2.398 ± 0.855 (4)
1.142 ± 0.148 (4)
3.162 ± 0.837 (5)
0.990 ± 0.263 (5)
F1,7 = 1.821, P = 0.219
F1,7 = 1.050, P = 0.340
Anolis 3.419 ± 1.765 (7)
1.290 ± 0.364 (7)
4.053 ± 1.053 (3)
1.014 ± 0.194 (3)
F1,8 = 0.324, P = 0.585
F1,8 = 1.472, P = 0.260
Tropidurus 3.818 ± 0.829 (5)
1.662 ± 0.278 (5)
3.360 ± 0.949 (6)
1.333 ± 0.107 (6)
F1,9 = 0.421, P = 0.421
F1,9 = 7.223, P = 0.025

57
Figure Legends
Figure 1. Collecting localities in savannas of Brazil. 1- Paracatu - MG, 2- Alvorada do Norte –
GO, 3- São Domingos – GO, 4- Dianópolis - TO, 5- Mateiros - TO, 6- Paranã - TO, 7- Vilhena -
RO, 8- Pimenta Bueno - RO, 9- Guajará – Mirim - RO, 10- Humaitá - AM, 11- Cachimbo – PA,
12- Paraupebas - PA, 13- Alter do Chão - PA, 14- Monte Alegre - PA, 15- Macapá - AP, 16-
Tartarugalzinho - AP, and 17- Boa Vista. Adapted from “Mapa de Vegetação do Brasil” by
Instituto Brasileiro de Geografia e Estatística (IBGE).
Figure 2. Relationship between average microhabitat niche breadths and number of species of
lizards from Cerrado-like open vegetation habitats in Brazil. Circle = isolated and triangle = non
isolated.
Figure 3. Relationship between average diet niche breadths based on pooled stomachs and
number of species of Ameiva ameiva, Cnemidophorus, Micrabepharus, Anolis, Tropidurus and
all species combined from Cerrado-like open vegetation habitats in Brazil. Circle = isolated and
triangle = non isolated.
Figure 4. Relationship between average diet niche breadths based on individual stomachs and
number of species of Ameiva ameiva, Cnemidophorus, Micrabepharus, Anolis, Tropidurus and
all species combined from Cerrado-like open vegetation habitats in Brazil. Circle = isolated and
triangle = non isolated.
58
Figure 5. Relationship between average nearest neighbor Euclidean distance of log transformed
morphometrical data of lizards from 20 Cerrado-like open vegetation habitats in Brazil and
number of species of each assemblage.
Figure 6. Relationship between abundance (individuals per day) of lizards in the genera Anolis,
Micrablepharus, Ameiva, and Cnemidophorus and number of species in each assemblage
collected in 100 pitfall traps in several Cerrado-like open vegetation habitats in Brazil.

59

60
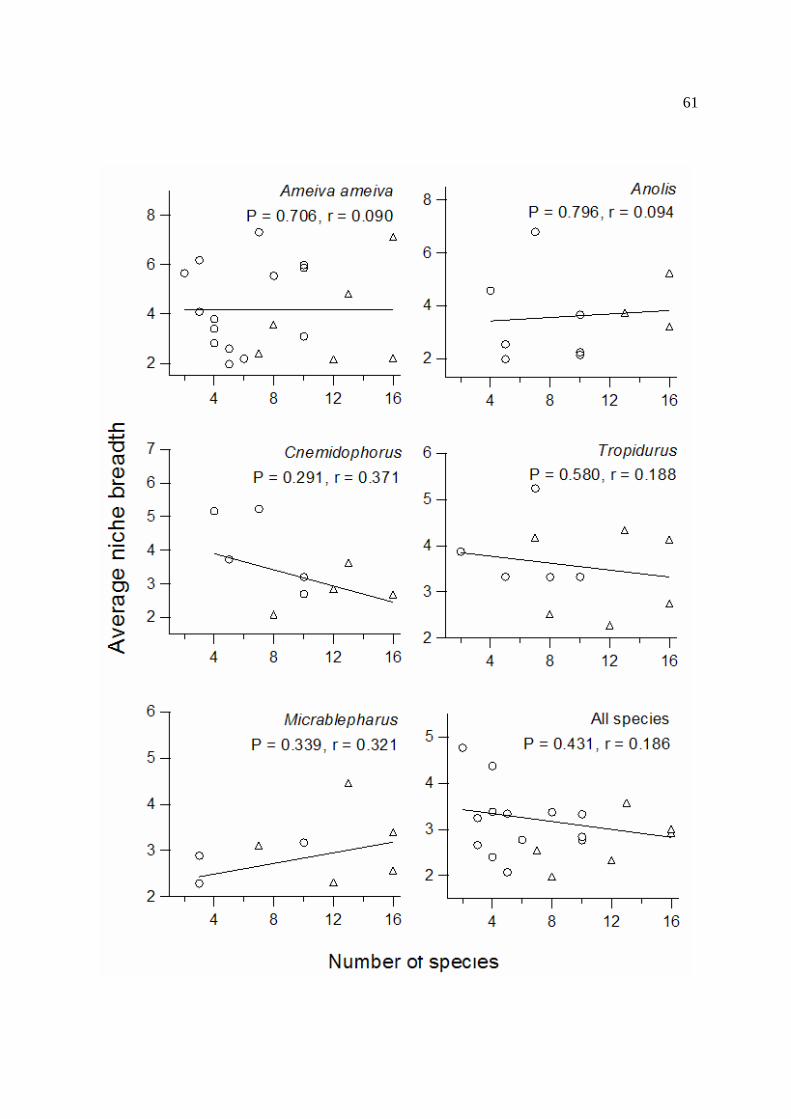
61
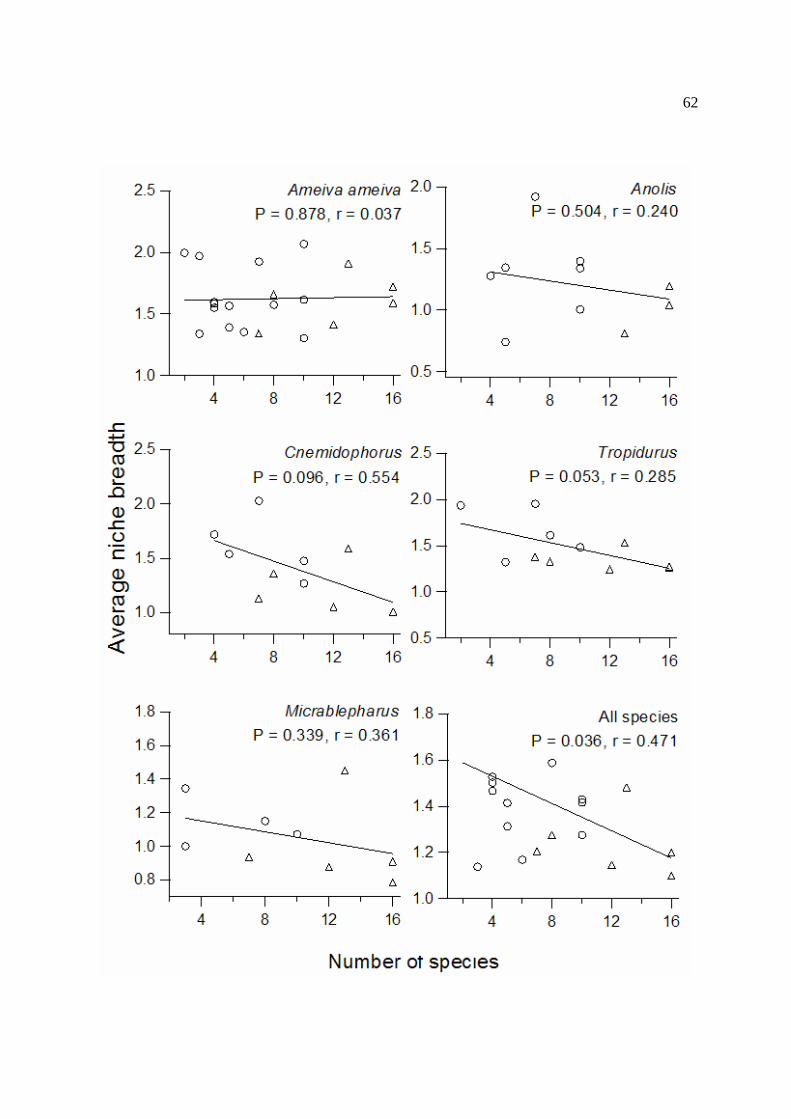
62
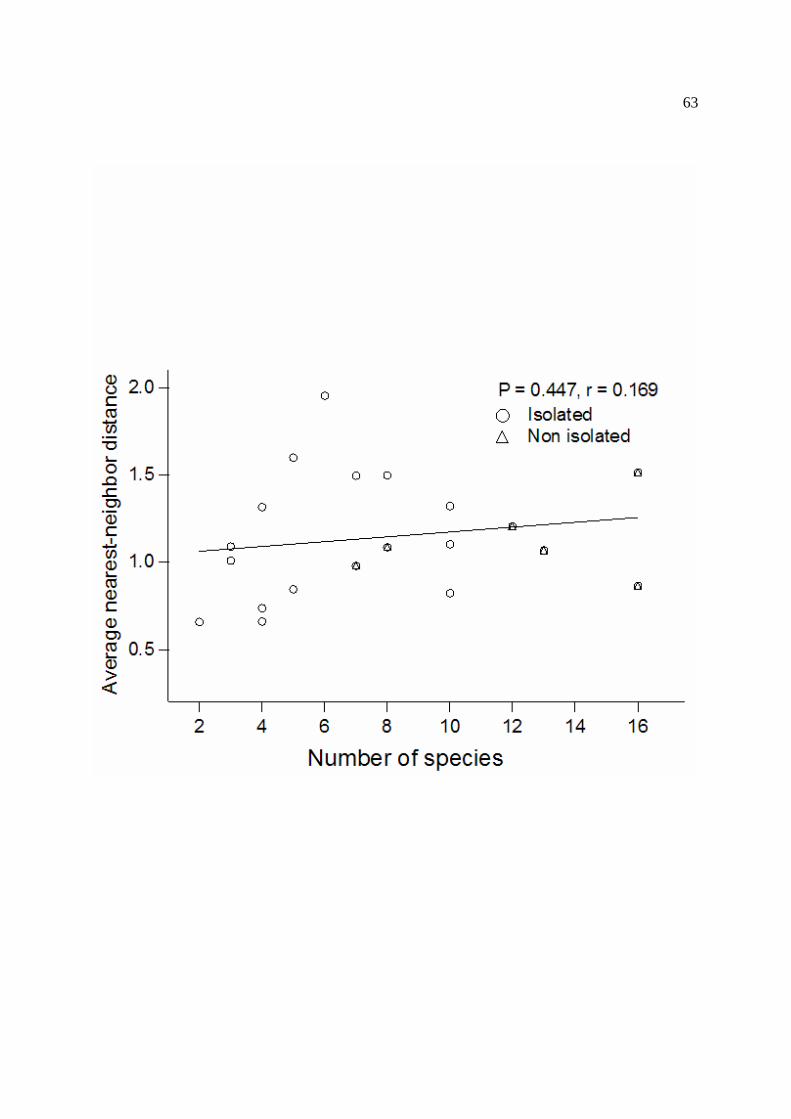
63
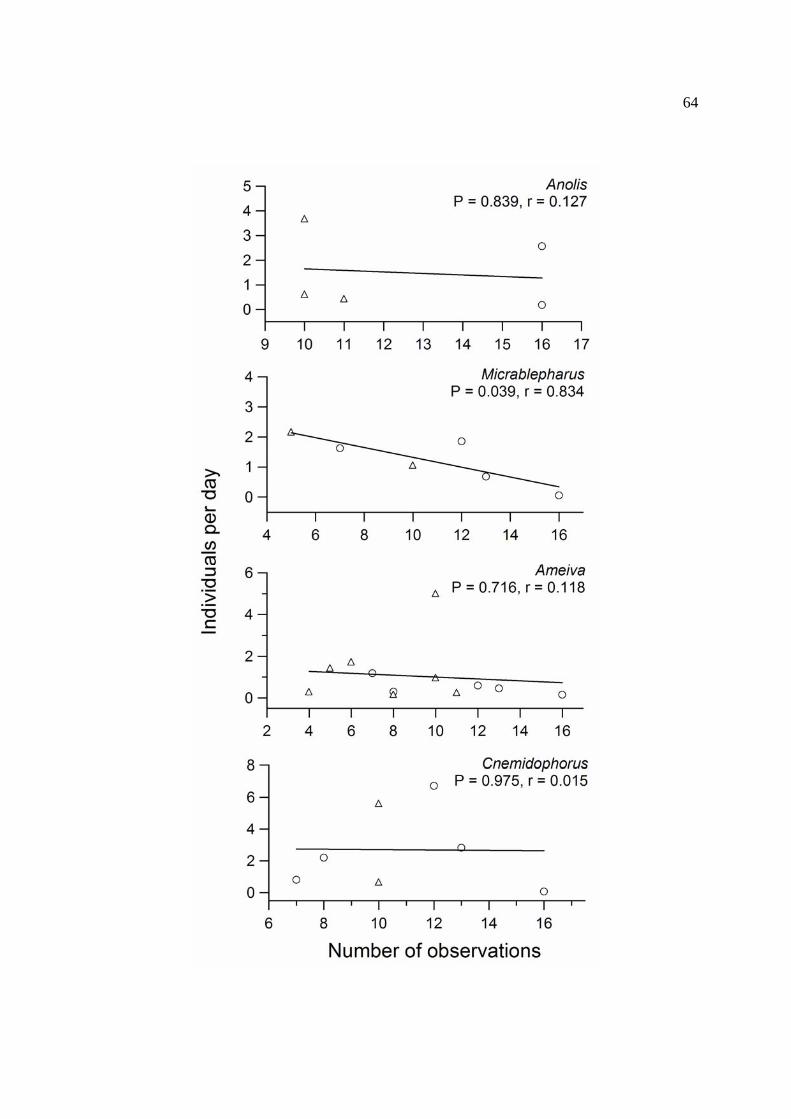
64

65
Appendix 1. Composition of lizard assemblages and number of individuals in 20 Cerrado like open vegetation enclaves from Brazil. dr = dry forest, lc = latosoil cerrado, rf = rocky field, sc = sandy cerrado, and tf = transitional forest. 1- Alter do Chão, 2- Alvorada, 3- Amapá, 4- Cachimbo, 5- Carajás, 6- Dianópolis, 7- Guajará-Mirim, 8- Humaitá, 9- Jalapão, 10- Monte Alegre, 11- Paracatu, 12- Paranã, 13- Pimenta Bueno, 14- Roraima, 15- São Domingos, and 16- Vilhena.
Lizard Species 1 2 3 4 5 6 7 8 9 10 11 12 13 14 15 16 sc sc-rf sc sc-rf rf sc-rf rf lc sc sc-rf sc-rf lc sc-rf lc tf sc sc df lc scGekkonidae Briba brasiliana b - - - - - 5 - - - 8 - - - - - - - - - - Coleodactylus meridionalis - - - - - 14 - - - - - - 7 - - - - 25 - - Gonatodes humeralis a - - - - - - - - - - 3 - - - - - - - - - Gymnodactylus geckoides - - - - - 1 - - - 107 - - 85 - - - - 75 - - Hemidactylus palaichthus - - - - - - - - - - - - - - - - 2 - - - Lygodactylus klugei b - - - - - - - - - - - - - - - - - 8 - - Phyllopezus pollicaris - - - - - - - - - - - - 19 - - - - 19 - -
Gymnophthalmidae Bachia bresslaui - - - - - - - - - - - 12 - - - - - - - - Bachia cacerensis - - - - - - - - - - - - - - - - - - - 2 Bachia dorbignyi a - - - - - - - - 1 - - - - - - - - - - - Cercosaura ocellata - - - - - - - 8 - - - 11 - 21 79 2 - - 7 - Colobosaura modesta - 12 - 1 2 - - - - 20 - 14 - - - - - 6 - - Gymnophthalmidae sp a - - - - - - - - - - - - - 1 - 1 - - - - Gymnophthalmus leucomystax - - - - - - - - - - - - - - - - 3 - - - Gymnophthalmus underwoodi 1 - - - - - - - - - 14 - - - - - - - - - Iphisa elegans a - - - - - - - - - - - - - - 3 - - - 3 - Micrablepharus atticolus - - - - - - - - - - - 13 - - - 110 - - - 69Micrablepharus maximiliani - 27 - 3 - - - - 6 48 - - 19 - - - - 14 - - Prionodactylus eigenmanni a - - - - - - - - - - - - - - 9 - - - 2 - Vanzosaura rubricauda - - - - - 4 - - - 33 - - - - - - - - - -
Leiosauridae Enyalius cf bilineatus - - - - - - - - - - - 6 - - - - - - - -
Polychrotidae
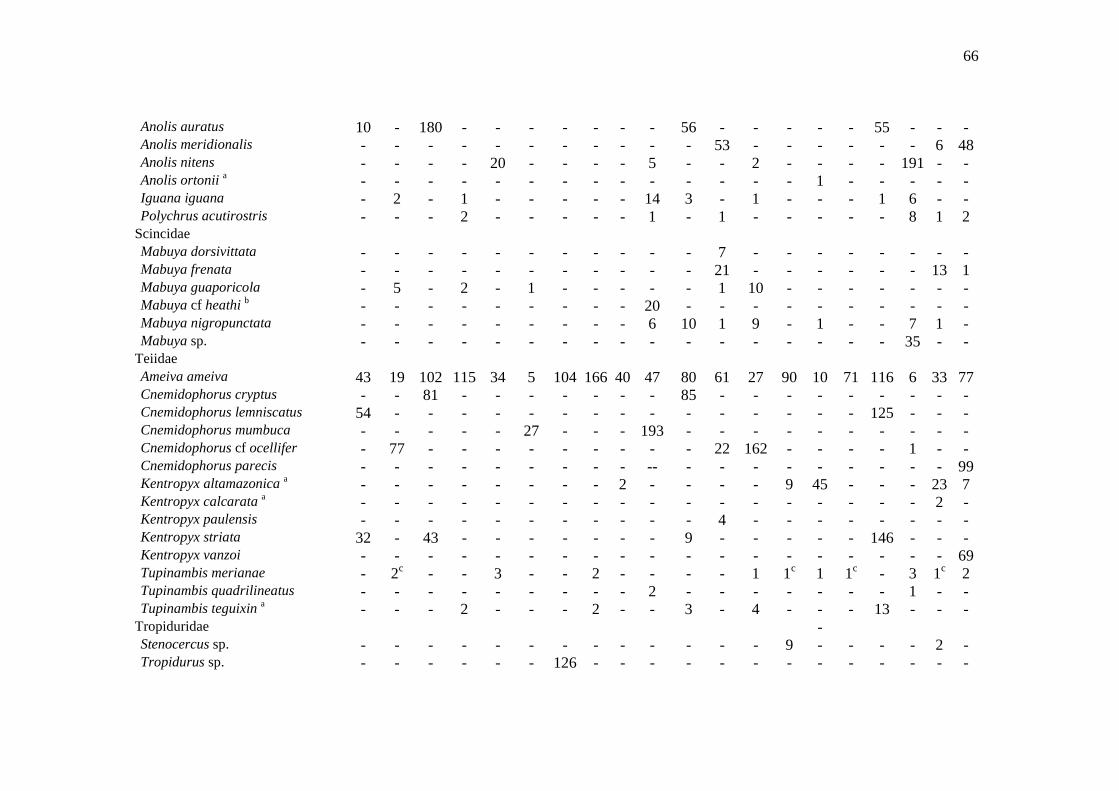
66
Anolis auratus 10 - 180 - - - - - - - 56 - - - - - 55 - - - Anolis meridionalis - - - - - - - - - - - 53 - - - - - - 6 48Anolis nitens - - - - 20 - - - - 5 - - 2 - - - - 191 - - Anolis ortonii a - - - - - - - - - - - - - - 1 - - - - - Iguana iguana - 2 - 1 - - - - - 14 3 - 1 - - - 1 6 - - Polychrus acutirostris - - - 2 - - - - - 1 - 1 - - - - - 8 1 2
Scincidae Mabuya dorsivittata - - - - - - - - - - - 7 - - - - - - - - Mabuya frenata - - - - - - - - - - - 21 - - - - - - 13 1 Mabuya guaporicola - 5 - 2 - 1 - - - - - 1 10 - - - - - - - Mabuya cf heathi b - - - - - - - - - 20 - - - - - - - - - - Mabuya nigropunctata - - - - - - - - - 6 10 1 9 - 1 - - 7 1 - Mabuya sp. - - - - - - - - - - - - - - - - - 35 - -
Teiidae Ameiva ameiva 43 19 102 115 34 5 104 166 40 47 80 61 27 90 10 71 116 6 33 77Cnemidophorus cryptus - - 81 - - - - - - - 85 - - - - - - - - - Cnemidophorus lemniscatus 54 - - - - - - - - - - - - - - - 125 - - - Cnemidophorus mumbuca - - - - - 27 - - - 193 - - - - - - - - - - Cnemidophorus cf ocellifer - 77 - - - - - - - - - 22 162 - - - - 1 - - Cnemidophorus parecis - - - - - - - - - -- - - - - - - - - - 99Kentropyx altamazonica a - - - - - - - - 2 - - - - 9 45 - - - 23 7 Kentropyx calcarata a - - - - - - - - - - - - - - - - - - 2 - Kentropyx paulensis - - - - - - - - - - - 4 - - - - - - - - Kentropyx striata 32 - 43 - - - - - - - 9 - - - - - 146 - - - Kentropyx vanzoi - - - - - - - - - - - - - - - - - - - 69Tupinambis merianae - 2c - - 3 - - 2 - - - - 1 1c 1 1c - 3 1c 2 Tupinambis quadrilineatus - - - - - - - - - 2 - - - - - - - 1 - - Tupinambis teguixin a - - - 2 - - - 2 - - 3 - 4 - - - 13 - - -
Tropiduridae - Stenocercus sp. - - - - - - - - - - - - - 9 - - - - 2 - Tropidurus sp. - - - - - - 126 - - - - - - - - - - - - -

67
Tropidurus cf hispidus - - - - - - - - - - 44 - - - - - 130 - - - Tropidurus insulanus - - - 73 - - - - - - - - - - - - - - - - Tropidurus itambere - - - - - - - - - - - 154 - - - - - - - - Tropidurus cf oreadicus - 41 - - 72 48 - - - 165 - - 51 - - - - 26 - -
Total species richness 5 8 5 8 5 8 2 4 4 13 10 16 12 6 8 5 9 16 11 10Isolated X X X X X X X X X X X X X XTotal No. 140 183 471 217 132 105 230 271 49 668 307 397 426 129 149 183 591 439 92 376
a Forest species. b Caatinga species c Species sighted but not captured.
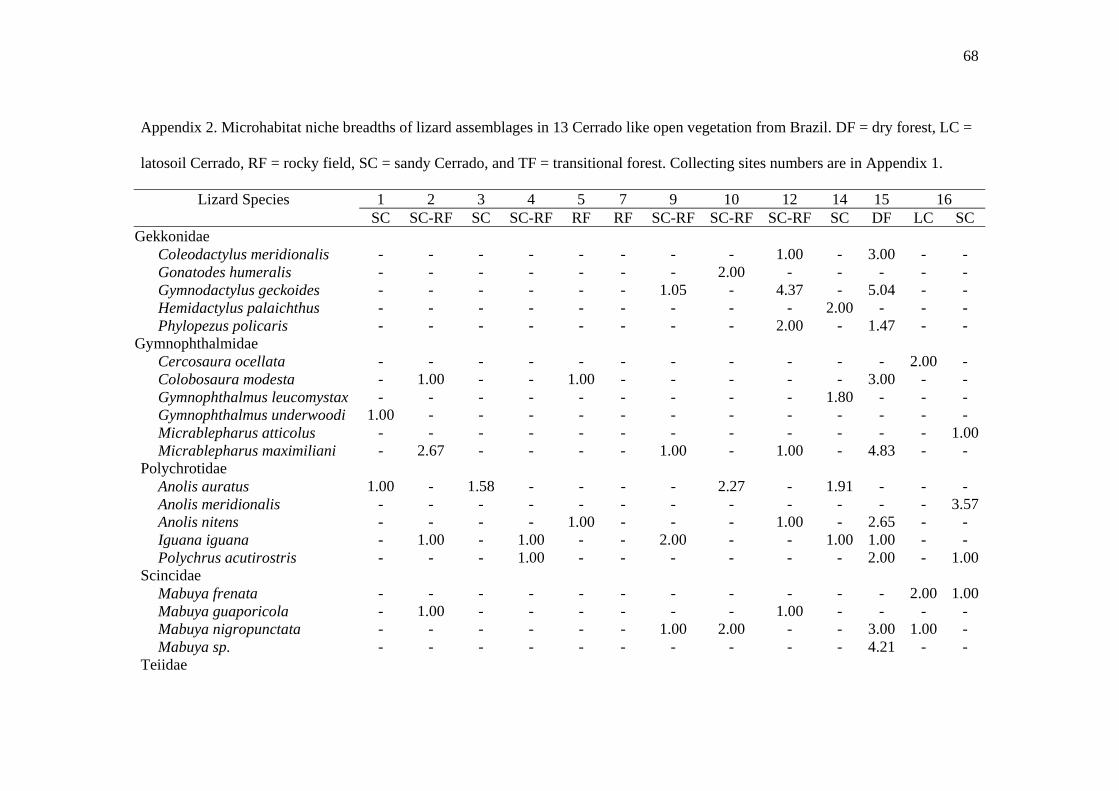
68
Appendix 2. Microhabitat niche breadths of lizard assemblages in 13 Cerrado like open vegetation from Brazil. DF = dry forest, LC =
latosoil Cerrado, RF = rocky field, SC = sandy Cerrado, and TF = transitional forest. Collecting sites numbers are in Appendix 1.
Lizard Species 1 2 3 4 5 7 9 10 12 14 15 16 SC SC-RF SC SC-RF RF RF SC-RF SC-RF SC-RF SC DF LC SC Gekkonidae
Coleodactylus meridionalis - - - - - - - - 1.00 - 3.00 - - Gonatodes humeralis - - - - - - - 2.00 - - - - - Gymnodactylus geckoides - - - - - - 1.05 - 4.37 - 5.04 - - Hemidactylus palaichthus - - - - - - - - - 2.00 - - - Phylopezus policaris - - - - - - - - 2.00 - 1.47 - -
Gymnophthalmidae Cercosaura ocellata - - - - - - - - - - - 2.00 - Colobosaura modesta - 1.00 - - 1.00 - - - - - 3.00 - - Gymnophthalmus leucomystax - - - - - - - - - 1.80 - - - Gymnophthalmus underwoodi 1.00 - - - - - - - - - - - - Micrablepharus atticolus - - - - - - - - - - - - 1.00Micrablepharus maximiliani - 2.67 - - - - 1.00 - 1.00 - 4.83 - -
Polychrotidae Anolis auratus 1.00 - 1.58 - - - - 2.27 - 1.91 - - - Anolis meridionalis - - - - - - - - - - - - 3.57Anolis nitens - - - - 1.00 - - - 1.00 - 2.65 - - Iguana iguana - 1.00 - 1.00 - - 2.00 - - 1.00 1.00 - - Polychrus acutirostris - - - 1.00 - - - - - - 2.00 - 1.00
Scincidae Mabuya frenata - - - - - - - - - - - 2.00 1.00Mabuya guaporicola - 1.00 - - - - - - 1.00 - - - - Mabuya nigropunctata - - - - - - 1.00 2.00 - - 3.00 1.00 - Mabuya sp. - - - - - - - - - - 4.21 - -
Teiidae
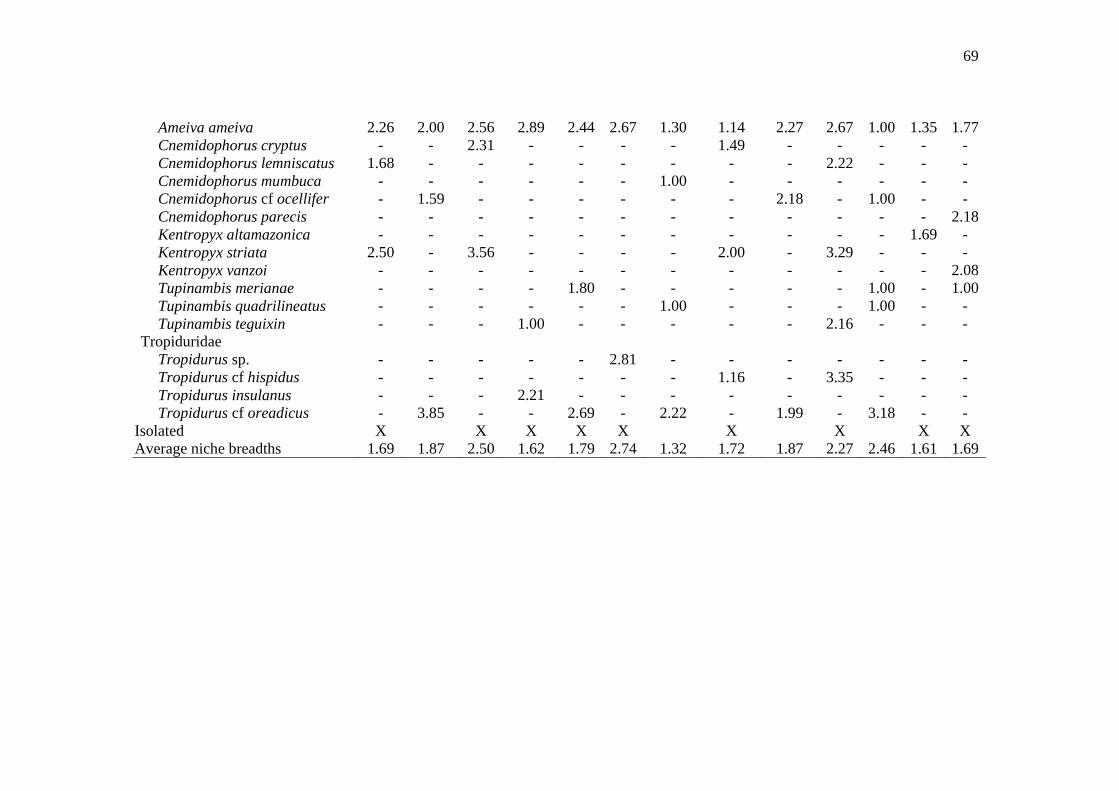
69
Ameiva ameiva 2.26 2.00 2.56 2.89 2.44 2.67 1.30 1.14 2.27 2.67 1.00 1.35 1.77Cnemidophorus cryptus - - 2.31 - - - - 1.49 - - - - - Cnemidophorus lemniscatus 1.68 - - - - - - - - 2.22 - - - Cnemidophorus mumbuca - - - - - - 1.00 - - - - - - Cnemidophorus cf ocellifer - 1.59 - - - - - - 2.18 - 1.00 - - Cnemidophorus parecis - - - - - - - - - - - - 2.18Kentropyx altamazonica - - - - - - - - - - - 1.69 - Kentropyx striata 2.50 - 3.56 - - - - 2.00 - 3.29 - - - Kentropyx vanzoi - - - - - - - - - - - - 2.08Tupinambis merianae - - - - 1.80 - - - - - 1.00 - 1.00Tupinambis quadrilineatus - - - - - - 1.00 - - - 1.00 - - Tupinambis teguixin - - - 1.00 - - - - - 2.16 - - -
Tropiduridae Tropidurus sp. - - - - - 2.81 - - - - - - - Tropidurus cf hispidus - - - - - - - 1.16 - 3.35 - - - Tropidurus insulanus - - - 2.21 - - - - - - - - - Tropidurus cf oreadicus - 3.85 - - 2.69 - 2.22 - 1.99 - 3.18 - -
Isolated X X X X X X X X X Average niche breadths 1.69 1.87 2.50 1.62 1.79 2.74 1.32 1.72 1.87 2.27 2.46 1.61 1.69
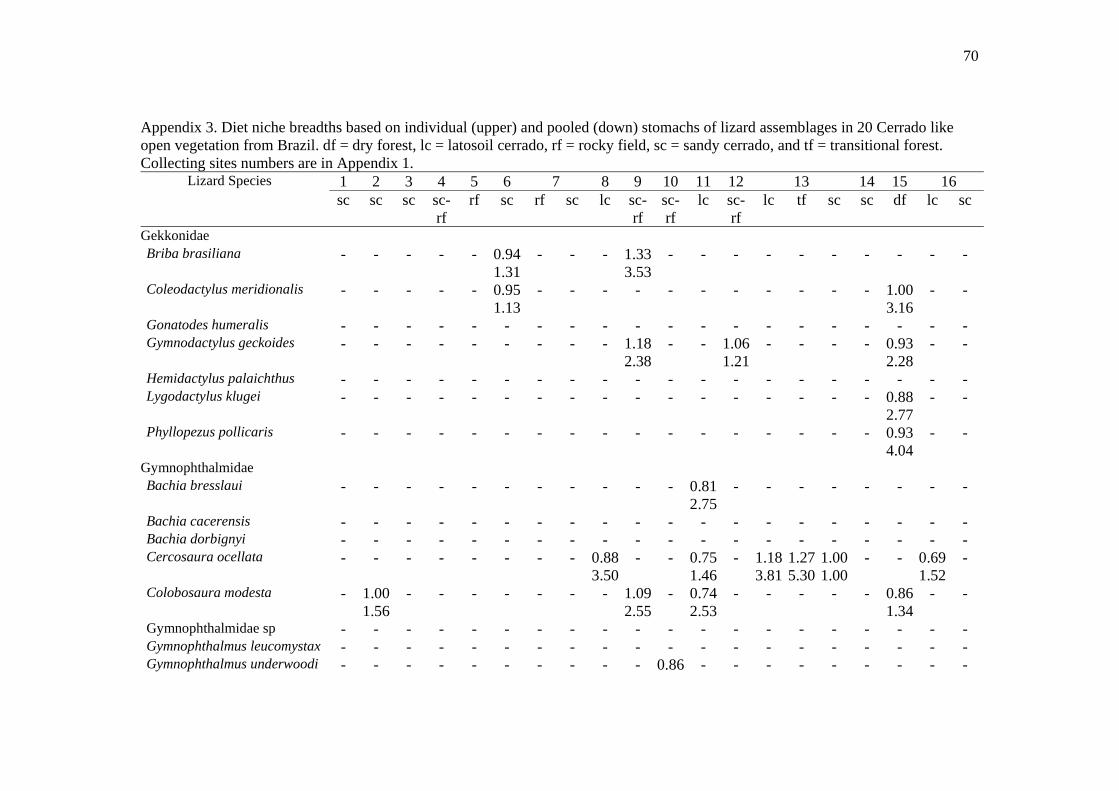
70
Appendix 3. Diet niche breadths based on individual (upper) and pooled (down) stomachs of lizard assemblages in 20 Cerrado like open vegetation from Brazil. df = dry forest, lc = latosoil cerrado, rf = rocky field, sc = sandy cerrado, and tf = transitional forest. Collecting sites numbers are in Appendix 1.
Lizard Species 1 2 3 4 5 6 7 8 9 10 11 12 13 14 15 16 sc sc sc sc-
rf rf sc rf sc lc sc-
rf sc-rf
lc sc-rf
lc tf sc sc df lc sc
Gekkonidae Briba brasiliana - - - - - 0.94
1.31- - - 1.33
3.53 - - - - - - - - - -
Coleodactylus meridionalis - - - - - 0.951.13
- - - - - - - - - - - 1.003.16
- -
Gonatodes humeralis - - - - - - - - - - - - - - - - - - - - Gymnodactylus geckoides - - - - - - - - - 1.18
2.38 - - 1.06
1.21- - - - 0.93
2.28- -
Hemidactylus palaichthus - - - - - - - - - - - - - - - - - - - - Lygodactylus klugei - - - - - - - - - - - - - - - - - 0.88
2.77- -
Phyllopezus pollicaris - - - - - - - - - - - - - - - - - 0.934.04
- -
Gymnophthalmidae Bachia bresslaui - - - - - - - - - - - 0.81
2.75- - - - - - - -
Bachia cacerensis - - - - - - - - - - - - - - - - - - - - Bachia dorbignyi - - - - - - - - - - - - - - - - - - - - Cercosaura ocellata - - - - - - - - 0.88
3.50 - - 0.75
1.46- 1.18
3.811.275.30
1.001.00
- - 0.691.52
-
Colobosaura modesta - 1.001.56
- - - - - - - 1.09 2.55
- 0.742.53
- - - - - 0.861.34
- -
Gymnophthalmidae sp - - - - - - - - - - - - - - - - - - - - Gymnophthalmus leucomystax - - - - - - - - - - - - - - - - - - - - Gymnophthalmus underwoodi - - - - - - - - - - 0.86 - - - - - - - - -
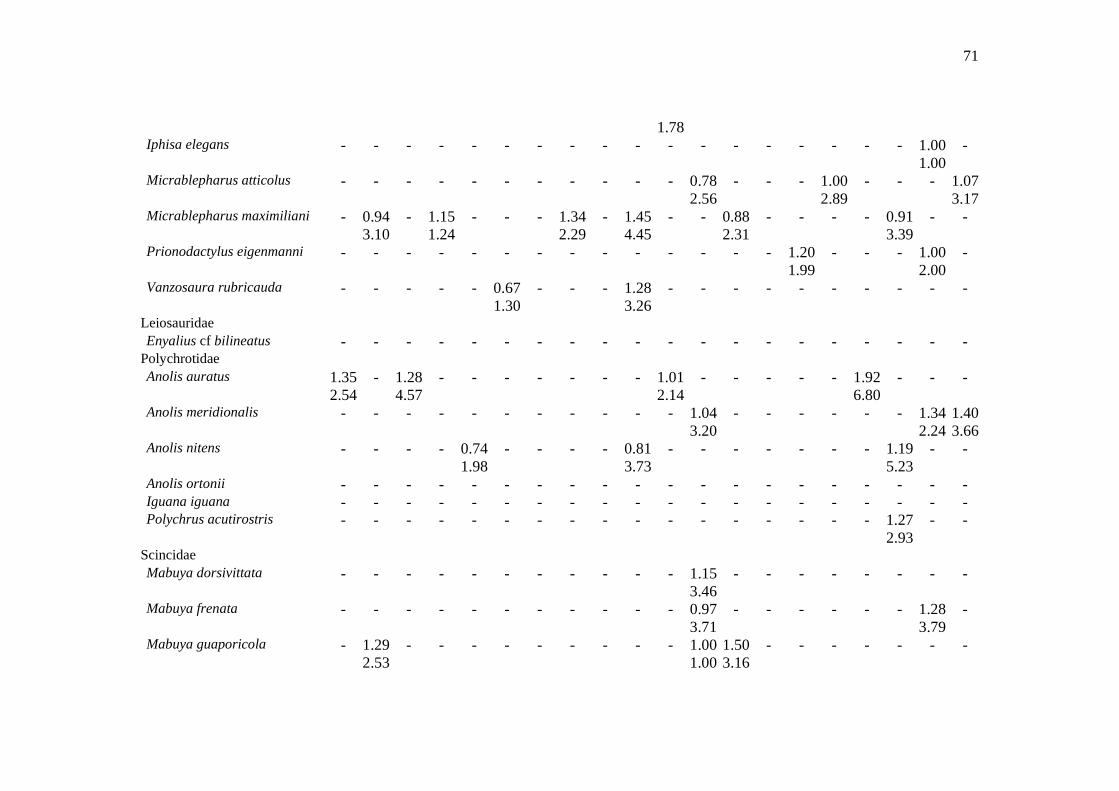
71
1.78Iphisa elegans - - - - - - - - - - - - - - - - - - 1.00
1.00-
Micrablepharus atticolus - - - - - - - - - - - 0.782.56
- - - 1.002.89
- - - 1.073.17
Micrablepharus maximiliani - 0.943.10
- 1.151.24
- - - 1.342.29
- 1.45 4.45
- - 0.882.31
- - - - 0.913.39
- -
Prionodactylus eigenmanni - - - - - - - - - - - - - - 1.201.99
- - - 1.002.00
-
Vanzosaura rubricauda - - - - - 0.671.30
- - - 1.28 3.26
- - - - - - - - - -
Leiosauridae Enyalius cf bilineatus - - - - - - - - - - - - - - - - - - - -
Polychrotidae Anolis auratus 1.35
2.54- 1.28
4.57- - - - - - - 1.01
2.14- - - - - 1.92
6.80- - -
Anolis meridionalis - - - - - - - - - - - 1.043.20
- - - - - - 1.342.24
1.403.66
Anolis nitens - - - - 0.741.98
- - - - 0.81 3.73
- - - - - - - 1.195.23
- -
Anolis ortonii - - - - - - - - - - - - - - - - - - - - Iguana iguana - - - - - - - - - - - - - - - - - - - - Polychrus acutirostris - - - - - - - - - - - - - - - - - 1.27
2.93- -
Scincidae Mabuya dorsivittata - - - - - - - - - - - 1.15
3.46- - - - - - - -
Mabuya frenata - - - - - - - - - - - 0.973.71
- - - - - - 1.283.79
-
Mabuya guaporicola - 1.292.53
- - - - - - - - - 1.001.00
1.503.16
- - - - - - -
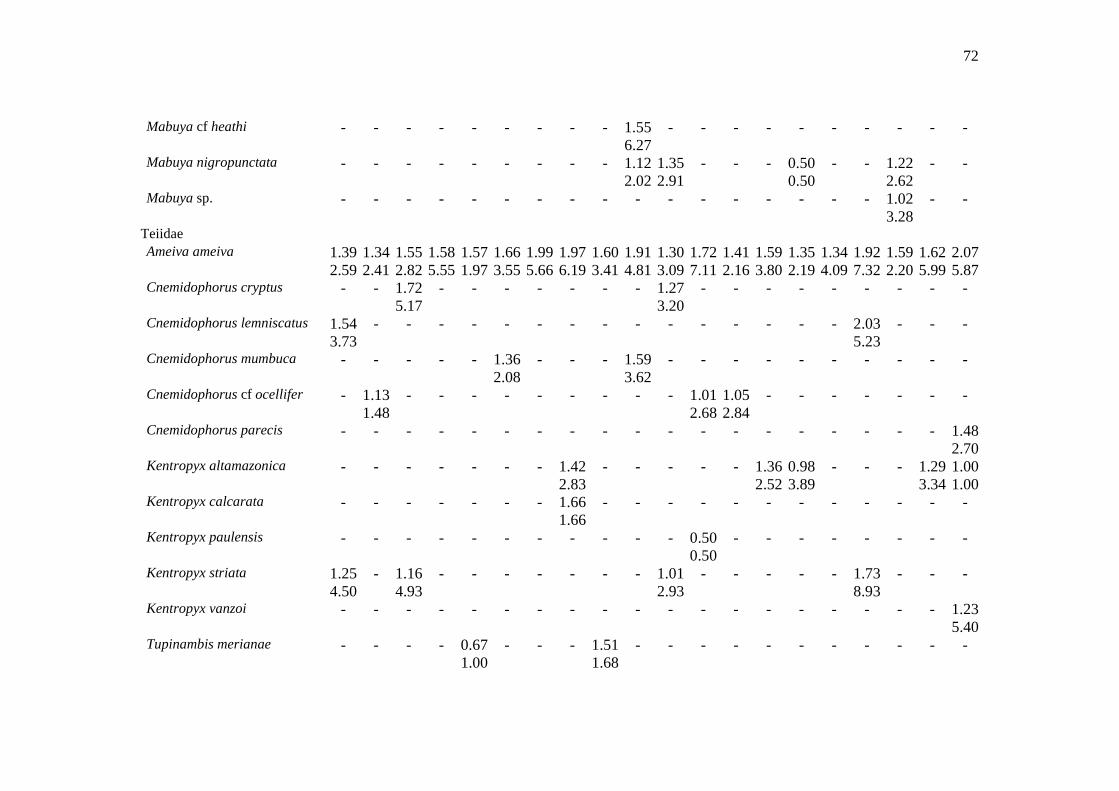
72
Mabuya cf heathi - - - - - - - - - 1.55 6.27
- - - - - - - - - -
Mabuya nigropunctata - - - - - - - - - 1.12 2.02
1.352.91
- - - 0.500.50
- - 1.222.62
- -
Mabuya sp. - - - - - - - - - - - - - - - - - 1.023.28
- -
Teiidae Ameiva ameiva 1.39
2.591.342.41
1.552.82
1.585.55
1.571.97
1.663.55
1.995.66
1.976.19
1.60 3.41
1.91 4.81
1.303.09
1.727.11
1.412.16
1.593.80
1.352.19
1.344.09
1.927.32
1.592.20
1.625.99
2.075.87
Cnemidophorus cryptus - - 1.725.17
- - - - - - - 1.273.20
- - - - - - - - -
Cnemidophorus lemniscatus 1.543.73
- - - - - - - - - - - - - - - 2.035.23
- - -
Cnemidophorus mumbuca - - - - - 1.362.08
- - - 1.59 3.62
- - - - - - - - - -
Cnemidophorus cf ocellifer - 1.131.48
- - - - - - - - - 1.012.68
1.052.84
- - - - - - -
Cnemidophorus parecis - - - - - - - - - - - - - - - - - - - 1.482.70
Kentropyx altamazonica - - - - - - - 1.422.83
- - - - - 1.362.52
0.983.89
- - - 1.293.34
1.001.00
Kentropyx calcarata - - - - - - - 1.661.66
- - - - - - - - - - - -
Kentropyx paulensis - - - - - - - - - - - 0.500.50
- - - - - - - -
Kentropyx striata 1.254.50
- 1.164.93
- - - - - - - 1.012.93
- - - - - 1.738.93
- - -
Kentropyx vanzoi - - - - - - - - - - - - - - - - - - - 1.235.40
Tupinambis merianae - - - - 0.671.00
- - - 1.51 1.68
- - - - - - - - - - -
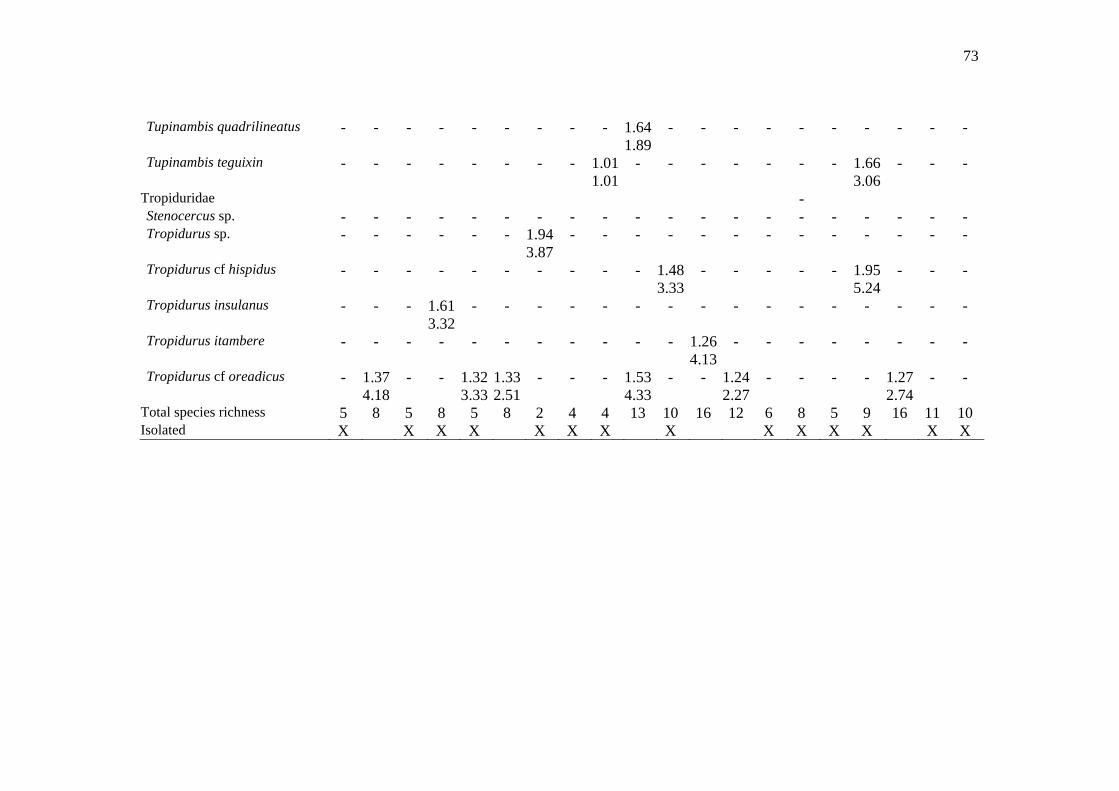
73
Tupinambis quadrilineatus - - - - - - - - - 1.64 1.89
- - - - - - - - - -
Tupinambis teguixin - - - - - - - - 1.01 1.01
- - - - - - - 1.663.06
- - -
Tropiduridae - Stenocercus sp. - - - - - - - - - - - - - - - - - - - - Tropidurus sp. - - - - - - 1.94
3.87- - - - - - - - - - - - -
Tropidurus cf hispidus - - - - - - - - - - 1.483.33
- - - - - 1.955.24
- - -
Tropidurus insulanus - - - 1.613.32
- - - - - - - - - - - - - - - -
Tropidurus itambere - - - - - - - - - - - 1.264.13
- - - - - - - -
Tropidurus cf oreadicus - 1.374.18
- - 1.323.33
1.332.51
- - - 1.53 4.33
- - 1.242.27
- - - - 1.272.74
- -
Total species richness 5 8 5 8 5 8 2 4 4 13 10 16 12 6 8 5 9 16 11 10 Isolated X X X X X X X X X X X X X X

74
Appendix 4. Abundance of lizards (number of lizards/day) from 13 Cerrado like open vegetation from Brazil. DR = dry forest, LC =
latosoil Cerrado, RF = rocky field, SC = sandy Cerrado, and TF = transitional forest. Collecting sites numbers are in Appendix 1.
Lizard Species 2 6 8 9 10 11 12 13 15 16 SC SC LC SC-
RF SC-RF
LC SC-RF
LC TF SC DF LC SC
Gekkonidae Briba brasiliana - 0.20 - 0.04 - - - - - - - - - Coleodactylus meridionalis - - - - - - 0.21 - - - 0.13 - - Gonatodes humeralis - - - - 0.13 - - - - - - - - Gymnodactylus geckoides - - - 0.32 - - 2.71 - - - 0.63 - - Lygodactylus klugei - - - - - - - - - - 0.38 - - Phylopezus policaris - - - - - - - - - - 0.13 - -
Gymnophthalmidae Bachia bresslaui - - - - - 0.04 - - - - - - - Bachia cacerensis - - - - - - - - - - - - 0.02 Cercosaura ocellata - - 0.35 - - 0.04 - 0.50 1.73 0.04 - 0.36 - Colobosaura modesta 0.62 - - 0.28 - 0.04 - - - - 0.63 - - Gymnophthalmidae sp - - - - - - - 0.02 - 0.02 - - - Gymnophthalmus underwoodi - - - - 0.87 - - - - - - - - Iphisa elegans - - - - - - - - 0.02 - - 0.12 - Micrablepharus atticolus - - - - - 0.05 - - - 2.25 - - 1.05 Micrablepharus maximiliani 1.63 - - 0.65 - - 1.86 - - - 0.63 - - Prionodactylus eigenmanni - - - - - - - - 0.20 - - - - Vanzosaura rubricauda - 0.30 - 0.57 - - - - - - - - -
Leiosauridae Enyalius cf bilineatus - - - - - 0.01 - - - - - - -
Polychrotidae Anolis auratus - - - - 3.67 - - - - - - - - Anolis meridionalis - - - - - 0.18 - - - - - 0.48 0.68
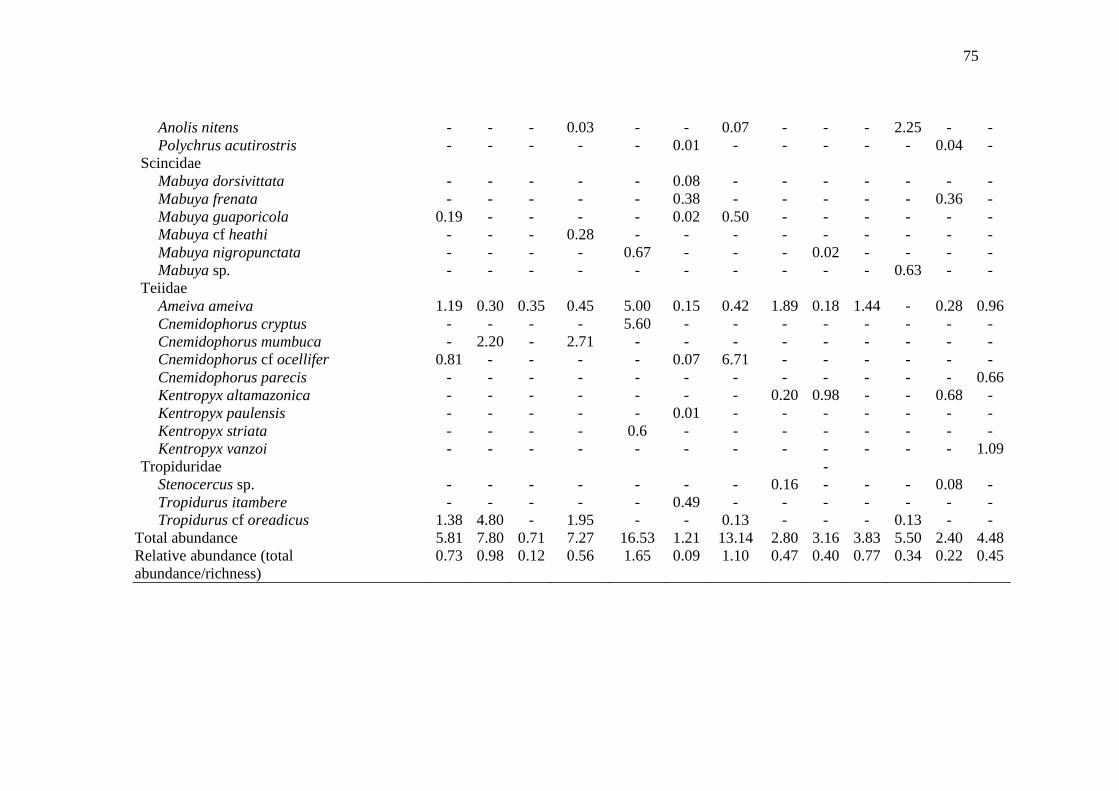
75
Anolis nitens - - - 0.03 - - 0.07 - - - 2.25 - - Polychrus acutirostris - - - - - 0.01 - - - - - 0.04 -
Scincidae Mabuya dorsivittata - - - - - 0.08 - - - - - - - Mabuya frenata - - - - - 0.38 - - - - - 0.36 - Mabuya guaporicola 0.19 - - - - 0.02 0.50 - - - - - - Mabuya cf heathi - - - 0.28 - - - - - - - - - Mabuya nigropunctata - - - - 0.67 - - - 0.02 - - - - Mabuya sp. - - - - - - - - - - 0.63 - -
Teiidae Ameiva ameiva 1.19 0.30 0.35 0.45 5.00 0.15 0.42 1.89 0.18 1.44 - 0.28 0.96 Cnemidophorus cryptus - - - - 5.60 - - - - - - - - Cnemidophorus mumbuca - 2.20 - 2.71 - - - - - - - - - Cnemidophorus cf ocellifer 0.81 - - - - 0.07 6.71 - - - - - - Cnemidophorus parecis - - - - - - - - - - - - 0.66 Kentropyx altamazonica - - - - - - - 0.20 0.98 - - 0.68 - Kentropyx paulensis - - - - - 0.01 - - - - - - - Kentropyx striata - - - - 0.6 - - - - - - - - Kentropyx vanzoi - - - - - - - - - - - - 1.09
Tropiduridae - Stenocercus sp. - - - - - - - 0.16 - - - 0.08 - Tropidurus itambere - - - - - 0.49 - - - - - - - Tropidurus cf oreadicus 1.38 4.80 - 1.95 - - 0.13 - - - 0.13 - -
Total abundance 5.81 7.80 0.71 7.27 16.53 1.21 13.14 2.80 3.16 3.83 5.50 2.40 4.48 Relative abundance (total abundance/richness)
0.73 0.98 0.12 0.56 1.65 0.09 1.10 0.47 0.40 0.77 0.34 0.22 0.45

76
APÊNDICE 2- manuscrito submetido para a publicação na revista Copeia em janeiro de
2005.
Ecology of a Cerrado lizard assemblage in the Jalapão region of Brazil
Daniel O. Mesquita1, Guarino R. Colli1, Frederico G. R. França1 and Laurie J. Vitt2
1Departamento de Zoologia, Instituto de Ciências Biológicas, Universidade de Brasília,
70910-900 Brasília, Distrito Federal, Brazil, Tel/fax: 55-61-307-2092, email:
2Sam Noble Oklahoma Museum of Natural History and Zoology Department, University
of Oklahoma, 2401 Chautauqua Ave., Norman, OK 73072 USA, email: [email protected]
Corresponding author: Daniel Oliveira Mesquita
Manuscript type: major article
Running title: Jalapão lizard assemblage
Key words: assemblage structure, community ecology, historical factors
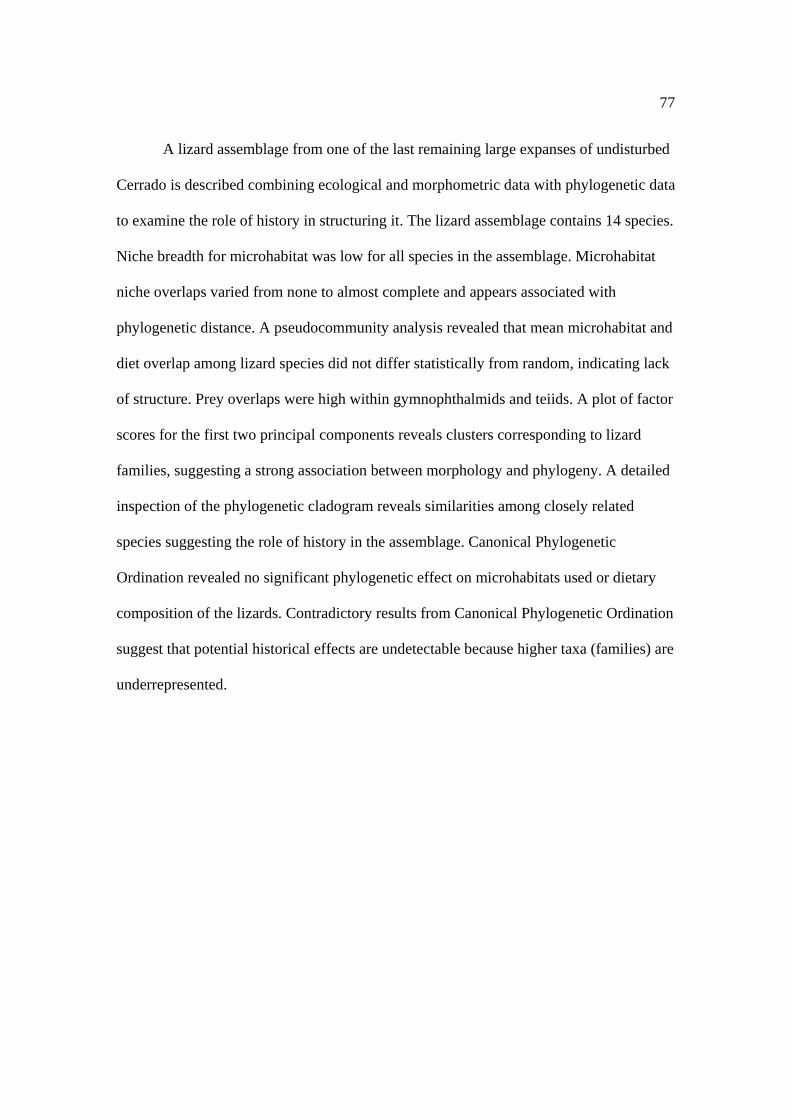
77
A lizard assemblage from one of the last remaining large expanses of undisturbed
Cerrado is described combining ecological and morphometric data with phylogenetic data
to examine the role of history in structuring it. The lizard assemblage contains 14 species.
Niche breadth for microhabitat was low for all species in the assemblage. Microhabitat
niche overlaps varied from none to almost complete and appears associated with
phylogenetic distance. A pseudocommunity analysis revealed that mean microhabitat and
diet overlap among lizard species did not differ statistically from random, indicating lack
of structure. Prey overlaps were high within gymnophthalmids and teiids. A plot of factor
scores for the first two principal components reveals clusters corresponding to lizard
families, suggesting a strong association between morphology and phylogeny. A detailed
inspection of the phylogenetic cladogram reveals similarities among closely related
species suggesting the role of history in the assemblage. Canonical Phylogenetic
Ordination revealed no significant phylogenetic effect on microhabitats used or dietary
composition of the lizards. Contradictory results from Canonical Phylogenetic Ordination
suggest that potential historical effects are undetectable because higher taxa (families) are
underrepresented.
78
Introduction
Structure of animal assemblages is defined by the geographic area where species
live, their ecological interactions, resource use patterns, and evolutionary relationships
among species (Ricklefs and Miller, 1999). Ecological factors (competition and predation
in particular) were deemed the primary determinants of assemblage structure until
recently (Wiens, 1977; Diamond, 1978; Semlitsch, 1987). Although community-level
processes may influence structure of some assemblages (e.g., Spiller and Schoener, 1990;
Spiller and Schoener, 1989; Case and Bolger, 1991), it is becoming increasingly clear
that some ecological differences among syntopic species have their origins deep in the
evolutionary history of clades comprising present-day assemblages (Losos, 1996; Losos,
1994; Vitt et al., 2003).
Several recent studies have demonstrated structure in Neotropical lizard
assemblages. In a lizard assemblage of a Restinga area in the Brazilian state of Rio de
Janeiro, morphometric data distinguished two groups: one of bromeliad lizards and
another of “sandy runners” (Araújo, 1991). In a Caatinga lizard assemblage, similarities
among closely related species suggested that phylogeny contributed to observed structure
(Vitt, 1995). Vitt & Zani (1998a) reached the same conclusion in describing the structure
of a lizard assemblage in a transitional forest in Amazonia. Gainsbury & Colli (2003)
used a null model analyses to assess structure in lizard assemblages from open vegetation
enclaves in the Brazilian state of Rondônia and suggested lack of organization in the
assemblages. In a lizard assemblage in Amazonian Savanna (in Roraima), eight species
sorted into three foraging guilds: herbivores, active foragers, and sit-and-wait foragers
(Vitt and Carvalho, 1995). A Cerrado lizard assemblage near Alto Araguaia, in Mato

79
Grosso State with only nine species contained some species that diverged in microhabitat
use (Tropiduridae and Polychrotidae) and others that appeared to converge in
microhabitat use (Teiidae and Gymnophthalmidae) (Vitt, 1991). However, in Cerrado
and Amazonian Savanna lizard assemblage studies, historical factors were not
considered.
The Cerrado harbors a diverse herpetofauna with numerous endemic species
(Colli et al., 2002) and covers about 2,000,000 km2, 25% of Brazil (Oliveira and Marquis,
2002). It is considered among the most threatened biomes in the world as the result of
anthropogenic activities (Alho and Martins, 1995). Monthly temperatures average 20 to
22°C 1,500-2,000 mm of highly predictable and strongly seasonal precipitation falls
annually, mostly from October to April (Nimer, 1989). The biome includes: forests,
where arboreal species predominate; savannas, with trees and shrubs dispersed in an
herbaceous stratum; and grasslands, with herbaceous species and some shrubs. Tree
trunks are tortuous, with thick corky barks and hard, coriaceous leaves (Ribeiro and
Walter, 1998).
Considering that the Cerrado covers 25% of Brazil, the largest country in South
America, it is surprising that so few studies have focused on lizard assemblages. Lizards
have been shown to be model organisms for ecological research, particularly studies
aimed at understanding patterns of community structure (Huey et al., 1983; Vitt and
Pianka, 1994). The most relevant study on lizard assemblages from the Cerrado was
carried out in Alto Araguaia, Mato Grosso State and the lizard assemblage was
considered depauperate compared with those of other Neotropical biomes (Vitt, 1991).
80
More recent studies have shown that many Cerrado lizard assemblages are nearly as
diverse as Amazonian lizard assemblages (Colli et al., 2002).
Herein, we describe the lizard assemblage from the Jalapão region, one of the last
remaining large expanses of undisturbed Cerrado. We combine ecological and
morphometric data with phylogenetic data to examine the role of history (e. g., Brooks
and McLennan, 1991; Losos, 1996) in structure of this assemblage. Because the Cerrado
is one of the most threatened biomes in world, these data should also be useful in
developing conservation and management strategies for the Cerrado.
Materials and methods
Study site.- Field work was conducted from 13 February to 10 March 2002 in a Cerrado
area in the Jalapão region near the city of Mateiros (10º 32' 46.69'' S, 46º 25' 13.20'' W) in
eastern Tocantins state, Brazil. The Jalapão covers approximately 53,340.90 km2. The
region is characterized by an open and low Cerrado on sandy soils with strong influence
of the Caatinga biome from northeastern Brazil. It has one of the lowest demographic
densities in Brazil, with 1.21 inhabitants per km2, but anthropic pressures are increasing
mainly due to tourism.
Microhabitat and activity, and temperatures.- We captured lizards with pitfall traps with
drift fences, by hand or using a shotgun. In the lab, we killed live lizards with an injection
of Tiopental®, in accordance with approved protocols, and fixed them with 10% formalin.
When we captured lizards by hand or shot gun, we took cloacal, substrate, and air
temperatures (at 5 cm and 1.5 m above ground) to the nearest 0.2 C, with a Miller &
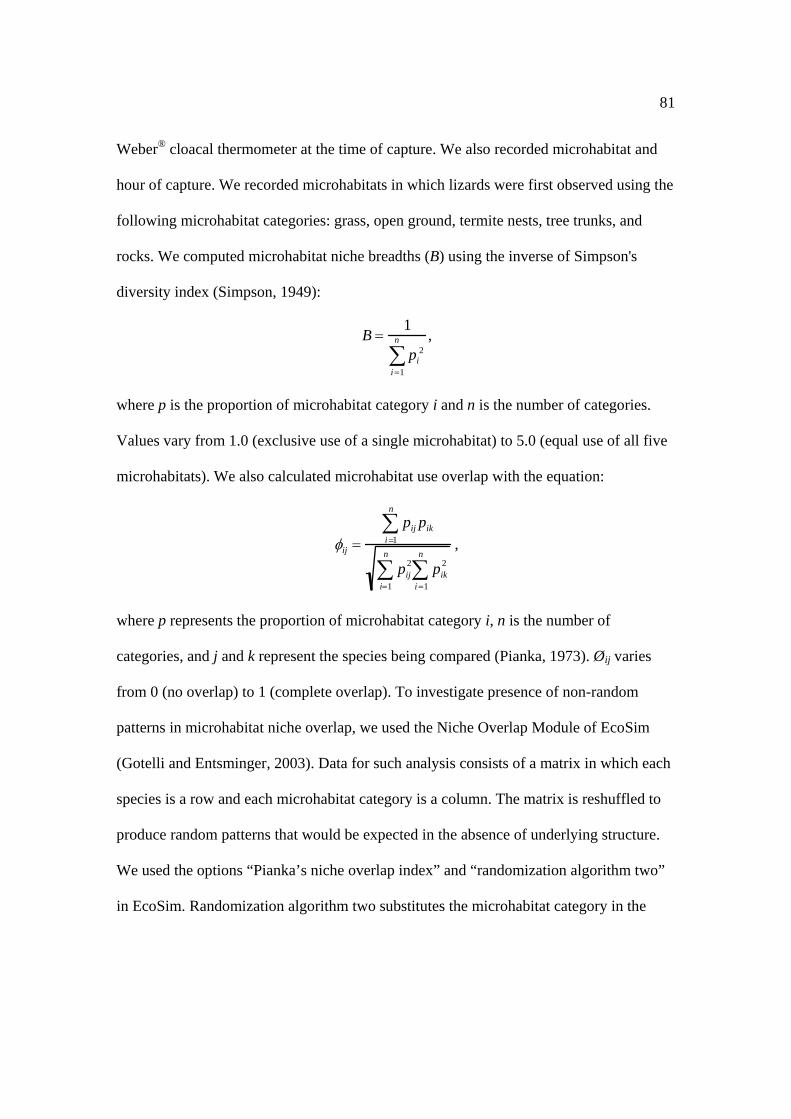
81
Weber® cloacal thermometer at the time of capture. We also recorded microhabitat and
hour of capture. We recorded microhabitats in which lizards were first observed using the
following microhabitat categories: grass, open ground, termite nests, tree trunks, and
rocks. We computed microhabitat niche breadths (B) using the inverse of Simpson's
diversity index (Simpson, 1949):
B =1
pi2
i =1
n
∑,
where p is the proportion of microhabitat category i and n is the number of categories.
Values vary from 1.0 (exclusive use of a single microhabitat) to 5.0 (equal use of all five
microhabitats). We also calculated microhabitat use overlap with the equation:
φij =pij pik
i =1
n
∑
pij2 pik
2
i =1
n
∑i=1
n
∑,
where p represents the proportion of microhabitat category i, n is the number of
categories, and j and k represent the species being compared (Pianka, 1973). Øij varies
from 0 (no overlap) to 1 (complete overlap). To investigate presence of non-random
patterns in microhabitat niche overlap, we used the Niche Overlap Module of EcoSim
(Gotelli and Entsminger, 2003). Data for such analysis consists of a matrix in which each
species is a row and each microhabitat category is a column. The matrix is reshuffled to
produce random patterns that would be expected in the absence of underlying structure.
We used the options “Pianka’s niche overlap index” and “randomization algorithm two”
in EcoSim. Randomization algorithm two substitutes the microhabitat category in the

82
original matrix with a random uniform number between zero and one, but retains the zero
structure in the matrix (Winemiller and Pianka, 1990).
Diet.- We analyzed stomach contents under a stereoscopic microscope, identifying prey
items to level of order, with the exception of ants (Formicidae), which were considered as
a separate prey category. We recorded the length and width (0.01 mm) of intact items
with Mitutoyo® electronic calipers, and estimated prey volume (V) as an ellipsoid:
V =43
πw2
⎛ ⎝
⎞ ⎠
2 l2
⎛ ⎝
⎞ ⎠ ,
where w is prey width and l is prey length. We calculated the numeric and volumetric
percentages of each prey category for pooled stomachs. From these percentages, we
computed niche breadths (B) using the inverse of Simpson's diversity index (Simpson,
1949), as described above except that values for diet niche breadth can vary from 1.0 to
30 (30 prey categories were recognized). Throughout the text we used the average
between numeric and volumetric niche breadths, referred to as diet niche breadth. We
also calculated the percentage of occurrence of each prey category (number of stomachs
containing prey category i, divided by the total number of stomachs). We excluded from
the volumetric analyses prey items that were too fragmented to allow a reliable estimate
of their volumes. To determine relative contribution of each prey category, we calculated
the importance index for pooled stomachs using the following equation:
I =F% + N% + V%
3,
where F% is the percentage of occurrence, N% is the numeric percentage, and V% is the
volumetric percentage.
83
We calculated dietary overlap using the overlap equation as described above for
microhabitat (Pianka, 1973). To investigate presence of non-random patterns in
microhabitat niche overlap, we used “Niche Overlap Module” of EcoSim (Gotelli and
Entsminger, 2003) as described above for microhabitat.
Morphometry.- Using Mitutoyo® electronic calipers, were recorded the following
morphometric variables to the nearest 0.01 mm: snout-vent length (SVL), body width (at
its broadest point); body height (at its highest point), head width (at its broadest point),
head height (at its highest point), head length (from the tip of the snout to the commissure
of the mouth), hind limb length, forelimb length, and tail length (from the cloaca to the
tip of the tail). To maximize availability of data, we estimated intact tail length of lizards
with broken or regenerated tails using a regression equation relating tail length to SVL,
calculated from lizards with intact tails, separately for populations and sexes. We log-
transformed (base 10) all morphometric variables prior to analyses to meet requirements
of normality (Zar, 1998). To partition total morphometric variation between size and
shape variation, we defined body size as an isometric size variable (Rohlf and Bookstein,
1987) following the procedure described by Somers (1986). We calculated an isometric
eigenvector, defined a priori with values equal to p-0.5, where p is the number of variables
(Jolicoeur, 1963). Next, we obtained scores from this eigenvector, hereafter called body
size, by post-multiplying the n by p matrix of log-transformed data, where n is the
number of observations, by the p by 1 isometric eigenvector. To remove the effects of
body size from the log-transformed variables, we used residuals of regression between
body size and each variable. The resultant residuals were used in a principal component
84
analysis to examine size-free morphological variation and to identify the taxonomic level
at which ecological variation among species occurred.
Statistical analysis.- We used SYSTAT 11.0 and SAS 8.1 for Windows, with a
significance level of 5% to reject null hypotheses for statistical hypothesis testing.
Throughout the text, means appear ± 1 SD.
To assess the role of history in structuring the assemblage, we used Canonical
Phylogenetic Ordination (Giannini, 2003) coupled with Monte Carlo permutations
(9,999) in CANOCO 4.5 for Windows. The analysis consists of canonical ordination to
identify divergence points within a reduced tree matrix that best explain ecological
patterns (Giannini, 2003). Because of differences in completeness of data for
microhabitat use and diets, we used two different trees, defined in Figure 1.
Results
Species composition, microhabitat, activity, and body temperatures.- The lizard
assemblage in Jalapão contains 14 species; one iguanid (Iguana iguana), two
polychrotids (Anolis nitens and Polychrus acutirostris), one tropidurid (Tropidurus
“oreadicus”), two gekkonids (Briba brasiliana and Gymnodactylus geckoides), three
teiids (Ameiva ameiva, Cnemidophorus mumbuca and Tupinambis quadrilineatus), three
gymnophthalmids (Colobosaura modesta, Micrablepharus maximiliani and Vanzosaura
rubricauda) and two scincids (Mabuya heathi and Mabuya nigropunctata). Almost all
species are diurnal, with exception of the gekkonids B. brasiliana, which is strictly
nocturnal, and G. geckoides, which is active both during the day and at night. Although

85
we did not find G. geckoides during searches at night, they were abundant in drift fences
that were monitored early in the morning suggesting that they were active outside of
termite nests early in the evening the night before, at night, or early in the morning. A
majority of the lizard fauna occurs in open areas, but a small portion was restricted to
gallery forest. The teiids, gymnophthalmids and scincids are primarily terrestrial, the
iguanid and polychrotids are both terrestrial and arboreal, and the tropidurid is ubiquitous
(Fig. 2).
Ameiva ameiva occurs primarily in open ground and grass microhabitats (Fig. 2),
similar to the other teiids Cnemidophorus mumbuca and Tupinambis quadrilineatus, but
T. quadrilineatus lives only inside gallery forests. Briba brasiliana was observed active
at night. A few individuals were found inactive during the day under loose bark on tree
trunks. Gymnodactylus geckoides was found almost exclusively inside termite nests (Fig.
2). Iguana iguana occurs on the ground and in trees (Fig. 2), in open and forested
habitats, closely associated with watercourses. Mabuya nigropunctata was observed in
open and forested areas, occurring in the open ground microhabitat (Fig. 2).
Micrablepharus maximiliani was collected inside of termite nests (Fig. 2) and in drift
fences, indicating that the termite nests are important to these lizards. Individuals move
on open ground, especially in areas with leaf litter. Tropidurus "oreadicus" was found in
most microhabitats (Fig. 2). Anolis nitens was associated with forested habitats, where it
used the ground and low perches on trees. Polychrus acutirostris lives in trees in open
habitats but descends to the ground to disperse. Because of their cryptic coloration and
behavior, they are difficult to observe. Colobosaura modesta is associated with forested

86
habitats, but also occurs in open areas, on the ground. Vanzosaura rubricauda and M.
heathi were observed in open ground in open areas of Cerrado.
Niche breadth for microhabitat was low for all species in the assemblage. T.
"oreadicus" had the largest (2.22) and C. mumbuca, T. quadrilineatus, M. maximiliani
and M. nigropunctata had the smallest (1.00) niche breath values.
Microhabitat niche overlap varied from none to almost complete (Table 1). The
lowest results for niche overlap were found between species most distant
phylogenetically. I. iguana had intermediate values for niche overlap with most other
species, but probably does not interact with other species because it is more often found
in gallery forests whereas other species are usually found in open Cerrado. The sit-and-
wait forager T. “oreadicus” also had intermediate values of overlap with most other
species, but not M. maximiliani and G. geckoides, which were found nearly exclusively
inside termite nests. However, both of these were also common in drift fences, suggesting
that they frequently move about outside termite nests. Microhabitat overlaps among
active foragers tended to be high for all species combinations.
Lizard activity occurred from 7:00 h to 22:00 h and varied among species.
Usually, sit-and-wait lizards tended to be active earlier than active foragers. For example,
the first active T. “oreadicus” was observed near 8:00 h, whereas the first active A.
ameiva and C. mumbuca were not observed until nearly 10:00 h. Activity of diurnal
lizards ended around 18:00 h and nocturnal lizards initiated activity around 18:00 h. The
latest record was 22:00 h for the gecko B. brasiliana. Because we did not search for
lizards after 22:00 h, their activity period may be longer. The diurnal lizard M.
maximiliani was common in pitfall traps indicating that most activity was during the day.
87
Several found between 18:00 h and 20:00 h were inside termite nests and probably not
active.
Mean body temperatures ranged from 29.1°C in M. maximiliani to 40.0°C in I.
iguana. Because of a high association between body and air temperature (R2 = 0.66, F3,102
= 66.04, P < 0.0001), we removed the effect of air temperature by calculating residuals of
a regression between body and air temperatures and then performed an ANOVA on the
residuals followed by a post-hoc Tukey test. The ANOVA detected significant
differences among species (F4,98 = 11.32, P < 0.0001) and a post-hoc Tukey test
identified two statistically homogeneous groups, one with the teiids A. ameiva and C.
mumbuca and another with G. geckoides, M. maximiliani and T. “oreadicus.”
The pseudocommunity analysis showed that mean microhabitat overlap among
lizard species did not differ statistically from random (P = 0.09), indicating lack of
structure with respect to microhabitat.
Diet composition.- We analyzed contents of 557 stomachs and recognized 30 prey
categories. The percentage of empty stomachs was 8.26% (46). Based on all lizard
species, orthopterans were the most important prey type followed by termites and spiders
(Table 2). The most important prey for A. ameiva were termites (38.78%) and insect
larvae (11.02%); for C. mumbuca, termites (30.96%) and orthopterans (24.51%); for T.
quadrilineatus, plant material (60.42%), mainly fruits, and vertebrates (19.39%), a single
individual of the toad, Bufo granulosus; for T. “oreadicus,” mainly ants (42.29%); for B.
brasiliana, millipedes (42.15%) and mole crickets (34.09%); for G. geckoides, termites
(55.8%); for C. modesta, spiders (33.34%); for M. maximiliani, spiders (21.65%) and
88
homopterans (20.71%); for V. rubricauda, grasshoppers (45.52%) and spiders (34.73%);
for M. heathi, grasshoppers (23.42%) and insect larvae (18.53%); for M. nigropunctata,
termites (50.93%) and spiders (24.69%); and for A. nitens, grasshoppers (43.07%) and
insect larvae (30.73%) (Table 2).
Diet niche breadths calculated from the average between numeric and volumetric
percentages of prey were usually low, with lowest values for T. quadrilineatus (1.89) and
M. nigropunctata (1.99) and the largest values for M. heathi (6.32), A. ameiva (4.81),
Tropidurus oreadicus (4.50) and Micrablepharus maximiliani (4.46).
Prey overlap varied from 0 (B. brasiliana vs. A. nitens, C. modesta, T.
quadrilineatus and V. rubricauda) to 0.991 (V. rubricauda vs. C. modesta) (Table 1).
Tupinambis quadrilineatus had low overlaps with all species, the greatest of which was
with A. ameiva (0.144) (Table 1). Overlaps were high among the gymnophthalmids, the
lowest of which was between M. maximiliani and C. modesta (0.889) and the greatest
between C. modesta and V. rubricauda (0.991) (Table 1). With the exception of T.
quadrilineatus, teiid lizards had high overlaps (Table 1).
A pseudocommunity analysis with all original prey categories showed that mean
diet overlap among lizard species did not differ statistically from random (P = 0.06),
indicating lack of structure.
Morphometry.- The principal component analyses of size-free morphological variables
revealed two factors accounting for 58.5% of the variation (Table 3). The first factor
(33.39%) described a gradient of increasing SVL, as leg length, forelimb length and head
height decrease (Table 3). The second factor (25.11%) describes a gradient of increasing

89
head width and body width and a tail length decreases. The third factor an increasing
head length and a decreasing forelimb length (Table 3). A plot of the average of factor
scores per species for the first two principal components reveals clusters corresponding to
lizard families (Fig. 3).
Historical effects.- A detailed inspection of the cladogram (Fig. 4) reveals several
patterns suggesting the role of history in the Jalapão lizard assemblage. Microhabitats
used by teiids, gymnophthalmids, and scincids were similar, suggesting that at least a
portion of microhabitat use patterns reflect general traits of scleroglossan lizards. The
same occurs with the polychrotids, with species using similar microhabitats. Activity is
very similar among all species except the gekkonids, one of which is nocturnal and the
other crepuscular/nocturnal. Body temperature data indicate that teiid lizards are active at
very similar body temperatures. The teiids also have similar microhabitat niche breadth
values. The two scincids differ in diet niche breadths values.
Monte Carlo permutations (based on 9999 permutations) revealed no significant
phylogenetic effect on microhabitats used or dietary composition of the lizards (Table 4).
Gekkonids (23.72%) and teiids (18.76%) contributed most to dietary variation (Fig. 1),
but even their contributions were not significant (P = 0.199 and 0.240, respectively). For
microhabitat, taxonomic groups that best explained variation were the basal separation
between Iguania and Scleroglossa (Fig. 1), accounting 32.65%, and teid lizards. Neither
of these was significant (P = 0.054 and 0.213 respectively) (Table 4).

90
Discussion
Species composition, microhabitat, activity, and body temperatures.- The first known
survey in a Cerrado area was in Pirassununga municipality, São Paulo State, where only
seven lizard species were found (Vanzolini, 1948). In a Cerrado area near Alto Araguaia,
Mato Grosso State, only nine species were found, leading Vitt (1991) to consider it
depauperate when compared with other South American biomes. The Jalapão site has 14
species. This appears low when compared with other South American biomes like
Amazon forest, which typically has about 25 species (Vitt, 1996; Vitt and Zani, 1996).
When compared with other South American open formations, lizard species richness is
similar or greater, like in Caatinga, Exu municipality area, Pernambuco State, with 18
species (Vitt, 1995) and in an Amazonian savanna, in state of Roraima, with only eight
species (Vitt and Carvalho, 1995). Well-sampled localities in Cerrado average 14 – 25
species (Colli et al., 2002). Most estimates of lizard species diversity in South America
are based on data from numerous sites. Lizard species diversity for the entire Jalapão
region is greater than the 14 species that we report, but this serves well as an estimate of
lizard species diversity at a single site. A preliminary survey recorded 18 species for the
region (Vitt et al., 2002) and recently, more have been added to the list, including a
Cnemidophorus species that is currently being described (unpublished data), enhancing
the importance of the Jalapão region and Cerrado biome based on their biodiversity.
Additional species with secretive habits will undoubtedly be found with additional
surveys.
Difference in time of activity among diurnal species was small. Tropidurid lizards
were active somewhat earlier in the day than teiid lizards, a pattern that appears common
91
in other South American lizard assemblages. For example, various species of Tropidurus
tend to be more active in morning and late afternoon avoiding the hottest hours of the day
(Vitt, 1993; Van Sluys, 1992; Rocha and Bergalo, 1990), whereas teiid lizards tend to be
active primarily during warmer periods near mid-day (Mesquita and Colli, 2003b;
Mesquita and Colli, 2003a; Vitt et al., 1997c). Activity body temperature data are
consistent with differences in activity. Not only do the teiids have higher body
temperatures than the tropidurid in this study, they have higher body temperatures than
all other species in the assemblage. The post-hoc Tukey test on body temperatures
grouped A. ameiva and C. mumbuca together. In all Neotropical lizard assemblages
studied, teiid lizards had the highest body temperatures suggesting that high body
temperatures and associated high activity levels have an historical basis.
With few exceptions, microhabitat niche overlaps in the Jalapão lizard
assemblage tended to be highest among closely related species. Thus, at least some
ecological traits can be traced to ancestors within the phylogeny, suggesting that ongoing
interactions among species do not sufficiently explain observed patterns of resource use
(Losos, 1996; Brooks and McLennan, 1991). Historical effects have been detected in
several Neotropical lizard assemblages, including Amazon forest (Vitt and Zani, 1996;
Vitt and Zani, 1998a) and Caatinga (Vitt, 1995). However, very few studies have been
conducted on lizard assemblages in Neotropical open formations. Lack of structure in
microhabitat overlaps among Jalapão lizards, although unusual (e. g., Winemiller and
Pianka, 1990; Vitt and Carvalho, 1995; Pianka, 1986), may suggest lack of competition
for space; microhabitats may not be limited for these lizards (Connor and Simberloff,
1979). One possible explanation for this finding is that lizard populations are maintained
92
well below carrying capacity by predators. Alternatively, failure to detect microhabitat
structure may result from sampling problems. Microhabitat data for several species were
poor, and additional data might reveal different patterns of microhabitat use. Although
lizards can be easily trapped in Cerrado habitats, they are very difficult to observe while
active making it difficult to accurately quantify microhabitat use.
Diet composition.- With exception of Vanzosaura rubricauda, which ate mainly
grasshoppers and spiders in Jalapão but thysanurans and dermapterans in Caatinga (Vitt,
1995), most species from Jalapão had diets similar to those of different populations or
closely related species from other Neotropical lizard assemblages. These include Ameiva
ameiva (termites and insect larvae) (Vitt and Colli, 1994), Cnemidophorus mumbuca
(termites and orthopterans) (Mesquita and Colli, 2003a; Eifler and Eifler, 1998; Mesquita
and Colli, 2003b), T. quadrilineatus (plant material and vertebrates) (Colli et al., 1998),
Tropidurus “oreadicus” (ants) (Van Sluys, 1993; Van Sluys, 1995; Vitt et al., 1997b),
Gymnodactylus geckoides (termites) (Colli et al., 2003), M. maximiliani (spiders and
homopterans) (Vieira et al., 2000), M. heathi (grasshoppers and insect larvae) (Vitt,
1995), M. nigropunctata (termites and spiders) (Vitt and Blackburn, 1991) and A. nitens
(grasshoppers and insect larvae) (Vitt et al., 2001). These results suggest a historical
origin for diets of the majority of Jalapão lizards. The diet of these lizards appears
conservative with little detectable variation among populations from different places.
Phylogenetic inertia appears more important than ecological interactions in determining
diets of Jalapão lizards (e. g., Brooks and McLennan, 1991; Losos, 1996).

93
The highest dietary overlaps were found within gymnophthalmids, teiids, except
for T. quadrilineatus, and between teiids, the gecko G. geckoides, and the skink M.
nigropunctata. The primary contributor to these high overlaps was the high consumption
of termites in these species. These lizards do not necessarily capture termites in the same
places or at the same times. For example, teiid lizards dig and break into materials
containing termites whereas gymnophthalmids do not. Gymnodactylus geckoides likely
capture termites within the termite nests where they live. Similar differences in temporal
or spatial acquisition of similar prey have been reported by Pianka (1986). High dietary
overlap among closely related species suggests that phylogenetic inertia accounts for a
large portion of dietary similarity among closely related species (Brooks and McLennan,
1991; Losos, 1996). A similar pattern was reported for an assemblage of Neotropical
lizards in central Amazon of Brazil (Vitt et al., 1999). Dietary overlap between M.
nigropunctata and M. heathi was low, suggesting that ecological factors are more
important that historical factors in these species. Because the antiquity of the relationship
between these skinks remains unknown, phylogenetic information will be necessary to
determine the historical basis for the differences (Losos, 1996). Low overlap between T.
quadrilineatus and the other teiids may simply reflect the small sample size for T.
quadrilineatus. However, the large body size of these lizards compared to other teiids and
other species in the assemblage likely contributes to actual differences in diet
(Magnusson and Silva, 1993; Vitt and Zani, 1998a).
Lack of structure found with the pseudocommunity analysis could indicate a lack
of detectable competition among species suggesting that resources are effectively non-
limiting (Connor and Simberloff, 1979). A previous study on fat storage cycles in

94
Amazonia Savanna and Cerrado lizards showed that most species accumulate fat during
dry season when insect availability is low, suggesting that food is not a limiting factor
(Colli et al., 1997). Considering the range of body sizes of lizards in the Jalapão
assemblage, structure may be more affected by prey size than prey type (Vitt and Zani,
1998a). For example, the difference between T. quadrilineatus and other teiids may
simply reflect the difference in the influence of body size on prey size.
Morphometry.- Use of morphological analyses to assess ecological relationships was first
described by Hutchinson (1959). Early attempts to analyze morphological differentiation
in an ecological context were applied to bird assemblages in temperate and subtropical
forests (Schoener, 1965). Morphological analyses are independent of habitat and easily
comparable with other studies (Ricklefs and Miller, 1999). On the other hand,
morphology is relatively fixed (historical) such that morphological analyses might not be
sensitive enough to detect ecological differences when they do exist (Ricklefs and Miller,
1999). Nevertheless, a study carried out on lizards in three different deserts revealed a
reasonable association between morphological and ecological attributes, confirming
patterns revealed by previous ecological studies (Ricklefs et al., 1981). Use of
morphological analyses as a complementary analysis can be particularly useful when
other kinds of data (e.g., microhabitat use data as in this study) are difficult to obtain.
Our data suggest a strong association between morphology and phylogeny, with
closely related species clustered in morphological space. The best evidence for cause and
effect has been among closely related species or populations when habitat shifts have
resulted in morphological change. Closely related tropidurids have differentiated
95
morphologically in response to shifts from a variety of microhabitats in open areas to
rock surfaces surrounded by rainforest (Vitt, 1981; Vitt et al., 1997a). Likewise Anolis
have responded morphologically to microhabitat shifts (Pounds, 1988; Losos et al., 1993;
Losos, 1995). Iguanian lizards in the Jalapão assemblage are not closely related.
Morphological differences among these species evolved in distant ancestors under
different ecological conditions. Anolis nitens and T. “oreadicus,” for example, are quite
similar morphologically and ecologically to their close relatives in other habitats,
suggesting that pre-existing morphological and ecological traits have allowed them to
coexist in the Jalapão lizard assemblage. Gekkonid lizards vary greatly in morphology
(Zug et al., 2001). Geckos in the Jalapão assemblage occupied similar positions in
morphological space, suggesting a strong association between morphology and
phylogeny. Teiids and gymnophthalmids are conservative in body shape but differ
considerably in body size, most likely a consequence of intraguild interactions. Even
though the bauplan appears to be affected very little by ecological interactions, body size
may determine to some extent which species can coexist (Vitt et al., 1998; Vitt and Zani,
1996; Vitt et al., 2000). Most tropical New World skinks of genus Mabuya are
conservative morphologically. Until recently, only a few species had been described.
Recent descriptions of new species indicate that diversity of Mabuya is much greater than
previously thought (Rodrigues, 2000; Rebouças-Spieker, 1981; Ávila-Pires, 1995).
Morphological similarity among Mabuya species also suggests that historical factors may
be more important than local interactions in determining the ecology of these lizards.

96
Historical effects.- An examination of the ecological data with an historical perspective
suggests that phylogenetic history of lizards in the Jalapão area influences assemblage
structure (Fig. 4). Several patterns emerged by plotting ecological traits on the
cladogram. Even that the lack of data on microhabitat use for several species in this
assemblage limits some of our conclusions, the niche breadth and the microhabitat used
by teiids, gymnophthalmids and scincids appear to be similar within families, differing
little among families, suggesting that historical factors may determine patterns of
microhabitat use. In addition, several studies comparing closely related species among
drastically different habitats show that ecological traits of lizards are highly conservative
(Vitt and Colli, 1994; Vitt et al., 1998; Mesquita and Colli, 2003b). For example, four
geographically separated populations of the gymnophthalmid Neusticurus ecpleopus are
nearly identical ecologically even though they differ considerably from other species in
their respective assemblages (Vitt et al., 1998). The same is true for polychrotids with
respect to microhabitats. Among teiid lizards, high body temperatures and activity levels
have a historic origin (see Pianka and Vitt, 2003). Regardless of locality or species, teiid
lizards exhibit similar body temperatures and all are highly active (Vitt et al., 1997c; Vitt
and Colli, 1994; Mesquita and Colli, 2003b).
Diet niche breadth values for the gekkonids and some gymnophytalmids and
teiids also suggest the importance of history. Body size differences among teiids accounts
for some variation in dietary niche data (Vitt et al., 2000). The two scincids had
completely different diet niche breadth values. However, additional phylogenetic data for
the genus will be necessary to confirm whether ecological divergence is historical or the
result of species interactions. Even though the lack of data for several species limit some
97
of our conclusions, data we present are the best for any studied Cerrado lizard
assemblage. The Cerrado biome harbors a diverse saurofauna, but some species are very
difficult to observe while active making it difficult to quantify some ecological aspects.
Some species, like most gymnophthalmids, are commonly collected in drift fences, but
difficult to observe, making it difficult to acquire microhabitat use data. Others, like
Briba brasiliana and some species of Mabuya are difficult to collect even using traps,
biasing dietary data. Finally, the lack of data for some species reflects to a certain extent,
differences in local abundance.
Comparisons of ecological traits of lizards within the Jalapão assemblage and
with closely related species in different assemblages revealed that history played an
important role in most ecological traits of Jalapão lizards. If species interactions
determine ecological traits of Jalapão lizards, then ecological traits should map randomly
on their phylogeny, but this is not the case. This appears contradictory to our results from
the Canonical Phylogenetic Ordination, which detected no significant phylogenetic effect
(although the P value for the node A/F was marginally significant. 0.0541). We offer two
possible explanations for this apparent inconsistency, one of which may have broad
implications.
First, sample size for microhabitat data was either too small or completely
nonexistent for four of the 14 species rendering a portion of the results unreliable. Small
sample sizes for calculation of niche breadth values effectively results in low estimates
potentially falsely creating specialists (see Pianka, 1986). Because of this, overlap values
between these species and others with large sample sizes could be misleading. Even
concluding that data for a species with small sample size might be a reasonable estimate
98
because close relatives in other habitats have similar ecological traits is inherently
circular logic.
Secondly, and more importantly, ecological data sets on depauperate lizard
assemblages may suffer from taxon sampling deficiencies such that real historical effects
are undetectable because major taxa are underrepresented. Only a single species pair, M.
heathi and M. nigropunctata, is represented by more than one species in a genus, and in
this case, the two species are highly divergent ecologically. Mabuya nigropunctata is
widespread in Amazon rainforest entering the Cerrado in gallery forests (Vitt and
Blackburn, 1991; Vitt, 1996). Mabuya heathi is known only from open areas, Caatinga in
particular (Vitt, 1995). Lack of structure in the Jalapão lizard assemblage and the
inability to detect a phylogenetic effect using Canonical Phylogenetic Ordination may
result from a data deficiency in the phylogenetically based ecological analysis.
Phylogenetic effects detected in an Amazonian lizard assemblage by Vitt et al. (1999)
and Giannini (2003) using different analyses was facilitated by a rich lizard fauna and
one that contained several pairs of relatively closely related species. One of the primary
phylogenetic effects found was in tropidurid lizards, in which two closely related species
(Plica plica and P. umbra) were ant specialists. In assemblages with greater numbers of
closely related species, differences in ecological traits should be more easily detectable
even if a portion of those differences is historical. Studies showing rapid ecological and
morphological evolution in closely related Anolis species in the Caribbean suggest this
(Losos et al., 1993; Losos, 1995).
Application of phylogenetic analyses to interpretations of underlying causes of
community organization is in its infancy (e.g.,Webb et al., 2002). Nevertheless, several

99
analyses at the local (e.g., Vitt and Zani, 1998b; Vitt et al., 2000; Giannini, 2003) and one
at the global (Vitt et al., 2003) level indicate that portions of lizard community structure
have an historical base. Because some of the ecological differences among lizard clades
are deeply rooted in evolutionary history, evolutionary and ecological responses of
individual species to changes in assemblage structure and resource abundance and
diversity should vary in a manner predictable to some degree on how closely related
species in different habitats and assemblages respond to such change. Finally,
phylogenetic analyses in which species from different assemblages are combined are
essential to understand the relative importance of ecological and historical factors in
determining structure in lizard assemblages because the probability of detecting historical
effects may be inversely related to the number of species in each major clade.
Acknowledgements
We thank J. P. Caldwell, A. A. Garda and S. F. Balbino for help with the
fieldwork. This work was supported by a doctorate fellowship from Coordenação de
Aperfeiçoamento de Pessoal de Nível Superior – CAPES to DOM and a research
fellowship from Conselho Nacional de Desenvolvimento Científico e Tecnológico -
CNPq to GRC (# 302343/88-1). Conservation International of Brazil and the Division of
Herpetology of the Sam Noble Oklahoma Museum of Natural History funded the field
research.
100
Literature Cited
ALHO, C. J. R., and E. S. MARTINS. 1995. De Grão em Grão, o Cerrado Perde Espaço.
WWF-Fundo Mundial para a Natureza, Brasília.
ARAÚJO, A. F. B. 1991. Structure of a white sand-dune lizard community of coastal
Brazil. Revta. Brasil. Biol. 51:857-865.
ÁVILA-PIRES, T. C. S. 1995. Lizards of Brazilian Amazonia (Reptilia: Squamata).
Zoologische Verhandelingen, Leiden. 1995:3-706.
BROOKS, D. R., and D. A. MCLENNAN. 1991. Phylogeny, Ecology, and Behavior, a
Research Program in Comparative Biology. The University of Chicago Press,
Chicago.
CASE, T. J., and D. T. BOLGER. 1991. The role of interspecific competition in the
biogeography of island lizards. TREE. 6:135-139.
COLLI, G. R., R. P. BASTOS, and A. F. B. ARAÚJO. 2002. The character and dynamics of
the Cerrado herpetofauna, p. 223-241. In: The Cerrados of Brazil: Ecology and
Natural History of a Neotropical Savanna. P. S. Oliveira and R. J. Marquis (eds.).
Columbia University Press, New York, NY.
COLLI, G. R., D. O. MESQUITA, P. V. V. RODRIGUES, and K. KITAYAMA. 2003. The
ecology of the gecko Gymnodactylus geckoides amarali in a neotropical savanna.
J. Herpetol. 37:694-706.
COLLI, G. R., A. K. PÉRES, JR., and H. J. CUNHA. 1998. A new species of Tupinambis
(Squamata: Teiidae) from central Brazil, with analysis of morphological and
genetic variation in the genus. Herpetologica. 54:477-492.

101
COLLI, G. R., A. K. PÉRES, JR., and M. G. ZATZ. 1997. Foraging mode and reproductive
seasonality in tropical lizards. J. Herpetol. 31:490-499.
CONNOR, E. F., and D. SIMBERLOFF. 1979. The assembly of species communities: chance
or competition? Ecology. 60:1132-1140.
DIAMOND, J. M. 1978. Niche shifts and the rediscovery of interspecific competition.
American Scientist. 66:322-331.
EIFLER, D. A., and M. A. EIFLER. 1998. Foraging behavior and spacing patterns of the
lizard Cnemidophorus uniparens. J. Herpetol. 32:24-33.
ESTES, R., K. DE QUEIROZ, and J. GAUTHIER. 1988. Phylogenetic relationships within
Squamata, p. 119-281. In: Phylogenetic Relationships of the Lizard Families.
Essays Commemorating Charles L. Camp. R. Estes and G. Pregill (eds.). Stanford
University Press, Stanford, California.
GAINSBURY, A. M., and G. R. COLLI. 2003. Lizard assemblages from natural Cerrado
enclaves in southwestern Amazonia: the role of stochastic extinctions and
isolation. Biotropica. 35:503-519.
GIANNINI, N. P. 2003. Canonical phylogenetic ordination. Syst. Biol. 52:684-695.
GOTELLI, N. J., and G. L. ENTSMINGER. 2003. EcoSim: Null models software for ecology.
In: Acquired Intelligence Inc. & Kesey-Bear.
http://homepages.together.net/~gentsmin/ecosim.htm, Burlington, VT. 05465.
HUEY, R. B., E. R. PIANKA, and A. SCHOENER. 1983. Lizard Ecology: Studies of a Model
Organism. Harvard University Press, Cambridge, Mass.
HUTCHINSON, G. H. 1959. Homage to Santa Rosalia or why are there so many kinds of
animals? Am. Nat. 95:145-159.
102
JOLICOEUR, P. 1963. The multivariate generalization of the allometry equation.
Biometrics. 19:497-499.
LOSOS, J. B. 1994. Historical contingency and lizard community ecology, p. 319-333. In:
Lizard Ecology: Historical and Experimental Perspectives. L. J. Vitt and E. R.
Pianka (eds.). Princeton University Press, Princeton, New Jersey.
—. 1995. Community evolution in greater antillean Anolis lizards: phylogenetic patterns
and experimental tests. Phil. Trans. R. Soc. London B. 349:69-75.
—. 1996. Phylogenetic perspectives on community ecology. Ecology. 77:1344-1354.
LOSOS, J. B., J. C. MARKS, and T. W. SCHOENER. 1993. Habitat use and ecological
interactions of an introduced and a native species of Anolis lizard on Grand
Cayman, with a review of the outcomes of anole introductions. Oecologia.
95:525-532.
MAGNUSSON, W. E., and E. V. SILVA. 1993. Relative effects of size, season and species
on the diets of some amazonian Savanna lizards. J. Herpetol. 27:380-385.
MESQUITA, D. O., and G. R. COLLI. 2003a. The ecology of Cnemidophorus ocellifer
(Squamata, Teiidae) in a neotropical savanna. J. Herpetol. 37:498-509.
—. 2003b. Geographical variation in the ecology of populations of some Brazilian
species of Cnemidophorus (Squamata, Teiidae). Copeia. 2003:285-298.
NIMER, E. 1989. Climatologia da região centro-oeste, p. 393-421. In: Climatologia do
Brasil. Fundação Instituto Brasileiro de Geografia e Estatística - IBGE, Rio de
Janeiro, Brazil.
OLIVEIRA, P. S., and R. J. MARQUIS. 2002. The Cerrados of Brazil: Ecology and Natural
History of a Neotropical Savanna. Columbia University Press, New York, NY.
103
PIANKA, E. R. 1973. The structure of lizard communities. Annu. Rev. Ecol. Syst. 4:53-74.
—. 1986. Ecology and Natural History of Desert Lizards: Analyses of the Ecological
Niche and Community Structure. Princeton Univ. Press, Princeton, New Jersey.
PIANKA, E. R., and L. J. VITT. 2003. Lizards: Windonws of the Evolution of Diversity.
University of California Press, Los Angeles, CA.
POUNDS, J. A. 1988. Ecomorphology, locomotion, and microhabitat structure: patterns in
a tropical mainland Anolis community. Ecol. Monog. 58:299-320.
REBOUÇAS-SPIEKER, R. 1981. Sobre uma nova espécie de Mabuya da Amazônia
brasileira (Sauria, Scincidae). Papéis Avulsos de Zoologia, São Paulo. 34:161-
163.
RIBEIRO, J. F., and B. M. T. WALTER. 1998. Fitofisionomias do bioma Cerrado, p. 89-166.
In: Cerrado: Ambiente e Flora. S. M. Sano and S. P. Almeida (eds.). EMBRAPA-
CPAC, Planaltina, DF.
RICKLEFS, R. E., D. COCHRAN, and E. R. PIANKA. 1981. A morphological analysis of the
structure of communities of lizards in desert habitats. Ecology. 62:1474-1483.
RICKLEFS, R. E., and G. L. MILLER. 1999. Ecology. Freeman, New York, NY.
ROCHA, C. F. D., and H. G. BERGALO. 1990. Thermal biology and flight distance of
Tropidurus oreadicus (Sauria: Iguanidae) in an area of amazonian Brazil. Eth.
Eco. Evo. 2:263-268.
RODRIGUES, M. T. 2000. A new species of Mabuya (Squamata: Scincidae) from the
semiarid Caatingas of Northeastern Brazil. Papéis Avulsos de Zoologia, São
Paulo. 41:313-328.

104
ROHLF, F. J., and F. L. BOOKSTEIN. 1987. A comment on shearing as a method for "size
correction". Syst. Zool. 36:356-367.
SCHOENER, T. W. 1965. The evolution of bill size differences among sympatric
congeneric species of birds. Evolution. 19:189-213.
SEMLITSCH, R. D. 1987. Relationship of pond drying to the reproductive success of the
salamander Ambystoma talpoideum. Copeia. 1987:61-69.
SIMPSON, E. H. 1949. Measurement of diversity. Nature. 163:688.
SOMERS, K. M. 1986. Multivariate allometry and removal of size with principal
component analysis. Syst. Zool. 35:359-368.
SPILLER, D. A., and T. W. SCHOENER. 1989. Effect of a major predator on grouping of an
orb-weaving spider. J. An. Eco. 58:509-523.
—. 1990. A terrestrial field experiment showing the impact of eliminating top predators
on foliage damage. Nature. 347:469-472.
VAN SLUYS, M. 1992. Aspectos da ecologia do lagarto Tropidurus itambere
(Tropiduridae), em uma área do sudeste do Brasil. Revta. Brasil. Biol. 52:181-
185.
—. 1993. Food habits of the lizard Tropidurus itambere (Tropiduridae) in Southeastern
Brazil. J. Herpetol. 27:347-351.
—. 1995. Seasonal variation in prey choice by the lizard Tropidurus itambere
(Tropiduridae) in Southeastern Brazil. Ciência e Cultura. 47:61-65.
VANZOLINI, P. E. 1948. Notas sobre os ofídios e lagartos da Cachoeira de Emas, no
município de Pirassununga, estado de São Paulo. Revta. Brasil. Biol. 8:377-400.
105
VANZOLINI, P. E., A. M. M. RAMOS-COSTA, and L. J. VITT. 1980. Répteis das Caatingas.
Academia Brasileira de Ciências, Rio de Janeiro, Brasil.
VIEIRA, G. H. C., D. O. MESQUITA, A. K. P. JR, K. KITAYAMA, and G. R. COLLI. 2000.
Natural History: Micrablepharus atticolus. Herpetol. Rev. 31:241-242.
VITT, L. J. 1981. Lizard reproduction: habitat specificity and constraints on relative clutch
mass. Am. Nat. 117:506-514.
—. 1991. An introduction to the ecology of Cerrado lizards. J. Herpetol. 25:79-90.
—. 1993. Ecology of isolated open-formation Tropidurus (Reptilia: Tropiduridae) in
Amazonian lowland rain forest. Can. J. Zool. 71:2370-2390.
—. 1995. The ecology of tropical lizards in the Caatinga of northeast Brazil. Occ. Pap.
Oklahoma Mus. Nat. Hist. 1:1-29.
—. 1996. Biodiversity of Amazonian lizards, p. 89-108. In: Neotropical Biodiversity and
Conservation. A. C. Gibson (ed.). Occasional Publication of the Mildred E.
Mathias Botanical Garden 1, Los Angeles.
VITT, L. J., and D. G. BLACKBURN. 1991. Ecology and life history of the viviparous lizard
Mabuya bistriata (Scincidae) in the Brazilian Amazon. Copeia. 1991:916-927.
VITT, L. J., and J. P. CALDWELL. 1993. Ecological observations on Cerrado lizards in
Rondônia, Brazil. J. Herpetol. 27:46-52.
VITT, L. J., J. P. CALDWELL, G. R. COLLI, A. A. GARDA, D. O. MESQUITA, F. G. R.
FRANÇA, and S. F. BALBINO. 2002. Um guia fotográfico dos répteis e anfíbios da
região do Jalapão no Cerrado brasileiro. Spec. Pub. Herp. 1:1-17.
VITT, L. J., J. P. CALDWELL, P. A. ZANI, and T. A. TITUS. 1997a. The role of habitat shift
in the evolution of lizard morphology: evidence from tropical Tropidurus.
106
Proceedings of the National Academy of Sciences of the United States of
America. 94:3828-3832.
VITT, L. J., and C. M. CARVALHO. 1995. Niche partitioning in a tropical wet season:
lizards in the Lavrado area of Northern Brazil. Copeia. 1995:305-329.
VITT, L. J., and G. R. COLLI. 1994. Geographical ecology of a neotropical lizard: Ameiva
ameiva (Teiidae) in Brazil. Can. J. Zool. 72:1986-2008.
VITT, L. J., and E. R. PIANKA. 1994. Lizard Ecology. Princeton University Press,
Princeton.
VITT, L. J., E. R. PIANKA, W. E. COOPER, JR., and K. SCHWENK. 2003. History and the
global ecology of squamate reptiles. Am. Nat. 162:44-60.
VITT, L. J., S. S. SARTORIUS, T. C. S. ÁVILA-PIRES, and E. C. ESPOSITO. 2001. Life on the
leaf litter: The ecology of Anolis nitens tandai in the brazilian Amazon. Copeia.
2001:401-412.
VITT, L. J., S. S. SARTORIUS, T. C. S. ÁVILA-PIRES, M. C. ESPÓSITO, and D. B. MILES.
2000. Niche segregation among sympatric Amazonian teiid lizards. Oecologia.
122:410-420.
VITT, L. J., and P. A. ZANI. 1996. Organization of a taxonomically diverse lizard
assemblage in Amazonian Ecuador. Can. J. Zool. 74:1313-1335.
—. 1998a. Ecological relationships among sympatric lizards in a transitional forest in the
Northern Amazon of Brazil. J. Trop. Ecol. 14:63-86.
—. 1998b. Prey use among sympatric lizard species in lowland rain forest of Nicaragua.
J. Trop. Ecol. 14:537-559.
107
VITT, L. J., P. A. ZANI, and T. C. S. ÁVILA-PIRES. 1997b. Ecology of the arboreal
tropidurid lizard Tropidurus (= Plica) umbra in the Amazon region. Can. J. Zool.
75:1876-1882.
VITT, L. J., P. A. ZANI, T. C. S. ÁVILA-PIRES, and M. C. ESPOSITO. 1998. Geographical
ecology of the gymnophthalmid lizard Neusticurus ecpleopus in the Amazon
rainforest. Can. J. Zool. 76:1671-1680.
VITT, L. J., P. A. ZANI, J. P. CALDWELL, M. C. D. ARAUJO, and W. E. MAGNUSSON.
1997c. Ecology of whiptail lizards (Cnemidophorus) in the amazon region of
Brazil. Copeia. 1997:745-757.
VITT, L. J., P. A. ZANI, and M. C. ESPOSITO. 1999. Historical ecology of Amazonian
lizards: implications for community ecology. Oikos. 87:286-294.
WEBB, C. O., D. D. ACKERLEY, M. A. MCPEEK, and M. J. DONOGHUE. 2002. Phylogenies
and community ecology. Annu. Rev. Ecol. Syst. 33:475-505.
WIENS, J. A. 1977. On competition and variable environments. American Scientist.
65:590-597.
WINEMILLER, K. O., and E. R. PIANKA. 1990. Organization in natural assemblages of
desert lizards and tropical fishes. Ecol. Monog. 60:27-55.
ZAR, J. H. 1998. Biostatistical Analysis. Prentice-Hall, Inc., Englewood Cliffs, New
Jersey.
ZUG, G. R., L. J. VITT, and J. P. CALDWELL. 2001. Herpetology: An Introductory Biology
of Amphibians and Reptiles. Academic Press, San Diego, California.
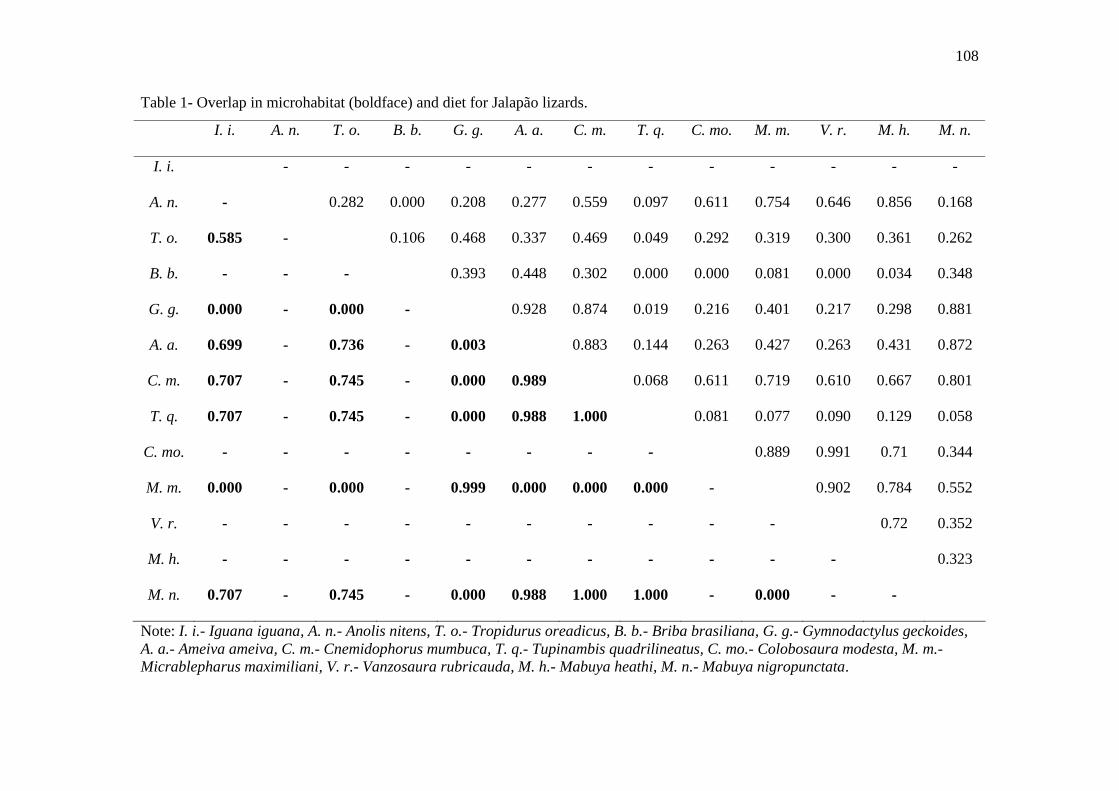
108
Table 1- Overlap in microhabitat (boldface) and diet for Jalapão lizards.
I. i. A. n. T. o. B. b. G. g. A. a. C. m. T. q. C. mo. M. m. V. r. M. h. M. n.
I. i. - - - - - - - - - - - -
A. n. - 0.282 0.000 0.208 0.277 0.559 0.097 0.611 0.754 0.646 0.856 0.168
T. o. 0.585 - 0.106 0.468 0.337 0.469 0.049 0.292 0.319 0.300 0.361 0.262
B. b. - - - 0.393 0.448 0.302 0.000 0.000 0.081 0.000 0.034 0.348
G. g. 0.000 - 0.000 - 0.928 0.874 0.019 0.216 0.401 0.217 0.298 0.881
A. a. 0.699 - 0.736 - 0.003 0.883 0.144 0.263 0.427 0.263 0.431 0.872
C. m. 0.707 - 0.745 - 0.000 0.989 0.068 0.611 0.719 0.610 0.667 0.801
T. q. 0.707 - 0.745 - 0.000 0.988 1.000 0.081 0.077 0.090 0.129 0.058
C. mo. - - - - - - - - 0.889 0.991 0.71 0.344
M. m. 0.000 - 0.000 - 0.999 0.000 0.000 0.000 - 0.902 0.784 0.552
V. r. - - - - - - - - - - 0.72 0.352
M. h. - - - - - - - - - - - 0.323
M. n. 0.707 - 0.745 - 0.000 0.988 1.000 1.000 - 0.000 - -
Note: I. i.- Iguana iguana, A. n.- Anolis nitens, T. o.- Tropidurus oreadicus, B. b.- Briba brasiliana, G. g.- Gymnodactylus geckoides, A. a.- Ameiva ameiva, C. m.- Cnemidophorus mumbuca, T. q.- Tupinambis quadrilineatus, C. mo.- Colobosaura modesta, M. m.- Micrablepharus maximiliani, V. r.- Vanzosaura rubricauda, M. h.- Mabuya heathi, M. n.- Mabuya nigropunctata.
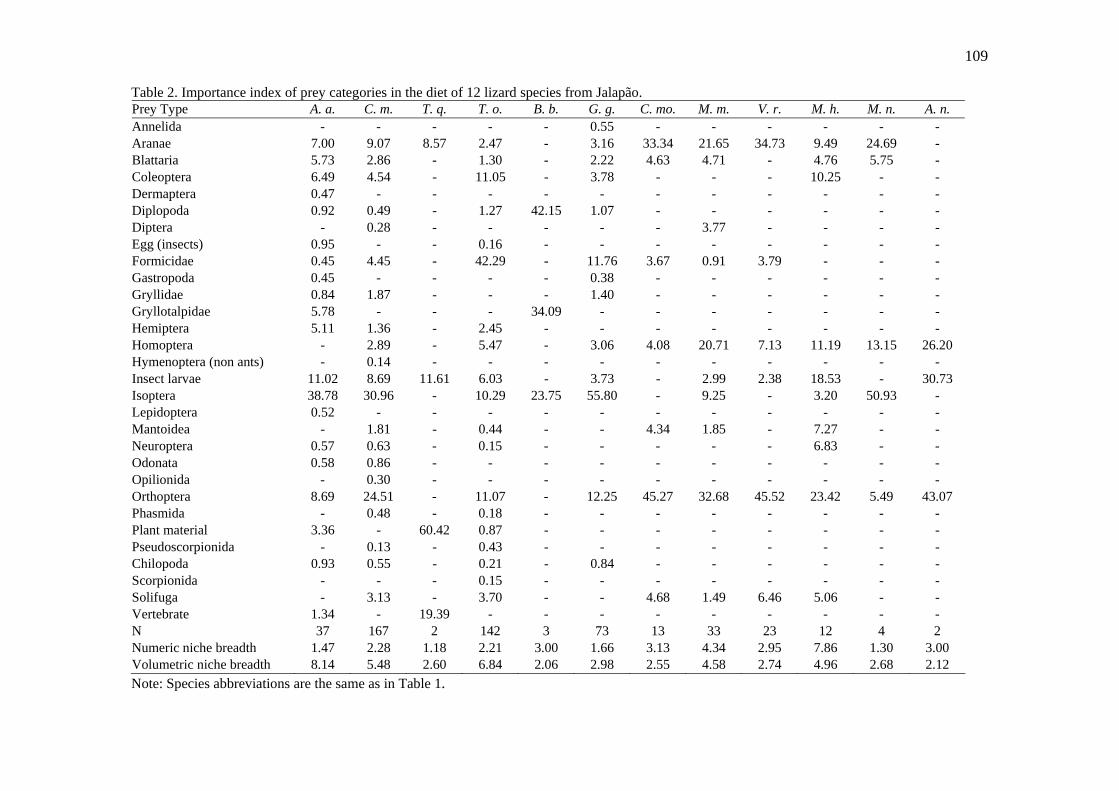
109
Table 2. Importance index of prey categories in the diet of 12 lizard species from Jalapão. Prey Type A. a. C. m. T. q. T. o. B. b. G. g. C. mo. M. m. V. r. M. h. M. n. A. n. Annelida - - - - - 0.55 - - - - - - Aranae 7.00 9.07 8.57 2.47 - 3.16 33.34 21.65 34.73 9.49 24.69 - Blattaria 5.73 2.86 - 1.30 - 2.22 4.63 4.71 - 4.76 5.75 - Coleoptera 6.49 4.54 - 11.05 - 3.78 - - - 10.25 - - Dermaptera 0.47 - - - - - - - - - - - Diplopoda 0.92 0.49 - 1.27 42.15 1.07 - - - - - - Diptera - 0.28 - - - - - 3.77 - - - - Egg (insects) 0.95 - - 0.16 - - - - - - - - Formicidae 0.45 4.45 - 42.29 - 11.76 3.67 0.91 3.79 - - - Gastropoda 0.45 - - - - 0.38 - - - - - - Gryllidae 0.84 1.87 - - - 1.40 - - - - - - Gryllotalpidae 5.78 - - - 34.09 - - - - - - - Hemiptera 5.11 1.36 - 2.45 - - - - - - - - Homoptera - 2.89 - 5.47 - 3.06 4.08 20.71 7.13 11.19 13.15 26.20 Hymenoptera (non ants) - 0.14 - - - - - - - - - - Insect larvae 11.02 8.69 11.61 6.03 - 3.73 - 2.99 2.38 18.53 - 30.73 Isoptera 38.78 30.96 - 10.29 23.75 55.80 - 9.25 - 3.20 50.93 - Lepidoptera 0.52 - - - - - - - - - - - Mantoidea - 1.81 - 0.44 - - 4.34 1.85 - 7.27 - - Neuroptera 0.57 0.63 - 0.15 - - - - - 6.83 - - Odonata 0.58 0.86 - - - - - - - - - - Opilionida - 0.30 - - - - - - - - - - Orthoptera 8.69 24.51 - 11.07 - 12.25 45.27 32.68 45.52 23.42 5.49 43.07 Phasmida - 0.48 - 0.18 - - - - - - - - Plant material 3.36 - 60.42 0.87 - - - - - - - - Pseudoscorpionida - 0.13 - 0.43 - - - - - - - - Chilopoda 0.93 0.55 - 0.21 - 0.84 - - - - - - Scorpionida - - - 0.15 - - - - - - - - Solifuga - 3.13 - 3.70 - - 4.68 1.49 6.46 5.06 - - Vertebrate 1.34 - 19.39 - - - - - - - - - N 37 167 2 142 3 73 13 33 23 12 4 2 Numeric niche breadth 1.47 2.28 1.18 2.21 3.00 1.66 3.13 4.34 2.95 7.86 1.30 3.00 Volumetric niche breadth 8.14 5.48 2.60 6.84 2.06 2.98 2.55 4.58 2.74 4.96 2.68 2.12 Note: Species abbreviations are the same as in Table 1.
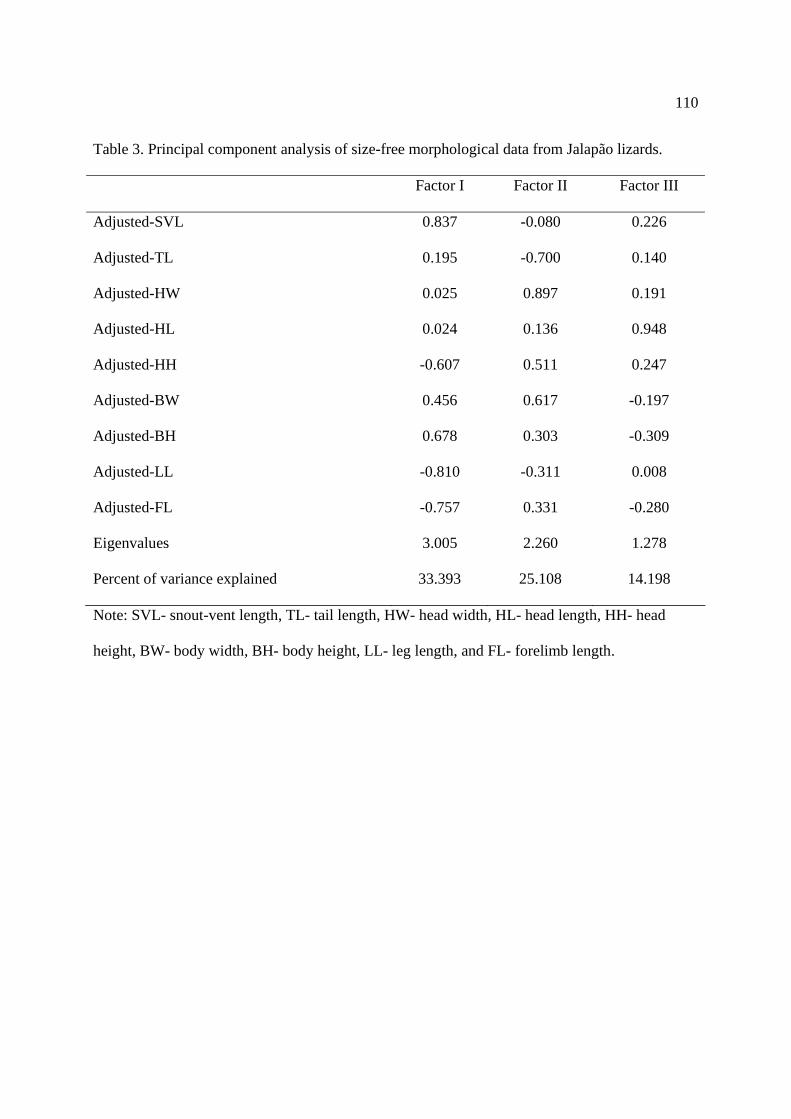
110
Table 3. Principal component analysis of size-free morphological data from Jalapão lizards.
Factor I Factor II Factor III
Adjusted-SVL 0.837 -0.080 0.226
Adjusted-TL 0.195 -0.700 0.140
Adjusted-HW 0.025 0.897 0.191
Adjusted-HL 0.024 0.136 0.948
Adjusted-HH -0.607 0.511 0.247
Adjusted-BW 0.456 0.617 -0.197
Adjusted-BH 0.678 0.303 -0.309
Adjusted-LL -0.810 -0.311 0.008
Adjusted-FL -0.757 0.331 -0.280
Eigenvalues 3.005 2.260 1.278
Percent of variance explained 33.393 25.108 14.198
Note: SVL- snout-vent length, TL- tail length, HW- head width, HL- head length, HH- head
height, BW- body width, BH- body height, LL- leg length, and FL- forelimb length.
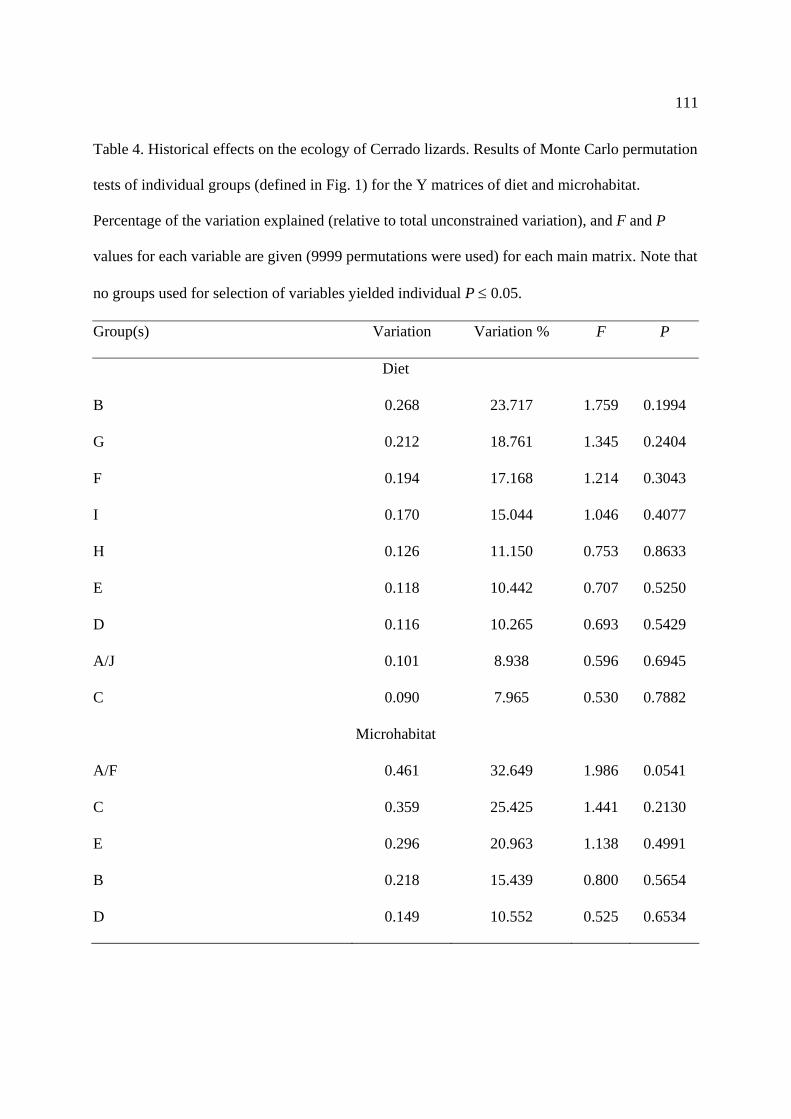
111
Table 4. Historical effects on the ecology of Cerrado lizards. Results of Monte Carlo permutation
tests of individual groups (defined in Fig. 1) for the Y matrices of diet and microhabitat.
Percentage of the variation explained (relative to total unconstrained variation), and F and P
values for each variable are given (9999 permutations were used) for each main matrix. Note that
no groups used for selection of variables yielded individual P ≤ 0.05.
Group(s) Variation Variation % F P
Diet
B 0.268 23.717 1.759 0.1994
G 0.212 18.761 1.345 0.2404
F 0.194 17.168 1.214 0.3043
I 0.170 15.044 1.046 0.4077
H 0.126 11.150 0.753 0.8633
E 0.118 10.442 0.707 0.5250
D 0.116 10.265 0.693 0.5429
A/J 0.101 8.938 0.596 0.6945
C 0.090 7.965 0.530 0.7882
Microhabitat
A/F 0.461 32.649 1.986 0.0541
C 0.359 25.425 1.441 0.2130
E 0.296 20.963 1.138 0.4991
B 0.218 15.439 0.800 0.5654
D 0.149 10.552 0.525 0.6534
112
FIGURE LEGENDS
Figure 1. Individual groups used in canonical phylogenetic ordination for microhabitat and diet data.
Phylogeny based in Estes et al. (1988).
Figure 2. Frequency distribution of individuals according to microhabitat categories for Jalapão
lizards. Sample sizes are indicated at the top of the bars.
Figure 3. Plot of the average per species of the first two principal components derived from size-free
morphological data for Jalapão lizards.
Figure 4. Phylogeny of Jalapão lizards showing the topology of ecological characteristics.
Abbreviations for habitat are: C = Cerrado, GF = gallery forest, R = rocky field. Abbreviations
for microhabitat are: A = arboreal, OG = open ground, B = bushes, LD = litter-dwelling, S =
saxicolous, TN = termite nest. Abbreviations for activity are: D = diurnal, N = nocturnal, CN =
crepuscular/nocturnal. Note: general microhabitat categories are based on data from this work
and from Vieira et al. (2000), Vitt (1991), Vitt and Caldwell (1993), Vanzolini et al. (1980) and
Ávila-Pires (1995).

113

114
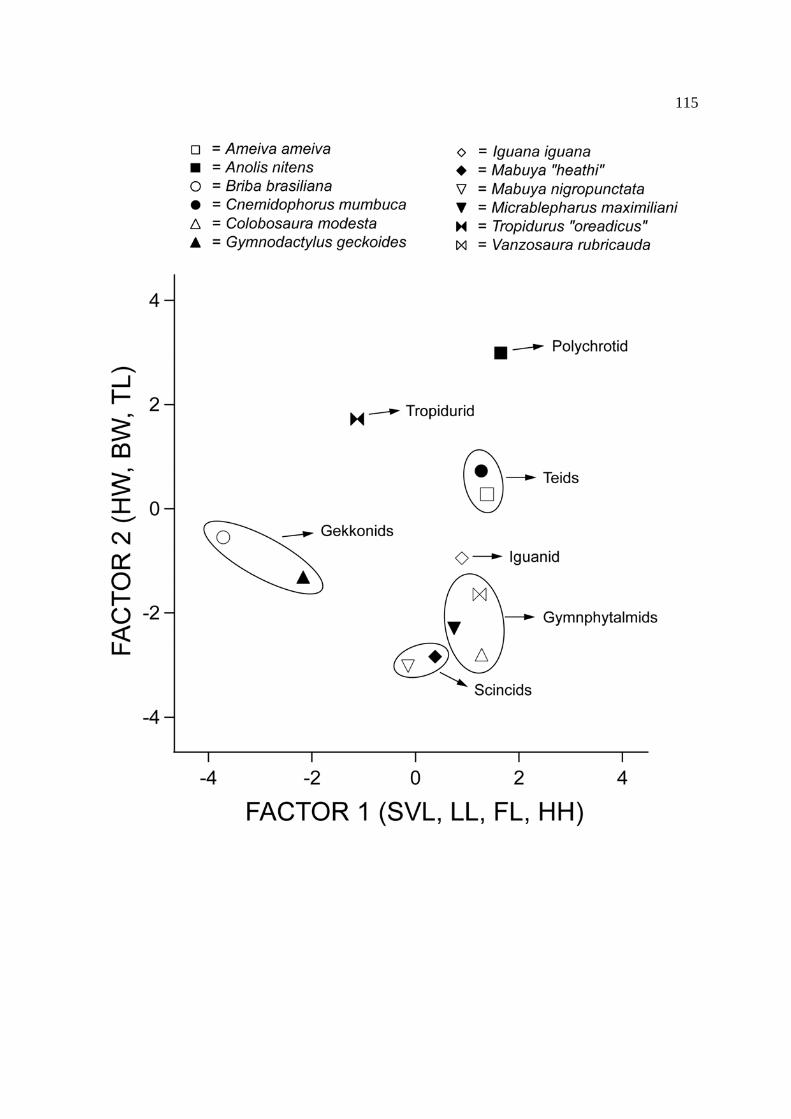
115

116

117
APÊNDICE 3- manuscrito submetido para a publicação na revista Biotropica em fevereiro de
2005.
Ecology of an Amazonian savanna lizard assemblage in Monte Alegre, Pará State, Brazil
Daniel O. Mesquita, Gabriel C. Costa, and Guarino R. Colli
Departamento de Zoologia, Instituto de Ciências Biológicas, Universidade de Brasília, 70910-
900 Brasília, Distrito Federal, Brazil, Tel/fax: 55-61-307-2265 r. 21, email: [email protected]
Corresponding author: Daniel Oliveira Mesquita
Manuscript type: major article
Running title: Amazonian savanna lizard assemblage
Key words: assemblage structure, community ecology, historical factors
118
We describe the lizard assemblage from an Amazonian savanna in the region of Monte
Alegre, Pará, Brazil, using ecological, morphological, and life history data, examining the role of
history in the assemblage. The lizard assemblage in Monte Alegre contained seven species.
Microhabitat niche breadth was low for all species in the assemblage and niche overlap varied
from none to almost complete. The least overlap in microhabitat occurred among more distantly
related species and the greatest overlap occurred among teiids. Lizards were active between 9:00
h to 17:00 h. “Active foraging” lizards tended to be active during the hottest hours of day,
whereas “sit and wait foraging” lizards were more commonly observed later in the day, when
temperatures were lower. Analysis of body temperatures identified two statistically
homogeneous groups, one with teiids and another with the remaining species. Dietary overlap
was highest among teiids. Pseudocommunity analyses showed that neither mean dietary overlap
nor mean microhabitat overlap differed statistically from random, indicating lack of structure.
Factor scores of morphological variables per species reveals clusters corresponding to lizard
families. An examination of ecological traits mapped onto a tree depicting phylogenetic
relationships among species and comparisons with related species from other biomes clearly
indicated the role of history in the Monte Alegre lizard assemblage. This result was corroborated
by Canonical Phylogenetic Ordination analysis.

119
Introduction
An assemblage is a group of closely related species that coexist in a defined area and
assemblage structure may be the result of several factors (Begon et al. 1990, Pianka 1994,
Ricklefs & Miller 1999). Ecologists have traditionally considered that ecological relationships
among taxa were the primary factors in structuring assemblages (Roughgarden & Diamond
1986, Werner 1986, Yodzis 1986); recently, however, more attention has been given to the
importance of historical factors, since ignoring the role of phylogenetic history may result in
equivocal conclusions about the determinants of assemblage structure (Losos 1994, Losos 1996,
Webb et al. 2002).
Divergence along niche axes (e.g., food, time, or microhabitats) among closely related
species is usually viewed as evidence of ecological factors prevailing over historical factors (e.g.,
Pianka 1973). On the other hand, lack of divergence among closely related species suggests that
historical factors prevail over ecological factors (Brooks & McLennan 1991, Losos 1996, Vitt
1995). Likewise, similar patterns of structure in different assemblages suggest that historical
factors predominate, whereas variation in patterns among assemblages indicates the prevalence
of ecological factors (Brooks & McLennan 1991, Cadle & Greene 1993).
Recently, several studies were performed in Neotropical open formations. In Caatinga,
the lizard assemblage was described throughout activity, body temperatures, habitat,
microhabitat and diet data and phylogeny influenced lizard assemblage structure more than
present-day ecological relationships among species (Vitt 1995). In Cerrado, a lizard assemblage
showed microhabitat divergence between tropidurids and polychrotids and overlap between
teiids and gymnophytalmids, but differences in body size promoted divergence in diet (Vitt
1991). In Amazonian Savanna, eight species were grouped into three alimentary guilds:

120
herbivores, active, and sit-and-wait foragers, and the main determinant of guilds was not diet
composition, but prey acquisition mode (Vitt & Carvalho 1995). However, in the Cerrado and
Amazonian Savanna studies, authors failed to consider the influence of historical factors.
During Pleistocene glacial periods, great expanses of the Amazon basin were covered by
savannas, with forest restricted to isolated patches (Ab'Sáber 1982, Bigarella & Andrade-Lima
1982, Eden 1974, Huber 1982). Presumably, Amazonian savannas represent vestiges of a large
savanna that once extended from central Brazil through Guianas (Prance 1978) and now persist
as islands embedded in the Amazon forest (Pires 1973). Eiten (1978) found that Amazonian
savannas were dominated by several common Cerrado plant species, but had low levels of
species diversity and endemism. Amazonian savanna lizard assemblages also show low
diversity, but instead, have high endemism (Ávila-Pires 1995, Colli 1996, Vitt & Carvalho
1995). In addition, Amazonian savannas are still poorly known, are highly threatened by
agricultural expansion, mining, cattle ranching, and fire (Machado et al. 2004, Mesquita 2003),
and are under-represented in conservation units (Cavalcanti 1995). Herein, we describe the lizard
assemblage of an Amazonian savanna, from Monte Alegre region, Pará State, using ecological,
morphological, and life history data and we examine the role of phylogenetic history in
assemblage structure (e. g., Brooks & McLennan 1991, Giannini 2003, Losos 1996).
Materials and methods
Study site.-We conducted field work from 27 November to 18 December 2002 in an Amazonian
savanna near Monte Alegre, northern Pará, Brazil (2º 00' S, 44º 20' W). The region is
characterized by open and low Cerrado-like vegetation (Amazonian savanna) on sandy soil with
rocky areas. Amazonian savannas occur like scattered islands inside the Amazon Forest and
121
cover about 150,000 km2, or 2% of Brazil (Pires 1973). The climate (Aw) is highly seasonal and
annual precipitation averages 1,700 mm (Eidt 1968). The vegetation is dominated by species
typical of the Cerrado, but diversity is lower (Eiten 1978).
Microhabitat and activity, and temperatures.-We captured lizards using drift fences with pitfall
traps, by hand, or using a shotgun. In the lab, we killed live lizards with an injection of
Thiopental® in accordance with approved protocols and preserved them in 10% formalin. When
we captured lizards by hand or gun, we took cloacal, substrate, and air temperatures (at 5 cm and
1.5 m above ground) at the time of capture to the nearest 0.2 C with a Miller & Weber® cloacal
thermometer. We also recorded microhabitat where the lizard was first observed (grass, open
ground, termite nests, tree trunks, or rocks) and the time of capture. We computed microhabitat
niche breadths (B) using the inverse of Simpson's diversity index (Simpson 1949):
B =1
pi2
i =1
n
∑,
where p is the proportion of microhabitat category i and n is the number of categories. Values
vary from 1.0 (exclusive use of a single microhabitat) to 5.0 (equal use of all five microhabitats).
We also calculated microhabitat use overlap with the equation:
φij =pij pik
i =1
n
∑
pij2 pik
2
i =1
n
∑i=1
n
∑,
where p represents the proportion of microhabitat category i, n is the number of categories, and j
and k represent the species being compared (Pianka 1973). Øij varies from 0 (no overlap) to 1
(complete overlap). To investigate the presence of non-random patterns in microhabitat niche
122
overlap, we used the Niche Overlap Module of EcoSim (Gotelli & Entsminger 2003). Data for
such analysis consist of a matrix in which each species is a row and each microhabitat category
is a column. The matrix is reshuffled to produce random patterns that would be expected in the
absence of underlying structure. We used the options “Pianka’s niche overlap index” and
“randomization algorithm two” in EcoSim. Randomization algorithm two substitutes the
microhabitat category in the original matrix with a random uniform number between zero and
one, but retains the zero structure in the matrix (Winemiller & Pianka 1990).
Diet.-We analyzed stomach contents under a stereoscope, identifying prey items to the level of
order, with the exception that ants (Formicidae) were considered a separate category. We
recorded the length and width (to the nearest 0.01 mm) of intact items with Mitutoyo® electronic
calipers and estimated prey volume (V) as an ellipsoid:
V =43
πw2
⎛ ⎝
⎞ ⎠
2 l2
⎛ ⎝
⎞ ⎠ ,
where w is prey width and l is prey length. We calculated the numeric and volumetric
percentages of each prey category for pooled stomachs. From these percentages, we computed
niche breadths (B) using the inverse of Simpson's diversity index (Simpson 1949), as described
above except that values for diet niche breadth can vary from 1.0 to 25 (25 prey categories were
recognized). Throughout the text, we refer to diet niche breadth, which is the average between
numeric and volumetric niche breadths. We also calculated the percent occurrence of each prey
category (number of stomachs containing prey category i divided by the total number of
stomachs). We excluded prey items that were too fragmented to allow a reliable estimate of their
volumes from volumetric analyses. To determine the relative contribution of each prey category,
we calculated an importance index for pooled stomachs using the equation:

123
I =F% + N% + V%
3,
where F% is the percentage of occurrence, N% is the numeric percentage, and V% is the
volumetric percentage.
We calculated dietary overlap using the equation for microhabitat overlap above (Pianka
1973). To investigate the presence of non-random patterns in microhabitat niche overlap, we
used “Niche Overlap Module” of EcoSim (Gotelli & Entsminger 2003) in the same manner
described for microhabitat above.
Morphometry.-Using Mitutoyo® electronic calipers, we recorded the following morphometric
variables to the nearest 0.01 mm: snout-vent length (SVL), body width (at its broadest point),
body height (at its highest point), head width (at its broadest point), head height (at its highest
point), head length (from the tip of the snout to the commissure of the mouth), hind limb length,
forelimb length, and tail length (from the cloaca to the tip of the tail). To maximize availability
of data, we estimated tail length of lizards with broken or regenerated tails using a regression
equation relating tail length to SVL, calculated from lizards with intact tails. We calculated
separate regression equations for sexes. Prior to analysis, we log10-transformed all morphometric
variables to meet requirements of normality (Zar 1998). The transformed morphometric variables
were used in a principal component analysis to examine the morphological variation and to
identify the taxonomic level at which ecological variation among species occurred.
To conduct statistical analyses we used SYSTAT 11.0 and SAS 8.1 for Windows, with a
significance level of 0.05 to reject null hypotheses. Throughout the text, means appear ± 1 SD.
To assess the role of history in assemblage structure, we used Canonical Phylogenetic Ordination
(Giannini 2003) coupled with Monte Carlo permutations (9,999) in CANOCO 4.5 for Windows.
124
The analysis consists of canonical ordination to identify divergence points within a reduced tree
matrix that best explains ecological patterns (Giannini 2003). Because of differences in
completeness of data for microhabitat use and diets, we used two different trees (Figure 1). For
diet, we used the average of the importance index based on individual stomach means and pooled
data.
Results
Species composition, microhabitat, activity, and body temperatures.-The lizard assemblage in
Monte Alegre contained 7 species; one polychrotid (Anolis auratus), one tropidurid (Tropidurus
hispidus), three teiids (Ameiva ameiva, Cnemidophorus cryptus and Kentropyx striata), one
gymnophthalmid (Gymnophthalmus underwoodi) and one scincid (Mabuya nigropunctata). In
the study region, we documented more lizard species, like the forest-dweller gekkonids
Gonatodes humeralis and Thecadactylus rapicauda (pers. comm. Jossehan Frota), the teiid
Tupinambis teguixin, and the iguanid Iguana iguana; however, in this paper, we consider only
the species that occurred in the area of the pitfall traps.
All species in the assemblage are diurnal and typical of open areas, except M.
nigropunctata that also occurs in the forest. The teiid Ameiva ameiva occurred mainly in open
ground and grass microhabitats, like the other teiids Cnemidophorus cryptus and Kentropyx
striata and the scincid Mabuya nigropunctata. Tropidurus hispidus was found almost exclusively
in saxicolous microhabitats. Anolis auratus occurred on the ground and low perches on trees
(Fig. 2).
Niche breadth for microhabitat was low for all species in the assemblage. Anolis auratus
had the largest (2.27) and A. ameiva and T. hispidus had the smallest (1.14 and 1.16,

125
respectively) niche breath values (Fig. 3). Microhabitat niche overlap varied from none to almost
complete (Table 1). The lowest results for niche overlap were found between species most
distant phylogenetically (e.g., between T. hispidus and A. ameiva and between M. nigropunctata
and A. auratus) whereas the greatest overlap occurred among teiids (Table 1). The
pseudocommunity analysis showed that mean microhabitat overlap among lizard species did not
differ statistically from random (P=0.31), indicating lack of assemblage structure with respect to
microhabitat.
Lizards were active from 9:00 h to 17:00 h, but activity times varied among species.
Usually, “active forager” lizards tended to be active during the hottest hours of day. For example,
most teiids and scincids were active between 9:30 h and 13:30 h, whereas the “sit and wait
forager” T. hispidus was active from 10:30 h until 17:00 h.
Mean body temperatures ranged from 28.2°C in Anolis auratus to 41.8°C in Ameiva
ameiva. Because of a high association between body and substrate temperature (R2 = 0.53, F1,93
=102.45, P < 0.0001), we removed the effect of substrate temperature by calculating residuals of
a regression between body and substrate temperatures and then performed an ANOVA on the
residuals followed by post-hoc Tukey tests. The ANOVA detected significant differences among
species (F5,88 = 7.642, P < 0.0001) and post-hoc Tukey tests identified two statistically
homogeneous groups, one containing the teiids and another consisting of the other species (A.
auratus, M. nigropunctata, and T. hispidus).
Diet composition.-We analyzed the contents of 245 stomachs and recognized 25 prey categories.
The percentage of empty stomachs was 6.94 % (n = 17). Based on all lizard species, termites
were the most important prey type followed by orthopterans and spiders. The results based on

126
data from individual and pooled stomachs were similar. The most important prey for A. ameiva
and C. cryptus were termites and spiders; for K. striata, spiders and orthopterans; for T. hispidus,
mainly ants; for M. nigropunctata, orthopterans and beetles; for G. underwoodi, spiders; and for
A. auratus, termites (Table 2).
Diet niche breadths calculated from the average between numeric and volumetric
percentages of prey were usually low, with lowest values for G. underwoodi and A. auratus and
the largest values for A. ameiva and C. cryptus (Table 2). Prey overlap varied from 0.125 (G.
underwoodi vs. T. hispidus) to 0.951 (A. ameiva vs. C. cryptus) (Table 1). Tropidurus hispidus
had low overlap with all other species, with the greatest overlap with C. cryptus (0.422) (Table
1). Overlaps were high among teiids, with the lowest between K. striata and A. ameiva (0.686)
(Table 1). A pseudocommunity analysis with all original prey categories showed that mean diet
overlap among lizard species did not differ statistically from random (P=0.98), indicating lack of
structure.
Morphometry.-The first two factors of the principal component analysis of morphological
variables accounted for 97.46% of the variation (Table 3). The first factor (56.06%) described a
gradient of increasing hind limb length, forelimb length and tail length and decreasing head
height and head length (Table 3). The second factor (41.40%) described a gradient of increasing
body height and body width (Table 3). A plot of the average of factor scores by species for the
first two principal components revealed clusters corresponding to lizard families (Fig. 4).
Historical effects.-A detailed inspection of the cladogram (Fig. 3) reveals several patterns
indicating a role of history in the Monte Alegre lizard assemblage, mainly among Teioidea
127
lizards. Microhabitats, body temperatures, and diet niche breadths of teiids and
gymnophthalmids were similar, suggesting that history plays an important role in determining
the observed pattern. Some differences occurred in niche breadth (diet and microhabitat),
microhabitat use, and body temperature of A. auratus and T. hispidus; however, these species are
not closely related even though they were placed together in the cladogram, which suggests that
differences are not promoted by ecological factors.
Monte Carlo permutations (based on 9,999 permutations) revealed a significant
phylogenetic effect on dietary composition of Teioidea, which accounted for 33.6% of the
dietary variation (Table 4). No significant phylogenetic effects on microhabitats use or dietary
composition were detected in any other clades (Table 4).
Discussion
Species composition, microhabitat, activity, and body temperatures.- Data available on species
richness for Amazonian savannas and isolated Cerrado areas in the Amazon show a great
disparity, varying from two species in Guajará-Mirim, Rondônia State (Gainsbury & Colli 2003),
five in Carajás, Pará State (Cunha et al. 1985), eight in Boa Vista, Roraima State (Vitt &
Carvalho 1995), to nine in Vilhena, Rondônia State (Gainsbury & Colli 2003). Considering all
open-vegetation species collected in Monte Alegre region (9 species), the area harbors one of the
richest lizard faunas from open areas in the Amazon region. The reason for this variation is still
unclear, however, it has been suggested that time of isolation may be a determining factor
(Gainsbury & Colli 2003).
Activity times were similar among species, except for T. hispidus, which was active later
in the day compared to teiid lizards. This pattern appears to be common in other species of

128
Tropidurus, which avoid the hottest hours of the day and are more active early in the morning
and late afternoon (Bergallo & Rocha 1993, Rocha & Bergalo 1990, Vitt et al. 1996). On the
other hand, teiid lizards commonly concentrate their activity during warmer periods near mid-
day (Mesquita & Colli 2003a, Vitt & Colli 1994, Vitt et al. 1993). Furthermore, teiids
maintained higher body temperatures than all other species and temperatures were similar among
them. In most Neotropical lizard assemblages studied previously (see Vieira & Alves 1975, Vitt
1991, Vitt 1995, Vitt & Carvalho 1995), teiid lizards had the highest body temperatures,
suggesting that phylogenetic history plays an important role in the thermal ecology and activity
cycles of these lizards.
In most cases, microhabitat niche overlaps in Monte Alegre lizards were highest among
closely related species, especially teiids. Several other studies also detected a historical effect in
ecological traits, such as microhabitat (Vitt 1995, Vitt & Zani 1996, Vitt et al. 1999).
Additionally, previous studies where ecological traits were mapped on the phylogeny revealed
that present-day interactions cannot explain observed patterns of resource use (Brooks &
McLennan 1991, Losos 1994, Losos 1996). Although structure in microhabitat use was found in
several assemblages (e. g., Pianka 1986, Vitt 1995, Vitt & Carvalho 1995, Winemiller & Pianka
1990), we did not find such structure in Monte Alegre, which indicates a lack of competition for
space. Therefore, microhabitat may not be a limiting for these lizards (see Connor & Simberloff
1979). Because some species were difficult to observe (e.g., gymnophthalmids), microhabitat
data for some species were poor, which may have influenced the results. Additional data could
reveal different patterns of microhabitat use.
129
Diet composition.- Most species from the Monte Alegre lizard assemblage showed similar diet
composition when compared with other conspecific populations, e.g., C. cryptus from
Amazonian savanna area in Amapá State (Mesquita & Colli 2003b), K. striata from Amazonian
savanna area in Roraima (Vitt & Carvalho 1995), M. nigropunctata from Brazilian Amazonia
(Vitt & Blackburn 1991), Tropidurus sp. from open vegetation areas in Rondônia (Vitt 1993),
Gymnophthalmus spp. from Roraima (Vitt & Carvalho 1995), and A. ameiva range wide (Vitt &
Colli 1994). These results emphasize the importance of history in the diet of Monte Alegre
lizards, which regardless of differences in prey availability among localities, ingested similar
prey. One exception to this was A. auratus, which differed in diet composition compared to other
localities (Magnusson et al. 1985, Vitt & Carvalho 1995). In Monte Alegre, A. auratus had a
high proportion of termites in the diet, which is unusual among Anolis (Vitt et al. 2003a, Vitt et
al. 2002, Vitt et al. 2003b, Vitt et al. 2001) and even for iguanian lizards (Vitt et al. 2003c). This
result suggests an important role of ecological factors influencing the diet of this species in
Monte Alegre. Several explanations are possible, including local prey availability, inter-specific
interactions and/or seasonality effects; however, more work is necessary to elucidate this issue.
Overall, when examining diet composition, the Monte Alegre lizard assemblage appears to be
more shaped by phylogenetic inertia than ecological interactions.
The highest dietary overlaps were found within teiids, mainly due to high consumption of
termites, spiders and orthopterans. Arthropod abundance may not be a limiting resource (e. g.,
Colli et al. 1997) and/or differences in foraging mode and home range between these species
allow partitioning of food resources (Pianka 1973, Pianka 1986). Nevertheless, high dietary
overlap among closely related species suggests the influence of phylogeny (Brooks & McLennan
1991, Losos 1996). On the other hand, low dietary overlap among distantly related species, such
130
as T. hispidus vs. K. striata, G. underwoodi vs. T. hispidus, and A. auratus vs. K. striata, cannot
be interpreted as evidence of competition or local scale effects (see Brooks & McLennan 1993,
Harvey & Pagel 1991, Losos 1996). Furthermore, lack of structure found in the
pseudocommunity analysis suggests absence of competition among species (i.e., the resources
may not be limiting) (Connor & Simberloff 1979). Indeed, a previous study on fat storage cycles
in Amazonian Savanna and Cerrado lizards showed that most species accumulate fat bodies
during the dry season when insect availability is lowest, which supports that food is not a
limiting factor (Colli et al. 1997).
Morphometry.- Morphological approaches for assessing ecological relationships have been used
for many years and have several advantages (Ricklefs et al. 1981, Ricklefs & Travis 1980,
Schoener 1965). Although morphology is relatively fixed and consequently not suitable to detect
delicate aspects of the ecology, it is easily comparable with other studies and is useful when
combined with other kinds of data (Ricklefs & Miller 1999).
Our data suggest a strong association between morphology and ecology, with closely
related species grouping together in morphological space, especially teiid lizards. Traditionally,
tropidurids and polychrotids (both iguanians) have a high association between morphology and
ecology, typically evidenced when habitat shifts promote changes in morphology (Losos 1992,
Losos et al. 1994, Pounds 1988, Vitt 1981). Several studies have shown adaptive morphological
differentiation in response to habitat shifts in closely related tropidurids (Vitt 1981, Vitt et al.
1997a) and in Anolis lizards (Losos 1995, Losos et al. 1993, Pounds 1988). The iguanians from
Monte Alegre did not cluster together in morphological space and this could be interpreted as
evidence of morphological differentiation in response to interactions between these lizards.
131
However, iguanians from Monte Alegre are not closely related and this likely explains the
morphological differentiation. Tropidurus hispidus and Anolis auratus are morphologically
similar to their close relatives in other habitats (see Magnusson & Silva 1993, Vitt 1993, Vitt &
Carvalho 1995), suggesting that differences originated long ago in the history of these species.
The morphological similarity among teiid lizards suggests a major influence of history,
whereas the gymnophthalmid plotted far from teiids in morphological space. Teiids and
gymnophthalmids are characterized by a strong similarity in body shape, but differ in body size.
These morphological differences are likely a historical consequence of intraguild interactions
rather than more recent ecological interactions (Vitt et al. 2000, Vitt & Zani 1996, Vitt et al.
1998).
Historical effects.-Like most lizard assemblages from Neotropical savannas, Monte Alegre is
depauperate of closely related species (Vitt 1991, Vitt 1995, Vitt & Carvalho 1995). With the
exception of teiids, species belonged to different families, complicating comparisons to access
the role of historical and local factors on assemblage structure. Nevertheless, the conservative
ecology of most species when examined across different habitats is strong evidence for historical
influence (Brooks & McLennan 1991, Brooks & McLennan 1993, Losos 1996). Among all
Monte Alegre lizards, only Anolis auratus differed in an ecological trait (diet composition)
compared to other populations (Magnusson et al. 1985, Magnusson & Silva 1993, Vitt &
Carvalho 1995), showing that local factors are also important. Anoles have been shown to
respond quickly, even in morphology, to changes in ecological conditions (Losos 1995, Losos et
al. 1993, Pounds 1988). Conversely, scleroglossan lizards tend to have more conservative
ecological traits (Vitt et al. 2003c).

132
An examination of ecological traits mapped on the current phylogenetic hypothesis
clearly shows the role of history in the Monte Alegre lizard assemblage (Fig. 3). This is
particularly evident for Teiioidea (teiids and gymnophthalmids), which showed high similarity in
most ecological traits examined. Studies with these lizards from drastically different habitats
have shown that their ecology is little influenced by local differences, such as environmental and
species interactions, further emphasizing the influence of history in their ecology (Mesquita &
Colli 2003b, Vitt & Colli 1994, Vitt et al. 1998, Vitt et al. 1997b). If present-day interactions
exert more influence on the Monte Alegre lizard assemblage than the history of species, we
would expect ecological traits to map randomly on the phylogeny (see Vitt 1995). The
cladogram, however, revealed the opposite pattern, especially in Teioidea. Canonical
Phylogenetic Ordination detected significant phylogenetic effects in Teioidea when considering
the diet data. However, we found no phylogenetic effect for any other taxa in the assemblage for
diet and no effect in any species when considering microhabitat.
Some caution should be used when interpreting our results. Microhabitat data may be
biased by differences in local abundance. Although most lizard species from Amazonian
savannas are abundant and easy to observe, some did not occur in high abundance or were more
difficult to capture (e.g., gymnophthalmids). On the other hand, assemblages from Amazonian
savannas are depauperate of closely related species. In the Monte Alegre assemblage, historical
effects could be undetectable because major taxa are underrepresented. In more complex
assemblages, with greater numbers of closely related species, historic effects may be more easily
detected. In Amazon forest, a significant phylogenetic effect was detected, primarily in
tropidurid lizards, which are represented by two closely related species, Plica plica and P. umbra

133
(Giannini 2003, Vitt et al. 1999). Finally, the lack of a phylogenetic effect may have resulted
from a data deficiency in the Canonical Phylogenetic Ordination analysis.
Although there are some analyses of niche structure to examine the influences of
historical factors on species interactions, the use of phylogenetically based analyses is not well
established and the nature of forces acting on assemblages remains unclear (see Webb et al.
2002). Previous studies have suggested that ecological differences originated long ago in the
history of species (Losos 1996, Vitt et al. 1999, Webb et al. 2002). In addition, observations on
ecological characteristics of sympatric, closely related species and comparisons among different
assemblages with phylogenetically based analyses are essential to elucidate the relative
importance of ecological and historical factors in structuring assemblages.
Acknowledgments
We thank D. B. Shepard and Tony Gamble for review of a previous version of the
manuscript. This work was supported by a doctorate fellowship from Coordenação de
Aperfeiçoamento de Pessoal de Nível Superior – CAPES to DOM and a research fellowship
from Conselho Nacional de Desenvolvimento Científico e Tecnológico - CNPq to GRC (#
302343/88-1). Fundação O Boticário de Proteção à Natureza funded the field research.
Literature Cited
AB'SÁBER, A. N. 1982. The paleoclimate and paleoecology of Brazilian Amazonia, p. 41-59. In:
Biological Diversification in the Tropics. G. T. Prance (ed.). Columbia University Press,
New York.
134
ÁVILA-PIRES, T. C. S. 1995. Lizards of Brazilian Amazonia (Reptilia: Squamata). Zoologische
Verhandelingen, Leiden. 1995:3-706.
BEGON, M., HARPER, J. L. & TOWNSEND, C. R. 1990. Ecology: Individuals, Populations and
Communities. Blackwell Scientific Publications, Cambridge, Massachusetts.
BERGALLO, H. G. & ROCHA, C. F. D. 1993. Activity patterns and body temperatures of two
sympatric lizards (Tropidurus torquatus and Cnemidophorus ocellifer) with different
foraging tactics in Southeastern Brazil. Amphibia-Reptilia. 14:312-315.
BIGARELLA, J. J. & ANDRADE-LIMA, D. 1982. Paleoenvironmental changes in Brazil, p. 27-40.
In: Biological Diversification in the Tropics. G. T. Prance (ed.). Columbia University
Press, New York.
BROOKS, D. R. & MCLENNAN, D. A. 1991. Phylogeny, Ecology, and Behavior, a Research
Program in Comparative Biology. The University of Chicago Press, Chicago.
BROOKS, D. R. & MCLENNAN, D. A. 1993. Historical ecology: examining phylogenetic
components of community evolution, p. 267-280. In: Species Diversity in Ecological
Communities, Historical and Geographical Perspectives. R. E. Ricklefs & D. Schluter
(eds.). The University of Chicago Press, Chicago, Illinois.
CADLE, J. E. & GREENE, H. W. 1993. Phylogenetic patterns, biogeography, and the ecological
structure of Neotropical snake assemblages, p. 281-293. In: Species Diversity in
Ecological Communities: Historical and Geographical Perspectives. R. E. Ricklefs & D.
Schluter (eds.). University of Chicago Press, Chicagi.
CAVALCANTI, R. B. 1995. Subsídios para o zoneamento ecológico econômico do Amapá: uma
análise das unidades de conservação biológica, http://www.bdt.org.br/amapa/irda/.

135
COLLI, G. R. 1996. Amazonian savanna lizards and the historical biogeography of Amazonia, p.
137. University of California, Los Angeles.
COLLI, G. R., PÉRES, A. K., JR. & ZATZ, M. G. 1997. Foraging mode and reproductive seasonality
in tropical lizards. Journal of Herpetology. 31:490-499.
CONNOR, E. F. & SIMBERLOFF, D. 1979. The assembly of species communities: chance or
competition? Ecology. 60:1132-1140.
CUNHA, O. R., NASCIMENTO, F. P. & ÁVILA-PIRES, T. C. S. 1985. Os répteis da área de Carajás,
Pará, Brasil (Testudines e Squamata). Publicações Avulsas do Museu Paraense Emílio
Goeldi. 40:9-92.
EDEN, M. J. 1974. Paleoclimatic influences and the development of savanna in Southern
Venezuela. Journal of Biogeography. 1:95-109.
EIDT, R. C. 1968. The climatology of South America, p. 54-81. In: Biogeography and Ecology in
South America. Vol. 1. E. J. Fitkau, J. Illies, H. Klinge, G. H. Schwabe & H. Sioli (eds.).
Dr. W. Junk N. V. Publishers, The Hague, Netherlands.
EITEN, G. 1978. Delimitation of the Cerrado concept. Vegetatio. 36:169-178.
ESTES, R., DE QUEIROZ, K. & GAUTHIER, J. 1988. Phylogenetic relationships within Squamata, p.
119-281. In: Phylogenetic Relationships of the Lizard Families. Essays Commemorating
Charles L. Camp. R. Estes & G. Pregill (eds.). Stanford University Press, Stanford,
California.
GAINSBURY, A. M. & COLLI, G. R. 2003. Lizard assemblages from natural Cerrado enclaves in
southwestern Amazonia: the role of stochastic extinctions and isolation. Biotropica.
35:503-519.
GIANNINI, N. P. 2003. Canonical phylogenetic ordination. Systematic Biology. 52:684-695.

136
GOTELLI, N. J. & ENTSMINGER, G. L. 2003. EcoSim: Null models software for ecology. In:
Acquired Intelligence Inc. & Kesey-Bear.
http://homepages.together.net/~gentsmin/ecosim.htm, Burlington, VT. 05465.
HARVEY, P. H. & PAGEL, M. D. 1991. The Comparative Method in Evolutionary Biology.
Oxford Univ. Press, New York.
HUBER, O. 1982. Significance of savanna vegetation in the Amazon Territory of Venezuela, p.
221-244. In: Biological Diversification in the Tropics. G. T. Prance (ed.). Columbia
University Press, New York.
LOSOS, J. B. 1992. The evolution of convergent structure in Caribbean Anolis communities.
Systematic Biology. 41:403-420.
LOSOS, J. B. 1994. Historical contingency and lizard community ecology, p. 319-333. In: Lizard
Ecology: Historical and Experimental Perspectives. L. J. Vitt & E. R. Pianka (eds.).
Princeton University Press, Princeton, New Jersey.
LOSOS, J. B. 1995. Community evolution in greater antillean Anolis lizards: phylogenetic patterns
and experimental tests. Philosophical Transactions of the Royal Society of London B.
349:69-75.
LOSOS, J. B. 1996. Phylogenetic perspectives on community ecology. Ecology. 77:1344-1354.
LOSOS, J. B., IRSCHICK, D. J. & SCHOENER, T. W. 1994. Adaptation and constraint in the
evolution of specialization of Bahamian Anolis lizards. Evolution. 48:1786-1798.
LOSOS, J. B., MARKS, J. C. & SCHOENER, T. W. 1993. Habitat use and ecological interactions of
an introduced and a native species of Anolis lizard on Grand Cayman, with a review of
the outcomes of anole introductions. Oecologia. 95:525-532.

137
MACHADO, R. B., RAMOS NETO, M. B., PEREIRA, P. G. P., CALDAS, E. F., GONÇALVES, D. A.,
SANTOS, N. S., TABOR, K. & STEININGER, M. 2004. Estimativas de perda de área do
Cerrado brasileiro, p. 1-23. Conservation International, Brasília, DF.
MAGNUSSON, W. E., PAIVA, L. J. D., ROCHA, R. M. D., FRANKE, C. R., KASPER, L. A. & LIMA, A.
P. 1985. The correlates of foraging mode in a community of Brazilian lizards.
Herpetologica. 41:324-332.
MAGNUSSON, W. E. & SILVA, E. V. 1993. Relative effects of size, season and species on the diets
of some amazonian Savanna lizards. Journal of Herpetology. 27:380-385.
MESQUITA, D. O. 2003. Herpetofauna das Savanas Amazônicas: subsídios para sua preservação,
http://www.unb.br/ib/zoo/grcolli/alunos/daniel/paginaprincipal.html.
MESQUITA, D. O. & COLLI, G. R. 2003a. The ecology of Cnemidophorus ocellifer (Squamata,
Teiidae) in a neotropical savanna. Journal of Herpetology. 37:498-509.
MESQUITA, D. O. & COLLI, G. R. 2003b. Geographical variation in the ecology of populations of
some Brazilian species of Cnemidophorus (Squamata, Teiidae). Copeia. 2003:285-298.
PIANKA, E. R. 1973. The structure of lizard communities. Annual Review of Ecology and
Systematics. 4:53-74.
PIANKA, E. R. 1986. Ecology and Natural History of Desert Lizards: Analyses of the Ecological
Niche and Community Structure. Princeton Univ. Press, Princeton, New Jersey.
PIANKA, E. R. 1994. Evolutionary Ecology. HarperCollins College Publishers, New York, NY.
PIRES, J. M. 1973. Tipos de vegetação da Amazônia. Publicações Avulsas do Museu Paraense
Emílio Goeldi. 20:179-202.
POUNDS, J. A. 1988. Ecomorphology, locomotion, and microhabitat structure: patterns in a
tropical mainland Anolis community. Ecological Monographs. 58:299-320.

138
PRANCE, G. T. 1978. The origin and evolution of the Amazon flora. Interciencia. 3:207-222.
REEDER, T. W., COLE, C. J. & DESSAUER, H. C. 2002. Phylogenetic relationships of Whiptail
lizards of the genus Cnemidophorus (Squamata: Teiidae): a test of monophyly,
reevaluation of karyotypic evolution, and review of hybrid origins. American Museum
Novitates. 3365:1-61.
RICKLEFS, R. E., COCHRAN, D. & PIANKA, E. R. 1981. A morphological analysis of the structure
of communities of lizards in desert habitats. Ecology. 62:1474-1483.
RICKLEFS, R. E. & MILLER, G. L. 1999. Ecology. Freeman, W H and Company, New York, NY.
RICKLEFS, R. E. & TRAVIS, J. 1980. A morphological approach to the study of avian community
organization. The Auk. 97:321-338.
ROCHA, C. F. D. & BERGALO, H. G. 1990. Thermal biology and flight distance of Tropidurus
oreadicus (Sauria: Iguanidae) in an area of amazonian Brazil. Ethology, Ecology and
Evolution. 2:263-268.
ROUGHGARDEN, J. & DIAMOND, J. M. 1986. Overview: The role of species interactions in
community ecology, p. 333-343. In: Community Ecology. J. Diamond & T. J. Case
(eds.). Harper & Row, Publishers, Inc., New York, NY.
SCHOENER, T. W. 1965. The evolution of bill size differences among sympatric congeneric
species of birds. Evolution. 19:189-213.
SIMPSON, E. H. 1949. Measurement of diversity. Nature. 163:688.
VANZOLINI, P. E., RAMOS-COSTA, A. M. M. & VITT, L. J. 1980. Répteis das Caatingas. Academia
Brasileira de Ciências, Rio de Janeiro, Brasil.
VIEIRA, G. H. C., MESQUITA, D. O., JR, A. K. P., KITAYAMA, K. & COLLI, G. R. 2000. Natural
History: Micrablepharus atticolus. Herpetological Review. 31:241-242.
139
VIEIRA, M. I. & ALVES, M. L. M. 1975. Estudo revisivo de Bothrops neuwiedi pubescens (Cope
1869). Serpentes, Viperidae. Iheringia. 48:57-74.
VITT, L. J. 1981. Lizard reproduction: habitat specificity and constraints on relative clutch mass.
The American Naturalist. 117:506-514.
VITT, L. J. 1991. An introduction to the ecology of Cerrado lizards. Journal of Herpetology.
25:79-90.
VITT, L. J. 1993. Ecology of isolated open-formation Tropidurus (Reptilia: Tropiduridae) in
Amazonian lowland rain forest. Canadian Journal of Zoology. 71:2370-2390.
VITT, L. J. 1995. The ecology of tropical lizards in the Caatinga of northeast Brazil. Occasional
Papers of the Oklahoma Museum of Natural History. 1:1-29.
VITT, L. J., AVILA-PIRES, T. C. S., ESPÓSITO, M. C., SARTORIUS, S. S. & ZANI, P. A. 2003a.
Sharing amazonian rain-forest trees: ecology of Anolis punctatus and Anolis transversalis
(Squamata: Polychrotidae). Journal of Herpetology. 37:276-285.
VITT, L. J., ÁVILA-PIRES, T. C. S., ZANI, P. A. & ESPOSITO, E. C. 2002. Life in the shade: the
ecology of Anolis trachyderma (Squamata: Polychrotidae) in amazonian Ecuador and
Brazil, with comparisons to ecologically similar anoles. Copeia. 2002:275-286.
VITT, L. J., AVILA-PIRES, T. C. S., ZANI, P. A., SARTORIUS, S. S. & ESPÓSITO, M. C. 2003b. Life
above ground: ecology of Anolis fuscoauratus in the Amazon rain forest, and
comparisons with its nearest relatives. Canadian Journal of Zoology. 81:142-156.
VITT, L. J. & BLACKBURN, D. G. 1991. Ecology and life history of the viviparous lizard Mabuya
bistriata (Scincidae) in the Brazilian Amazon. Copeia. 1991:916-927.
VITT, L. J. & CALDWELL, J. P. 1993. Ecological observations on Cerrado lizards in Rondônia,
Brazil. Journal of Herpetology. 27:46-52.
140
VITT, L. J., CALDWELL, J. P., ZANI, P. A. & TITUS, T. A. 1997a. The role of habitat shift in the
evolution of lizard morphology: evidence from tropical Tropidurus. Proceedings of the
National Academy of Sciences of the United States of America. 94:3828-3832.
VITT, L. J. & CARVALHO, C. M. 1995. Niche partitioning in a tropical wet season: lizards in the
Lavrado area of Northern Brazil. Copeia. 1995:305-329.
VITT, L. J. & COLLI, G. R. 1994. Geographical ecology of a neotropical lizard: Ameiva ameiva
(Teiidae) in Brazil. Canadian Journal of Zoology. 72:1986-2008.
VITT, L. J., PIANKA, E. R., COOPER, W. E., JR. & SCHWENK, K. 2003c. History and the global
ecology of squamate reptiles. The American Naturalist. 162:44-60.
VITT, L. J., SARTORIUS, S. S., ÁVILA-PIRES, T. C. S. & ESPOSITO, M. C. 2001. Life on the leaf
litter: The ecology of Anolis nitens tandai in the Brazilian Amazon. Copeia. 2001:401-
412.
VITT, L. J., SARTORIUS, S. S., ÁVILA-PIRES, T. C. S., ESPÓSITO, M. C. & MILES, D. B. 2000.
Niche segregation among sympatric Amazonian teiid lizards. Oecologia. 122:410-420.
VITT, L. J. & ZANI, P. A. 1996. Organization of a taxonomically diverse lizard assemblage in
Amazonian Ecuador. Canadian Journal of Zoology. 74:1313-1335.
VITT, L. J., ZANI, P. A., ÁVILA-PIRES, T. C. S. & ESPOSITO, M. C. 1998. Geographical ecology of
the gymnophthalmid lizard Neusticurus ecpleopus in the Amazon rainforest. Canadian
Journal of Zoology. 76:1671-1680.
VITT, L. J., ZANI, P. A. & CALDWELL, J. P. 1996. Behavioural ecology of Tropidurus hispidus on
isolated rock outcrops in Amazonia. Journal of Tropical Ecology. 12:81-101.
141
VITT, L. J., ZANI, P. A., CALDWELL, J. P., ARAUJO, M. C. D. & MAGNUSSON, W. E. 1997b.
Ecology of whiptail lizards (Cnemidophorus) in the Amazon region of Brazil. Copeia.
1997:745-757.
VITT, L. J., ZANI, P. A., CALDWELL, J. P. & DURTSCHE, R. D. 1993. Ecology of the whiptail lizard
Cnemidophorus deppii on a tropical beach. Canadian Journal of Zoology. 71:2391-2400.
VITT, L. J., ZANI, P. A. & ESPOSITO, M. C. 1999. Historical ecology of Amazonian lizards:
implications for community ecology. Oikos. 87:286-294.
WEBB, C. O., ACKERLEY, D. D., MCPEEK, M. A. & DONOGHUE, M. J. 2002. Phylogenies and
community ecology. Annual Review of Ecology and Systematics. 33:475-505.
WERNER, E. E. 1986. Species interactions in freshwater fish communities, p. 344-357. In:
Community Ecology. J. Diamond & T. J. Case (eds.). Harper & Row, Publishers, Inc.,
New York, NY.
WINEMILLER, K. O. & PIANKA, E. R. 1990. Organization in natural assemblages of desert lizards
and tropical fishes. Ecological Monographs. 60:27-55.
YODZIS, P. 1986. Competition, mortality, and community structure, p. 480-491. In: Community
Ecology. J. Diamond & T. J. Case (eds.). Harper & Row, Publishers, Inc., New York,
NY.
ZAR, J. H. 1998. Biostatistical Analysis. Prentice-Hall, Inc., Englewood Cliffs, New Jersey.

142
Table 1- Overlap in microhabitat (lower half of matrix) and diet (upper half) for Monte Alegre lizards.
A. ameiva C. cryptus K. striata T. hispidus M. nigropunctata G. underwoodi A. auratus
A. ameiva 0.951 0.686 0.226 0.579 0.683 0.748
C. cryptus 0.993 0.709 0.422 0.513 0.716 0.799
K. striata 0.756 0.807 0.132 0.512 0.730 0.193
T. hispidus 0.027 0.105 0.019 0.312 0.125 0.487
M. nigropunctata 0.705 0.696 0.500 0.019 0.187 0.312
G. underwoodi - - - - - 0.286
A. auratus 0.365 0.439 0.853 0.008 0.213 -
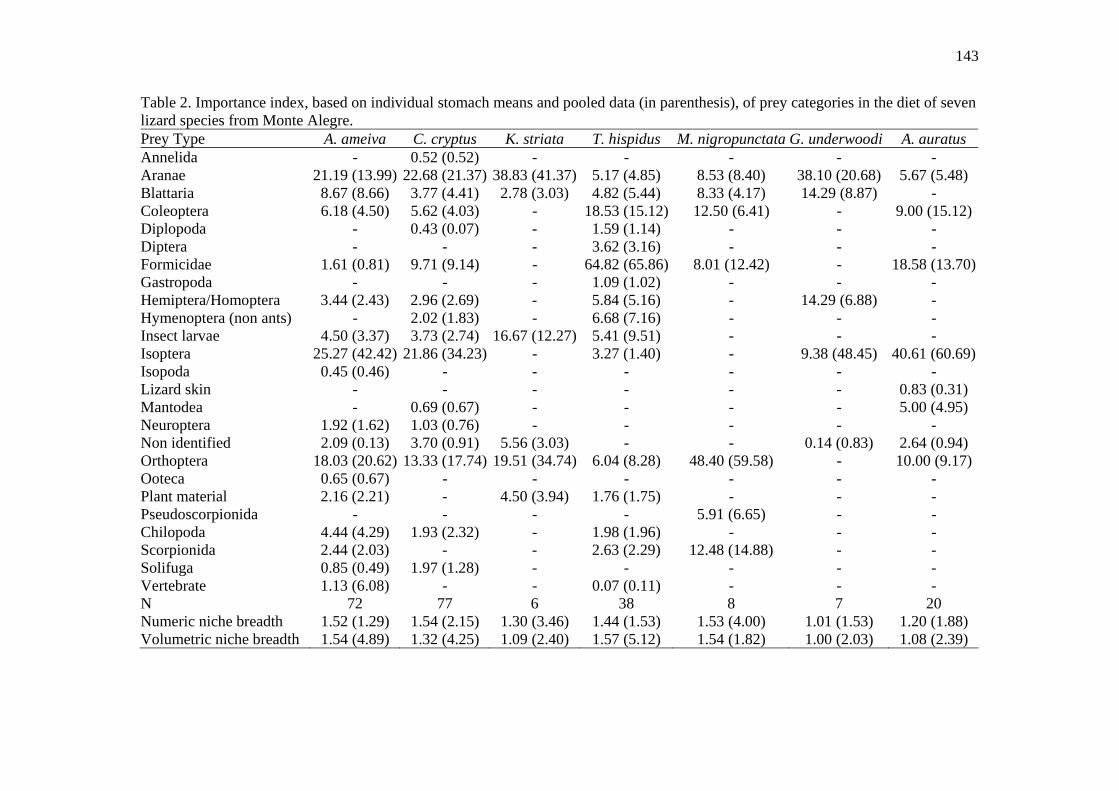
143
Table 2. Importance index, based on individual stomach means and pooled data (in parenthesis), of prey categories in the diet of seven lizard species from Monte Alegre. Prey Type A. ameiva C. cryptus K. striata T. hispidus M. nigropunctata G. underwoodi A. auratus Annelida - 0.52 (0.52) - - - - - Aranae 21.19 (13.99) 22.68 (21.37) 38.83 (41.37) 5.17 (4.85) 8.53 (8.40) 38.10 (20.68) 5.67 (5.48) Blattaria 8.67 (8.66) 3.77 (4.41) 2.78 (3.03) 4.82 (5.44) 8.33 (4.17) 14.29 (8.87) - Coleoptera 6.18 (4.50) 5.62 (4.03) - 18.53 (15.12) 12.50 (6.41) - 9.00 (15.12)Diplopoda - 0.43 (0.07) - 1.59 (1.14) - - - Diptera - - - 3.62 (3.16) - - - Formicidae 1.61 (0.81) 9.71 (9.14) - 64.82 (65.86) 8.01 (12.42) - 18.58 (13.70)Gastropoda - - - 1.09 (1.02) - - - Hemiptera/Homoptera 3.44 (2.43) 2.96 (2.69) - 5.84 (5.16) - 14.29 (6.88) - Hymenoptera (non ants) - 2.02 (1.83) - 6.68 (7.16) - - - Insect larvae 4.50 (3.37) 3.73 (2.74) 16.67 (12.27) 5.41 (9.51) - - - Isoptera 25.27 (42.42) 21.86 (34.23) - 3.27 (1.40) - 9.38 (48.45) 40.61 (60.69)Isopoda 0.45 (0.46) - - - - - - Lizard skin - - - - - - 0.83 (0.31) Mantodea - 0.69 (0.67) - - - - 5.00 (4.95) Neuroptera 1.92 (1.62) 1.03 (0.76) - - - - - Non identified 2.09 (0.13) 3.70 (0.91) 5.56 (3.03) - - 0.14 (0.83) 2.64 (0.94) Orthoptera 18.03 (20.62) 13.33 (17.74) 19.51 (34.74) 6.04 (8.28) 48.40 (59.58) - 10.00 (9.17)Ooteca 0.65 (0.67) - - - - - - Plant material 2.16 (2.21) - 4.50 (3.94) 1.76 (1.75) - - - Pseudoscorpionida - - - - 5.91 (6.65) - - Chilopoda 4.44 (4.29) 1.93 (2.32) - 1.98 (1.96) - - - Scorpionida 2.44 (2.03) - - 2.63 (2.29) 12.48 (14.88) - - Solifuga 0.85 (0.49) 1.97 (1.28) - - - - - Vertebrate 1.13 (6.08) - - 0.07 (0.11) - - - N 72 77 6 38 8 7 20 Numeric niche breadth 1.52 (1.29) 1.54 (2.15) 1.30 (3.46) 1.44 (1.53) 1.53 (4.00) 1.01 (1.53) 1.20 (1.88) Volumetric niche breadth 1.54 (4.89) 1.32 (4.25) 1.09 (2.40) 1.57 (5.12) 1.54 (1.82) 1.00 (2.03) 1.08 (2.39)

144
Table 3. Principal component analysis of log transformed morphological data from Monte
Alegre lizards.
Factor I Factor II Factor III
Snout-vent length 0.373 0.263 0.434
Tail length 0.419 0.160 0.367
Head width -0.226 0.441 -0.039
Head length -0.352 0.307 -0.151
Head height -0.354 0.307 0.012
Body width 0.087 0.494 0.353
Body height 0.048 0.510 0.193
Leg length 0.434 0.089 -0.126
Forelimb length 0.432 0.105 -0.213
Eigenvalues 5.045 3.726 0.0896
Percent of variance explained 56.059 41.405 0.991

145
Table 4. Historical effects on the ecology of Cerrado lizards. Results of Monte Carlo permutation
tests of individual groups (defined in Fig. 1) for diet and microhabitat matrices. Percentage of
variation explained (relative to total unconstrained variation), and F and P values for each
variable are given (9,999 permutations were used) for each main matrix.
Group(s) Variation Variation % F P
Diet
D 0.223 33.635 1.458 0.0426
A/E 0.190 28.658 1.187 0.1899
C 0.162 24.434 0.979 0.4961
B 0.114 17.195 0.650 0.9626
Microhabitat
A/D 0.427 47.870 1.509 0.2031
C 0.301 33.744 0.956 0.6549
B 0.136 15.247 0.382 0.9803
146
FIGURE LEGENDS
Figure 1. Individual groups used in canonical phylogenetic ordination for microhabitat and diet data.
Phylogeny based in Estes et al. (1988) and Reeder et al. (2002).
Figure 2. Frequency distribution of individuals according to microhabitat categories for Monte
Alegre lizards. Sample sizes are indicated at the top of bars.
Figure 3. Phylogeny of Monte Alegre lizards showing the mapping of ecological characteristics.
Abbreviations for habitat are: C = cerrado, GF = gallery forest, R = rocky field. Abbreviations
for microhabitat are: A = arboreal, OG = open ground, B = bushes, LD = litter-dwelling, S =
saxicolous, TN = termite nest. Abbreviations for activity are: D = diurnal, N = nocturnal, CN =
crepuscular/nocturnal. Note: general microhabitat categories are based on data from this work
and from Vieira et al. (2000), Vitt (1991), Vitt and Caldwell (1993), Vanzolini et al. (1980) and
Ávila-Pires (1995).
Figure 4. Plot of species means on first two principal components derived from log-transformed
morphological data for Monte Alegre lizards.
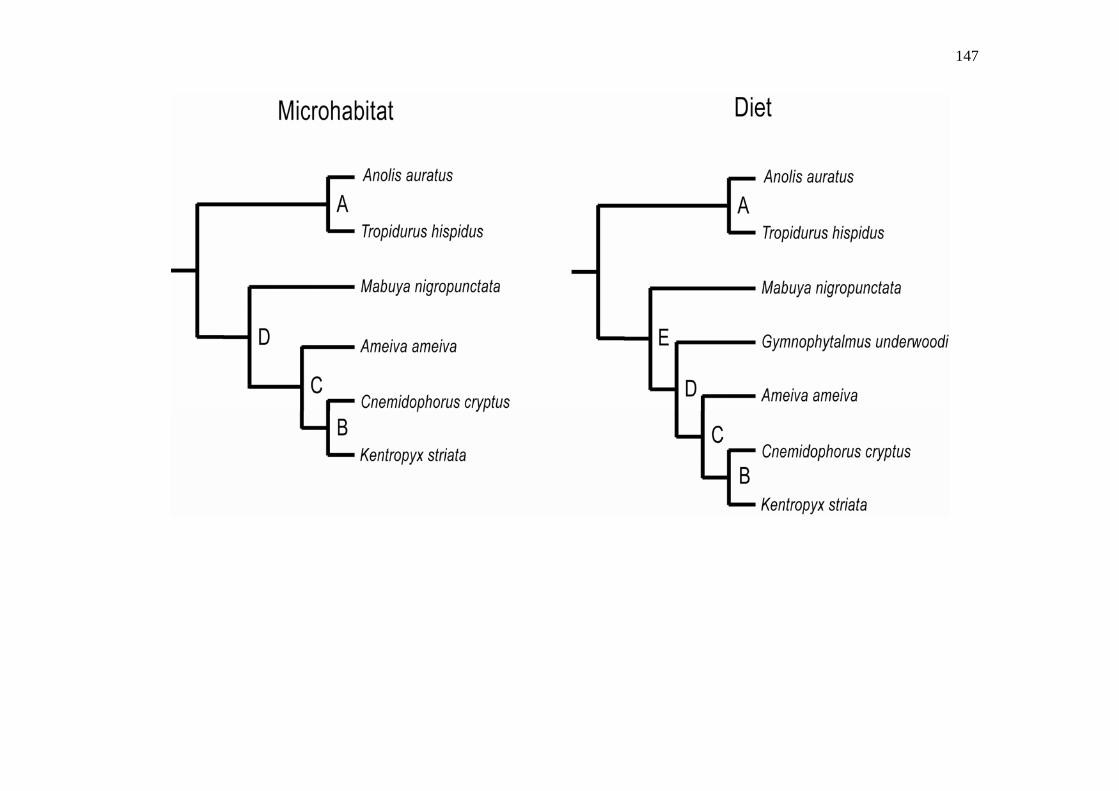
147
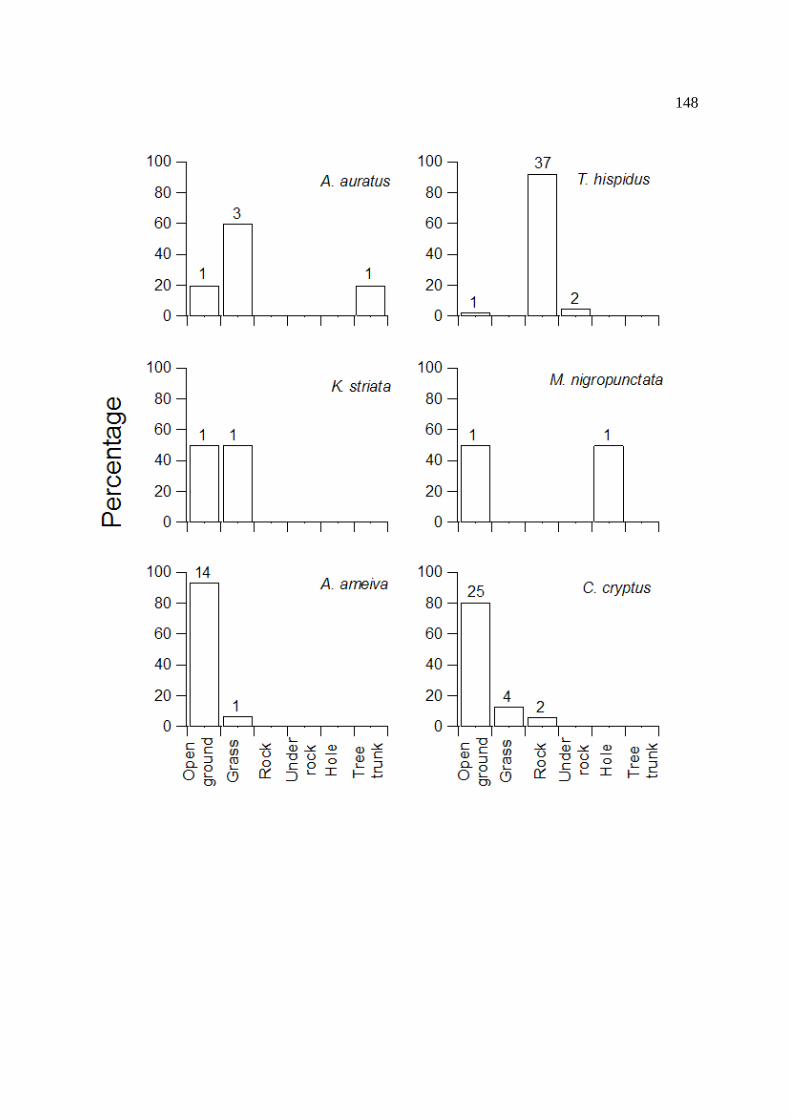
148
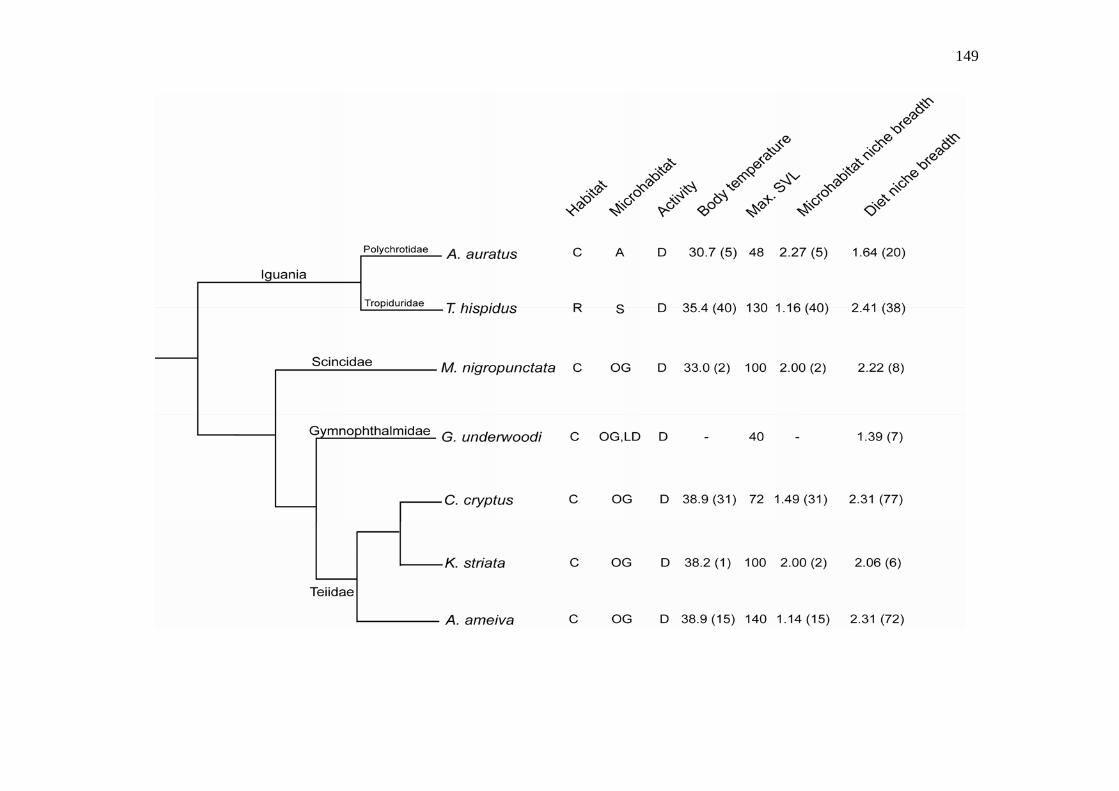
149

150
151
APÊNDICE 4- manuscrito submetido para a publicação na revista Journal of Tropical Ecology em
outubro de 2004.
Lizard species richness and diversity are determined by habitat characteristics at a
microgeographic scale: implications for conservation in the Brazilian Cerrado
Laurie J. Vitt,* Guarino R. Colli,‡ Janalee P. Caldwell,* Daniel O. Mesquita,‡ Adrian A. Garda,*
and Frederico G. R. França‡
*Sam Noble Oklahoma Museum of Natural History, 2401 Chautauqua Ave., Norman, OK
73072-7029, USA
‡ Departamento de Zoologia, Universidade de Brasília, 70910-900 Brasília, DF Brasil
Running head: Habitat structure and lizard diversity
Key words: Brazil, Cerrado, community, conservation, scale, lizard, tropical.
152
We used a pitfall-trap system to determine the relationship of species composition,
species diversity (relative abundance), and community structure to habitat structure in two easily
distinguished and nearly contiguous habitat patches in the Brazilian Cerrado. One habitat patch
was relatively open (no canopy) and the other was relatively closed (partial canopy); they
differed significantly in 5 of 9 habitat variables and the more open habitat maintained higher
microhabitat temperatures throughout the day than did the closed habitat. A PCA on habitat
variables revealed that the closed habitat contained a combination of more fallen logs, burrows,
and leaf litter than the open habitat. A total of 531 individuals of twelve lizard species were
sampled. Species accumulation curves show that after 23 continuous days of sampling, species
numbers asymptote at 10 in the open habitat and 12 in the closed habitat. Lizard community
structure also differs between habitats. A CCA comparing habitat variables at each array with
lizards sampled within the array shows that lizard species are tied to particular microhabitat
characteristics. Our results indicate that variation in habitat structure at small scales can impact
lizard species composition, diversity, and community structure. Moreover, conservation
programs aimed at maintaining natural diversity will by necessity need to consider microhabitats
that individual species use.

153
INTRODUCTION
Identification and protection of areas with high biodiversity require surveys and inventories of
existing flora and fauna. Unfortunately, many large regions, for example, the Brazilian Cerrado
Biome, were transformed from natural habitat to agriculture prior to biotic surveys (see below).
Only patches of undisturbed Cerrado remain today (e.g., Ratter et al. 1997), and it is
undetermined whether intensive surveys of these patches will paint an accurate picture of the
biodiversity that was lost during development. The scale at which plant and animal distributions
are examined can influence conclusions on distributions because habitat structure affects species
distributions at several scales (Hamer & Hill 2000; Levin 2000; Gering et al. 2002; Johnson et
al. 2003). It is well known, for example, that mammals (Lindenmayer et al. 1999), birds (Renjifo
1999; MacFaden & Capen 2002; Rodewald & Yahner 2002; Bennett et al. 2004), reptiles (Rocha
& Bergallo 1997; Bini et al. 2000; Fisher et al. 2002; Marchand & Litvaitis 2004a, b),
amphibians (Welsh & Lind 2002; Guerry & Hunter 2002; Lowe & Bolger 2002) and terrestrial
invertebrates (Bestelmeyer & Wiens 2001; Chust et al. 2003; Summerville et al. 2003) respond
to variation in habitat structure at various scales in a wide variety of environments throughout the
world. We first comment on the threatened nature of the Cerrado Biome, then introduce a study
designed to examine lizard diversity and community structure at a small spatial scale.
Largely because of the Amazon rainforest, the Atlantic rainforest, and the Cerrado, Brazil
shares the lead with Indonesia as one of the top two “megadiversity” countries in the world
(Mittermeier et al. 1997). The Amazon rainforest has received considerable attention and threats
to its biodiversity are well known (Adis & Ribeiro 1989; Hecht & Cockburn 1989; Myers 1980,
1990; Sayer & Whitmore 1991; Skole & Tucker 1993). In contrast, the Cerrado has only
recently become the focus of conservation efforts, yet its biodiversity is more threatened than
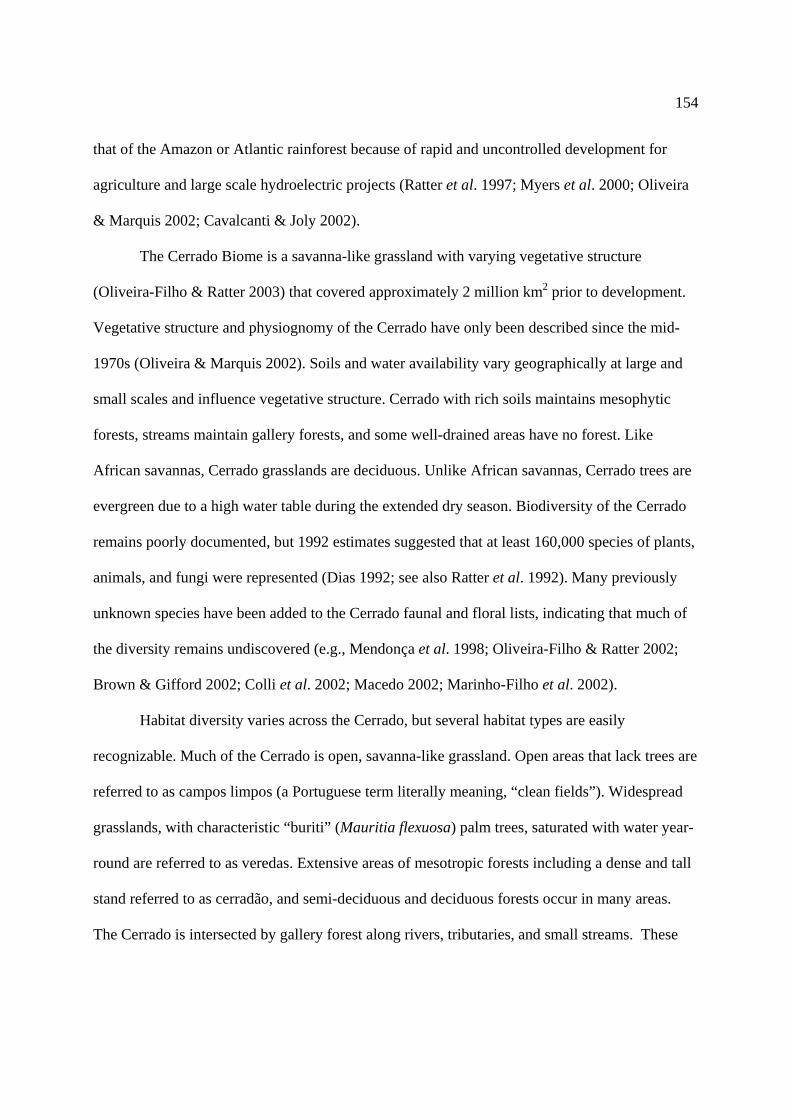
154
that of the Amazon or Atlantic rainforest because of rapid and uncontrolled development for
agriculture and large scale hydroelectric projects (Ratter et al. 1997; Myers et al. 2000; Oliveira
& Marquis 2002; Cavalcanti & Joly 2002).
The Cerrado Biome is a savanna-like grassland with varying vegetative structure
(Oliveira-Filho & Ratter 2003) that covered approximately 2 million km2 prior to development.
Vegetative structure and physiognomy of the Cerrado have only been described since the mid-
1970s (Oliveira & Marquis 2002). Soils and water availability vary geographically at large and
small scales and influence vegetative structure. Cerrado with rich soils maintains mesophytic
forests, streams maintain gallery forests, and some well-drained areas have no forest. Like
African savannas, Cerrado grasslands are deciduous. Unlike African savannas, Cerrado trees are
evergreen due to a high water table during the extended dry season. Biodiversity of the Cerrado
remains poorly documented, but 1992 estimates suggested that at least 160,000 species of plants,
animals, and fungi were represented (Dias 1992; see also Ratter et al. 1992). Many previously
unknown species have been added to the Cerrado faunal and floral lists, indicating that much of
the diversity remains undiscovered (e.g., Mendonça et al. 1998; Oliveira-Filho & Ratter 2002;
Brown & Gifford 2002; Colli et al. 2002; Macedo 2002; Marinho-Filho et al. 2002).
Habitat diversity varies across the Cerrado, but several habitat types are easily
recognizable. Much of the Cerrado is open, savanna-like grassland. Open areas that lack trees are
referred to as campos limpos (a Portuguese term literally meaning, “clean fields”). Widespread
grasslands, with characteristic “buriti” (Mauritia flexuosa) palm trees, saturated with water year-
round are referred to as veredas. Extensive areas of mesotropic forests including a dense and tall
stand referred to as cerradão, and semi-deciduous and deciduous forests occur in many areas.
The Cerrado is intersected by gallery forest along rivers, tributaries, and small streams. These
155
waters drain into the Amazon Basin (e.g., Rio Araguaia, Rio Tocantins, Rio Xingu, Rio
Tapajós), the Pantanal (e.g., Rio Cuiabá, Rio Taquari), the western drainages of the Rio
Paranaíba, or the Rio São Francisco. Scattered throughout the Cerrado are sandstone and
limestone rock outcrops that contain vegetation and faunal elements similar to those of the semi-
arid Caatinga to the northeast. Similar rock outcrops are scattered across the northern and
southern Amazon.
Estimates of habitat loss vary for the Cerrado. As early as 1994, Dias (1994) reported that
41% of Cerrado was used for cattle grazing and 37% had been converted to agriculture; thus, the
only patches of undisturbed Cerrado comprised about 22% of its original area. Satellite imagery
from 1993 indicated that 67% of Cerrado was either highly modified or disturbed (Mantovani &
Pereira 1998). Development for cattle grazing usually involves clearing natural vegetation and
planting non-native grasses, which has an impact similar to clearing and planting crops. The
most recent estimate is that about 80% of the Cerrado has been impacted by humans, resulting in
its inclusion as one of the world’s 25 principal “hotspots” (Myers et al. 2000; Cavalcanti & Joly
2002). “Hotspots” are defined by Myers et al. (2000) based on two primary criteria: endemism
and degree of threat. According to these authors, only 20% (356,630 km2) of the Cerrado
remains as primary vegetation and only 6.2% (22,000 km2) is protected.
Several integrated analyses organized by federal agencies in Brazil have painted a much
more dismal view of what remains of this once vast habitat (e.g., Santos & Câmara 2000,
Rambaldi & Oliveira 2003). Scattered across a virtual sea of agriculture (e.g., soy, corn, and
cotton) and pasture (e.g., cattle, goats) are relictual patches of natural Cerrado vegetation. Major
rivers have been dammed resulting in total loss of gallery forest in many areas. Two large dams
on the Rio Tocantins, the Serra da Mesa (1800 km2) and the Luis Eduardo Magalhães (600 km2)

156
hydroelectric facilities, have been constructed in the last six years, and three others are planned
for the next decade (Secretaria do Planejamento e Meio Ambiente, 1999). The Rio São Francisco
may be redirected due to a highly controversial development program currently under
consideration (Mamede et al. 2002). The region is already known to contain endangered bird
species (Braz et al. 2003), and changes in drainage will undoubtedly adversely affect many
species that rely on gallery forest as dispersal corridors. We know from recent surveys that 1) the
herpetofauna varies from site to site and 2) each site contains undescribed frogs, lizards, and
snakes, all of which are endemic to the Cerrado (e.g., see Colli et al. 2002, 2003a, b).
Consequently, endemism is much greater than previously indicated.
Because the Cerrado contains a mosaic of habitats, it offers an ideal opportunity to
examine the effect of habitat structure on vertebrate assemblages. Lizards, which have proven to
be excellent models for ecological research (Milstead 1967; Huey et al. 1983; Vitt & Pianka
1994), are abundant but often difficult to observe in the Cerrado (Vitt 1991). We designed a
study to test the hypothesis that lizard assemblages vary on a microgeographic scale and that
their distribution on such a scale is predictable based on habitat structure. Our results show that
lizard assemblages in the Cerrado vary on a microgeographic scale and, because most species are
tied to specific microhabitat characteristics, species distributions within the structural habitat
mosaic that the Cerrado offers is predictable based on that structure. However, we know little
about community structure or microhabitat requirements of individual species. Nevertheless, our
results suggest that poorly planned development projects may have drastic effects on cerrado
lizard assemblages.

157
METHODS
The Jalapão site
We conducted the study from 13 February to 10 March 2002 near “Escola D. Isabel
Barreira de Oliveira” (10° 15’ 46” S, 46° 33’ 56’’ W), ca. 35 km NW from the city of Mateiros,
Tocantins state, Brazil, in a region known as Jalapão. Located in the eastern part of the state of
Tocantins, with portions in southern Maranhão and Piauí, and western Bahia, the Jalapão region
covers approximately 53,340 km2 of relatively undisturbed Brazilian Cerrado (Fig. 1). This is the
largest remaining undisturbed patch of Cerrado and among the least populated regions of Brazil.
Much of it has recently been designated as national and state reserves, including the Área de
Proteção Ambiental da Serra de Tabatinga (61,000 ha), Estação Ecológica Serra Geral do
Tocantins (716,306 ha), Parque Estadual do Jalapão (158,885.5 ha), and Parque Nacional das
Nascentes do Rio Parnaíba (729,813.55 ha). These contiguous reserves form the largest protected
tract of Cerrado in Brazil. The habitat is relatively open, with gallery forests associated with
streams and large as yet unexplored buttes harboring quite different vegetation than surrounding
flatlands.
Field methods
We selected two adjacent habitat patches that we could visually distinguish based on
vegetation structure. The first was open grassland with sparse stunted trees (Fig. 2A). The
second, which was approximately 100 m from the first site, was grassland with higher density of
trees, a partial canopy, and leaf litter (Fig. 2B). Soils were sandy in both. We established linear
158
pitfall trap arrays in each habitat. Each array consisted of a central 20-liter plastic bucket sunk
into the ground with the top flush with the surface, three 5-m drift fences at angles of 120° from
each other, and a terminal 20-liter bucket also sunk flush with the ground surface. Thus each
array had four bucket traps. Array 1 (open habitat) contained 38 pitfall trap arrays evenly spaced
along a 1,437 m transect; Array 2 (closed habitat) contained 37 arrays evenly spaced along a
1,257 m transect. Traps were monitored 4 times per day (early morning, late morning, early
afternoon, and late afternoon) to minimize mortality resulting from thermal stress during 23
consecutive days in the field. Considering each day as a trap day and each bucket as a trap, we
completed 6,900 trap days.
When we monitored traps, we identified each lizard to species and recorded time of day
and the number of the array. We removed all lizards captured, humanely killed them following
standard approved protocols (Anonymous 1987), gave each individual an unique numbered tag,
took tissue samples that were frozen in liquid nitrogen, took a series of morphological
measurements, and preserved them. Later, we removed stomachs and identified all prey items for
other studies. Thus our sampling protocol was a total removal one. This protocol allowed us to
examine the effect of continual sampling on a local population as well. We used linear regression
with day as the independent variable and number of lizards collected as the dependent variable to
determine whether trapping success was a function of time.
To examine success rate in terms of species sampling, we assembled matrices for each
habitat type that contained species as rows and day of collection as columns. Entries in the
matrices were the number of lizards of each species collected that day. We then calculated
species accumulation curves using EstimateS (Colwell & Coddington 1994; Colwell 1997).
Shape of species accumulation curves based strictly on empirical data is determined by the order
159
in which samples are added. EstimateS randomizes sample order to generate smooth species
accumulation curves. The Abundance-base Coverage Estimator (ACE) was used to estimate
completeness of sampling (see Colwell 1997).
In each array, we measured the following vegetative and structural habitat variables: 1)
leaf litter mass, 2) percent open ground, 3) percent of surface open to the sky, 4) number of plant
stem contacts, 5) number of burrows in ground, 6) number of termite nests within 6 meters, 7)
distance to nearest tree, 8) trunk circumference as a measure of tree size, and 9) total number of
fallen logs. To do this, we constructed a 0.5-m square from wooden dowels and placed strings
across at 0.1 meter intervals to form 25 equal-size squares. In each area delineated by drift fences
within each array, the square was thrown over the researcher’s shoulder and its landing point was
used as our random sample site. We counted squares represented by more than 50% open
ground, squares not under canopy (open to sky), and picked up all leaf litter under it and weighed
it. At the center of the spot where the square landed, we placed a vertical stake with a 1-m
horizontal dowel 20 cm above ground and rotated the stick 360°. We counted the number of
plant stem contacts with the horizontal stick. We then measured the distance to nearest tree from
center of square. This procedure gave three independent measurements for each variable in each
array. We used means for each array for analysis. From 1 m beyond end of wings (6 m from
center of array), we counted all burrows, all termite nests, and the total number of fallen logs in
the array.
In addition to collecting data on the vegetative and structural characteristics of the
habitats, we used TidBit electronic temperature recording devices (made by Onset Computer,
http://www.onsetcomp.com/) to examine thermal characteristics of the arrays at ground level
(where lizards live). These devices have been shown to estimate lizard operative temperatures

160
(Vitt & Sartorius 1999; Shine & Kearney 2001). However, we used them specifically to test for
thermal differences in microhabitats within arrays, making no assumptions about thermal
preferences of lizards using the habitats. The four microhabitats that we sampled were 1) under
grass clump, 2) under small shrub, 3) in leaf litter, and 4) on open ground (exposed to sun). Nine
replicates for each microhabitat were run in each habitat type. Each replicate sampled
temperature at 5-min intervals over a 48-hr period. These data were collected during an 8-day
period from 22 February through 29 February. We calculated means and SD for all replicates for
each microhabitat for each of the two habitats to provide a 24 h representation of temperature
changes throughout the day with data from all days combined.
We used two different approaches to examine relationship of lizard species to habitat
characteristics. In the first, we simply considered the two sets of arrays as representing distinct
habitat patches. We performed a Principal Components Analysis (PCA) on vegetative and
structural habitat characteristics to compare the two patches. We log10 transformed all variables.
For several variables that contained zero entries (number of stems, burrows, termite nests, and
fallen logs) we added 1 to each value prior to log transformation because there is no log of zero
(Tabachnick & Fidell 2001). We then compared frequencies of collection records for lizards
between the patches. This method provided a descriptive assessment of the association between
relative lizard abundances and habitat type. For the second analysis, we performed a Canonical
Correspondence Analysis (CCA; Ter Braak 1986), a multivariate ordination procedure that
directly associates variation in communities (lizards in this case) to habitat characteristics. We
used vegetation and structural habitat variables to characterize the habitat within individual
arrays and lizard species identities and relative abundance as a measure of lizard community
structure within individual arrays. Thus, in this analysis, we were asking if an association exists

161
between specific habitat characteristics and abundance of particular lizard species. CCA was
performed with CANOCO (Ter Braak & Smilauer 1998).
RESULTS
The Jalapão lizard fauna
A total of 531 lizards of 12 species were sampled with pitfall arrays, including
representatives from the three major lizard clades: Iguania, Gekkota, and Autarchoglossa (Fig.
3). Mean body size (SVL) varied from 31.5 ± 0.3 mm in Vanzosaura rubricauda to 98.5 ± 4.5 in
Ameiva ameiva (Fig. 4). Five additional species were collected in the area, but not on our plots.
They were Iguana iguana, an arboreal iguanid lizard distributed primarily along gallery forest,
Tipinambis quadrilineatus, a large teiid also distributed in gallery forests in Cerrado, and three
species of subterranean amphisbaenians, Leposternon polystegum, Amphisbaena alba, and
Bronia kraoh. We do not consider these further. Although we had collected all 12 species in the
arrays by day 11, the simulated species accumulation curve for all arrays combined shows that
about 23 days are required to reliably sample the lizard fauna at these sites (Fig. 5). Trapping
success was greatest during the first 10 days, dropping off considerably by the 23rd day (Fig. 6).
The reduction in trapping success was significant (rs = –0.8, P = 0.0002).
Habitat type comparison
Our qualitative descriptions of the two pitfall trap arrays as “open” versus “closed” were
confirmed but slightly different based on single variable comparisons (Table 1) versus the PCA
(Fig. 7). Based on single variable comparisons, the “open habitat” had greater sun exposure, less

162
open ground (denser grass stands), less leaf litter, fewer fallen logs, and the nearest trees were
farther away. In the PCA, factor I described a gradient based on the number of fallen logs and
burrow and total leaf litter mass (Table 2). Factor II described a gradient based on number of
termite nests and the number of plant stems (negative loading). Scores for factor I were
significantly different between open and closed Cerrado (ANOVA F1, 73 = 20.2, P < 0.0001). The
two habitats did not differ in respect to Factor II (ANOVA F1, 73 = 0.2, P = 0.6668).
Microhabitat temperatures were significantly higher (all P values < 0.0001 based on
ANOVA) in the open Cerrado habitat than in the closed Cerrado habitat (Fig. 8). Daily
fluctuations of microhabitat temperatures indicate that temperatures in microhabitats of open
Cerrado were higher than those in closed Cerrado during the time period in which lizard activity
occurs, with the exception of the open ground microhabitat. Open ground microhabitats
remained lower in temperature in closed Cerrado habitat until about 1130 hr, at which time open
ground microhabitats exceeded those in open Cerrado (Fig. 9).
Structure of the lizard assemblages differed considerably between open and closed
Cerrado sites (Fig. 10). Two species, Cnemidophorus mumbuca and Tropidurus oreadicus,
dominated the lizard fauna in open Cerrado, with all but one other (Vanzosaura rubricauda)
being relatively rare. Cnemidophorus mumbuca and T. oreadicus were less abundant in closed
Cerrado where six other species were moderately abundant.
Analysis by array
Based on 1000 permutations of a Monte Carlo test, and the first canonical axis, there was
a significant association between habitat structure within arrays and lizards found there
(eigenvalue = 0.335, F = 12.73, P = 0.001). In addition, all canonical axes were significant (trace

163
= 0.543, F = 2.611, P = 0.001). Vanzosaura rubricauda, Tropidurus oreadicus, and
Cnemidophorus mumbuca were associated with open sky (Fig. 11). Briba brasiliana was
associated with the nearest tree. Mabuya heathi was associated with fallen logs. Mabuya
nigropunctata, Colobosaura modesta, and Gymnodactylus geckoides were associated with leaf
litter.
DISCUSSION
Pitfall trap arrays are highly successful for censusing reptiles and amphibians and crucial
for sampling lizards in habitats where they are difficult to observe and collect (Jones 1986;
Gibbons 2004). In our arrays, we were able to determine species composition and relative
abundance in a relatively short period of time. However, number of lizards collected dropped off
significantly (rs = 0.0002) with time (Fig. 5) indicating that either 1) linear trapping and removal
reduced density along the linear transect or 2) real changes had occurred in lizard populations
during the study. We believe that both occurred. During the first 14 days of sampling, number of
lizards collected per day remained stable and no significant effect was evident (rs = 0.0569).
However, numbers of lizards trapped dropped off by the 15th day, when a significant effect of
time became detectable (rs = 0.0297). Coincident with the drop-off in trapping success was a
transition from the end of the wet season to the beginning of the dry season. A portion of the
drop-off in lizard numbers may have resulted from reduced lizard activity associated with a
seasonal resource shortage.
Open Cerrado habitat contained 10 species and was dominated by two species, C.
mumbuca and T. oreadicus; one species, V. rubricauda, was moderately abundant. Closed
Cerrado not only contained more species (12), but many of them were moderately abundant. The
164
closed Cerrado habitat was structurally more complex than the open Cerrado habitat, had a more
moderate thermal landscape, and contained a greater density of microhabitats that might harbor
lizards (fallen logs, termite nests, leaf litter, tree trunks). These results are not surprising because
lizard diversity is generally associated with structural diversity of the habitat (e.g., Pianka 1966a,
b; Schall & Pianka 1978). Increased midday temperatures in open patches within the closed
Cerrado habitat relative to the open Cerrado appear counterintuitive. However, in open Cerrado,
most of the ground was covered with grass whereas open patches (the open ground microhabitat)
in closed Cerrado tended to not contain as much grass. Consequently, during midday when the
sun angle is highest, open patches in the closed Cerrado habitat receive direct sunlight and are
not as well buffered from temperature change as similar microhabitats in the grassier open
Cerrado. However, closed Cerrado does provide numerous refuges from extreme temperatures in
leaf litter, trees, termite nests, and fallen logs.
The CCA shows that lizard species are tied to specific vegetative and physical
characteristics of Cerrado habitats on a microgeographic level. Absence of leaf litter, open sky
(as in Cerrado with a closed canopy), or fallen logs, for example, would result in absence, or at
best, rarity of some species. Lizard species are often associated with particular microhabitats, not
only in Cerrado, but in habitats as different as Amazonian rainforest (Vitt & Zani 1996) and
Australian deserts (Pianka 1973, 1986) on a global level (Vitt et al. 2003). Similar to our results,
studies of birds in northern temperate habitats, identified microhabitat as the most important
contributor to bird distributions at several scales based on a CCA (MacFadden & Capen 2002).
Our results have broad implications for conservation biology in general, and in particular,
for conservation and management of the Jalapão region. First, lizards are important components
of natural ecosystems, particularly in arid and tropical lands where their species diversity and

165
abundance is greatest (e.g., Pianka 1973, 1986; Duellman 1978, 1987; Lieberman 1986). Second,
they are excellent models for examining patterns of occurrence and relative abundance on
microgeographic scales, because they can be easily trapped, identified, and monitored. Finally,
as we have shown, many species depend on specific vegetative or structural aspects of the
habitats in which they live. The ability to identify microhabitat characteristics essential to
presence of individual species provides necessary information to develop conservation and
management plans for ecosystems. In this example, removal of trees, leaf litter, fallen logs, and
termite nests from relatively closed Cerrado sites would have immediate and measurable effects
on lizard diversity and community structure. Hydroelectric projects will flood or otherwise
impact gallery forest, which is well known to provide a link between Amazon and Atlantic
rainforest (Costa 2003; da Silva 1996). Loss of these habitats is likely to interfere with gene flow
for those species using gallery forests for dispersion. As we’ve shown, animal species are not
distributed uniformly across the Cerrado. Rather, microgeographic variation in habitat structure
affects species composition and relative abundance such that species assemblages will easily be
changed by habitat modification.
ACKNOWLEDGMENTS
This research was conducted under the project “Proposta de levantamento da
herpetofauna da micro-região do Jalapão,” funded by Conservation International do Brasil,
Universidade de Brasília, and the Sam Noble Oklahoma Museum of Natural History. Portions of
the project were conducted under the auspices of NSF grant DEB-0415430 to LJV and JPC.
Santos F. Balbino and Graziela Biaviati assisted in fieldwork. Daniel Mesquita, Frederico
França, and Adrian Garda were supported by graduate student fellowships from Coordenação de

166
Aperfeiçoamento de Pessoal de Nível Superior - CAPES. Guarino Colli was supported by a
research fellowship from Conselho Nacional de Desenvolvimento Científico e Tecnológico–
CNPq (# 302343/88-1).
LITERATURE CITED
ADIS, J., & RIBEIRO, M. de N. J. 1989. Impact of deforestation on soil invertebrates from
central Amazonian inundation forests and their survival strategies to long-term flooding.
Water Quality Bulletin 14:88-98.
ANONYMOUS. 1987. Guidelines for the use of live amphibians and reptiles in field research.
Publication of the American Society of Ichthyologists and Herpetologists, the
Herpetologists’ League, and the Society for the Study of Amphibians and Reptiles. 14 pp.
BENNETT, A. F., HINSLEY, S. A., BELLAMY, P. E., SWETNAM, R. D. & MACNALLY, R.
2004. Do regional gradients in land-use influence richness, composition and turnover of
bird assemblages in small woods? Biological Conservation 119:191-206.
BESTELMEYER, B. T., & WIENS, J. A. 2001. Local and regional-scale responses of ant
diversity to a semiarid biome transition. Ecography 24:381-392.
BINI, L. M., DINIZ-FILHO, J. A. F., BONFIM, F. & BASTOS, R. P. 2000. Local and regional
species richness relationships in viperid snake assemblages from South America:
unsaturated patterns at three different spatial scales. Copeia 2000:799-205.
BRAZ, V. S., ABREU, T. L. S., LOPES, L. E., LEITE, L. O., FRANÇA, F. G. R.,
VASCONCELLOS, M. M. & BALBINO, S. F. 2003. Brazilian merganser Mergus
octosetaceus discovered in Jalapão State Park, Tocantins, Brazil. Cotinga 20:68-71.
167
BROWN, K. S., JR. & GIFFORD, D. R. 2002. Lepidoptera in the Cerrado landscape and the
conservation of vegetation, soil, and topographic mosaics. Pp. 201-222 in Oliveira, P. S.,
& Marquis, R. J. (eds). The Cerrados of Brazil. Columbia University Press, New York.
398 pp.
CAVALCANTI, R. B. & JOLY, C. A. 2002. Biodiversity and conservation priorities in the
Cerrado region. Pp. 351-367 in Oliveira, P. S., & Marquis, R. J. (eds). The Cerrados of
Brazil. Columbia University Press, New York. 398 pp.
CHAO, A. & LEE, S.-M. 1992 Estimating the number of classes via sample coverage. Journal of
the American Statistical Association 87:210-217.
CHUST, G., PRETUS, J. L., DUCROT, D., BEDÒS, A. & DEHARVENG, L. 2003. Response
of soil fauna to landscape heterogeneity: determining optimal scales for biodiversity
modeling. Conservation Biology 17:1712-1723.
COLLI, G. R., BASTOS, R. P. & ARAUJO, A. F. B. 2002. The character and dynamics of the
Cerrado herpetofauna. Pp. 223-241 in Oliveira, P. S., & Marquis, R. J. (eds). The
Cerrados of Brazil. Columbia University Press, New York. 398 pp.
COLLI, G. R., COSTA, G. C., GARDA, A. A., KOPP, K. A., MESQUITA, D. O., PÉRES, A.
K. JR., VALDUJO, P. H., VIEIRA, G. H. C. & WIEDERHECKER, H. C. AND ZATZ,
M. G. 2003a. A critically endangered new species of Cnemidophorus (Squamata,
Teiidae) from a Cerrado enclave in southwestern Amazonia, Brazil. Herpetologica 59:76-
88.
COLLI, G. R., PÉRES, A. K. & CUNHA, H. J. 1998. A new species of Tupinambis (Squamata:
Teiidae) from central Brazil, with an analysis of morphological and genetic variation in
the genus. Herpetologica 54:477-492.

168
COLLI, G. R., CALDWELL, J. P., COSTA, G. C., GAINSBURY, A. M., GARDA, A. A.,
MESQUITA, D. O., FILHO, C. M. M. R., SOARES, A. H. B., SILVA, V. N.,
VALDUJO, P. H., VIEIRA, G. H. C., VITT, L. J., WERNECK, F. P.,
WIEDERHECKER, H. C. & ZATZ, M. G. 2003b. A new species of Cnemidophorus
(Squamata, Teiidae) from the Cerrado Biome in central Brazil. Occasional Papers of the
Sam Noble Oklahoma Museum of Natural History 14:1-14.
COLWELL, R. K. 1997. EstimateS: Statistical estimation of species richness and shared species
from samples. Version 5. User's Guide and application published at:
http://viceroy.eeb.uconn.edu/estimates.
COLWELL, R. K., & CODDINGTON, J. A. 1994. Estimating terrestrial biodiversity through
extrapolation. Philosophical Transactions of the Royal Society (Series B) 345:101-118.
COOPER, W. E., JR., & VITT, L. J. 2002. Distribution, extent, and evolution of plant
consumption by lizards. Journal of Zoology, London 257:487-517.
COSTA, L. P. 2003. The historical bridge between the Amazon and Atlantic Forest of Brazil: a
study of molecular phylogeography with small mammals. Journal of Biogeography
30:71-86.
DA SILVA, J. M. C. 1996. Distribution of Amazonian and Atlantic birds in gallery forests of the
Cerrado region, South America. Ornitologia Neotropical 7:1-18.
DIAS, B. F. S. 1992. Cerrados: uma caracterização. Pp. 11-25 in Dias, B. F. S. (ed). Alternativas
de desenvolvimento dos cerrados: Manejo e conservação dos recursos naturais
renováveis. Fundação PróNatureza, Brasília.
DIAS, B. F. S. 1994. Conservação da natureza do cerrado brasileiro. Pp. 607-663 in Pinto, M.
N. (ed). Cerrado: caracterização, ocupação e perspectivas. Brasília, Editoria da

169
Universidade de Brasília e Secretaria do Meio Ambiente, Ciência e Tecnologia do
Distrito Federal.
FISHER, R. N., SUAREZ, A. V. & CASE, T. J. 2002. Spatial patterns in the abundance of the
coastal horned lizard. Conservation Biology 16:205-215.
FROST, D. R., ETHERIDGE, R., JANIES, D. & TITUS, T. A. 2001. Total evidence, sequence
alignment, evolution of polychrotid lizards, and a reclassification of the Iguania
(Squamata: Iguania). American Museum Novitates 3343:1-38.
GERING, J. C., CRIST, T. O. & VEECH, J. A. 2002. Additive partitioning of species diversity
across multiple spatial scales: implications for regional conservation of biodiversity.
Conservation Biology 17:488-499.
GUERRY, A. D., & HUNTER, M., JR. 2002. Amphibian distributions in a landscape of forests
and agriculture: an examination of landscape composition and configuration.
Conservation Biology 16:745-754.
HAMER, K. C., & HILL, J. K. 2000. Scale-dependent effects of habitat disturbance on species
richness in tropical forests. Conservation Biology 14:1435-1440.
JOHNSON, M. P., FROST, N. J., MOSLEY, M. W. J., ROBERTS, M. E. & HAWKINS, S. J.
2003. The area-independent effects of habitat complexity on biodiversity vary between
regions. Ecology Letters 6:126-132.
JONES, K. B. 1986. Amphibians and reptiles. Pp. 267-290 in Cooperrider, A. Y. Boyd, R. J.
and Stuart, H. R. (eds). Inventory and monitoring of wildlife habitat. U. S. Department of
the Interior. Bureau of Land Management, Denver, CO.
Hecht, S., & Cockburn, A. 1989. The fate of the forest: developers, destroyers, and defenders of
the Amazon. Verso, New York.

170
HUEY, R. B., PIANKA, E. R. & SCHOENER, T. W. (eds.) 1983. Lizard ecology: studies of a
model organism. Harvard University Press, Cambridge, Massachussetts.
LEVIN, S. A. 2000. Multiple scales and the maintenance of biodiversity. Ecosystems 3:498-506.
LIEBERMAN, S. S. 1986. Ecology of the leaf litter herpetofauna of a neotropical rain forest: La
Selva, Costa Rica. Acta Zoologica Mexicana 15:1-72.
LINDENMAYER, D. B., CUNNINGHAM, R. B. & POPE, M. L. 1999. A large-scale
“experiment” to examine the effects of landscape context and habitat fragmentation on
mammals. Biological Conservation 88:387-403.
LOWE, W. H., & BOLGER, D. T. 2002. Local and landscape-scale predictors of salamander
abundance in New Hampshire headwater streams. Conservation Biology 16:183-193.
MACEDO, R. H. F. 2002. The avifauna: ecology, biogeography, and behavior Pp. 242-265 in
Oliveira, P. S., & Marquis, R. J. (eds). The Cerrados of Brazil. Columbia University
Press, New York. 398 pp.
MACFADEN, S. W., & CAPEN, D. E. 2002. Avian habitat relationships at multiple scales in a
New England forest. Forest Science 48:243-253.
MAMEDE F., GARCIA, P. Q., & SOUZA, W. C. 2002. Análise de Viabilidade sócio-
econômico-ambiental da transposição de águas da bacia do rio Tocantins para o rio São
Francisco, região do Jalapão/TO. Caderno de Política Ambiental, 1. Brasília:
Conservation Strategy Fund/Conservation International do Brasil/ Instituto Internacional
de Educação do Brasil.
MANTOVANI, J. E., & PEREIRA, L. A. 1998. Estimativa da integridade da cobertura vegetal
do Cerrado/Pantanal através de dados TM/Landstat. Relatório apresentado no Workshop

171
“Ações Prioritárias para a Conservação do Cerrado e Pantanal,” Brasília, Brasil.
Funatura, Conservation International, Universidade de Brasília, Fundação Biodiversitas.
MARCHAND, M. N., & LITVAITIS, J. A. 2004a. Effects of habitat features and landscape
composition on the population structure of a common aquatic turtle in a region
undergoing rapid development. Conservation Biology 18:758-767.
MARCHAND, M. N., & LITVAITIS, J. A. 2004b. Effects of landscape composition, habitat
features, and nest distribution on predation rates of simulated turtle nests. Biological
Conservation 117:243-251.
MARINHO-FILHO, J., RODRIGUES, F. H. G. & JAUREZ, K. M. The Cerrado mammals:
diversity, ecology, and natural history. Pp. 266-284 in Oliveira, P. S., & Marquis, R. J.
(eds). The Cerrados of Brazil. Columbia University Press, New York. 398 pp.
MENDONÇA, R. C., FELFLI, J. M., WALTER, B. M. T., SILVA-JÚNIOR, M.C., REZENDE,
A. V., SANO, S. M. & ALMEIDA, S. P. (eds). 1998. Flora vascular do cerrado. Pp. 289-
556 in Sao, S. M. & Almeida, S. P. (eds). Cerrado: ambiente e flora. Empresa Brasileira
de Pesquisa Agropecuaria, Brasília.
MILSTEAD, W. W. (ed). 1967. Lizard ecology: a symposium. University of Missouri Press,
Columbia, Missouri.
MITTERMEIER, R. A., MYERS, N. & MITTERMEIER, C. G. 2000. Hotspots: Earth’s
biologically richest and most endangered terrestrial ecoregions. CEMEX, Conservation
International.
MYERS, N. 1980. Conversion of tropical moist forests. National Academy of Sciences,
Washington, D. C. 430 pp.
172
MYERS, N. 1990. The biodiversity challenge: expanded hot-spots analysis. The
Environmentalist 10:243-256.
MYERS, N., MITTERMEIER, R. A., MITTERMEIER, C. G., FONSECA, G. A. B. DA &
KENT, J. 2000. Biodiversity hotspots for conservation priorities. Nature 403:853-858.
OLIVEIRA, P. S., & MARQUIS, R. J. 2002. The Cerrados of Brazil. Columbia University
Press, New York. 398 pp.
OLIVEIRA-FILHO, A. T., & RATTER. J. A. 2002. Vegetation physiognomies and woody flora
of the Cerrado Biome. Pp. 91-120 in Oliveira, P. S., & Marquis, R. J. (eds). The
Cerrados of Brazil. Columbia University Press, New York. 398 pp.
PELLEGRINO, K. C. M., RODRIGUES, M. T., YONENAGA-YASSUDA, Y. & SITES, J. W.
2001. A molecular perspective on the evolution of microteiid lizards (Squamata,
Gymnophthalmidae), and a new classification for the family. Biological Journal of the
Linnean Society 74:315-338.
PIANKA, E. R. 1966a. Latitudinal gradients in species diversity: a review of concepts. American
Naturalist 100:33–46.
PIANKA, E. R. 1966b. Convexity, desert lizards and spatial heterogeneity. Ecology 47:1055-
1059.
PIANKA, E. R., & VITT, L. J. 2003. Lizards: windows to the evolution of diversity. University
of California Press, Berkeley. 333 pp.
PRESCH, W. 1974. Evolutionary relationships and biogeography of the macroteiid lizards
(Family Teiidae, Subfamily Teiinae). Bulletin of the Southern California Academy of
Science 73:23-32.
173
PRESCH, W. 1983. The lizard family Teiidae: is it a monophyletic group. Zoological Journal of
the Linnean Society 77:189-197.
RAMBALDI, D. M., & OLIVEIRA, D. A. S. 2003. Fragmentação de ecossitemas: causas,
efeitos sobre a biodiversidade e recomendações de políticas públicas. Brasília, Ministério
do Meio Ambiente, Secretaria de Biodiversidade e Florestas.
RATTER, J. A., RIBEIRO, J. F. & BRIDGEWATER, S. 1997. The Brazilian cerrado vegetation
and threats to its biodiversity. Annals of Botany 80:223–230.
RENJIFO, L. M. 1999. Composition changes in a subandean avifauna after long-term forest
fragmentation. Conservation Biology 13:1124-1139.
ROCHA, C. F. D., & BERGALLO, H. G. 1997. Intercommunity variation in the distribution of
abundance of dominant lizard species in restinga habitats. Ciência e Cultura 49:269-274.
RODEWALD, A. D., & YAHNER, R. H. 2002. Influence of landscape composition on avian
community structure and associated mechanisms. Ecology 82:3493-3502.
SANTOS, T. C. C., & CÂMARA, J. B. D. 2002. GEO Brazil 2002—Environmental outlooks in
Brazil. Brasília, IBAMA Editions.
SAYER, J. A., & WHITMORE, T. C. 1991. Tropical moist forests: destruction and species
extinction. Biological Conservation 55:199-213.
SCHALL, J. J., & PIANKA, E. R. 1978. Geographical trends in numbers of species. Science
201:679-686.
SECRETARIA DO PLANEJAMENTO E MEIO AMBIENTE. 1999. Atlas do Tocantins:
subsídios ao planejamento de gestão territorial. Secretaria do Planejamento e Meio
Ambiente, Diretoria de Zoneamento Ecológico-Econômico-DZE: Palmas.

174
SHINE, R., & KEARNEY, M. 2001. Field studies of reptilian thermoregulation: how well do
physical models predict operative temperatures? Functional Ecology 15:282–288.
SKOLE, D., & TUCKER, C. 1993. Tropical deforestation and habitat fragmentation in the
Amazon: satellite data from 1978-1988. Science 260:1905-1910.
SUMMERVILLE, K. S., BOULWARE, M. J., VEECH, J. A. & CRIST, T. O. 2003. Spatial
variation in species diversity and composition of forest Lepidoptera in eastern deciduous
forests of North America. Conservation Biology 17:1045-1047.
TABACHNICK, B. G., & FIDELL, L. S. 2001. Multivariate Statistics, Fourth Edition. Allyn &
Bacon, Needham Heights, Mass.
TER BRAAK, C. J. F. (1986) Canonical correspondence analysis: a new eigenvector technique
for multivariate direct gradient analysis. Ecology 67: 1167–1179.
TER BRAAK, C. J. F., & SMILAUER, P. 1998. CANOCO reference manual and user's guide to
Canoco for Windows: software for canonical community ordination (version 4).
Microcomputer Power. Ithaca, New York.
VITT, L. J. 1991. An introduction to the ecology of cerrado lizards. Journal of Herpetology
25:79-90.
VITT, L. J., & PIANKA, E. R. (eds.) 1994. Lizard ecology: historical and experimental
perspectives. Princeton University Press, Princeton, New Jersey.
VITT, L. J., & SARTORIUS, S. S. 1999. HOBO's, Tidbits and lizard models: the utility of
electronic devices in field studies of ectotherm thermoregulation. Functional Ecology
13:670-674.
VITT, L. J., & ZANI, P. A. 1996. Organization of a taxonomically diverse lizard assemblage in
Amazonian Ecuador. Canadian Journal of Zoology 74:1313-1335.

175
VITT, L. J., PIANKA, E. R., COOPER, W. E., JR., & SCHWENK, K. 2003. History and the
global ecology of squamate reptiles. American Naturalist 162:44-60.
WELSH, H. H., & LIND, A. J. 2002. Multiscale habitat relationships of stream amphibians in
the Klamath-Siskiyou region of California and Oregon. Journal of Wildlife Management
66:581-602.

176
Table 1. Vegetative and structural habitat characteristics of open and closed Cerrado patches. Means ± SE
are shown for actual measured values with min – max values in parentheses. ANOVA results are based on
comparisons of log10 transformed variables. DF for F tests are 1, 73.
________________________________________________________________________ Habitat characteristic Open habitat Closed habitat F value P value ________________________________________________________________________ leaf litter mass 53.56 ± 4.19 343.65 ± 34.89 207.1 <0.0001
(11.67–133.33) (96.67–965.00)
squares open ground 14.92 ± 0.69 19.79 ± 0.56 25.7 <0.0001
(5.00–22.00) (11.67–25.00)
squares open to sky 24.51 ± 0.22 19.90 ± 0.70 29.6 <0.0001
(19.00–25.00) (8.33–26.00)
plant stem contacts 4.07 ± 0.48 3.47 ± 0.34 0.4 0.5301
(0.33–14.00) (0.00–9.33)
burrows 0.03 ± 0.03 0.11 ± 0.05 1.8 0.1791
(0–1) (0–1)
termite nests 1.05 ± 0.32 0.74 ± 0.16 0.2 0.6663
(0–10) (0–3)
nearest tree (m) 2.32 ± 0.23 1.56 ± 0.12 5.5 0.0220
(0.32–5.85) (0.38–3.88)
trunk circumference (m) 0.23 ± 0.02 0.22 ± 0.03 2.7 0.1044
(0.10–0.50) (0.05–1.04)
number of fallen logs 0.87 ± 0.17 2.63 ± 0.29 34.5 <0.0001
(0.00–4.00) (0.00–9.00)
________________________________________________________________________

177
Table 2. Results of PCA on vegetative characteristics of open and closed Cerrado patches in the
Jalapão region of Tocantins, Brazil.
________________________________________________________________________
Variable Factor 1 Factor 2 Factor 3 Factor 4 ________________________________________________________________________ log leaf litter mass 0.501 -0.103 -0.133 0.625
log squares open Ground 0.079 0.303 -0.021 0.770
log squares open Sky < 0.001 0.225 < 0.001 -0.792
log number of plant stems -0.100 -0.627 -0.198 -0.088
log number of burrows 0.624 0.552 0.199 -0.183
log number of termite nests -0.153 0.681 -0.221 -0.050
log trunk circumference -0.106 0.242 0.810 0.092
log number of fallen logs 0.770 -0.023 0.008 0.233
log distance to nearest tree 0.199 -0.085 0.794 -0.212
Eigenvectors 2.462 1.623 1.255 0.918
Percent of variation 0.274 0.180 0.139 0.102
________________________________________________________________________

178
Figure Legends
Figure 1. Map showing location of the study site in eastern Tocantins state, Brazil. Shaded area
is Cerrado and the study site is situated near the center of the Jalapão area.
Figure 2. Habitats in which pitfall trap arrays were placed; A. Open Cerrado, B. Closed Cerrado.
Figure 3. Phylogenetic relationships among lizard species observed near the Jalapão site. Species
in bold text were not observed on the pitfall array sites. Relationships of lizards based on
Pellegrino et al. (2001) for gymnophthalmids, Presch (1974, 1983) for teiids, and Frost et
al. (2001) for iguanians, The three iguanians shown are in different families. They are,
from left to right, Iguanidae, Polychrotidae, and Tropiduridae.
Figure 4. Body sizes of Jalapão lizards ranked from largest to smallest (mean values). Size for T.
quadrilineatus is based on data from Colli et al. (1998). Mean values are biased by
varying proportions of juveniles collected. Rank order of size based on maximum SVL is,
from largest to smallest: T. quadrilineatus, A. ameiva, M. nigropunctatus, T. oreadicus, M.
heathi, A. nitens, C. mumbuca, G. geckoides, B. brasiliana, C. modesta, M. maximiliani,
and V. rubricauda.
Figure 5. Species accumulation curve for all arrays combined (open and closed Cerrado) based
on 1000 randomizations from empirical data using EstimateS. Crosses show means ± SD
for empirical data simulations and shaded triangles show the “abundance-base coverage
estimator” (see Chao and Lee 1994; Colwell and Coddington 1994). Singletons are species
for which only a single individual was observed. Doubletons are species for which just
two individuals were observed. Uniques represent species for which all individuals were
collected on a single day.
Figure 6. Relationship between trapping success (number of lizards captured) and time in days.
179
Figure 7. Plot of the first two factors from a Principal Components Analysis on vegetative and
structural habitat characteristics for open and closed Cerrado sites.
Figure 8. Mean temperatures ± SE for microhabitats sampled within trap arrays in open and
closed Cerrado sites based on nine replicates for each microhabitat. SE of means are
shown.
Figure 9. Daily patterns of temperature change for microhabitats sampled within trap arrays in
open and closed Cerrado sites. Symbols show hourly means ± SE. Note that SE values
are so small in most instances that they are hidden by symbols. All sampling days were
combined for this analysis and nine replicates were made for each microhabitat.
Figure 10. Structure of lizard assemblages in open and closed Cerrado sites based on numbers of
individuals collected during a 23-day period.
Figure 11. Plot of Canonical Correspondence Analysis comparing matrices of structural habitat
characteristics with lizard sampling data.
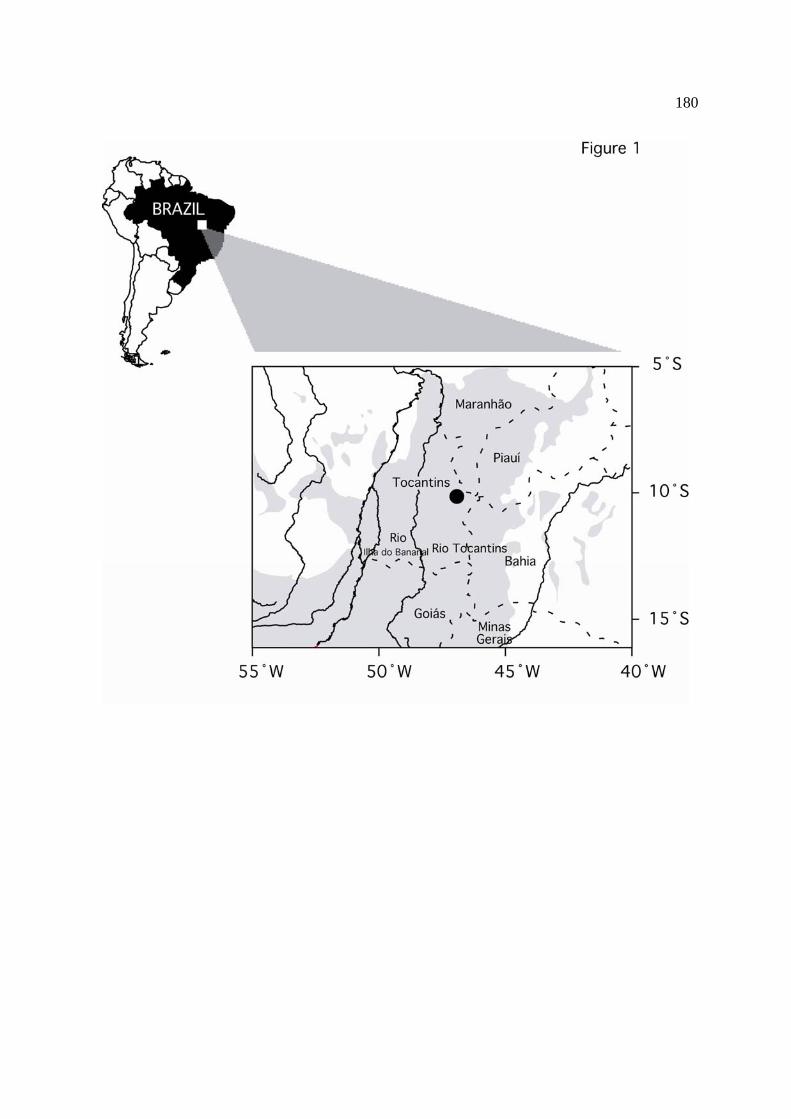
180
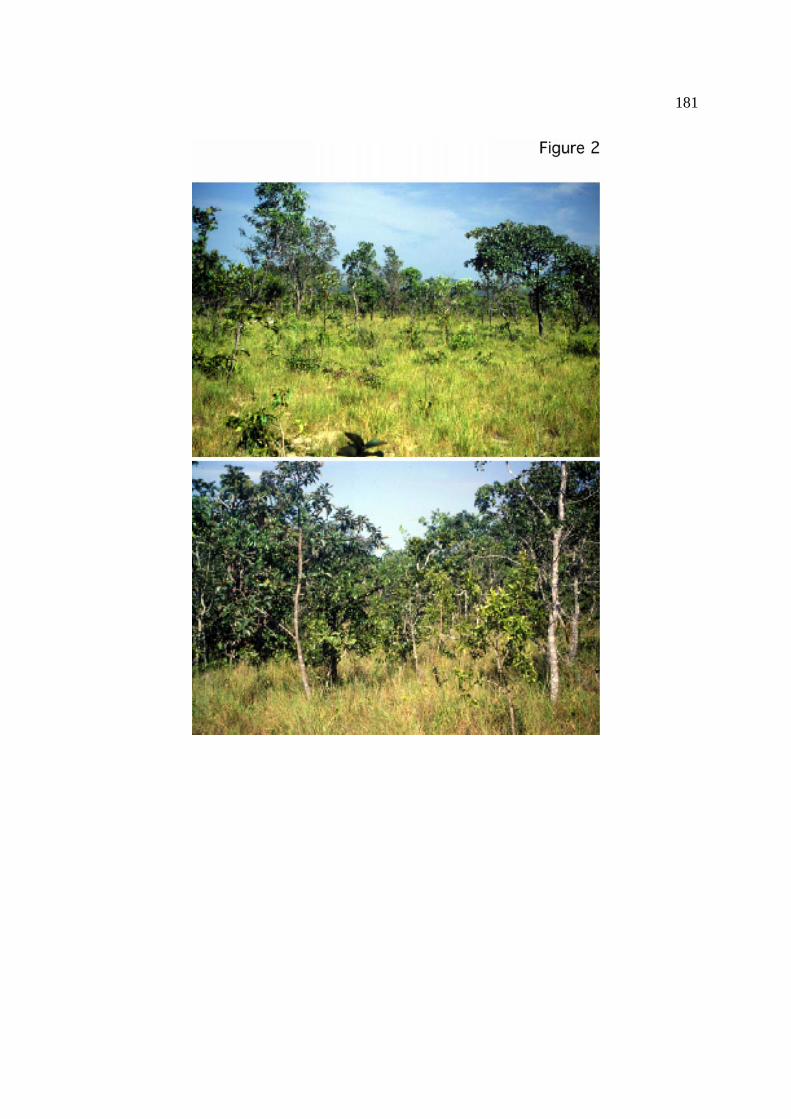
181
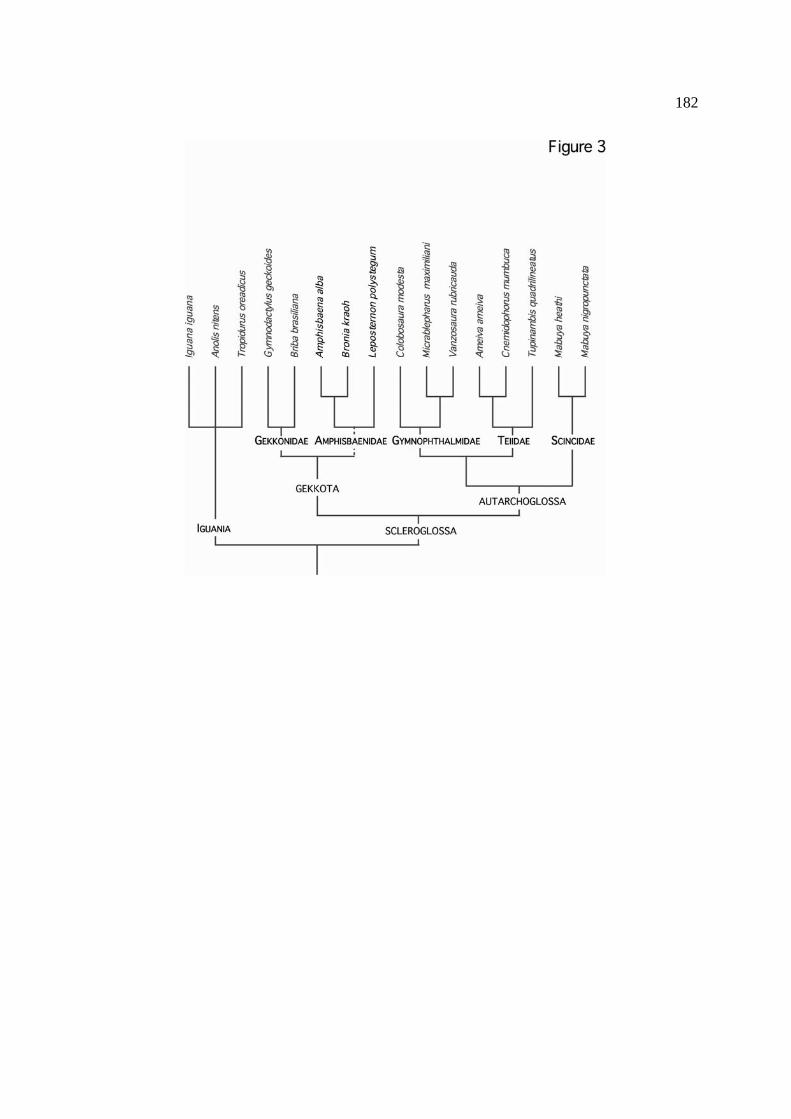
182
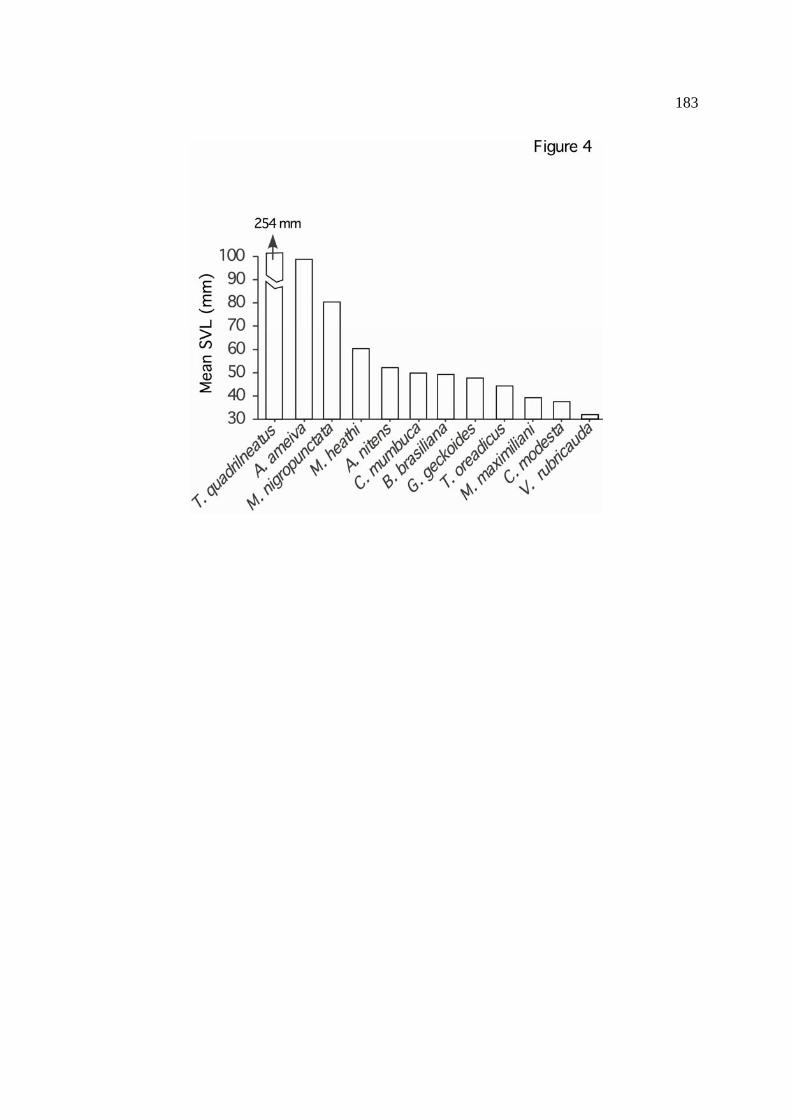
183
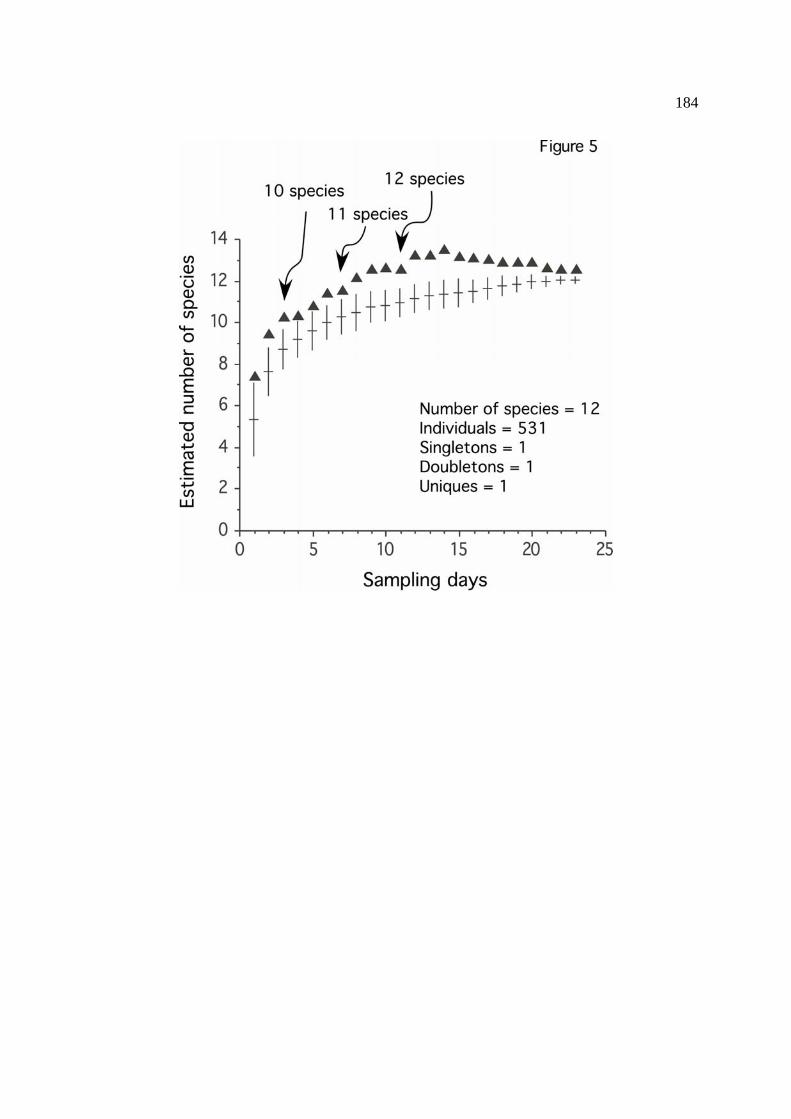
184
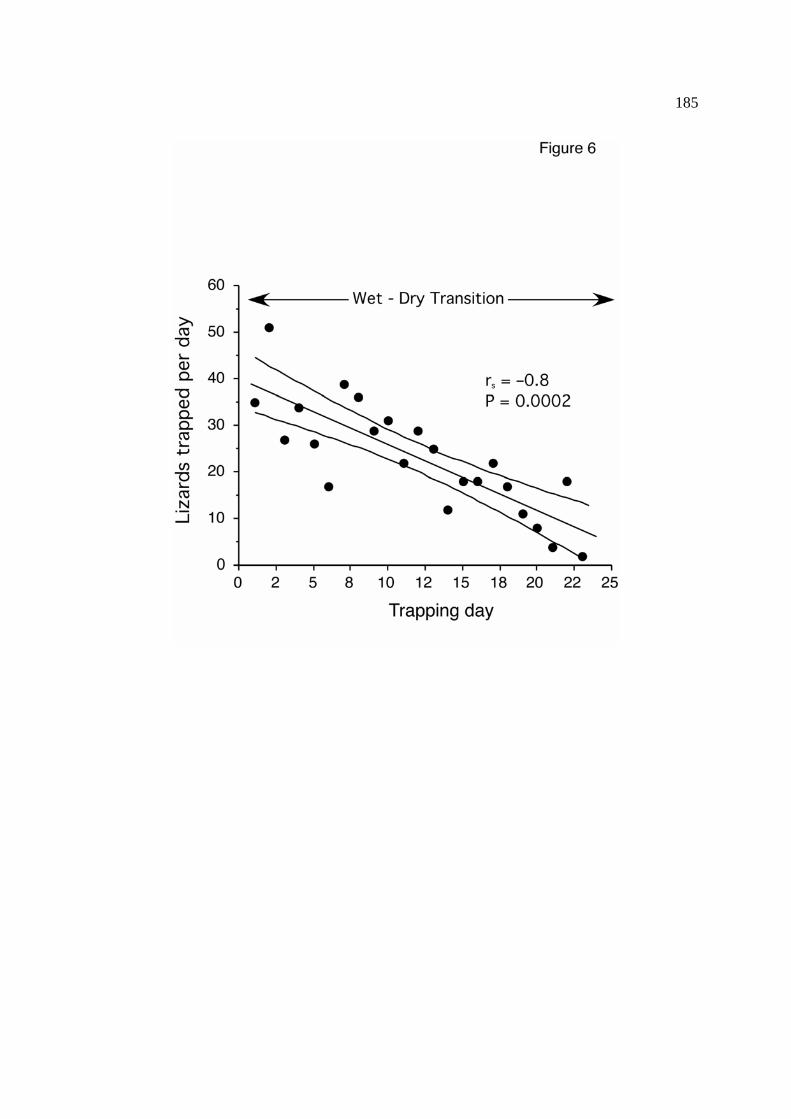
185

186

187

188

189

190