Embed Size (px)
Citation preview
2017
Nº 29ISBN 978-85-64878-46-4
AMAZÔNIA LEGALPROPOSTAS PARA UM DESENVOLVIMENTO AGRÍCOLA SUSTENTÁVEL
PROPOSALS FOR SUSTAINABLE AGRICULTURE

2017
Nº 29ISBN 978-85-64878-46-4
AMAZÔNIA LEGALPROPOSTAS PARA UM DESENVOLVIMENTO AGRÍCOLA SUSTENTÁVEL
PROPOSALS FOR SUSTAINABLEAGRICULTURE

2
GV AGRO
Coordenador do GV Agro | Coordinator of GV AgroRoberto Rodrigues
Gerente do GV Agro | Manager of GV AgroCecília Fagan Costa
FGV PROJETOS
Diretor | DirectorCesar Cunha Campos
Diretor Técnico | Technical DirectorRicardo Simonsen
Diretor de Controle | Director of ControlAntônio Carlos Kfouri Aidar
Diretor de Qualidade | Director of QualityFrancisco Eduardo Torres de Sá
Diretor de Mercado | Market DirectorSidnei Gonzalez
REDE DE PESQUISA E CONHECIMENTO APLICADO
Diretora | DirectorGoret Pereira Paulo
CRÉDITOS | CREDITS
Coordenador do Estudo | Study CoordinatorEduardo Assad (visiting researcher at FGV and researcher for Embrapa Informática Agropecuaria)
Equipe Técnica | Technical TeamEduardo Pavão, Felippe Serigati, Judson Ferreira Valentim, Marilene Cristiane de Jesus,Rodrigo Rudge R. Ribeiro, Susian C. Martins
Revisão Técnica | Technical RevisionMaria Leonor Ribeiro C. Lopes Assad
Revisão | RevisionAlexandre Sobreiro
Coordenação Editorial | Editorial CoordinationManuela Fantinato
Coordenação de Design | Design CoordinationPatricia Werner
Produção Editorial e Revisão | Editorial Produc-tion and ProofreadingTalita Marçal, Paula Nascimento, María ArréllagaMarina Bichara
Diagramação | LayoutCafé.art.br
Fotos | Photoswww.shutterstock.com
Esta edição está disponível para download no site da FGV Projetos: www.fgv.br/fgvprojetos
This issue is avaiable for download at FGV Pro-jetos’ website: www.fgv.br/fgvprojetos
Primeiro Presidente Fundador | Founder and First PresidentLuiz Simões Lopes
Presidente | PresidentCarlos Ivan Simonsen Leal
Vice-Presidentes | Vice-PresidentsSergio Franklin Quintella, Francisco Oswaldo Neves Dornelles, & Marcos Cintra Cavalcante de Albuquerque
CONSELHO DIRETOR | BOARD OF DIRECTORS
Presidente | PresidentCarlos Ivan Simonsen Leal
Vice-Presidentes | Vice-PresidentsSergio Franklin Quintella, Francisco Oswaldo Neves Dornelles & Marcos Cintra Cavalcanti de Albuquerque
Vogais | Voting MembersArmando Klabin, Carlos Alberto Pires de Carvalho e Albuquerque, Cristiano Buarque Franco Neto, Ernane Galvêas, José Luiz Miranda, Lindolpho de Carvalho Dias, Marcílio Marques Moreira, Roberto Paulo Cezar de Andrade.
Suplentes | DeputiesAldo Floris, Antonio Monteiro de Castro Filho, Ary Oswaldo Mattos Filho, Eduardo Baptista Vianna, Gilberto Duarte Prado, Jacob Palis Júnior, José Ermírio de Moraes Neto, Marcelo José Basílio de Souza Marinho, Mauricio Matos Peixoto.
CONSELHO CURADOR | BOARD OF TRUSTEES
Presidente | PresidentCarlos Alberto Lenz César Protásio
Vice-Presidente | Vice-presidentJoão Alfredo Dias Lins (Klabin Irmãos e Cia)
Vogais | Voting MembersAlexandre Koch Torres de Assis, Andrea Martini (Souza Cruz S.A.), Antonio AlbertoGouvea Vieira, Eduardo M. Krieger, Rui Costa (Governador do Estado da Bahia), José Ivo Sartori (Governador do Estado do Rio Grande Do Sul), José Carlos Cardoso (IRB - Brasil Resseguros S.A.), Luiz Chor, Marcelo Serfaty, Márcio João de Andrade Fortes, Murilo Portugal Filho (Federação Brasileira de Bancos), Orlando dos Santos Marques (Publicis Brasil Comunicação Ltda.), Pedro Henrique Mariani Bittencourt (Banco BBM S.A.), Raul Calfat (Votorantim Participações S.A.), Ronaldo Mendonça Vilela (Sindicato das Empresas de Seguros Privados, de Previdência Complementar e de Capitalização nos Estados do Rio de Janeiro e do Espírito Santo), Sandoval Carneiro Junior & Willy Otto Jorden Neto
Suplentes | DeputiesCesar Camacho, Clóvis Torres (Vale S.A.), José Carlos Schmidt Murta Ribeiro, LuizIldefonso Simões Lopes (Brookfield Brasil Ltda.), Luiz Roberto Nascimento Silva, Manoel Fernando Thompson Motta Filho, Nilson Teixeira (Banco de Investimentos Crédit Suisse S.A.), Olavo Monteiro de Carvalho (Monteiro Aranha Participações S.A.), Patrick de Larragoiti Lucas (Sul América Companhia Nacional de Seguros), Rui Barreto, Sergio Andrade e Victório Carlos de Marchi
Sede | HeadquartersPraia de Botafogo, 190, Rio de Janeiro – RJ, CEP 22250-900 ou Caixa Postal 62.591CEP 22257-970, Tel: (21) 3799-5498, www.fgv.br
Instituição de caráter técnico-científico, educativo e filantrópico, criada em 20 de dezembro de 1944 como pessoa jurídica de direito privado, tem por finalidade atuar, de forma ampla, em todas as matérias de caráter científico, com ênfase no campo das ciências sociais: administração, direito e economia, contribuindo para o desenvolvimento econômico-social do país.
Institution of technical-scientific, educational and philanthropic character, created on December 20th, 1944, as a legal entity of private law with the objective to act, broadly, in all subjects of scientific character, with emphasis on social sciences: administration, law and economics, contributing for the socioeconomical development of the country.
Impresso em papel certificado, proveniente de florestas plantadas de forma sustentável,com base em práticas que respeitam o meio ambiente e as comunidades.
Printed on certified paper from sustainably planted forests using practices that respect the environment and communities.
SUMÁRIO CONTENT
EDITORIAL ......................................................................................................................................................... 05EDITORIAL
INTRODUÇÃO ................................................................................................................................................... 09INTRODUCTION
RETROSPECTIVA DO DESMATAMENTO FLORESTAL,
PRODUÇÃO AGROPECUÁRIA E VULNERABILIDADE SOCIAL ........................................................... 15RETROSPECTIVE OF DEFORESTATION, FARMING AND STOCK BREEDING
AND SOCIAL VULNERABILITY
ANÁLISE DO PASSIVO AMBIENTAL MUNICIPAL ..................................................................................... 21ANALYSIS OF MUNICIPAL ENVIRONMENTAL LIABILITY
MUNICÍPIO DE SANTA MARIA DAS BARREIRAS (PA) ............................................................... 25MUNICIPALITY OF SANTA MARIA DAS BARREIRAS - PA
MUNICÍPIO DE ALTAMIRA (PA) ........................................................................................................ 30MUNICIPALITY OF ALTAMIRA - PA
SISTEMAS PRODUTIVOS SUSTENTÁVEIS NA AMAZÔNIA LEGAL ................................................ 37SUSTAINABLE PRODUCTION SYSTEMS IN AMAZÔNIA LEGAL
RECOMENDAÇÃO PARA ANÁLISE DE SISTEMAS PRODUTIVOS – METODOLOGIA FIAS .... 39RECOMMENDATION FOR ANALYSIS OF PRODUCTIVE SYSTEMS – FIAS METHODOLOGY
ZONEAMENTO DE FORRAGEIRAS .................................................................................................... 41FORAGE ZONING
ANÁLISE DE VIABILIDADE ECONÔMICA ................................................................................................ 49ECONOMIC FEASIBILITY ANALYSIS
ANÁLISE E PROPOSTAS DE POLÍTICAS PÚBLICAS ......................................................................... 57ANALYSIS AND PROPOSALS FOR PUBLIC POLICIES
CONCLUSÕES E AVALIAÇÕES DE PANORAMAS FUTUROS .............................................................. 65CONCLUSIONS AND EVALUATION OF FUTURE PANORAMAS
REFERÊNCIAS BIBLIOGRÁFICAS ................................................................................................................. 71REFERENCES

4

5 AMAZÔNIA LEGAL: PROPOSTAS PARA UMA EXPLORAÇÃO AGRÍCOLA SUSTENTÁVEL
AMAZÔNIA LEGAL: PROPOSALS FOR SUSTAINABLE AGRICULTURE
Na Amazônia Legal, a adoção de sistemas
agropecuários que tenham alta produtivi-
dade e, ao mesmo tempo, compromisso
com o meio ambiente é condição essen-
cial para o desenvolvimento sustentável
da região. Essa área é extremamente rica
em termos de recursos naturais e de bio-
diversidade. Seus limites geográficos tam-
bém são vastos: abrangem cerca de 60%
do território nacional, compreendendo
os estados do Acre, Amapá, Amazonas,
Mato Grosso, Pará, Rondônia, Roraima,
Tocantins e parte do Maranhão.
Para refletir sobre os desafios de se conciliar
sustentabilidade regional com o avanço das
atividades agrícolas e pecuárias, esta publi-
cação reúne os principais pontos abordados
originalmente em um amplo estudo sobre a
Amazônia Legal e as propostas de desenvol-
vimento agrícola sustentável para a área, rea-
lizado por especialistas da GV Agro, o centro
de agronegócios da Fundação Getulio Vargas,
em parceria com a FGV Projetos.
Na contextualização do cenário da Amazônia
Legal nas últimas décadas, o leitor poderá
acompanhar uma breve retrospectiva do des-
matamento florestal ocorrido entre 1988 e
2015, o histórico da produção agropecuária e
da questão da vulnerabilidade social.
EDITORIAL EDITORIAL
The adoption of highly productive and
environmentally sustainable agropastoral
systems is essential for the development
of the Amazônia Legal region. An area
that is extremely rich in terms of natural
resources and biodiversity, Amazônia Le-
gal´s vast geographical expanse covers
near 60% of the national territory, includ-
ing the states of Acre, Amapá, Amazonas,
Mato Grosso, Pará, Rodônia, Roraima,
Tocantins and parts of Maranhão.
Considering the significant challenges fac-
ing the Amazônia Legal region in reconciling
regional sustainability with the advance of
agricultural and livestock activities, this pub-
lication brings together the principal points
originally presented in a study on the Amazônia
Legal and proposals for sustainable agricul-
tural development for the region, realized by
specialists from GV Agro, Fundação Getulio
Vargas´ agribusiness center, in partnership
with FGV Projetos.
Contextualizing the present scenario observed
in Amazônia Legal in the last decades, the
study presents a brief retrospective regarding
deforestation that occurred between 1988 and
2015, the history of agricultural and livestock
production and social vulnerability in the region.

6
Além disso, terá a oportunidade de conhecer
não só alguns dos sistemas agropecuários re-
gionais que possuem baixa emissão de carbono,
como será apresentado a uma metodologia
de classificação e identificação de tais siste-
mas, chamada de Fluxo para Implantação da
Agropecuária Sustentável (FIAS).
A publicação analisa ainda a viabilidade econô-
mica dos sistemas produtivos implementados
na Amazônia Legal e traça um panorama das
principais políticas públicas agroambientais bra-
sileiras, no qual avalia o impacto que possuem
na competitividade do setor e reflete sobre os
obstáculos a serem superados para que o país
possa, efetivamente, alcançar uma produção
agropecuária sustentável.
Moreover, the study introduces several low
carbon emissions agropastoral systems uti-
lized in the region, as is illustrated through the
classification methodology utilized for these
systems, known as Flow for Implementation
of Sustainable Agricultural Systems (FIAS).
The study analyzes the economic viability of the
productive systems implemented in Amazônia
Legal and traces a panorama of the primary
agro-environmental public policies in Brazil,
evaluating the competitive impact the systems
possess in the sector as well as the main ob-
stacles to overcome in order for the country
to reach sustainable agricultural and livestock
production.
Cesar Cunha CamposDiretor Director
FGV Projetos
Boa leitura! Enjoy!
Roberto RodriguesCoordenador Coordinator
GV Agro
7 AMAZÔNIA LEGAL: PROPOSTAS PARA UMA EXPLORAÇÃO AGRÍCOLA SUSTENTÁVEL
AMAZÔNIA LEGAL: PROPOSALS FOR SUSTAINABLE AGRICULTURE

8

9 AMAZÔNIA LEGAL: PROPOSTAS PARA UMA EXPLORAÇÃO AGRÍCOLA SUSTENTÁVEL
AMAZÔNIA LEGAL: PROPOSALS FOR SUSTAINABLE AGRICULTURE
INTRODUÇÃO INTRODUCTION
Nos últimos cinquenta anos, o Brasil pas-
sou por um intenso processo de urbani-
zação e modernização da agricultura. O
desenvolvimento rápido, sem o devido
planejamento, causou a devastação de
parte significativa dos biomas (ou ecossis-
temas nativos) e a degradação dos solos
e das bacias hidrográficas. Infelizmente,
a região da Amazônia Legal não foi uma
exceção nesse processo e tal situação tem
causado preocupação mundial. Todavia,
essa inquietação não é motivada apenas
pela perda irreversível da riqueza natural,
mas também pela percepção de que se
trata de um processo destrutivo no qual os
ganhos sociais e econômicos são menores
do que as perdas ambientais. 1
O espaço da Amazônia Legal corresponde a um
conceito político, criado pelo governo brasileiro
no ano de 1953, que engloba o bioma Amazônia
e parte dos biomas Cerrado e Pantanal, com
extensão de mais de 500 milhões de hectares e
população superior a 25 milhões de pessoas. A
região detém parte considerável dos recursos
naturais globais e desempenha papel vital na
provisão de produtos e serviços ambientais no
ciclo do carbono e na regulação do clima global.
Sua biodiversidade compreende cerca de 60 mil
espécies de plantas (mais de 2,5 mil espécies
arbóreas), mais de duas mil espécies de peixes,
300 espécies de mamíferos e mais de 2,5 milhões
1 MARGULIS, 2004.
Over the past 50 years, Brazil has un-
dergone an intense process of urbaniza-
tion and agricultural modernization. Yet
this rapid development, without proper
planning, has caused the devastation of
a significant part of the country’s vari-
ous biomes (or native ecosystems) and
degradation of soils and watersheds. The
Amazônia Legal region is no exception in
this respect, and presents a situation that
is cause for global concern. This worry
is not only motivated by the irreversible
loss of natural resources, but also by the
perception that such destructive process-
es cause greater environmental loss than
social and economic gains. 1
The Amazônia Legal’s space corresponds to a
political concept that was created by the Bra-
zilian government in 1953, encompassing the
Amazon biome and part of the Cerrado and
Pantanal biomes. The Amazônia Legal region
covers more than 500 million hectares and has
a population greater than 25 million people.
The region contains a considerable part of the
world’s natural resources, playing a vital role in
the provision of environmental products and
services regarding the carbon cycle and global
climate regulation. Its biodiversity encompass-
es about 60 thousand species of plants (more
than 2,500 arboreal species), more than 2,000
fish species, 300 mammal species and over 2.5
1 MARGULIS, 2004.

10
de espécies de artrópodes. A biomassa florestal
da região detém um estoque de 83 a 116 bilhões
de toneladas de carbono. 2 Com mais de mil rios
tributários, a Amazônia possui importância estra-
tégica por seus imensos potenciais de recursos
não só minerais e hidrelétricos, como também
de manejo da pesca e da aquicultura.
2 MAHLI et al., 2006; SAATCHI et al., 2007.
million arthropod species. The forest biomass
in the region holds a stock of between 83 and
116 billion metric tons of carbon. 2 With more
than one thousand tributary rivers, the Amazon
watershed is strategically important for its huge
potential in mineral and hydroelectric resources
as well as for fishing and aquaculture.
2 Mahli et al., 2006; Saatchi et al., 2007.
FIGURA 1 | FIGURE 1
O ESPAÇO GEOGRÁFICO DA AMAZÔNIA LEGAL
THE AMAZÔNIA LEGAL’S GEOGRAPHIC SPACE
PANTANAL
AMAZÔNIA
CERRADO
+1.000 RIOS TRIBUTÁRIOSTRIBUTARY RIVERS
83 a 116 biTONELADAS DE CARBONO
TONS OF CARBON
+2,5 mi ESPÉCIES DE ARTRÓPODES
ARTHROPOD SPECIES
300 ESPÉCIES DE MAMÍFEROS
MAMMAL SPECIES
+2.000 ESPÉCIES DE PEIXES
FISH SPECIES
+2.500ESPÉCIES ARBÓREASARBOREAL SPECIES
60.000 ESPÉCIES DE PLANTAS
SPECIES OF PLANTS
+25 miPOPULAÇÃOPOPULATION
500 miHECTARES DE EXTENSÃOHECTARES OF EXTENSION
AMAZÔNIA LEGAL

11 AMAZÔNIA LEGAL: PROPOSTAS PARA UMA EXPLORAÇÃO AGRÍCOLA SUSTENTÁVEL
AMAZÔNIA LEGAL: PROPOSALS FOR SUSTAINABLE AGRICULTURE
Há mais de cinco séculos, com a chegada dos
colonizadores europeus, tiveram início os pro-
jetos de exploração, mas foi durante o século
XX que aumentaram os conflitos concernentes
à ocupação e à posse de terra por migrantes,
populações indígenas e populações locais, e à
preservação de riquezas naturais. Se, por um
lado, tais conflitos permanecem atuais, por
outro, cada vez mais se tem dado importân-
cia à conservação do bioma Amazônia e ao
seu uso sustentável pelas populações locais
e pelos produtores que detêm a posse dessa
floresta tropical. Além disso, o desmatamento
acumulado, que era inferior a um porcento do
território amazônico até o início da década de
1970, atingiu quase 19% desse território em 2013
(cerca de 76 milhões de hectares).
Diante desse cenário, o presente projeto tem como
pergunta central: como aproveitar de maneira sus-
tentável as áreas desmatadas da Amazônia Legal
a partir de sistemas agroambientais? O estudo
desenvolvido considera como recorte de análise
as áreas da região desmatadas com corte raso.
Large scale exploitation of the region started
more than five centuries ago with the arrival of
the first European explorers and colonizers, but
this process intensified greatly during the twen-
tieth century, increasing the conflicts regarding
land occupation and possession by migrants,
indigenous peoples and traditional communities
and the preservation of natural resources. These
conflits remais current, however, attention is
increasingly focused on the conservation of the
Amazon biome and its sustainable use by tradi-
tional communities and producers in possession
of land in this tropical forest area. In addition,
the deforestation accumulated, which was less
than one per cent territory until the beginning
of the 1970, reached almost 19% of that territory
in 2013 (about 76 million hectares) .
Given this scenario, the present project aims to
address the central question: how can defor-
ested areas in the Amazônia Legal region be
utilized sustainably through the implementation
of agro-environmental systems? The analytical
scope developed in this study corresponds spe-
cifically to the areas deforested by clear cutting.

12
É importante ressaltar que as atividades e os
conteúdos abordados neste trabalho envolveram
revisões bibliográficas, consulta a especialistas em
pecuária sustentável, reuniões sistemáticas com
a equipe de especialistas e análises detalhadas
de dados do perfil dos municípios da Amazônia
Legal. Também foi necessário assumir algumas
premissas, principalmente, diante das divergências
de dados de fontes distintas encontradas durante
a realização do projeto, 3 sendo elas:
• A consideração de um total de 772 muni-
cípios na Amazônia Legal, de acordo com
o critério adotado pelo IBGE;
• A análise de desmatamento foi feita em
função do corte raso proveniente dos dados
do Projeto de Monitoramento do Desma-
tamento na Amazônia Legal por Satélite
(PRODES), do Instituto Nacional de Pes-
quisas Espaciais (INPE); 4
• A seleção de 319 municípios da região para
a realização de análises mais detalhadas
da Amazônia Legal, segundo os seguintes
critérios: estarem localizados dentro do
bioma Amazônia, apresentarem 10% de
área desmatada convertidos em agricultura
anual, pasto limpo, pasto sujo, regeneração
com pasto e pasto com solo exposto ou
possuírem 100 mil hectares desmatados. 5
3 As divergências de dados e/ou informações encontradas durante a
realização do projeto foram organizadas e dispostas nos anexos do
relatório completo “Amazônia Legal: Propostas para uma exploração
agrícola sustentável”, disponível em: <http://gvagro.fgv.br/pesquisa>.
4 Disponível em: <http://www.obt.inpe.br/prodes/index.php>.
5 Os 12 municípios com as maiores áreas desmatadas, segundo os
critérios descritos, foram caracterizados e analisados no relatório
completo “Amazônia Legal: Propostas para uma exploração
agrícola sustentável”. Os demais municípios podem ser acessados
no sistema online da base de dados do Think Tank Amazônia.
The proposals made in this study are based
on bibliographical reviews, consultation with
specialists in sustainable stock breeding, reg-
ular meetings with teams of specialists and
detailed analysis of the data in the municipali-
ties’ profiles of the Amazônia Legal. It was also
necessary to make some assumptions, mainly
due to discrepancies found in data from differ-
ent sources throughout the project, 3 namely:
• The consideration of a total of 772 munic-
ipalities in the Amazônia Legal, according
to the criterion adopted by the Brazilian
Institute of Geography and Statistics (IBGE);
• Deforestation was analyzed in function
of the clear cut areas using data from the
Project for Satellite Monitoring of Defor-
estation in Amazônia Legal (PRODES),
conducted by the National Institute of
Space Studies (INPE); 4
• For more detailed analyses of Amazônia Legal,
319 municipalities were chosen, according to
the following criteria: being located within
the Amazon biome; having 10% of the area
deforested and converted to annual crop-
ping, clean pasture, weedy pasture, pasture
with exposed soil, or having 100 thousand
or more hectares cleared. 5
3 These discrepancies in data and/or information found during
the project are organized and placed in the attachments to the
complete report “Amazônia Legal: proposals for sustainable
agriculture”, available at: < http://gvagro.fgv.br/pesquisa.>.
4 Available at: <http://www.obt.inpe.br/prodes/index.php>.
5 The twelve municipalities with the largest deforested areas,
according to the criteria described, are characterized and an-
alyzed in the complete report “Amazônia Legal: proposals for
sustainable agriculture”. The data on the other municipalities
can be accessed online in the Think Tank Amazônia database.

13 AMAZÔNIA LEGAL: PROPOSTAS PARA UMA EXPLORAÇÃO AGRÍCOLA SUSTENTÁVEL
AMAZÔNIA LEGAL: PROPOSALS FOR SUSTAINABLE AGRICULTURE
In order to answer the central question pro-
posed by this study and to outline proposals for
sustainable farming and stock breeding in the
medium and long terms, this study was struc-
tured in two parts. First, the study observes the
region, focusing on the characterization of the
Amazônia Legal in the face of the reduction of
deforestation. Subsequently, the options that
could be presented for sustainable agricultural
in deforested areas were rostered, identified
in its 772 municipalities, considering, above
all, edaphoclimatic and historical aspects of
deforestation, agriculture and cattle raising
and social vulnerability in the region. These
diagnoses are observed in further detail for
the main municipalities where deforestation
has occurred.
In the latter part of the study, attention is turned
to the characterization and analysis of the main
sustainable stock breeding systems identified as
having potential for adoption and/or expansion,
primarily in degraded and clear-cut areas of
Amazônia Legal. Finally, several observations and
conclusions are addressed about the economic
feasibility of intensified and/or integrated pro-
ductive low carbon emission systems, along with
evaluation of the main federal and state public
policies, financial incentives and public-private
partnership initiatives associated directly and
indirectly with the Amazônia Legal region.
Em busca de responder ao questionamento
central suscitado por este estudo e de traçar
propostas para o desenvolvimento agrope-
cuário sustentável de médio e longo prazos,
foi realizada, primeiramente, a caracterização
da Amazônia Legal face à redução do des-
matamento. Posteriormente, foram listadas
as opções que podem ser apresentadas para
uma produção agrícola sustentável nas áreas
desmatadas, identificadas nos seus 772 muni-
cípios, considerando, sobretudo, os aspectos
edafoclimáticos e históricos do desmatamento, a
produção agropecuária e a vulnerabilidade social
da região. Tais diagnósticos foram detalhados
para os principais municípios desmatadores.
Posteriormente, foram caracterizados e analisa-
dos os principais sistemas produtivos pecuários
sustentáveis identificados com potencial de
adoção e/ou ampliação de tais sistemas pelos
produtores, principalmente nas áreas degra-
dadas e de corte raso da Amazônia Legal. Por
fim, também foram abordados aspectos rela-
cionados à viabilidade econômica dos sistemas
produtivos de baixa emissão de carbono, inten-
sificados e/ou integrados, bem como realizada
uma avaliação das principais políticas públicas
federais e estaduais, dos incentivos financeiros
e das iniciativas público-privadas ligadas direta
e indiretamente à sustentabilidade no campo
na região da Amazônia Legal.

14

15 AMAZÔNIA LEGAL: PROPOSTAS PARA UMA EXPLORAÇÃO AGRÍCOLA SUSTENTÁVEL
AMAZÔNIA LEGAL: PROPOSALS FOR SUSTAINABLE AGRICULTURE
RETROSPECTIVA DO DESMATAMENTO
FLORESTAL, PRODUÇÃO AGROPECUÁRIA E
VULNERABILIDADE SOCIAL
RETROSPECTIVE OF DEFORESTATION, FARMING
AND STOCK BREEDING PRODUCTOIN AND SOCIAL
VULNERABILITY
Em relação ao desmatamento, o INPE
realiza o inventário de perda de floresta
primária por meio do mapeamento da
dinâmica do desmatamento por corte
raso, 1 com uso de imagens de satélites
para calcular a taxa anual de desmata-
mento, pelo PRODES. 2 Essa tecnologia
foi sendo melhorada ao longo dos anos
e, atualmente, o Brasil possui a maior ex-
periência mundial em monitoramento de
desmatamento de florestas.
As margens sul e leste da Floresta Amazônica
sofreram mais com o desmatamento devido,
principalmente, à expansão da soja e à cria-
ção de gado, ocorrendo, especialmente, no
1 De acordo com o INPE (2013), o desmatamento por corte raso
é “resultado da remoção completa da cobertura florestal em um
curto intervalo de tempo e totalmente substituída por outras co-
berturas e usos (agrícola, pastagem, urbano, hidroelétricas etc.)”.
2 As estimativas geradas pelo PRODES baseiam-se em mapea-
mento anual de um grande conjunto de imagens do satélite Land-
sat 5/TM ou similares cobrindo toda a extensão da Amazônia. O
PRODES identifica áreas de corte raso, ou seja, retirada completa
da cobertura florestal, maiores do que 6,25 hectares (ha).
The INPE performs an ongoing inven-
tory of forest loss by mapping clear
cutting, 1 using Landsat images to cal-
culate the annual rate of deforestation
as a part of PRODES. 2 Monitoring and
mapping technologies have improved
drastically in the last decade. Today
Brazil is the world’s leading example
for its experience in improved defor-
estation monitoring.
The southern and eastern margins of the Am-
azon Forest suffer the most from deforesta-
tion, mainly due to the expansion of soybean
production and cattle grazing. This particu-
larly occurs in what is known in Brazil as the
1 According to the INPE (2013), clear cutting is defined as the
“complete removal of the forest cover in a short interval of
time and total replacement by other covers and uses (faming,
grazing, urban development, hydroelectric projects etc.)”.
2 The estimates produced by PRODES are based on the annual
mapping of a large set of images from the Landsat 5/TM satellite
and other similar satellites covering the entire extension of the
Amazon. PRODES identifies clear cut areas completely removed
of forest cover greater than 6,25 hectares (ha) .

16
chamado arco do desmatamento 3 e, mais recen-
temente, em Roraima e no Amapá. A Figura 3
apresenta o desmatamento anual na Amazônia
Legal entre 1988 e 2015. Os dados indicam
tendência de estabilização do desmatamento
anual entre 450 mil e 600 mil hectares, sendo
que, a partir de 2001, existem dados em escala
municipal no PRODES. 4
Esse dado quantitativo de desmatamento anual
residual pode estar relacionado, predominante-
mente, à manutenção de sistemas tradicionais
de agricultura de derruba e queima por grupos
de populações indígenas, comunidades extra-
tivistas e ribeirinhas e produtores familiares
em áreas de assentamentos e regularização
fundiária mais recente.
Em relação à produção agrícola de lavouras
permanentes, o total da área colhida em 2013 foi
de 529,1 mil hectares (9% do total nacional). O
cacau foi o produto com maior extensão (135,7
mil hectares), seguido do café (120,9 mil hecta-
res), da banana (94,9 mil hectares), do dendê
(54,9 mil hectares), da borracha obtida por látex
coagulado (27,9 mil hectares) e do coco-da-baía
(26,8 mil hectares). A área colhida de lavouras
temporárias foi de 16,7 milhões hectares (26% do
total nacional). A soja foi o produto com maior
extensão de área destinada à colheita (9,3 milhões
de hectares), seguida do milho (4,4 milhões de
hectares), do arroz (0,78 milhão de hectare), do
3 As estimativas geradas pelo PRODES baseiam-se no mapea-
mento anual de um grande conjunto de imagens do satélite Land-
sat 5/TM ou similares cobrindo toda a extensão da Amazônia. O
PRODES identifica áreas de corte raso, ou seja, retirada completa
da cobertura florestal, maiores do que 6,25 hectares (ha).
4 O valor do desmatamento de 2015 é uma taxa estimada
do PRODES.
“deforestation arc”, 3 and, more recently, in the
states of Roraima and Amapá. Figure 3 depicts
the annual deforestation in Amazônia Legal
between 1988 and 2015. This data indicates
a tendency for land clearance to stabilize at
a yearly rate between 450 thousand and 600
thousand hectares. Municipal-scale data in
PRODES is only available from 2001 onward. 4
The quantitative measure of yearly deforesta-
tion may be predominantly related to the main-
tenance of traditional slash-and-burn farming
practices by indigenous groups and riverside
settlements, as well as extractive activities and
farming by smallholders living in settlements
with recent landholding regularization.
In regard to agricultural production of perennial
crops, the total farmed area in 2013 was 529.1
thousand hectares (9% of the national total).
Cacao was the product with the greatest ex-
tension (135.7 thousand hectares), followed by
coffee (120.9 thousand hectares), banana (94.9
thousand hectares), oil palm nut (54.9 thousand
hectares), rubber from coagulated latex (27.9
thousand hectares) and coconut (26.8 thousand
hectares). The area covered by annual crops
was 16.7 million hectares (26% of the national
total). Soybean was the crop with the great-
est extension (9.3 million hectares), followed
by corn (4.4 million hectares), rice (0.78 mil-
lion hectare), cotton (0.75 million hectare) and
3 The region where the agricultural frontier is advancing toward
the forest, and also where the highest deforestation rates in the
Amazon are found. It covers 500,000 km2 of land from the east
and south of Pará state to the west, passing through the states
of Mato Grosso, Rondônia and Acre (Source: IPAM).
4 The total rate of deforestation for 2015 was estimated as part
of the PRODES.

17 AMAZÔNIA LEGAL: PROPOSTAS PARA UMA EXPLORAÇÃO AGRÍCOLA SUSTENTÁVEL
AMAZÔNIA LEGAL: PROPOSALS FOR SUSTAINABLE AGRICULTURE
cassava (0.66 million hectare). Furthermore, the
number of cattle in Amazônia Legal in 2013 was
80.3 million head, accounting for 37.9% of the
national total, an increase of 116% between 1995
and 2013. Therefore, while on the one hand the
number of cattle and percentage of the national
herd increased, the deforestation rate declined
in this period (Figure 4). This is a reflection of
the substantial increase in productivity of cattle
herding in the Amazon.
algodão (0,75 de milhão hectare) e da mandioca
(0,66 milhão de hectare). Ademais, o número de
bovinos registrados na Amazônia Legal em 2013
foi de 80,3 milhões de animais, representando
37,9% do rebanho do território nacional, e apre-
sentou aumento de 116% entre os anos de 1995 e
2013. Se, de um lado, temos o aumento do número
de animais e da representatividade do rebanho
nacional, por outro, temos redução da taxa de
desmatamento (Figura 4). Além disso, o efeito
poupa-terra, resultante do aumento da produti-
vidade da bovinocultura na Amazônia, é enorme.
FIGURA 2 | FIGURE 2
PRODUÇÃO AGRÍCOLA DE LAVOURAS EM 2013 - ÁREA COLHIDA MILHÕES DE HECTARES
AGRICULTURAL CROP PRODUCTION IN 2013 - AREA HARVESTED IN MILLIONS OF HECTARES
27,95,3%
26,85,0% 135,7
25%
6813%
120,922%94,9
18%
54,910%
0,784,7%
0,754,5%
0,663,9%
0,814,8%
9,355%
4,426%
COFFEECOCOA BANANACAFÉCACAU BANANA
BORRACHARUBBER
OUTROSOTHERS
DENDEDENDE
COCO-DA-BAÍACOCO-DA-BAÍA
MILHOCORN
SOJASOY
ARROZRICE
MANDIOCACASSAVA
ALGODÃOCOTTON
OUTROSOTHERS
529,1 mil hectares (9% do total nacional)529.1 thousand hectares (9% of national total)
16,7 milhões de hectares (26% do total nacional)16.7 thousand hectares (26% of national total)
TEMPORÁRIAS TEMPORARYPERMANENTES PERMANENT

18
FIGURA 3 | FIGURE 3
DESMATAMENTO ANUAL NA AMAZÔNIA LEGAL (HECTARES) DE 1988 A 2015
ANNUAL DEFORESTATION IN AMAZÔNIA LEGAL (HECTARES) FROM 1988 TO 2015
Fonte | Source
PRODES (2016)
FIGURA 4 | FIGURE 4
ANÁLISE DA EVOLUÇÃO DO REBANHO BOVINO E DA TAXA DE DESMATAMENTO NA
AMAZÔNIA LEGAL ENTRE 1989 E 2014
EVOLUTION OF NUMBER OF CATTLE AND DEFORESTATION RATE IN AMAZÔNIA LEGAL
BETWEEN 1989 AND 2014
Fonte | Source
Adaptado de IBGE (2015); PRODES (2015) Adapted from IBGE (2015); PRODES (2015)
8988 90 91 92 93 94 95 96 97 98 99 00 01 02 03 04 05 06 07 08 09 10 11 12 13 14 150
1
2
3
4
5
6
MIL
LIO
NS
OF
HE
CT
AR
ES
MIL
HÕ
ES
DE
HE
CT
AR
ES
(1988 - 200) ANTES DO PRODES BEFORE PRODES (2001 - 2015) DEPOIS DO PRODES AFTER PRODES
TAXA DE DESMATAMENTO (KM2/ANO)
DEFORESTATION RATE (KM2/YEAR)REBANHO BOVINO (NÚMERO DE ANIMAIS)
CATTLE HERD (NUMBER OF ANIMALS)
89 90 91 92 93 94 95 96 97 98 99 00 01 02 03 04 05 06 07 08 09 10 11 12 13 140
10
20
30
40
50
60
70
80
90
0
5
10
15
20
25
30
35
MIL
LIO
NS
OF
AN
IMA
LS
MIL
HÕ
ES
DE
AN
IMA
IS
MIL
KM
2/A
NO
TH
OU
SA
ND
KM
2/Y
EA
R
19 AMAZÔNIA LEGAL: PROPOSTAS PARA UMA EXPLORAÇÃO AGRÍCOLA SUSTENTÁVEL
AMAZÔNIA LEGAL: PROPOSALS FOR SUSTAINABLE AGRICULTURE
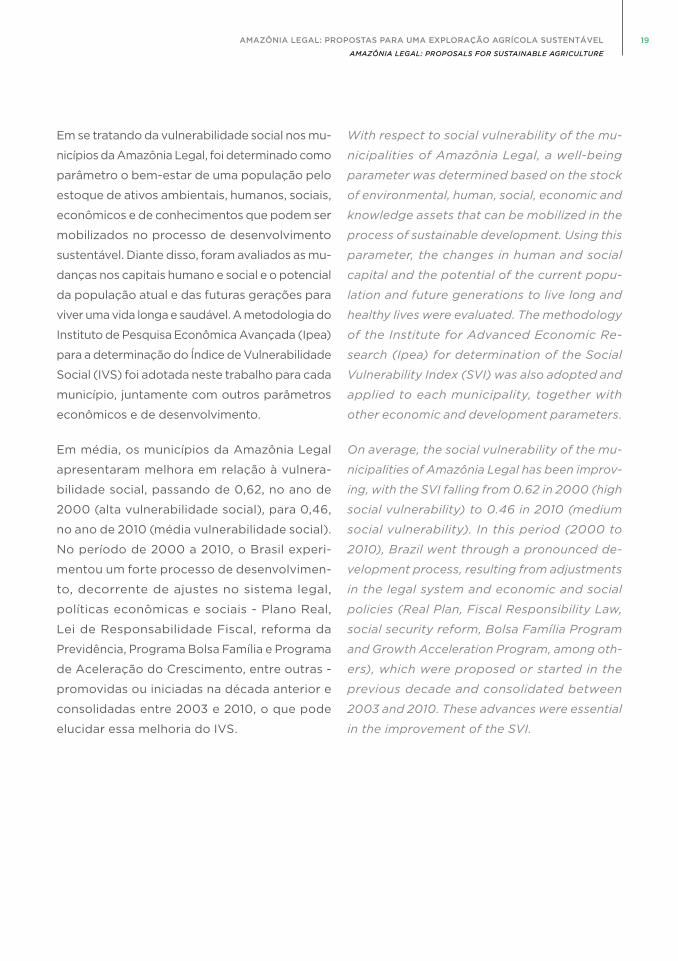
Em se tratando da vulnerabilidade social nos mu-
nicípios da Amazônia Legal, foi determinado como
parâmetro o bem-estar de uma população pelo
estoque de ativos ambientais, humanos, sociais,
econômicos e de conhecimentos que podem ser
mobilizados no processo de desenvolvimento
sustentável. Diante disso, foram avaliados as mu-
danças nos capitais humano e social e o potencial
da população atual e das futuras gerações para
viver uma vida longa e saudável. A metodologia do
Instituto de Pesquisa Econômica Avançada (Ipea)
para a determinação do Índice de Vulnerabilidade
Social (IVS) foi adotada neste trabalho para cada
município, juntamente com outros parâmetros
econômicos e de desenvolvimento.
Em média, os municípios da Amazônia Legal
apresentaram melhora em relação à vulnera-
bilidade social, passando de 0,62, no ano de
2000 (alta vulnerabilidade social), para 0,46,
no ano de 2010 (média vulnerabilidade social).
No período de 2000 a 2010, o Brasil experi-
mentou um forte processo de desenvolvimen-
to, decorrente de ajustes no sistema legal,
políticas econômicas e sociais - Plano Real,
Lei de Responsabilidade Fiscal, reforma da
Previdência, Programa Bolsa Família e Programa
de Aceleração do Crescimento, entre outras -
promovidas ou iniciadas na década anterior e
consolidadas entre 2003 e 2010, o que pode
elucidar essa melhoria do IVS.
With respect to social vulnerability of the mu-
nicipalities of Amazônia Legal, a well-being
parameter was determined based on the stock
of environmental, human, social, economic and
knowledge assets that can be mobilized in the
process of sustainable development. Using this
parameter, the changes in human and social
capital and the potential of the current popu-
lation and future generations to live long and
healthy lives were evaluated. The methodology
of the Institute for Advanced Economic Re-
search (Ipea) for determination of the Social
Vulnerability Index (SVI) was also adopted and
applied to each municipality, together with
other economic and development parameters.
On average, the social vulnerability of the mu-
nicipalities of Amazônia Legal has been improv-
ing, with the SVI falling from 0.62 in 2000 (high
social vulnerability) to 0.46 in 2010 (medium
social vulnerability). In this period (2000 to
2010), Brazil went through a pronounced de-
velopment process, resulting from adjustments
in the legal system and economic and social
policies (Real Plan, Fiscal Responsibility Law,
social security reform, Bolsa Família Program
and Growth Acceleration Program, among oth-
ers), which were proposed or started in the
previous decade and consolidated between
2003 and 2010. These advances were essential
in the improvement of the SVI.

20

21 AMAZÔNIA LEGAL: PROPOSTAS PARA UMA EXPLORAÇÃO AGRÍCOLA SUSTENTÁVEL
AMAZÔNIA LEGAL: PROPOSALS FOR SUSTAINABLE AGRICULTURE
ANÁLISE DO PASSIVO AMBIENTAL MUNICIPAL
ANALYSIS OF MUNICIPAL ENVIRONMENTAL LIABILITY
Para analisar mais detalhadamente o poten-
cial de adoção e/ou expansão de sistemas
produtivos sustentáveis em áreas desma-
tadas da Amazônia, foi feito um recorte
municipal, tendo como critérios a seleção
de municípios totalmente inseridos no bio-
ma Amazônia que tenham 100 mil hectares
ou mais desmatados (em valor absoluto)
ou 10% de sua área municipal desmatadas.
Dessa forma, chegou-se a um total de 319 muni-
cípios, que correspondem a aproximadamente
60% dos municípios do bioma Amazônia. Esses
municípios selecionados possuem 23,6% da
área desmatada.
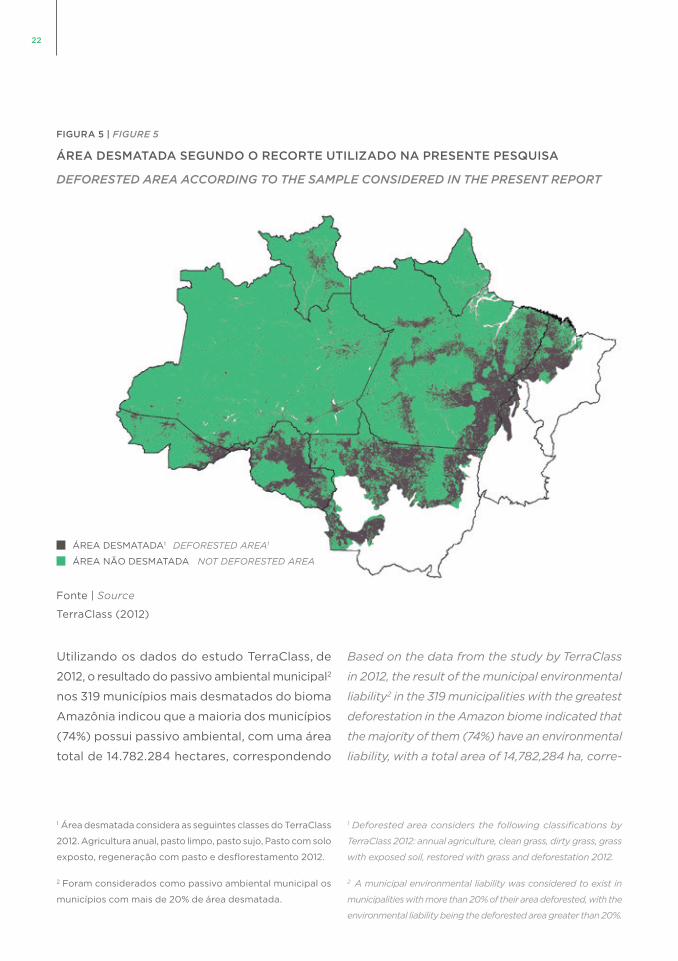
Na Figura 5, é possível observar a distribuição
espacial da área desmatada no bioma Amazônia
segundo os critérios adotados neste estudo.
To analyze the potential of adopting and/
or expanding sustainable productive sys-
tems in deforested areas of Amazônia
Legal in further detail, a sample of mu-
nicipalities was chosen based on the fol-
lowing criteria: 100% of territory within
the Amazon biome; and 10% or more, or
100,000 ha or more (in absolute terms),
of the municipal area deforested.
The application of these criteria led to the
selection of 319 municipalities, approximately
60% of those in the Amazon biome, of which,
23.6% of the area of these municipalities has
been deforested.
Figure 5 shows the spatial distribution of the de-
forested parts of the Amazon biome according
to the criteria adopted in this report.
22
Utilizando os dados do estudo TerraClass, de
2012, o resultado do passivo ambiental municipal 2
nos 319 municípios mais desmatados do bioma
Amazônia indicou que a maioria dos municípios
(74%) possui passivo ambiental, com uma área
total de 14.782.284 hectares, correspondendo
1 Área desmatada considera as seguintes classes do TerraClass
2012. Agricultura anual, pasto limpo, pasto sujo, Pasto com solo
exposto, regeneração com pasto e desflorestamento 2012.
2 Foram considerados como passivo ambiental municipal os
municípios com mais de 20% de área desmatada.
Based on the data from the study by TerraClass
in 2012, the result of the municipal environmental
liability 2 in the 319 municipalities with the greatest
deforestation in the Amazon biome indicated that
the majority of them (74%) have an environmental
liability, with a total area of 14,782,284 ha, corre-
1 Deforested area considers the following classifications by
TerraClass 2012: annual agriculture, clean grass, dirty grass, grass
with exposed soil, restored with grass and deforestation 2012.
2 A municipal environmental liability was considered to exist in
municipalities with more than 20% of their area deforested, with the
environmental liability being the deforested area greater than 20%.
FIGURA 5 | FIGURE 5
ÁREA DESMATADA SEGUNDO O RECORTE UTILIZADO NA PRESENTE PESQUISA
DEFORESTED AREA ACCORDING TO THE SAMPLE CONSIDERED IN THE PRESENT REPORT
Fonte | Source
TerraClass (2012)
ÁREA DESMATADA1 DEFORESTED AREA1
ÁREA NÃO DESMATADA NOT DEFORESTED AREA

23 AMAZÔNIA LEGAL: PROPOSTAS PARA UMA EXPLORAÇÃO AGRÍCOLA SUSTENTÁVEL
AMAZÔNIA LEGAL: PROPOSALS FOR SUSTAINABLE AGRICULTURE
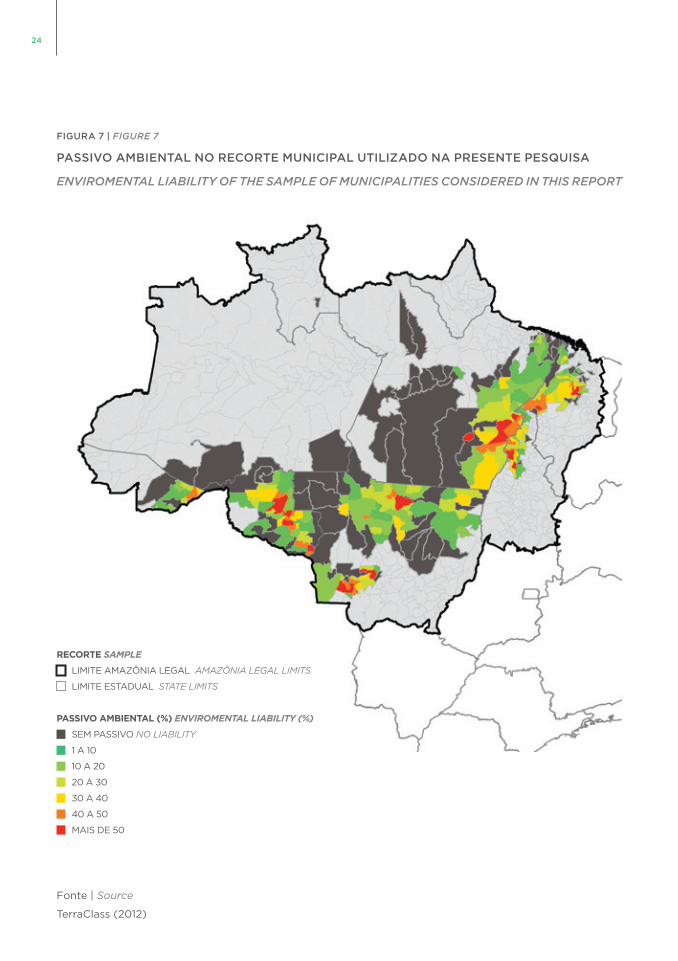
a 8% da área estudada. A análise desse passivo
ambiental municipal por estado indica que os
estados do Pará e do Mato Grosso representam
63% dele (Figura 6 e Figura 7). 3
3 Nos anexos do relatório completo “Amazônia Legal: Propostas
para uma exploração agrícola sustentável” estão os resulta-
dos integrais referentes ao passivo ambiental dos municípios
selecionados. Disponível em: <http://gvagro.fgv.br/pesquisa>.
sponding to 8% of the area studied. The analysis
of the municipal environmental liability per state
indicates that the states of Pará and Mato Grosso
represent 63% (Figure 6 and Figure 7). 3
3 The attachments of the complete report “Amazônia Legal:
proposals for sustainable agriculture“ contain the full results re-
ferring to the environmental liability of the selected municipalities.
Available at: http://gvagro.fgv.br/pesquisa.
FIGURA 6 | FIGURE 6
PASSIVO AMBIENTAL MUNICIPAL NOS ESTADOS DA AMAZÔNIA LEGAL
MUNICIPAL ENVIRONMENTAL LIABILITY IN THE STATES OF AMAZÔNIA LEGAL
ACRE (3%)
424.066 HECTARES
MARANHÃO (11%)
1.687.408 HECTARES
MATO GROSSO (32%)
4.667.826 HECTARES
PARÁ (32%)
4.680.274
HECTARES
RONDÔNIA (17%)
2.478.258HECTARES
TOCANTINS (6%)
844.452
HECTARES
32%
32%
6%
3%
17%
32%
11%
ACRE (3%)
424.066 HECTARES
MARANHÃO (11%)
1.687.408 HECTARES
MATO GROSSO (32%)
4.667.826 HECTARES
PARÁ (32%)
4.680.274
HECTARES
RONDÔNIA (17%)
2.478.258HECTARES
TOCANTINS (6%)
844.452
HECTARES
32%
32%
6%
3%
17%
32%
11%
Fonte | Source
TerraClass (2012)
24
FIGURA 7 | FIGURE 7
PASSIVO AMBIENTAL NO RECORTE MUNICIPAL UTILIZADO NA PRESENTE PESQUISA
ENVIROMENTAL LIABILITY OF THE SAMPLE OF MUNICIPALITIES CONSIDERED IN THIS REPORT
Fonte | Source
TerraClass (2012)
RECORTE SAMPLE
LIMITE AMAZÔNIA LEGAL AMAZÔNIA LEGAL LIMITS
LIMITE ESTADUAL STATE LIMITS
PASSIVO AMBIENTAL (%) ENVIROMENTAL LIABILITY (%)
SEM PASSIVO NO LIABILITY
1 A 10
10 A 20
20 A 30
30 A 40
40 A 50
MAIS DE 50

25 AMAZÔNIA LEGAL: PROPOSTAS PARA UMA EXPLORAÇÃO AGRÍCOLA SUSTENTÁVEL
AMAZÔNIA LEGAL: PROPOSALS FOR SUSTAINABLE AGRICULTURE
A seguir, para uma análise mais detalhada, é
apresentado o estudo da evolução do desma-
tamento, das atividades agropecuárias e do IVS
em dois municípios com características distintas
selecionados em função da área desmatada.
MUNICÍPIO DE SANTA MARIA DAS BARREI-
RAS (PA)
Nos últimos anos, verificou-se a tendência de esta-
bilização na taxa de desmatamento anual em Santa
Maria das Barreiras, no Pará (Figura 8). No entan-
to, a análise da evolução da porcentagem da área
desmatada em relação à sua área total demonstrou
que, entre 2000 e 2013, essa porcentagem variou
de aproximadamente 40% para acima de 50%. 4
No entanto, a evolução do rebanho bovino não
apresentou uma tendência contínua ao longo
do período analisado, com aumento de animais
entre 2003 e 2005 e queda desse indicador
entre 2006 e 2009. Após 2009, houve um leve
incremento, com tendência à estabilização do
efetivo bovino entre 2011 e 2013. Ademais, a
análise da evolução da área colhida indica uma
redução principalmente a partir de 2007. 5
4 PRODES, 2015.
5 IBGE, 2015.
Next, a study is presented on the evolution of
deforestation, farming and stock breeding ac-
tivities, as well as the SVI in two municipalities
with distinct characteristics, chosen for a more
detailed analysis because of their cleared area.
MUNICIPALITY OF SANTA MARIA DAS BAR-
REIRAS - PA
In recent years, yearly deforestation in Santa
Maria das Barreiras (Figure 8) has shown a ten-
dency to stabilize. Nevertheless, analysis of the
evolution of the percentage cleared in relation
to its total area demonstrates that between
2000 and 2013 this percentage varied from
approximately 40% to over 50%. 4
In turn, the size of the cattle herd did not
show a continuous tendency during the peri-
od analyzed, with an increase of the number
of animals between 2003 and 2005 and a
decline from 2006 to 2009. After 2009, the
total herd size increased slightly and then
stabilized from 2011 to 2013. Furthermore,
the area planted for grazing declined, mainly
as of 2007. 5
4 PRODES, 2015.
5 IBGE, 2015.

26
FIGURA 8 | FIGURE 8
DESMATAMENTO E BOVINOCULTURA EM SANTA MARIA DAS BARREIRAS ENTRE 2000 E 2013
DEFORESTATION AND CATTLE BREEDING IN SANTA MARIA DAS BARREIRAS BETWEEN
2000 AND 2013
Fonte | Source
IBGE (2015); PRODES (2015)
0
1
2
3
4
5
6
7
8
2000 2001 2002 2003 2004 2005 2006 2007 2008 2009 2010 2011 2012 2013
DESMATAMENTO (MILHARES DE HECTARES) BOVINOCULTURA (MILHARES DE ANIMAIS)
DEFORESTATION (THOUSANDS OF HECTARES) CATTLE BREEDING (THOUSANDS OF HEAD)
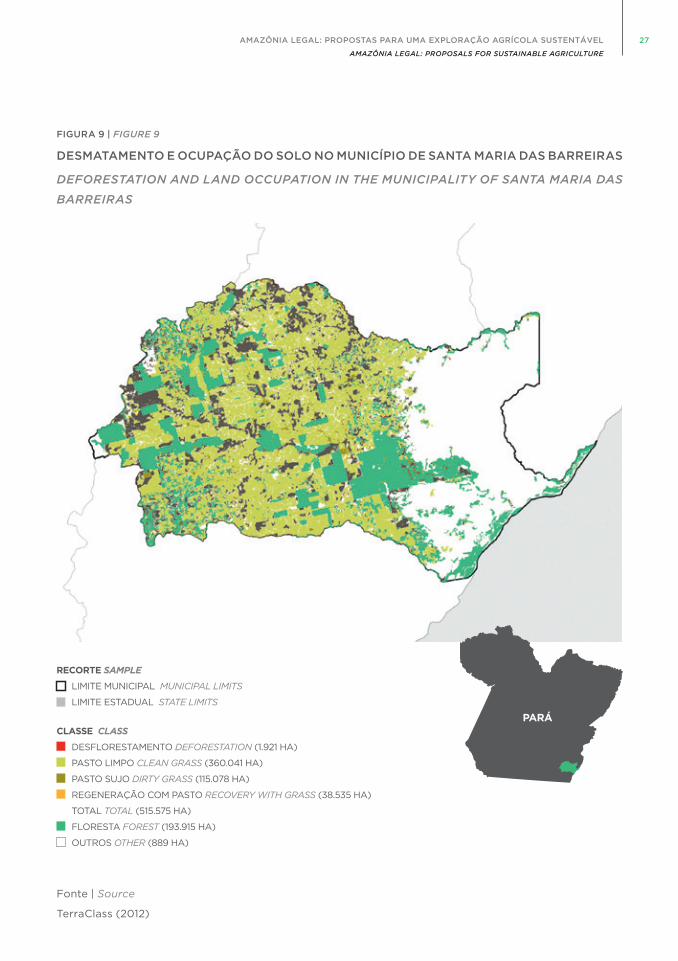
A espacialização do desmatamento é ilustrada
na Figura 9. Apresenta-se uma extensão do
desmatamento no total de 515.575 hectares,
ou seja, 50% da área do município a partir das
análises do estudo TerraClass, de 2012.
The spatial distribution of deforestation is il-
lustrated in Figure 9. The total cleared area is
515,575 hectares, or 50% of the municipality’s
area, based on the analysis of the TerraClass
study from 2012.
27 AMAZÔNIA LEGAL: PROPOSTAS PARA UMA EXPLORAÇÃO AGRÍCOLA SUSTENTÁVEL
AMAZÔNIA LEGAL: PROPOSALS FOR SUSTAINABLE AGRICULTURE
CLASSE CLASS
DESFLORESTAMENTO DEFORESTATION (1.921 HA)
PASTO LIMPO CLEAN GRASS (360.041 HA)
PASTO SUJO DIRTY GRASS (115.078 HA)
REGENERAÇÃO COM PASTO RECOVERY WITH GRASS (38.535 HA)
TOTAL TOTAL (515.575 HA)
FLORESTA FOREST (193.915 HA)
OUTROS OTHER (889 HA)
FIGURA 9 | FIGURE 9
DESMATAMENTO E OCUPAÇÃO DO SOLO NO MUNICÍPIO DE SANTA MARIA DAS BARREIRAS
DEFORESTATION AND LAND OCCUPATION IN THE MUNICIPALITY OF SANTA MARIA DAS
BARREIRAS
Fonte | Source
TerraClass (2012)
RECORTE SAMPLE
LIMITE MUNICIPAL MUNICIPAL LIMITS
LIMITE ESTADUAL STATE LIMITS
PARÁ
28
A partir do cruzamento do Zoneamento Ecológico-
Econômico (ZEE) da Amazônia para o município
de Santa Maria das Barreiras – utilizando-se so-
mente as categorias áreas de uso consolidado –
com as classes de pasto e agricultura, obtém-se
como resultado o mapa da Figura 10.
Nesse caso específico, a diferença entre o mape-
amento dos pastos e o cruzamento com o ZEE é
de 74.729 hectares de pastos em áreas que não
estão de acordo com os indicativos de uso do
ZEE, quando são consideradas as classes pas-
to limpo, pasto sujo e pasto com solo exposto.
Isso representa a área de pasto possivelmente
em situação irregular, conforme as indicações
do ZEE. Por outro lado, as áreas de pastagens
(115.078 hectares) consideradas na classe pas-
tos sujos indicam um processo de degradação
e representam oportunidades de intervenção
visando à recuperação e à intensificação da
produção nessas áreas.
The map in Figure 10 was produced by cross-ref-
erencing the Ecological-Economic Zoning (EEZ)
of the Amazon for the municipality in question –
using only the consolidated use area categories
– with the classes of pasture and cropped land.
In this specific case, the difference between the
mapping of pastures and cross-referencing with
the EEZ is 74,729 hectares of pastures in areas that
are not in accordance with the indication for use
of the EEZ considering the classes clean pasture,
weedy pasture and pasture with exposed soil.
This represents the area with pasture possibly in
an irregular situation, according to the indications
of the EEZ. On the other hand, the existence of
the pasture areas considered in the weedy pas-
ture class (115,078 hectares) indicates a process
of degradation and represents opportunities for
intervention intervention to recover and to inten-
sify production in these areas.
29 AMAZÔNIA LEGAL: PROPOSTAS PARA UMA EXPLORAÇÃO AGRÍCOLA SUSTENTÁVEL
AMAZÔNIA LEGAL: PROPOSALS FOR SUSTAINABLE AGRICULTURE
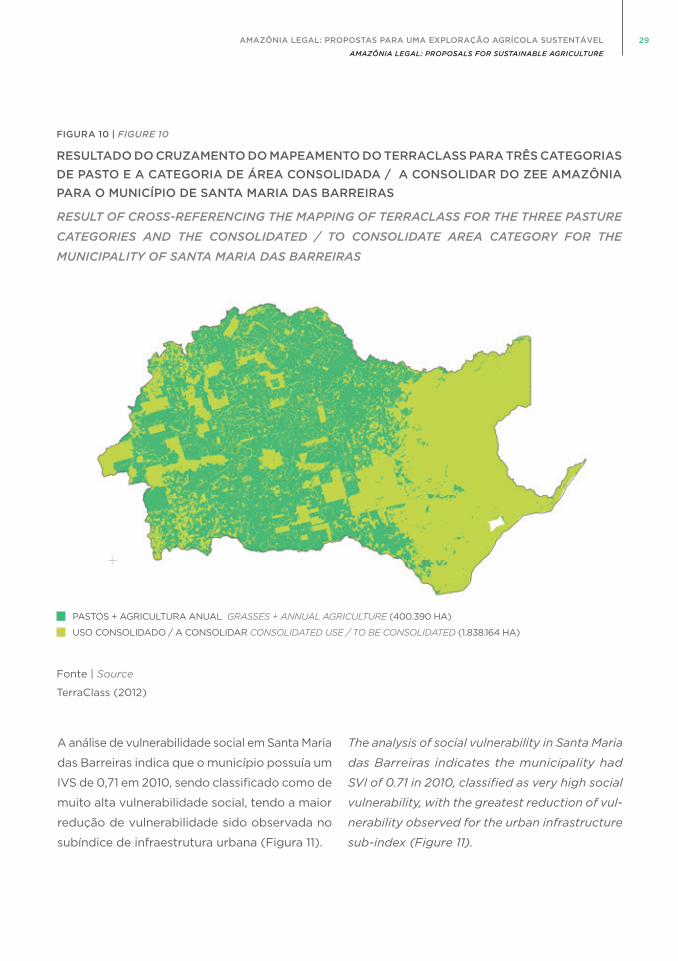
FIGURA 10 | FIGURE 10
RESULTADO DO CRUZAMENTO DO MAPEAMENTO DO TERRACLASS PARA TRÊS CATEGORIAS
DE PASTO E A CATEGORIA DE ÁREA CONSOLIDADA / A CONSOLIDAR DO ZEE AMAZÔNIA
PARA O MUNICÍPIO DE SANTA MARIA DAS BARREIRAS
RESULT OF CROSS-REFERENCING THE MAPPING OF TERRACLASS FOR THE THREE PASTURE
CATEGORIES AND THE CONSOLIDATED / TO CONSOLIDATE AREA CATEGORY FOR THE
MUNICIPALITY OF SANTA MARIA DAS BARREIRAS
A análise de vulnerabilidade social em Santa Maria
das Barreiras indica que o município possuía um
IVS de 0,71 em 2010, sendo classificado como de
muito alta vulnerabilidade social, tendo a maior
redução de vulnerabilidade sido observada no
subíndice de infraestrutura urbana (Figura 11).
The analysis of social vulnerability in Santa Maria
das Barreiras indicates the municipality had
SVI of 0.71 in 2010, classified as very high social
vulnerability, with the greatest reduction of vul-
nerability observed for the urban infrastructure
sub-index (Figure 11).
Fonte | Source
TerraClass (2012)
PASTOS + AGRICULTURA ANUAL GRASSES + ANNUAL AGRICULTURE (400.390 HA)
USO CONSOLIDADO / A CONSOLIDAR CONSOLIDATED USE / TO BE CONSOLIDATED (1.838.164 HA)

30
FIGURA 11 | FIGURE 11
ANÁLISE DE VULNERABILIDADE SOCIAL (IVS) EM SANTA MARIA DAS BARREIRAS
ANALYSIS OF SOCIAL VULNERABILITY (SVI) IN SANTA MARIA DAS BARREIRAS
Fonte | Source
Atlas de Vulnerabilidade Social (2015)
MUNICÍPIO DE ALTAMIRA (PA)
Diferentemente do município de Santa Maria
das Barreiras, nos últimos anos, verificou-se a
tendência de aumento na taxa de desmatamento
anual no município de Altamira. No entanto, a
taxas são menores do que o avanço do rebanho
bovino (Figura 12).
A análise da evolução da porcentagem da área
desmatada em relação à sua área total demonstrou
que, entre 2000 e 2013, essa porcentagem foi baixa
e variou de aproximadamente 1% para 5%. 6 Porém,
é preciso levar em consideração que o município
de Altamira é o maior do Brasil e o terceiro maior
6 PRODES, 2015.
MUNICIPALITY OF ALTAMIRA - PA
In contrast to the situation of Santa Maria das
Barreiras, in recent years the tendency has
been for an increase in the annual deforestation
rate in the municipality de Altamira, but at a
lower rate than the increase in the number of
cattle (Figure 12).
The analysis of the percentage of deforested
area in relation to its total area demonstrated
that from 2000 to 2013 this percentage was low
and varied from about 1% to 5%. 6 However, it is
necessary to consider that Altamira is the larg-
est municipality in Brazil and the third largest
6 PRODES, 2015.
IVS INFRAESTRUTURA URBANA IVS CAPITAL HUMANO IVS RENDA E TRABALHO
0,720
0,514
0,788
0,6060,635
0,479
2000 2010
SVI URBAN INFRASTRUCTURE SVI HUMAN CAPITAL SVI INCOME AND LABOR

31 AMAZÔNIA LEGAL: PROPOSTAS PARA UMA EXPLORAÇÃO AGRÍCOLA SUSTENTÁVEL
AMAZÔNIA LEGAL: PROPOSALS FOR SUSTAINABLE AGRICULTURE
do mundo. Ademais, a análise da evolução da área
colhida indica uma redução, principalmente de
2005 a 2008, com gradual elevação entre 2009
e 2011, seguida pela sua estabilização até 2013. 7 É
importante destacar que o desmatamento passou
de 3%, em 2000, para 4%, em 2013.
No caso do município de Altamira, a espacializa-
ção do desmatamento é ilustrada na Figura 13.
O município apresenta uma extensão do desma-
tamento no total de 469.367 hectares, ou seja,
3% da área do município a partir das análises do
estudo TerraClass, de 2012.
7 IBGE, 2015.
in the world in terms of landmass. Furthermore,
the area planted for grazing declined, mainly
from 2005 to 2008, followed by elevation be-
tween 2009 and 2011 and then stabilization until
2013. 7 It is important to note that deforestation
increased from 3% in 2000 to 4% in 2013.
The spatial pattern of deforestation in Altamira
is illustrated in Figure 13. The municipality pres-
ents a total deforested area of 469,367 hectares,
or 3% of its area, based on the analyses of the
TerraClass study from 2012.
7 IBGE, 2015.
FIGURA 12 | FIGURE 12
DESMATAMENTO E BOVINOCULTURA EM ALTAMIRA ENTRE 2000 E 2013
DEFORESTATION AND CATTLE BREEDING IN ALTAMIRA BETWEEN 2000 AND 2013
Fonte | Source
IBGE (2015); PRODES (2015)
0
1
2
3
4
5
6
7
8
2000 2001 2002 2003 2004 2005 2006 2007 2008 2009 2010 2011 2012 2013
DESMATAMENTO (MILHARES DE HECTARES) BOVINOCULTURA (MILHARES DE ANIMAIS)
DEFORESTATION (THOUSANDS OF HECTARES) CATTLE BREEDING (THOUSANDS OF HEAD)

32
FIGURA 13 | FIGURE 13
DESMATAMENTO E OCUPAÇÃO DO SOLO NO MUNICÍPIO DE ALTAMIRA
DEFORESTATION AND LAND OCCUPATION IN THE MUNICIPALITY DE ALTAMIRA
CLASSE CLASS
DESFLORESTAMENTO DEFORESTATION (22.845 HA)
PASTO LIMPO CLEAN GRASS (271.847 HA)
PASTO SUJO DIRTY GRASS (108.055 HA)
REGENERAÇÃO COM PASTO RECOVERY WITH GRASS (66.620 HA)
TOTAL TOTAL (469.367 HA)
FLORESTA FOREST (14.644.858 HA)
OUTROS OTHER (789.796 HA)
RECORTE SAMPLE
LIMITE MUNICIPAL MUNICIPAL LIMITS
LIMITE ESTADUAL STATE LIMITS
Fonte | Source
TerraClass (2012)
PARÁ

33 AMAZÔNIA LEGAL: PROPOSTAS PARA UMA EXPLORAÇÃO AGRÍCOLA SUSTENTÁVEL
AMAZÔNIA LEGAL: PROPOSALS FOR SUSTAINABLE AGRICULTURE
A partir do cruzamento do ZEE da Amazônia
para o município de Altamira – utilizando-se
somente as categorias áreas de uso consoli-
dado – com as classes de pasto e agricultura,
obtém-se como resultado o mapa da Figura 14.
Assim, observa-se que o mapeamento dos pas-
tos está de acordo com os indicativos de uso
do ZEE, considerando-se as classes pasto limpo,
pasto sujo e pasto com solo exposto. Por outro
lado, as áreas de pastagens (108.055 hectares)
consideradas na classe pastos sujos indicam um
processo de degradação e representam oportu-
nidades de intervenção visando à recuperação
e à intensificação da produção nestas áreas.
The map in Figure 14 was produced by cross-ref-
erencing the EEZ of the Amazon for the munic-
ipality of Altamira – using only the consolidated
use area categories – with the classes of pasture
and cropped land.
It can be observed that the mapping of pastures is
in accordance with the indications of the EEZ,con-
sidering the classes clean pasture, weedy pasture
and pasture with exposed soil. On the other hand,
the existence of the pasture areas considered in
the weedy pasture class (108,055 hectares) indi-
cates a process of degradation and represents
opportunities for intervention for recuperation
and intensification of production in these areas.

34
FIGURA 14 | FIGURE 14
RESULTADO DO CRUZAMENTO DO MAPEAMENTO DO TERRACLASS PARA TRÊS CATEGORIAS
DE PASTO E A CATEGORIA DE ÁREA CONSOLIDADA / A CONSOLIDAR DO ZEE AMAZÔNIA
PARA O MUNICÍPIO DE ALTAMIRA
RESULT OF CROSS-REFERENCING THE MAPPING OF TERRACLASS FOR THE THREE PASTURE
CATEGORIES AND THE CONSOLIDATED / TO CONSOLIDATE AREA CATEGORY FOR THE
MUNICIPALITY OF ALTAMIRA
Fonte | Source
TerraClass (2012)
PASTOS + AGRICULTURA ANUAL GRASSES + ANNUAL AGRICULTURE (469.367 HA)
USO CONSOLIDADO / A CONSOLIDAR CONSOLIDATED USE / TO BE CONSOLIDATED (2.230.389 HA)
35 AMAZÔNIA LEGAL: PROPOSTAS PARA UMA EXPLORAÇÃO AGRÍCOLA SUSTENTÁVEL
AMAZÔNIA LEGAL: PROPOSALS FOR SUSTAINABLE AGRICULTURE
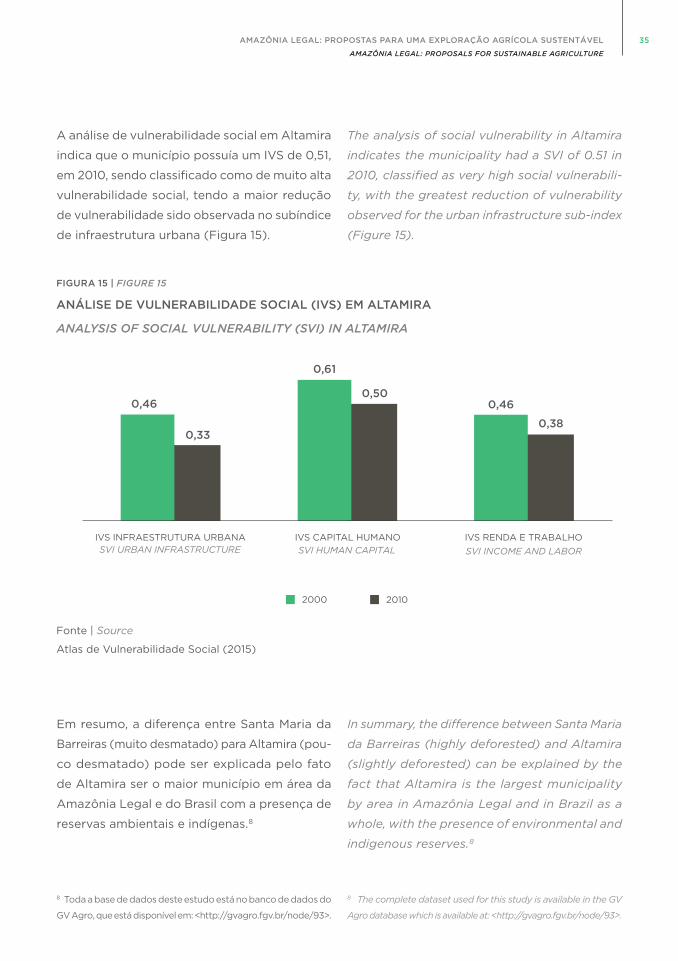
The analysis of social vulnerability in Altamira
indicates the municipality had a SVI of 0.51 in
2010, classified as very high social vulnerabili-
ty, with the greatest reduction of vulnerability
observed for the urban infrastructure sub-index
(Figure 15).
In summary, the difference between Santa Maria
da Barreiras (highly deforested) and Altamira
(slightly deforested) can be explained by the
fact that Altamira is the largest municipality
by area in Amazônia Legal and in Brazil as a
whole, with the presence of environmental and
indigenous reserves. 8
8 The complete dataset used for this study is available in the GV
Agro database which is available at: <http://gvagro.fgv.br/node/93>.
A análise de vulnerabilidade social em Altamira
indica que o município possuía um IVS de 0,51,
em 2010, sendo classificado como de muito alta
vulnerabilidade social, tendo a maior redução
de vulnerabilidade sido observada no subíndice
de infraestrutura urbana (Figura 15).
Em resumo, a diferença entre Santa Maria da
Barreiras (muito desmatado) para Altamira (pou-
co desmatado) pode ser explicada pelo fato
de Altamira ser o maior município em área da
Amazônia Legal e do Brasil com a presença de
reservas ambientais e indígenas. 8
8 Toda a base de dados deste estudo está no banco de dados do
GV Agro, que está disponível em: <http://gvagro.fgv.br/node/93>.
FIGURA 15 | FIGURE 15
ANÁLISE DE VULNERABILIDADE SOCIAL (IVS) EM ALTAMIRA
ANALYSIS OF SOCIAL VULNERABILITY (SVI) IN ALTAMIRA
Fonte | Source
Atlas de Vulnerabilidade Social (2015)
0,33
0,61
0,500,46
0,38
0,46
IVS INFRAESTRUTURA URBANA IVS CAPITAL HUMANO IVS RENDA E TRABALHO
2000 2010
SVI URBAN INFRASTRUCTURE SVI HUMAN CAPITAL SVI INCOME AND LABOR

36

37 AMAZÔNIA LEGAL: PROPOSTAS PARA UMA EXPLORAÇÃO AGRÍCOLA SUSTENTÁVEL
AMAZÔNIA LEGAL: PROPOSALS FOR SUSTAINABLE AGRICULTURE
SISTEMAS PRODUTIVOS SUSTENTÁVEIS
NA AMAZÔNIA LEGAL
SUSTAINABLE PRODUCTIVE SYSTEMS
IN AMAZÔNIA LEGAL
No levantamento e na caracterização dos siste-
mas produtivos agropecuários de baixa emissão
de carbono na Amazônia Legal, foram utilizadas
três fontes de informações:
• Literatura: informações publicadas em teses,
artigos, relatórios, boletins e sites institucionais;
• Consulta a especialistas: sobretudo para
validação das informações encontradas
na literatura;
• Linha de base do Plano ABC: este plano do
Ministério da Agricultura, Pecuária e Abas-
tecimento, tem por finalidade a organização
e o planejamento de ações ligadas à adoção
de tecnologias de produção sustentáveis que
estejam alinhadas com os compromissos as-
sumidos pelo país de redução de emissão de
gases de efeito estufa no setor agropecuário.
Entre 2011 e 2012, equipes da Empresa Bra-
sileira de Pesquisa Agropecuária (Embrapa)
percorreram todos os biomas brasileiros
com o objetivo de subsidiar o Plano ABC
no que tange à contabilidade do potencial
de carbono armazenado no solo a partir da
adoção das tecnologias de baixo carbono.
The investigation and characterization of the
crop-livestock productive systems with low
carbon emissions in Amazônia Legal relied on
three sources of information:
• Literature: information published in theses,
reports, bulletins and institutional websites;
• Consultation with specialists: especially
to validate the information found in the
literature;
• Baseline of the ABC Plan: This plan by the
Ministry of Agriculture, Livestock and Food
Supply aims to organize and coordinate
actions linked to the adoption of sustainable
production technologies that are in line with
the commitments assumed by the country
to reduce greenhouse gas emissions in
the agricultural sector. Between 2011 and
2012, teams from The Brazilian Agriculture
Research Corporation (Embrapa) visited
all Brazilian biomes with the objective of
supporting the ABC Plan, in which the
group quantified the potential for carbon
storage in the soil from the adoption of
low-carbon technologies.

38
Com base nas informações levantadas pelo
estudo foram descritos 29 arranjos de sistemas
produtivos nas seguintes modalidades:
• Pastos bem manejados;
• Integração lavoura-pecuária (ILP);
• Integração lavoura-pecuária-floresta (ILPF);
• Sistemas agroflorestais (SAF). 1
Os resultados preliminares dos sistemas pro-
dutivos mapeados indicam que, de acordo
com as fontes consultadas, pode-se observar
que existem diversos arranjos para os sistemas
produtivos integrados na Amazônia Legal. No
entanto, alguns componentes vegetais e arbó-
reos são predominantes nesses arranjos para
os sistemas ILP e ILPF, como:
1 É importante ressaltar que, apesar de os SAFs caracteriza-
dos não apresentarem o componente tecnológico animal,
ou seja, não estarem ligados diretamente à cadeia de carne,
eles possuem importância significativa no cenário agrícola da
Amazônia Legal, principalmente para a agricultura familiar.
Based on the information obtained during the
study, 29 productive system arrangements were
described, in the following modalities:
• Well-managed pasture;
• Crop-livestock integration (CLI);
• Crop-livestock-forest integration (CLFI);
• Agro-forestry system (AFS). 1
The preliminary results of the productive sys-
tems mapped indicate that, according to the
sources consulted, many possible arrange-
ments exist for integrated productive systems
in Amazônia Legal. However, some plant and
tree components are predominant in these
arrangements in the case of the CLI and CLFI
systems, such as:
1 It is important to stress that the AFSs characterized do not include
large-scale stock breeding for meat production. The importance of
livestock in this scenario of Amazônia Legal is mainly represented
by farm animals owned by family farmers.
ARROZRICE
FEIJÃOBEAN
BRAQUIÁRIABRACHIARIA
SOJASOY
MILHOCORN
TECATEAK
ARROZRICE
FEIJÃOBEAN
SOJASOY
MILHOCORN
EUCALIPTOEUCALYPTUS
ILP
ILPF

39 AMAZÔNIA LEGAL: PROPOSTAS PARA UMA EXPLORAÇÃO AGRÍCOLA SUSTENTÁVEL
AMAZÔNIA LEGAL: PROPOSALS FOR SUSTAINABLE AGRICULTURE
Além disso, em alguns arranjos produtivos de
gado de corte, foi identificada a inserção do sis-
tema ILP por aproximadamente dois anos iniciais
para promover a recuperação da pastagem, por
meio da melhoria da fertilidade, da microbiota e
da estruturação do solo, acarretando aumento
da sua capacidade de suporte.
Em se tratando de pastagens solteiras, foi identi-
ficada que a principal forma de se promover a sua
melhoria, com vistas a tornar-se uma pastagem
de boa qualidade e altamente eficiente, é pela
sua consorciação com leguminosas forrageiras.
Isso, por sua vez, promove a diminuição do uso
de adubos nitrogenados e maior suporte para
essas pastagens.
RECOMENDAÇÃO PARA ANÁLISE DE SISTE-
MAS PRODUTIVOS – METODOLOGIA FIAS
A partir da metodologia elaborada para a análise dos
sistemas produtivos na Amazônia Legal com base
no estudo Innovation and Access to Technologies for
Sustainable Development: Diagnosing Weaknesses
and Identifying Interventions in the Transnational
Arena, 2 desenvolvido por pesquisadores da
Universidade de Harvard , foi construído um mo-
delo de classificação/identificação dos sistemas
produtivos denominado de Fluxo para Implantação
da Agropecuária Sustentável (FIAS). (Figura 16).
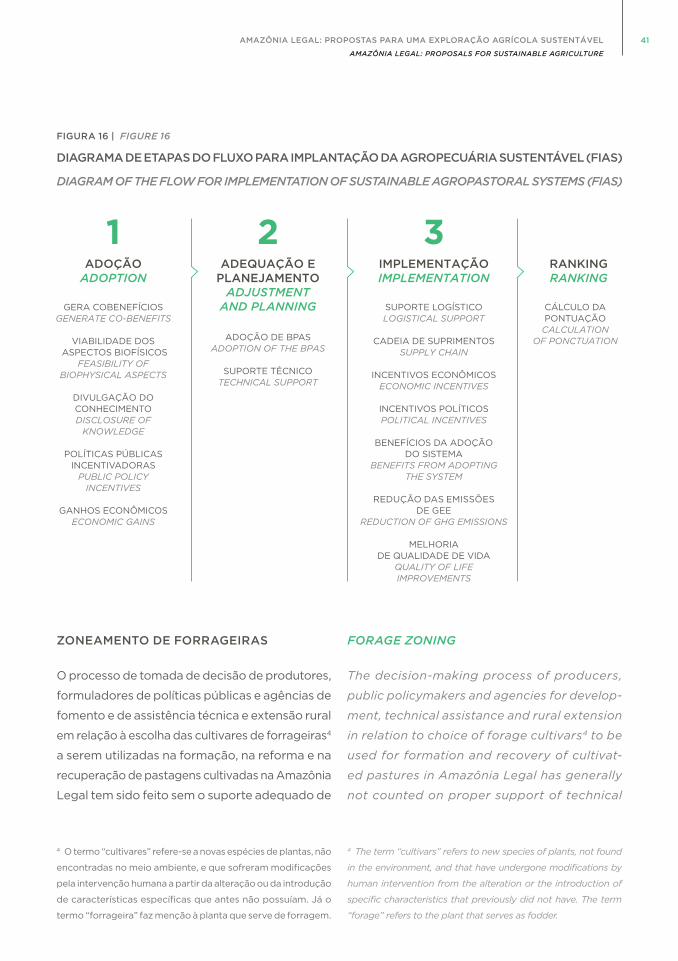
A classificação da metodologia FIAS proposta
foi dividida em três fases:
• Fase I – Adoção;
• Fase II – Adequação e planejamento; e
• Fase III – Implementação.
2 ANADON et al., 2014.
Furthermore, in some productive arrange-
ments involving beef cattle, the benefit was
identified of inserting the CLI system for ap-
proximately two years, to promote recovery
of the pasture by improving its fertility, mi-
crobiota and soil structure, to increase the
carrying capacity.
In the case of areas only with pasture, it was
identified that the main way to improve them
for increased quality and efficiency is by com-
bination with forage legumes. In turn, this re-
duces the need for nitrogen fertilizer and gives
greater support to these pastures.
RECOMMENDATION FOR ANALYSIS OF PRO-
DUCTIVE SYSTEMS - FIAS METHODOLOGY
Through application of the method formulat-
ed for analysis of the productive systems in
Amazônia Legal based on the study Innovation
and Access to Technologies for Sustainable
Development: Diagnosing Weakness and Identi-
fying Interventions in the Transnational Arena, 2
developed by Harvard University’s researchers,
a model was constructed for classification/iden-
tification of the productive systems called Flow
for Implementation of Sustainable Agricultural
Systems (FIAS). (Figure 16).
The classification by the proposed FIAS meth-
odology was divided into three phases:
• Phase I – Adoption;
• Phase II – Adjustment and planning; and
• Phase III – Implementation.
2 ANADON et al., 2014.

40
A proposta do FIAS é validar essa metodologia
de análise entre atores que atuam na área. Os sis-
temas mapeados foram classificados segundo a
metodologia FIAS, neste projeto, em uma primeira
tentativa, apresentando resultados subjetivos. 3
As principais considerações desse modelo de
ranking são:
• O sistema de pontuação varia de 0 a 5, sendo
que: 0 = sem informação; 1 = muito baixo; 2
= baixo; 3 = médio; 4 = alto; e 5 = muito alto.
• Os sistemas podem alcançar pontuação máxi-
ma de 75 pontos na soma dos 15 indicadores.
• Foram incluídos 29 sistemas produtivos.
• Para a análise dos sistemas produtivos ABC na
planilha FIAS, foram utilizadas três fontes de
informações: literatura, consulta a especialistas
e a linha de base do Plano ABC feita em 2011.
• A classificação da fase de desenvolvimento
pode ser feita por análise indutiva, utilizan-
do-se o conhecimento do especialista, ou
por análise de critério, utilizando-se informa-
ções publicadas na literatura especializada.
É importante ressaltar que os critérios supraci-
tados, sobretudo os componentes tecnológicos,
podem variar de acordo com o sistema pecuário
produtivo analisado, uma vez que cada região tem
particularidades que influenciam diretamente no
tipo de manejo do sistema produtivo adotado.
3 A metodologia FIAS foi aplicada como um teste durante a
elaboração da presente pesquisa, tendo os seus resultados
preliminares analisados pelos autores.
The idea behind the FIAS model is to vali-
date this methodology for analysis among
the actors in the area. The systems mapped
were classified according to the FIAS model
in this project in a first attempt, producing
subjective results. 3
The main considerations of this ranking model are:
• The scoring system goes from 0 to 5, where
0 = no information; 1 = very low; 2 = low;
3 = medium; 4 = high; and 5 = very high.
• The systems can attain a maximum score of
75 points from the sum of the 15 indicators.
• 29 production systems were included.
• To analyze the ABC productive systems in the
FIAS spreadsheet, three information sources
were used: literature, consultation with spe-
cialists and ABC Plan baseline in 2011.
• The classification of the development phase
can be done by inductive analysis (using
the knowledge of a specialist) or by criteria
(using information published in the special-
ized literature).
It is important to mention that the criteria
mentioned above, especially the technological
components, can vary according to the stock
breeding system analyzed, since each region
has its own peculiarities, with direct influence
on the type of management of the productive
system adopted.
3 This FIAS model was applied as a test during the project, and
its preliminary results were analyzed by the authors.
41 AMAZÔNIA LEGAL: PROPOSTAS PARA UMA EXPLORAÇÃO AGRÍCOLA SUSTENTÁVEL
AMAZÔNIA LEGAL: PROPOSALS FOR SUSTAINABLE AGRICULTURE
FIGURA 16 | FIGURE 16
DIAGRAMA DE ETAPAS DO FLUXO PARA IMPLANTAÇÃO DA AGROPECUÁRIA SUSTENTÁVEL (FIAS)
DIAGRAM OF THE FLOW FOR IMPLEMENTATION OF SUSTAINABLE AGROPASTORAL SYSTEMS (FIAS)
ZONEAMENTO DE FORRAGEIRAS
O processo de tomada de decisão de produtores,
formuladores de políticas públicas e agências de
fomento e de assistência técnica e extensão rural
em relação à escolha das cultivares de forrageiras 4
a serem utilizadas na formação, na reforma e na
recuperação de pastagens cultivadas na Amazônia
Legal tem sido feito sem o suporte adequado de
4 O termo “cultivares” refere-se a novas espécies de plantas, não
encontradas no meio ambiente, e que sofreram modificações
pela intervenção humana a partir da alteração ou da introdução
de características específicas que antes não possuíam. Já o
termo “forrageira” faz menção à planta que serve de forragem.
FORAGE ZONING
The decision-making process of producers,
public policymakers and agencies for develop-
ment, technical assistance and rural extension
in relation to choice of forage cultivars 4 to be
used for formation and recovery of cultivat-
ed pastures in Amazônia Legal has generally
not counted on proper support of technical
4 The term “cultivars” refers to new species of plants, not found
in the environment, and that have undergone modifications by
human intervention from the alteration or the introduction of
specific characteristics that previously did not have. The term
“forage” refers to the plant that serves as fodder.
ADOÇÃOADOPTION
ADEQUAÇÃO EPLANEJAMENTO
ADJUSTMENTAND PLANNING
IMPLEMENTAÇÃOIMPLEMENTATION
RANKINGRANKING
GERA COBENEFÍCIOSGENERATE CO-BENEFITS
VIABILIDADE DOS ASPECTOS BIOFÍSICOS
FEASIBILITY OF BIOPHYSICAL ASPECTS
DIVULGAÇÃO DO CONHECIMENTODISCLOSURE OF
KNOWLEDGE
POLÍTICAS PÚBLICAS INCENTIVADORAS
PUBLIC POLICY INCENTIVES
GANHOS ECONÔMICOSECONOMIC GAINS
ADOÇÃO DE BPASADOPTION OF THE BPAS
SUPORTE TÉCNICOTECHNICAL SUPPORT
SUPORTE LOGÍSTICOLOGISTICAL SUPPORT
CADEIA DE SUPRIMENTOSSUPPLY CHAIN
INCENTIVOS ECONÔMICOSECONOMIC INCENTIVES
INCENTIVOS POLÍTICOSPOLITICAL INCENTIVES
BENEFÍCIOS DA ADOÇÃODO SISTEMA
BENEFITS FROM ADOPTINGTHE SYSTEM
REDUÇÃO DAS EMISSÕESDE GEE
REDUCTION OF GHG EMISSIONS
MELHORIA DE QUALIDADE DE VIDA
QUALITY OF LIFE IMPROVEMENTS
CÁLCULO DA PONTUAÇÃO
CALCULATIONOF PONCTUATION
1 2 3
42
informações técnicas sobre a adaptação das di-
ferentes cultivares de gramíneas e leguminosas
forrageiras disponíveis no mercado aos diversos
ambientes existentes na Amazônia Legal. O uso
de cultivares de forrageiras não adaptadas a es-
sas condições ambientais tem causado grandes
perdas econômicas, além dos impactos sociais
e econômicos decorrentes da degradação de
extensas áreas de pastagens na região. 5
Padrões gerais de clima e grandes extensões com
solos semelhantes são a base para a caracteriza-
ção ambiental nos trópicos. Essas classificações
podem ser usadas de forma efetiva para indicar
faixas amplas de adaptação para forrageiras
tropicais. A partir do ano 2000, iniciativas de
zoneamento de risco edáfico de morte de pasta-
gens da espécie Brachiaria brizantha cv. Marandu
tiveram grande sucesso em propiciar informações
adequadas sobre esse problema aos produtores,
aos técnicos das organizações de fomento e de
Assistência Técnica e Extensão Rural (ATER) e
aos formuladores de políticas do estado do Acre. 6
O zoneamento para as principais cultivares de
gramíneas e leguminosas forrageiras lançadas,
ou recomendadas pela Embrapa, e já em uso em
larga escala nos estados da Amazônia Legal em
função das variáveis de clima e solo podem ser
verificadas na Tabela 1.
O zoneamento forrageiro das áreas desmatadas
da Amazônia Legal pode utilizar uma matriz que
integra as exigências das cultivares de forrageiras
recomendadas com as bases de dados pedológicos,
na escala 1:250.000, do IBGE, e os mapas de uso
5 SCOLESE, 2000; KISS, 2012.
6 VALENTIM et al., 2000a, 2000b e 2002; AMARAL et al., 2006;
ANDRADE & VALENTIM, 2007; MANZATTO et al., 2008.
information regarding the adaptation of the
different grass and legume cultivars available
in the market to the various environmental con-
ditions in Amazônia Legal region. The use of
forage cultivars not adapted to these environ-
mental conditions has caused large economic
losses, besides social and economic impacts
resulting from degradation of extensive pas-
ture areas in the region. 5
General climate patterns and large areas with
similar soils are the bases for environmental
characterization in the tropics. These classi-
fications can be used effectively to indicate
broad ranges of adaptation for tropical for-
age plants. Since 2000, initiatives for edaphic
zoning for risk of death of pastures of Bra-
chiaria brizantha cv. Marandu have had much
success in providing adequate information
about this problem to producers, technicians
of development agencies, Program for Tech-
nical Assistance and Rural Extension (ATER)
and public policymakers in the state of Acre. 6
The zoning for the main grass and forage le-
gume cultivars launched or recommended by
Embrapa and already widely used in the states
of Amazônia Legal in function of the climate
and soil variables can be seen in Table 1.
The forage zoning of deforested areas of
Amazônia Legal can utilize a matrix that inte-
grates the requirements of the recommended
cultivars with the pedologic databases, on a
scale of 1:250,000 from IBGE, land use maps
5 SCOLESE, 2000; KISS, 2012.
6 VALENTIM et al., 2000a, 2000b e 2002; AMARAL et al., 2006;
ANDRADE & VALENTIM, 2007; MANZATTO et al., 2008.

43 AMAZÔNIA LEGAL: PROPOSTAS PARA UMA EXPLORAÇÃO AGRÍCOLA SUSTENTÁVEL
AMAZÔNIA LEGAL: PROPOSALS FOR SUSTAINABLE AGRICULTURE
e a cobertura da terra do projeto TerraClass, de
2012, 7 além da base de dados de clima da Amazônia
Legal (Tabela 1). As variáveis abióticas para inclu-
são na avaliação da adaptação das cultivares às
características pedológicas e climáticas para o
zoneamento forrageiro das áreas desmatadas da
Amazônia Legal podem ser as descritas a seguir:
• Solo: tolerância à acidez – alta, mediana e
baixa –, faixa de saturação de base requerida,
saturação de alumínio tolerada, textura do
solo e alagamento;
• Clima: precipitação anual, tolerância ao
período seco, temperatura máxima, tem-
peratura mínima no período em que a taxa
de acúmulo de matéria seca se aproxima do
nulo e temperatura ótima.
Os valores ou classes para cada variável po-
dem ser definidos a partir dos resultados de
pesquisa com pastagens e forrageiras tropicais
na Amazônia Legal e com base na literatura. 8
O próximo passo desejável é validar e deba-
ter o conteúdo da Tabela 1 em um workshop
com especialistas em Sistemas de Informações
Geográficas (SIG), clima, solos, pastagens e for-
rageiras que conhecem ou atuam na Amazônia
Legal. Com base nisso, será possível elaborar
a primeira versão dos mapas do zoneamento.
Depois, será necessária uma validação de campo,
contando com o apoio dos especialistas e dos
produtores na Amazônia Legal. Com isso, será
possível gerar mapas, documentos descritivos
e recomendações de modo que as informações
sejam disponibilizadas para a sociedade.
7 INPE & EMBRAPA, 2015.
8 PITMAN, 2000; COOK et al., 2005.
from the TerraClass project in 2012 7 and a cli-
mate database of Amazônia Legal (Table 1). The
abiotic variables for inclusion in the evaluation
of adaptation of cultivars to the pedologic and
climatic characteristics for forage zoning of
the deforested areas of Amazônia Legal are
described below:
• Soil: tolerance to acidity – high, medium
and low, required base saturation range,
aluminum saturation tolerated, soil texture,
and flooding;
• Climate: annual rainfall, tolerance to drought,
maximum temperature, minimum tempera-
ture in the period when the accumulation of
dry matter is nil, and optimal temperature.
The values or classes for each variable can
be defined based on the results of research
with tropical pastures and forage grasses in
Amazônia Legal and based on the literature. 8
The next desirable step is to validate and de-
bate the content of Table 1 in a workshop with
specialists in geographic information systems
(GIS), climate, soils, pastures and forage grass-
es, who know or work in Amazônia Legal.
Based on this, it will be possible to produce
a first version of the zoning maps. Afterward,
it will be necessary to conduct field valida-
tion, with the support of the specialists and
producers in Amazônia Legal. Once having
completed these steps, it will be possible to
generate the maps and descriptive documents
to make available to society.
7 INPE & EMBRAPA, 2015.
PITMAN, 2000; COOK et al., 2005.

44
The adaptation of the method for interpreting
the agricultural fitness of soils, 9 considering
the following levels of soil and pasture man-
agement, is recommended:
9 RAMALHO FILHO et al., 1995.
A adaptação da metodologia de interpretação
da aptidão agrícola dos solos, 9 considerando
os seguintes níveis de manejo do solo e das
pastagens, é recomendada:
9 RAMALHO FILHO et al., 1995.
NÍVEL LEVEL
APOUCO TECNIFICADO
OU RUDIMENTAR
LOW OR RUDIMENTARY
TECHNIFICATION
Práticas agrícolas que refletem baixo
nível técnico; manejo de pastagens
sob lotação contínua ou alternada;
uso do fogo ou roçagem manual no
controle de plantas daninhas.
The agricultural practices involve low technical level; management of pastures under continuous or alternated grazing; and use of fire or manual cutting to
control weeds.
NÍVEL LEVEL
B MEDIANAMENTE
TECNIFICADO
MEDIUM TECHNIFICATION
As práticas de manejo estão condi-
cionadas a um nível razoável de
conhecimento técnico, à aplicação
moderada de capital e à utilização
de resultados de pesquisa para
manutenção e melhoramento das
condições das terras agrícolas, das
pastagens e das lavouras, à me-
canização com tração animal ou
tratorizada para desbravamento
(destoca e enleiramento) e prepa-
ro inicial do solo, à análise de solo,
calagem, adubação, ao uso de se-
mentes de bom valor cultural, com
taxa de semeadura recomendada, a
tratamentos fitossanitários simples,
ao controle de plantas daninhas com
herbicidas e/ou roçagem mecâni-
ca, ao manejo das pastagens sob
lotação contínua, alternada e parte
da área de pastagens manejada sob
lotação rotacionada.
The management practices rely on a medium level of technical knowl-edge; moderate application of cap-ital and use of research results for maintenance and improvement of conditions of pastures and crops; mechanization with animal or ve-hicle traction for clearance (stump removal and windrowing) and initial soil preparation; soil analysis; liming, fertilization; use of seeds with good crop value, with recommended sowing rate; simple phytosanitary treatments; weed control with herbicides and/or mechanical cutting; management of pastures under continuous, alternated
or rotational grazing.
NÍVEL LEVEL
C CONDICIONAMENTO A UM ALTO
NÍVEL DE CONHECIMENTO TECNOLÓGICO
DEPENDING ON A HIGH LEVEL OF
TECHNOLOGICAL KNOWLEDGE
Dão-se a aplicação intensiva de ca-
pital e a utilização de resultados de
pesquisa para manutenção e melho-
ramento das condições das terras
agrícolas e das pastagens e lavouras.
As práticas de manejo são conduzidas
com o auxílio de maquinário agrope-
cuário, e os produtores têm acesso a
conhecimentos técnicos e operacio-
nais capazes de elevar a capacidade
produtiva e que incluem mecanização
adequada, análise de solo, calagem e
adubação, uso de sementes com alto
valor cultural e taxa de semeadura
recomendada, tratos fitossanitários,
controle de plantas daninhas com
herbicidas e/ou roçagem mecânica,
plantio direto, com rotação de cultu-
ras e sementes melhoradas, sistemas
ILP e ILPF, uso de sistemas de manejo
das pastagens e dos rebanhos sob
lotação rotacionada e medidas de
controle de erosão.
The management practices rely on a medium level of technical knowledge; moderate application of capital and use of research results for maintenance and improvement of conditions of pastures and crops; mechanization with animal or vehicle traction for clearance (stump removal and windrowing) and initial soil preparation; soil analysis; liming, fertiliza-tion; use of seeds with good crop value, with recommended sowing rate; simple phytosanitary treatments; weed control with herbicides and/or mechanical cut-ting; management of pastures under con-tinuous, alternated or rotational grazing.

45 AMAZÔNIA LEGAL: PROPOSTAS PARA UMA EXPLORAÇÃO AGRÍCOLA SUSTENTÁVEL
AMAZÔNIA LEGAL: PROPOSALS FOR SUSTAINABLE AGRICULTURE
As cultivares de gramíneas e leguminosas for-
rageiras selecionadas podem ser classificadas
quanto ao seu potencial de uso em relação às
variáveis de clima e solo nas áreas antropizadas
da Amazônia Legal, em cada nível de manejo do
solo e das pastagens, utilizando a seguinte escala:
1. cultivo não recomendável;
2. pouco recomendável;
3. preferencial;
4. recomendável.
Enfim, vale destacar que, em etapas futuras
do presente projeto, pretende-se utilizar as
informações provenientes do ZEE abordadas
neste trabalho para inferir sobre a adoção ou
o sucesso dos sistemas agropecuários de baixa
emissão de carbono mapeados.
The grass and forage legume cultivars selected
can be classified regarding their potential for
use with respect to variables of climate and oil
in the anthropized areas of Amazônia Legal,
in each level of soil and pasture management,
using the following scale:
1. not recommended;
2. moderately recommended;
3. strongly recommended;
4. preferred.
For future developments of this project, the
intention is to use the information from the
EEZs addressed to make inferences about
the adoption or success of the low carbon
emissions agricultural systems mapped in this
stage of the project.
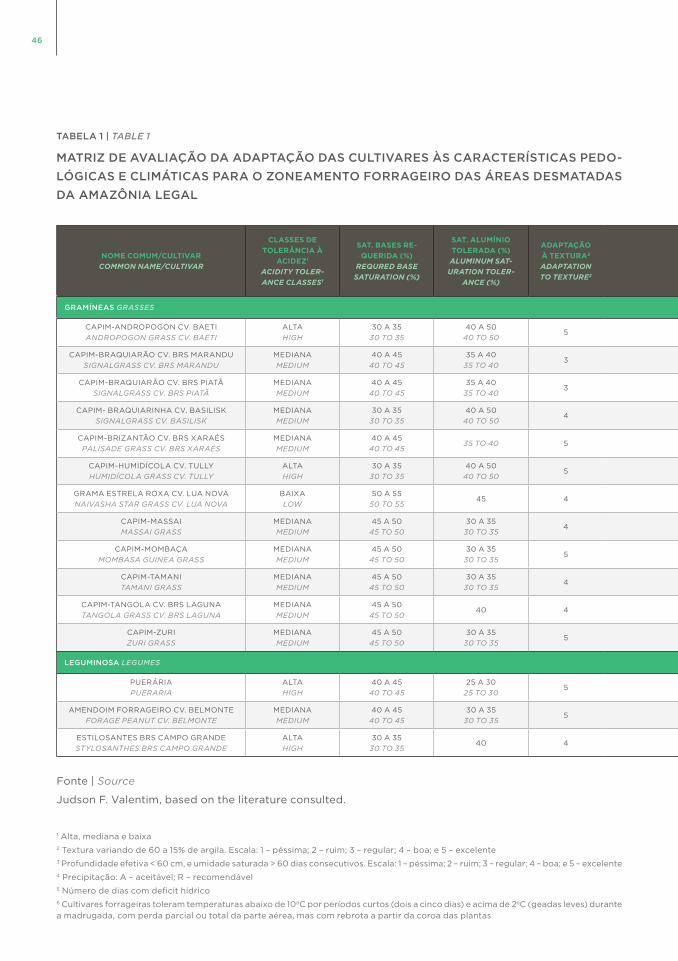
46
NOME COMUM/CULTIVAR
COMMON NAME/CULTIVAR
CLASSES DE
TOLERÂNCIA À
ACIDEZ1
ACIDITY TOLER-
ANCE CLASSES1
SAT. BASES RE-
QUERIDA (%)
REQURED BASE
SATURATION (%)
SAT. ALUMÍNIO
TOLERADA (%)
ALUMINUM SAT-
URATION TOLER-
ANCE (%)
ADAPTAÇÃO
À TEXTURA2
ADAPTATION
TO TEXTURE2
ADAPTAÇÃO A SOLOS DE BAIXA
PERMEABILIDADE (1 A 5)3
ADAPTATION TO SOILS WITH
LOW PERMEABILITY (1 TO 5)3
PRECIPITAÇÃO
ANUAL4
ANNUAL
RAINFALL (MM)4
TOLERÂNCIA AO
PERÍODO SECO
(DIAS)5
DROUGHT TOLERANCE
(DAYS)5
TEMP. MÁ-
XIMA (OC)
MAX. TEMP
(OC)
TEMP. MÍNI-
MA (OC)6
MIN. TEMP.
(OC)6
TEMP. ÓTIMA
(OC)
OPTIMAL
TEMP. (OC)
GRAMÍNEAS GRASSES
CAPIM-ANDROPOGON CV. BAETI
ANDROPOGON GRASS CV. BAETI
ALTA
HIGH
30 A 35
30 TO 35
40 A 50
40 TO 505 3
A > 750
R > 1.000270
35 A 40
35 TO 4015
25 A 35
25 TO 35
CAPIM-BRAQUIARÃO CV. BRS MARANDU
SIGNALGRASS CV. BRS MARANDU
MEDIANA
MEDIUM
40 A 45
40 TO 45
35 A 40
35 TO 403 1
A > 1.000
R > 1.200180
35 A 40
35 TO 4015
25 A 35
25 TO 35
CAPIM-BRAQUIARÃO CV. BRS PIATÃ
SIGNALGRASS CV. BRS PIATÃ
MEDIANA
MEDIUM
40 A 45
40 TO 45
35 A 40
35 TO 403 1
A > 1.000
R > 1.200180
35 A 40
35 TO 4015
25 A 35
25 TO 35
CAPIM- BRAQUIARINHA CV. BASILISK
SIGNALGRASS CV. BASILISK
MEDIANA
MEDIUM
30 A 35
30 TO 35
40 A 50
40 TO 504 3
A > 1.000
R > 1.200150
35 A 40
35 TO 4015
25 A 35
25 TO 35
CAPIM-BRIZANTÃO CV. BRS XARAÉS
PALISADE GRASS CV. BRS XARAÉS
MEDIANA
MEDIUM
40 A 45
40 TO 4535 TO 40 5 4
A > 1.000
R > 1.200180
35 A 40
35 TO 4015
25 A 35
25 TO 35
CAPIM-HUMIDÍCOLA CV. TULLY
HUMIDÍCOLA GRASS CV. TULLY
ALTA
HIGH
30 A 35
30 TO 35
40 A 50
40 TO 505 5
A > 1.200
R > 1.500150
35 A 40
35 TO 4015
25 A 35
25 TO 35
GRAMA ESTRELA ROXA CV. LUA NOVA
NAIVASHA STAR GRASS CV. LUA NOVA
BAIXA
LOW
50 A 55
50 TO 5545 4 5
A > 1.200
P > 1.500120
35 A 40
35 TO 4015
25 A 35
25 TO 35
CAPIM-MASSAI
MASSAI GRASS
MEDIANA
MEDIUM
45 A 50
45 TO 50
30 A 35
30 TO 354 3
A > 800
R > 1.000210
35 A 40
35 TO 4015
25 A 35
25 TO 35
CAPIM-MOMBAÇA
MOMBASA GUINEA GRASS
MEDIANA
MEDIUM
45 A 50
45 TO 50
30 A 35
30 TO 355 4
A > 1.000
R > 1.200150
35 A 40
35 TO 4015
25 A 35
25 TO 35
CAPIM-TAMANI
TAMANI GRASS
MEDIANA
MEDIUM
45 A 50
45 TO 50
30 A 35
30 TO 354 2
A > 1.000
R > 1.200150
35 A 40
35 TO 4015
25 A 35
25 TO 35
CAPIM-TANGOLA CV. BRS LAGUNA
TANGOLA GRASS CV. BRS LAGUNA
MEDIANA
MEDIUM
45 A 50
45 TO 5040 4 5
A > 1.200
P > 1.500120
35 A 40
35 TO 4015
20 A 30
20 TO 30
CAPIM-ZURI
ZURI GRASS
MEDIANA
MEDIUM
45 A 50
45 TO 50
30 A 35
30 TO 355 4
A > 1.000
R > 1.200150
35 A 40
35 TO 40 15
25 A 35
25 TO 35
LEGUMINOSA LEGUMES
PUERÁRIA
PUERARIA
ALTA
HIGH
40 A 45
40 TO 45
25 A 30
25 TO 305 5
A > 1.200
R > 1.500120
35 A 40
35 TO 4018 > 27
AMENDOIM FORRAGEIRO CV. BELMONTE
FORAGE PEANUT CV. BELMONTE
MEDIANA
MEDIUM
40 A 45
40 TO 45
30 A 35
30 TO 355 4
A > 1.200
R > 1.500150
35 A 40
35 TO 4015 > 27
ESTILOSANTES BRS CAMPO GRANDE
STYLOSANTHES BRS CAMPO GRANDE
ALTA
HIGH
30 A 35
30 TO 3540 4 1
A > 700
R > 1.200150
35 A 40
35 TO 4015 > 27
TABELA 1 | TABLE 1
MATRIZ DE AVALIAÇÃO DA ADAPTAÇÃO DAS CULTIVARES ÀS CARACTERÍSTICAS PEDO-
LÓGICAS E CLIMÁTICAS PARA O ZONEAMENTO FORRAGEIRO DAS ÁREAS DESMATADAS
DA AMAZÔNIA LEGAL
1 Alta, mediana e baixa2 Textura variando de 60 a 15% de argila. Escala: 1 – péssima; 2 – ruim; 3 – regular; 4 – boa; e 5 – excelente3 Profundidade efetiva < 60 cm, e umidade saturada > 60 dias consecutivos. Escala: 1 – péssima; 2 – ruim; 3 – regular; 4 – boa; e 5 – excelente4 Precipitação: A – aceitável; R – recomendável5 Número de dias com deficit hídrico6 Cultivares forrageiras toleram temperaturas abaixo de 10oC por períodos curtos (dois a cinco dias) e acima de 2oC (geadas leves) durante
a madrugada, com perda parcial ou total da parte aérea, mas com rebrota a partir da coroa das plantas
Fonte | Source
Judson F. Valentim, based on the literature consulted.

47 AMAZÔNIA LEGAL: PROPOSTAS PARA UMA EXPLORAÇÃO AGRÍCOLA SUSTENTÁVEL
AMAZÔNIA LEGAL: PROPOSALS FOR SUSTAINABLE AGRICULTURE
MATRIX FOR EVALUATION OF ADAPTATION OF CULTIVARS TO THE PEDOLOGIC AND CLIMATIC
CHARACTERISTICS FORAGE ZONING OF DEFORESTED AREAS OF AMAZÔNIA LEGAL
1 High, medium and low2 Texture varying from 60 to 15% clay. Scale: 1 – very poor; 2 – poor; 3 – medium; 4 – good; 5 – excellent3 Effective depth < 60 cm and saturated water content > 60 consecutive days. Scale: 1 – very poor; 2 – poor; 3 – medium; 4 – good; 5 – excellent4 Rainfall: A – Acceptable; R – Recommended5 Number of days with water deficit6 Forage species tolerate temperatures below 10oC for short periods (2 to 5 days) and above 2oC (slight frosts) in predawn hours, with partial or total loss of aboveground part but with resprouting
NOME COMUM/CULTIVAR
COMMON NAME/CULTIVAR
CLASSES DE
TOLERÂNCIA À
ACIDEZ1
ACIDITY TOLER-
ANCE CLASSES1
SAT. BASES RE-
QUERIDA (%)
REQURED BASE
SATURATION (%)
SAT. ALUMÍNIO
TOLERADA (%)
ALUMINUM SAT-
URATION TOLER-
ANCE (%)
ADAPTAÇÃO
À TEXTURA2
ADAPTATION
TO TEXTURE2
ADAPTAÇÃO A SOLOS DE BAIXA
PERMEABILIDADE (1 A 5)3
ADAPTATION TO SOILS WITH
LOW PERMEABILITY (1 TO 5)3
PRECIPITAÇÃO
ANUAL4
ANNUAL
RAINFALL (MM)4
TOLERÂNCIA AO
PERÍODO SECO
(DIAS)5
DROUGHT TOLERANCE
(DAYS)5
TEMP. MÁ-
XIMA (OC)
MAX. TEMP
(OC)
TEMP. MÍNI-
MA (OC)6
MIN. TEMP.
(OC)6
TEMP. ÓTIMA
(OC)
OPTIMAL
TEMP. (OC)
GRAMÍNEAS GRASSES
CAPIM-ANDROPOGON CV. BAETI
ANDROPOGON GRASS CV. BAETI
ALTA
HIGH
30 A 35
30 TO 35
40 A 50
40 TO 505 3
A > 750
R > 1.000270
35 A 40
35 TO 4015
25 A 35
25 TO 35
CAPIM-BRAQUIARÃO CV. BRS MARANDU
SIGNALGRASS CV. BRS MARANDU
MEDIANA
MEDIUM
40 A 45
40 TO 45
35 A 40
35 TO 403 1
A > 1.000
R > 1.200180
35 A 40
35 TO 4015
25 A 35
25 TO 35
CAPIM-BRAQUIARÃO CV. BRS PIATÃ
SIGNALGRASS CV. BRS PIATÃ
MEDIANA
MEDIUM
40 A 45
40 TO 45
35 A 40
35 TO 403 1
A > 1.000
R > 1.200180
35 A 40
35 TO 4015
25 A 35
25 TO 35
CAPIM- BRAQUIARINHA CV. BASILISK
SIGNALGRASS CV. BASILISK
MEDIANA
MEDIUM
30 A 35
30 TO 35
40 A 50
40 TO 504 3
A > 1.000
R > 1.200150
35 A 40
35 TO 4015
25 A 35
25 TO 35
CAPIM-BRIZANTÃO CV. BRS XARAÉS
PALISADE GRASS CV. BRS XARAÉS
MEDIANA
MEDIUM
40 A 45
40 TO 4535 TO 40 5 4
A > 1.000
R > 1.200180
35 A 40
35 TO 4015
25 A 35
25 TO 35
CAPIM-HUMIDÍCOLA CV. TULLY
HUMIDÍCOLA GRASS CV. TULLY
ALTA
HIGH
30 A 35
30 TO 35
40 A 50
40 TO 505 5
A > 1.200
R > 1.500150
35 A 40
35 TO 4015
25 A 35
25 TO 35
GRAMA ESTRELA ROXA CV. LUA NOVA
NAIVASHA STAR GRASS CV. LUA NOVA
BAIXA
LOW
50 A 55
50 TO 5545 4 5
A > 1.200
P > 1.500120
35 A 40
35 TO 4015
25 A 35
25 TO 35
CAPIM-MASSAI
MASSAI GRASS
MEDIANA
MEDIUM
45 A 50
45 TO 50
30 A 35
30 TO 354 3
A > 800
R > 1.000210
35 A 40
35 TO 4015
25 A 35
25 TO 35
CAPIM-MOMBAÇA
MOMBASA GUINEA GRASS
MEDIANA
MEDIUM
45 A 50
45 TO 50
30 A 35
30 TO 355 4
A > 1.000
R > 1.200150
35 A 40
35 TO 4015
25 A 35
25 TO 35
CAPIM-TAMANI
TAMANI GRASS
MEDIANA
MEDIUM
45 A 50
45 TO 50
30 A 35
30 TO 354 2
A > 1.000
R > 1.200150
35 A 40
35 TO 4015
25 A 35
25 TO 35
CAPIM-TANGOLA CV. BRS LAGUNA
TANGOLA GRASS CV. BRS LAGUNA
MEDIANA
MEDIUM
45 A 50
45 TO 5040 4 5
A > 1.200
P > 1.500120
35 A 40
35 TO 4015
20 A 30
20 TO 30
CAPIM-ZURI
ZURI GRASS
MEDIANA
MEDIUM
45 A 50
45 TO 50
30 A 35
30 TO 355 4
A > 1.000
R > 1.200150
35 A 40
35 TO 40 15
25 A 35
25 TO 35
LEGUMINOSA LEGUMES
PUERÁRIA
PUERARIA
ALTA
HIGH
40 A 45
40 TO 45
25 A 30
25 TO 305 5
A > 1.200
R > 1.500120
35 A 40
35 TO 4018 > 27
AMENDOIM FORRAGEIRO CV. BELMONTE
FORAGE PEANUT CV. BELMONTE
MEDIANA
MEDIUM
40 A 45
40 TO 45
30 A 35
30 TO 355 4
A > 1.200
R > 1.500150
35 A 40
35 TO 4015 > 27
ESTILOSANTES BRS CAMPO GRANDE
STYLOSANTHES BRS CAMPO GRANDE
ALTA
HIGH
30 A 35
30 TO 3540 4 1
A > 700
R > 1.200150
35 A 40
35 TO 4015 > 27

48
49 AMAZÔNIA LEGAL: PROPOSTAS PARA UMA EXPLORAÇÃO AGRÍCOLA SUSTENTÁVEL
AMAZÔNIA LEGAL: PROPOSALS FOR SUSTAINABLE AGRICULTURE
ANÁLISE DE VIABILIDADE ECONÔMICA
ECONOMIC FEASIBILITY ANALYSIS
O principal objetivo deste tópico é avaliar
sob quais condições as principais varian-
tes 1 dos sistemas integrados permanecem
(ou se tornam) economicamente viáveis
em propriedades agrícolas nos municípios
localizados no bioma Amazônia.
Primeiramente, é importante ressaltar que ser
economicamente viável não é atributo intrínse-
co de uma tecnologia, mas o resultado de uma
combinação entre os impactos que ela gera ao
longo do processo produtivo e um conjunto de
variáveis que reflete as condições do merca-
do onde a tecnologia está inserida, tanto pelo
lado da oferta - preços dos insumos, da mão de
obra, do crédito, do frete, entre outros -, quanto
pelo lado da demanda - preço final do produto,
renda disponível e preferências do mercado
consumidor, entre outros. Essa combinação
implica que a viabilidade econômica de uma
tecnologia varia conforme existam alterações
nos coeficientes técnicos do processo produtivo
e nas condições de mercado. Assim, a viabili-
dade econômica de uma tecnologia vincula-se
à conjuntura à qual ela está associada.
1 Os sistemas de integração não representam uma unidade
homogênea, possuindo diversos arranjos diferentes, como, por
exemplo, ILPF, ILP, IPF. Como o foco não é especificamente
nenhum desses modelos, foi usado o termo “variantes”.
The main objective of this topic is to eval-
uate under what conditions the main vari-
ants 1 of the integrated systems will remain
(or become) economically feasible on ag-
ricultural properties in the municipalities
located in the Amazon biome.
First it is important to stress economic feasi-
bility is not an intrinsic attribute of a technol-
ogy. Rather, it is the result of a combination of
the impacts generated during the productive
process and a set of variables that reflect the
market conditions of the place where it is es-
tablished, both on the supply side - prices of
inputs, cost of labor, credit and transport etc.
- and on the demand side - final price of the
product, available income and preferences of
consumers, etc. .Thus, this combination implies
that the economic feasibility of a technology
varies according to changes in the technical
coefficients of the productive process and
the market conditions. In the final analysis,
the economic feasibility is not an attribute
of a technology, but rather of a situation to
which it is associated.
1 The integrated systems are not homogeneous. They have
various different arrangements, such as CLFI, CLI or IPF.
Since the focus here is not on any of these models, the term
“variants” was used.

50
Embora a análise de viabilidade econômica de
uma tecnologia, ou de um projeto, seja etapa
fundamental para sua implementação, o cálculo
dos indicadores de viabilidade está longe de ser
um processo trivial. Os resultados finais são sen-
síveis a pelo menos três conjuntos de informação:
• As características de uma propriedade ou de
um projeto que podem ser consideradas como
representativas para a região em análise;
• Os dados e os coeficientes técnicos as-
sociados a esse projeto na região em que
está inserido;
• O modelo econômico, com as suas respec-
tivas premissas, para a construção do fluxo
de caixa.
Somente a partir dessas informações é possível
calcular sob quais condições os sistemas de
integração se apresentam economicamente
viáveis. Desse modo, foi realizado um mapea-
mento da literatura disponível sobre os sistemas
de integração no bioma Amazônia, obtendo-se
o seguinte resultado:
• Número limitado de trabalhos sobre a
avaliação da viabilidade econômica desses
projetos no bioma Amazônia;
• Ausência de trabalhos replicáveis. Não foram
localizados trabalhos que demonstrassem
com clareza as premissas adotadas, os coe-
ficientes técnicos assumidos e as condições
de mercado (oferta e demanda) escolhidas
de forma a se conseguir refazer os cálculos
dos indicadores de viabilidade apresentados.
Although the economic feasibility of a tech-
nology or project is a fundamental step for
its implementation, the calculation of the fea-
sibility indicators is not a trivial process. The
final results are sensitive to at least three sets
of information:
• The characteristics of a property or project
that can be considered representative of
the region under analysis;
• The data and technical coefficients associ-
ated with this project in the region where
it is inserted;
• The economic model, with its respective
premises, for construction of the cash flow.
Based only on this information is it possible to
calculate under which conditions the integrated
systems will be economically feasible. There-
fore, an outline was mapped from the available
literature with the necessary information on
integrated systems in the Amazon biome. The
results obtained are the following:
• Small number of studies on the economic
feasibility of these projects in the Amazon
biome;
• Absence of repeatable studies. No studies
were found that clearly demonstrated the
premises adopted, the technical coefficients
assumed and the market conditions (supply
and demand) chosen, to enable redoing
the calculations of the feasibility indicators.

51 AMAZÔNIA LEGAL: PROPOSTAS PARA UMA EXPLORAÇÃO AGRÍCOLA SUSTENTÁVEL
AMAZÔNIA LEGAL: PROPOSALS FOR SUSTAINABLE AGRICULTURE
Para superar tais limitações, ampliou-se o ma-
peamento da literatura disponível, incorporan-
do-se trabalhos que analisaram a viabilidade
econômica dos sistemas de integração em outros
biomas. Essa estratégia proporcionou um núme-
ro razoável de trabalhos que avançaram sobre o
tema, mas apenas uma pequena parte do mate-
rial foi replicável, com destaque para o Projeto
FIP-ABC executado pelo Serviço Nacional de
Aprendizagem Rural (SENAR) em 2013. 2
Nessa direção, realizou-se um empenho para
fazer a análise completa do modelo do SENAR
(2013), incluindo as variáveis, os conceitos, as
premissas e as equações utilizadas. A partir do
modelo reconstruído foi feita uma análise de
quais mudanças seriam necessárias para que o
modelo conseguisse incorporar as características
do bioma Amazônia. Uma vez implementados
tais ajustes, era importante refazer, sempre que
necessário, as premissas e atualizar os valores
das variáveis presentes para o cálculo dos indi-
cadores de viabilidade. Com esse conjunto de
informações atualizado, tornou-se possível avaliar
sob quais condições as diferentes variantes dos
sistemas de integração apresentar-se-iam como
economicamente viáveis.
Para mostrar quanto os resultados dos indica-
dores de viabilidade foram sensíveis às premis-
sas adotadas e dada a necessidade de todas as
etapas e processos realizados para o cálculo de
tais métricas estarem detalhados na literatura,
este capítulo apresenta uma simulação de quais
seriam os novos valores dos indicadores de
2 PROJETO FIP-ABC – com vistas à produção sustentável em
áreas já convertidas para o uso agropecuário (com base no
Plano ABC), Análise financeira de modelos típicos de produção
com e sem adoção de práticas de baixo carbono.
In order to overcome these limitations, the map-
ping from the available literature was expand-
ed to include studies that have analyzed the
economic feasibility of integrated systems in
other biomes. This strategy provided a reason-
ably large number of studies that advanced the
subject, but only a small part of this material
was actually repeatable. The study that stood
out among the others as repeatable was the
FIB-ABC Project realized by National Rural
Apprenticeship Service (SENAR) 2 in 2013.
An effort was made to completely docu-
ment the SENAR (2013) model, including the
variables, concepts, premises and equations
utilized. From this reconstructed model, an
analysis was made to identify which chang-
es would be necessary for this model to in-
corporate the characteristics of the Amazon
biome. With the adjusted model, it would be
important to reconsider the premises and up-
date the values of the variables to calculate
the feasibility indicators as necessary. In other
words, with this updated information it became
possible to evaluate under which conditions
the different integrated systems would be
economically feasible.
To show how sensitive the results of the feasi-
bility indicators were to the premises adopted,
given the need for all the steps and all the pro-
cesses to calculate these metrics to be clearly
detailed in the literature, this chapter presents
a simulation of the new values of the feasibility
indicators for each activity associated with the
2 FIP-ABC Project – aiming at sustainable production in areas
converted to agricultural use (based on the ABC Plan) and financial
analysis of typical production models with and without adoption
of low-carbon practices.

52
viabilidade para cada atividade associada ao
sistema integrado, utilizando-se o modelo do
SENAR de 2013, considerando-se, porém, os pre-
ços e os custos de produção de 2015 (Tabela 3).
Para isso, alguns dados utilizados no cálculo da
viabilidade econômica realizado pelo SENAR, que
são de 2013, foram atualizados até 2015. Esses
dados foram substituídos pelos dados mais atuais
a fim de saber se, com as mudanças conjunturais
ocorridas nos últimos anos, os resultados seriam
alterados, ou seja, se o sistema integrado conti-
nuaria tendo viabilidade econômica. A partir da
consideração dos novos valores, observou-se que:
• A atividade agrícola continuaria econo-
micamente inviável, porém com um Valor
Presente Líquido (VPL) ainda mais negativo
(- R$ 1.371.401) do que o do cenário-base
calculado com os dados originais (- R$
723.865), e a Taxa Interna de Retorno Modi-
ficada (TIR-M) ficaria menor (9,92% contra
10,78% no cenário original);
• A atividade pecuária, por outro lado, tor-
nar-se-ia economicamente viável. O VPL
seria de R$ 1.211.518 contra um VPL de - R$
713.482 no cenário-base calculado com os
dados originais, e uma TIR-M de 11%, contra
uma TIR-M de 9,4% no cenário original;
• A análise de viabilidade econômica da ativi-
dade florestal não sofreria mudança relevante
com a alteração dos parâmetros. O VPL
seria de R$ 8.053.182 contra um VPL de R$
7.176.348 no cenário original, e a TIR-M seria
de 15,9% contra 15,5% no cenário original.
integrated system, using the model of SENAR
in 2013, but considering the prices and produc-
tion costs of 2015 (Table 3).
For this purpose, some of the data utilized in
the economic feasibility calculation performed
by SENAR, which are from 2013, were updated
for 2015. Thus, the data was replaced with the
updated information to see whether, consider-
ing the situational changes in recent years, the
results have changed, whether or the integrated
system is economically feasible. Considering
the new values, the updated analysis presented
the following findings:
• Farming activity would continue being
economically unfeasible, and with an even
larger negative net present value (NPV) (-R$
1,371,401) than in the base scenario calculated
with the original data (- R$ 723,865), and
the modified internal rate of return (MIRR)
would be smaller (9.92% versus 10.78% in
the original scenario);
• Stock breeding activity, on the other hand,
would become economically feasible. The
NPV would be R$ 1,211,518 (versus NPV de
-R$ 713,482 in the base scenario calculated
with the original data), and a MIRR of 11.0%
(against MIRR of 9.4% in the original scenario);
• The analysis of the economic feasibility of
forestry activities underwent a relevant
change with the alteration of the parameters.
The NPV would be R$ 8,053,182 (versus NPV
of R$ 7,176,348 in the original scenario), and
the MIRR would be 15.9% (against 15.5% in
the original scenario).

53 AMAZÔNIA LEGAL: PROPOSTAS PARA UMA EXPLORAÇÃO AGRÍCOLA SUSTENTÁVEL
AMAZÔNIA LEGAL: PROPOSALS FOR SUSTAINABLE AGRICULTURE
Com essas alterações no VPL e na TIR em cada
uma das atividades isoladamente, os resultados
também se alteraram na análise econômica do
sistema integrado. Apesar de a TIR-M prati-
camente não se alterar em relação ao cenário
original (13,65% contra 12,73% no cenário-base
calculado com os dados originais), o VPL modi-
ficou-se significativamente (R$ 7.681.616, contra
R$ 5.738.992 no cenário original), porém ainda
se mantendo economicamente viável.
With these alterations in the NPV and IRR of
each of the activities alone, the results of the
economic analysis of the integrated system
also change. Although there was virtually no
change in the MIRR in relation to the original
scenario (13.65% against 12.73% in the base
scenario calculated with the original data), the
NPV changes significantly (R$ 7,681,616 versus
R$ 5,738,992 in the original scenario), although
remaining economically feasible.
TABELA 2 | TABLE 2
SIMULAÇÃO DE VIABILIDADE ECONÔMICA POR ATIVIDADE A PARTIR DE DADOS
ATUALIZADOS ATÉ 2015
SIMULATION OF ECONOMIC FEASIBILITY BY ACTIVITY FROM UPDATED DATA UP TO 2015
ATIVIDADE
ACTIVITY
VIABILIDADE ECONÔMICA
ECONOMI-CALLY
FEASIBLE
VALOR PRESENTE LÍQUIDO
(VPL) (2013)
NET PRESENT VALUE (NPV)
(2013)
VALOR PRESENTE LÍQUIDO
(VPL) (2015)
NET PRESENT VALUE (NPV)
(2015)
TAXA INTERNA DE RETORNO MODIFICA-
DA (TIR-M) (2013)
MODIFIED INTERNAL RATE OF RETURN
(MIRR) (2013)
TAXA INTERNA DE RETORNO MODIFICA-
DA (TIR-M) (2015)
MODIFIED INTERNAL RATE OF RETURN
(MIRR) (2015)
AGRÍCOLAFARMING
CONTINUA
INVIÁVEL
CONTINUE
BEING
UNFEASIBLE
- R$ 723.865 - R$ 1.371.401 10,78% 9,92%
PECUÁRIASTOCK
BREEDING
TORNOU-SE
VIÁVEL
BECOME
FEASIBLE
- R$ 713.482 R$ 1.211.518 9,4% 11%
FLORESTALFORESTRY
SEM MUDANÇA
RELEVANTE
UNDERWENT
A RELEVANT
CHANGE
R$ 7.176.348 R$ 8.053.182 15,5% 15,9%
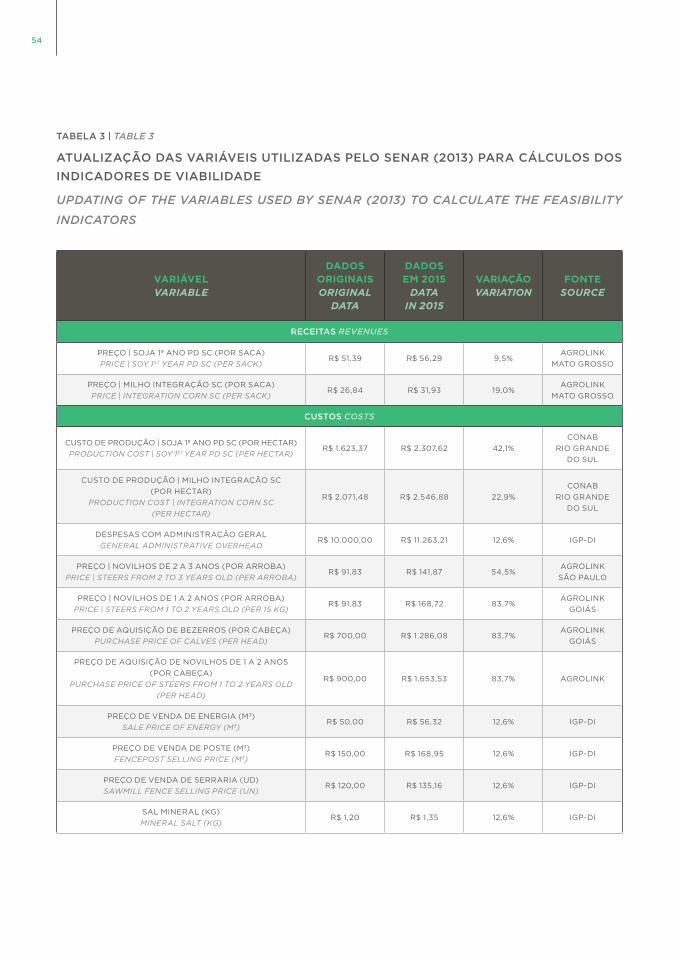
54
TABELA 3 | TABLE 3
ATUALIZAÇÃO DAS VARIÁVEIS UTILIZADAS PELO SENAR (2013) PARA CÁLCULOS DOS
INDICADORES DE VIABILIDADE
UPDATING OF THE VARIABLES USED BY SENAR (2013) TO CALCULATE THE FEASIBILITY
INDICATORS
VARIÁVELVARIABLE
DADOS ORIGINAISORIGINAL
DATA
DADOS EM 2015
DATA IN 2015
VARIAÇÃOVARIATION
FONTE SOURCE
RECEITAS REVENUES
PREÇO | SOJA 1º ANO PD SC (POR SACA)
PRICE | SOY 1ST YEAR PD SC (PER SACK)R$ 51,39 R$ 56,29 9,5%
AGROLINK
MATO GROSSO
PREÇO | MILHO INTEGRAÇÃO SC (POR SACA)
PRICE | INTEGRATION CORN SC (PER SACK)R$ 26,84 R$ 31,93 19,0%
AGROLINK
MATO GROSSO
CUSTOS COSTS
CUSTO DE PRODUÇÃO | SOJA 1º ANO PD SC (POR HECTAR)
PRODUCTION COST | SOY 1ST YEAR PD SC (PER HECTAR)R$ 1.623,37 R$ 2.307,62 42,1%
CONAB
RIO GRANDE
DO SUL
CUSTO DE PRODUÇÃO | MILHO INTEGRAÇÃO SC
(POR HECTAR)
PRODUCTION COST | INTEGRATION CORN SC
(PER HECTAR)
R$ 2.071,48 R$ 2.546,88 22,9%
CONAB
RIO GRANDE
DO SUL
DESPESAS COM ADMINISTRAÇÃO GERAL
GENERAL ADMINISTRATIVE OVERHEADR$ 10.000,00 R$ 11.263,21 12,6% IGP-DI
PREÇO | NOVILHOS DE 2 A 3 ANOS (POR ARROBA)
PRICE | STEERS FROM 2 TO 3 YEARS OLD (PER ARROBA)R$ 91,83 R$ 141,87 54,5%
AGROLINK
SÃO PAULO
PREÇO | NOVILHOS DE 1 A 2 ANOS (POR ARROBA)
PRICE | STEERS FROM 1 TO 2 YEARS OLD (PER 15 KG)R$ 91,83 R$ 168,72 83,7%
AGROLINK
GOIÁS
PREÇO DE AQUISIÇÃO DE BEZERROS (POR CABEÇA)
PURCHASE PRICE OF CALVES (PER HEAD)R$ 700,00 R$ 1.286,08 83,7%
AGROLINK
GOIÁS
PREÇO DE AQUISIÇÃO DE NOVILHOS DE 1 A 2 ANOS
(POR CABEÇA)
PURCHASE PRICE OF STEERS FROM 1 TO 2 YEARS OLD
(PER HEAD)
R$ 900,00 R$ 1.653,53 83,7% AGROLINK
PREÇO DE VENDA DE ENERGIA (M3)
SALE PRICE OF ENERGY (M3)R$ 50,00 R$ 56,32 12,6% IGP-DI
PREÇO DE VENDA DE POSTE (M3)
FENCEPOST SELLING PRICE (M3)R$ 150,00 R$ 168,95 12,6% IGP-DI
PREÇO DE VENDA DE SERRARIA (UD)
SAWMILL FENCE SELLING PRICE (UN)R$ 120,00 R$ 135,16 12,6% IGP-DI
SAL MINERAL (KG)
MINERAL SALT (KG)R$ 1,20 R$ 1,35 12,6% IGP-DI

55 AMAZÔNIA LEGAL: PROPOSTAS PARA UMA EXPLORAÇÃO AGRÍCOLA SUSTENTÁVEL
AMAZÔNIA LEGAL: PROPOSALS FOR SUSTAINABLE AGRICULTURE
VARIÁVELVARIABLE
DADOS ORIGINAISORIGINAL
DATA
DADOS EM 2015
DATA IN 2015
VARIAÇÃOVARIATION
FONTE SOURCE
MISTURA MÚLT. DA SECA (KG)
MIXED FEED (DRY SEASON)(KG) R$ 1,06 R$ 1,19 12,6% IGP-DI
MISTURA MÚLT. DAS ÁGUAS (KG)
MIXED FEED (WET SEASON)(KG)R$ 0,84 R$ 0,95 12,6% IGP-DI
RAÇÃO PARA ANIMAL DE 1 A 2 ANOS (KG)
FEED FOR ANIMALS FROM 1 TO 2 YEARS OLD (KG)R$ 1,08 R$ 1,22 12,6% IGP-DI
RAÇÃO PARA ANIMAL DE 2 A 3 ANOS (KG)
FEED FOR ANIMALS FROM 2 TO 3 YEARS OLD (KG)R$ 1,08 R$ 1,22 12,6% IGP-DI
MEDICAMENTOS E VERMÍFUGOS (R$/UA/ANO)
MEDICINES AND VERMIFUGES (R$/ANIMAL/YEAR) R$ 25,00 R$ 28,16 12,6% IGP-DI
FORMAÇÃO DE PASTAGEM (HECTAR)
PASTURE FORMATION (HA)R$ 1.065,50 R$ 1.200,10 12,6% IGP-DI
GERENTE (R$/MÊS)
MANAGER (R$/MONTH)R$ 1.627,20 R$ 1.832,75 12,6% IGP-DI
MÃO DE OBRA (R$/MÊS)
LABOR (R$/MONTH)R$ 1.084,80 R$ 1.221,83 12,6% IGP-DI
SEMENTE DE BRAQUIÁRIA
GRASS SEEDR$ 9,60 R$ 10,81 12,6% IGP-DI
ENERGIA ELÉTRICA (R$/MÊS)
ELECTRICITY (R$/MONTH)R$ 350,00 R$ 394,21 12,6% IGP-DI
MANUTENÇÃO DE BENFEITORIAS E EQUIPAMENTOS (MÊS)
MAINTENANCE OF IMPROVEMENTS & EQUIPMENT (MONTH)R$ 3.543,22 R$ 3.990,80 12,6% IGP-DI
RASTREABILIDADE (CAB)
BRANDING (PER HEAD)R$ 2,50 R$ 2,82 12,6% IGP-DI
ADMINISTRAÇÃO GERAL (MÊS)
GENERAL ADMINISTRATION (MONTH)R$ 5.000,00 R$ 5.631,61 12,6% IGP-DI
INVESTIMENTOS INVESTMENTS
AQUISIÇÃO DE ANIMAIS:
PURCHASE OF ANIMALS:R$ 1.220.767,00 R$ 1.631.238,19 33,6% –
BEZERROS (22%): VARIAÇÃO
DO PREÇO DO BEZERRO
CALVES (22%): VARIATION
OF PRICE OF CALVES
– – 18,4% –
NOVILHOS (22%): VARIAÇÃO
DO PREÇO DO NOVILHO
STEERS (22%): VARIATION
OF PRICE OF STEERS
– – 15,2% –
TAXA DE JUROS INTEREST RATE
TAXA DE JUROS
INTEREST RATE5,50% 8,50% 3,00%
PONTOS
PERCENTUAIS
PERCENTAGE
POINTS

56
57 AMAZÔNIA LEGAL: PROPOSTAS PARA UMA EXPLORAÇÃO AGRÍCOLA SUSTENTÁVEL
AMAZÔNIA LEGAL: PROPOSALS FOR SUSTAINABLE AGRICULTURE
ANÁLISE E PROPOSTAS DE POLÍTICAS PÚBLICAS
ANALYSIS AND PROPOSALS FOR PUBLIC POLICIES
O Brasil possui um conjunto de políticas
públicas que influencia na inovação tec-
nológica e na ampliação da adoção de
sistemas de produção agropecuária in-
tensiva. No entanto, para avaliar os efeitos
dessas políticas sobre a intensificação da
produção agropecuária, seriam necessárias
análises mais aprofundadas e detalhadas.
Porém, em um estudo de caráter mais
técnico como este, é possível esboçar al-
gumas inferências gerais sobre o cenário
das políticas agroambientais e seus im-
pactos na produção e na competitividade
da agropecuária no país.
É pertinente lembrar que existem outros me-
canismos de incentivos aos produtores rurais
visando à ampliação da adoção de sistemas
de produção agropecuários intensivos, como
as políticas governamentais de crédito agríco-
la e as diversas iniciativas do setor privado. As
linhas governamentais de crédito agrícola que
possuem perfil ambiental constituem uma pe-
quena parcela dos recursos aplicados. Diante
disso, a política de crédito pode servir como ins-
trumento de apoio à intensificação da produção
agropecuária, como, por exemplo, o Programa
ABC, que concede taxas de juros e condições
de pagamento diferenciadas para os produto-
res que adotam tecnologias de baixa emissão
Brazil possesses a set of public policies
that influence technological innovation
and the adoption of intensive farming and/
or stock breeding production systems.
Nevertheless, to evaluate the effects of
these policies on the intensification of this
activity, more comprehensive and detailed
analysis are necessary. For a study with
a more technical character like this one,
however, it is possible to make general
inferences about the scenario of agro-en-
vironmental policies and their impacts on
the production and competitiveness of the
country’s agriculture.
Furthermore, other incentive mechanisms ex-
ist for rural producers seeking to expand the
adoption of intensive agricultural production
systems, such as the government farm credit
policies, in addition to various initiatives from
the private sector. The government credit
lines for agriculture that possess an environ-
mental profile correspond to a small portion
of applied financing. Nonetheless, the credit
policy can serve as an instrument to support
intensification, such as in the ABC Program,
that grants lowerinterest rates and facilitates
payment conditions for farmers that adopt low
carbon emissions technologies and strategies
for recuperating degraded pasture areas and

58
de carbono por meio da intensificação do uso
da terra adotando estratégias de recuperação
de áreas de pastagens degradadas e sistemas
de produção integrando lavoura-pecuária e la-
voura-pecuária-floresta. Entretanto, até o mo-
mento, o crédito é concedido sem a verificação
do atendimento ao Código Florestal.
Políticas de mercado, como o pagamento de ser-
viços ambientais, e políticas públicas devem ser
desenhadas para promover o estabelecimento de
sistemas de produção agropecuários sustentáveis,
de acordo com suas diretrizes, seus objetivos e
suas necessidades. Nesse sentido, nota-se que as
instâncias de governança relativas à sustentabi-
lidade da agropecuária devem ser estabelecidas
levando-se em conta os objetivos anteriormente
mencionados. Observa-se que, atualmente, não
estão totalmente definidas as instituições e as
estruturas de governança para a implantação de
estratégias que visem à produção agropecuária
intensiva e sustentável, atentando-se para o fato
de que, em alguns casos, essas instâncias ainda
precisam ser criadas ou aperfeiçoadas. Um modelo
de governança efetivo é constituído por políticas
públicas e regulatórias, acordos ou normas que
sejam fundamentados em objetivos consisten-
tes, orientando-se por uma lógica baseada em
evidências e cuja implementação seja bem-su-
cedida, cumprida e monitorada. Um sistema de
governança efetivo inclui ainda processos de
tomada de decisão participativos, transparen-
tes e responsáveis, com forte empoderamento
(delegação de autoridade) para a participação
concreta dos atores públicos e privados ao longo
de todas as cadeias produtivas.
production systems through crop-livestock
and crop-livestock-forestry integration. To
date, however, the credit is granted without
verifying satisfaction of the Forestry Code.
Market policies, such as payment for environ-
mental services and public policies and pro-
grams need to be designed to promote the
establishment of sustainable agricultural pro-
duction systems, according to the guidelines,
objectives and needs. Governance regarding
sustainable agriculture needs to be consider
the objectives mentioned above. At present,
the governance institutions and structures for
implementing strategies to attain intensive
and sustainable agricultural production are
not fully defined or have yet to be created
or improved. An effective governance mod-
el consists of public and regulatory policies,
agreements and standards rooted in consistent
objectives, in an evidence-based logic that
includes monitoring. Also imperative to an
effective governance system are participative,
transparent and responsible decision-making
processes, with strong empowerment (dele-
gation of authority) for the effective partici-
pation of public and private actors within and
across all productive chains.
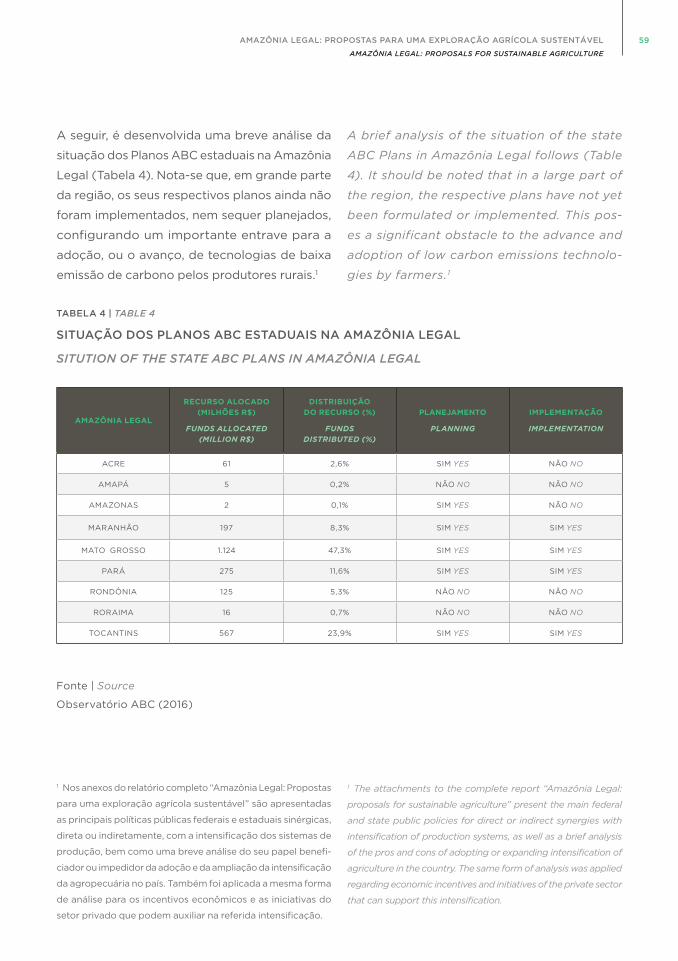
59 AMAZÔNIA LEGAL: PROPOSTAS PARA UMA EXPLORAÇÃO AGRÍCOLA SUSTENTÁVEL
AMAZÔNIA LEGAL: PROPOSALS FOR SUSTAINABLE AGRICULTURE
A seguir, é desenvolvida uma breve análise da
situação dos Planos ABC estaduais na Amazônia
Legal (Tabela 4). Nota-se que, em grande parte
da região, os seus respectivos planos ainda não
foram implementados, nem sequer planejados,
configurando um importante entrave para a
adoção, ou o avanço, de tecnologias de baixa
emissão de carbono pelos produtores rurais. 1
1 Nos anexos do relatório completo “Amazônia Legal: Propostas
para uma exploração agrícola sustentável” são apresentadas
as principais políticas públicas federais e estaduais sinérgicas,
direta ou indiretamente, com a intensificação dos sistemas de
produção, bem como uma breve análise do seu papel benefi-
ciador ou impedidor da adoção e da ampliação da intensificação
da agropecuária no país. Também foi aplicada a mesma forma
de análise para os incentivos econômicos e as iniciativas do
setor privado que podem auxiliar na referida intensificação.
TABELA 4 | TABLE 4
SITUAÇÃO DOS PLANOS ABC ESTADUAIS NA AMAZÔNIA LEGAL
SITUTION OF THE STATE ABC PLANS IN AMAZÔNIA LEGAL
Fonte | Source
Observatório ABC (2016)
A brief analysis of the situation of the state
ABC Plans in Amazônia Legal follows (Table
4). It should be noted that in a large part of
the region, the respective plans have not yet
been formulated or implemented. This pos-
es a significant obstacle to the advance and
adoption of low carbon emissions technolo-
gies by farmers. 1
1 The attachments to the complete report “Amazônia Legal:
proposals for sustainable agriculture” present the main federal
and state public policies for direct or indirect synergies with
intensification of production systems, as well as a brief analysis
of the pros and cons of adopting or expanding intensification of
agriculture in the country. The same form of analysis was applied
regarding economic incentives and initiatives of the private sector
that can support this intensification.
AMAZÔNIA LEGAL
RECURSO ALOCADO (MILHÕES R$)
FUNDS ALLOCATED (MILLION R$)
DISTRIBUIÇÃO DO RECURSO (%)
FUNDS DISTRIBUTED (%)
PLANEJAMENTO
PLANNING
IMPLEMENTAÇÃO
IMPLEMENTATION
ACRE 61 2,6% SIM YES NÃO NO
AMAPÁ 5 0,2% NÃO NO NÃO NO
AMAZONAS 2 0,1% SIM YES NÃO NO
MARANHÃO 197 8,3% SIM YES SIM YES
MATO GROSSO 1.124 47,3% SIM YES SIM YES
PARÁ 275 11,6% SIM YES SIM YES
RONDÔNIA 125 5,3% NÃO NO NÃO NO
RORAIMA 16 0,7% NÃO NO NÃO NO
TOCANTINS 567 23,9% SIM YES SIM YES
60
Em ocasião da Sessão Plenária da Conferência das
Nações Unidas para a Agenda de Desenvolvimento
Pós-2015, realizada em setembro de 2015, foi di-
vulgada pelo Governo Federal a sua Intended
Nationally Determined Contribution (INDC), 2 com
escopo sobre mitigação, adaptação e meios de
implementação e metas para reduzir, em 2025,
as emissões de gases de efeito estufa (GEE) em
37% abaixo dos níveis de 2005, e, em 2030, as
emissões de GEE em 43% abaixo dos níveis de
2005. Assim sendo, o Brasil vem adotando medi-
das adicionais que são consistentes com a meta
de temperatura de 2°C nos setores de energia,
floresta e mudança de uso do solo, indústria,
transporte e agropecuária.
No setor agropecuário, o objetivo é fortalecer
o Plano ABC como a principal estratégia para
o desenvolvimento sustentável na agricultura,
inclusive por meio da restauração adicional de 15
milhões de hectares de pastagens degradadas
e pelo incremento de cinco milhões de hectares
de sistemas de ILPF até 2030.
Contudo, a fim de garantir, contabilizar e comprovar
a possibilidade de atingir as metas assumidas no
Plano ABC e na NDC, é importante a comprova-
ção dos resultados obtidos ao final do período de
compromisso. Para tanto, o Plano ABC apresenta
estratégias de monitoramento de forma a assegurar
a integridade das reduções e a possibilidade de uma
futura verificação internacional. 3 Porém, é importan-
te ressaltar que, inicialmente, o Plano ABC estimou
que as ações de monitoramento das reduções das
2 Em livre tradução: “Contribuição Nacionalmente Determinada
Pretendida”. Disponível em: <http://www.itamaraty.gov.br/images/
ed_desenvsust/BRASIL-iNDC-portugues.pdf>. Acesso em: dez/2015.
3 MAPA, 2013.
In September 2015, during the plenary session
of the United Nations Summit for Adoption
of the Post-2015 Development Agenda, the
Brazilian government announced its Intended
Nationally Determined Contribution (INDC), 2
with a scope covering mitigation, adaptation
and implementation of targets to reduce green-
house gas (GHG) emissions in 2025 to 37%
below the levels of 2005, and 43% below the
2005 levels in 2030. As such, Brazil has joined
other countries in the world in adopting ad-
ditional measures in the energy, forest , land
use, transportation, agriculture and industrial
sectors that are consistent with the average
temperature increase target of at most 2 °C.
In the agricultural sector, the objective is to
strengthen the ABC Plan as the main strategy
for sustainable development of agriculture,
including the restoration of a further 15 million
hectares of degraded pasture areas and an
increase of 5 million hectares of CLFI systems
by 2030.
However, to guarantee, quantify and demon-
strate the possibility of achieving the targets
determined in the ABC Plan and the iNDC,
it will be important to prove the results at
the end of the commitment period. For this
purpose, the ABC Plan presents monitoring
strategies to assure the integrity of the reduc-
tions and the possibility of future international
verification. 3 However, while initially the ABC
Plan estimated that the actions to monitor the
2 Available at: <http://www.itamaraty.gov.br/images/
ed_desenvsust/BRASIL-iNDC-portugues.pdf>. Consulted
in: December 2015.
3 MAPA, 2013.

61 AMAZÔNIA LEGAL: PROPOSTAS PARA UMA EXPLORAÇÃO AGRÍCOLA SUSTENTÁVEL
AMAZÔNIA LEGAL: PROPOSALS FOR SUSTAINABLE AGRICULTURE
emissões deveriam ser iniciadas a partir de 2013,
o que não ocorreu até o momento, prejudicando
o monitoramento das emissões evitadas pelo uso
das técnicas preconizadas no próprio plano.
Diante disso, é preciso que se institua com ur-
gência um sistema de Monitoramento, Relato e
Verificação (MRV). Esse se refere a um agregado
de processos e métodos por meio dos quais os
dados reais sobre emissão de GEE são coleta-
dos, avaliados e verificados. A sua aplicabilidade
define se as partes efetivamente cumpriram seus
respectivos compromissos por meio de prazos
e protocolos predefinidos. 4
Ademais, experiências de sucesso de pagamento
por serviços ambientais são realidade no Brasil.
No entanto, essa ação não se constituiu em uma
política pública de abrangência nacional capaz de
estruturar as experiências dos projetos e políticas
estaduais. A pesquisa científica tem produzido
inúmeras tecnologias capazes de contribuir na
intensificação da pecuária nacional. Entretanto, a
presença de uma ATER que auxilie na utilização
de tais tecnologias não é realidade para muitos
agricultores. Para melhoria, é necessária a ava-
liação contínua das políticas agroambientais
brasileiras. Por serem desenvolvidas por distintas
áreas de governo, é fundamental promover a
articulação intersetorial, buscando transformar
e adaptar instituições e políticas públicas, a fim
de auxiliar no desenvolvimento tecnológico da
agropecuária brasileira.
A fim de aprimorar a adoção das tecnologias
de intensificação da agropecuária, com reba-
timento direto na diminuição das emissões de
4 GVCES, 2015.
emission reductions would start in 2013, this
has yet to occur, impairing the monitoring of
avoided emissions by use of the techniques
established in the plan itself.
As such, an urgent need exists to establish a
Monitoring, Reporting and Verification (MRV)
system. This refers to a combination of pro-
cesses and methods to collect, evaluate and
verify data on GHG emissions. The application
of such a system will define whether the parties
have actually complied with their respective
commitments by means of predefined time
frames and protocols. 4
While there have been some successful experi-
ences of payment for environmental services in
Brazil, this action is not part of a public policy
with nationwide scope able to structure the
experiences of the projects and policies at the
state level. Scientific research has produced
many technologies able to contribute to the
intensification of stock breeding in the country,
but many producers cannot count on an ATER
to help them utilize these technologies. For
improvement in this respect, ongoing evalua-
tion of Brazilian agro-environmental policies
is necessary. Because policies are developed
by distinct areas of the government, it is nec-
essary to promote inter-sectorial articulation,
aiming to transform and adapt institutions and
public policies to support the technological
development of Brazilian agriculture.
To encourage the adoption of technologies for
agricultural intensification, with a direct impact
in reducing GHG emissions of the sector, it is
4 GVCES, 2015.
62
GEE do setor, é importante que seja considera-
da, nesse processo, uma gama de diretrizes de
acompanhamento de políticas públicas sinér-
gicas com essa agenda.
Conforme detalhado anteriormente, verifica-se
que existem diversas políticas agroambientais
responsáveis, direta e indiretamente, pelo avan-
ço da intensificação dos sistemas produtivos
brasileiros, principalmente os da carne e da
soja. No entanto, diversos entraves e desafios
relacionados a tais políticas devem ser solucio-
nados para que o país possa, enfim, atingir de
fato uma agricultura de baixa emissão de car-
bono intensificada em larga escala. No Quadro 1
são listadas diretrizes que podem auxiliar nessa
mudança de paradigma na pecuária brasileira.
important to consider a range of guidelines
for monitoring public policies in synergy with
this agenda.
As mentioned, there are various agro-environ-
mental policies that are directly and indirect-
ly responsible for promoting intensification
of Brazilian productive systems, mainly for
meat and soybeans. However, the country
will confront several challenges related to
these policies in order to enable intensified
low carbon emission agriculture on a larger
scale. Chart 1 lists guidelines that can help in
the process of seeking a paradigm change in
Brazilian livestock production.
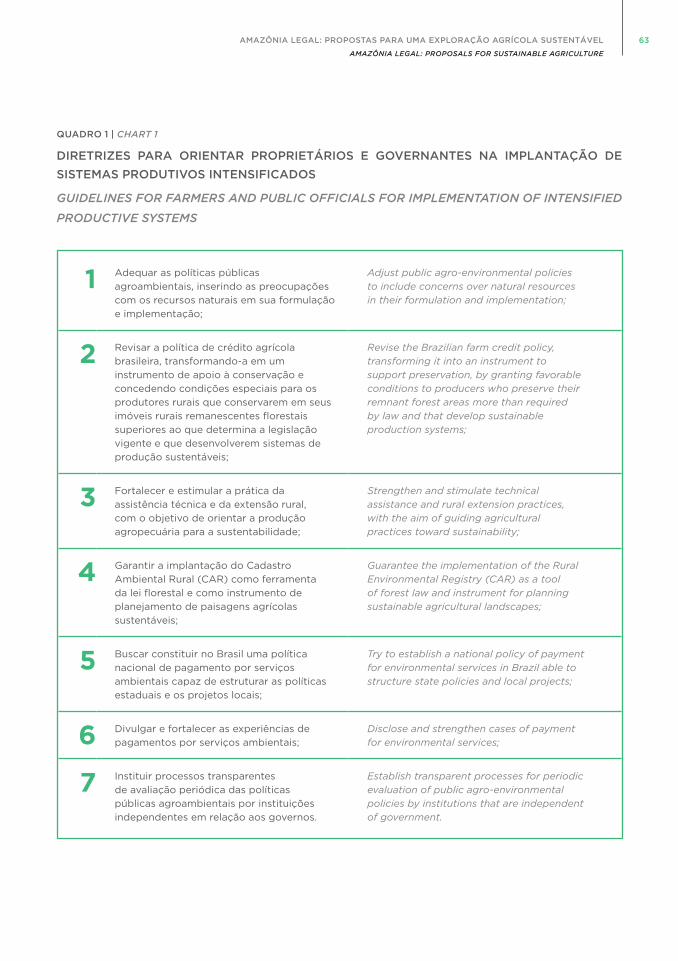
63 AMAZÔNIA LEGAL: PROPOSTAS PARA UMA EXPLORAÇÃO AGRÍCOLA SUSTENTÁVEL
AMAZÔNIA LEGAL: PROPOSALS FOR SUSTAINABLE AGRICULTURE
1 Adequar as políticas públicas
agroambientais, inserindo as preocupações
com os recursos naturais em sua formulação
e implementação;
Adjust public agro-environmental policies to include concerns over natural resources in their formulation and implementation;
2 Revisar a política de crédito agrícola
brasileira, transformando-a em um
instrumento de apoio à conservação e
concedendo condições especiais para os
produtores rurais que conservarem em seus
imóveis rurais remanescentes florestais
superiores ao que determina a legislação
vigente e que desenvolverem sistemas de
produção sustentáveis;
Revise the Brazilian farm credit policy, transforming it into an instrument to support preservation, by granting favorable conditions to producers who preserve their remnant forest areas more than required by law and that develop sustainable production systems;
3 Fortalecer e estimular a prática da
assistência técnica e da extensão rural,
com o objetivo de orientar a produção
agropecuária para a sustentabilidade;
Strengthen and stimulate technical assistance and rural extension practices, with the aim of guiding agricultural practices toward sustainability;
4 Garantir a implantação do Cadastro
Ambiental Rural (CAR) como ferramenta
da lei florestal e como instrumento de
planejamento de paisagens agrícolas
sustentáveis;
Guarantee the implementation of the Rural Environmental Registry (CAR) as a tool of forest law and instrument for planning sustainable agricultural landscapes;
5 Buscar constituir no Brasil uma política
nacional de pagamento por serviços
ambientais capaz de estruturar as políticas
estaduais e os projetos locais;
Try to establish a national policy of payment for environmental services in Brazil able to structure state policies and local projects;
6 Divulgar e fortalecer as experiências de
pagamentos por serviços ambientais;
Disclose and strengthen cases of payment for environmental services;
7 Instituir processos transparentes
de avaliação periódica das políticas
públicas agroambientais por instituições
independentes em relação aos governos.
Establish transparent processes for periodic evaluation of public agro-environmental policies by institutions that are independent of government.
QUADRO 1 | CHART 1
DIRETRIZES PARA ORIENTAR PROPRIETÁRIOS E GOVERNANTES NA IMPLANTAÇÃO DE
SISTEMAS PRODUTIVOS INTENSIFICADOS
GUIDELINES FOR FARMERS AND PUBLIC OFFICIALS FOR IMPLEMENTATION OF INTENSIFIED
PRODUCTIVE SYSTEMS

64

65 AMAZÔNIA LEGAL: PROPOSTAS PARA UMA EXPLORAÇÃO AGRÍCOLA SUSTENTÁVEL
AMAZÔNIA LEGAL: PROPOSALS FOR SUSTAINABLE AGRICULTURE
CONCLUSÕES E AVALIAÇÃO DE PANORAMAS FUTUROS
CONCLUSIONS AND EVALUATION OF FUTURE
PANORAMAS
Este trabalho contou com investigação bi-
bliográfica, levantamento e tratamento de
dados para os 772 municípios da Amazônia
Legal e análises com recorte municipal em
319 municípios do bioma Amazônia.
Para dar resposta às questões suscitadas, foi
inicialmente apresentada uma descrição do
espaço geográfico da Amazônia Legal como
um conceito político, criado pelo governo
brasileiro na década de 1950, que engloba o
bioma Amazônia, parte dos biomas Cerrado e
Pantanal. Na Amazônia Legal ocorrem impactos
ambientais decorrentes da conversão de áreas
de florestas para atividades agropecuárias, de
exploração madeireira e de garimpo legais e
ilegais, sendo o processo de desmatamento
considerado como prejudicial ao meio am-
biente, produzindo também limitados ganhos
sociais e econômicos.
This study is based on a bibliographical in-
vestigation, treatment of data gathered on
772 municipalities in Amazônia Legal and
analyses of a sample of 319 municipalities
in the Amazon biome.
To respond to the questions raised for the study,
first, a description of the geographic space com-
posing the Amazônia Legal region as a political
concept was presented. This concept was cre-
ated by the Brazilian government in the 1950s,
encompassing the Amazon biome and part of the
Cerrado and Pantanal biomes. In the Amazônia
Legal region, significant environmental impacts
have resulted from the extensive conversion of
forest areas for agricultural activities, both crop
growing and livestock breeding, as well as legal
and illegal forest extraction and mining. The
resultingdeforestation is not only considered
harmful to the environment, but it also produces
limited social and economic gains.
CONVERSÃODE FLORESTAS
PARA ATIVIDADES AGROPECUÁRIAS
EXTENSIVE CONVERSION
OF FOREST FORAGRICULTURAL
ACTIVITIES
EXPLORAÇÃOMADEIREIRA
CROP GROWINGAND LIVESTOCK
BREEDING
GARIMPO LEGAISE ILEGAIS
LEGAL AND ILLEGAL FOREST EXTRACTION
AND MINING
IMPACTOSAMBIENTAIS
SIGNIFICATIVOS
SIGNIFICANT ENVIRONMENTAL
IMPACTS

66
Posteriormente, foram apresentados dados da
retrospectiva do desmatamento florestal na
Amazônia Legal entre 1988 e 2015, em que se
destacou a grande redução do desmatamento e a
estabilização do desmatamento anual entre 450
mil e 600 mil hectares nos últimos anos. Além
disso, o desmatamento anual residual pode estar
relacionado, predominantemente, à manutenção
de sistemas tradicionais de agricultura de derruba
e queima por grupos de populações indígenas,
comunidades extrativistas e ribeirinhas e pro-
dutores familiares em áreas de assentamentos
e regularização fundiária mais recente. Foi feita
uma análise do histórico da produção agrícola
de culturas permanentes e temporárias e da
criação de animais na Amazônia Legal em 1995,
2006 e 2013. Para essa análise, foi utilizado o
banco de dados agregados do IBGE.
Nos municípios da Amazônia Legal brasileira, no
ano de 2013, a área colhida de lavouras perma-
nentes soma um total de 529 mil hectares (9%
do valor total da área destinada à colheita de
lavouras permanentes do território nacional). O
cacau é o produto com maior extensão de área
destinada à colheita, seguido do café e da bana-
na. A área colhida de lavouras temporárias soma
o total de 16,7 milhões de hectares (26% da área
total colhida com lavouras temporárias no Brasil).
A soja é o produto com maior extensão de área
destinada à colheita, seguida do milho e do arroz.
A análise das principais características da
criação de animais (bovinos, equinos, suínos,
búfalos, caprinos, ovinos e aves) indicou cres-
cimento de 52,45%, sendo que as criações de
bovinos, equinos, ovinos e aves apresentaram
From there, the retrospective data on defor-
estation in Amazônia Legal between 1988 to
2015 was presented, highlighting the substan-
tial reduction of deforestation and its annual
stabilization in the range of 450 thousand
to 600 thousand hectares in recent years.
Aside from large-scale annual deforestation,
residual yearly deforestation is likely mainly
related to maintenance of traditional slash-
and-burn agriculture by indigenous groups
and riverside settlements as well as extractive
activities and farming by smallholders living
in settlements with recent landholding regu-
larization. A historical analysis of agricultural
output of perennial and temporary crops and
stock breeding in Amazônia Legal in 1995,
2006 and 2013 was carried out using the ag-
gregated database of the IBGE.
In 2013, the area planted with perennial crops
amounted to 529 thousand hectares (9% of
the total for the country) in the municipalities
of Amazônia Legal. Cacao is the product with
greatest land extension, followed by coffee
and banana. The area cultivated with tempo-
rary crops was 16.7 million hectares (26% of
the national total), with the main crops being
soybean, corn and rice, in that order.
The analysis of the main characteristics of
stock breeding (cattle, horses, hogs, water
buffaloes, sheep, goats and poultry) indicat-
ed overall growth of 52.45 , with breeding
of cattle, horses, sheep and poultry showing
positive growth. The total number of cattle in
Amazônia Legal has been steadily increasing,
both in absolute terms and in percentage of

67 AMAZÔNIA LEGAL: PROPOSTAS PARA UMA EXPLORAÇÃO AGRÍCOLA SUSTENTÁVEL
AMAZÔNIA LEGAL: PROPOSALS FOR SUSTAINABLE AGRICULTURE
crescimento positivo. O rebanho bovino na
Amazônia Legal encontra-se em expansão e
com maior participação no rebanho nacional,
tendo representado 14% do rebanho nacional,
em 1988, e 38%, em 2011.
Em seguida, realizou-se um estudo da evolu-
ção dos capitais humano e social por meio da
vulnerabilidade social, de acordo com dados
do Ipea, 2000 e 2010. Em média, os municípios
da Amazônia Legal apresentaram uma melhora
com relação à vulnerabilidade social.
A análise do recorte municipal nos 319 muni-
cípios segundo as premissas do projeto possi-
bilitou um diagnóstico mais detalhado desses
municípios por meio do cruzamento de dados
do TerraClass, de 2012, com o ZEE.
A análise dos sistemas produtivos identificou 29
arranjos nas seguintes modalidades: pastos bem
manejados, integração lavoura-pecuária (ILP),
integração lavoura-pecuária-floresta (ILPF) e
sistemas agroflorestais (SAF). Além disso, reco-
mendou um modelo de classificação/identifica-
ção dos sistemas produtivos que foi chamado
de Fluxo para Implantação da Agropecuária
Sustentável (FIAS). Também foram abordados
aspectos relacionados ao ZEE para as principais
cultivares de gramíneas e leguminosas forragei-
ras na Amazônia Legal, por meio de uma matriz
de avaliação da adaptação às características
pedológicas e climáticas para o zoneamento
forrageiro das áreas desmatadas.
A análise de viabilidade econômica em sistemas
integrados procurou avaliar sob quais condições
the national number, accounting for 14% of the
national herd in 1988 and 38% in 2011.
Moreover, the evolution of human and social
capital was also analyzed through the social
vulnerability index according with data from
Ipea, 2000 and 2010. On average, social vul-
nerability has declined in the municipalities of
Amazônia Legal.
The analysis of a sample of 319 municipalities
according to the premises of the project enabled
a more detailed diagnosis of these municipalities,
by cross-referencing of data from TerraClass
study in 2012 with EEZ.
The analysis of the productive systems re-
vealed the existence of 29 arrangements,
in the following modalities: well-managed
pastures, crop-livestock integration (CLI),
crop-livestock-forest integration (CLFI) and
agroforestry systems (AFSs). Besides this, a
model was recommended for classification/
identification of the productive systems, called
Flow for Implementation of Sustainable Ag-
ricultural Systems (FIAS). Aspects related to
EEZ were also covered for the main grass and
forage legume cultivars in Amazônia Legal,
by means of an evaluation matrix adapted to
the pedologic and climatic characteristics for
forage zoning of deforested areas.
The analysis of the economic feasibility of inte-
grated systems aimed to evaluate under what
conditions the main variants of the crop-live-
stock-forest integration (CLFI) systems have
remained (or become) economically feasible

68
as principais variantes dos sistemas de integração
lavoura-pecuária-floresta (ILPF) permanecem
(ou se tornam) economicamente viáveis em pro-
priedades agrícolas em municípios localizados
no bioma Amazônia. Buscou-se avaliar sob quais
condições técnicas e de mercado os sistemas
de integração conseguem proporcionar um re-
torno econômico razoável para os produtores.
Para chegar a esses resultados, mapeou-se a
literatura disponível sobre a viabilidade econô-
mica desses sistemas. Porém, não foi possível
identificar sob quais condições os sistemas de
integração são economicamente viáveis, sendo
necessário construir esse modelo em etapas
futuras do presente estudo. Nessa direção, mais
do que apresentar as condições que tornam os
sistemas de integração rentáveis para os produ-
tores, essa análise oferece a documentação de
um modelo para fazer essa avaliação, baseado
no relatório do SENAR, o mais detalhado traba-
lho disponível na literatura revisada. Uma vez
com esse modelo estabelecido, bastará alimen-
tá-lo com os dados característicos a respeito
das propriedades e da produção para calcular
os indicadores de viabilidade dos sistemas de
integração naquela região.
Por fim, foi realizada uma abordagem dos princi-
pais pilares da sustentabilidade para a exploração
agropecuária na Amazônia Legal, analisando-se
aspectos agroambientais, sociais, políticos e
econômicos. O melhor aproveitamento susten-
tável das áreas desmatadas na Amazônia Legal
a partir de sistemas agroambientais passa pela
utilização de sistemas produtivos mais eficien-
tes, pela redução da vulnerabilidade social, pela
in properties in the municipalities located in
the Amazon biome. The aim was to evaluate
under which technical and market conditions
the integrated systems can assure a reasonable
economic return to producers.
To achieve these results, the available literature
on the economic feasibility of these systems
was mapped. However, it was not possible to
identify under which conditions the integrat-
ed systems are economically feasible, so it is
necessary to construct this model in future
steps of this project. Moving forward, it will
be necessary to provide documentation for
a model to perform this evaluation based on
the report of SENAR, the most detailed work
available in the literature reviewed, aside from
presenting the conditions that make integrated
systems profitable to producers.. Once this
model is established, it will be necessary to
feed it with data on the characteristics of the
properties and production systems to calculate
the feasibility of the integration of systems in
specific regions.
To conclude, an analysis of the main sustain-
ability pillars for agricultural exploitation of
Amazônia Legal is carried out, covering critical
agro-environmental, social, political and eco-
nomic aspects. The most effective sustainable
exploitation of deforested areas in Amazônia
Legal by agro-environmental systems includes
the utilization of more efficient productive sys-
tems, reduction of social vulnerability, identi-
fication of economic conditions under which
these systems of integration are feasible and

69 AMAZÔNIA LEGAL: PROPOSTAS PARA UMA EXPLORAÇÃO AGRÍCOLA SUSTENTÁVEL
AMAZÔNIA LEGAL: PROPOSALS FOR SUSTAINABLE AGRICULTURE
identificação econômica das condições sob as
quais os sistemas de integração são viáveis e
por melhores políticas públicas.
Dessa forma, destaca-se a importância do tema
estudado para o aumento da produtividade
agrícola evitando o desmatamento. A adoção
ou a ampliação de tecnologias para o desen-
volvimento sustentável e a gestão positiva do
ambiente geram benefícios para o agricultor e
para as florestas. Os passos futuros estão rela-
cionados ao mapeamento das forrageiras mais
indicadas para o bioma, à identificação dos me-
lhores sistemas de produção por município, ao
aperfeiçoamento dos estudos de aptidão agrí-
cola e de zoneamento de risco climático, prin-
cipalmente de forrageiras para cada município,
e, especialmente, à busca do estabelecimento
de uma base sólida de variáveis econômicas
que possam auxiliar na escolha dos sistemas
de produção que possam ser indicados para
cada município, com intensificação tecnológica
associada à rentabilidade econômica.
identification of the best public policies.
The theme studied is especially relevant because
increasing agricultural productivity can help
avoid deforestation. The adoption or expanded
use of technologies for sustainable development
combinedwith positive environmental manage-
ment generates benefits for both farmers and
forests. Future tasks will include the mapping
of forage grasses that are most suitable for the
specific biomes, the identification of the most
suitable production systems at the municipal
level, improvement of studies on agricultural
fitness and climate risk zoning, and particularly
the effort to establish a solid base of economic
variables to help choose suitable productions
systems for each municipality.

70
71 AMAZÔNIA LEGAL: PROPOSTAS PARA UMA EXPLORAÇÃO AGRÍCOLA SUSTENTÁVEL
AMAZÔNIA LEGAL: PROPOSALS FOR SUSTAINABLE AGRICULTURE
REFERÊNCIAS BIBLIOGRÁFICAS REFERENCES
AMARAL, E. F. do et al. (2006). Áreas de risco de morte de pastagens de Brachiaria brizantha
cultivar Marandu, com uso da base de dados pedológicos do zoneamento ecológico-econômi-
co no Estado do Acre. In: BARBOSA, R. A. (org.). Morte de Pastos de Braquiárias. 1ed. Campo
Grande: Embrapa Gado Corte, p. 151-174.
ANADON, L. K. D. (2014). Innovation and Access to Technologies for Sustainable Development:
Diagnosing Weaknesses and Identifying Interventions in the Transnational Arena. Cambridge:
Harvard University.
ANDRADE, C. M. S.; VALENTIM, J. F. (2007) Síndrome da morte do capim-brizantão no Acre:
características, causas e soluções tecnológicas. Rio Branco: Embrapa Acre, 41 p. (Embrapa Acre.
Documentos, 105).
COSTA, M.A.; MARGUTI, B.O. (Eds.) (2015). Atlas da Vulnerabilidade Social dos Municípios
Brasileiros. Brasília: IPEA, 77 p.
BARTHEM, R. B. et al. (2004). Amazon Basin, GIWA Regional assessment. Kalmar, Sweden,
2004 p. 76. Disponível em | Available at: <http://www.unep.org/dewa/giwa/areas/reports/r40b/
giwa_regional_assessment_40b.pdf>.
COOK, B. G. et al. (2005). Tropical Forages: an interactive selection tool. [CD-ROM], CSIRO,
DPI&F(Qld), CIAT and ILRI: Brisbane, Austrália. Disponível | Available at: <http://www.tropical-
forages.info/>.
GOULDING, M.; BARTHEM, R.; FERREIRA, E. (2003). The Smithsonian Atlas of the Amazon.
Washington. DC: Smithsonian Books.
GVCES/FGV (2015). Incentivos Positivos e Programas de Relato de Emissões de Gases de Efeito Estufa.

72
IBGE. Banco de dados agregados. Rio de Janeiro: IBGE. Disponível em| Avaiable at: <http://
www.sidra.ibge.gov.br/bda/tabela/listabl.asp?c=1613&-z=t&o=3.> Acesso em: março de 2015.
Consulted in: March 2015.
Estimativa Populacional. Disponível em: IBGE <http://www.ibge.gov.br/estadosat/>.
Acesso em: março de 2015. Consulted in: March 2015.
Amazônia Legal. Disponível em | Available at: <http://www.ibge.gov.br/home/geociencias/
geografia/amazonialegal.shtm>. Acesso em: agosto de 2015. Consulted in: August 2015.
KISS, J. (2012). Morte súbita de pastagens gera perda de R$ 3 bi em MT. In: Valor Econômico, 9
de maio de 2012. Disponível em | Available at: <http://amazonia.web1325.kinghost.net/2012/05/
morte-s%C3%BAbita-de-pastagens-gera- perda-de-r-3-bi-em-mt/>.
MAHLI, Y. et al. (2006). The regional variation of aboveground live biomass in old-growth Amazonian
forests. Glob Chang Biol. v. 12, n. 7, p. 1107-1138. Disponível em | Available at: <http://doi.wiley.co
m/10.1111/j.1365-2486.2006.01120>.
MANZATTO, C. B. et al. (2008). Zoneamento de risco edáfico de ocorrência da síndrome da
morte do braquiarão nas áreas antropizadas da Amazônia Legal. Rio de Janeiro: Embrapa Solos/
Embrapa Acre. Folder.
MARGULIS, S. (2004). Causes of Deforestation of the Brazilian Amazon. In: World Bank
Working Paper n°22. Disponível em | Available at: <http://www-wds.worldbank.org/servlet/
WDSContentServer/WDSP/IB/2004/02/02/000090341_20040202130625/Rendered/
PDF/277150PAPER0wbwp0no1022.pdf>.
PITMAN, W. D. (2000). Environmental constraints to tropical forage plant adaptation and pro-
ductivity. In: SOTOMAYOR-RIOS, A.; PITMAN, W. D. (Eds.) Tropical forage plants: development
and use. Washington: CRC Press. p. 17-23.
INPE. Projeto de Monitoramento do Desflorestamento na Amazônia Legal (PRODES)- Monitotamento
da Floresta Amazônica Brasileira por Satélite. Disponível em | Available at: <http://www.obt.inpe.
br/PRODES/index.php>. Acesso em: jun 2015. Consulted in: June 2015.
Metodologia para o Cálculo da Taxa Anual de Desmatamento na Amazônia Legal (2013).
Disponível em | Available at: <http://www.obt.inpe.br/PRODES/metodologia_TaxaPRODES.
pdf>. Acesso em: junho 2015. Consulted in: June 2015.

73 AMAZÔNIA LEGAL: PROPOSTAS PARA UMA EXPLORAÇÃO AGRÍCOLA SUSTENTÁVEL
AMAZÔNIA LEGAL: PROPOSALS FOR SUSTAINABLE AGRICULTURE
Taxas anuais do desmatamento - 1988 até 2013. (2013). Disponível em | Available at:
http://www.obt.inpe.br/prodes/index.php. Acesso em: março de 2016. Consulted in:
March 2016.
SAATCHI, S. S. et al. (2007). Distribution of aboveground live biomass in the Amazon basin. In:
Global Change Biology. v. 13, n. 4, p. 816-837, 2007. Disponível em | Available at: <http://online-
library.wiley.com/resolve/doi?DOI=10.1111%2Fj.1365-2486.2007.01323.x>
SENAR (2013). Análise financeira de modelos típicos de produção com e sem adoção de práticas
de baixo carbono. Brasília-DF, julho de 2013.
SCOLESE, E. (2000). Pecuária no Acre está sob risco, diz estudo. In: Folha de São Paulo: Ambiente,
11 de setembro de 2000. Disponível em | Available at: <http://www1.folha.uol.com.br/fsp/ciencia/
fe1109200001.htm>.
STEEGE, H. ter et al. (2013). Hyperdominance in the Amazonian Tree Flora. In: Science. v. 342,
p. 325-335. TERRACLASS (2012). Mapeamento do uso e cobertura da terra na Amazônia Legal
Brasileira. Brasília: MAPA, MMA e MCTI. Disponível em | Available at: <http://www.inpe.br/noti-
cias/arquivos/pdf/TerraClass_2012.pdf>.
VALENTIM, J. F. et al. (2000a). Diagnosis and potential socioeconomic and environmental im-
pacts of pasture death in the Eastern Brazilian Amazon. In: I LBA Scientific Conference, 2000,
Belém, PA. Abstracts LBA Scientific Conference, 1, 2000a. p. 212.
VALENTIM, J. F. et al. (2000b). Zoneamento de risco edáfico atual e potencial de morte de pasta-
gens Brachiaria brizantha no Acre. Rio Branco: Embrapa-CPAF-Acre, Boletim de Pesquisa n° 29.
VALENTIM, J. F. et al. (2002). Definição das zonas de risco de morte de pastagens de Brachiaria
brizantha cv. Marandu no Estado do Acre. In: XIX Reunião Brasileira de Manejo e Conservação
do Solo e da Água, 2002, Cuiabá, MT. Anais da XIV Reunião Brasileira de Manejo e Conservação
do Solo e da Água.