Embed Size (px)
Citation preview

Pedro André Dias Ramos
Licenciatura em Bioquímica
Genome-wide shRNA screening identifies genes involved in fulvestrant
resistance in breast cancer
Dissertação para obtenção do Grau de Mestre em Genética Molecular e Biomedicina
Orientador: Prof. Henrik J. Ditzel, MD, PhD, DMsc, SDU-IMM Co-orientador: Daniel Elias, Post-Doc, SDU-IMM
Júri:
Presidente: Doutora Margarida Casal Ribeiro Castro Caldas Braga, Professora Auxiliar da Faculdade de Ciências e Tecnologia da Universidade Nova de Lisboa; Arguente: Doutora Maria Alexandra Núncio de Carvalho Ramos Fernandes, Professor Auxiliar da Faculdade de Ciências e Tecnologia da Universidade Nova de Lisboa. Vogal: Doutor Pedro Miguel Ribeiro Viana Baptista, Professor Associado com Agregação da Faculdade de Farmácia da Universidade de Lisboa


Genome-wide shRNA screening identifies genes involved in fulvestrant resistance in breast
cancer
Copyright Pedro André Dias Ramos, FCT/UNL, UNL
A Faculdade de Ciências e Tecnologia e a Universidade Nova de Lisboa têm o direito, perpétuo e sem
limites geográficos, de arquivar e publicar esta dissertação através de exemplares impressos reproduzidos
em papel ou de forma digital, ou por qualquer outro meio conhecido ou que venha a ser inventado, e de a
divulgar através de repositórios científicos e de admitir a sua cópia e distribuição com objectivos
educacionais ou de investigação, não comerciais, desde que seja dado crédito ao autor e editor.


I
ACKNOWLEDGMENTS
In first place, I’m sincerely grateful to my supervisor Prof. Henrik Ditzel for his full availability in giving
me the opportunity to do my thesis in his laboratory at the Department of Cancer and Inflammation
Research, Institute of Molecular Medicine, University of Southern Denmark.
I’m also deeply grateful to my co-supervisor Post Doc Daniel Elias, which was a mentor for me, giving
me guidance regarding my work and whose discussions were fundamental for my learning.
I also want to express my appreciation to my teacher at my home university, Prof. Alexandra Fernandes,
whose efforts in allowing me to come to Denmark were essential. Also, I would like to thank to Prof.
Paula Gonçalves for her sensibility when taking care of the process for my thesis extent.
I would also like to thank to all the people from the 3rd floor, WP25 for their hospitality in welcoming me
to the group and for the pleasant work environment. A special thanks to Carla Alves, whose help and
incentive words in many situations were very important (Obrigado!). To all the lab technicians, especially
to Henriette Vever, whose assistance was indispensable to carry out all the lab work.
Finally, I would like not to thank but to express my eternal gratitude to my parents Ermelinda Ramos
and Emídio Ramos and to my beloved girlfriend Rita Falcão for their inconditional love. To my parents,
I would like to thank for their invaluable support, otherwise it wouldn’t be possible to have my degree
and to get the chance to study abroad and for the fact of being side-by-side with me, giving me strength
during the hardest months of my life. To Rita, a word is just simply not enough, her support every day
during the time that I was here, all the kind words, all the happiness and love that she gave me were the
reasons that made me strong enough to overcome the worst moments of my life and comeback stronger
to our life and finish what I started. (UM ENORME OBRIGADO!).
I also would like to thank to all my family and friends for their support and concern during all these year
and a half.
I’m grateful for the financial support from the Danish Government under the cultural agreement
programme through a scholarship and afterwards from the ERASMUS programme from the Faculdade
de Ciências e Tecnologia da Universidade Nova de Lisboa.
Obrigado, Thank you, Tusind tak!

II

III
ABSTRACT
Breast cancer accounts as the most prevalent cancer and the leading cause of cancer death worldwide
among women. Estrogen is one main factor responsible for tumour growth in breast cancer patients
through stimulation of estrogen receptor (ER) signalling. ER positive (ER+) breast cancer patients are
eligible for anti-estrogenic drugs. Fulvestrant (Faslodex®) represents a second-line therapy for the
treatment of postmenopausal women with ER+ advanced breast cancer. Unfortunately, a significant
number of ER+ patients will develop resistance to second-line fulvestrant treatment. It is therefore
important to understand the molecular mechanisms of resistance and to identify biomarkers capable of
predicting response to this treatment.
The aim of this project is to establish a genome-wide shRNA functional screening to identify key proteins
central in resistance mechanisms and potentially predictive biomarkers capable of identifying ER+
patients that are responsive or resistant to fulvestrant treatment. To do so, a MCF-7-based fulvestrant
resistant breast cancer cell line was used. MCF-7/LCC1 and MCF-7/LCC9 were transduced with shRNA
libraries covering over 15,000 mRNAs and treated with fulvestrant. This led to depletion and/or
enrichment of shRNAs targeting genes evaluated by next generation sequencing (NGS). Deconvolution
of NGS data from genomic DNA of LCC1 and LCC9 cells transduced by shRNA libraries led to
identification of 206 genes that may have functional significance in fulvestrant resistance. Ingenuity
Pathway Analysis of the candidate genes identified HSD17B10 and HSPE1 as key-molecules in
networks related to cell proliferation and death. We have found that these genes are upregulated in
different fulvestrant-resistant cell lines when compared to their fulvestrant-sensitive parental cell line at
gene and protein expression levels using RT-qPCR and Western blotting. This expression is enhanced
in fulvestrant presence, suggesting that these proteins may have critical importance in the resistance
phenotype. Further studies on these proteins may elucidate on how to overcome fulvestrant resistance.
Keywords: ER+ breast cancer, Fulvestrant resistance, Genome-wide shRNA screening, HSD17B10,
HSPE1

IV

V
RESUMO
O cancro de mama apresenta a maior prevalência e conta como a maior causa de morte por cancro
em mulheres a nível mundial. O estrogénio é um dos principais factores responsável pelo crescimento
de tumores em pacientes de cancro de mama através da estimulação da sinalização do receptor de
estrogénio (RE). Pacientes de cancro de mama RE positivos (RE+) são elegíveis para fármacos anti-
estrogénicos. Fulvestrant (Faslodex®) representa uma segunda linha terapêutica para o tratamento de
mulheres em pós-menopausa com cancro de mama RE+ avançado. Infelizmente, um número
significativo destes pacientes irá desenvolver resistência a fulvestrant. Assim, é importante entender os
mecanismos moleculares de resistência e identificar biomarcadores capazes de prever resposta a estes
tratamentos.
O objectivo deste projecto é estabelecer um genome-wide shRNA screening e identificar proteínas-
chave associadas a mecanismos de resistência assim como biomarcadores potencialmente preditivos
e capazes de identificar pacientes RE+ que respondam ou demonstrem resistência ao tratamento com
fulvestrant. Para tal, linhas celulares de cancro de mama resistentes a fulvestrant originalmente de
MCF-7 foram utilizadas. MCF-7/LCC1 e MCF-7/LCC9 foram transduzidas por bibliotecas de shRNAs
capazes de alvejar mais de 15000 mRNAs e tratadas com fulvestrant. Isto levou a um fenómeno de
delecção ou enriquecimento de genes alvejados por shRNAs, sendo avaliado através de next-
generation sequencing (NGS). A desconvolução dos dados de NGS a partir de DNA genómico de
células LCC1 e LCC9 transduzidas pelas bibliotecas de shRNA levaram à identificação de 206 genes
que poderão ter relevância funcional na resistência a fulvestrant. Ingenuity Pathway Analysis dos genes
candidatos identificou HSD17B10 e HSPE1 como moléculas-chave em redes/vias relacionadas com
proliferação e morte celular. Estes genes demonstraram regulação e expressão elevada em diferentes
linhas celulares resistentes a fulvestrant por comparação com as sensíveis em termos dos níveis de
expressão génica e proteica avaliada por RT-qPCR e Western Blotting, respectivamente. Esta
expressão aumenta na presença de fulvestrant, sugerindo que estas proteínas poderão ter uma
importância crítica no fenótipo de resistência. Mais estudos nestas proteínas poderão elucidar sobre
como ultrapassar a resistência a fulvestrant.
Palavras-chave: Cancro de mama RE+, Resistência a Fulvestrant, genome-wide shRNA screening,
HSD17B10, HSPE1

VI

VII
ABBREVIATIONS
+fulv Plus fulvestrant
β-actin Beta-actin
AF Activating function
AIs Aromatase Inhibitors
AKT Protein kinase B
AP-1 Activator protein 1
BAK Bcl-2 homologous antagonist/killer
BCA Bicichoninic acid
BCL-2 B-cell lymphoma 2
BIK Bcl-2 interacting killer
bps base pairs
BRCA1 Breast cancer 1
BSA Bovine albumin serum
C.elegans Caenorhabditis elegans
CCT8 Chaperonin Containing TCP1, Subunit 8
cDNA complementary DNA
CEP192 Centrosomal protein of 192 kDa
CONFIRM Comparison of Faslodex in Recurrent or
Metastatic Breast cancer
Day0 Day zero or baseline
DBD DNA binding domain
DEPC Diethylpyrocarbonate
DMEM Dubelcco’s Modified Eagle Medium
dNTP deoxy-nucleotides triphosphate
dsRNA double-stranded RNA
DTT Dithiothreitol
ECL Enhanced chemiluminescence
EDTA Ethylenediamine tetraacetic acid
EGFR Epidermal growth factor receptor

VIII
EIF2 Eukaryotic translation initiation factor 2
EIF2S2 Eukaryotic translation initiation factor 2
subunit 2
eIF4 Eukaryotic initiation factor 4
ER Estrogen receptor
ERα Estrogen receptor alpha
ERβ Estrogen receptor beta
ER+ Estrogen receptor positive
ERK Extracellular signal-regulated kinase
ERRγ Estrogen-related receptor gamma
FACS Fluorescence-activated cell sorting
FBS Fetal bovine serum
FCS Fetal calf serum
GFR Growth factor receptor
HER2 Human epidermal growth factor receptor 2
HER3 Human epidermal growth factor receptor 3
HRP Horseradish peroxidase
HSD17B10 Hydroxysteroid (17-Beta) Dehydrogenase
HSP Heat shock protein
HSPE1/HSP10 Heat shock 10 kDa protein
HTS High-throughput screening
IAA Iodoacetamide
IGF-1 Insulin-like growth factor 1
IPA Ingenuity Pathway Analysis
LBD Ligand binding domain
LTED Long-term estrogen deprivation
MAPK Mitogen-activated pathway kinase
MBP Myelin binding protein
MED1 Mediator of polymerase II transcription
subunit 1
miR microRNA
IX
MOI Multiplicity of Infection
mRNA messenger RNA
mTOR Mammalian target of rapamycin
NEDD8 Neural precursor cell expressed,
developmentally down-regulated 8
NF-κB Nuclear factor-kappa B
NGS Next-generation sequencing
Nofulv No fulvestrant
NP-40 nonyl phenoxypolyethoxylethanol 40
p70S6k P70 S6 kinase
PBS Phosphate buffer saline
PCR Polymerase chain reaction
Pen/Strep Penicilin/Streptomycin
PFS Progression-free survival
PI3K Phosphoinositide-3-kinase
PI3KCA Phosphoinositide-3-kinase, catalytic, alpha
polypeptide
PSMB2 Proteasome subunit beta type-2
PTEN Phosphatase and tensin homolog
PUM1 Pumilio homolog 1
PVDF Polivinylidene fluoride
RFP Red Fluorescent Protein
RIPA Radioimmunoprecipitation assay
RISC RNA-induced silencing complex
RNAi Ribonucleic acid interference
RPMI Roswell Park Memoriam Institute
RQ Relative quantification
RT-qPCR Quantitative real-time polymerase chain
reaction
SDS Sodium dodecyl sulphate
SERDs Selective Estrogen Receptor Downregulators

X
SERMs Selective Estrogen Receptor Modulators
shmiRNA small hairpin microRNA
shRNA small hairpin RNA
SHROOM2 Shroom Family Member 2
siRNA small interfering RNA
SME Standard error of the mean
SP-1 Specific protein 1
TBS Tris buffer saline
TBST Tris buffer saline Tween 20
TNF Tumor necrosis factor
TP53 Tumor protein 53
USP7 Ubiquitin-specific-processing protease 7

XI
CONTENTS
ACKNOWLEDGEMENTS …………………………………………………………………………………….I
ABSTRACT…….. …………………………..…………………………………………………………………III
RESUMO……………………………………………………………………………...………………………..V
ABBREVIATIONS………………………………………………………………………………………….…..VII
1. INTRODUCTION
Breast cancer: Prevalence and characterization…………………………………………………..1
Estrogen production and ER…………………………………………………………………………1
Endocrine therapy……………………………………………………………………………………..3
Resistance to endocrine therapy…………………………………………………………………….4
Molecular mechanisms of resistance to endocrine therapy……………………………………....4
Overcoming endocrine resistance – combined drug therapy……………………………………..5
RNAi screening: Main features and shRNA libraries………………………………………………7
Pooled format: an approach using shRNA libraries in HTS……………………………………….9
Negative selection HTS for cancer-related genes…………………………………………………10
Present study…………………………………………………………………………………………..11
2. MATERIALS AND METHODS
Cell lines culturing
293T cell line………………………………………………………………………………….13
MCF-7/0,5 and fulvestrant-resistant (FRs) cell lines……………………………………..13
LCC1 and LCC9 cell lines………………………………………………………………...…14
T47-D cell lines……………………………………………………………………………….14
ZR75 cell lines………………………………………………………………………………..14
Lentivirus packaging in 293T cell line……………………………………………………………….15
Puromycin titration in LCC1 and LCC9 cell lines…………………………………………………...15
Viral titer estimation in LCC1 and LCC9 cell lines………………………………………………….16
shRNA genome-wide screening in LCC1 and LCC9 cell lines……………………………………16
DNA extraction and purification…………………………………………………………………...….16
PCR barcode amplification and evaluation…………………………………………………………17
PCR product purification……………………………………………………………………………...17

XII
DNA quantification for next-generation sequencing (NGS) using Picogreen assay……………17
NGS sequencing of shRNA-specific barcodes……………………………………………………..17
Selection of candidate genes…………………………………………………………………….….18
Ingenuity Pathway Analysis………………………………………………………………………….18
RNA extraction…………………………………………………………………………................….18
cDNA synthesis…………………………………………………………...…………………………..18
Quantitative reverse transcription PCR (RT-qPCR)…………………...………………………….19
Protein extraction……………………………………………………………………………………...19
Protein quantification (BCA assay)………………………………………………………………….19
SDS-page………………………………………………………………………………………………20
Western Blotting……………………………………………………………………………………….20
3. RESULTS
Determination of virus titres to ensure enough shRNA representation in LCC cell lines………23
Barcode amplification of shRNA inserts in screen cell populations………………………………24
Sequencing of barcode sequences led to identification of several candidate genes in different
shRNA library screenings………………………………………………………………………………………25
Pathway analysis using Ingenuity Pathway Analysis (IPA) software showed representation of
candidate genes in relevant networks………………………………………………………………………...28
HSD17B10 and HSPE1 genes are up-regulated in fulvestrant-resistant cell lines……………..32
Evaluation of protein expression showed enhanced expression of HSD17B10 and HSPE1 in
fulvestrant-resistant cell lines…………………………………………………….…………...……………….33
4. DISCUSSION…………………………………………………………………………...……………………37
Future perspectives……………………………………………………………………………...……39
REFERENCES………………………………………………………………………………………………….41
APPENDICES
Appendix I: Red Fluorescent Protein (RFP) fluorescence spectra and specifications………...49
Appendix II: Indexing primers sequences from Cellecta……………………………………….….50
Appendix III: BCA protein assay (working range 20-2000 µg/mL)…………………………….….51
Appendix IV: BCA standard curves for different cell lines using Bovine Serum Albumin (BSA) as
a standard protein……………………………………………………………………………………………….52

XIII
Appendix V: Multiplicity of Infection (MOI) vs % of transduced cells and titer formula calculation
example...........................................................................................................................................…...54
Appendix VI: Lentiviral shRNA expression vector pRSI9-U6-(sh)-UbiC-RFP-2A-Puro (HTS3
cassette)………………………………………………………………..………………………………………..55
Appendix VII: HSD17B10 and HSPE1 genes associated to important molecules related with
endocrine resistance in evaluate by IPA……………………………………………………………………...56
Appendix VIII: HSD17B10 expression in the absence and presence of fulvestrant in LCC1 and
LCC9 cell lines……………………………………………………………………..……………………….…...57

XIV

XV
FIGURE CONTENTS
Figure 1.1. Estrogen production and action targeted by endocrine therapies…………………………….2
Figure 1.2. Schematic representation of functional domains of human ERα and ERβ…………………..3
Figure 1.3. Treatment algorithm for post-menopausal patients with hormone receptor positive (ER+) and
HER2 negative (HER2-) breast cancer………………………………………………………………………...6
Figure 1.4. RNAi tools and enzymatic processes involved in mRNA targeting and degradation………..8
Figure 1.5. Workflow of a negative selection shRNA screening using NGS……………………………….10
Figure 3.1. Percentage of LCC9 cells transduced upon transduction with lentiviral particles carrying
shRNA library module 1………………………………………………………………………………...………23
Figure 3.2. Percentage of LCC9 cells transduced upon transduction with lentiviral particles carrying
shRNA library module 2………………………………………………………………………………………...23
Figure 3.3. Percentage of LCC9 cells transduced upon transduction with lentiviral particles carrying
shRNA library module 3……………………………………………………………………………..…………24
Figure 3.4. Percentage of LCC1 cells transduced upon transduction with lentiviral particles carrying
shRNA library module 3……………………………………………………………………..…………………24
Figure 3.5. Barcode PCR amplification of genomic DNA from shRNA libraries screening cell populations
in agarose gel-electrophoresis………………………………………………………………………………...25
Figure 3.6. Canonical pathways common between all different shRNA library screening potential
depleted candidate genes………………………………………………………………………………...……28
Figure 3.7. IPA network representation based on the pool of depleted candidate genes retrieved from
the different shRNA library modules screening………………………………………………………………29
Figure 3.8. IPA summary from the convergence of the candidate genes obtained from the different
shRNA library screening analysis representing the top networks identified and the correspondent score
probability……………………………..…………………………………………………………………………31
Figure 3.9. Relative quantification (RQ) of gene expression of HSD17B10 (black) and HSPE1 (grey)
genes in fulvestrant-sensitive LCC1 and fulvestrant-resistant LCC9 cell as measured using RT-qPCR
…………………………………………………………………………………………………32
Figure 3.10. Relative quantification (RQ) of gene expression of HSD17B10 (black) and HSPE1 (grey)
genes in the fulvestrant-sensitive MCF-7 and fulvestrant-resistant FRs cell lines as measured using RT-
qPCR……………………………………………………………………………………………………..………33

XVI
Figure 3.11. Western-blot analysis of HSD17B10 protein expression in different ER+ breast cancer cell
lines models in the absence and presence of fulvestrant…………………………………………………..34
Figure 3.12. Western-blot analysis of HSPE1 protein expression in different ER+ breast cancer cell lines
models in the absence and presence of fulvestrant………………………………..………………………..35
Figure 3.13. Densitometric analysis of representative western-blots of HSD17B10 expression in LCC1,
LCC9, ZR 75-1 and ZR 75-1R cell lines (a) and T47-D S5, T47-D R1 and R2 and MCF-7/S0,5 and FRs
cell lines (b) both in absence and presence of fulv (+fulv)……………………………………………….....35
Appendix
Figure 1. Tag Red Fluorescent Protein (TagRFP) characteristics………………………………………….49
Figure 2. Preparation of standards (A) and working reagent (B) in a working range between 20-2000
µg/mL for BCA protein assay…………………………………………………………………………………..51
Figure 3. BCA standard curve for LCC1 and LCC9 cell lines in the absence of fulvestrant by using Pierce
BCA Protein Assay kit working range in appendix II..............................................................................52
Figure 4. BCA standard curve for LCC1 and LCC9 cell lines in the presence of fulvestrant by using
Pierce BCA Protein Assay kit working range in appendix II………………………………….....................52
Figure 5. BCA standard curve for MCF-7 and FRs cell lines in the absence and presence of fulvestrant
by using Pierce BCA Protein Assay kit working range in appendix II………………………………………53
Figure 6. BCA standard curve for T47-D cell lines in the absence and presence of fulvestrant by using
Pierce BCA Protein Assay kit working range in appendix II…………………………………………………53
Figure 7. BCA standard curve for ZR-75 cell lines in the absence and presence of fulvestrant by using
Pierce BCA Protein Assay kit working range in appendix II…………………………………………………53
Figure 8. Multiplicity of infection (MOI) and respective % of transduced cells upon infection with viral
particles………………………………………………………………………………….………………...…….54
Figure 9. pRSI9-U6-(sh)-HTS3-UbiC-TagRFP-2A-Puro-dW lentiviral shRNA expression vector……...55
Figure 10. Network 2 (score probability of 12) associated to cell morphology, cellular assembly and
organization and cellular development retrieved from IPA of candidate genes from shRNA library 1
screening………………………………………………………………………………………………………...56
Figure 11. Western-blot analysis of HSD17B10 protein expression in fulvestrant-sensitive (LCC1) and
fulvestrant-resistant (LCC9) cell line models in the absence and presence of fulvestrant……………….57

XVII
TABLE CONTENTS
Table 3.1. Table showing the list of genes whose corresponding shRNAs showed marked depletion
following fulvestrant treatment in shRNA library transduced LCC9 cell lines……………………………..26
Appendix
Table 1. Indexing primers sequences used for identification of samples for next-generation sequencing
step………………………………………………………………………………..……………………………..50

XVIII

1
INTRODUCTION
Breast cancer – prevalence and characterization
Breast cancer is the most common and frequently diagnosed cancer in women worldwide (Release,
2013; Jemal et al, 2011; Esebua, 2013). According to GLOBOCAN 2012, 1.7 million breast cancers
were diagnosed in total (around 12% of total cancers), being only surpassed by lung cancer and since
2008 estimates, breast cancer incidence has increased by more than 20%, while mortality has increased
by 14% being the most common cause of cancer death among women in 140 countries worldwide
(Release, 2013; Ferlay et al, 2010; Jemal et al, 2008; Jemal et al, 2011). In western Europe, incidence
rates are high so that it has been estimated that 90 in 100 000 women have been diagnosed with breast
cancer (Release, 2013; Jemal et al, 2011). In Portugal, breast cancer ranks first among cancer affecting
women and Denmark is the 2nd country with higher incidence of breast cancer in the world (André et al,
2014; Release, 2013). Five major biologically distinct intrinsic subtypes of breast cancer tumors aroused
after high-throughput screening technologies like microarray analysis: luminal A, luminal B, human
epidermal growth factor (HER2)-overexpressing, normal-like and basal-like (Han et al, 2013). Luminal
A and luminal B subtypes are characterized by typically expressing estrogen receptor (ER), although at
a different level and by having the best outcome disease in patients (Kok et al, 2009; Han et al, 2013;
Osborne & Schiff, 2011). They are often called ER positive tumors (ER+) and can be treated through
the use of endocrine therapy (Han et al, 2013; Herynk et al, 2009; Osborne & Schiff, 2011). It has been
long established that estrogen is a tumor promoter for the mammary gland, being involved in the
pathogenesis of breast cancer through the sustained growth and proliferation of breast cancer cells
expressing ER (Dixon, 2014; Zilli et al, 2009; Ali & Coombes, 2002; Ambrosino et al, 2013).
Estrogen production and ER
In hormone-dependent cancers, estrogen taken up from the blood plasma or from local production sites
diffuses into the cancer cell and binds to the estrogen receptor (ER) that is generally associated to heat
shock proteins (HSPs). This binding promotes HSPs dissociation from the ER and consequently
dimerization of ERs. After this dimerization, these bound-molecules can bind to conserved estrogen
response element (ERE) sequences within the promotor regions of genes in cell nucleus (Dixon, 2014;
Ambrosino et al, 2013). ER activates gene expression by stimulating recruitment of the general
transcription machinery to the transcription start site through the action of its activation domains (Fig.1.1)
(Ali & Coombes, 2002; Osborne & Schiff, 2011).

2
ER is a nuclear receptor encoded by the ESR1 gene. It comprises two distinct transactivation domains:
Activation function 1 and 2 (AF-1 and AF-2) as represented in Fig.1.2. AF-1 is regulated by growth
factors and act through Mitogen-a
ctivated pathway kinase (MAPK) whereas AF-2 is incorporated in the ligand binding region of ER and is
logically activated by estrogen molecules (Dixon, 2014, Zilli et al, 2009; Musgrove et al, 2009; Howell,
2006; Herynk et al, 2009; Becerra et al, 2013). At the present, ERα seems to be more associated with
breast cancer initiation and progression, being intensively investigated throughout the latter years in
regarding to this matter. ER is related to cell proliferation and survival through two different mechanisms:
the genomic and non-genomic signaling pathway (Schiff & Osborne, 2005; Osborne & Schiff, 2011;
Becerra et al, 2013). The AF-1 domain is very active in ERα in different cell lines, but its activity is
negligible in ERβ under the same conditions, also showing a different response to agonist/antagonist
ligands as synthetic antiestrogens like tamoxifen, ICI 164,384, faslodex and raloxifene (Klinge, 2001;
Nilsson et al, 2001; Zilli et al, 2009; Howell, 2006).
Figure 1.1. Estrogen production and action targeted by endocrine therapies. AIs inhibit aromatase enzyme and consequently estrogen production. Tamoxifen and fulvestrant bind to AF-1 and AF-2 domains of ER preventing the process of dimerization and subsequent ER transcriptional activity in cell nucleus. ER – Estrogen Receptor, ERE – Estrogen Response Element, AI - Aromatase inhibitor, T - Tamoxifen, F – Fulvestrant. (Adapted from Dixon, 2014)

3
Endocrine therapy
It is known and statistically reported that over 80% breast cancer patients are classified as ER+ breast
cancers and are eligible to receive endocrine therapy (Osborne & Schiff, 2011; Zilli et al, 2009; Dixon,
2014; Musgrove et al, 2009).
Selective Estrogen Receptor Modulators (SERMs) like tamoxifen showed up to reduce the rate of
disease recurrence for half when used as an adjuvant therapy in combination with surgical removal of
tumor or chemotherapy and radiotherapy in early breast cancer stage (Musgrove et al, 2009; Dixon,
2014; Johnston, 2010; Howell, 2006). Tamoxifen is responsible for the reduction of annual breast cancer
death to 25-30% after five years treatment (Musgrove et al, 2009; Zilli et al, 2009; Ali & Coombes, 2002;
Breast, Trialists, & Group, 2005). Finally and not less important, tamoxifen treatment induces objective
response or disease stabilization in about 50% of untreated metastatic breast cancer patients with ER-
positive tumors (Zilli et al, 2009; Osborne & Schiff, 2011). Tamoxifen works by intranuclear competitive
binding to ER, preventing the binding of coactivators to the AF-2 domain of the ER dimer (Dixon, 2014;
Zilli et al, 2009; Nilsson et al, 2001; Herynk et al, 2009). Selective Estrogen Receptor Downregulators
(SERDs) like fulvestrant (Faslodex®/ICI 182,780) have 100 times higher binding affinity than tamoxifen
due to a complete antagonist activity, inactivating both AF-1 and AF-2, inhibiting subsequently ER-
mediated gene transcription completely, which makes ER completely unavailable or unresponsive to
estrogen or its agonists (Johnston, 2010; Ciruelos et al, 2014; Howell & Bergh, 2010; Howell, 2006).
Fulvestrant demonstrated clinical efficacy among patients who relapsed for a second time after
responding to tamoxifen and aromatase inhbitors (AIs) (Howell, 2006; Howell et al, 2004; Robertson et
Figure 1.2. Schematic representation of functional domains of human ERα and ERβ. Both have 6 domains (A-F), from N to C-terminus encoded by 8-9 exons. The three major functional domains of the ER are: the N-terminus (A and B domains), that integrates AF-1, which is responsible for the constitutive and ligand-independent transcriptional activity of ER; the DNA-binding domain (DBD) consisting of C domain, responsible for specific binding to the DNA helix and ER dimerization and finally, the ligand binding domain (LBD) – E domain – containing AF-2, which when active leads not only to conformational changes in the rate of transcription of estrogen-regulated genes but also to the ligand-dependent activation of ER. The F domain exerts a complex modulatory role on both AF-1 and AF-2 activities and seems to distinguish estrogen agonists from antagonists as well as shows up to be involved in ER dimerization, nuclear translocation and ligand-dependent activation of gene expression (Klinge, 2001)(Nilsson et al, 2001)(Zilli et al, 2009; Adapted from Becerra et al, 2013)

4
al, 2003; Ciruelos et al, 2014). In fact, fulvestrant is indicated for the treatment of postmenopausal
women with ER+ with locally advanced or metastatic breast cancer and for disease relapse on or after
adjuvant antiestrogen therapy (Ciruelos et al, 2014; Howell, 2006; Howell & Bergh, 2010).
Resistance to endocrine therapy
Endocrine therapy represents a mainstay in the treatment of ER-positive breast cancer and despite its
major good effects, resistance to the treatment will eventually occur in a large number of patients. This
type of resistance can be a primary lack of response – de novo/intrinsic resistance – occurring early in
the treatment or later following a period of response, defined as acquired resistance (Dixon, 2014).
It is known that about 50% of patients with advanced disease aren’t able to respond to first line treatment
with tamoxifen (de novo resistance) (Becerra et al, 2013). Studies have also shown that recurrence
occurs in approximately 10-15% of patients with early-stage ER-positive breast cancer within 5 years of
adjuvant therapy and recurrence rates will reach 30% by 15 years (Dixon, 2014; Breast, Trialists, &
Group, 2005). Others stated that between 40-50% of ER-positive breast cancer patients receiving
adjuvant endocrine therapy will probably relapse (Dixon, 2014; Johnston, 2010). In advanced disease,
patients tend to acquire resistance within 2-3 years of commencing endocrine therapy (Dixon, 2014).
Molecular mechanisms of resistance to endocrine therapy
Lack of expression is the main responsible for de novo resistance and may also account for progressive
disease (Zilli et al, 2009; Musgrove et al, 2009; Johnston, 2010). In terms of acquired resistance to
tamoxifen about only 17-28% of tumours don’t express ER and 20% will probably respond to second-
line treatment with AIs or fulvestrant (Zilli et al, 2009; Becerra et al, 2013; Musgrove et al, 2009). The
loss of expression of ER constitutes, however, the main mechanism through which acquired resistance
is developed against fulvestrant in ER+ breast cancer patients (Zilli et al, 2009).
Post-translational modifications like phosphorylations have been reported to take place in ER and shown
to confer resistance to endocrine therapy (Musgrove et al, 2009; Dixon et al, 2014; Herynk et al, 2009;
Becerra et al,2013; Possemato et al, 2011; Ali & Coombes, 2002). Stimulation of epidermal growth factor
receptor (EGFR), HER2 and insulin-like growth factor 1 (IGF1) expression leads to MAPK/Extracellular
signal-regulated kinases (ERK), Phosphoinositide-3-kinase/Protein kinase B (PI3K/AKT) and
mammalian target of rapamycin (mTOR) activation resulting in antiestrogen resistance to tamoxifen and
fulvestrant (Zilli et al, 2009; Johnston, 2010; Bianco et al, 2012; Tokunaga et al, 2006; Osborne & Schiff,
2011; Massarweh et al, 2006).
The existence of truncated isoforms of ERα like ERα36 and estrogen-related receptor gamma (ERRγ)
associates with less responsiveness to tamoxifen (Dixon, 2014; Musgrove et al, 2009; Bianco et al,

5
2012; Ambrosino et al, 2013; Osborne & Schiff, 2011). Activation of transcriptional activity of activator
protein 1 (AP1) protein, the specific protein 1 (SP1) protein and the nuclear factor- κB (NF-κB) also leads
to endocrine resistance (Musgrove et al, 2009; Bianco et al, 2012).
In cell culture, anti-estrogens play a role as cytostatic and cytotoxic causing G1 phase-specific cell cycle
arrest, leading consequently to a decrease in the growth rate (Musgrove et al, 2009). Activation of
survival signaling through the PI3K-AKT pathway and increased non-genomic signaling from
cytoplasmic ER may increase the expression of anti-apoptotic molecules as B-cell lymphoma 2 (BCL-
2) and decrease expression of pro-apoptotic molecules such as Bcl-2 homologous antagonist/killer
(BAK), Bcl-2 interacting killer (BIK) and caspase 9 (Musgrove et al, 2009; Bianco et al, 2012; Tokunaga
et al, 2006; Ali & Coombes, 2002; Osborne & Schiff, 2011).
Fulvestrant is able to inhibit proliferation of long-term estrogen deprivation (LTED) cell line models
proliferation by comparison to MCF-7 cell lines models (Zilli et al, 2009). It was shown that fulvestrant
may sensitize cells to therapeutically effects of PI3K inhibitors when resistance to estrogen deprivation
is associated with ligand-independent ER activity (Becerra et al, 2013; Van Tine et al, 2011).
Loss of expression of ER and increased GFR signaling constitute the main mechanisms of resistance
to fulvestrant treatment, but disruption of Neural precursor cell expressed, developmentally down-
regulated 8 (NEDD8) pathway, which is responsible for ER ubiquitination may avoid ER degradation
making it sensitive to AIs sequential treatment (Zilli et al, 2009; Fan et al, 2003). HER3 and ERK were
also found to be essential for growth of human breast cancer cell lines with acquired resistance to
fulvestrant (Frogne et al, 2009). Finally, overexpression of miR-221/222 in estrogen positive cell lines
was shown to counteract the effect of estradiol depletion of fulvestrant-induced cell death (Ciruelos et
al, 2014).
Overcoming endocrine resistance – combined therapy
Figure 1.3 shows the clinical treatment strategy adopted for post-menopausal women with ER+/HER2-
breast cancer.
The Comparison of Faslodex in Recurrent or Metastatic Breast Cancer (CONFIRM) trial was able to
corroborate the high-dose regimen importance for significant increases in progression-free survival
(PFS) and absence of toxicity when administrating fulvestrant after relapse on endocrine therapy with
tamoxifen and AIs (Ciruelos et al, 2014; Dixon, 2014; Di Leo et al, 2010). A clinical benefit rate around
30% has been reported when using fulvestrant after AI and tamoxifen resistance in preclinical and
clinical studies in breast cancer patients (Zilli et al, 2009; Howell, 2006).
An in vitro study using tamoxifen or fulvestrant along with geftinib, an EFGR inhibitor, promotes
antiproliferative and pro-apoptotic effect when compared with the use of the drug alone (Zilli et al, 2009;
Gee et al, 2003).

6
Downstream signaling pathways inhibition through the use of PI3K-mTOR antagonists like everolimus
in combination with endocrine therapy have been demonstrated to inhibit cell growth and to enhance
cell death (Johnston, 2010; Zilli et al, 2009; Dixon, 2014). PI3K pathway inhibitors increases pro-
apoptotic effects of tamoxifen and fulvestrant in cell lines expressing high levels of AKT and ER/PI3KCA
mutant models (Becerra et al, 2013; Ma, 2015; Bosch et al, 2015). Everolimus suggests benefit in
metastatic ER+ patients after tamoxifen resistance when combined with fulvestrant (Dixon, 2014;
Massarweh et al, 2014; Ciruelos et al, 2014; Ma, 2015; Hortobagyi et al, 2015). Blockade of AKT
signaling pathway through the use of an AKT antagonist (AZD5363) in together with fulvestrant,
influenced estrogen receptor function in vivo (Ribas et al, 2015; Fox et al, 2013).
It is very important to differentiate early on treatment patients who may be able to gain or lose benefit
from endocrine therapy in order to spare them from prolonged periods of ineffective and redundant
therapy and susceptibility to high risk side-effects (Dixon, 2014). Therefore, establishing molecular
response markers in breast cancer may help in identifying patients that are more susceptible to
treatment using endocrine therapy and subsequently understand which common or alternative pathways
are involved in the acquisition of resistance to it. This status establishment may give an appropriate
selection of specific targeting therapy panel by the time of relapse in order to overcome resistance
(Johnston, 2010; Zilli et al, 2009; Kok et al, 2009).
Throughout the latter years, different types of genetic screens allowed identification of candidate genes
related to resistance to endocrine therapy (Musgrove et al, 2009; Mendes-Pereira, A et al, 2012). As a
matter of example, PI3K-AKT pathway shows up as one of the main targets in endocrine resistant breast
cancer due to what was retrieved from bioinformatics studies, RNA interference (RNAi) screening and
Figure 1.3. Treatment algorithm for post-menopausal patients with hormone receptor positive (ER+) and HER2 negative (HER2-) breast cancer. Different stages of drug administration are depicted (1st, 2nd and 3rd line). CT - Chemotherapy, DFI - Disease-free survival, EE - Exemestane plus everolimus, FUL - Fulvestrant, RT - Radiotherapy, TAM –Tamoxifen. Short DFI – relapse occurs during adjuvant treatment or within first 12 months after its administration, Long DFI – relapse occurs after 12 months from the end of adjuvant hormonal therapy. (Adapted from Ciruelos et al, 2014)

7
integrative analysis of genomic and proteomic approaches (Musgrove et al, 2009; Stemke-Hale et al,
2009; Van Tine et al, 2011; Ma, 2015).
RNAi screening: Main features and background.
RNAi is an endogenous cellular process by which messenger RNAs (mRNAs) are targeted for
degradation by double-stranded RNAs (dsRNAs) of complementary sequence, first identified in
C.elegans and conserved among almost all the eukaryotic species. The general process involves
targeted transcript cleavage and degradation after a sequence-specific small interfering RNA (siRNA)
binding to the mRNA transcript, leading to gene silencing (Boutros et al, 2008; Mohr et al, 2014; Kassner,
2008; Falschlehner et al, 2010; Cheng & Qin, 2009; Mohr & Perrimon, 2012). With this approach, the
combination of genetic screens with phenotypic assays made possible to identify new genes or gene
networks that are involved in a wide variety of biological processes like signal transduction, cell viability
and drug resistance (Mohr et al, 2014; Mohr & Perrimon, 2012; Boutros et al, 2008).
Once entering the cells after transfection or after injection in animals, one of the strands of the RNA
duplex is incorporated into the multi-subunit ribonucleoprotein complex RNA-induced silencing complex
(RISC), directing it into the target mRNA, which after base pair (bp) complementarity (complete or not)
can be cleaved or degraded. This process occurs after the action of the enzyme Dicer, that is responsible
for generate the breakdown of the duplex and subsequent selection of the strand to be incorporated into
the RISC through an energetic stability criteria - Fig.1.4 (Perrimon et al, 2010; Mohr et al, 2010;
Falschlehner et al, 2010; Cheng & Qin, 2009; Morris & Rossi, 2006; Ameres et al, 2007; Paddison et al,
2004). In the case of a perfect complementarity, the mRNA target is cleaved and degraded rapidly,
whereas imperfect complementarity results in translational repression and mRNA destabilization
(Falschlehner et al, 2010; Morris & Rossi, 2006; Ameres et al, 2007).

8
siRNAs are small RNA duplexes constituted by 19 complementary bps and 2-nucleotide 3’ overhangs
and have a transient effect with special focus in actively dividing cells (Myagishi & Taira, 2002).
Conversely, shRNAs and shmiRNAs are a 50-70 bps single-stranded RNA transcripts that acquire a
stem loop structure after a folding process, allowing for controlled expression of small transcripts
capable of target the selected mRNA (Perrimon et al, 2010; Dyxhoorn et al, 2003). siRNAs can be
designed and show an effectiveness of >70% knockdown for about of 80% of the number of the designs
made (Kassner, 2008). However, the duration of the knockdown is limited to 5-7 days in most cell lines
and its peak is only between 2-5 days, representing a transient knockdown (Kassner, 2008; Dyxhoorn
et al, 2003). Therefore, vector-based RNAi methods are the method of excellence when long-term
knockdown of a gene product is required and/or hard to transfect cell lines are desired to be used for a
particular screening (Kassner, 2008; Cheng & Qin, 2009; Moffat & Sabatini, 2006). When using vector-
based RNAi, the most common types of RNAi in use are shRNAs which are incorporated as shRNA
libraries in order to perform genome-wide screenings. Lentiviral vectors are probably the best choice for
delivery and stably expression of shRNAs in target cells because they tend to integrate into the host
genome (Hu & Luo, 2012; Morris & Rossi, 2006). Lentivirus are usually produced through co-transfection
of packaging constructs and required accessory proteins encoding genes for lentiviral successful
integration into host cells, resulting in a packaged vector that can be harvested and used for subsequent
transfection into a wide range of target cells, including mammalian cells, being incorporated in primary
screens (Morris & Rossi, 2006; Moffat et al, 2006; Moffat & Sabatini, 2006; Guo et al, 2007).
RNAi libraries allowed an high-throughput screening (HTS) in gene silencing of important genes involved
in tumorigenesis and cancer features in cells and organisms (Mohr et al, 2014; Bernards et al, 2006;
Cheng & Qin, 2009; Falschlehner et al, 2010; Mohr et al, 2010). HTS facilitates large genome-scale
study of gene function in a wide variety of cell lines, tissues and organisms, including mammalian cells
Figure 1.4. RNAi tools and enzymatic processes involved in mRNA targeting and degradation. Silencing RNAs (siRNAs), small hairpin RNAs (shRNAs), long dsRNAs, and small-hairpin microRNAs (shmiRNAs) are represented (Adapted from Perrimon et al, 2010)

9
and the assay can be modified in order to address different question like combining RNAi and drug
treatment (Falschlehner et al, 2010; Mohr et al, 2010).
Pooled format: an approach using shRNA libraries in HTS
The purpose is to try that one single-cell contains one gene-specific RNAi reagent (Mohr et al, 2010;
Boettcher et al, 2010; Mohr & Perrimon, 2012; Kassner, 2008). For that reason, the aim is to target one
specific gene for knockdown in each clone, introducing a RNAi library into cells randomly by DNA
transfection or through viral transduction and subject them to a certain type of selective pressure (Mohr
et al, 2010; Kassner, 2008; Mohr & Perrimon, 2012; Boettcher & Hoheisel, 2010). After this introduction
through viral infection/transduction, a selection process can be performed in order to eliminate the
untransduced cells by using antibiotics (Kassner, 2008; Mohr et al, 2010; Bernards et al, 2006; Sims et
al, 2011). In order to predict the number of cells that are or are not carrying the shRNA library,
fluorescence-activated cell sorting (FACS), can be used to search for the population of cells that are
found to be transduced (Mohr et al, 2010; Sims et al, 2011; Kassner, 2008). The screening process is
accomplished through the transduction of the population of cells and respective treatment with a specific
drug – the study selective condition. In parallel, transduced untreated cells are grown for the same
period of time in order for comparison by the end of the screening process (Mohr et al, 2010; Bernards
et al, 2006; Sims et al, 2011). By the end of the screening process, cells are harvested from both
populations and genomic DNA containing integrated hairpins of shRNAs vectors is extracted. The
shRNA cassette contains the shRNA sequence with a unique randomized DNA sequence called the
barcode, representing a molecular tag which can afterwards be amplified and recovered through PCR
and analyzed through microarray hybridization or using Sanger sequencing and next-generation
sequencing (NGS) (Figure 1.5) (Brummelkamp et al, 2003; Sims et al, 2011; Moffat & Sabatini, 2006;
Bernards et al, 2006; Mohr et al, 2010; Hu & Luo, 2012; Cheng & Qin, 2009; Boettcher & Hoheisel,
2010; Boettcher et al, 2010; Kassner, 2008; Ward et al, 2013; Bassik et al, 2009). These barcodes are
encoded in the downstream region of the shRNA template sequences and present a specific sequence
already validated properly for each individual shRNA construct (Boettcher et al, 2010; Boettcher &
Hoheisel, 2010). The relative quantity of each shRNA construct in both populations of cells of the
different arms of the experiment can be compared in order to identify the genes that may be involved in
a response to the selective condition applied during the screening study (Sims et al, 2011; Cheng & Qin,
2009; Boettcher et al, 2010; Brummelkamp et al, 2003; Kassner, 2008; Cheng et al, 2009; Hu & Luo,
2012; Luo et al, 2008).

10
Negative selection HTS for cancer-related genes
Negative selection or drop-out screen assays are the most commonly and straightforward used
screening types, especially due to the fact of identifying the genetic vulnerabilities of cancer cells as well
as in identifying gene targets, which after being silenced will inhibit cancer growth, survival or other
malignant phenotypes and restore drug sensitivity, Fig.1.5 (Hu & Luo, 2012; Ward et al, 2013; Albukhari
et al, 2015; Ketela et al, 2011; Bernards et al, 2006; Brummelkamp et al, 2006). It is possible and has
been already done by several groups, the conduction of a pooled shRNA screening with cancer and
normal cell lines capable of identifying the genes essential in those different contexts (Luo et al, 2008;
Schlabach et al, 2008; Silva et al, 2008; Berns et al, 2004). In order to identify the loss of shRNA vectors
from a population, it needs to cause a phenotype capable of scoring for the relative depletion of cells
carrying the shRNA vector from the population (Bernards et al, 2006; Ngo et al, 2006; Kampmann et al,
2014). Cells that are rendered sensitive to drugs upon gene silencing will die, enter growth arrest or
decrease proliferation, resulting in a diminished representation of shRNAs in the treated cells compared
to the control population. Therefore, genes under these conditions are suitable and likely candidates to
drug development targets (Ward et al, 2013; Albukhari et al, 2015).
Figure 1.5. Workflow of a negative selection shRNA screening using NGS. Control/Untreated and Experimental/Treated cell pools are transduced with viral particles carrying shRNAs. After the end of the screening, genomic DNA is isolated from treated and untreated cells and subsequent barcode amplification is performed. NGS is achieved in barcodes from both untreated and treated cells in the beginning and in the end of the screening (Adapted from Ward et al, 2013)

11
Present study
In this work, it was aimed at mimetizing a gene silencing of endocrine resistance associated genes
capable of being subjected to regulation when fulvestrant treatment is applied to ER+ breast cancer
cells. By identifying genes important in the process of antiestrogen resistance it would be possible to
evaluate the expression of these same promising genes in clinical samples from ER+ patients who were
given antiestrogen treatments and assess whether the expression of the gene/protein is correlated with
clinical outcome of fulvestrant treatment.
Therefore we packaged shRNA libraries in lentivirus capable of transducing ER+ breast cancer cell lines
and subjected them to an RNAi screening using fulvestrant. Barcodes retrieved from extracted DNA of
the cells in the beginning and in the end of the screening were sequenced and the level of enrichment
or depletion of shRNAs in the different cells in both time points was evaluated. By identifying relevant
shRNAs it was possible to assign a number of important candidate genes that could be required for the
cells in the process of fulvestrant resistance/responsiveness. We were able to identify a limited number
of genes thought to be relevant in the process of fulvestrant resistance. For further evaluation were
selected:
- HSD17B10 gene which codes for a protein involved in the sex steroid metabolism and belongs to
the short-chain dehydrogenase/reductase superfamily 17β-hydroxysteroid dehydrogenase where
some of the members have been associated and implied as prognostic biomarkers in breast cancer
showing high expression levels in ER+ breast cancer cell lines (Yang et al, 2005; Day et al, 2008;
Jansson et al, 2006).
- HSPE1/HSP10 gene codes for a heat shock protein which functions as a chaperonin and has been
suggested to be involved in immunomodulation and tumor progression (Rappa et al, 2014).

12

13
MATERIALS AND METHODS
Cell lines used in the study:
- 293T - Human Embryonic Kidney (HEK) cells
- MCF-7/S0.5 - ER+ subline of MCF-7
- MCF-7/LCC: MCF-7/LCC1 (LCC1) and MCF-7/LCC9 (LCC9) - ER+ cell lines derived from MCF-7/S0,5
- Fulvestrant resistant (FR) cell lines: MCF-7/164R-1 (FR1), MCF-7/182R-6 (FR2), MCF7/164R-4 (FR3)
and MCF-7/182R-1 (FR4) – ER+ cell lines derived from MCF-7/S0,5 cell lines
- T47-D: AL2770 (S5), AL3354 (R1) and AL3369 (R2)
- ZR75: 1 and 1R
293T growth medium
Dubelcco’s Modified Eagle Medium (DMEM; Sigma-Aldrich) supplemented with 10% Fetal Bovine
Serum (FBS; Sigma-Aldrich) and 1% Penicilin/Streptomycin (Pen/Strep; Sigma-Aldrich) - optional.
LCC1 and LCC9 cell lines growth medium
Phenol red-free Dubelcco’s Modified Eagle Medium and HAM’s F-12 nutrient mixture (DMEM-F12,
(Gibco, Invitrogen™) supplemented with 5% stripped charcoal FBS (DCC; Gibco, Invitrogen™) and 1%
Pen/Strep (Sigma-Aldrich) – optional.
Cell lines culturing
293T cell line
Human Embryonic Kidney (HEK) or 293T cells from American Type Culture Collection (ATCC) were
thawed from the cryopreservation vial in 293T growth medium and grown at 37°C and 5% CO2 until they
became 80-90% confluent. After they reach this confluence media was removed, cells were washed
with Dubelcco’s Phosphate Buffer Saline (PBS; Sigma-Aldrich) 1X and detached using trypsin (Sigma-
Aldrich) 1X being incubated for 5-10 minutes at 37° C in humidified air with 5% CO2. Media was changed
every second day.
MCF-7/0,5 and fulvestrant resistant (FRs) cell lines
MCF-7 was originally obtained from the Human Cell Culture Bank, Mason Research Institute (Rockville,
MD, USA) and adapted to grow in DMEM-F12 (1:1) supplemented with 1% Fetal Calf Serum (FCS;
Gibco BRL), Glutamax 2,5 mM and 6 ng/mL insulin (Novo Nordisk) as reported by Briand & Lykkesfeldt
1984 and Lykkesfeldt et al, 1994. MCF-7/S0,5, a subline of the original MCF-7 cell line has been adapted
to grow at low serum concentration as described by Briand & Lykkesfeldt, 1984. The antiestrogen-
resistant cell lines MCF-7/164R-1, MCF-7/182R-6, MCF7/164R-4 and MCF-7/182R-1 have been
established according to Lykkesfeldt et al, 1995 from MCF-7/S0,5 cell line by long-term selection with
10-7 M ICI 164,384 and ICI 182,780 (fulvestrant; AstraZeneca®). MCF-7/S0,5 cells were routinely
propagated in DMEM-F12 (Gibco, Invitrogen™) supplemented with 2 mM Glutamax (Gibco,
Invitrogen™), 1% heat inactivated FBS (Sigma-Aldrich) and 6 ng/mL insulin (Sigma-Aldrich).

14
Fulvestrant-resistant cell lines were maintained in the same growth medium as MCF-7/S0,5
supplemented with 10-7 M fulvestrant (Tocris, BioScience). Growth medium was changed every second
or third day. In order to sub-culture so that they reach 80-90% confluence, media was removed, cells
were washed with PBS 1X and detached using trypsin 1X being incubated for 5-10 minutes at 37° C in
humidified air with 5% CO2.
LCC1 and LCC9 cell lines
The human breast cancer cell lines MCF-7/LCC1 and MCF-7/LCC9 cell lines were generated in Nils
Brunner’s laboratory at the University of Copenhagen, Denmark, MCF-7/LCC1 cell, a hormone-
independent but hormone-responsive cell line was generated according to Brunner et al, 1993. MCF-
7/LCC9 cells were established through a stepwise in vitro selection process of MCF-7/LCC1 cells
against increasing concentrations of ICI 182,780 as described in Brunner et al 1997. All cell lines were
maintained in phenol red-free DMEM-F12 supplemented with 5% charcoal-stripped FBS and 1%
Pen/Strep (LCC growth medium; de Cremoux et al, 2003). In order to sub-culture so that they reach 80-
90% confluence media was removed, cells were washed with PBS 1X and detached using trypsin 1X
being incubated for 5-10 minutes at 37° C in humidified air with 5% CO2.
T47-D cell lines
The human ER+ breast cancer T47-D cell line was obtained thanks to Anne Lykkesfeldt from Breast
Cancer Group, Danish Cancer Research Center, Copenhagen, Denmark. T47-D cells were originally
obtained from Human Cell Culture Bank (Mason Research Center, Rockville, MD, USA) and maintained
in Roswell Park Memoriam Institute (RPMI) 1640 medium without phenol red (Gibco, Invitrogen™)
supplemented with 5% FBS (Thermo Fisher Scientific), 2 mM glutamax (Gibco, Invitrogen™) and
8µg/mL insulin (Sigma-Aldrich). The fulvestrant-resistant cell lines T47-D/182R-1 (182R-1) and T47-
D/182R-2 (182R-2) were established by long-term exposure to 100 nM fulvestrant and maintained in the
same growth medium as parental T47-D cell lines plus 100 nM fulvestrant (Tocris, BioScience;
Kirkegaard et al, 2014). Both sensitive (S5 – AL2770) and resistant (R1 – AL3354 and R2 – AL3369)
cell lines were cultured in RPMI 1640 without phenol red (Gibco, Invitrogen™) supplemented with 5%
heat-inactivated fetal bovine serum (Hi-FBS; Gibco, Invitrogen™), 1% glutamax (Gibco, Invitrogen™)
and 8µg/mL insulin (Sigma-Aldrich). Both cell lines were cultured both without and/or with fulvestrant
(Tocris, BioScience) in a concentration of 10-7 M. Growth medium was changed every second or third
day. In order to sub-culture so that they reach 80-90% confluence media was removed, cells were
washed with PBS 1X and detached using trypsin 1X being incubated for 5-10 minutes at 37° C in
humidified air with 5% CO2.
ZR75 cell lines
The human ER+ breast cancer ZR75 cell line were kindly provided by Todd Miller from departments of
Pharmacology & Toxicology and Comprehensive Breast Program, Norris Cotton Cancer Center, Geisel
School of Medicine at Dartmouth, Lebanon, NH. ZR75 parental cell lines were originally obtained from
ATCC and cultured in DMEM/10% FBS (Hyclone) and passaged for less than 3 months before analysis.

15
ZR75-1/ fulvestrant-resistant (ZR75-1/FR) were generated by culturing ZR75-1 cells with 1 µM
fulvestrant for 4 months (Tocris, Bioscience) (Yang et al, 2016). Both sensitive (ZR75-1) and resistant
(ZR75-1R) cell lines were cultured in RPMI 1640 without phenol red (Gibco, Invitrogen™) supplemented
with 10% FBS (Gibco, Invitrogen™). Both cell lines were cultured both without and/or with fulvestrant
(Tocris, BioScience) in a concentration of 10-7 M. Growth medium was changed every second or third
day. In order to sub-culture so that they reach 80-90% confluence media was removed, cells were
washed with PBS 1X and detached using trypsin 1X being incubated for 5-10 minutes at 37° C in
humidified air with 5% CO2.
Lentivirus packaging in 293T cell line
The protocol was followed based on Cellecta manual, ABM lentivirus packaging protocol and Addgene
lentivirus packaging protocols and safety data measures for GMO class II working with lentivirus were
respected. These protocols detail the approach when packaging lentivirus.
293 cells were seeded (13,5x10⁶ cells in T175 flask) in 30 mL of 293T growth media without Pen/Strep
in T175 flasks until 80-90% confluence. For each T175 flask a transfection complex was prepared using
two solutions: Solution A - 6 µL of DNA plasmids (1µg/µL; Cellecta) and 60 µL Packaging Mix (0,5
ug/uL; Cellecta) containing psPAX (Addgene) and pMD2.G (Addgene) were added in 2,25 mL DMEM
(Sigma-Aldrich) and Solution B with 195 µL Lentifectin™ reagent (Applied Biological Materials) in 2,25
mL DMEM. Both solutions were incubated at room temperature for 5 minutes, mixed and incubated for
20 minutes. DMEM was added to the transfection complex and the mixture subsequently added to the
cells. 1,5 mL of FBS (Sigma-Aldrich) was added to all T175 flasks 4-8h later. DNase treatment was
performed 18 hours later by adding DMEM medium containing 5 mM of MgCl2 (Sigma-Aldrich) and 20
mM of HEPES (Sigma-Aldrich) pH 7,4 and 1U/mL DNAse I (Thermo Fisher Scientific). Supernatant was
harvested 24h and 48h after, centrifuged at 512x g for 10 min and filtered through a 0,45 µm sterile low-
protein binding filter. For both harvesting days, Lenti-X concentrator protocol (Takara-Clontech)
instructions were followed and safety data measures were respected. Lentivirus were harvested and
concentrated 100 times by using 480 µL of DMEM giving about 4 mL of virus harvested for each
concentrating/harvesting step. Lentivirus were aliquoted and stored at -80°C. Lentivirus concentration
was assessed through the use of Clontech test strips (Takara-Clontech) following the protocol
instructions.
Puromycin titration in LCC1 and LCC9 cell lines
Puromycin titration was performed for LCC1 and LCC9 similarly to what is described in TRC Lentiviral™
shRNA Technical manual (Dharmacon, GE Healthcare). 1x10⁵ cells/mL were seeded in 24-well plate
and puromycin (Life Technologies, Thermo Fisher Scientific) was added at the following concentrations:
0,2; 0,4; 0,6; 0,8; 1 and 1,2 µg/mL. Cells were then incubated at 37oC in 5% CO2 in humidified air. The
number of viable cells was determined 48h later using the Crystal violet-based colorimetric assay. In
order to perform this assay, media was removed from cells, which were gently washed in PBS and fixed
by adding 300 µL of crystal violet solution 5 mg/mL crystal violet (Sigma-Aldrich), 25% (v/v) methanol

16
(Sigma-Aldrich), H20) to each well. After 10 minutes of incubation, crystal violet was removed, followed
by 3 times washing with H20. Plates were left to dry at least 24h.
Viral titer estimation in LCC1 and LCC9 cell lines
LCC1 and LCC9 cells were seeded in a 12-well plate at a concentration of 1x10⁵ cells/mL and incubated
overnight. After 24h, cells were transduced with various amounts of lentiviral particles of the shRNA
libraries and of the empty vector (negative control) ranging between 0-100 µL (0, 8, 24, 36, 48, 60 and
100 µL) in LCC media containing 5 µg/mL polybrene (Sigma-Aldrich). Media without polybrene was
changed in the next day and cells were harvested 48h later with 0,5% formaldehyde (Sigma-Aldrich) in
PBS and collected in tubes kept on ice and protected from light. Fluorescence-Activated Cell Sorting
(FACS) was performed in a Becton Dickinson LSR II Flow Cytometer (BD Biosciences, USA ) in order
to evaluate the proportion of cells transduced by lentiviral particles through the measurement of Red
Fluorescent Protein (RFP) intensity (Evrogen-TagRFP specifications - Appendix I) encoded in the viral
genome recently integrated in LCC1 and LCC9. Data was analyzed using FlowJo (FlowJo LLC, USA)
and Flowlogic (Iniviai Technologies, USA) commercial softwares.
shRNA genome-wide screening in LCC1 and LCC9 cell lines
In order to perform the genome-wide functional screening, DECIPHER Human module 1, 2 and 3 pooled
lentiviral shRNA libraries (Cellecta) were used. Each shRNA libraries with a complexity of 27K shRNAs
cover about 5000 human mRNAs. Cells were transduced with lentiviral particles representing Modules
1, 2 and 3 separately as detailed in Cellecta manual. For the transduction, 14x106 cells (LCC1 and
LCC9) were seeded in T175 flasks in medium and 5 µg/ml Polybrene (Sigma-Aldrich) and enough viral
particles were added in order to achieve 40% transduction - Mutiplicity of Infection (MOI) of 0.5. A day
after transduction media was replaced with fresh medium without polybrene and 72h later post-
transduction cells were selected with 0,8 µg/ml puromycin (Life Technologies, Thermo Fisher Scientific)
during 48h. Baseline samples (day0) were harvested at 300x g for 15 min in PBS and pellet was stored
at -80° C. For the negative selection screening, cells were then treated with 10-7 M fulvestrant (Tocris,
BioScience) (+fulv) while controls (Nofulv) were kept in normal medium for 3 weeks. By the end of the
screening, cells were harvested at 300x g for 15 min in 1X PBS and pellets were stored at -80° C.
DNA extraction and purification
Genomic DNA was extracted from harvested pellet cells as described in Cellecta manual. DNA was
sheared by 30 sec at intensity 1 using an ultrasonic homogenizer in a Branson 150/150D sonifier
(Branson, USA). Extracted genomic DNA was evaluated in terms of concentration and purity in a ND-
100 Spectrophotometer (Thermo Fisher Scientific).

17
PCR barcode amplification and evaluation
For the amplification of shRNA-specific barcodes from genomic DNA, Cellecta manual guidelines were
followed. 200 µg of genomic DNA were used in 1st PCR round of amplification. In 2nd round repeat of
PCR amplification, 14 cycles and 10 and 15 µL of DNA were used for baseline (day0), untreated (Nofulv)
and treated (+fulv) samples when using the indexing primers (sequences in table 1 - appendix II).
Analysis of PCR products was performed after running a gel-electrophoresis on a 1X TAE gel 3,5%
agarose (Invitrogen™) with GelRed (Biotium) after both 2nd rounds of PCR amplification. PCR products
were mixed with 5X loading dye (Fermentas, Thermo Fisher Scientific) prior to loading and marker 1kb
Plus DNA Ladder (Invitrogen™) was also included in the gel. The electrophoresis ran at 100V for 40
min and gel was revealed in a Fusion-Fx7-7026 WL/26MX equipment (Vilbaer Lourmat, Germany)
equipment through UV-light exposure.
PCR product purification
The PCR products of each sample were combined in order to perform purification after gel
electrophoresis analysis. All different samples were purified using different methods in order to evaluate
the methods of choice before sequencing. For PCR purification of samples Qiaquick purification kit
(Qiagen) was used according with manufacturer’s instructions as well as Clean-up kit Dynamag kit
(Invitrogen™). For PCR product purification from the gel, Qiaquick gel extraction kit (Qiagen) was used
according with manufacturer’s instructions. PCR products were evaluated in terms of concentration and
purity in a ND-100 Spectrophotometer (Thermo Fisher Scientific) and using a Quant-iT™ Picogreen
dsDNA Reagent and Kits (Life Technologies, Thermo Fisher Scientific).
DNA quantification for next-generation sequencing (NGS) using Picogreen assay
Quant-iT™ Picogreen dsDNA Reagent and Kits (Life Technologies, Termo Fisher Scientific) was used
according with manufacturer´s instructions. A high-range standard curve was used and the volumes
were scaled down 10x. A total volume of 300 uL was loaded for all standard and test samples in a 96-
well microplate reader (Nunc). Picogreen absorbance was measured in a Victor Wallac 1420 equipment
(Perkin Elmer) using an excitation wavelength of 485 nm and an emission wavelength of 535 nm and a
measurement time of 0,1 s.
NGS Sequencing of shRNA-specific barcodes
HT Sequencing of pooled shRNA-specific barcodes was performed on an Illumina HiSeq platform using
the respective indexing primers (Appendix II – Table 1). Sequencing was done in collaboration with
Associate Professor Mads Thomassen, Department of Genetics, Odense University Hospital, Odense,
Denmark.
All samples measured through Picogreen assay ranging in a concentration between 15 and 60 ng/µL
were re-measured through quantitative PCR (qPCR) in order to confirm their values and evaluate
sample clustering. All the samples were pooled and ran together in an Illumina Single-Read (SR) Flow
cell.

18
Selection of candidate genes
Correspondent genes to depleted shRNAs identified from the sequencing data of the different shRNA
library screenings were selected based on a reliable criteria. For shRNA library 1 and 2 screenings,
genes presenting 2 or more shRNAs with a fold-change higher than 4, a minimum of 400 read counts
for baseline (day0) samples and consistency (all with less shRNA read counts in treated (+fulv) samples
compared to day0) were selected for further Ingenuity Pathway Analysis (IPA).
Due to the existence of replicates for treated (+fulv), untreated (nofulv) and baseline (day0) samples in
shRNA library 3 screening sequencing data, a fold-change higher than 2 was adopted between +fulv
and day0 and a minimum of 400 read counts in the baseline samples. All genes showing only depletion
of shRNAs in these conditions were intersected with genes with a fold-change higher than 1,5 between
nofulv and day0 with 400 minimum read counts. Genes not common upon this intersection were
considered and compared with +fulv and nofulv list of genes. All genes showing consistency - less
shRNAs read counts in treated (+fulv) than in day0 or than in untreated (nofulv) – were considered as
candidates and chosen for further IPA.
Ingenuity Pathway Analysis
Ingenuity Pathway Analysis (IPA) (Qiagen) was used to evaluate whether candidate genes selected
from the sequence data were part of functionally related integrated biological networks. Candidate genes
were therefore uploaded to IPA and networks relating genes with pathways were established. Molecules
with highest fold-change were associated with networks which were ranked based on probability scoring
using p-values.
RNA extraction
RNA extraction was performed following the TRIzol® Reagent (Ambion, Life Technologies, Thermo
Fisher Scientific) protocol guidelines. 6,8x10⁶ cells (LCC, MCF-7 and FRs) were harvested from T75
flask and 1 mL of Isol-Lysis Reagent (Invitrogen™) was added.
DNAse treatment was performed using DNAse I (Thermo Fisher Scientific) according to DNase I-RNase
free protocol guidelines (Ambion, Life Technologies, Thermo Fisher Scientific) as well as DNAse I
inactivation through heat using EDTA. RNA samples were evaluated in terms of concentration and purity
using a Nanodrop ND-100 spectrophotometer (Thermo Fisher Scientific). The samples were stored at -
80°C.
cDNA synthesis
cDNA synthesis was performed for extracted RNA samples in duplicates. 0,5 µg of RNA extracted was
added to 10 mM dNTP mix (Termo Fisher Scientific), Random Hexamer Primer 30 ng/µL (Termo Fisher
Scientific) and diethylpyrocarbonate (DEPC) water until reach a final volume of 14,5 µL for each
replicate.
A first extension cycle of 5 min at 65°C followed by 1 min of 4°C was performed and the samples were
added to a volume of 5,5 µL mastermix containing: 5x RT Buffer (Termo Fisher Scientific) RiboLock

19
(40U/µL; Termo Fisher Scientific) and RevertAid Premium Reverse Transcriptase (200 U/µL; Termo
Fisher Scientific) - Reverse Transcriptase (RT) positive sample - or dH20 – RT negative sample. A PCR
program was used: 10 min at 25°C, 30 min at 50 °C and 5 min at 85°C (inactivation step). The newly
synthesized cDNA was stored at -20° C.
Quantitative reverse transcription PCR (RT-qPCR)
Real-time or quantitative Reverse Transcription Polymerase Chain Reaction (RT-qPCR) has been
accomplished for all genes selected from IPA. This list included HSD17B10, HSPE1, MBP and PSMB2
genes. In order to carry out qPCR, Quanti-Tech specific primers were used for the different mentioned
genes: HSD17B10 (#QT00031444); HSPE1 (#QT00000777); MBP (#QT00073528); PSMB2
(#QT00082999) and PUM1 (#QT00029421). PUM1 was used as reference gene. A mastermix of
Quanti-Tech Primers (Qiagen), bi-distilled water, Power SyBr® green (Qiagen) and cDNA from RT+ and
RT- samples diluted 1:10 in water was added to each well of a MicroAmp Fast 96 well reaction plate
(Applied Biosystems®) in triplicates. Non-template control wells were designed using RNase-free water
instead of cDNA. MicroAmp Fast 96 well reaction plate was covered with a MicroAmp optical adhesive
film (Applied Biosystems®) briefly centrifuged at 1000 RPM for 1 min in a 5310 R centrifuge (Eppendorf)
and read in a StepOne™ Real-Time PCR System (Applied Biosystems®) during 2h50 min using the
following program: 1 cycle: 10 min at 95°C; 40 cycles: 15 sec at 95°C + 1 min at 60°C; 15 sec at 95°C
+ 1 min at 60°C + 15 sec at 95°C. The RNA expression was calculated by using the comparative
threshold (ct) method (Livak et al, 2001).
Protein extraction
Protein was extracted from all cell lines using a Radioimmunoprecipitation assay (RIPA) buffer (10 mM
Tris-HCl pH 8, 5 mM Na2EDTA, pH 8, 1% NP-40, 0,5% sodium dioxycholate, 0,1% Sodium Dodecyl
Sulphate (SDS) containing Complete Mini, Protease Inhibitor Cocktail tablets (1 tablet/10 mL; Roche).
LCC, MCF-7/FRs, T47-D, ZR75 cells in T75 flasks were rinsed and washed with cold PBS and collected
using a cold cell-scrapper for a pre-cooled tube. The suspension of cells was then centrifuged for 5 min
at 300xg, 4°C. Afterwards, cells’ pellet was lysed using ice-cold RIPA buffer on ice for 10 min through
persistent pipetting and subsequently centrifuged for 15 min at 12000x g, 4°C. The supernatant was
transferred for a pre-cooled eppendorf and stored at -20 °C.
Protein quantification (BCA assay)
Protein concentration was evaluated by carrying out bicichoninic acid (BCA) assay. Pierce™ BCA assay
kit (Thermo Fisher Scientific) guidelines for a microplate procedure were followed in a working range
between 20-2000 µg/mL (Appendix III – Figure 2). Triplicates were used for the standard curve using
Bovine Albumin Serum (BSA) protein (Thermo Fisher Scientific) and duplicates were used for the lysates
of the protein samples. The 96-well microplate reader (Nunc) was read on a Victor Wallac 1420 (Perkin
Elmer) equipment at 560 nm during 0,1 s. Protein samples were afterwards aliquoted in several tubes

20
being stored at -80°C and -20°C. Protein concentration of the lysate samples was calculated based on
several standard curves (Appendix IV – Figures 3-7)
SDS-page
SDS-PAGE gel has been used aiming to separate the protein bands of the protein extracts from all
different cell lines in study. 5-10 µg of protein lysate was mixed with 1,5 – Dithiothreitol in water (DTT)
0,6M (Sigma-Aldrich); RunBlue LDS Sample Buffer 4X (Expedeon) and/or Laemmli Sample buffer 4X
(BioRad) and heated to 99°C. 1,4 M Iodoacetamide (IAA) in sodium acetate (Sigma-Aldrich) was also
heated to 99°C for 5 min and added to the mixture for the expedeon gel-electrophoresis. The mixture
was loaded in 4-20% pre-cast SDS-PAGE gels; in a 12-well or 17-well (Expedeon) and 15-well (Biorad)
together with protein marker PageRuler™ 250 kDa Prestained Protein Ladder (Thermo Fisher Scientific)
– Expedeon – and with Precision Plus Protein™ Dual Color Standards, 500 μl #1610374 (BioRad). The
gel ran at 200V, 90 mA, between 45-55 min in a gel chamber filled with SDS Running buffer (Expedeon)
and for 30 min in a gel chamber filled with SDS Laemli Running Buffer (BioRad).
Western-blotting
In order to evaluate protein expression of candidate genes, Western-blotting was performed according
to abcam® protocol guidelines for LCC, MCF-7/FRs, T47-D and ZR75 cell lines. Positively charged
nylon Polivinylidene fluoride (PVDF) membrane (GE Healthcare) was activated through the use of: 96%
ethanol (15 s), 2 min in ELGA water and 10 min in transfer buffer (48 mM Tris base, 39 mM Glycine,
and 0,037 % v/v SDS, 20% EtOH in ddH20). After activation, a semi-dry blotting system was assembled
containing pre-wetted pieces of Whatman paper (GE Healthcare) in transfer buffer and ran at 300V, 58
mA for 1h30 min using Expedeon system and 300V, 10 min for Trans-blot turbo system. Blocking of the
membrane was performed using non-fat milk (Sigma-Aldrich) 5% solution (10g dry milk in 200 mL of
TBST 0,1%). TBST 0,1% buffer - 1X Tris Buffer Saline (TBS; 20X TBS: 24,23 g Trizma HCl, 80,06 g
NaCl, 800 mL ELGA water, pH 7,6 and Tween20 (Sigma-Aldrich). The incubation was performed at
room temperature for 1 hour. After membrane blocking, incubation with primary antibody in blocking
agent was achieved using both dilution working ranges: 1:250 and 1:500 for rabbit polyclonal anti-human
HSD17B10 antibody (#HPA001432; Sigma-Aldrich) and 1:250 and 1:100 for rabbit polyclonal anti-
human HSPE1 antibody (#HPA038755; Sigma-Aldrich). The membrane was incubated overnight at 4°C
with agitation, washed afterwards (3 times, 15 min) and incubation with secondary antibody – goat
polyclonal anti-rabbit HRP (#P0448; Dako Cytomation) – was performed using a 1:5000 dilution in a
non-fat milk 1% solution. After washing steps (3 times, 15 min), the detection step was performed
recurring to Pierce™ enhanced chemiluminescence (ECL) Western Blotting substrate (GE Healthcare)
reagents using it in a 1:1 reaction and applying it to the previously briefly dried PVDF membrane. After
5 min incubation period, the membrane was exposed to chemiluminescent Epi-White light in a Fusion-
Fx7-7026 WL/26MX equipment (Vilbaer Lourmat, Germany) as well as to a CL-Xposure light sensitive

21
film (Thermo Fisher Scientific) and developed on an Optimax 2010 (Protec) in a dark room. The time
used for the X-ray film was way shorter than the one identified for the chemiluminescence camera. Beta-
actin antibody (#ab6276, Abcam) was used as a loading control in a 1:15000 dilution and the
correspondent goat polyclonal anti-mouse HRP (#P0447 – Dako Cytomation) secondary antibody in a
1:5000 dilution.
Densitometry measurements of western-blot bands were performed using ImageJ software (Research
Services Branch, National Insitute of Mental Health, USA) and further comparison of integrated density
values between proteins in study (HSD17B10 and HSPE1) and the reference protein β-actin across the
different cell lines was accomplished.

22

23
RESULTS
Determination of virus titre to ensure sufficient shRNA representation in LCC cell lines
To ensure reliable and reproducible results when using pooled shRNA libraries, it is critical to infect
enough cells and maintain sufficient representation of each shRNA construct (integrant) in the cells. A
virus titration was performed using the shRNA libraries before the actual functional screening. A
multiplicity of infection (MOI) of 0.5 was indicated to allow a single integrant per cell in the majority of
the cells (Figure 8 – Appendix V). This will reduce the possibility of transduction of cells with multiple
shRNAs, improving on-targeting effects of the shRNAs against the mRNAs present in the cell milieu
(Sigoillot & King, 2011; Mohr et al, 2014). To identify the amount of viral particles used in the transfection
of cells, cells were transduced with different viral suspension representing the 3 shRNA libraries. The
proportion of cells transfected were subsequently determined by FACS analysis. Figures 3.1, 3.2, 3.3
and 3.4 demonstrate the percentage of transduction efficiency achieved when using different lentiviral
amounts to infect both LCC1 and LCC9 cells with the 3 shRNA libraries.
Figure 3.1. Percentage of LCC9 cells transduced upon transduction with lentiviral particles carrying shRNA library module 1. Different viral amounts were used and percentage of transduced efficiency was established based on RFP+ cell number. Each bar represents the median value between replicates. Error bars are identified as standard deviation value between both replicates of each viral amount used.
Figure 3.2. Percentage of LCC9 cells transduced upon transduction with lentiviral particles carrying shRNA library module 2. Different viral amounts were used and percentage of transduced efficiency was established based on RFP+ cell number. Each bar represents the median value between replicates. Error bars are identified as standard deviation value between both replicates of each viral amount used.

24
Analysis of the figure 3 above indicate it is possible to achieve 40% transduction efficiency (MOI 0.5) for
LCC1 and LCC9 cell lines when using 100 µL of lentivirus with all the different libraries. By scaling-up
the volumes and using the titer formula in Figure 8 – Appendix V it is possible to obtain the required
amount of lentiviral stock aimed to transduce 40% of cells in the screening experiments.
Barcode amplification of shRNA inserts in screen cell populations
After genomic DNA extraction, barcode recovery was performed using PCR. In all screen cell population
samples, primers complementary to a constant sequence in the shRNA constructs were designed in
order to amplify the individual shRNA sequence specific (barcode). Figure 3.5 illustrates PCR
amplification of the barcode of each shRNA sequence from the screen cell populations. By analyzing
Fig.3.5 it is possible to verify the presence of a clear bright band around 100 bps. This band represents
the HTS3-cassette that contains the shRNA insert (106 bps; Figure 9 - Appendix VI) capable of integrate
in the host genome of the transduced LCC1 and LCC9 cell lines after viral infection.
Figure 3.3. Percentage of LCC9 cells transduced upon transduction with lentiviral particles carrying shRNA library module 3. Different viral amounts were used and percentage of transduced efficiency was established based on RFP+ cell number. Each bar represents the median value between replicates. Error bars are identified as standard deviation value between both replicates of each viral amount used.
Figure 3.4. Percentage of LCC1 cells transduced upon transduction with lentiviral particles carrying shRNA library module 3. Different viral amounts were used and percentage of transduced efficiency was established based on RFP+ cell number. Each bar represents the median value between replicates. Error bars are identified as standard deviation value between both replicates of each viral amount used.

25
Purified barcode from the different screen cell populations was subsequently subjected to sequencing.
Sequencing of barcode sequences led to identification of several candidate genes in different
shRNA library screenings
Sequencing data originating from the Illumina HiSeq platform was displayed in terms of read counts
referent to the different screen cell population samples. To analyze the sequencing data, a set of criteria
was applied to ensure consistency when comparing treated, untreated and baseline samples read
counts. This led to the identification of a panel of potentially reliable shRNAs directed against specific
mRNAs and consequently the identification of potential candidate genes involved in resistance and/or
susceptibility of mammalian cells to fulvestrant exposure.
Table 3.1 represents the 206 candidate genes identified following the identification of correspondent
depleted shRNAs upon selection criteria appliance in fulvestrant-resistant breast cancer cell lines
among the different shRNA library screening modules. A depletion of 82 shRNAs targeting 31 human
genes were obtained following functional screening of shRNA represented in human module 1 shRNA
library (Table 3.1a). Functional screening using the module 3 shRNA library resulted in the identification
of 233 shRNAs specific to 74 genes (Table 3.1b). Screening using module 2 shRNA library resulted in
the depletion of 258 shRNAs targeting 101 genes (Table 3.1c).
Figure 3.5. Barcode PCR amplification of genomic DNA from shRNA libraries screening cell populations in agarose gel-electrophoresis. A bright band around 100 bps is visible and represents the shRNA insert (106 bps) present in HTS3 cassette of pRSI9-U6-(sh)-HTS3-UbiC-TagRFP-2A-Puro-dW (Fig.9 - appendix VI) plasmid used as construct for lentiviral packaging of the shRNA library module 1 (a) and shRNA library 2 and 3 (b). In a) day0 (1st well) and +Fulv (2nd well) samples are represented. In b) day0 (1st well) and +Fulv (2nd well) from shRNA library module 2 and replicates from shRNA library module 3: day0 (4th and 8th well), Nofulv (5th and 9th well) and +Fulv (6th and 10th well) are also represented. DNA 1 kb plus ladder (MK) is represented in both gels in the last lane.
Day0 Day0 Day0 Day0 +Fulv +Fulv +Fulv +Fulv
No
Fulv No
Fulv MK MK 1 2 3 1 2 5 4 6 7 8 9 10
a) b)
100 bps
200 bps
100 bps
200 bps

26
Table 3.1 Table showing the list of genes whose corresponding shRNAs showed marked depletion
following fulvestrant treatment in module 1 shRNA library transduced LCC9 cell lines (a), in module 3
shRNA library transduced LCC9 cell lines (b) and in module 2 shRNA library transduced LCC9 cell lines
(c). The numbers show median fold-change in shRNA abundance.
GENE
SYMBOL
FOLD-
CHANG
E
GENE
SYMBOL
FOLD-
CHANG
E
GENE
SYMBOL
FOLD-
CHANG
E
GENE
SYMBOL
FOLD-
CHAN
GE
ADA -4,78 ANKS3 -3,58 ISX -2,06 RPS21 -7,07
AKT1 -7,30 ARID1A -2,11 KCTD10 -4,55 RPS25 -3,95
ANAPC10 -5,44 ATP6V0E2 -2,60 KDM2B -3,43 SCUBE3 -2,25
CA5A -7,47 BAT1 -2,75 KIF11 -2,83 SF3B5 -5,30
CDK5RAP
1 -8,56 C17ORF48 -2,88 LOC642393 -3,99 SLTM -4,44
CPSF2 -4,86 C17ORF81 -2,95 LRRC56 -2,71 SUPV3L1 -3,01
CYC1 -6,32 C2ORF40 -2,36 LSM6 -6,54 THOC3 -4,20
DDB1 -7,61 C9ORF119 -2,09 MAGEA8 -2,28 TWSG1 -5,10
DDOST 5,55 CCDC88B -7,86 MDFIC -2,74 USP31 -5,53
EIF2S2 -9,00 CDKAL1 -4,04 MEA1 -4,53 VPS33A -2,47
EIF4G2 -7,87 CEP192 -3,63 MGC57359 -2,85 ZNF184 -2,48
FAU -6,97 CEP68 -3,07 MRPL51 -2,81 ZNF500 -2,79
FCGR3B -4,44 CLIC3 -4,58 NOP2 -7,32 ZNF540 -3,71
FDPS -6,51 CNOT2 -5,03 NUP93 -2,62 ZNF566 -3,01
HSD17B10 -6,41 COPB1 -10,48 OR6C3 -2,71 ZNF609 -2,17
HSPE1 -10,37 COP54 -2,68 PCAF -2,18 ZNF684 -2,30
MBP -5,15 CRTC2 -2,12 PCGF5 -2,62 ZNF700 -2,60
NAE1 -5,63 CTNNBL1 -4,18 RASSF9 -2,51
NDUFA10 -5,23 CYS1 -4,03 RCOR1 -3,11
PALB2 -5,24 DDX21 -3,65 RFTN2 -7,11
PIK3R2 -5,06 DGCR6 -3,37 RP11-529I10.4 -7,23
PPARBP -7,36 DNTTIP2 -2,4 RPH3A -3,86
PPP2R1A -5,18 DOHH -2,97 RPL10A -18,04
PRPF40A -10,49 EFTUD1 -2,36 RPL17 -6,71
PSMB2 -13,50 EXOC6B -3,02 RPL23 -8,76
RRHEB -8,24 EXOSC5 -3,41 RPL3 -7,04
RRM2B -5,37 FAM104B -3,63 RPL36 -3,41
SNRPA1 -9,42 FLVCR1 -6,09 RPL7 -7,15
TERF2IP -7,82 GAGE4 -5,55 RPP38 -6,90
THBS2 -5,62 GLB1L -2,60 RPS16 -3,19
UBE2G1 -4,82 GRPEL1 -3,01 RPS18 -5,44
a) b)
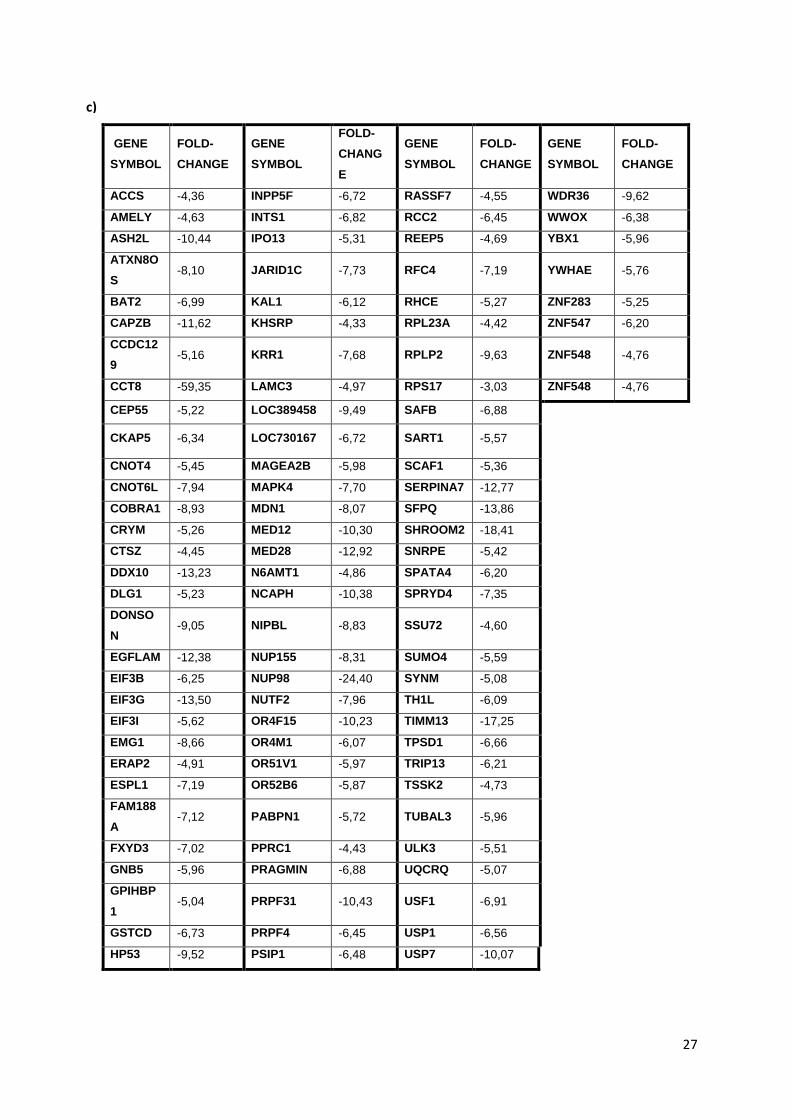
27
GENE
SYMBOL
FOLD-
CHANGE
GENE
SYMBOL
FOLD-
CHANG
E
GENE
SYMBOL
FOLD-
CHANGE
GENE
SYMBOL
FOLD-
CHANGE
ACCS -4,36 INPP5F -6,72 RASSF7 -4,55 WDR36 -9,62
AMELY -4,63 INTS1 -6,82 RCC2 -6,45 WWOX -6,38
ASH2L -10,44 IPO13 -5,31 REEP5 -4,69 YBX1 -5,96
ATXN8O
S -8,10 JARID1C -7,73 RFC4 -7,19 YWHAE -5,76
BAT2 -6,99 KAL1 -6,12 RHCE -5,27 ZNF283 -5,25
CAPZB -11,62 KHSRP -4,33 RPL23A -4,42 ZNF547 -6,20
CCDC12
9 -5,16 KRR1 -7,68 RPLP2 -9,63 ZNF548 -4,76
CCT8 -59,35 LAMC3 -4,97 RPS17 -3,03 ZNF548 -4,76
CEP55 -5,22 LOC389458 -9,49 SAFB -6,88
CKAP5 -6,34 LOC730167 -6,72 SART1 -5,57
CNOT4 -5,45 MAGEA2B -5,98 SCAF1 -5,36
CNOT6L -7,94 MAPK4 -7,70 SERPINA7 -12,77
COBRA1 -8,93 MDN1 -8,07 SFPQ -13,86
CRYM -5,26 MED12 -10,30 SHROOM2 -18,41
CTSZ -4,45 MED28 -12,92 SNRPE -5,42
DDX10 -13,23 N6AMT1 -4,86 SPATA4 -6,20
DLG1 -5,23 NCAPH -10,38 SPRYD4 -7,35
DONSO
N -9,05 NIPBL -8,83 SSU72 -4,60
EGFLAM -12,38 NUP155 -8,31 SUMO4 -5,59
EIF3B -6,25 NUP98 -24,40 SYNM -5,08
EIF3G -13,50 NUTF2 -7,96 TH1L -6,09
EIF3I -5,62 OR4F15 -10,23 TIMM13 -17,25
EMG1 -8,66 OR4M1 -6,07 TPSD1 -6,66
ERAP2 -4,91 OR51V1 -5,97 TRIP13 -6,21
ESPL1 -7,19 OR52B6 -5,87 TSSK2 -4,73
FAM188
A -7,12 PABPN1 -5,72 TUBAL3 -5,96
FXYD3 -7,02 PPRC1 -4,43 ULK3 -5,51
GNB5 -5,96 PRAGMIN -6,88 UQCRQ -5,07
GPIHBP
1 -5,04 PRPF31 -10,43 USF1 -6,91
GSTCD -6,73 PRPF4 -6,45 USP1 -6,56
HP53 -9,52 PSIP1 -6,48 USP7 -10,07
c)

28
Pathway analysis using Ingenuity Pathway Analysis software (IPA) showed representation of
candidate genes in relevant networks
All the genes identified as candidates involved in resistance to fulvestrant (Tables 3.1) were analyzed
in IPA to visualize the networks in which they were involved. Several canonical pathways were candidate
gene-enriched among the different libraries. These canonical pathways comprehend EIF2 signaling,
regulation of eIF4 and p70S6K signalling, mTOR signalling and PI3K-AKT among many others (Figure
3.6). A large set of genes can be identified in networks associated with these canonical pathways like
BRCA1, TP53, PIK3CA, NF-κB 1, TNF and MAP3K3 (Figure 3.7). It were also identified 2 genes from
the list of candidate genes already described to be associated to fulvestrant resistance: AKT1 and MED1
(Fig.3.7d) (Ribas et al, 2015; Zhang et al, 2013). These evidences result from the interaction between
genes involved in different pathways associated to different targeting shRNAs identified in several
networks with high values of score probability which are detailed in figure 3.8a. The networks identified
are related with: cancer, cell death and cell cycle, growth and proliferation retaining a score probability
of 19 and showing 14 focus molecules each associated to it (Fig. 3.7a and 3.7b), whereas figure 3.7c
(score probability 15) illustrates 12 focus molecules associated with DNA replication, recombination and
repair in addition to cancer-disease association. Figure 3.7d represents a network with high probability
score of 15 and retains 12 molecules involved in cellular function and maintenance as well as gene
expression. Importantly, HSD17B10, HSPE1 and MBP molecules were found in some of these networks
and therefore considered as likely candidates involved in fulvestrant resistance (Fig.3.7a, 3.7c and
Figure 10 – Appendix VII). Another diverse set of genes pops-up as majorly downregulated, presenting
very high fold-change values. CCT8, EIF2S, SHROOM2, CEP192 and USP7 are included in this gene
set, evoking the evidence that they can be determinant in the happening of fulvestrant resistance event
(Fig.3.8b).
Figure 3.6. Canonical pathways common between all different shRNA library screening potential depleted candidate genes. EIF2 signaling, regulation of eIF4 and p7056k signaling, mTOR signaling and PI3K/AKT signaling are in the top 5 pathways identified. The pathways are obtained based on a –log(p-value) scale and z probability scores.
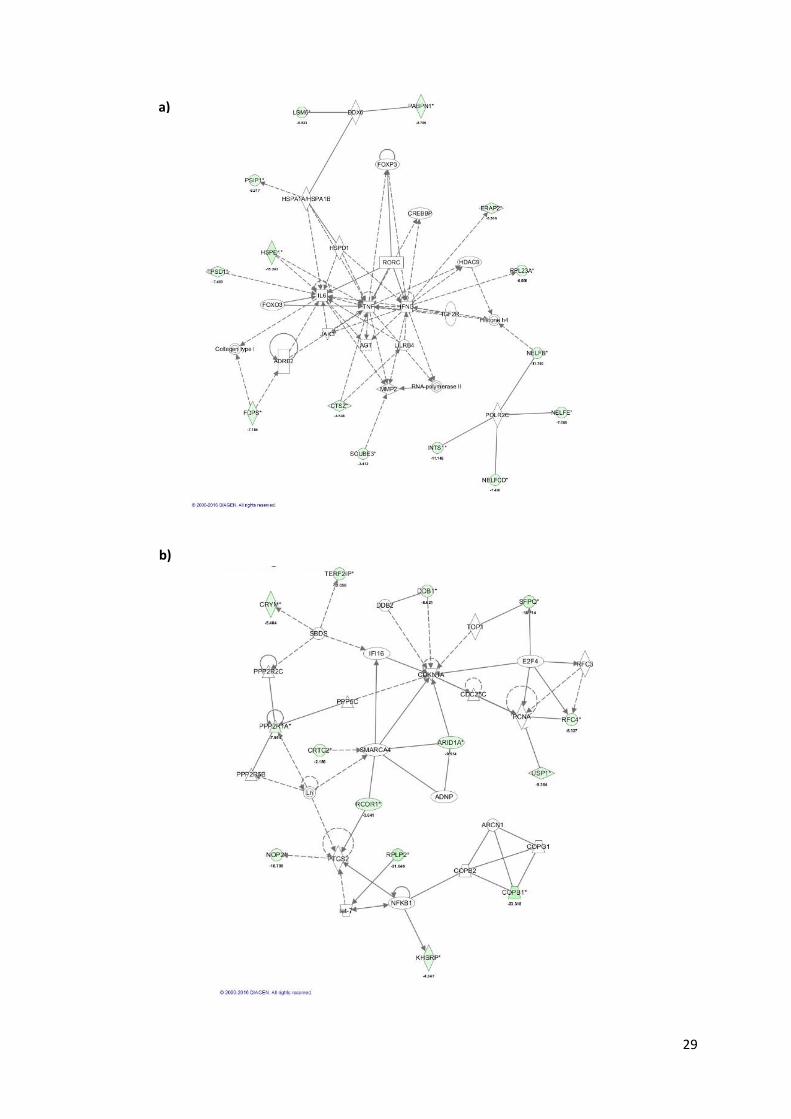
29
a)
b)

30
Figure 3.7. IPA network representation based on the pool of depleted candidate genes retrieved from the different shRNA library modules screening. a) Network 2 (score of 19) associated to cancer, cell death and survival among others. b) Network 3 (score of 19) associated with cell cycle, cellular development, cellular growth and proliferation. c) Network 4 (score of 15) associated to DNA replication, recombination and repair and cancer among others. d) Network 5 (score of 15) associated with cellular function and maintenance, gene expression among others. All candidate genes identified in these networks are depicted in green and respective fold-change is assigned. All the other genes are part of the network result and not from the screening data.
c)
d)

31
Figure 3.8. IPA summary from the convergence of the candidate genes obtained from the different shRNA library screening analysis representing the top networks identified and the correspondent score probability a) as well as the top downregulated molecules identified among the different networks generated and the fold-change associated to them (b).
a)
b)

32
HSD17B10 and HSPE1 genes are up-regulated in fulvestrant resistant cell lines
Among the genes identified in shRNA screening, pathway analysis showed that HSD17B10, HSPE1,
PSMB2 and MBP were found to be central molecules in networks whose main function was related to
cancer pathogenesis. These 4 genes were further evaluated using RT-qPCR in fulvestrant resistant and
their corresponding fulvestrant sensitive parental cell lines. The results showed that HSD17B10 (1.6-
fold) and HSPE1 (1.4-fold) genes showed enhanced expression in fulvestrant resistant LCC9 compared
to LCC1 (Figure 3.9). This corroborates well with the findings of shRNA library screenings where cells
carrying shRNAs targeting the 2 genes were depleted following exposure to fulvestrant. However,
PSMB2 and MBP genes showed similar expression between the resistant and the parental cell lines
(data not shown). For all the 4 genes, it was also concordant a lower gene expression in all the
fulvestrant-resistant cell lines (FRs) by comparison to the MCF-7/S0,5 cell line (Figure 3.10).
Figure 3.9. Relative quantification (RQ) of gene expression of HSD17B10 (black) and HSPE1 (grey) genes in fulvestrant-sensitive LCC1 and fulvestrant-resistant LCC9 cell as measured using RT-qPCR. RQ values are normalized relative to the parental cell lines (LCC1). Error bars are represented as the standard error of the mean (SME) and representative of three independent experiments using three technical replicates. PUM1 was used as a reference
gene.
0
0,2
0,4
0,6
0,8
1
1,2
1,4
1,6
1,8
2
Rel
ativ
e q
uan
tifi
cati
on
(R
Q)
of
gen
e ex
pre
ssio
n
Relative gene expression quantification of HSD17B10 and HSPE1 genes in
LCC1 and LCC9 cells

33
Evaluation of the expression of HSD17B10 and HSPE1 showed enhanced expression in
Fulvestrant resistant cell lines
To investigate whether the differences at mRNA level were consistent at the protein expression level
western blotting was performed for the differentially regulated genes (Figure 3.11 and 3.12).
The expressions of HSD17B10 and HSPE1 at the protein levels were evaluated in different breast
cancer sensitive and respective fulvestrant-resistant cell lines using Western blotting. These included
LCC, MCF-7/S0.5 and FRs as well as 2 other ER+ breast cancer cell line models T47-D and ZR75.
HSD17B10 (28 kDa) was found to be highly expressed in all fulvestrant-resistant cells grown in the
presence of fulvestrant as compared to the parental cell lines, except for FR3, which exhibited reduced
expression compared to parental cells (Figure 3.11 and 3.13). HSD17B10 is also highly expressed in
all fulvestrant-resistant cell lines compared to the sensitive one in the absence of fulvestrant, but
exposure to fulvestrant increases the expression even further (Fig.3.11 and Figure 11 - appendix VIII),
suggesting an important role of this protein in the resistance phenotypes. As expected, HSD17B10
protein expression decreases in LCC1 when fulvestrant is present (Fig.3.11a and Figure 11 – Appendix
VIII), due to its sensitiveness to this drug.
0
0,2
0,4
0,6
0,8
1
1,2
1,4
Rel
ativ
e q
uan
tifi
cati
on
(R
Q)
of
gen
e ex
pre
ssio
n
Relative gene expression quantification of HSD17B10 and HSPE1 genes in MCF-7/S0,5 and
FRs cells
Figure 3.10. Relative quantification (RQ) of gene expression of HSD17B10 (black) and HSPE1 (grey) genes in the fulvestrant-sensitive MCF-7/S0,5 and fulvestrant-resistant FRs cell lines as measured using RT-qPCR. RQ values are normalized relative to the parental cell lines (MCF-7/S0,5). Error bars are represented as the standard error of the mean (SME) and representative of three independent experiments using three technical replicates. PUM1 was used as a reference gene.

34
HSPE1 protein (10 kDa) shows higher expression in LCC and ZR75 fulvestrant-resistant cells in
comparison to the corresponding sensitive parental cells (Fig.3.12a and 3.12b), and exposure of the
cells to fulvestrant enhances the expression of the protein further in all fulvestrant resistant cell lines
(Fig.3.12). Once again, HSPE1 protein expression largely decreases in the LCC1 sensitive phenotype
upon fulvestrant exposure (Fig.3.12a). Moreover, expression of HSPE1 in T47-D cell line seems to be
absent or very low, observably increasing in the resistant phenotypes upon fulvestrant exposure
(Fig.3.12c). No additional quantification of band density was performed for this protein however, due to
a high level of saturation of β-actin bands.
Figure 3.11. Western-blot analysis of HSD17B10 protein expression in different ER+ breast cancer cell lines models in the absence and presence of fulvestrant (+FULV). a) HSD17B10 protein expression in fulvestrant-sensitive LCC1 and fulvestrant-resistant LCC9 cell lines (a), fulvestrant-sensitive T47D S5 and fulvestrant-resistant T47-D R1 and T47-D R2 (b), fulvestrant-sensitive ZR75-1 and fulvestrant-resistant ZR75-1R (c), and fulvestrant sensitive MCF7/S0,5 and fulvestrant-resistant FR1, FR2, FR3 and FR4 cell lines (d). The western-blots shown are representative of the result of three independent experiments. β-actin was used as a loading control.
β-actin
HSD17B10
LCC1 LCC9 LCC1
(+FULV)
LCC9
(+FULV)
a)
MCF-7/
S0,5 FR3 FR3
(+FULV)
FR4
(+FULV) FR4 MCF-7 /S0,5
(+FULV)
β-actin
HSD17B10
d)
β-actin
HSD17B10
T47-D
S5
T47-D
R1
T47-D-
R1
(+FULV)
T47-D
R2
(+FULV)
)
T47-
D R2
T47-D
S5
(+FULV)
b)
β-actin
HSD17B10
ZR75-
1
ZR75-
1R
ZR75-1
(+FULV)
ZR75-1R
(+FULV)
c)
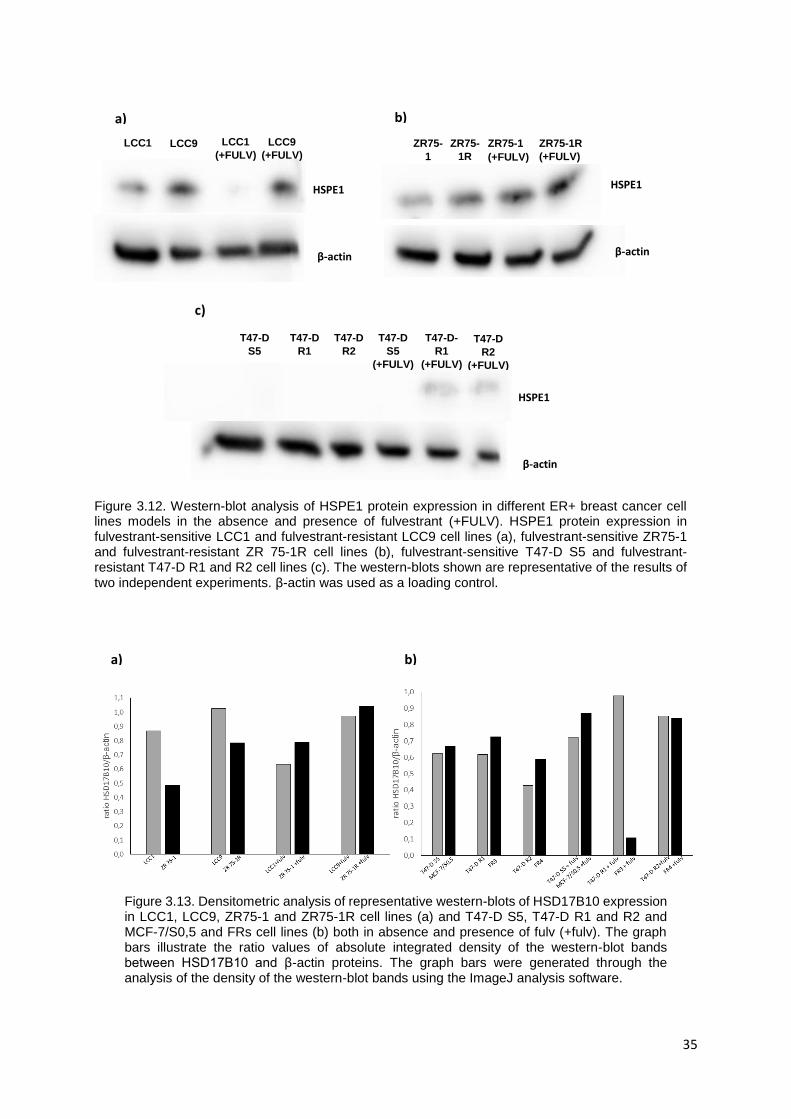
35
Figure 3.12. Western-blot analysis of HSPE1 protein expression in different ER+ breast cancer cell lines models in the absence and presence of fulvestrant (+FULV). HSPE1 protein expression in fulvestrant-sensitive LCC1 and fulvestrant-resistant LCC9 cell lines (a), fulvestrant-sensitive ZR75-1 and fulvestrant-resistant ZR 75-1R cell lines (b), fulvestrant-sensitive T47-D S5 and fulvestrant-resistant T47-D R1 and R2 cell lines (c). The western-blots shown are representative of the results of two independent experiments. β-actin was used as a loading control.
β-actin
HSPE1
T47-D
S5
T47-D
R1
T47-D-
R1
(+FULV)
T47-D
R2
(+FULV)
T47-D
R2
T47-D
S5
(+FULV)
c)
β-actin
HSPE1
LCC1 LCC9 LCC1
(+FULV)
LCC9
(+FULV)
a)
β-actin
HSPE1
ZR75-
1
ZR75-
1R
ZR75-1
(+FULV)
ZR75-1R
(+FULV)
b)
Figure 3.13. Densitometric analysis of representative western-blots of HSD17B10 expression in LCC1, LCC9, ZR75-1 and ZR75-1R cell lines (a) and T47-D S5, T47-D R1 and R2 and MCF-7/S0,5 and FRs cell lines (b) both in absence and presence of fulv (+fulv). The graph bars illustrate the ratio values of absolute integrated density of the western-blot bands between HSD17B10 and β-actin proteins. The graph bars were generated through the analysis of the density of the western-blot bands using the ImageJ analysis software.
a) b)

36

37
DISCUSSION
Resistance to fulvestrant, a second-line anti-estrogen drug used in the treatment of post-menopausal
women with ER+ locally or advanced breast cancer patients can be caused by several mechanisms
associated to ER-dependent or –independent signalling (Zilli et al, 2009; Becerra et al, 2013; Frogne et
al, 2009; Ciruelos et al, 2014). At the moment, besides HER2, there’s no other available biomarker in
clinical use for selection of ER+ breast cancer patients available to endocrine therapy.
Therefore, the study presented in this thesis aimed at evaluating potential biomarkers using shRNA
library consisting of over 75,000 individual shRNAs covering the human transcriptome. This way, we
were able to identify the most differentially regulated genes and/or proteins associated to known
canonical signalling pathways upon fulvestrant exposure. In this study 3 different shRNA library
modules, covering mRNAs related to signalling pathways (library 1), disease-associated (library 2) and
concerning cell surface, extracellular and DNA binding (library 3) were used. These shRNA libraries
were packaged in lentivirus and are capable of transducing mammalian cell lines. Two different ER+
breast cancer cell lines: LCC1 – an estrogen independent and fulvestrant-sensitive - and LCC9 – a
fulvestrant-resistant cell lines were used in this study. These cell lines are derived from the parental
MCF-7/S0,5 breast cancer cell line (Brunner et al, 1997).
Sequencing data analysis enabled us to identify 206 candidate genes through identification of depleted
correspondent shRNAs as a result of exposure to fulvestrant from the resistant cell line phenotype upon
negative selection screening. Pathway analysis using IPA showed that HSD17B10, HSPE1 and MBP
seem to be cancer-associated genes and central in the networks related with cell cycle, cell death and
survival and DNA replication, recombination and repair.
Further evaluation of the expression of these genes showed that HSD17B10 and HSPE1 genes are
significantly up-regulated in the fulvestrant-resistant cell lines compared to sensitive parental cell lines.
Moreover, exposure of resistant breast cancer cell lines to fulvestrant further enhances the expression
of the proteins suggesting that the genes may play a role in the survival and proliferation of cells in
fulvestrant containing medium. However, whether these 2 genes are responsible for fulvestrant
resistance phenotype remains to be evaluated. Gene knockdown using siRNAs and evaluating its
consequence in term of the survival, proliferation and death of cells in fulvestrant medium might be
needed to see whether these genes are in fact the ones responsible for the resistance mechanism.
HSD17B10 is a protein involved in the sex steroid metabolism by means of inactivation of estradiol to
estrone through oxidation and has been shown that overexpression of this molecule may lead to cell
growth and resistance to cell death (Yang et al, 2005; Justenhoven et al, 2012; Carlson et al, 2015).
HSD17B10 protein belongs to the short-chain dehydrogenase/reductase superfamily 17β-
hydroxysteroid dehydrogenase (HSD17B) and some of the members of this family have been reported
as prognostic biomarkers in breast cancer (Day et al, 2008; Jansson et al, 2006). HSPE1/HSP10 is a
heat shock protein which functions as a chaperonin and has been suggested to be involved in
immunomodulation and tumor progression (Rappa et al, 2014). Some reports have indicated that

38
HSPE1/HSP10 is associated with disease progression in ovarian cancer and chemoresistance (Têtu et
al, 2008; Maxwell et al, 2003).
Pathway analysis of functional screening also led to the identification of other genes involved in
important cellular processes such as cell cycle regulation, cell proliferation and growth, cell death and
survival and DNA replication, recombination and repair. Among these genes are well-documented tumor
suppressors such as BRCA1 and TP53 (James et al, 2007; Rivlin et al, 2011). Moreover, molecules
such as MED1, AKT1, PI3KCA, mTOR, TNF, FYN, JUN, FOS, IGF-1, NF-κB and MAPKs which are
known to be involved in endocrine resistance to tamoxifen and fulvestrant were also identified among
these pathways (Zhang et al, 2013; Jordan et al, 2014; Ribas et al, 2015; Knudsen et al, 2014; Clarke
et al, 2015; Stone & Musgrove, 2014; Fox et al, 2012; Fox et al, 2013; Ciruelos et al, 2014; Dixon, 2014;
Elias et al, 2014; Schiff & Osborne, 2005; Becerra et al, 2013). All these findings show up to be very
important when looking for the differentially regulated genes associated to them in a way that the genes
preceding or succeeding these ones may be relevant in terms of endocrine resistance. Others, identified
to be majorly downregulated such as CCT8 have been related to hepatocellular carcinoma, through
association with c-Jun signaling cascade and increased expression of this protein was reported to be
related to poor outcome in glioblastoma (Wei et al, 2015; Qiu et al, 2015). SHROOM2 have been
implicated in colorectal cancer, where its depletion from endothelial cells leads to increased
angiogenesis, whereas CEP192 have been implied in Her2+ breast cancer centrosome amplification
(Morgan-Fischer et al, 2013; Lee et al, 2014). USP7, a deubiquitination protein has been linked to p53
tumor suppressor stability and it has been shown to regulate mitotic progression and taxane sensitivity
(d’Arcy et al, 2015; Giovinazzi et al, 2013). EIF2S2, the beta subunit of the eukaryotic initiation factor
eIF2 (eIF2β) has been reported to be associated with suppression of testicular cancer incidence
(Heaney et al, 2009). Also, eIF2α phosphorylation was reported to be involved in cell adaptation to
stress associated with chemotherapeutic drug treatments and to PI3K and AKT activation (Kazemi et
al, 2007; Rajesh et al, 2015). Moreover, EIF2 and eIF4 and p70S6k were the pathways with significant
representation of the genes we identified in the shRNA functional screening. PI3K/AKT/p70S6k
signaling was reported to be regulated in breast cancer (Halacli et al, 2015).
PI3K/AKT and mTOR signaling pathways are among the top canonical pathways where the genes
identified by functional screening showed significant representation. It is plausible that the increased
PI3K-AKT-mTOR signaling may play a role in endocrine resistance. Interestingly, reports have shown
that PI3K-AKT-mTOR signaling pathway is directly associated to resistance to endocrine drugs (Peter-
Hansson et al, 2013; Stone & Musgrove et al, 2014; Ma, 2015; Fox et al, 2012). Components of PTEN-
PI3K-mTOR pathway have been described to influence p53 function and to interact with DNA repair
mechanisms (Lønning & Knappskog, 2013). PI3K promotes c-Jun phosphorylation and complexation
with c-Fos and this is known to be involved in ER transcription (Dixon, 2014). As a proposed mechanism,
HSD17B10 and HSPE1 might activate PI3K/AKT and mTOR signalling, c-Fos and c-Jun
phosphorylation and complexation which may enhance ER-independent signalling pathway and/or
influence p53 and lead to fulvestrant resistance. Some inhibitors targeting AKT and PI3K-mTOR
signaling have been developed and used in combination with endocrine therapy (Ribas et al, 2015;

39
Hortobagyi et al, 2015; Bosch et al, 2015; Ma, 2015) and the current study showed that inhibition of
pathways such as EIF2 and eIF4/p70S6k signaling may also be a promising venue in the treatment of
drug resistant breast cancer.
In conclusion, in this thesis we performed a functional screening of the human transcriptome in
fulvestrant resistance and observed that there was significant depletion of shRNAs targeting over 206
genes. Among these genes, HSD17B10 and HSPE1 were found to be significantly up-regulated in
fulvestrant resistant breast cancer cell lines. We further demonstrated that the expression of these
proteins can be influenced by the presence of fulvestrant in growth medium. These 2 genes are
promising candidates for further evaluation of their role in fulvestrant resistance and their potential as a
biomarker for endocrine resistance in breast cancer. shRNA library based functional screening method
appears to be very useful in the quest to identify biomarkers in endocrine resistance as well as in
understanding the molecular mechanisms of resistance .
Future perspectives
The work presented in this thesis is still in an initial phase and further work is needed in order to validate
the findings. Therefore, validation of the functional importance of these genes using transient and stable
gene knockdown methods is warranted. Gene knockdown effects will be evaluated in terms of cell
growth and proliferation as well as in terms of cell death and apoptosis induction. Evaluation of the
molecular mechanism by which these genes operate can be evaluated following interference with the
expression of target genes by assessing the activation/inhibition of downstream molecules.
Furthermore, evaluation of the genes for their potential as a biomarker will be performed by studying the
expression of the molecules in clinical samples and relating this to clinical outcome of fulvestrant
treatment in advanced disease patients.

40

41
REFERENCES
1. Ali, S., & Coombes, R. C. 2002. Endocrine-Responsive Breast Cancer and Strategies for Combating Resistance. Nature Reviews Cancer, 2(2), 101–112. http://doi.org/10.1038/nrc721
2. Ambrosino, C., Tarallo, R., Nassa, G., Cirillo, F., Weisz, A. 2013. New Insights on estrogen receptor actions in hormone-responsive breast cancer cells by interaction proteomics In Cell and Molecular biology of breast cancer (Heide Schatten ed) pp. 149-174, Springer, New York. DOI 10.1007/978-1-62703-634-4_8
3. Albukhari, A., Bokhari, F. F., Choudhry, H. 2015. Next Generation Sequencing in the Era of Cancer-Targeted Therapies: Towards Personalised Medicine In Next Generation Sequencing in Cancer Research (W. Wu and H. Choudhry eds) pp. 39-55, Springer, New York. DOI 10.1007/978-3-319-15811-2_3
4. Ameres, S. L., Martinez, J., & Schroeder, R. 2007. Molecular basis for target RNA recognition and cleavage by human RISC. Cell, 130(1), 101–112. http://doi.org/10.1016/j.cell.2007.04.037
5. André, M. do R., Amaral, S., Mayer, A., Miranda, A., & SUL, W. G. R. 2014. Sobrevivência de Cancro da Mama e Factores Associados: Resultados do Registo Oncológico Regional Sul. Acta Médica Portuguesa, 27(3), 325–330.
6. Bassik, M. C., Lebbink, R. J., Churchman, L. S., Ingolia, N. T., Patena, W., Leproust, E. M., … Mcmanus, M. T. 2009. Rapid Creation and Quantitative Monitoring of High Coverage shRNA libraries, Nat Methods 6(6), 443–445. http://doi.org/10.1038/nmeth.1330.Rapid
7. Bernards, R., Brummelkamp, T. R., & Beijersbergen, R. L. 2006. shRNA libraries and their use in cancer genetics. Nature Methods, 3(9), 701–706. http://doi.org/10.1038/nmeth921
8. Berns, K., Hijmans, E. M., Mullenders, J., Brummelkamp, T. R., Velds, A., Heimerikx, M., … Bernards, R. 2004. A large-scale RNAi screen in human cells identifies new components of the p53 pathway. Nature, 428(6981), 431–437. http://doi.org/10.1038/nature02371
9. Bianco, S., & Gévry, N. 2012. Endocrine resistance in breast cancer: From cellular signaling pathways to epigenetic mechanisms. Transcription, 3(4), 165–170. http://doi.org/10.4161/trns.20496
10. Boettcher, M., Fredebohm, J., Moghaddas Gholami, A., Hachmo, Y., Dotan, I., Canaani, D., & Hoheisel, J. D. 2010. Decoding pooled RNAi screens by means of barcode tiling arrays. BMC Genomics, 11(1), 7. http://doi.org/10.1186/1471-2164-11-7
11. Boettcher, M., & Hoheisel, J. D. 2010. Pooled RNAi Screens - Technical and Biological Aspects. Current Genomics, 11(3), 162–7. http://doi.org/10.2174/138920210791110988
12. Bosch, A., Li, Z., Bergamaschi, A., Ellis, H., Toska, E., Prat, A., … Chandarlapaty, S. 2015. PI3K inhibition results in enhanced estrogen receptor function and dependence in hormone receptor – positive breast cancer. Science Translational Medicine, 7(283). http://doi.org/10.1126/scitranslmed.aaa4442
13. Boutros, M., & Ahringer, J. 2008. The art and design of genetic screens: RNA interference. Nature Reviews Genetics, 9(7), 554–566. http://doi.org/10.1038/nrg2364
14. Brünner, N., Boysen, B., Jirus, S., Skaar, T. C., Holst-Hansen, C., Lippman, J., … Clarke, R. 1997. MCF7/LCC9: An antiestrogen-resistant MCF-7 variant in which acquired resistance to the steroidal antiestrogen ICI 182,780 confers an early cross- resistance to the nonsteroidal antiestrogen tamoxifen. Cancer Research, 57(16), 3486–3493.
15. Breast, E., Trialists, C., & Group, C. 2005. Effects of chemotherapy and hormonal therapy for early breast cancer on recurrence and 15-year survival: an overview of the randomised trials. Lancet, 365(9472), 1687–717. http://doi.org/10.1016/S0140-6736(05)66544-0
16. Briand, P., & Lykkesfeldt, A. E. 1984. Effect of Estrogen and Antiestrogen on the Human Breast Cancer Cell Line MCF-7 Adapted to Growth at Low Serum Concentration Effect of Estrogen and Antiestrogen on the Human Breast Cancer Cell Line MCF-7 Adapted to Growth at Low Serum Concentration. Cancer Research, 44(March), 1114–1119.
17. Brummelkamp, T. R., & Bernards, R. 2003. New tools for functional mammalian cancer genetics. Nature Reviews. Cancer, 3(10), 781–789. http://doi.org/10.1038/nrc1191
18. Brummelkamp, T. R., Fabius, A. W. M., Mullenders, J., Madiredjo, M., Velds, A., Kerkhoven, R. M., … Beijersbergen, R. L. 2006. An shRNA barcode screen provides insight into cancer cell vulnerability to MDM2 inhibitors. Nature Chemical Biology, 2(4), 202–206. http://doi.org/10.1038/nchembio774

42
19. Brünner, N., Frandsen, T. L., Holst-hansen, C., Brãnner, N., Lippman, M. E., Clarke, R., … Wakeling, A. E. 1993. MCF7 / LCC2 : A 4-Hydroxytamoxifen Resistant Human Breast Cancer Variant That Retains Sensitivity to the Steroidal Advances in Brief MCF7 / LCC2 : A 4-Hydroxytamoxifen Resistant Human Breast Cancer Variant That Retains Sensitivity to the Steroidal Antiest, 3229–3232.
20. Carlson, E. a, Marquez, R. T., Du, F., Wang, Y., Xu, L., & Yan, S. S. 2015. Overexpression of 17β-hydroxysteroid dehydrogenase type 10 increases pheochromocytoma cell growth and resistance to cell death. BMC Cancer, 15(1), 166. http://doi.org/10.1186/s12885-015-1173-5
21. Cheng, K., & Qin, B. 2009. Pharmaceutical Perspectives of Cancer Therapeutics. http://doi.org/10.1007/978-1-4419-0131-6
22. Ciruelos, E., Pascual, T., Arroyo Vozmediano, M. L., Blanco, M., Manso, L., Parrilla, L., … Cortes-Funes, H. 2014. The therapeutic role of fulvestrant in the management of patients with hormone receptor-positive breast cancer. The Breast, 23(3), 201–208. http://doi.org/10.1016/j.breast.2014.01.016
23. Clarke, R., Tyson, J. J., & Dixon, J. M. 2015. Endocrine resistance in breast cancer - An overview and update. Molecular and Cellular Endocrinology, 418, 220–234. http://doi.org/10.1016/j.mce.2015.09.035
24. d’Arcy, P., Wang, X., & Linder, S. 2015. Deubiquitinase inhibition as a cancer therapeutic strategy. Pharmacology & Therapeutics, 147, 32–54. http://doi.org/10.1016/j.pharmthera.2014.11.002
25. Day, J. M., Foster, P. a, Tutill, H. J., Parsons, M. F. C., Newman, S. P., Chander, S. K., … Purohit, A. 2008. 17beta-hydroxysteroid dehydrogenase Type 1, and not Type 12, is a target for endocrine therapy of hormone-dependent breast cancer. International Journal of Cancer. Journal International Du Cancer, 122(9), 1931–40. http://doi.org/10.1002/ijc.23350
26. de Cremoux, P., Tran-Perennou, C., Brockdorff, B. L., Boudou, E., Brunner, N., Magdelenat, H., & Lykkesfeldt, A. E. 2003. Validation of real-time RT-PCR for analysis of human breast cancer cell lines resistant or sensitive to treatment with antiestrogens. Endocr. Relat. Cancer, 10(3), 409–418.
27. Di Leo, A., Jerusalem, G., Petruzelka, L., Torres, R., Bondarenko, I. N., Khasanov, R., … Martin, M. 2010. Results of the CONFIRM phase III trial comparing fulvestrant 250 mg with fulvestrant 500 mg in postmenopausal women with estrogen receptor-positive advanced breast cancer. Journal of Clinical Oncology, 28(30), 4594–4600. http://doi.org/10.1200/JCO.2010.28.8415
28. Dixon, J. M. 2014. Endocrine Resistance in Breast Cancer New Journal of Science (2014). http://dx.doi.org/10.1155/2014/390618
29. Dykxhoorn, D. M., Novina, C. D., & Sharp, P. A. 2003. Killing the messenger: short rnas that silence gene expression. Nature Reviews Molecular Cell Biology, 4(6), 457–467. http://doi.org/10.1038/nrm1129
30. Elias, D., Vever, H., Lænkholm, a-V., Gjerstorff, M. F., Yde, C. W., Lykkesfeldt, a E., & Ditzel,
H. J. 2014. Gene expression profiling identifies FYN as an important molecule in tamoxifen
resistance and a predictor of early recurrence in patients treated with endocrine therapy.
Oncogene, 7(November 2013), 1–9. http://doi.org/10.1038/onc.2014.138
31. Esebua, M. 2013. Histopathology and grading of breast cancer In Cell and molecular biology of breast cancer (Heide Schatten ed) pp.1-28, Springer, New York. DOI 10.1007/978-1-62703-634-4_1,
32. Falschlehner, C., Steinbrink, S., Erdmann, G., & Boutros, M. 2010. High-throughput RNAi screening to dissect cellular pathways: A how-to guide. Biotechnology Journal, 5(4), 368–376. http://doi.org/10.1002/biot.200900277
33. Fan, M., Bigsby, R. M., & Nephew, K. P. 2003. The NEDD8 pathway is required for proteasome-mediated degradation of human estrogen receptor (ER)-alpha and essential for the antiproliferative activity of ICI 182,780 in ERalpha-positive breast cancer cells. Molecular Endocrinology, 17(3), 356–365. http://doi.org/10.1210/me.2002-0323
34. Ferlay, J., Shin, H.-R., Bray, F., Forman, D., Mathers, C., & Parkin, D. M. 2010. Estimates of worldwide burden of cancer in 2008: GLOBOCAN 2008. International Journal of Cancer, 127(12), 2893–2917. http://doi.org/10.1002/ijc.25516
35. Fox, E. M., Arteaga, C. L., & Miller, T. W. 2012. Abrogating endocrine resistance by targeting ERα and PI3K in breast cancer. Frontiers in Oncology, 2(October), 145. http://doi.org/10.3389/fonc.2012.00145
36. Fox, E. M., Kuba, M. G., Miller, T. W., Davies, B. R., & Arteaga, C. L. 2013. Autocrine IGF-I/insulin receptor axis compensates for inhibition of AKT in ER-positive breast cancer cells with resistance to estrogen deprivation. Breast Cancer Research : BCR, 15(4), R55.

43
http://doi.org/10.1186/bcr3449 37. Frogne, T., Sonne-hansen, K., & Nexo, E. 2009. Activation of ErbB3, EGFR and Erk are
essential for growth of human breast cancer cell lines with acquired resistance to fulvestrant. Breast Cancer Research, 114(2), 263–275. http://doi.org/10.1007/s10549-008-0011-8.Activation
38. García-Becerra, R., Santos, N., Díaz, L., & Camacho, J. 2012. Mechanisms of Resistance to Endocrine Therapy in Breast Cancer: Focus on Signaling Pathways, miRNAs and Genetically Based Resistance. International Journal of Molecular Sciences, 14(1), 108–145. http://doi.org/10.3390/ijms14010108
39. Gee, J. M. W., Harper, M. E., Hutcheson, I. R., Madden, T. A., Barrow, D., Knowlden, J. M., … Nicholson, R. I. 2003. The Antiepidermal Growth Factor Receptor Agent Gefitinib (ZD1839/Iressa) Improves Antihormone Response and Prevents Development of Resistance in Breast Cancer in Vitro. Endocrinology, 144(11), 5105–5117. http://doi.org/10.1210/en.2003-0705
40. Guo, Q., Kong, Y., Fu, L., Yu, T., Xu, J., & Chen, W. 2007. A randomized lentivirus shRNA library construction. Biochemical and Biophysical Research Communications, 358(1), 272–276. http://doi.org/10.1016/j.bbrc.2007.04.123
41. Halacli, S. O., & Dogan, A. L. 2015. FOXP1 regulation via the PI3K/Akt/p70S6K signaling pathway in breast cancer cells. Oncology Letters, 9(3), 1482–1488. http://doi.org/10.3892/ol.2015.2885
42. Han, B., Audeh, W., Jin, Y., Bagaria, S.P., Cui, X. 2013 Biology and treatment of basal-like breast cancer In Cell and Molecular biology of breast cancer (Heide Schatten ed) pp. 91-110, Springer, New York
43. Heaney, J. D., Michelson, M. V., Youngren, K. K., Lam, M. Y. J., & Nadeau, J. H. 2009. Deletion of eIF2beta suppresses testicular cancer incidence and causes recessive lethality in agouti-yellow mice. Human Molecular Genetics, 18(8), 1395–1404. http://doi.org/10.1093/hmg/ddp045
44. Herynk, M., Selever, J., Thirugnanasampanthan, J., Cui, Y., Fuqua, S. A. W. 2009. Hormone action and clinical significance of the estrogen receptor α In Hormone receptors in breast cancer, Cancer Treatment and Research (S.A.W. Fuqua ed) pp.1-16, Springer, New York. DOI 10.1007/978-0-387-09463-2_1
45. Hortobagyi, G. N., Chen, D., Piccart, M., Rugo, H. S., Burris, H. A., Pritchard, K. I., … Baselga, J. 2015. Correlative Analysis of Genetic Alterations and Everolimus Benefit in Hormone Receptor-Positive, Human Epidermal Growth Factor Receptor 2-Negative Advanced Breast Cancer: Results From BOLERO-2. Journal of Clinical Oncology : Official Journal of the American Society of Clinical Oncology. http://doi.org/10.1200/JCO.2014.60.1971
46. Howell, A. 2006. Pure oestrogen antagonists for the treatment of advanced breast cancer. Endocrine Related Cancer, 13(3), 689–706. http://doi.org/10.1677/erc.1.00846
47. Howell, A., Robertson, J. F. R., Abram, P., Lichinitser, M. R., Elledge, R., Bajetta, E., … Osborne, C. K. 2004. Comparison of fulvestrant versus tamoxifen for the treatment of advanced breast cancer in postmenopausal women previously untreated with endocrine therapy: A multinational, double-blind, randomized trial. Journal of Clinical Oncology, 22(9), 1605–1613. http://doi.org/10.1200/JCO.2004.02.112
48. Hu, G., & Luo, J. 2012. A primer on using pooled shRNA libraries for functional genomic screens. Acta Biochimica et Biophysica Sinica, 44(2), 103–112. http://doi.org/10.1093/abbs/gmr116
49. James, C. R., Quinn, J. E., Mullan, P. B., Johnston, P. G., & Harkin, D. P. (2007). BRCA1, a potential predictive biomarker in the treatment of breast cancer. The Oncologist, 12(2), 142–50. http://doi.org/10.1634/theoncologist.12-2-142
50. Jansson, A., Gunnarsson, C., Cohen, M., Sivik, T., & Stål, O. 2006. 17β-Hydroxysteroid Dehydrogenase 14 Affects Estradiol Levels in Breast Cancer Cells and Is a Prognostic Marker in Estrogen Receptor–Positive Breast Cancer. Cancer Research, 66(23), 11471–11477. http://doi.org/10.1158/0008-5472.CAN-06-1448
51. Jemal, A., Bray, F., & Ferlay, J. 2011. Global Cancer Statistics: 2011. CA Cancer J Clin, 49(2), 1,33–64. http://doi.org/10.3322/caac.20107.Available
52. Jemal, A., Siegel, R., Ward, E., Hao, Y., Xu, J., Murray, T., & Thun, M. J. 2008. Cancer statistics, 2008. CA: A Cancer Journal for Clinicians, 58(2), 71–96. http://doi.org/10.3322/CA.2007.0010
53. Johnston, S. R. D. 2010. New Strategies in Estrogen Receptor-Positive Breast Cancer. Clinical Cancer Research, 16(7), 1979–1987. http://doi.org/10.1158/1078-0432.CCR-09-1823
54. Jordan, N. J., Dutkowski, C. M., Barrow, D., Mottram, H. J., Hutcheson, I. R., Nicholson, R. I., … Gee, J. M. W. 2014. Impact of dual mTORC1/2 mTOR kinase inhibitor AZD8055 on acquired

44
endocrine resistance in breast cancer in vitro. Breast Cancer Research : BCR, 16(1), R12. http://doi.org/10.1186/bcr3604
55. Justenhoven, C., Obazee, O., & Brauch, H. 2012. The pharmacogenomics of sex hormone metabolism: breast cancer risk in menopausal hormone therapy. Pharmacogenomics April, 13, 659–675.
56. Kampmann, M., Bassik, M. C., & Weissman, J. S. (2014). Functional genomics platform for pooled screening and generation of mammalian genetic interaction maps. Nature Protocols, 9(8), 1825–1847. http://doi.org/10.1038/nprot.2014.103
57. Kassner, P. D. 2008. Discovery of novel targets with high throughput RNA interference screening. Combinatorial Chemistry & High Throughput Screening, 11(3), 175–84. http://doi.org/10.2174/138620708783877744
58. Kazemi,S., Mounir,Z., Baltzis, D., Raven,JF., Wang,S., Krishnamoorthy, JL., Pluquet, O., Pelletier, J., and Koromilas, AE. 2007. Multiple pathways differentially regulate global oxidative stress responses in fission yeast. Molecular Biology of the Cell, 18, 3635–3644. http://doi.org/10.1091/mbc.E07
59. Ketela, T., Heisler, L. E., Brown, K. R., Ammar, R., Kasimer, D., Surendra, A., … Nislow, C. 2011. A comprehensive platform for highly multiplexed mammalian functional genetic screens. BMC Genomics, 12(1), 213. http://doi.org/10.1186/1471-2164-12-213
60. Kirkegaard T, Hansen SK, Larsen SL, Reiter BE, Sorensen BS, Lykkesfeldt AE. 2014. T47D breast cancer cells switch from ER/HER to HER/c-Src signaling upon acquiring resistance to the antiestrogen fulvestrant. Cancer Lett; 344: 90-100.
61. Klinge, C. M. 2001. Estrogen receptor interaction with estrogen response elements. Nucleic Acids Res, 29(14), 2905–19.
62. Knudsen, S., Jensen, T., Hansen, A., Mazin, W., Lindemann, J., Kuter, I., … Anderson, E. (2014). Development and validation of a gene expression score that predicts response to fulvestrant in breast cancer patients. PLoS ONE, 9(2). http://doi.org/10.1371/journal.pone.0087415
63. Kok, M., Linn, S., van de Vijver, M. 2009. Estrogen Receptor Phenotypes defined by gene expression profiles In Hormone receptors in breast cancer, Cancer Treatment and Research (S.A.W. Fuqua ed) pp.231-248 Springer, New York. DOI 10.1007/978-0-387-09463-2_1
64. Lee, M.-Y., Marina, M., King, J. L., & Saavedra, H. I. 2014. Differential expression of centrosome regulators in Her2+ breast cancer cells versus non-tumorigenic MCF10A cells. Cell Division, 9(1), 3. http://doi.org/10.1186/1747-1028-9-3
65. Livak, K.J. and T.D. Schmittgen. 2001. Analysis of relative gene expression data using real-time quantitative PCR and the 2(-Delta Delta C(T)) Method. Methods, 25(4) p. 402-8.
66. Lønning, P. E., & Knappskog, S. 2013. Mapping genetic alterations causing chemoresistance in cancer: identifying the roads by tracking the drivers. Oncogene, 32(46), 5315–5330. http://doi.org/10.1038/onc.2013.48
67. Luo, B., Cheung, H. W., Subramanian, A., Sharifnia, T., Okamoto, M., Yang, X., … Root, D. E. 2008. Highly parallel identification of essential genes in cancer cells. Proceedings of the National Academy of Sciences of the United States of America, 105(51), 20380–5. http://doi.org/10.1073/pnas.0810485105
68. Lykkesfeldt, A. E., Madsen, M. W., & Briand, P. 1994. Altered Expression of Estrogen-regulated Genes in a Tamoxifen-resistant and ICI 164 , 384 and ICI 182 , 780 Sensitive Altered Expression of Estrogen-regulated Genes. Cancer Research, 54, 1587–1595.
69. Lykkesfeldt, A. E., Larsen,S.S , & Briand, P. 1995. Human Breast Cancer Cell Lines Resistant to Pure.Antiestrogens are Sensitive to Tamoxifen Treatment. Int J Cancer , 61(4) 529–534.
70. Ma, C. X. 2015. The PI3K Pathway as a Therapeutic Target in Breast Cancer. American Journal of Hematology / Oncology®, 11(3), 23–29.
71. Massarweh, S., Osborne, C. K., Jiang, S., Wakeling, A. E., Rimawi, M., Mohsin, S. K., … Schiff, R. 2006. Mechanisms of tumor regression and resistance to estrogen deprivation and fulvestrant in a model of estrogen receptor-positive, HER-2/neu-positive breast cancer. Cancer Research, 66(16), 8266–8273. http://doi.org/10.1158/0008-5472.CAN-05-4045
72. Massarweh, S., Romond, E., Black, E. P., Van Meter, E., Shelton, B., Kadamyan-Melkumian, V., … Elledge, R. 2014. A phase II study of combined fulvestrant and everolimus in patients with metastatic estrogen receptor (ER)-positive breast cancer after aromatase inhibitor (AI) failure. Breast Cancer Research and Treatment, 143(2), 325–332. http://doi.org/10.1007/s10549-013-2810-9
73. Maxwell, P. J., Longley, D. B., Latif, T., Boyer, J., Allen, W., Lynch, M., … Johnston, P. G. 2003. Identification of 5-fluorouracil-inducible target genes using cDNA microarray profiling. Cancer

45
Res., 63(15), 4602–4606. 74. Mendes-Pereira, A. M., Sims, D., Dexter, T., Fenwick, K., Assiotis, I., Kozarewa, I., … Ashworth,
A. 2012. Genome-wide functional screen identifies a compendium of genes affecting sensitivity to tamoxifen. Proceedings of the National Academy of Sciences, 109(8), 2730–2735. http://doi.org/10.1073/pnas.1018872108
75. Miyagishi, M., & Taira, K. 2002. U6 promoter-driven siRNAs with four uridine 3’ overhangs efficiently suppress targeted gene expression in mammalian cells. Nature Biotechnology, 20(5), 497–500. http://doi.org/10.1038/nbt0502-497
76. Moffat, J., Grueneberg, D. A., Yang, X., Kim, S. Y., Kloepfer, A. M., Hinkle, G., … Root, D. E. 2006. A Lentiviral RNAi Library for Human and Mouse Genes Applied to an Arrayed Viral High-Content Screen. Cell, 124(6), 1283–1298. http://doi.org/10.1016/j.cell.2006.01.040
77. Moffat, J., & Sabatini, D. M. 2006. Building mammalian signalling pathways with RNAi screens. Nature Reviews. Molecular Cell Biology, 7(3), 177–187. http://doi.org/10.1038/nrm1860
78. Mohr, S. & Perrimon, N. 2012. RNAi screening: New approaches, understandings and organisms. Wiley Interdisciplinary Ver RNA 3(2):145-148 doi: 10.1002/wrna.110
79. Mohr, S., Bakal, C., & Perrimon, N. 2010. Genomic screening with RNAi: results and challenges. Annual Review of Biochemistry, 79, 37–64. http://doi.org/10.1146/annurev-biochem-060408-092949
80. Mohr, S. E., Smith, J. a, Shamu, C. E., & Neumüller, R. a. 2014. RNAi screening comes of age : improved techniques and complementary approaches. Nature Publishing Group, 15(9), 591–600. http://doi.org/10.1038/nrm3860
81. Morgan-Fisher, M., Wewer, U. M., & Yoneda, A. 2013. Regulation of ROCK activity in cancer. The Journal of Histochemistry and Cytochemistry : Official Journal of the Histochemistry Society, 61(3), 185–98. http://doi.org/10.1369/0022155412470834
82. Morris, K. V, & Rossi, J. J. 2006. Lentiviral-mediated delivery of siRNAs for antiviral therapy. Gene Therapy, 13(6), 553–558. http://doi.org/10.1038/sj.gt.3302688
83. Musgrove, E. a, & Sutherland, R. L. 2009. Biological determinants of endocrine resistance in breast cancer. Nature Reviews Cancer, 9(9), 631–43. http://doi.org/10.1038/nrc2713
84. Ngo, V. N., Davis, R. E., Lamy, L., Yu, X., Zhao, H., Lenz, G., … Staudt, L. M. 2006. A loss-of-function RNA interference screen for molecular targets in cancer. Nature, 441(7089), 106–110. http://doi.org/10.1038/nature04687
85. Nilsson, S., Mäkelä, S., Treuter, E., Tujague, M., Thomsen, J., Andersson, G., … Gustafsson, J. a. (2001). Mechanisms of estrogen action. Physiological Reviews, 81(4), 1535–1565.
86. Osborne, C. K., Schiff, R. 2011. Mechanisms of Endocrine Resistance in Breast Cancer. Annu Ver Med, (3), 233–247. http://doi.org/10.1146/annurev-med-070909-182917.
87. Paddison, P. J., Silva, J. M., Conklin, D. S., Schlabach, M., Li, M., Aruleba, S., … Hannon, G. J. 2004. A resource for large-scale RNA-interference-based screens in mammals. Nature, 428(6981), 427–431. http://doi.org/10.1038/nature02370
88. Peleg Hasson, S., Rubinek, T., Ryvo, L., & Wolf, I. 2013. Endocrine Resistance in Breast Cancer: Focus on the Phosphatidylinositol 3-Kinase/Akt/Mammalian Target of Rapamycin Signaling Pathway. Breast Care, 8(4), 248–255. http://doi.org/10.1159/000354757
89. Perrimon, N., Ni, J. Q., & Perkins, L. 2010. In vivo RNAi: today and tomorrow. Cold Spring Harbor Perspectives in Biology, 2(8), 1–11. http://doi.org/10.1101/cshperspect.a003640
90. Possemato, R., Marks, K. M., Shaul, Y. D., Pacold, M. E., Kim, D., Birsoy, K., … Sabatini, D. M. 2011. Functional genomics reveal that the serine synthesis pathway is essential in breast cancer. Nature, 476(7360), 346–50. http://doi.org/10.1038/nature10350
91. Qiu, X., He, X., Huang, Q., Liu, X., Sun, G., Guo, J., Yuan, D., Yang, L., Ban, N., Fan, S., Tao, T., Wang, D. 2015. Overexpression of CCT8 and its significance for tumor cell proliferation, migration and invasion in glioma. Pathol Res Pract. Oct;211(10):717-25. doi: 10.1016/j.prp.2015.04.012.
92. Rajesh, K., Krishnamoorthy, J., Kazimierczak, U., Tenkerian, C., Papadakis, a I., Wang, S., … Koromilas, a E. 2015. Phosphorylation of the translation initiation factor eIF2α at serine 51 determines the cell fate decisions of Akt in response to oxidative stress. Cell Death & Disease, 6(1), e1591. http://doi.org/10.1038/cddis.2014.554
93. Rappa, F., Sciume, C.2, Lo Bello, M., Bavisotto, CC, Marino Gammazza, A., Barone, R., Campanella, C., David, S., Carini, F., Zarcone, F., Rizzuto, S., Lena, A., Tomasello, G., Uzzo, ML, Spatola, GF., Bonaventura, G., Leone, A., Gerbino, A., Cappello, F., Bucchieri, F., Zummo, G., Farina, F. 2014. Comparative analysis of Hsp10 and Hsp90 expression in healthy mucosa and adenocarcinoma of the large bowel. Anticancer Res. 2014 Aug;34(8):4153-9.
94. Release, P. 2013. Latest world cancer statistics Global cancer burden rises to 14 . 1 million new
46
cases in 2012 : Marked increase in breast cancers must be addressed. International Agency for Research on Cancer, World Health Organization, (December), 2012–2014. http://doi.org/223
95. Ribas, R., Pancholi, S., Guest, S. K., Marangoni, E., Gao, Q., Thuleau, A., … Martin, L.-A. 2015. AKT Antagonist AZD5363 Influences Estrogen Receptor Function in Endocrine-Resistant Breast Cancer and Synergizes with Fulvestrant (ICI182780) In Vivo. Molecular Cancer Therapeutics, 2035–2049. http://doi.org/10.1158/1535-7163.MCT-15-0143
96. Rivlin, N., Brosh, R., Oren, M., & Rotter, V. 2011. Mutations in the p53 Tumor Suppressor Gene: Important Milestones at the Various Steps of Tumorigenesis. Genes & Cancer, 2(4), 466–474. http://doi.org/10.1177/1947601911408889
97. Robertson, J. F. R., Osborne, C. K., Howell, A., Jones, S. E., Mauriac, L., Ellis, M., … Morris, C. 2003. Fulvestrant versus anastrozole for the treatment of advanced breast carcinoma in postmenopausal women: A prospective combined analysis of two multicenter trials. Cancer, 98(2), 229–238. http://doi.org/10.1002/cncr.11468
98. Schiff, R., & Osborne, C. K. 2005. Endocrinology and hormone therapy in breast cancer: new insight into estrogen receptor-alpha function and its implication for endocrine therapy resistance in breast cancer. Breast Cancer Research : BCR, 7(5), 205–11. http://doi.org/10.1186/bcr1287
99. Schlabach, M. R., Luo, J., Solimini, N. L., Hu, G., Xu, Q., Z, M., … Elledge, S. J. 2008. Cancer Proliferation Gene Discovery Through Funcitional Genomics. Science, 319(5863), 620–624. http://doi.org/10.1126/science.1149200.
100. Sigoillot, F. D., & King, R. W. (2011). Vigilance and Validation: Keys to Success in RNAi Screening. NIH Public Access, 6(1), 47–60. http://doi.org/10.1021/cb100358f.
101. Silva, J. M., Marran, K., Parker, J. S., Silva, J., Golding, M., Michael, R., … Chang, K. 2008. Profiling Essential Genesin Human Mammary Cells by Multiplex RNAi Screening, Science.319(5863), 617–620. http://doi.org/10.1126/1149185.
102. Sims, D., Mendes-Pereira, A. M., Frankum, J., Burgess, D., Cerone, M.-A., Lombardelli, C., … Lord, C. J. 2011. High-throughput RNA interference screening using pooled shRNA libraries and next generation sequencing. Genome Biology, 12(10), 1–13. http://doi.org/10.1186/gb-2011-12-10-r104
103. Stemke-hale, K., Gonzalez-angulo, A. M., Lluch, A., Neve, R. M., Kuo, W., Davies, M., … Gray, J. W. 2008. An Integrative Genomic and Proteomic Analysis of PI3KCA, PTEN and AKT Mutations in Breast Cancer. NIH Public Access, 68(15), 6084–6091. http://doi.org/10.1158/0008-5472.CAN-07-6854.An
104. Stone, A., & Musgrove, E. A. 2014. Endocrine therapy: Defining the path of least resistance. Breast Cancer Research, 16(3), 1–3. http://doi.org/10.1186/bcr3659
105. Têtu, B., Popa, I., Bairati, I., L’Esperance, S., Bachvarova, M., Plante, M., … Bachvarov, D. 2008. Immunohistochemical analysis of possible chemoresistance markers identified by micro-arrays on serous ovarian carcinomas. Modern Pathology, 21, 1002–1010.
106. Tokunaga, E., Kimura, Y., Mashino, K., Oki, E., Kataoka, A., Ohno, S., … Maehara, Y. 2006. Activation of PI3K/Akt signaling and hormone resistance in breast cancer. Breast Cancer (Tokyo, Japan), 13(2), 137–44. http://doi.org/10.2325/jbcs.13.137
107. Van Tine, B. A., Crowder, R. J., & Ellis, M. J. 2011. ER and PI3K independently modulate endocrine resistance in ER-positive breast cancer. Cancer Discovery, 1(4), 287–288. http://doi.org/10.1158/2159-8290.CD-11-0192
108. Ward, T., Jegg, A., Iorns, E. 2013. Next Generation Sequencing for High-Throughput RNA Interference Screens In Next Generation Sequencing in Cancer Research (W. Wu and H. Choudhry eds) pp. 287-300, Springer, New York. DOI 10.1007/978-1-4614-7645-0_14
109. Wei, PL., Huang, CY., Tai, CJ., Batzorig, U., Cheng, WL., Hunag, MT., Chang, YJ. 2015. Glucose-regulated protein 94 mediates metastasis by CCT8 and the JNK pathway in hepatocellular carcinoma. Tumour Biol. Dec 30.
110. Yang, S. Y., He, X. Y., & Schulz, H. 2005. Multiple functions of type 10 17β-hydroxysteroid dehydrogenase. Trends in Endocrinology and Metabolism, 16(4), 167–175. http://doi.org/10.1016/j.tem.2005.03.006
111. Yang W, Hosford SR, Dillon LM, Shee K, Liu SC, Bean JR, et al. 2016. Strategically timing inhibition of phosphatidylinositol 3-kinase to maximize therapeutic index in estrogen receptor alpha-positive, PIK3CA-mutant breast cancer. Clin Cancer Res
112. Zhang, L., Cui, J., Leonard, M., Nephew, K., Li, Y., & Zhang, X. 2013. Silencing MED1 Sensitizes Breast Cancer Cells to Pure Anti-Estrogen Fulvestrant In Vitro and In Vivo. PLoS ONE, 8(7), 1–11. http://doi.org/10.1371/journal.pone.0070641
113. Zilli, M., Grassadonia, A., Tinari, N., Di Giacobbe, A., Gildetti, S., Giampietro, J., … Iacobelli, S. 2009. Molecular mechanisms of endocrine resistance and their implication in the

47
therapy of breast cancer. Biochimica et Biophysica Acta, 1795(1), 62–81. http://doi.org/10.1016/j.bbcan.2008.08.003

48
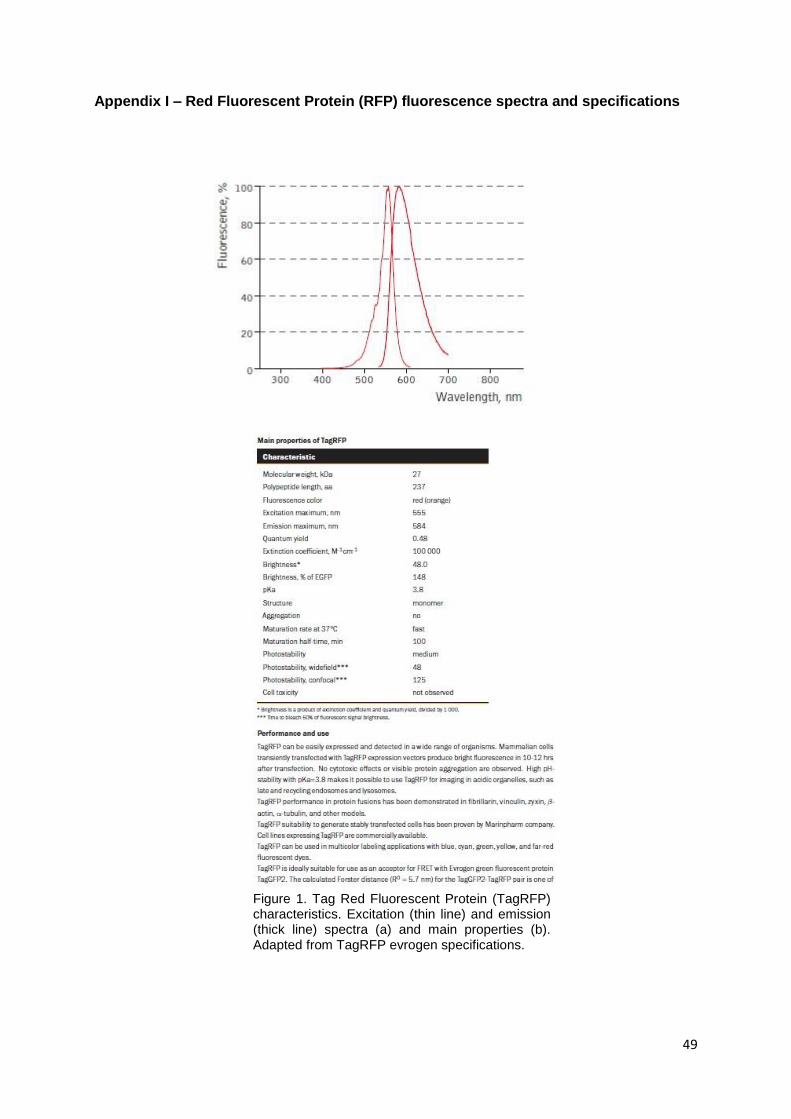
49
Appendix I – Red Fluorescent Protein (RFP) fluorescence spectra and specifications
Figure 1. Tag Red Fluorescent Protein (TagRFP) characteristics. Excitation (thin line) and emission (thick line) spectra (a) and main properties (b). Adapted from TagRFP evrogen specifications.

50
Appendix II – Indexing primers sequences from Cellecta
Ind1 AATGATACGGCGACCACCGAGAGGTTCAGAGACGTACAGTCCGAAA
Ind2 AATGATACGGCGACCACCGAGAGGTTCAGATTATTACAGTCCGAAA
Ind3 AATGATACGGCGACCACCGAGAGGTTCAGAAGTATACAGTCCGAAA
Ind4 AATGATACGGCGACCACCGAGAGGTTCAGACCGCTACAGTCCGAAA
Ind5 AATGATACGGCGACCACCGAGAGGTTCAGAAACCTACAGTCCGAAA
Ind6 AATGATACGGCGACCACCGAGAGGTTCAGATGTTTACAGTCCGAAA
Ind7 AATGATACGGCGACCACCGAGAGGTTCAGAATAATACAGTCCGAAA
Ind8 AATGATACGGCGACCACCGAGAGGTTCAGAGCGGTACAGTCCGAAA
Table 1. Indexing primers sequences used for identification of samples for next-generation sequencing step.

51
Appendix III – BCA assay (working range 20-2000 µg/mL)
Figure 2. Preparation of standards (A) and working reagent (B) in a working range between 20-2000 µg/mL for BCA protein assay. Adapted from Pierce BCA Protein Assay
kit (Thermo Fisher Scientific)

52
Appendix IV – BCA standard curves for different cell lines using Bovine Serum Albumin
(BSA) as a standard protein
y = 1,4727x + 0,2804R² = 0,9809
0,000
0,250
0,500
0,750
1,000
0 0,1 0,2 0,3 0,4 0,5
Ab
s
[protein] ug/uL
BCA LCC1 and LCC9
y = 1,2011x + 0,2611R² = 0,9985
0,000
0,250
0,500
0,750
1,000
0 0,1 0,2 0,3 0,4 0,5 0,6
Ab
s
[protein] ug/uL
BCA LCC1 and LCC9
Figure 3. BCA standard curve for LCC1 and LCC9 cell lines in the absence of fulvestrant by using Pierce BCA Protein Assay kit working range in appendix II. Protein concentration are based on standard protein BSA and plotted vs BSA absorbance at 560 nm.
Figure 4. BCA standard curve for LCC1 and LCC9 cell lines in the presence of fulvestrant by using Pierce BCA Protein Assay kit working range in appendix II. Protein concentration are based on standard protein BSA and plotted vs BSA absorbance at 560 nm.

53
y = 0,9972x + 0,1528R² = 0,9987
0,000
0,250
0,500
0,750
1,000
0 0,2 0,4 0,6 0,8 1
Ab
s
[protein] (µg/µL)
BCA MCF-7/FRs
y = 0,8953x + 0,1221R² = 0,9954
0,000
0,250
0,500
0,750
1,000
0 0,2 0,4 0,6 0,8 1
Ab
s
[protein] (µg/µL)
BCA T47-D
y = 1,1973x + 0,1489R² = 0,9985
0,000
0,200
0,400
0,600
0,800
1,000
0 0,2 0,4 0,6 0,8 1
Ab
s
[protein] (µg/µL)
BCA ZR75
Figure 5. BCA standard curve for MCF-7 and FRs cell lines in the absence and presence of fulvestrant by using Pierce BCA Protein Assay kit working range in appendix II. Protein concentration are based on standard protein BSA and plotted vs BSA absorbance at 560 nm.
Figure 6. BCA standard curve for T47-D cell lines in the absence and presence of fulvestrant by using Pierce BCA Protein Assay kit working range in appendix II. Protein concentration are based on standard protein BSA and plotted vs BSA absorbance at 560 nm.
Figure 7. BCA standard curve for ZR75 cell lines in the absence and presence of fulvestrant by using Pierce BCA Protein Assay kit working range in appendix II. Protein concentration are based on standard protein BSA and plotted vs BSA absorbance at 560 nm.

54
Appendix V – MOI vs % of transduced cells and titer formula calculation example
Figure 8. Multiplicity of infection (MOI) and respective % of transduced cells upon infection with viral particles. Titer formula calculation example based on Red Fluorescent Protein fluorescence is given by a titer chart plotting % of infected cells vs MOI. Adapted from Cellecta manual v5 and v7 (Cellecta)

55
Appendix VI – Lentiviral shRNA expression vector pRSI9-U6-(sh)-UbiC-TagRFP-2A-Puro
(HTS3 cassette)
Figure 9. pRSI9-U6-(sh)-HTS3-UbiC-TagRFP-2A-Puro-dW lentiviral shRNA expression vector. Constitution elements of lentiviral shRNA expression vector (a) and information regarding the size of the amplicon and the sequence of primers used in 1st, 2nd round of PCR and sequencing steps (b). Adapted from Cellecta manual (Cellecta)

56
Appendix VII – HSD17B10 and HSPE1 genes associated to important molecules related
with endocrine resistance evaluate by IPA
Figure 10. Network 2 (score probability of 12) associated to cell morphology, cellular assembly and organization and cellular development retrieved from IPA of candidate genes from shRNA library 1 screening. HSD17B10, HSPE1 and MBP molecules (depicted in green) are represented in this network along with AKT1, JUN, FOS, FYN, TNF and IGF1 (not coloured).

57
Appendix VIII – HSD17B10 expression in the absence and presence of fulvestrant in
LCC1 and LCC9 cells
Figure 11. Western-blot analysis of HSD17B10 protein expression in fulvestrant-sensitive (LCC1) and fulvestrant-resistant (LCC9) cell lines in the absence and presence of fulvestrant (+FULV). The western-blot results shown are representative of three independent experiments. β-actin was used as a loading control.
β-actin
HSD17B10
LCC1 LCC9 LCC1
(+FULV)
LCC9
(+FULV)