Embed Size (px)
Citation preview
GERENCIAMENTO HIERÁRQUICO DE REDES
VEICULARES

EWERTON MONTEIRO SALVADOR
GERENCIAMENTO HIERÁRQUICO DE REDES
VEICULARES
Tese apresentada ao Programa de Pós--Graduação em Ciência da Computação doInstituto de Ciências Exatas da Universi-dade Federal de Minas Gerais como re-quisito parcial para a obtenção do grau deDoutor em Ciência da Computação.
Orientador: José Marcos Silva NogueiraCoorientador: Daniel Fernandes Macedo
Belo Horizonte
Outubro de 2016

EWERTON MONTEIRO SALVADOR
HIERARCHICAL MANAGEMENT OF
VEHICULAR NETWORKS
Thesis presented to the Graduate Programin Computer Science of the UniversidadeFederal de Minas Gerais - Departamentode Ciência da Computação in partial ful-fillment of the requirements for the degreeof Doctor in Computer Science.
Advisor: José Marcos Silva NogueiraCo-Advisor: Daniel Fernandes Macedo
Belo Horizonte
October 2016
c© 2016, Ewerton Monteiro Salvador.Todos os direitos reservados.
Salvador, Ewerton Monteiro
S182h Hierarchical Management of Vehicular Networks /Ewerton Monteiro Salvador. — Belo Horizonte, 2016
xxv, 109 f. : il. ; 29cm
Tese (doutorado) — Universidade Federal de MinasGerais - Departamento de Ciência da Computação
Orientador: José Marcos Silva NogueiraCoorientador: Daniel Fernandes Macedo
1. Computação - Teses. 2. Vehicular ad hoc network.3. Redes de computadores - Administração.I. Orientador. II. Coorientador. III. Título.
CDU 519.6*22(043)


I dedicate this work to my fiancée, Geórgia Cordeiro Dantas, and to my family.
ix

Acknowledgments
Wow... what a long and incredible journey this doctoral course was! And along thisjourney I had the pleasure to meet many amazing people, who taught me and helpedme in many more ways than they would ever imagine.
Firstly I would like to thank God for watching over me during both good anddifficult times along my years of doctoral studies. I would be nothing without You, sothank You for making me who I am.
To my advisor, Professor José Marcos, thanks for the insane amount of lessonsI will carry with me for my entire life. Thanks for teaching me how to be a betterstudent, a better researcher, a better professor, and a better human being. Thankyou for teaching me the importance of taking care of myself as well as taking care ofeveryone around me.
I also thank my co-advisor, Professor Daniel Macedo, for his sincere dedicationin helping me to become a better researcher, for all the passionate conversations aboutthe directions to be followed along the doctoral research, and for being a great friendthat i can count on to be there for me. Whenever you need, you can count on me aswell.
To Geórgia, my fiancée and “academic journey partner”, thank you for all thesupport, all the inspiration and all the love. You bring light and meaning to my life,and I just can’t be grateful enough for that.
I also would like to thank my family, for always being rooting for my success,and for their unconditional support during my entire life. Mom, dad, Alisson, Eweline,Maiara, and Nick, thank you for being the best family any person would ever wish for.
To Professor Stephen Farrell, from Trinity College Dublin, thank you for sharingso much valuable knowledge with me, and thank you for taking care of me during theamazing time I had in this beautiful country called Ireland.
I would like to thank Professor Lisandro Granville for being a great friend andinspiration, helping me to overcome some of the most difficult obstacles I encounteredduring my academic life.
xi
To all the examiners of the final presentation of my thesis, thank you for acceptingour invitation and for being willing to enlight our research with your expertise.
To my friends Eduardo and Emanuelly, thank you for the good times together, forthe unvaluable support you guys gave to Georgia and me during our doctoral studies,and for being awesome. My thanks also goes to Moshe Moo and Guru Pancita forbeing such great pals!
To Virgil Almeida and his family, thank you for your kindness and friendship.Thank you for all the support you gave me whenever I needed, and know that I willbe there for you too whenever necessary.
To my friends from UFMG Alisson Rodrigues, Aloizio Silva, André Poersch,Cristiano Silva, Diego Da Hora, Erik de Britto, Fernando Teixeira, Jesse Leoni, JunioSalomé, Lucas Silva, Leandro Maia, Livia Almeida, Pablo Goulart, Rone Ilidio, ThiagoOliveira, Vinícius Fonseca, Vinícius Mota and Wendley Silva, thanks for the greatconversations, the valuable advices, and for the good moments together.
I would like to thank my friends Rodrigo and Ayla Rebouças for your friendship.It’s not long ago that we met for the first time, but ever since, you guys gave menothing but tons of love and support, and I will always be grateful for that.
To all the many colleagues I met along my stay at UFMG, thank you very muchfor all the shared moments: all the laughs, all the study sessions, and even all thecollective panic attacks! I also learned a lot from every one of you, and I hope we canmeet again as many times as possible.
To the Programa de Pós-Graduação em Ciência da Computação (PPGCC) ofUFMG and all its staff, thank you for the great support and for your patience. I’mvery lucky to count with the support of such a professional and dedicated graduateprogramme.
And last bot not least, I would like to thank CAPES, CNPq, FAPEMIG, andCEMIG for their crucial financial support to my doctoral research. Thanks for makingit possible for me to pursuit the dream of becoming a doctor in doing what I love todo.
Thank you. Thank you. Thank you.
xii

“We can only see a short distance ahead, but we can see plenty there that needs to bedone.”
(Alan Turing)
xiii

Resumo
Redes Ad Hoc Veiculares (VANETs) são redes móveis que podem se estender porgrandes áreas e cujos nós possuem mobilidade intensa. Essas características levam afrequentes atrasos de comunicação e desconexões de enlaces. Uma solução para osproblemas de conectividade de VANETs é o emprego do paradigma de Rede Tolerantea Atrasos e Desconexões (Delay-Tolerant Network, ou simplesmente DTN), resultandona criação de VDTNs (Vehicular Delay-Tolerant Networks). Contudo, as desconexõesfrequentes e as restrições relacionadas a atraso e confiabilidade de certas aplicações paraVDTN impedem o uso tanto de arquiteturas de gerenciamento convencionais quantodas arquiteturas baseadas em DTN. Por conta disso, se faz necessário o desenvolvimentode uma solução de gerenciamento que seja capaz de reagir de forma mais rápida e eficazaos problemas que podem ocorrer em uma VDTN. Esta tese apresenta uma arquiteturade gerenciamento hierárquico (HiErarchical MANagement - HE-MAN) para VDTNs.Essa arquitetura implementa uma topologia hierárquica de gerenciamento, onde umgerente global da rede (Top-Level Manager, ou TLM) delega a gerentes intermediários(Mid-Level Managers, ou MLMs) o gerenciamento de grupos de nós interconectados.A arquitetura também é composta por nós agentes e protocolos que coordenam trocasde mensagens e a organização lógica da topologia de gerenciamento. Para construir atopologia hierárquica, foram propostos algoritmos para agrupamento de nós da rede,monitoramento local e remoto, e configuração local e remota. Resultados de simu-lações mostram que a arquitetura proposta organiza com sucesso a VDTN em gruposrelativamente estáveis, resultando em um gerenciamento dos nós da VDTN de formamais eficiente. Além disso, os algoritmos de monitoramento e configuração melhorama confiabilidade e o tempo de resposta das tarefas de gerenciamento.
Palavras-chave: Gerenciamento de Redes, Redes Tolerantes a Atrasos e Desconexões,Redes Veiculares Tolerantes a Atrasos e Desconexões.
xv

Abstract
Vehicular Ad Hoc Networks (VANETs) are mobile networks that extend over vast areasand have intense node mobility. These characteristics lead to frequent communicationdelays and link disruptions. A solution to the connectivity problems of VANETs isto employ the Delay Tolerant Network (DTN) paradigm, resulting in the creation ofVehicular Delay-Tolerant Networks (VDTNs). However, the frequent disruptions aswell as the delay and reliability constraints of certain VDTN applications hinder theemployment of both conventional and DTN-based management architectures. Becauseof this, the development of a management solution able to react quicker and morereliably to problems that can occur in a VDTN becomes necessary. This thesis presentsthe HiErarchical MANagement (HE-MAN) architecture for VDTNs. This architectureimplements a hierarchical management topology, where a Top-Level Manager (TLM)delegates to Mid-Level Managers (MLMs) the management of clusters of interconnectednodes. The architecture is also composed of agents and protocols that coordinatemessage exchanges and the logical organization of the management topology. In orderto build the hierarchical topology, algorithms were designed for network clustering,local and remote monitoring, and local and remote configuration. Simulations resultsshow that the proposed architecture successfully organizes the VDTN in relativelystable clusters, leading to a more efficient management of VDTN nodes. Moreover, theproposed monitoring and configuration algorithms successfully improve the reliabilityand response time of the management tasks.
Palavras-chave: Network Management, Delay-Tolerant Network, Vehicular Delay-Tolerant Network.
xvii

List of Figures
2.1 Network management approaches . . . . . . . . . . . . . . . . . . . . . . . 92.2 Example of the SNNP network management architecture [Stallings, 1998] . 112.3 Example of the topology of a DTN through time . . . . . . . . . . . . . . 132.4 Bundle Layer in an example of DTN communication . . . . . . . . . . . . 152.5 Example of a vehicular network . . . . . . . . . . . . . . . . . . . . . . . . 19
4.1 Hierarchical monitoring in a VDTN . . . . . . . . . . . . . . . . . . . . . . 374.2 Main components of the HE-MAN architecture . . . . . . . . . . . . . . . 394.3 Behavior of isolated nodes according to the received type of beacon message 434.4 Behavior of MLMs according to the received type of beacon message . . . 454.5 Behavior of agent nodes according to the received type of beacon message . 464.6 Messages exchange in the publisher-subscriber monitoring . . . . . . . . . 474.7 Transmission Status Propagation System supported by HE-MAN . . . . . 53
5.1 Snapshot of the buses (red dots) and bus stops (black dots) in the traffictrace [Doering et al., 2010]. . . . . . . . . . . . . . . . . . . . . . . . . . . 61
5.2 Cumulative distribution function (CDF) of contact duration within thetrace files . . . . . . . . . . . . . . . . . . . . . . . . . . . . . . . . . . . . 62
6.1 Average time that nodes spend connected to clusters . . . . . . . . . . . . 726.2 Average lifetime of a cluster . . . . . . . . . . . . . . . . . . . . . . . . . . 736.3 Average number of clusters formed during the experiments . . . . . . . . . 746.4 Average size of clusters formed during the experiments . . . . . . . . . . . 746.5 Number of cluster-head transferences per cluster . . . . . . . . . . . . . . . 756.6 Notification delay in local communication . . . . . . . . . . . . . . . . . . 766.7 Notification delivery ratio in local communication . . . . . . . . . . . . . . 766.8 Average time that nodes spend connected to clusters . . . . . . . . . . . . 786.9 Average lifetime of a cluster . . . . . . . . . . . . . . . . . . . . . . . . . . 796.10 Average number of clusters formed during the experiments . . . . . . . . . 79
xix
6.11 Average size of clusters formed during the experiments . . . . . . . . . . . 806.12 Number of CH transferences per cluster . . . . . . . . . . . . . . . . . . . 816.13 Notification delay in local communication . . . . . . . . . . . . . . . . . . 816.14 Notification delivery ratio in local communication . . . . . . . . . . . . . . 826.15 Average local notification delay with different buffer sizes . . . . . . . . . . 846.16 Remote reports average delay with different buffer sizes . . . . . . . . . . . 846.17 Fault notification delivery ratio with different buffer sizes . . . . . . . . . . 856.18 Remote reports delivery ratio with different buffer sizes . . . . . . . . . . . 856.19 Fault notification average delay . . . . . . . . . . . . . . . . . . . . . . . . 866.20 Remote reports average delay . . . . . . . . . . . . . . . . . . . . . . . . . 876.21 Fault notification delivery . . . . . . . . . . . . . . . . . . . . . . . . . . . 886.22 Remote reports delivery ratio . . . . . . . . . . . . . . . . . . . . . . . . . 886.23 Fault notification average delay . . . . . . . . . . . . . . . . . . . . . . . . 896.24 Remote reports average delay . . . . . . . . . . . . . . . . . . . . . . . . . 896.25 Fault notification delivery . . . . . . . . . . . . . . . . . . . . . . . . . . . 906.26 Remote reports delivery ratio . . . . . . . . . . . . . . . . . . . . . . . . . 916.27 Delivery delay for configuration messages . . . . . . . . . . . . . . . . . . . 926.28 Delivery probability for configuration messages . . . . . . . . . . . . . . . . 92
xx
List of Tables
2.1 Vehicular networks applications’ classes . . . . . . . . . . . . . . . . . . . . 18
3.1 Main DTN management solutions . . . . . . . . . . . . . . . . . . . . . . . 273.2 Main clustering solutions for vehicular networks . . . . . . . . . . . . . . . 32
5.1 General parameters of the simulations . . . . . . . . . . . . . . . . . . . . 635.2 Simulation parameters for the VDTN clustering techniques . . . . . . . . . 665.3 Simulation parameters used for the monitoring evaluation . . . . . . . . . 695.4 Simulation parameters used for evaluating VDTN configuration techniques 69
xxi

Contents
Acknowledgments xi
Resumo xv
Abstract xvii
List of Figures xix
List of Tables xxi
1 Introduction 11.1 Problem Definition and Objectives . . . . . . . . . . . . . . . . . . . . 41.2 Research Methodology . . . . . . . . . . . . . . . . . . . . . . . . . . . 41.3 Thesis Contributions . . . . . . . . . . . . . . . . . . . . . . . . . . . . 51.4 Thesis Organization . . . . . . . . . . . . . . . . . . . . . . . . . . . . . 5
2 Basic Concepts and the VDTN Management Problem 72.1 Network Management Overview . . . . . . . . . . . . . . . . . . . . . . 7
2.1.1 Management Approaches . . . . . . . . . . . . . . . . . . . . . . 82.1.2 SNMP: A Traditional Management Architecture . . . . . . . . . 10
2.2 Delay-Tolerant Network . . . . . . . . . . . . . . . . . . . . . . . . . . 112.2.1 Contacts in DTN . . . . . . . . . . . . . . . . . . . . . . . . . . 122.2.2 DTN Architecture and Bundle Protocol . . . . . . . . . . . . . . 142.2.3 DTN Management . . . . . . . . . . . . . . . . . . . . . . . . . 15
2.3 Vehicular Networks . . . . . . . . . . . . . . . . . . . . . . . . . . . . . 162.3.1 Application Classes . . . . . . . . . . . . . . . . . . . . . . . . . 172.3.2 Architecture and Protocols . . . . . . . . . . . . . . . . . . . . . 182.3.3 Vehicular Delay-Tolerant Networks . . . . . . . . . . . . . . . . 20
2.4 The VDTN Management Problem . . . . . . . . . . . . . . . . . . . . . 20
xxiii
2.4.1 Network Model . . . . . . . . . . . . . . . . . . . . . . . . . . . 212.5 Chapter Conclusions . . . . . . . . . . . . . . . . . . . . . . . . . . . . 22
3 Related Work 233.1 Methodology . . . . . . . . . . . . . . . . . . . . . . . . . . . . . . . . 233.2 Delay-Tolerant Network Management . . . . . . . . . . . . . . . . . . . 243.3 Vehicular Network Management . . . . . . . . . . . . . . . . . . . . . . 273.4 Vehicular Network Clustering Algorithms . . . . . . . . . . . . . . . . . 283.5 Chapter Conclusions . . . . . . . . . . . . . . . . . . . . . . . . . . . . 33
4 The HE-MAN Architecture 354.1 HiErarchical MANagement (HE-MAN) Architecture for Vehicular
Delay-Tolerant Networks . . . . . . . . . . . . . . . . . . . . . . . . . . 364.2 Clustering Algorithm . . . . . . . . . . . . . . . . . . . . . . . . . . . . 39
4.2.1 General description of the algorithm . . . . . . . . . . . . . . . 404.2.2 Algorithms’ details . . . . . . . . . . . . . . . . . . . . . . . . . 41
4.3 Monitoring Support . . . . . . . . . . . . . . . . . . . . . . . . . . . . . 464.3.1 Publisher/Subscriber Model . . . . . . . . . . . . . . . . . . . . 464.3.2 Local and Remote Monitoring . . . . . . . . . . . . . . . . . . . 47
4.4 Configuration Support . . . . . . . . . . . . . . . . . . . . . . . . . . . 484.4.1 Local Configuration . . . . . . . . . . . . . . . . . . . . . . . . . 494.4.2 Remote Configuration . . . . . . . . . . . . . . . . . . . . . . . 49
4.5 Case Studies . . . . . . . . . . . . . . . . . . . . . . . . . . . . . . . . . 514.5.1 Case Study One: Platoon of Autonomous Vehicles . . . . . . . . 514.5.2 Case Study Two: Bus Fleet Monitoring . . . . . . . . . . . . . . 524.5.3 Case Study Three: Transmission Status Propagation System . . 53
4.6 Chapter Conclusions . . . . . . . . . . . . . . . . . . . . . . . . . . . . 54
5 Evaluation: Methodology and Preparation 575.1 Methodology . . . . . . . . . . . . . . . . . . . . . . . . . . . . . . . . 575.2 Objectives . . . . . . . . . . . . . . . . . . . . . . . . . . . . . . . . . . 58
5.2.1 Objectives for the clustering algorithm . . . . . . . . . . . . . . 585.2.2 Objectives for HE-MAN monitoring . . . . . . . . . . . . . . . . 585.2.3 Objectives for HE-MAN configuration . . . . . . . . . . . . . . 59
5.3 Metrics . . . . . . . . . . . . . . . . . . . . . . . . . . . . . . . . . . . . 595.4 Mobility trace selection . . . . . . . . . . . . . . . . . . . . . . . . . . . 605.5 Simulation environment and configuration . . . . . . . . . . . . . . . . 63
5.5.1 Clustering algorithm . . . . . . . . . . . . . . . . . . . . . . . . 65
xxiv
5.5.2 HE-MAN monitoring . . . . . . . . . . . . . . . . . . . . . . . . 675.5.3 HE-MAN configuration . . . . . . . . . . . . . . . . . . . . . . . 68
5.6 Chapter Conclusions . . . . . . . . . . . . . . . . . . . . . . . . . . . . 69
6 Evaluation: Results and Analyses 716.1 Clustering algorithm evaluation . . . . . . . . . . . . . . . . . . . . . . 71
6.1.1 Tunning of the configurable parameters in HE-MAN’s clusteringalgorithm . . . . . . . . . . . . . . . . . . . . . . . . . . . . . . 71
6.1.2 HE-MAN’s clustering algorithm performance analysis . . . . . . 776.2 Monitoring solution evaluation . . . . . . . . . . . . . . . . . . . . . . . 82
6.2.1 Analysis of the impact of the size of buffer in HE-MAN Monitoring 836.2.2 Performance analysis of HE-MAN Monitoring . . . . . . . . . . 866.2.3 Analysis of the impact of DTN routing algorithms over VDTN
monitoring . . . . . . . . . . . . . . . . . . . . . . . . . . . . . . 876.3 Configuration solution evaluation . . . . . . . . . . . . . . . . . . . . . 906.4 Chapter Conclusions . . . . . . . . . . . . . . . . . . . . . . . . . . . . 92
7 Conclusions and Future Work 957.1 Limitations . . . . . . . . . . . . . . . . . . . . . . . . . . . . . . . . . 977.2 On the Applicability of the Proposals on Different Scenarios . . . . . . 977.3 Future Work . . . . . . . . . . . . . . . . . . . . . . . . . . . . . . . . . 987.4 Publications . . . . . . . . . . . . . . . . . . . . . . . . . . . . . . . . . 99
Bibliography 101
xxv

Chapter 1
Introduction
Various cities around the world experience increase in the number of vehicles travellingon their roads, arising concerns on vehicular transportation safety and efficiency, amongothers. In order to overcome a number of limitations concerning vehicular travellingin general, such as the vulnerability caused by the human response time or drivererror, computational vehicular systems are being developed [Barba et al., 2012]. Thesesystems demand inter-vehicular communication in order to allow vehicles to exchangedata for supporting different types of applications, such as safety, transport efficiency orinformation/entertainment applications [Hartenstein and Laberteaux, 2008]. VehicularAd Hoc Networks (VANETs) are designed to provide communication among vehiclesconnected to other vehicles and to fixed equipment along roads, constituting an ad hocnetwork [Karagiannis et al., 2011].
VANET are becoming increasingly popular. Some countries are already con-ducting efforts to develop their own VANET systems, aiming to approach their spe-cific needs. For instance, the National Highway Traffic Safety Administration, in theUnited States, released an advance notice of proposed rulemaking (ANPRM) proposinga Federal Motor Vehicle Safety Standard (FMVSS). The proposed standard requiresvehicle-to-vehicle (V2V) communication capability for light vehicles and the creation ofminimum performance requirements for V2V devices and messages, in order to primar-ily support advanced safety applications [National Highway Traffic Safety Administra-tion, 2014]. Another example can be found in Brazil, where the ANTT (the BrazilianNational Agency of Land Transports) intends to monitor all the land transports un-der the responsibility of this agency, automatically keeping record of commercial data,like passengers and travels, in order to improve the quality and reliability of infor-mation within the passenger transportation sector [Agência Nacional de TransportesTerrestres, 2014]. Monitoring parameters on ANTT’s system include alarms of vehicle
1
2 Chapter 1. Introduction
breakdowns, the number of passengers on-board and the duration of mandatory driverbreaks during long trips.
Traditional wireless networking approaches should not be effective for implement-ing VANETs, since vehicular networks suffer from frequent topology changes and con-stant node disconnection. This occurs because of the high speed and mobility of ve-hicles, together with the fact that VANETs commonly extend themselves over vastareas, which may lead to partitioning of the network. While the usage of mobile in-ternet services (e.g., 3G/4G, GPRS, etc.) is increasingly growing and is an alternativefor dealing with the mobility and the size of VANETs, service outages will still happenfrom time to time, and it is unrealistic to assume universally consistent coverage of suchservices in large and/or underdeveloped countries as well as in challenging areas (e.g.,mountains, deserts, forests, etc.). Thus, a solution that is able to cope with partition-ing in vehicular networks will always be superior to a solution that is not [Crowcroftet al., 2008]. Delay Tolerant Network (DTN) is a more suitable approach for the con-nectivity problem in VANETs, since it enables communications in environments withfrequent disconnections and long transmission delays through store-carry-forward mes-sage switching. A VANET employing DTN protocols is usually referred as VehicularDelay-Tolerant Network (VDTN) [Pereira et al., 2012].
Just like any production network, VDTN needs to be managed. Companies andinstitutions that own fleets of vehicles would benefit from a solution for monitoringand configuring not only the devices and services responsible for V2V and vehicle-to-infrastructure (V2I) communication, but also elements of vehicles that should bemonitored - such as engines, tires, fuel consumption, etc. Moreover, traffic administra-tion agencies can receive alarms from traffic management systems installed in the cars,in order to detect traffic jams and other types of road incidents in real-time. Finally,vehicle manufacturers can employ vehicles monitoring using the VDTN communicationcapabilities, aiming to ensure the proper effectiveness and performance of the vehicles’parts.
Network management techniques are needed in VDTNs for keeping the networkoperational and performing as intended. The task of managing a VDTN is highly nec-essary due to the high dynamicity of this type of network, together with the existenceof critical systems that aim to prevent road accidents and improve traffic efficiency,among other features. These characteristics lead to the existence of two groups ofsystems (software and/or hardware) in a VDTN: delay-sensitive systems and non-delay-sensitive systems. A management solution for VDTNs must provide the meansfor both types of systems to be managed. Unfortunately it is unlikely that tradi-tional management solutions will work properly in VDTNs. These solutions are able
3
to manage delay-sensitive systems, but they assume permanent existence of end-to-end paths between any pair of nodes and communication delays that are relatively low.However, these assumptions are not always met in VDTNs. As an example of thisproblem, most of current production networks use the Simple Network ManagementProtocol (SNMP) for constantly polling devices and services [Hussain and Gurkan,2011]. This way of monitoring a network is almost impossible to be accomplished in aVDTN, since the long delays and constant disconnections would make it unlikely fora manager to send/receive polling messages in a regular basis. Issuing configurationcommands to a vehicle node in a VDTN is also problematic using current networkmanagement technologies, because there is a good chance of the message arriving toolate in its destination, which might compromise the validity of the issued configuration,or the command not arriving at all. Currently one can find a relatively small numberof works in the literature introducing architecture proposals for the management ofDTNs. Moreover, the vast majority of these proposals are either work in progress orfocused on the management of other types of DTN other than VDTNs.
Architectures conceived for other types of DTN (e.g., deep-space DTN) are alsonot suitable for many monitoring needs of VDTNs, since a number of applications,such as the safety-related applications, require management operations with particularcharacteristics such as very strict delay constraints in order to ensure timely responsefor detected problems. For instance, the intersection collision warning applicationdeal with messages being issued by neighboring vehicules every 100ms [Papadimitratoset al., 2009]. An eventual fault in such application must be detected and dealt with ina matter of milisseconds, or a few seconds at most. Not coping with this delay con-straint may lead to road accidents caused, among other things, by an untreated faultin the intersection collision warning application. Therefore, there are considerable dif-ferences between a management architecture for DTN and a management architecturefor VDTN.
One way to accomplish the management of delay-sensitive systems in VDTNsis to establish managers within every “island” composed of connected nodes. Theseestablished managers in connected groups would be subordinate to a superior managerin the network, forming a hierarchy of managers. Thanks to the low latency of thecommunication within connected groups, the established managers are able to suc-cessfully monitor and configure delay-sensitive systems, as it will be further explainedalong this thesis. It is important to notice that while other types of network may sharecharacteristics similar to the ones found in VDTNs, such as intermitent connectivityand the existence of delay-sensitive systems, this thesis will focus on the problem ofmanaging vehicular delay-tolerant networks.
4 Chapter 1. Introduction
1.1 Problem Definition and Objectives
This thesis presents an investigation on the management of Vehicular Delay-TolerantNetworks. The research question we aim to answer with this thesis is the following: Howcan one effectively manage Vehicular Delay-Tolerant Networks? The main objective ofthis PhD research can be stated as “to design a set of models and algorithms to manageVehicular Delay-Tolerant Ad Hoc Networks (VDTNs)”. Moreover, we formulate thefollowing specific objectives for our research:
1. To review the literature regarding the management of DTNs and vehicular net-works;
2. To formalize the problem of VDTN management;
3. To design an architecture that manages VDTNs;
4. To develop techniques for monitoring devices and services;
5. To develop techniques for configuring devices and services;
6. To evaluate the effectiveness and performance of the presented proposals.
1.2 Research Methodology
The research presented in this thesis was divided into four major phases, describedbelow:
1. Study of the literature: the first phase comprehended the study of the lit-erature regarding Network Management, Delay-Tolerant Networks (DTNs) andVehicular Ad Hoc Networks (VANETs), in order to acquire the necessary knowl-edge for conducting the other steps of the research;
2. Problem definition and specification: after that, an investigation on themanagement of Vehicular Delay-Tolerant Networks (VDTNs) was carried out, inorder to devise a more formal specification of the problem to be approached;
3. Design: the next phase was the design of an architecture and protocols for themanagement of VDTNs;
4. Evaluation: finally, there was an implementation and evaluation phase, wherethe designed proposals were materialized in the form of simulations in order tovalidate our proposals.
1.3. Thesis Contributions 5
1.3 Thesis Contributions
In this section the main contributions of this thesis are presented.
1. Literature review and analysis of the VDTN management problem: thethesis presents an overview of the VDTN management problem, highlighting thecurrent open research questions. In the light of this review, a VDTN hierarchicalmanagement model is defined, which describes the most important challengespertaining the VDTN management problem;
2. A new managament architecture for VDTNs: a new management archi-tecture that provides monitoring and configuration solutions for VDTNs;
3. A set of new algorithms for hierarchically organizing the managementtopology in a VDTN: the organization of the VDTN management topology ina hierarchical structure is a key requirement for the remainder of the proposalsdescribed in this thesis. Because of this, a set of algorithms was designed fororganizing a VDTN in connected groups;
4. New monitoring and configuration techniques: techniques are proposed toapproach the main needs of VDTNs concerning monitoring and configuration, inorder to allow near real-time management as well as to improve the reliability ofremote management tasks in VDTNs.
1.4 Thesis Organization
This thesis is organized as the following. Chapter 1 provides an introduction to thetheme of this thesis, stating the main motivations behind this doctorate work anddefining the objectives, methodology and contributions of the research. Chapter 2presents a set of basic concepts and definitions regarding Network Management ingeneral, Delay-Tolerant Networking, and Vehicular Delay-Tolerant Networks. At theend of the Chapter a more formal definition of the VDTN management problem ispresented. Chapter 3 presents a review of the literature concerning the main topicsrelated to this thesis, namely Delay-Tolerant Network management, Vehicular Networkmanagement and Clustering algorithms. The proposal of a hierarchical architecture forVDTN management is presented in Chapter 4. The chapter also describes algorithmsfor clustering, monitoring and configuration in VDTNs that are part of the proposedarchitecture. Chapter 5 provides a description of the simulations used in the evaluationof the algorithms for clustering, monitoring and configuration in VDTNs. The results
6 Chapter 1. Introduction
obtained through the simulations are presented and analyzed in Chapter 6. Finally,Chapter 7 concludes this thesis presenting the main conclusions of this research, adiscussion of its limitations, and possible applications outside the VDTN scenario. Italso presents comments on the publications resulted from this work, and future work.
Chapter 2
Basic Concepts and the VDTNManagement Problem
This chapter reviews basic concepts of this thesis. At the end of the chapter, a modelformalizing the main aspects of the Vehicular Delay-Tolerant Network considered inthis doctorate research is proposed and discussed.
2.1 Network Management Overview
A typical computer network is composed of a series of complex hardware and softwarecomponents interacting with each other through messages. Devices and software maymalfunction, users might cause errors (intentionally or not), links might suffer interfer-ence from the external environment, among a number of other things that can go wrongand may interrupt the normal functioning of a network. As a network grows larger,the probability of these problems happening also increases, because of the growth ofthe number of elements involved in the communication process.
Network management refers to the activities, methods, procedures, and tools re-lated to the operation, administration, maintenance, and provisioning of networkedsystems [Clemm, 2006]. In order to do so, management solutions employ a set of piecesof hardware and software to help network administrators to control the network. Net-work management tools help the management by relieving the network administratorof dealing with complex tasks, such as accessing network nodes one by one for updatingspecific configuration parameters, dealing with vendor specific hardware/software func-tionalities or manually aggregating large sets of data in order to determine the causeof a problem. Nowadays network management plays a crucial economic role, since to-
7
8 Chapter 2. Basic Concepts and the VDTN Management Problem
day’s business applications depend on reliable, secure, and well-performing networkedcomputer infrastructures [Ding, 2009].
2.1.1 Management Approaches
The placement of management software and hardware can be done in different ways,according to different network management approaches. Such approaches influencethe flow of communication in the management system. Because of this, managementapproaches have to be carefully chosen, considering the particularities of each type ofnetwork.
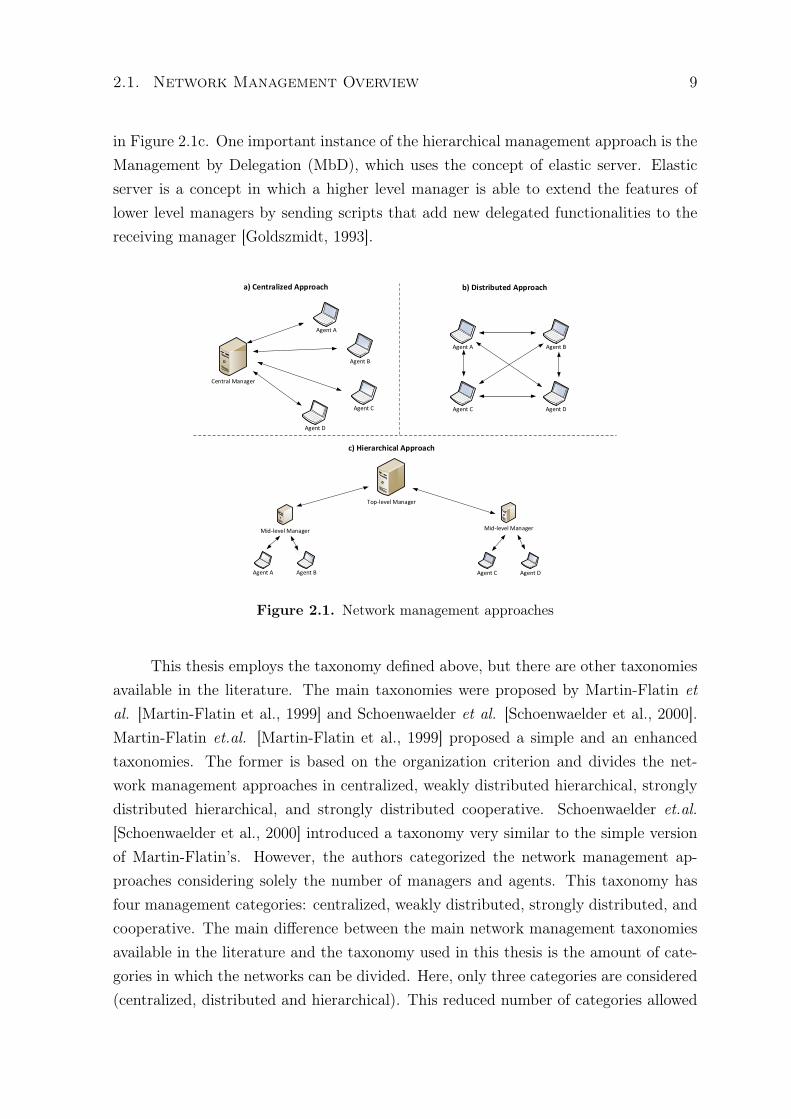
Traditional network management solutions, such as the SNMP architecture, use acentralized approach. In other words, the management station is the sole responsiblefor managing all the other nodes in the network. The centralized management approachis illustrated in Figure 2.1a. One advantage of this approach is the convenience providedby the centralization of the data collected from the agents in a single network entity,which perform functions based on a view of the whole network. On the other hand,a central, unique point acting as the sole network manager allows the existence ofa single point of failure in the management architecture, which means that if thenetwork manager fails for some reason, the entire network’s management system wouldbe inoperative. Moreover, the centralized approach cannot scale easily, since a highnumber of agents communicating with a single management station can lead to themanagement station not being able to handle all the necessary communication withthe agents.
The distributed approach, illustrated in Figure 2.1b, is another way to organizethe network management elements, where multiple managers communicate and coop-erate with each other in a peer-system [Kahani and Beadle, 1997]. In this approachit is possible to have multiple managers, or even make every node act as both agentand manager, forming a fully-distributed management. The main advantage of thisapproach is the potential increase of the reliability, robustness and performance of themanagement system due to the redundancy provided by the multiple managers spreadover the network. However, this type of management requires complex algorithms tocoordinate the managers. This might increase the overhead of the management solutionand make the design of new management applications more complex.
A middle-term solution is the hierarchical approach, which involves the exis-tence of multiple managers hierarchically organized, using the concepts of “Managers ofManagers” (MOM) [Kahani and Beadle, 1997]. In this approach, a manager in a higherlevel manages the managers that are in the lower levels of the hierarchy, as illustrated
2.1. Network Management Overview 9
in Figure 2.1c. One important instance of the hierarchical management approach is theManagement by Delegation (MbD), which uses the concept of elastic server. Elasticserver is a concept in which a higher level manager is able to extend the features oflower level managers by sending scripts that add new delegated functionalities to thereceiving manager [Goldszmidt, 1993].
Central Manager
Agent A
Agent B
Agent C
Agent D
Top-level Manager
Mid-level Manager Mid-level Manager
Agent A Agent B Agent C Agent D
Agent A
Agent C
Agent B
Agent D
a) Centralized Approach b) Distributed Approach
c) Hierarchical Approach
Figure 2.1. Network management approaches
This thesis employs the taxonomy defined above, but there are other taxonomiesavailable in the literature. The main taxonomies were proposed by Martin-Flatin etal. [Martin-Flatin et al., 1999] and Schoenwaelder et al. [Schoenwaelder et al., 2000].Martin-Flatin et.al. [Martin-Flatin et al., 1999] proposed a simple and an enhancedtaxonomies. The former is based on the organization criterion and divides the net-work management approaches in centralized, weakly distributed hierarchical, stronglydistributed hierarchical, and strongly distributed cooperative. Schoenwaelder et.al.[Schoenwaelder et al., 2000] introduced a taxonomy very similar to the simple versionof Martin-Flatin’s. However, the authors categorized the network management ap-proaches considering solely the number of managers and agents. This taxonomy hasfour management categories: centralized, weakly distributed, strongly distributed, andcooperative. The main difference between the main network management taxonomiesavailable in the literature and the taxonomy used in this thesis is the amount of cate-gories in which the networks can be divided. Here, only three categories are considered(centralized, distributed and hierarchical). This reduced number of categories allowed
10 Chapter 2. Basic Concepts and the VDTN Management Problem
a simple yet effective exploration of how each category would suit VDTN management.Taxonomies with a higher number of categories will be more useful in future investiga-tions, in order to fine tune the identification of management approaches that are viablefor VDTNs.
2.1.2 SNMP: A Traditional Management Architecture
The current de facto standard for TCP/IP network management is the Simple NetworkManagement Protocol (SNMP) [Cerroni et al., 2015]. SNMP is a set of network man-agement specifications created more than 25 years ago in the RFC 1157 [Case et al.,1990], which includes a protocol, data structures, and associated concepts [Stallings,1998]. The concepts and the network organization popularized by SNMP are stillwidely used nowadays.
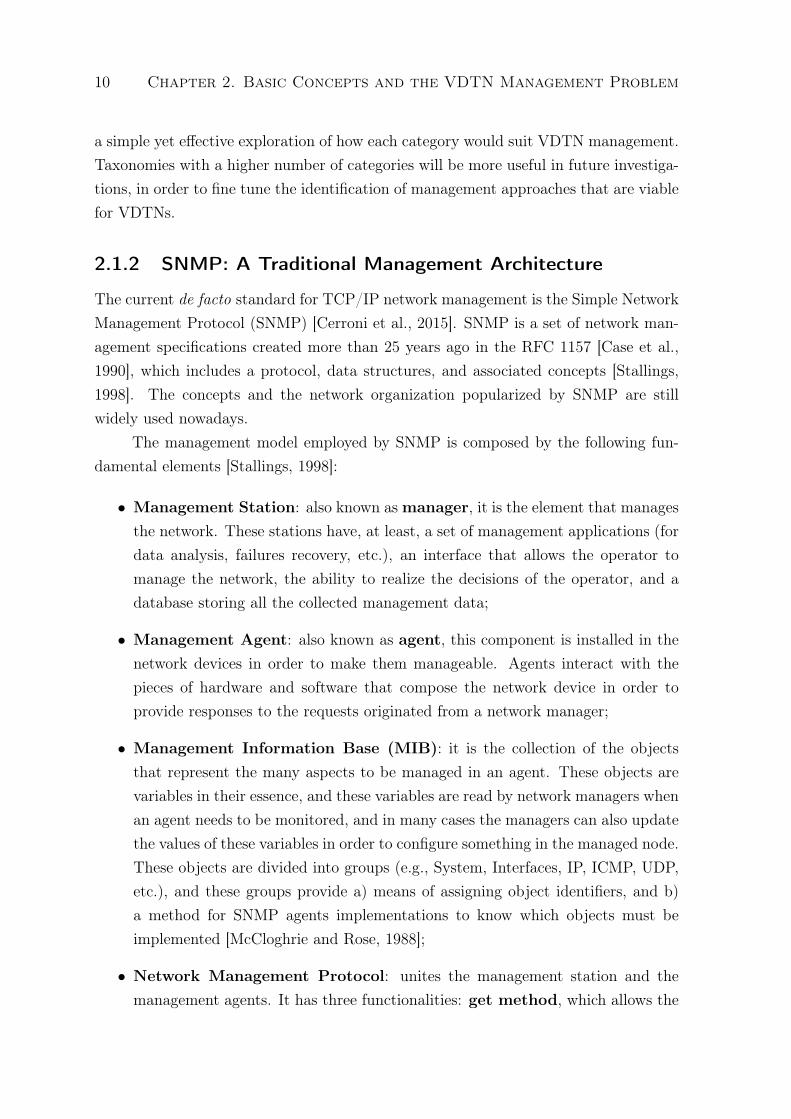
The management model employed by SNMP is composed by the following fun-damental elements [Stallings, 1998]:
• Management Station: also known asmanager, it is the element that managesthe network. These stations have, at least, a set of management applications (fordata analysis, failures recovery, etc.), an interface that allows the operator tomanage the network, the ability to realize the decisions of the operator, and adatabase storing all the collected management data;
• Management Agent: also known as agent, this component is installed in thenetwork devices in order to make them manageable. Agents interact with thepieces of hardware and software that compose the network device in order toprovide responses to the requests originated from a network manager;
• Management Information Base (MIB): it is the collection of the objectsthat represent the many aspects to be managed in an agent. These objects arevariables in their essence, and these variables are read by network managers whenan agent needs to be monitored, and in many cases the managers can also updatethe values of these variables in order to configure something in the managed node.These objects are divided into groups (e.g., System, Interfaces, IP, ICMP, UDP,etc.), and these groups provide a) means of assigning object identifiers, and b)a method for SNMP agents implementations to know which objects must beimplemented [McCloghrie and Rose, 1988];
• Network Management Protocol: unites the management station and themanagement agents. It has three functionalities: get method, which allows the
2.2. Delay-Tolerant Network 11
management station to request the values of objects in the managed agents; setmethod, which can redefine values for the objects of the managed agents; andthe trap functionality, which allows the agent to notify the management stationabout the occurrence of relevant events [Case et al., 1990].
Figure 2.2 presents the overall architecture of a typical TCP/IP network environ-ment managed via SNMP.
Figure 2.2. Example of the SNNP network management architecture [Stallings,1998]
2.2 Delay-Tolerant Network
The class of challenged networks is characterized by latency, bandwith limitations, errorprobability, node longevity, or path stability that are significantly worse in comparisonwith today’s Internet. Despite the increasing importance of challenged networks, it isnot well served by end-to-end TCP/IP model, since some of the assumptions on whichsuch protocols were built on are not met. For example, Internet protocols assume thatan end-to-end path between any pair of nodes will be available during a communicationsession, or that the delays involved in the transmissions are always relatively low [Fall,2003].
12 Chapter 2. Basic Concepts and the VDTN Management Problem
Delay Tolerant Network (DTNs) is an architecture conceived for provisioningcommunication in environments with frequent disconnections and long data deliverydelays [Cerf et al., 2007]. Although DTN technologies have been initially developedfor interplanetary communications, many characteristics of these networks can also befound in terrestrial applications, especially in scenarios where communication is asyn-chronous and subject to long message delivery delays [Ivansic, 2009]. These conditionsusually appear in sparse and/or mobile networks, or in networks where links have higherror rates.
For example, networks based on data mules use vehicles (e.g., bus, bicycle, un-manned aerial vehicle, etc.) that regularly travel between two or more remote locationsto carry messages from one place to another in order to provide connectivity amongthe visited locations [Grasic and Lindgren, 2014]. In such networks, the vehicles arelikely to go through high periods of disruption during the trips between both loca-tions, thus being able to deliver bundles only when inside the communication range ofthe villages. Another example is an emergency network, which is an ad hoc networkdeployed in disaster scenarios where the existent telecommunication infrastructure islost or inoperative [George et al., 2010]. In such networks, the communication amongthe devices being used by the disaster mitigation units can be broken frequently for anumber of different reasons, such as a sparse node deployment or the presence of debrisdisrupting the devices’ communication links.
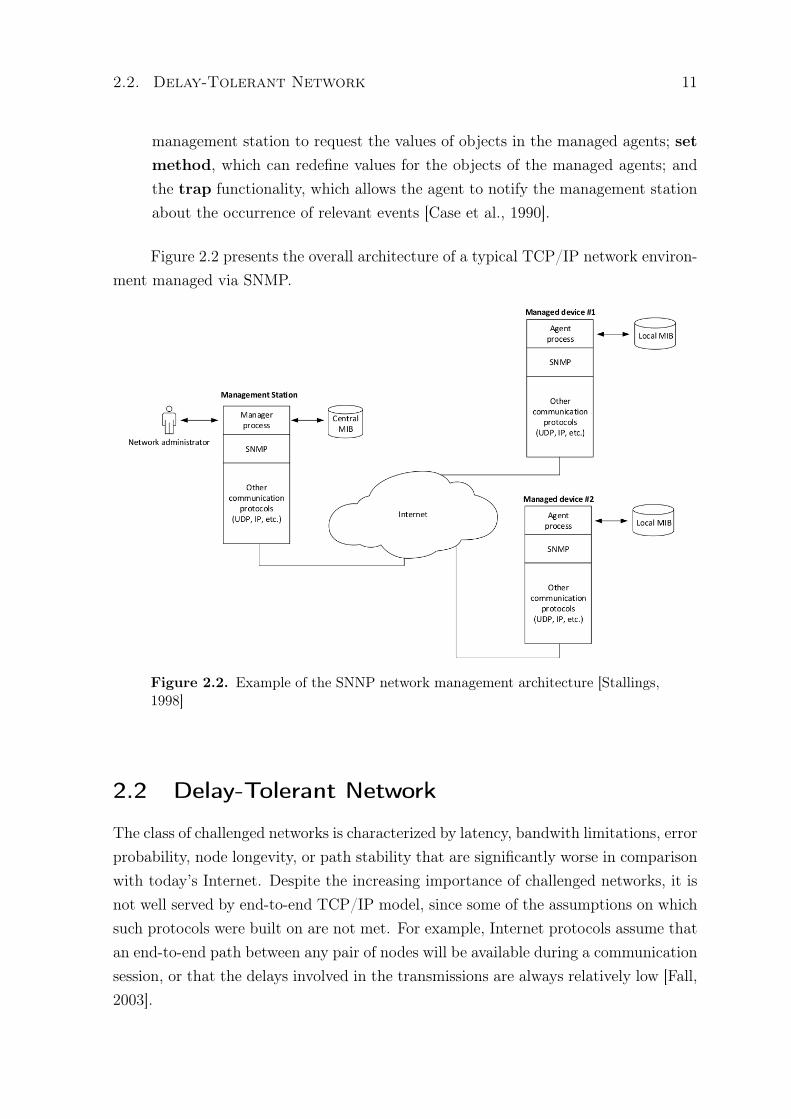
Figure 2.3 presents a typical DTN dynamic scenario, where the circles representnetwork nodes, the solid lines represent existing communication links between a pair ofnodes, and the dashed lines represent disrupted communication links. For example, atInstant 1 the link between a and b is up, while the link between a and c is down. Theterm contact is commonly employed in the DTN literature to refer to the existence ofconnectivity between a pair of nodes. For instance, there is a contact between a andb, but not between a and c at Instant 1. The remainder of Figure 2.3 (Instants 2, 3and 4) illustrates the volatile nature of contacts through time in a DTN environment,with contacts getting up and down as the time progresses.
2.2.1 Contacts in DTN
Contacts between DTN nodes can be classified into several categories, according to theirpredictability and to whether some action is required to bring them into existence. Inthis thesis, we classify the contacts as follows [Cerf et al., 2007]:
• Persistent Contacts: this type of contact is always available, such as a DSL(Digital Subscriber Line) or cable modem Internet connection;
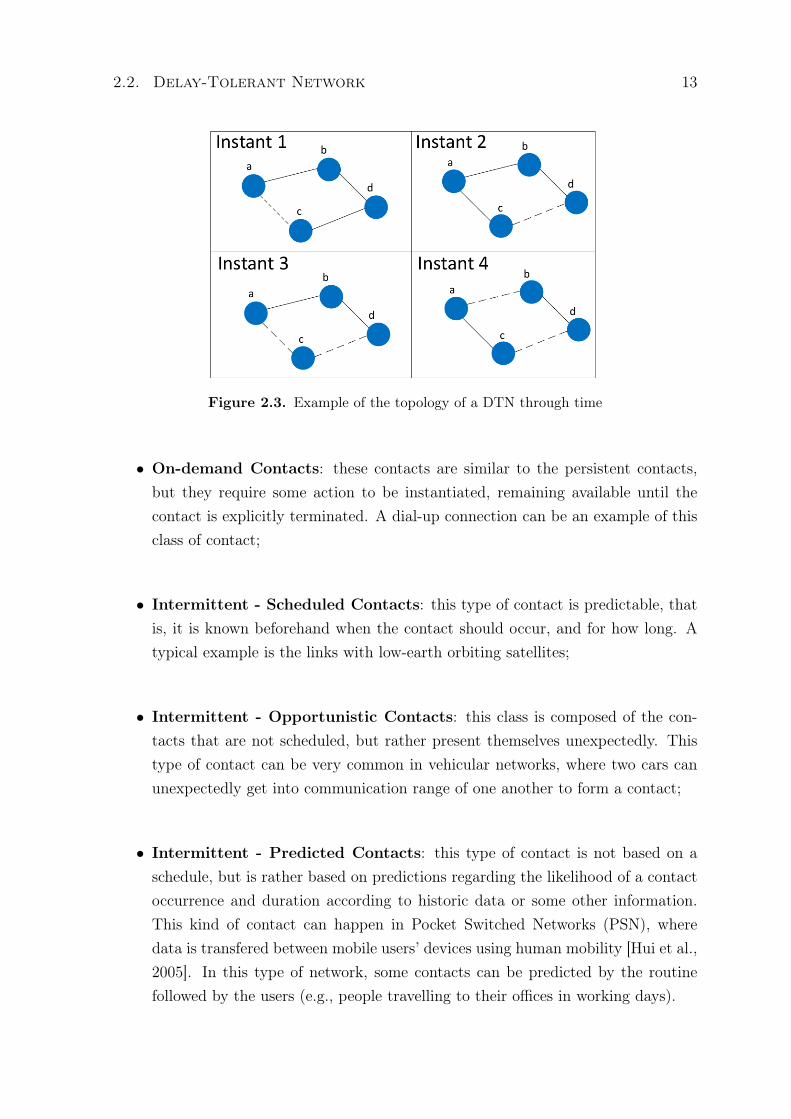
2.2. Delay-Tolerant Network 13
Figure 2.3. Example of the topology of a DTN through time
• On-demand Contacts: these contacts are similar to the persistent contacts,but they require some action to be instantiated, remaining available until thecontact is explicitly terminated. A dial-up connection can be an example of thisclass of contact;
• Intermittent - Scheduled Contacts: this type of contact is predictable, thatis, it is known beforehand when the contact should occur, and for how long. Atypical example is the links with low-earth orbiting satellites;
• Intermittent - Opportunistic Contacts: this class is composed of the con-tacts that are not scheduled, but rather present themselves unexpectedly. Thistype of contact can be very common in vehicular networks, where two cars canunexpectedly get into communication range of one another to form a contact;
• Intermittent - Predicted Contacts: this type of contact is not based on aschedule, but is rather based on predictions regarding the likelihood of a contactoccurrence and duration according to historic data or some other information.This kind of contact can happen in Pocket Switched Networks (PSN), wheredata is transfered between mobile users’ devices using human mobility [Hui et al.,2005]. In this type of network, some contacts can be predicted by the routinefollowed by the users (e.g., people travelling to their offices in working days).
14 Chapter 2. Basic Concepts and the VDTN Management Problem
2.2.2 DTN Architecture and Bundle Protocol
The DTN architecture employs store-carry-and-forward message switching to counterfrequent disconnections and long delays. In this type of switching, a node is able toreceive a message, and if the message is not addressed to that specific node, it is storedin a persistent memory to be forwarded in the future. As the node moves and getsin range with other nodes, it may forward the message (or a copy of it) to anotherintermediate node, or forward it directly to the final destination of the message. Inthis sense, the type of communication provided by a DTN is similar to electronic mail[Cerf et al., 2007].
In order to provide the intrinsic capabilities of the DTN architecture, the BundleProtocol (BP) was specified in RFC 5050 [Scott and Burleigh, 2007]. The key featuresof this protocol are the following:
• Custody-based retransmission, where the“custodian” or “responsible entity” is anode required to keep the bundle in persistent memory until another custodianhas received it successfully [FALL and FARREL, 2008];
• Ability to cope with intermittent connectivity;
• Ability to take advantage of scheduled, predicted, and opportunistic connectivity(in addition to continuous connectivity);
• Late binding of overlay network endpoint identifiers to constituent internet ad-dresses. The late binding is the opposite of the early binding that is typicalof Domain Name System (DNS) in the Internet, where the symbolic name of aresource is bound to a specific network address before a message is forwardedto its destination. In late binding, a message is forwarded to another node bymatching the name of the destination against name entries that are found in theDTN nodes’ routing directives [FALL and FARREL, 2008].
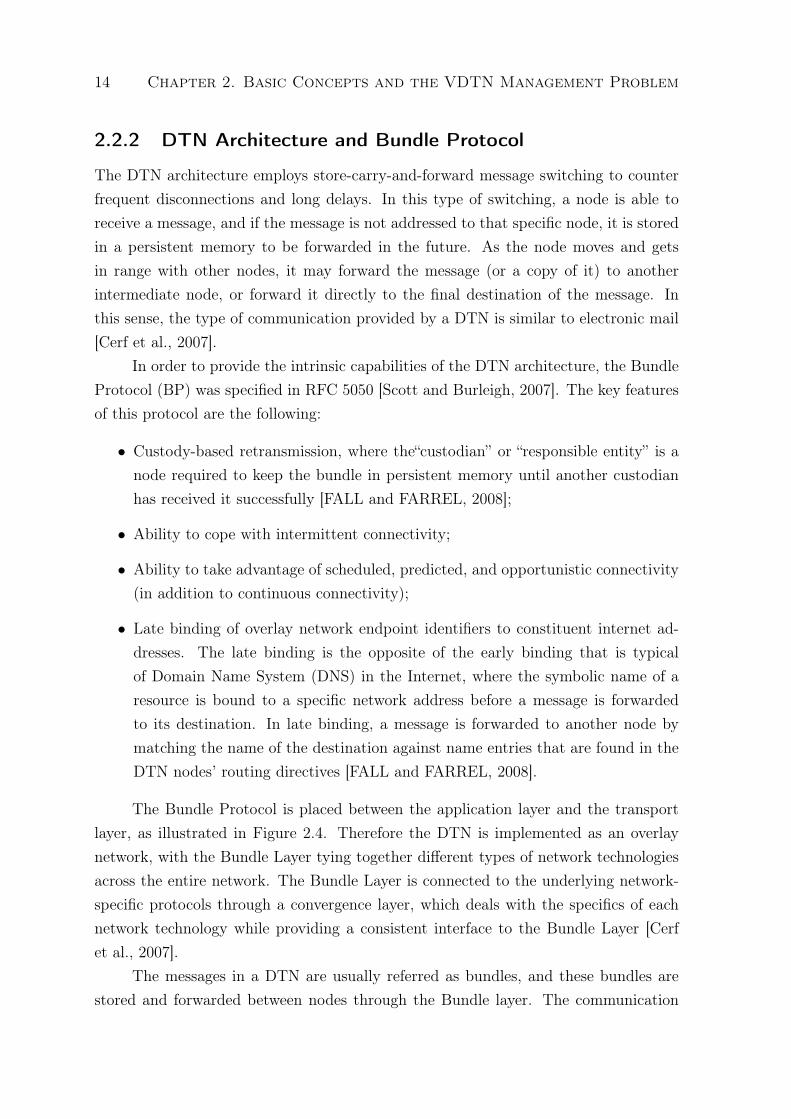
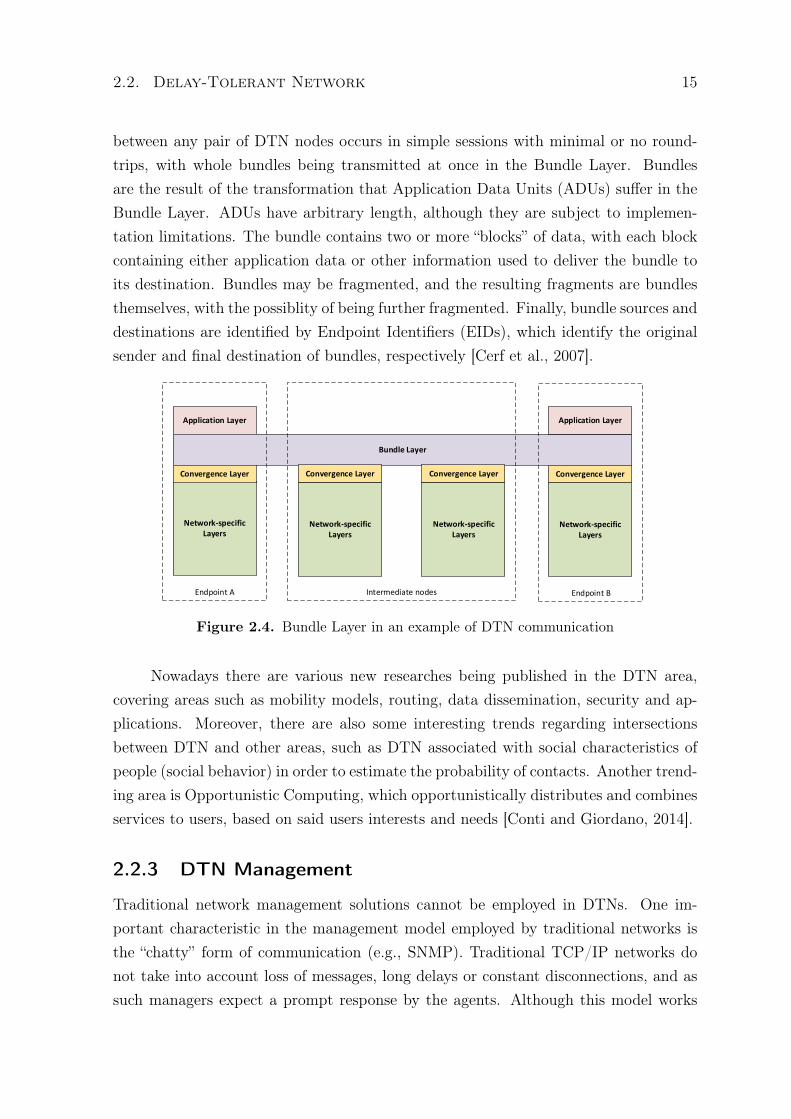
The Bundle Protocol is placed between the application layer and the transportlayer, as illustrated in Figure 2.4. Therefore the DTN is implemented as an overlaynetwork, with the Bundle Layer tying together different types of network technologiesacross the entire network. The Bundle Layer is connected to the underlying network-specific protocols through a convergence layer, which deals with the specifics of eachnetwork technology while providing a consistent interface to the Bundle Layer [Cerfet al., 2007].
The messages in a DTN are usually referred as bundles, and these bundles arestored and forwarded between nodes through the Bundle layer. The communication
2.2. Delay-Tolerant Network 15
between any pair of DTN nodes occurs in simple sessions with minimal or no round-trips, with whole bundles being transmitted at once in the Bundle Layer. Bundlesare the result of the transformation that Application Data Units (ADUs) suffer in theBundle Layer. ADUs have arbitrary length, although they are subject to implemen-tation limitations. The bundle contains two or more “blocks” of data, with each blockcontaining either application data or other information used to deliver the bundle toits destination. Bundles may be fragmented, and the resulting fragments are bundlesthemselves, with the possiblity of being further fragmented. Finally, bundle sources anddestinations are identified by Endpoint Identifiers (EIDs), which identify the originalsender and final destination of bundles, respectively [Cerf et al., 2007].
Application Layer
Bundle Layer
Network-specific Layers
Application Layer
Network-specific Layers
Convergence Layer Convergence Layer
Network-specific Layers
Convergence Layer
Network-specific Layers
Convergence Layer
Endpoint A Intermediate nodes Endpoint B
Figure 2.4. Bundle Layer in an example of DTN communication
Nowadays there are various new researches being published in the DTN area,covering areas such as mobility models, routing, data dissemination, security and ap-plications. Moreover, there are also some interesting trends regarding intersectionsbetween DTN and other areas, such as DTN associated with social characteristics ofpeople (social behavior) in order to estimate the probability of contacts. Another trend-ing area is Opportunistic Computing, which opportunistically distributes and combinesservices to users, based on said users interests and needs [Conti and Giordano, 2014].
2.2.3 DTN Management
Traditional network management solutions cannot be employed in DTNs. One im-portant characteristic in the management model employed by traditional networks isthe “chatty” form of communication (e.g., SNMP). Traditional TCP/IP networks donot take into account loss of messages, long delays or constant disconnections, and assuch managers expect a prompt response by the agents. Although this model works
16 Chapter 2. Basic Concepts and the VDTN Management Problem
fine in the networks it was designed for, it should not perform well in more challengednetworks, such as DTNs. Some problems arise as a result of the usage of traditionalmanagement techniques on DTNs, such as:
• The polling process being compromised by managers’ get-request messages notbeing delivered to the agents, or their respective responses not getting back tothe managers on time or at all;
• Monitoring information, configuration commands and notification messages(alarms) taking long periods of time towards the managers, in such a way that itwould be too late for a manager to correct the network behavior.
The requirements for managing DTNs are not fully known yet, and this is cur-rently an open research question. W. Ivansic points to some directions for the develop-ment of DTN management architectures, without specifying how exactly these direc-tions could be realized [Ivansic, 2009]. According to the author, one possible solutionis to divide the DTN management tasks into local management and remote manage-ment. Regions where local management is possible will likely benefit from traditionalmanagement based solutions. On the other hand, remote management occurs when itis necessary to manage one or more nodes via a DTN connection. Since this communi-cation will use the bundle protocol, frequent link disconnections and long propagationdelays will probably make the message delivery much more time-consuming. As forthe configuration functions, it is necessary that a DTN management solution has suf-ficient autonomic capabilities to validate an operation before its deployment, as wellas perform a rollback operation to the last known safe state whenever necessary. Thisthesis agrees with the general directions pointed by W. Ivansic, and make efforts toinstantiate the general recommendations into algorithms for vehicular networks.
2.3 Vehicular Networks
The wide adoption of wireless communication technologies and the increasing interestof both academia and industry in developing vehicular wireless communication madeVehicular Ad Hoc Networks (VANETs) a promising field of research. Improvements onvehicle and road safety, traffic efficiency, and convenience/comfort to both drivers andpassangers are among the main incentives behind VANET research [Zeadally et al.,2012]. Several automobile manufacturers and research centers are conducting investi-gations on protocols, applications and the use of inter-vehicle communication for theestablishment of VANETs [Liu et al., 2016].
2.3. Vehicular Networks 17
2.3.1 Application Classes
Applications in vehicular networks can be divided into three major classes from the cus-tomer’s perspective: safety-oriented, traffic management applications, and commercialapplications [Bai et al., 2006]. They are briefly described:
1. Safety applications: applications in this category monitor the surroundings ofthe vehicle and exchange messages with other vehicles, to assist drivers to avoidpotential dangers. Some examples of applications are “Stopped or Slow Vehi-cle Advisor”, “Emergency Electronic Brake Light” and “Road Hazard ConditionNotification”. Typical safety applications require high packet delivery rates andlow latency communication, because the safety messages need to arrive at theirdestination as fast as possible, in order to prevent accidents to happen;
2. Traffic Management applications: this class of applications provides a betterdistribution of vehicles on the roads, in order to reduce traffic jams and traveltime. Such objective is usually achieved by roadway infrastructure and vehiclesexchanging traffic information. “Congested Road Notification” and “Free FlowTolling” are examples of applications in this class. Some applications in this classrequire low latency communication in order to support real-time monitoring ofthe traffic conditions, while others are resilient to delay, since they require onlyhistorical data of the traffic (e.g., for future traffic planning);
3. Commercial applications: this class of applications improves driver produc-tivity, entertainment, and satisfaction. Some examples are “Service Announce-ments” and “Real-time Video Relay”. The network requirements for this class arehighly dependent on the application itself: it can range from delay-tolerant com-mercial applications, such as mobile advertising, to time sensitive applications,like real-time voice communication.
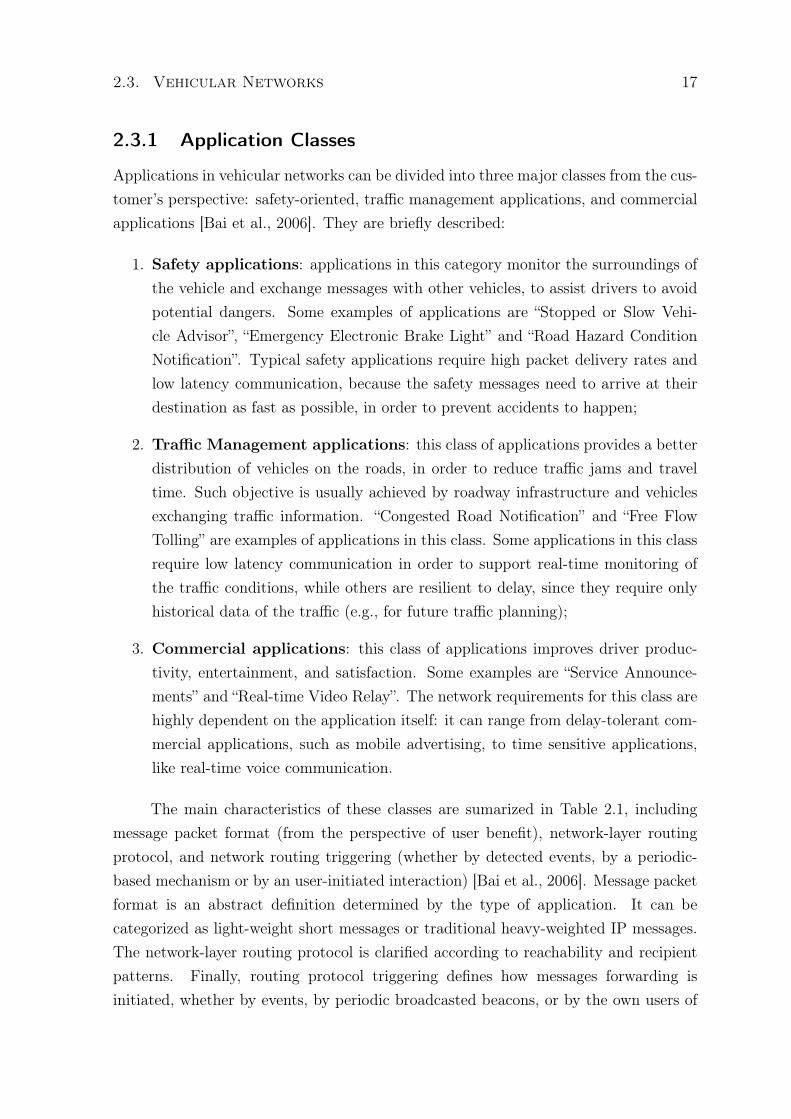
The main characteristics of these classes are sumarized in Table 2.1, includingmessage packet format (from the perspective of user benefit), network-layer routingprotocol, and network routing triggering (whether by detected events, by a periodic-based mechanism or by an user-initiated interaction) [Bai et al., 2006]. Message packetformat is an abstract definition determined by the type of application. It can becategorized as light-weight short messages or traditional heavy-weighted IP messages.The network-layer routing protocol is clarified according to reachability and recipientpatterns. Finally, routing protocol triggering defines how messages forwarding isinitiated, whether by events, by periodic broadcasted beacons, or by the own users of
18 Chapter 2. Basic Concepts and the VDTN Management Problem
the applications.
Network Safety Convenience CommercialAttributeMessage packet format Light-weighted Light-weighted Heavy-weightedNetwork-layer routing Multi-hop geocast and Multi-hop geocast, Multi-hop geocast,protocol single-hop broadcast single-hop broadcast and single-hop broadcast and
unicast unicastRouting protocol Event-driven and User-initiated User-initiatedtriggering periodic-driven
Table 2.1. Vehicular networks applications’ classes
2.3.2 Architecture and Protocols
Communication in VANET is standardized by the IEEE 802.11p standard and theIEEE 1609 WAVE (Wireless in Vehicular Networks) standards, which operate in theDedicated Short Range Communications (DSRC) in the United States [IEE, 2014].The main purposes of each of the standards are the following [Uzcategui et al., 2009]:
• IEEE 802.11p specifies the PHY and MAC layers for vehicular networks;
• IEEE 1609.1 describes the interaction of Onboard Units (OBUs) with both morelimited computing resources and more complex processes running outside theOBU;
• IEEE 1609.2 describes the format and processing of secure messages in vehicularnetworks;
• IEEE 1609.3 provides addressing and routing services within a WAVE system;
• IEEE 1609.4 describes enhancements to the 802.11p MAC, in order to supportmultichannel operation.
WAVE uses a multi-channel concept to separate the traffic of each applicationtype. Messages are prioritized through different Access Classes (ACS), having differentchannel access settings. Thus, high priority safety messages are able to reach theirdestination in a timely and reliable fashion, even in a dense network [Eichler, 2007].
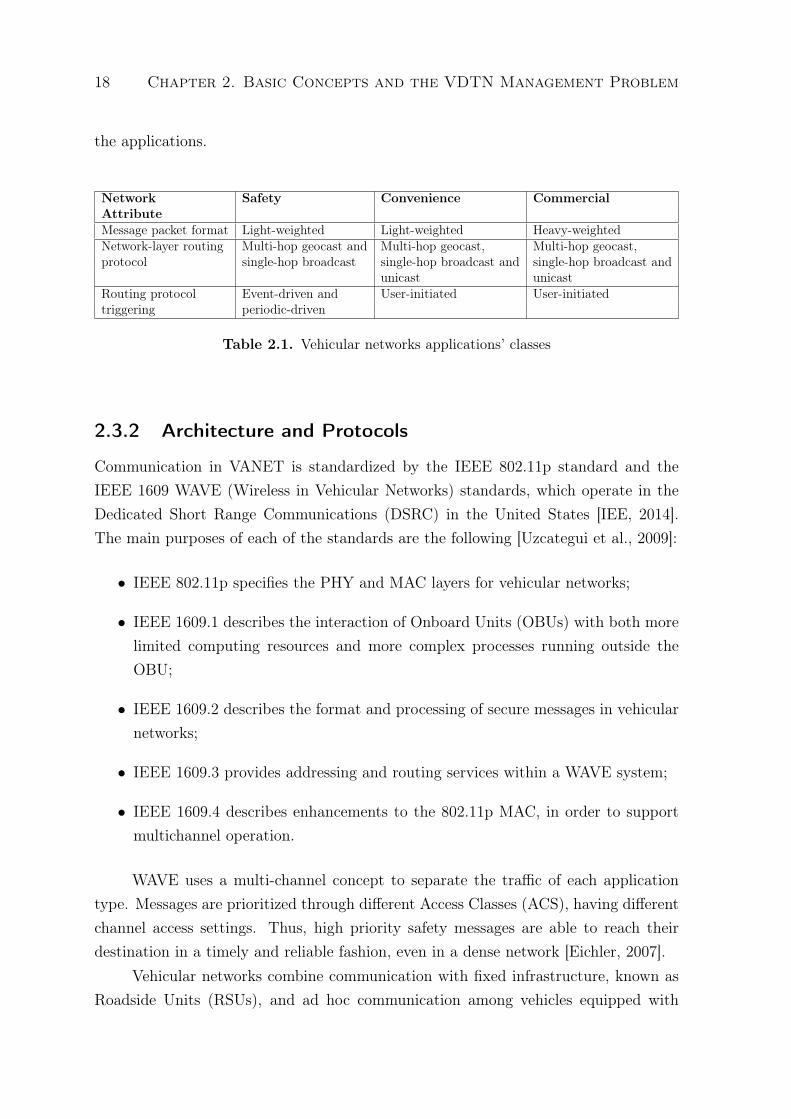
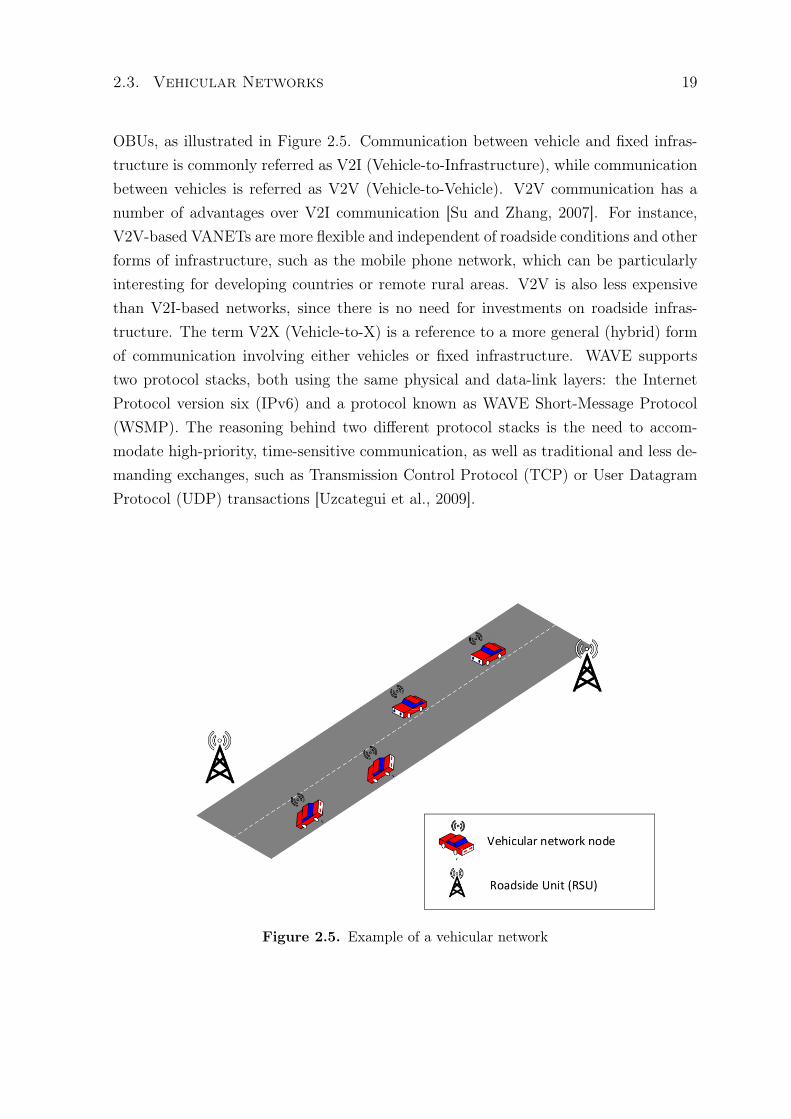
Vehicular networks combine communication with fixed infrastructure, known asRoadside Units (RSUs), and ad hoc communication among vehicles equipped with
2.3. Vehicular Networks 19
OBUs, as illustrated in Figure 2.5. Communication between vehicle and fixed infras-tructure is commonly referred as V2I (Vehicle-to-Infrastructure), while communicationbetween vehicles is referred as V2V (Vehicle-to-Vehicle). V2V communication has anumber of advantages over V2I communication [Su and Zhang, 2007]. For instance,V2V-based VANETs are more flexible and independent of roadside conditions and otherforms of infrastructure, such as the mobile phone network, which can be particularlyinteresting for developing countries or remote rural areas. V2V is also less expensivethan V2I-based networks, since there is no need for investments on roadside infras-tructure. The term V2X (Vehicle-to-X) is a reference to a more general (hybrid) formof communication involving either vehicles or fixed infrastructure. WAVE supportstwo protocol stacks, both using the same physical and data-link layers: the InternetProtocol version six (IPv6) and a protocol known as WAVE Short-Message Protocol(WSMP). The reasoning behind two different protocol stacks is the need to accom-modate high-priority, time-sensitive communication, as well as traditional and less de-manding exchanges, such as Transmission Control Protocol (TCP) or User DatagramProtocol (UDP) transactions [Uzcategui et al., 2009].
Figure 2.5. Example of a vehicular network
20 Chapter 2. Basic Concepts and the VDTN Management Problem
2.3.3 Vehicular Delay-Tolerant Networks
Because of the high mobility of the vehicular nodes and the vast area that a VANETcan cover, partitions in the network are likely to occur, especially in areas where thenodes are sparsely distributed. Moreover, investments on some sort of communicationinfrastructure, such as a mobile phone network, can be inviable in most developingcountries due to the cost of such infrastructure. In such cases, V2V communication ispreferable because of its flexibility and low associated cost.
VANETs can benefit from the DTN architecture, due to its ability to cope withfrequent link disconnections. Thus, a Vehicular Delay-Tolerant Network (VDTN) isa DTN where the nodes are composed by vehicles and RSUs [Pereira et al., 2012].The main difference between VANETs and VDTNs is the ability to cope with sparsenetworks: while VANET protocols assume fully connected networks, VDTNs are moreadapted to sparse networks and topology changes [Zhang and Wolff, 2010]. In VDTNsthe contacts are mostly opportunistic (specially when no road side infrastructure isused), and the transmission delay between two nodes that are not in contact witheach other can be considerably high, which has to be taken into account by VDTNapplication developers.
2.4 The VDTN Management Problem
DTNs and Vehicular DTNs have many common characteristics, as one would expect.However, VDTN management also carries some important aspects that are unique toits domain. The most important aspect is the fact that safety applications are very sen-sitive to communication delay, which imposes a serious challenge for the managementof those applications. Critical messages arriving late may result in delayed detectionof important events, which can result in road accidents. Vehicle proximity (used incollision avoidance systems), danger warnings and vehicle with faulty sensor warningsare examples of critical messages that are highly sensitive to long communication delay.Because of this, VDTN management systems need to support low-latency managementin a DTN environment, which can be a challenging problem that is yet to be solved.
Since low-latency communication in VDTN can only be achieved when nodes arewithin local communication range from one another, a VDTN management solutionmust gather information on the current topology of the network in order to take advan-tage of local management opportunities. Because of this, VDTN management systemsneed to know data such as the immediate neighborhood of a node at a given moment,or the estimated duration of a given contact, in order to adapt the behavior of the
2.4. The VDTN Management Problem 21
management solution to these changes in the network’s topology. In more traditionalnetworks, the need for a management system to know details on the topology of thenetwork is less important, since in these networks one can always assume the existenceof a route between any pair of nodes, eliminating the concern about the ability of themanagement system to communicate with other nodes.
In order to allow a better delimitation of the scope of this thesis, a network modelwill be provided. In the next chapters of this thesis some proposed concepts will bepresented in terms of the definitions described in the model presented in this chapter,hence the importance of the next subsection.
2.4.1 Network Model
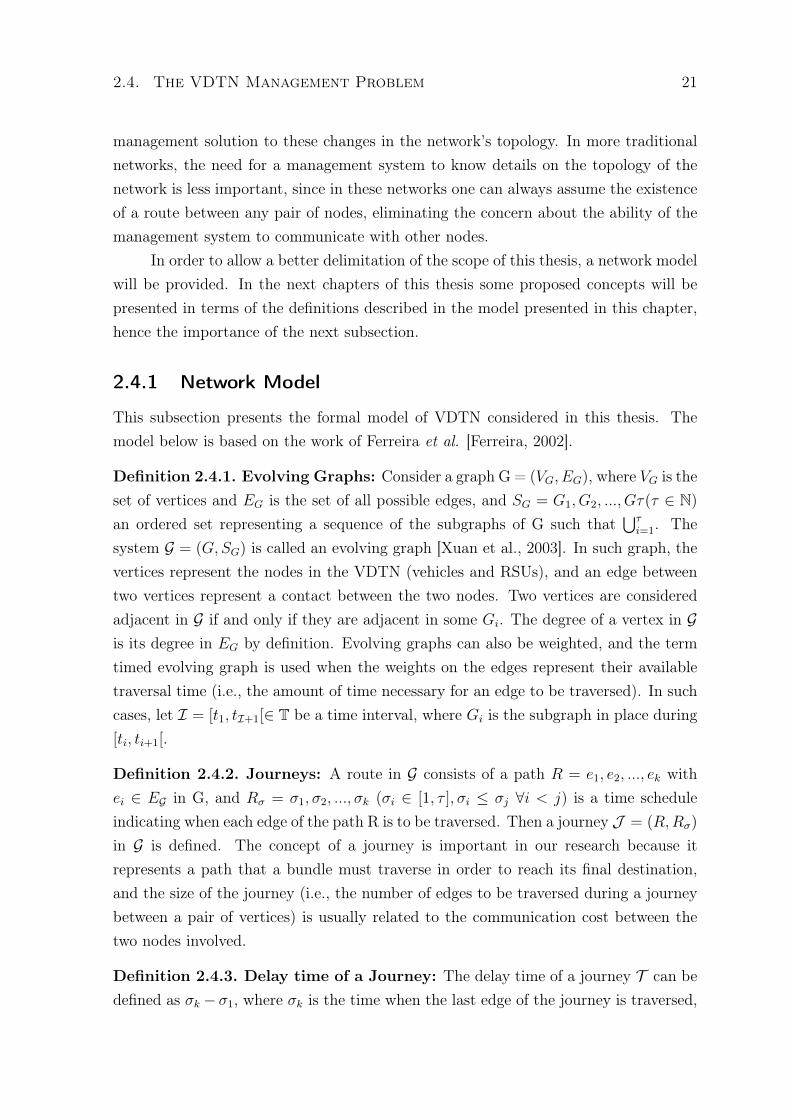
This subsection presents the formal model of VDTN considered in this thesis. Themodel below is based on the work of Ferreira et al. [Ferreira, 2002].
Definition 2.4.1. Evolving Graphs: Consider a graph G = (VG, EG), where VG is theset of vertices and EG is the set of all possible edges, and SG = G1, G2, ..., Gτ(τ ∈ N)an ordered set representing a sequence of the subgraphs of G such that
⋃τi=1. The
system G = (G,SG) is called an evolving graph [Xuan et al., 2003]. In such graph, thevertices represent the nodes in the VDTN (vehicles and RSUs), and an edge betweentwo vertices represent a contact between the two nodes. Two vertices are consideredadjacent in G if and only if they are adjacent in some Gi. The degree of a vertex in Gis its degree in EG by definition. Evolving graphs can also be weighted, and the termtimed evolving graph is used when the weights on the edges represent their availabletraversal time (i.e., the amount of time necessary for an edge to be traversed). In suchcases, let I = [t1, tI+1[∈ T be a time interval, where Gi is the subgraph in place during[ti, ti+1[.
Definition 2.4.2. Journeys: A route in G consists of a path R = e1, e2, ..., ek withei ∈ EG in G, and Rσ = σ1, σ2, ..., σk (σi ∈ [1, τ ], σi ≤ σj ∀i < j) is a time scheduleindicating when each edge of the path R is to be traversed. Then a journey J = (R,Rσ)
in G is defined. The concept of a journey is important in our research because itrepresents a path that a bundle must traverse in order to reach its final destination,and the size of the journey (i.e., the number of edges to be traversed during a journeybetween a pair of vertices) is usually related to the communication cost between thetwo nodes involved.
Definition 2.4.3. Delay time of a Journey: The delay time of a journey T can bedefined as σk − σ1, where σk is the time when the last edge of the journey is traversed,
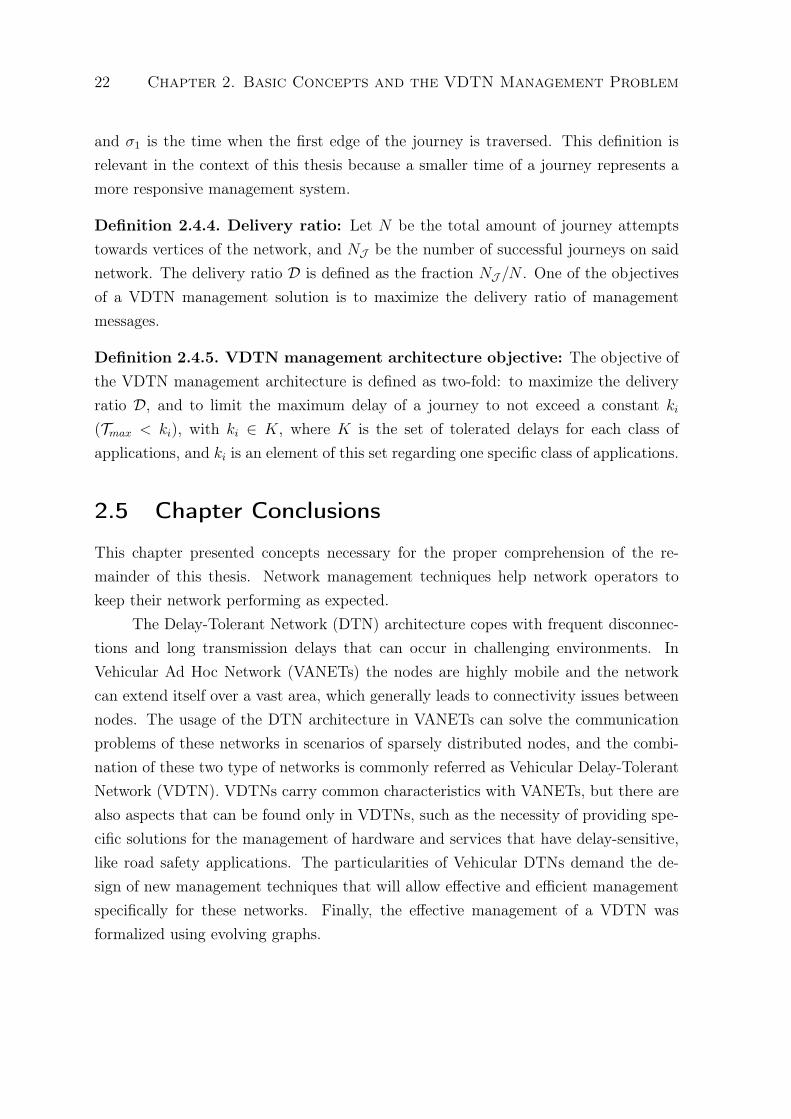
22 Chapter 2. Basic Concepts and the VDTN Management Problem
and σ1 is the time when the first edge of the journey is traversed. This definition isrelevant in the context of this thesis because a smaller time of a journey represents amore responsive management system.
Definition 2.4.4. Delivery ratio: Let N be the total amount of journey attemptstowards vertices of the network, and NJ be the number of successful journeys on saidnetwork. The delivery ratio D is defined as the fraction NJ /N . One of the objectivesof a VDTN management solution is to maximize the delivery ratio of managementmessages.
Definition 2.4.5. VDTN management architecture objective: The objective ofthe VDTN management architecture is defined as two-fold: to maximize the deliveryratio D, and to limit the maximum delay of a journey to not exceed a constant ki(Tmax < ki), with ki ∈ K, where K is the set of tolerated delays for each class ofapplications, and ki is an element of this set regarding one specific class of applications.
2.5 Chapter Conclusions
This chapter presented concepts necessary for the proper comprehension of the re-mainder of this thesis. Network management techniques help network operators tokeep their network performing as expected.
The Delay-Tolerant Network (DTN) architecture copes with frequent disconnec-tions and long transmission delays that can occur in challenging environments. InVehicular Ad Hoc Network (VANETs) the nodes are highly mobile and the networkcan extend itself over a vast area, which generally leads to connectivity issues betweennodes. The usage of the DTN architecture in VANETs can solve the communicationproblems of these networks in scenarios of sparsely distributed nodes, and the combi-nation of these two type of networks is commonly referred as Vehicular Delay-TolerantNetwork (VDTN). VDTNs carry common characteristics with VANETs, but there arealso aspects that can be found only in VDTNs, such as the necessity of providing spe-cific solutions for the management of hardware and services that have delay-sensitive,like road safety applications. The particularities of Vehicular DTNs demand the de-sign of new management techniques that will allow effective and efficient managementspecifically for these networks. Finally, the effective management of a VDTN wasformalized using evolving graphs.
Chapter 3
Related Work
This chapter presents a review of the literature of the main areas related to this thesis:DTN management and Vehicular Network management. Clustering Algorithms arealso reviewed due to the importance of these algorithms in the proposed managementarchitecture.
3.1 Methodology
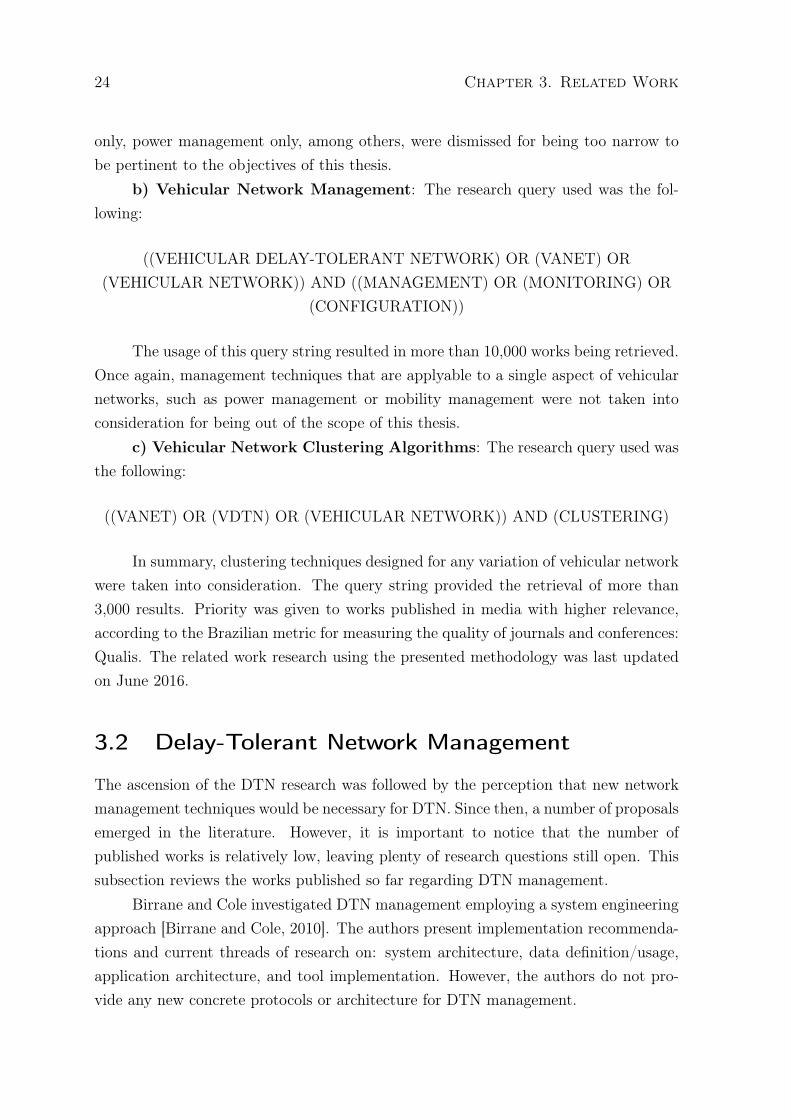
The search for the state of the art in this thesis used the prominent scientific searchengines. Google Scholar1 and Science Direct2 engines were selected, since they are ableto return results from several important scientific publishers, such as ACM, IEEE andElsevier. Only works published in the last decade (i.e., between 2006 and 2016) weretaken into account, in order to avoid reviewing research results that became obsoleteas the result of newer published works providing improved versions of older results.Selected search queries for each surveyed area were employed systematically in theselected search engines, as following:
a) Delay-Tolerant Network Management: The results matching the querystring below were taken into consideration:
((DELAY-TOLERANT NETWORK) OR (OPPORTUNISTIC NETWORK)) AND((MANAGEMENT) OR (MONITORING) OR (CONFIGURATION))
More than 21,000 results were retrieved through the usage of the query stringabove. Works strictly regarding specific management tasks such as buffer management
1http://scholar.google.com2http://www.sciencedirect.com
23
24 Chapter 3. Related Work
only, power management only, among others, were dismissed for being too narrow tobe pertinent to the objectives of this thesis.
b) Vehicular Network Management: The research query used was the fol-lowing:
((VEHICULAR DELAY-TOLERANT NETWORK) OR (VANET) OR(VEHICULAR NETWORK)) AND ((MANAGEMENT) OR (MONITORING) OR
(CONFIGURATION))
The usage of this query string resulted in more than 10,000 works being retrieved.Once again, management techniques that are applyable to a single aspect of vehicularnetworks, such as power management or mobility management were not taken intoconsideration for being out of the scope of this thesis.
c) Vehicular Network Clustering Algorithms: The research query used wasthe following:
((VANET) OR (VDTN) OR (VEHICULAR NETWORK)) AND (CLUSTERING)
In summary, clustering techniques designed for any variation of vehicular networkwere taken into consideration. The query string provided the retrieval of more than3,000 results. Priority was given to works published in media with higher relevance,according to the Brazilian metric for measuring the quality of journals and conferences:Qualis. The related work research using the presented methodology was last updatedon June 2016.
3.2 Delay-Tolerant Network Management
The ascension of the DTN research was followed by the perception that new networkmanagement techniques would be necessary for DTN. Since then, a number of proposalsemerged in the literature. However, it is important to notice that the number ofpublished works is relatively low, leaving plenty of research questions still open. Thissubsection reviews the works published so far regarding DTN management.
Birrane and Cole investigated DTN management employing a system engineeringapproach [Birrane and Cole, 2010]. The authors present implementation recommenda-tions and current threads of research on: system architecture, data definition/usage,application architecture, and tool implementation. However, the authors do not pro-vide any new concrete protocols or architecture for DTN management.
3.2. Delay-Tolerant Network Management 25
Peoples et al. proposed a network middleware called context-aware broker (CAB),supporting policies in deep space communication DTNs [Peoples et al., 2010]. Theimpact of the policy-driven model on transmissions, its ability to achieve autonomyand self-management, and the relationship between offered and received load werethe aspects evaluated for the proposed middleware. However the authors’ solution ispresented only in a deep space communication scenario, without information on howtheir solution could be extended to other scenarios. In the opinion of this thesis’ author,while the addition of a context-aware policy-based network management middlewarecould improve several management tasks in VDTNs, it would not satisfy near-real-timeapplications.
Sachin et al. extended the NETCONF to DTNs, to install, manipulate, anddelete configurations in network devices [Sachin et al., 2010]. Their proposal wascalled Configuration Network Management Protocol (CNMP), and an initial prototypeof this protocol was tested on a GNU Radio testbed. The authors discussed designtrade-offs and their impact to the configuration of nodes and services in a DTN. Theyproposed a new NETCONF operation called <verify >, which verifies the correctnessof operation in the nodes configuration environments. However, the design choices andimplementation presented by Sachin et al. are still in an early stage. The researchlacks details such as the specifics on the local policy rules checker, as well as a moreextensive evaluation concerning how well their NETCONF extension scales in largerDTNs.
Papalambrou et al. proposed a method for monitoring DTNs based on thepublisher-subscriber model [Papalambrou et al., 2011]. The proposed protocol is calledDiagnostic Interplanetary Network Gateway (DING), and it was the first to implementDTN monitoring based on the publisher/subscriber model. In this protocol, the sub-scriber informs which data it wishes to receive. Publishers generate data, which is sentto the subscribed nodes. This paradigm has a much lower overhead in comparison withSNMP, since it requires only one subscription request for the reception of an arbitrarynumber of responses, while SNMP requires one request for each response. DING eval-uation occurred in a small network called planet-ece, composed of three nodes based onthe DTN2 implementation of the DTN Bundle Protocol [FALL and FARREL, 2008].In this paper the authors gather monitoring data using scripts that interact with theoperating system and the DTN2 implementation. The authors’ proposal does not dealwith the consequences of frequent disconnections and long delays to management op-erations. Moreover, it is not clear if the authors’ solution scales well with the size ofthe DTN, since their evaluation process employed three nodes.
The Delay-Tolerant Network Management Protocol is proposed by the NASA
26 Chapter 3. Related Work
DTN program through an IETF Internet-Draft, and it is designed to support thenetwork management functions of configuration, performance reporting, control, andadministration [Birrane and Ramachandran, 2014]. DTNMP supports five desirableproperties: Intelligent Push of Information, eliminating the need for round-trip dataexchange in the management protocol; Small Message Sizes, requiring smaller contacttime to be transmitted; Fine-grained, Flexible Data Identification, to precisely definewhat data is required; Asynchronous Operation, to avoid relying on session establish-ment or round-trip data exchange; and Compatibility with Low-Latency Network Man-agement Protocols, to enable management interfaces between DTNs and other typesof networks. Nonetheless, the document primary focuses are to present an overview ofthe DTNMP and to specify message flows and formats, without providing details onhow the inner components of agents and managers should be implemented. Also, theDTNMP solution does not approach the specificities of VDTN management.
Torgerson [Torgerson, 2014] presented a suite of tools that provide network vi-sualization, performance monitoring, and node control software for devices using theInterplanetary Overlay Network (ION) DTN implementation [Burleigh, 2007]. Thissuite, called Network Monitor & Control (NM&C) System, complements the DTNMP.The authors expected their suite of tools, together with DTNMP, to form the basisfor flight operation using DTN. The limitation of this work is the fact that its propos-als are tied to the deep space communication scenario. The authors do not provideinformation on how their proposals could be extended to other scenarios.
The Opportunistic Management Contact Estimator (OMCE) estimates the ap-propriate time to execute future management tasks considering distributed statisticalanalysis of past contacts [Nobre et al., 2014]. Additionally, the nodes share data withother nodes regarding their contacts to improve contact estimation using a P2P man-agement overlay. Their solution was evaluated by both simulation experiments anda proof of concept implementation. Results showed that it is possible to improve theperformance of monitoring tasks through the usage of the authors’ proposals. However,this work relies on another overlay network on top of the DTN. The use of P2P overDTNs may increase the computational demands over the network nodes, which canlead to the authors’ proposal being inadequate for scenarios where the devices havestrict resource limitations. Unfortunately the authors did not provide insights on thecomputational costs of their proposal.
The Deutsches Zentrum Für Luft-und Raumfahrt (DLR) DTN working groupproposed major changes to the current DTNMP reference implementation in orderto better support commanding capability for the ION DTN reference implementa-tion [Pierce-Mayer and Peinado, 2016]. The proposed changes include a strong-typing
3.3. Vehicular Network Management 27
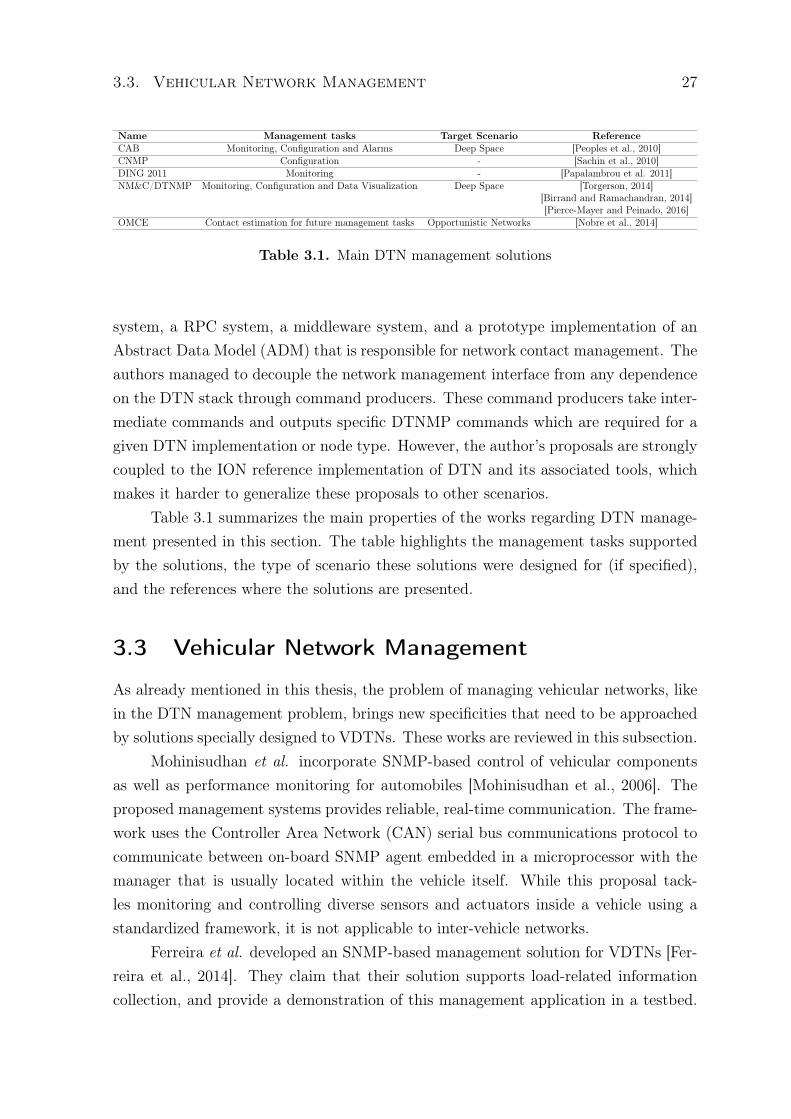
Name Management tasks Target Scenario ReferenceCAB Monitoring, Configuration and Alarms Deep Space [Peoples et al., 2010]CNMP Configuration - [Sachin et al., 2010]DING 2011 Monitoring - [Papalambrou et al. 2011]NM&C/DTNMP Monitoring, Configuration and Data Visualization Deep Space [Torgerson, 2014]
[Birrand and Ramachandran, 2014][Pierce-Mayer and Peinado, 2016]
OMCE Contact estimation for future management tasks Opportunistic Networks [Nobre et al., 2014]
Table 3.1. Main DTN management solutions
system, a RPC system, a middleware system, and a prototype implementation of anAbstract Data Model (ADM) that is responsible for network contact management. Theauthors managed to decouple the network management interface from any dependenceon the DTN stack through command producers. These command producers take inter-mediate commands and outputs specific DTNMP commands which are required for agiven DTN implementation or node type. However, the author’s proposals are stronglycoupled to the ION reference implementation of DTN and its associated tools, whichmakes it harder to generalize these proposals to other scenarios.
Table 3.1 summarizes the main properties of the works regarding DTN manage-ment presented in this section. The table highlights the management tasks supportedby the solutions, the type of scenario these solutions were designed for (if specified),and the references where the solutions are presented.
3.3 Vehicular Network Management
As already mentioned in this thesis, the problem of managing vehicular networks, likein the DTN management problem, brings new specificities that need to be approachedby solutions specially designed to VDTNs. These works are reviewed in this subsection.
Mohinisudhan et al. incorporate SNMP-based control of vehicular componentsas well as performance monitoring for automobiles [Mohinisudhan et al., 2006]. Theproposed management systems provides reliable, real-time communication. The frame-work uses the Controller Area Network (CAN) serial bus communications protocol tocommunicate between on-board SNMP agent embedded in a microprocessor with themanager that is usually located within the vehicle itself. While this proposal tack-les monitoring and controlling diverse sensors and actuators inside a vehicle using astandardized framework, it is not applicable to inter-vehicle networks.
Ferreira et al. developed an SNMP-based management solution for VDTNs [Fer-reira et al., 2014]. They claim that their solution supports load-related informationcollection, and provide a demonstration of this management application in a testbed.
28 Chapter 3. Related Work
Their work, however, does not control the delays involved in such transmissions, butinstead it uses encapsulation of SNMP messages in DTN bundles.
Silva and Meira Junior proposed an algorithm for the deployment of stationaryand mobile RSUs based on inputs of the density of vehicles along the road and the reg-istered migration ratios among the urban cells of the network [Silva and Meira, 2015].The authors also proposed a novel metric, called Delta Network, for measuring theconnectivity experienced by vehicles. Although the authors’ algorithm exploits vehic-ular network managemnet, their techniques apply only to RSUs, leaving the vehicularnodes out of the scope of monitoring and configuration techniques.
Dias et al. designed a monitoring and configuration tool for VDTNs, called MoM[Dias et al., 2016]. This work considers a model of VDTN that employs out-of-bandsignal for providing separation between control and data plane. The employed VDTNmodel also uses two types of static nodes: terminal nodes, which act as access pointsto other nodes in the VDTN, and relay nodes, which have large store capacity and areusually placed in crossroads for increasing contact opportunities. MoM uses out-of-band signalling to collect statistical information about the performance of the nodesand to spread configuration messages across the network. Monitored statistics areaddressed to terminal nodes, and whenever a problematic node is detected throughthe monitoring module of a terminal, it disseminates “advertisements” to other nodesof the VDTN in order to try to solve the problem. In this work, the authors relyon fixed infra-structure in the VDTN, which makes their solution more expensive incomparison to solutions that rely only in V2V communication. Moreover, although anetwork administrator is able to see in real-time data that has already arrived at oneof the terminals, it does not mean the VDTN nodes are being monitored in real-time.
3.4 Vehicular Network Clustering Algorithms
Clustering algorithms are commonly employed in wireless networks in order to or-ganize the network into clusters, which are groups of adjacent nodes selected by apredefined criterion. Clusters are usually formed by a number of cluster members anda cluster-head (CH), which acts as a local leader to perform the maintenance of saidcluster. Clustering algorithms for Vehicular Networks are an important part of themanagement architecture proposed in Chapter 4. Thus, this section reviews the mostrelevant clustering techniques designed for Vehicular Networks. The vehicular networkclustering problem is similar in many aspects to the mobile ad hoc network clusteringproblem in some aspects, but there are particularities exclusive to vehicular networks,
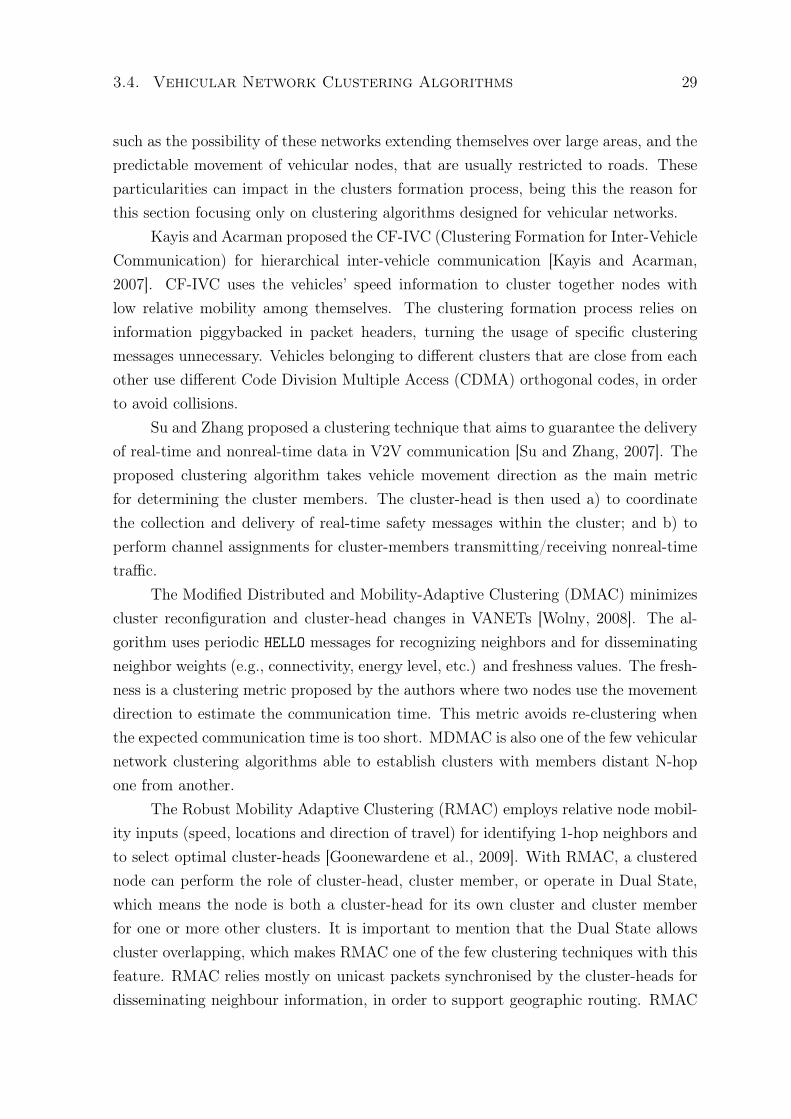
3.4. Vehicular Network Clustering Algorithms 29
such as the possibility of these networks extending themselves over large areas, and thepredictable movement of vehicular nodes, that are usually restricted to roads. Theseparticularities can impact in the clusters formation process, being this the reason forthis section focusing only on clustering algorithms designed for vehicular networks.
Kayis and Acarman proposed the CF-IVC (Clustering Formation for Inter-VehicleCommunication) for hierarchical inter-vehicle communication [Kayis and Acarman,2007]. CF-IVC uses the vehicles’ speed information to cluster together nodes withlow relative mobility among themselves. The clustering formation process relies oninformation piggybacked in packet headers, turning the usage of specific clusteringmessages unnecessary. Vehicles belonging to different clusters that are close from eachother use different Code Division Multiple Access (CDMA) orthogonal codes, in orderto avoid collisions.
Su and Zhang proposed a clustering technique that aims to guarantee the deliveryof real-time and nonreal-time data in V2V communication [Su and Zhang, 2007]. Theproposed clustering algorithm takes vehicle movement direction as the main metricfor determining the cluster members. The cluster-head is then used a) to coordinatethe collection and delivery of real-time safety messages within the cluster; and b) toperform channel assignments for cluster-members transmitting/receiving nonreal-timetraffic.
The Modified Distributed and Mobility-Adaptive Clustering (DMAC) minimizescluster reconfiguration and cluster-head changes in VANETs [Wolny, 2008]. The al-gorithm uses periodic HELLO messages for recognizing neighbors and for disseminatingneighbor weights (e.g., connectivity, energy level, etc.) and freshness values. The fresh-ness is a clustering metric proposed by the authors where two nodes use the movementdirection to estimate the communication time. This metric avoids re-clustering whenthe expected communication time is too short. MDMAC is also one of the few vehicularnetwork clustering algorithms able to establish clusters with members distant N-hopone from another.
The Robust Mobility Adaptive Clustering (RMAC) employs relative node mobil-ity inputs (speed, locations and direction of travel) for identifying 1-hop neighbors andto select optimal cluster-heads [Goonewardene et al., 2009]. With RMAC, a clusterednode can perform the role of cluster-head, cluster member, or operate in Dual State,which means the node is both a cluster-head for its own cluster and cluster memberfor one or more other clusters. It is important to mention that the Dual State allowscluster overlapping, which makes RMAC one of the few clustering techniques with thisfeature. RMAC relies mostly on unicast packets synchronised by the cluster-heads fordisseminating neighbour information, in order to support geographic routing. RMAC
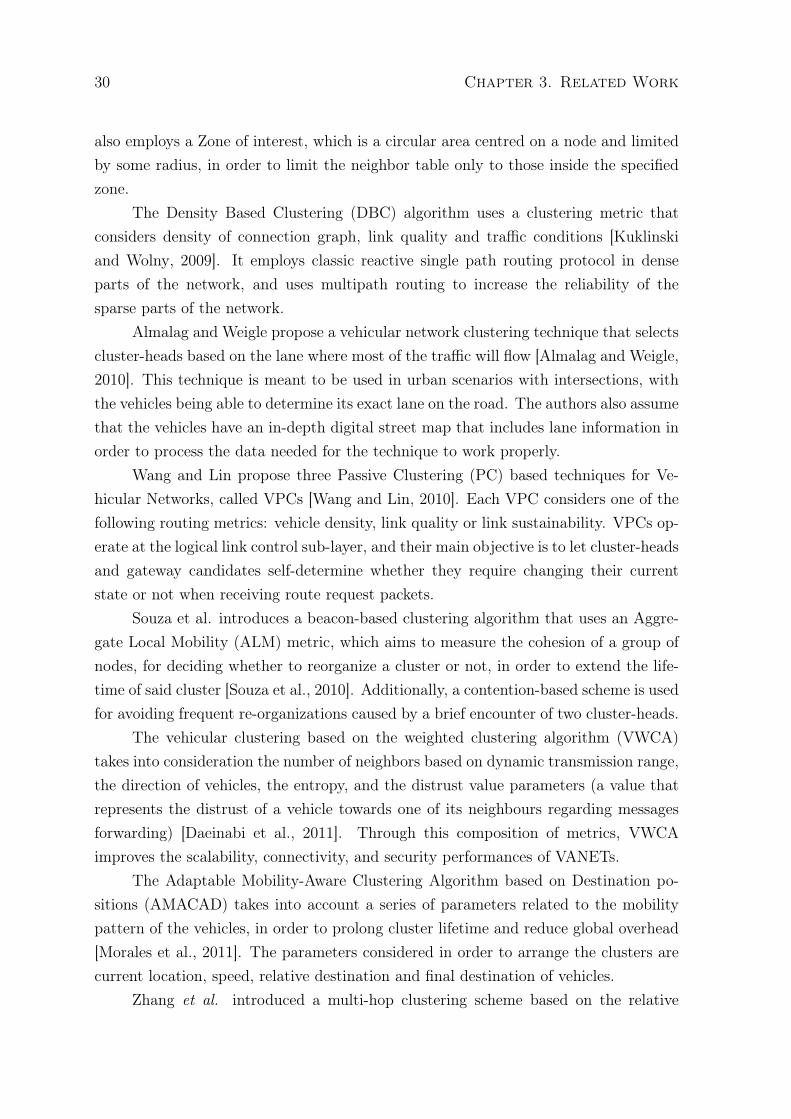
30 Chapter 3. Related Work
also employs a Zone of interest, which is a circular area centred on a node and limitedby some radius, in order to limit the neighbor table only to those inside the specifiedzone.
The Density Based Clustering (DBC) algorithm uses a clustering metric thatconsiders density of connection graph, link quality and traffic conditions [Kuklinskiand Wolny, 2009]. It employs classic reactive single path routing protocol in denseparts of the network, and uses multipath routing to increase the reliability of thesparse parts of the network.
Almalag and Weigle propose a vehicular network clustering technique that selectscluster-heads based on the lane where most of the traffic will flow [Almalag and Weigle,2010]. This technique is meant to be used in urban scenarios with intersections, withthe vehicles being able to determine its exact lane on the road. The authors also assumethat the vehicles have an in-depth digital street map that includes lane information inorder to process the data needed for the technique to work properly.
Wang and Lin propose three Passive Clustering (PC) based techniques for Ve-hicular Networks, called VPCs [Wang and Lin, 2010]. Each VPC considers one of thefollowing routing metrics: vehicle density, link quality or link sustainability. VPCs op-erate at the logical link control sub-layer, and their main objective is to let cluster-headsand gateway candidates self-determine whether they require changing their currentstate or not when receiving route request packets.
Souza et al. introduces a beacon-based clustering algorithm that uses an Aggre-gate Local Mobility (ALM) metric, which aims to measure the cohesion of a group ofnodes, for deciding whether to reorganize a cluster or not, in order to extend the life-time of said cluster [Souza et al., 2010]. Additionally, a contention-based scheme is usedfor avoiding frequent re-organizations caused by a brief encounter of two cluster-heads.
The vehicular clustering based on the weighted clustering algorithm (VWCA)takes into consideration the number of neighbors based on dynamic transmission range,the direction of vehicles, the entropy, and the distrust value parameters (a value thatrepresents the distrust of a vehicle towards one of its neighbours regarding messagesforwarding) [Daeinabi et al., 2011]. Through this composition of metrics, VWCAimproves the scalability, connectivity, and security performances of VANETs.
The Adaptable Mobility-Aware Clustering Algorithm based on Destination po-sitions (AMACAD) takes into account a series of parameters related to the mobilitypattern of the vehicles, in order to prolong cluster lifetime and reduce global overhead[Morales et al., 2011]. The parameters considered in order to arrange the clusters arecurrent location, speed, relative destination and final destination of vehicles.
Zhang et al. introduced a multi-hop clustering scheme based on the relative
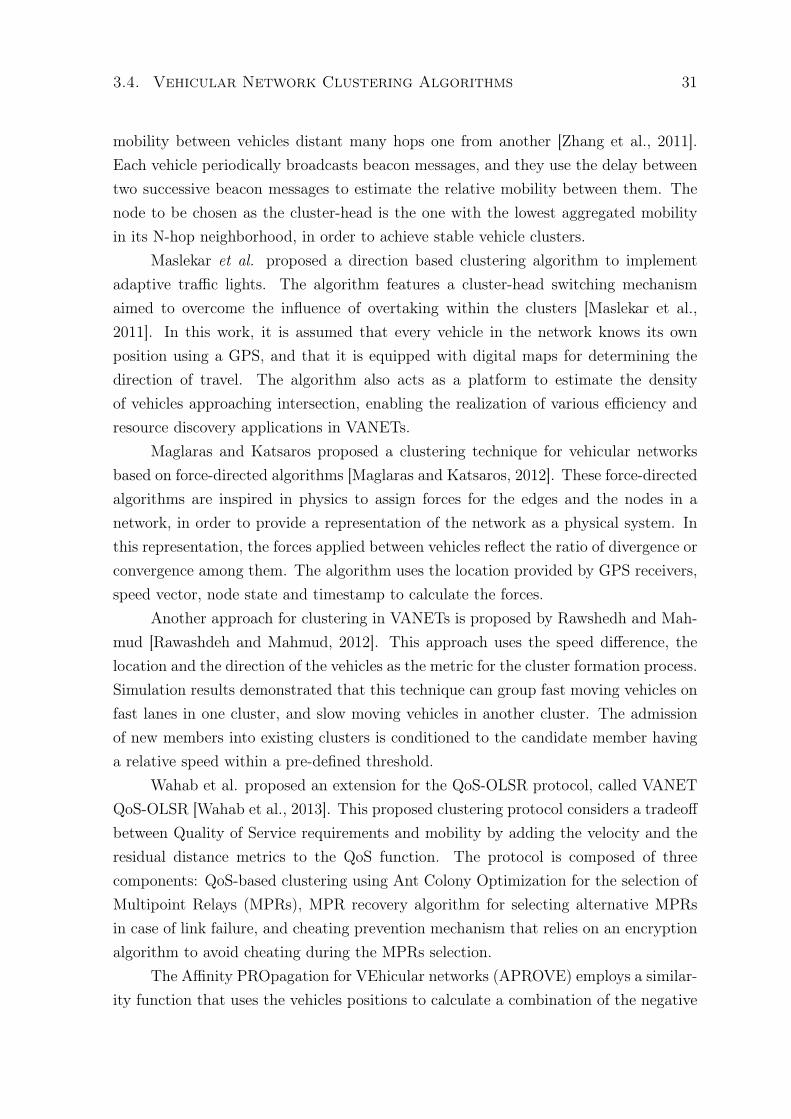
3.4. Vehicular Network Clustering Algorithms 31
mobility between vehicles distant many hops one from another [Zhang et al., 2011].Each vehicle periodically broadcasts beacon messages, and they use the delay betweentwo successive beacon messages to estimate the relative mobility between them. Thenode to be chosen as the cluster-head is the one with the lowest aggregated mobilityin its N-hop neighborhood, in order to achieve stable vehicle clusters.
Maslekar et al. proposed a direction based clustering algorithm to implementadaptive traffic lights. The algorithm features a cluster-head switching mechanismaimed to overcome the influence of overtaking within the clusters [Maslekar et al.,2011]. In this work, it is assumed that every vehicle in the network knows its ownposition using a GPS, and that it is equipped with digital maps for determining thedirection of travel. The algorithm also acts as a platform to estimate the densityof vehicles approaching intersection, enabling the realization of various efficiency andresource discovery applications in VANETs.
Maglaras and Katsaros proposed a clustering technique for vehicular networksbased on force-directed algorithms [Maglaras and Katsaros, 2012]. These force-directedalgorithms are inspired in physics to assign forces for the edges and the nodes in anetwork, in order to provide a representation of the network as a physical system. Inthis representation, the forces applied between vehicles reflect the ratio of divergence orconvergence among them. The algorithm uses the location provided by GPS receivers,speed vector, node state and timestamp to calculate the forces.
Another approach for clustering in VANETs is proposed by Rawshedh and Mah-mud [Rawashdeh and Mahmud, 2012]. This approach uses the speed difference, thelocation and the direction of the vehicles as the metric for the cluster formation process.Simulation results demonstrated that this technique can group fast moving vehicles onfast lanes in one cluster, and slow moving vehicles in another cluster. The admissionof new members into existing clusters is conditioned to the candidate member havinga relative speed within a pre-defined threshold.
Wahab et al. proposed an extension for the QoS-OLSR protocol, called VANETQoS-OLSR [Wahab et al., 2013]. This proposed clustering protocol considers a tradeoffbetween Quality of Service requirements and mobility by adding the velocity and theresidual distance metrics to the QoS function. The protocol is composed of threecomponents: QoS-based clustering using Ant Colony Optimization for the selection ofMultipoint Relays (MPRs), MPR recovery algorithm for selecting alternative MPRsin case of link failure, and cheating prevention mechanism that relies on an encryptionalgorithm to avoid cheating during the MPRs selection.
The Affinity PROpagation for VEhicular networks (APROVE) employs a similar-ity function that uses the vehicles positions to calculate a combination of the negative
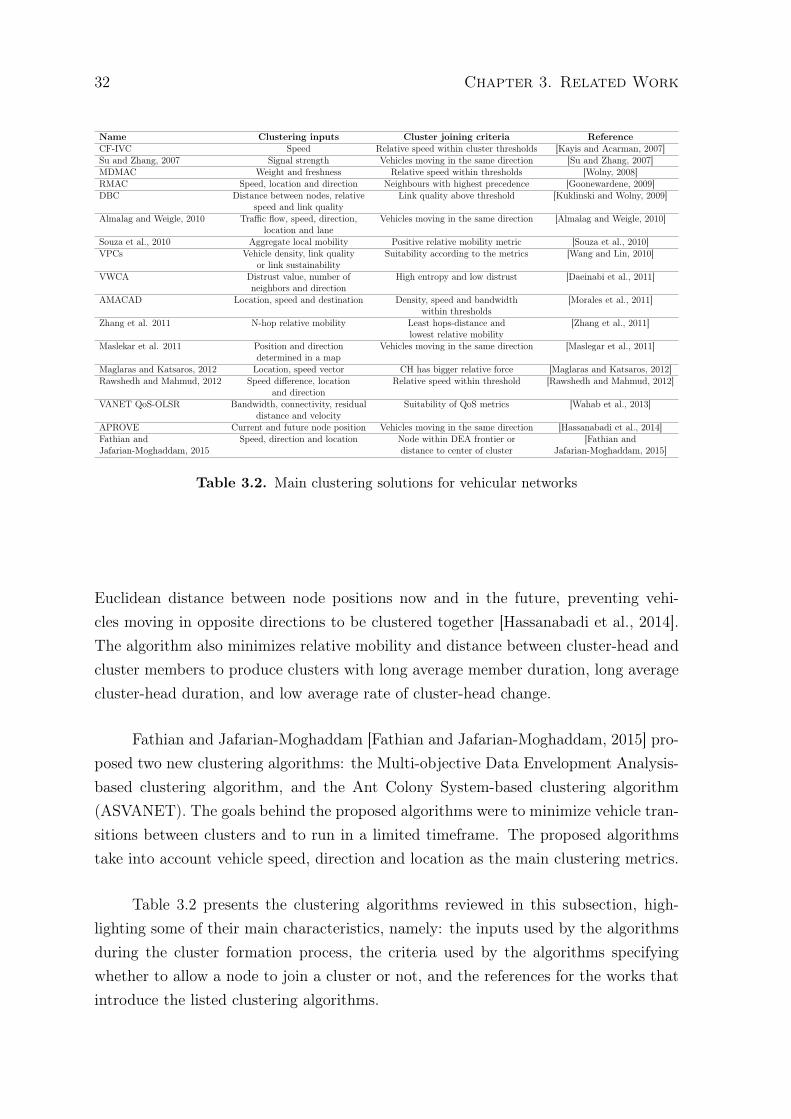
32 Chapter 3. Related Work
Name Clustering inputs Cluster joining criteria ReferenceCF-IVC Speed Relative speed within cluster thresholds [Kayis and Acarman, 2007]Su and Zhang, 2007 Signal strength Vehicles moving in the same direction [Su and Zhang, 2007]MDMAC Weight and freshness Relative speed within thresholds [Wolny, 2008]RMAC Speed, location and direction Neighbours with highest precedence [Goonewardene, 2009]DBC Distance between nodes, relative Link quality above threshold [Kuklinski and Wolny, 2009]
speed and link qualityAlmalag and Weigle, 2010 Traffic flow, speed, direction, Vehicles moving in the same direction [Almalag and Weigle, 2010]
location and laneSouza et al., 2010 Aggregate local mobility Positive relative mobility metric [Souza et al., 2010]VPCs Vehicle density, link quality Suitability according to the metrics [Wang and Lin, 2010]
or link sustainabilityVWCA Distrust value, number of High entropy and low distrust [Daeinabi et al., 2011]
neighbors and directionAMACAD Location, speed and destination Density, speed and bandwidth [Morales et al., 2011]
within thresholdsZhang et al. 2011 N-hop relative mobility Least hops-distance and [Zhang et al., 2011]
lowest relative mobilityMaslekar et al. 2011 Position and direction Vehicles moving in the same direction [Maslegar et al., 2011]
determined in a mapMaglaras and Katsaros, 2012 Location, speed vector CH has bigger relative force [Maglaras and Katsaros, 2012]Rawshedh and Mahmud, 2012 Speed difference, location Relative speed within threshold [Rawshedh and Mahmud, 2012]
and directionVANET QoS-OLSR Bandwidth, connectivity, residual Suitability of QoS metrics [Wahab et al., 2013]
distance and velocityAPROVE Current and future node position Vehicles moving in the same direction [Hassanabadi et al., 2014]Fathian and Speed, direction and location Node within DEA frontier or [Fathian andJafarian-Moghaddam, 2015 distance to center of cluster Jafarian-Moghaddam, 2015]
Table 3.2. Main clustering solutions for vehicular networks
Euclidean distance between node positions now and in the future, preventing vehi-cles moving in opposite directions to be clustered together [Hassanabadi et al., 2014].The algorithm also minimizes relative mobility and distance between cluster-head andcluster members to produce clusters with long average member duration, long averagecluster-head duration, and low average rate of cluster-head change.
Fathian and Jafarian-Moghaddam [Fathian and Jafarian-Moghaddam, 2015] pro-posed two new clustering algorithms: the Multi-objective Data Envelopment Analysis-based clustering algorithm, and the Ant Colony System-based clustering algorithm(ASVANET). The goals behind the proposed algorithms were to minimize vehicle tran-sitions between clusters and to run in a limited timeframe. The proposed algorithmstake into account vehicle speed, direction and location as the main clustering metrics.
Table 3.2 presents the clustering algorithms reviewed in this subsection, high-lighting some of their main characteristics, namely: the inputs used by the algorithmsduring the cluster formation process, the criteria used by the algorithms specifyingwhether to allow a node to join a cluster or not, and the references for the works thatintroduce the listed clustering algorithms.
3.5. Chapter Conclusions 33
3.5 Chapter Conclusions
This chapter presented a literature review of Delay-Tolerant Network Management,Vehicular Network Management and Vehicular Network Clustering Algorithms. Thesetopics were chosen due to their proximity to the theme of this thesis.
Despite some proposals for solving the DTN management problems being avail-able in the literature, there is still plenty of space for more research in this area.First, the number of papers regarding DTN management is still limited. Moreover,the proposed DTN management solutions usually take into consideration specific DTNscenarios (e.g., space networks, interconnection of remote villages, vehicular networks,etc.), and some of these scenarios were little explored by the investigations currentlyavailable, such as vehicular networks.
Management solutions for Vehicular Networks are scarce in comparison to DTNin general. It is important to notice that there are challenges imposed by VehicularNetworks that are inherent to this specific type of network, specially the fast andpredictable mobility of the nodes and the strict communication latency requirementsthat some applications impose. The impact of these challenges in management systemsmust be further studied, so more effective and reliable solutions for vehicular networkmanagement can be found.
This chapter presented a number of clustering techniques for vehicular networks.Each technique is based on a set of assumptions and desired characteristics, makingeach of them suitable for a certain number of scenarios. However there are still scenariosin the vehicular networks universe where none of the presented clustering techniques isfit for providing the desired results (Chapter 4 includes an example of such scenario).Hence, the design of new clustering algorithms for vehicular networks is still a validresearch problem.

Chapter 4
The HE-MAN Architecture
This chapter presents a new architecture for the management of Vehicular Delay-Tolerant Networks. For a proper comprehension of the remainder of this chapter,it is important that some definitions are made clear.
Definition 4.1. A network management architecture is a collection of differentcomponents that interact with each other in order to provide the means necessary for anetwork to be managed. The most common components found in network managementarchitectures are managers and agents.
Definition 4.2. A manager is a component of a network management architecturethat manages other nodes in the network. A manager can either perform its tasks inan autonomous fashion, or act as an intermediate entity between managed nodes andnetwork operators.
Definition 4.3. An agent is a component of a network management architecture thatinteracts with the pieces of hardware and software of network nodes in order to makesaid nodes manageable.
The architecture presented in this chapter is composed of a set of algorithmsand definitions that a) organizes the topology of managers and agents; b) monitorsdevices and services in a way that is suited for VDTNs; and c) implements configurationtechniques that deal with control commands being issued to vehicular nodes not only insituations where long delays are involved, but also in situations where the configurationmust occur with strict time restraints (such as safety applications). The next sectionpresents an overview of this architecture.
35
36 Chapter 4. The HE-MAN Architecture
4.1 HiErarchical MANagement (HE-MAN)
Architecture for Vehicular Delay-Tolerant
Networks
VDTN management presents unique requirements, such as the provision of near real-time management capabilities in order to allow the management of delay-sensitiveapplications, like road safety systems. Therefore, the Hierarchical MANagement (HE-MAN) Architecture for Vehicular Delay-Tolerant Networks is proposed with the ob-jective of fulfilling the VDTN management objective, as stated in Definition 2.4.5presented in Chapter 2. The HE-MAN architecture can be defined as the following:
Definition 4.4. HE-MAN is an architecture designed for managing networks that ex-perience frequent network partitioning and that need to run delay-sensitive systems(e.g., VDTNs) through the usage of a hierarchical organization of its components. Theestablished hierarchy aims to detect connected group of nodes to establish local man-agers and to take advantage of local communication opportunities for achieving nearreal-time management. The architecture is composed of a set of managers, one Top-Level Manager for the entire VDTN and a set of Mid-Level Managers, one per group ofconnected nodes. The remainder components found in the HE-MAN architecture areagents, and protocols for organizing message exchanges and the logical organization ofthe VDTN’s topology.
HE-MAN takes advantage of local communication opportunities (which is fasterand more reliable), while avoiding remote communication whenever possible (slowerand less reliable). This strategy allows the management of applications and deviceswith little tolerance to communication delay. On the other hand, applications thatare not sensitive to delays can be managed via remote communication. In VDTN,the division of the management tasks in local and remote tasks can be accomplishedwith a hierarchical architecture, where Mid-Level Managers (MLMs) manage locallyconnected groups. In the scope of this work, a locally connected group exists whenat least two nodes are within transmission range of each other. Vehicles that are notwithin the transmission range of any other node are considered isolated.
MLMs can perform tasks delegated by the VDTN’s Top-Level Manager (TLM),which is a unique central entity that manages an entire vehicular network (e.g., theoperational center of an enterprise that runs a fleet of vehicles). The TLM can beimplemented by a single stationary node in the network, or it can be distributed imple-mented by permanently linked infrastructures, such as RSUs. All MLMs established
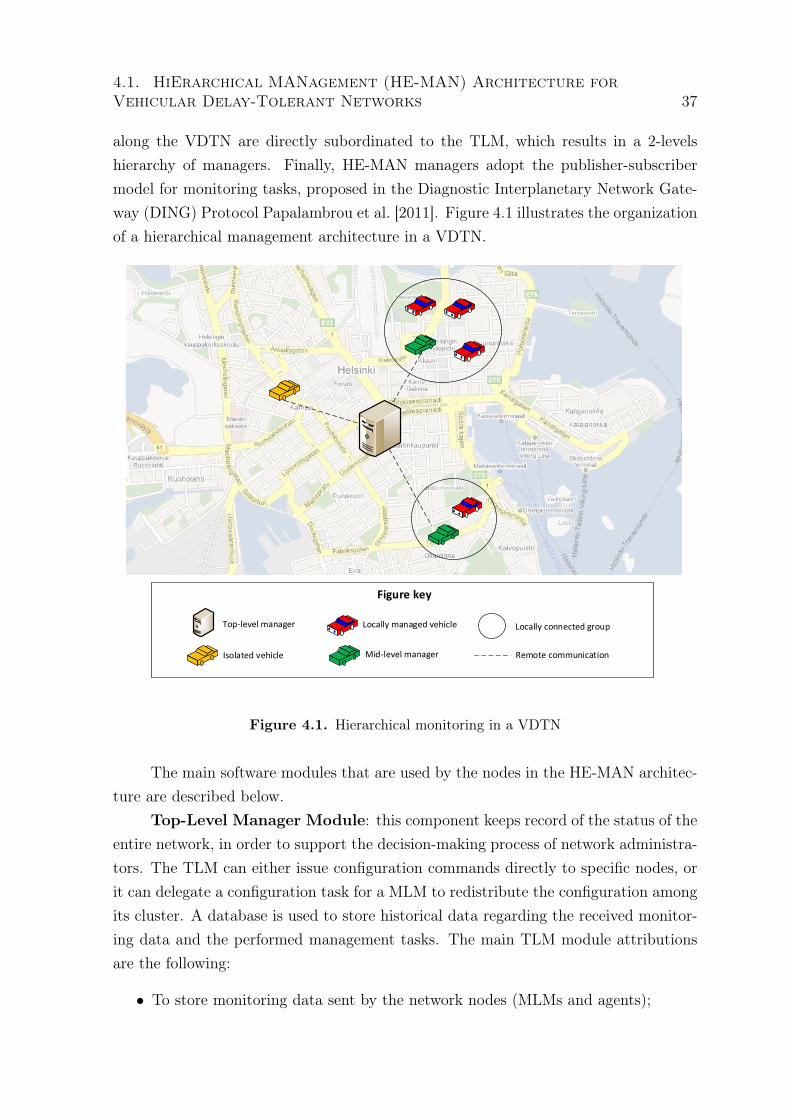
4.1. HiErarchical MANagement (HE-MAN) Architecture forVehicular Delay-Tolerant Networks 37
along the VDTN are directly subordinated to the TLM, which results in a 2-levelshierarchy of managers. Finally, HE-MAN managers adopt the publisher-subscribermodel for monitoring tasks, proposed in the Diagnostic Interplanetary Network Gate-way (DING) Protocol Papalambrou et al. [2011]. Figure 4.1 illustrates the organizationof a hierarchical management architecture in a VDTN.
Isolated vehicle
Locally managed vehicle
Mid-level manager
Top-level manager
Figure key
Remote communication
Locally connected group
Figure 4.1. Hierarchical monitoring in a VDTN
The main software modules that are used by the nodes in the HE-MAN architec-ture are described below.
Top-Level Manager Module: this component keeps record of the status of theentire network, in order to support the decision-making process of network administra-tors. The TLM can either issue configuration commands directly to specific nodes, orit can delegate a configuration task for a MLM to redistribute the configuration amongits cluster. A database is used to store historical data regarding the received monitor-ing data and the performed management tasks. The main TLM module attributionsare the following:
• To store monitoring data sent by the network nodes (MLMs and agents);
38 Chapter 4. The HE-MAN Architecture
• To issue new configuration commands from managers to any network node;
• To issue new management functionalities for MLMs;
Mid-Level Manager Module: the MLM module is responsible for implement-ing the management functions that this type of node must perform within the clusters.Therefore, this module must be able to process monitoring data sent by other membersof the cluster, and to react to detected faults in a quick and reliable manner. Moreover,the MLM module needs to issue periodic messages to the TLM with monitoring dataregarding its own cluster, and to redistribute configuration commands to other cluster’smembers whenever requested by the TLM.
The main functionalities of the MLM module are the following:
• To receive monitoring data from subscribed nodes;
• To treat detected faults, following pre-installed procedures;
• To redistribute configuration commands among its agents whenever ordered bythe TLM.
Agent Module: this module employs the publisher-subscriber scheme for mon-itoring tasks. An implementation of a regular SNMP agent is used to access manage-ment objects within the VDTN nodes, in order to achieve a certain level of compatibilitywith management solutions that rely on SNMP. A database is also used in the vehicu-lar nodes, in order to locally store management-related data that can be retrieved byexternal managers in case of any kind of data loss (e.g., bundles not delivered, dataloss in the TLM’s database, etc.).
The functionalities of the agent module are the following:
• To provide monitoring data to MLMs and TLM;
• To instantiate newly received configurations.
Both Mid-Level Manager Module and Agent Module are installed in vehicularnodes, enabling these nodes to perform any of these roles whenever needed. This pro-vides flexibility to the network, making it easy to transform a common agent node intoa MLM, or vice-versa. Figure 4.2 illustrates the organization of HE-MAN’s softwaremodules: the TLM module on the left-hand side, and the Agent and MLM modules onthe right-hand side. These last two modules are grouped together in the figure due tothe similarity between them, being differentiated only by the presence of the HE-MANMLM or HE-MAN Agent as the core component.
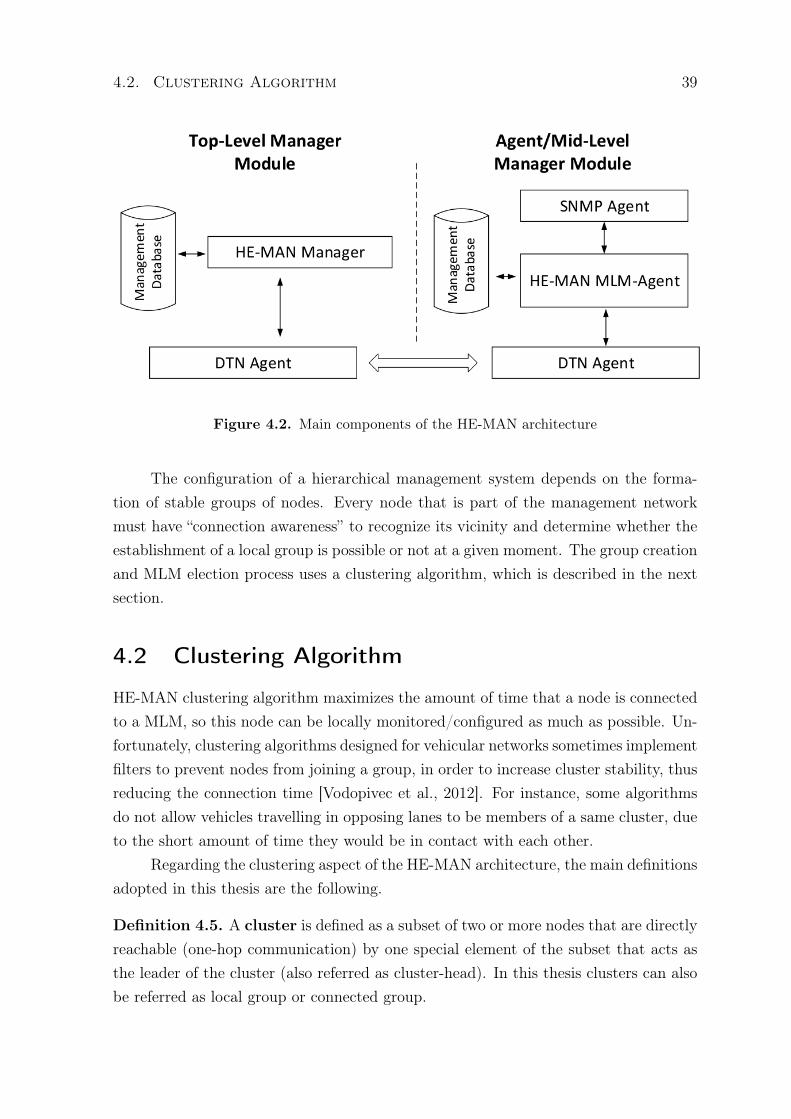
4.2. Clustering Algorithm 39
Figure 4.2. Main components of the HE-MAN architecture
The configuration of a hierarchical management system depends on the forma-tion of stable groups of nodes. Every node that is part of the management networkmust have “connection awareness” to recognize its vicinity and determine whether theestablishment of a local group is possible or not at a given moment. The group creationand MLM election process uses a clustering algorithm, which is described in the nextsection.
4.2 Clustering Algorithm
HE-MAN clustering algorithm maximizes the amount of time that a node is connectedto a MLM, so this node can be locally monitored/configured as much as possible. Un-fortunately, clustering algorithms designed for vehicular networks sometimes implementfilters to prevent nodes from joining a group, in order to increase cluster stability, thusreducing the connection time [Vodopivec et al., 2012]. For instance, some algorithmsdo not allow vehicles travelling in opposing lanes to be members of a same cluster, dueto the short amount of time they would be in contact with each other.
Regarding the clustering aspect of the HE-MAN architecture, the main definitionsadopted in this thesis are the following.
Definition 4.5. A cluster is defined as a subset of two or more nodes that are directlyreachable (one-hop communication) by one special element of the subset that acts asthe leader of the cluster (also referred as cluster-head). In this thesis clusters can alsobe referred as local group or connected group.
40 Chapter 4. The HE-MAN Architecture
Definition 4.6. The cluster-head is an unique node within a cluster that acts as theleader of the cluster. Hence, every other member of a cluster establishes some kind ofcommunication with the cluster-head, resulting in the cluster-head ultimately definingthe range of the cluster with its own communication range. In the scope of this thesis,the cluster-head is always the MLM of the cluster.
Definition 4.7. The role of a cluster node can be defined as a specific way this nodeinteracts with the other members of the cluster. There are three possible roles thatcluster nodes can perform, as further explained later in this section: MLM, agent orisolated.
Definition 4.8. A beacon message is defined as a type of message periodicallyissued by a VDTN node with the objective of sending to nearby nodes updates onsome property of interest. For instance, a node can issue beacon messages informingto other nodes what role it is currently performing.
The next subsection presents a general description of the algorithm, explainingit with a high level of abstraction. Next, the various procedures that compose theclustering algorithm are presented and detailed.
4.2.1 General description of the algorithm
The HE-MAN algorithm relies on information of the connectivity history of nodes tocreate clusters with high stability. However, it does so without preventing nodes fromjoining certain groups, as other algorithms usually do. Furthermore, our clusteringalgorithm attempts to maximize the amount of time that a node spends connectedto one of the VDTN clusters. To the best of our knowledge, an algorithm with suchcharacteristics is not available in the literature.
In HE-MAN clustering algorithm, the detection of neighboring nodes is based onperiodic beacon messages. Only neighbors within a 1-hop distance are detected, whichmeans that each formed cluster will also encompass nodes that are 1-hop away fromthe cluster-head. This avoids the need for retransmission of beacon messages, whichwould increase the complexity and decrease the overall performance of the algorithm.Moreover, the HE-MAN clustering algorithm assumes that all nodes in the networkare homogeneous.
A node can assume one of three roles: isolated, agent or MLM:
• Isolated: nodes that have no active contact with other nodes. Its objective is toidentify opportunities of joining existing clusters or creating new clusters;
4.2. Clustering Algorithm 41
• MLM: the cluster-heads. Its main objectives are to maintain updated dataabout the current state of the cluster, and to initiate cluster-head transferenceoperations whenever needed;
• Agent: it is a member of a cluster, but not its cluster-head. Nodes performingthis role are constantly feeding the MLM (cluster-head) with monitoring data.
Beacon messages transport information concerning basic properties of a node(e.g., network address, vehicle identification, vehicle speed, etc.), as well as its Con-nection Score (connScore). The connScore is a metric that represents the history ofconnection opportunities that a node had, and it is used to determine if such node is thefittest for the MLM role in a cluster. This metric gives priority to nodes that are consis-tently establishing contacts with other nodes. Each node calculates its own connScoreby sampling the number of active contacts at a given time, and then calculating thesamples’ Exponentially Weighted Moving Average (EWMA) [Roberts, 1959].
The EWMA is a statistic that processes historical data through a calculation thatprovides means for older values to be progressively “forgotten”. The calculated EWMAcan have a long memory or a short memory, depending on the definition of a constantλ. The EWMA can be calculated using the equation below:yt = yt−1λ+ (1− λ)yt (1)The yt variable is an observed value at time t, yt−1 is the old calculated EWMA, and λis a constant (0 < λ < 1) that determines the depth of memory of the EWMA [Hunter,1986]. By employing the EWMA statistic in the proposed clustering algorithm, it ispossible to control how much impact older samples of a node’s connScore will have overnew samples, which provides a final connScore value that reflects better the currentconnectivity state of a node. Algorithm 1 shows how the connScore metric is calculatedby vehicular nodes.
Algorithm 1 calculateConnScore() function1: function calculateConnScore()2: previousConnScore← getConnScore();3: activeConnNumber ← getActiveConnectionsNumber();4: return (λ ∗ previousConnScore) + ((1− λ) ∗ activeConnNumber)5: end function
4.2.2 Algorithms’ details
The procedure update, described in Algorithm 2, is periodically executed (e.g., everysecond) by each node of the VDTN. The first thing this procedure does is to update
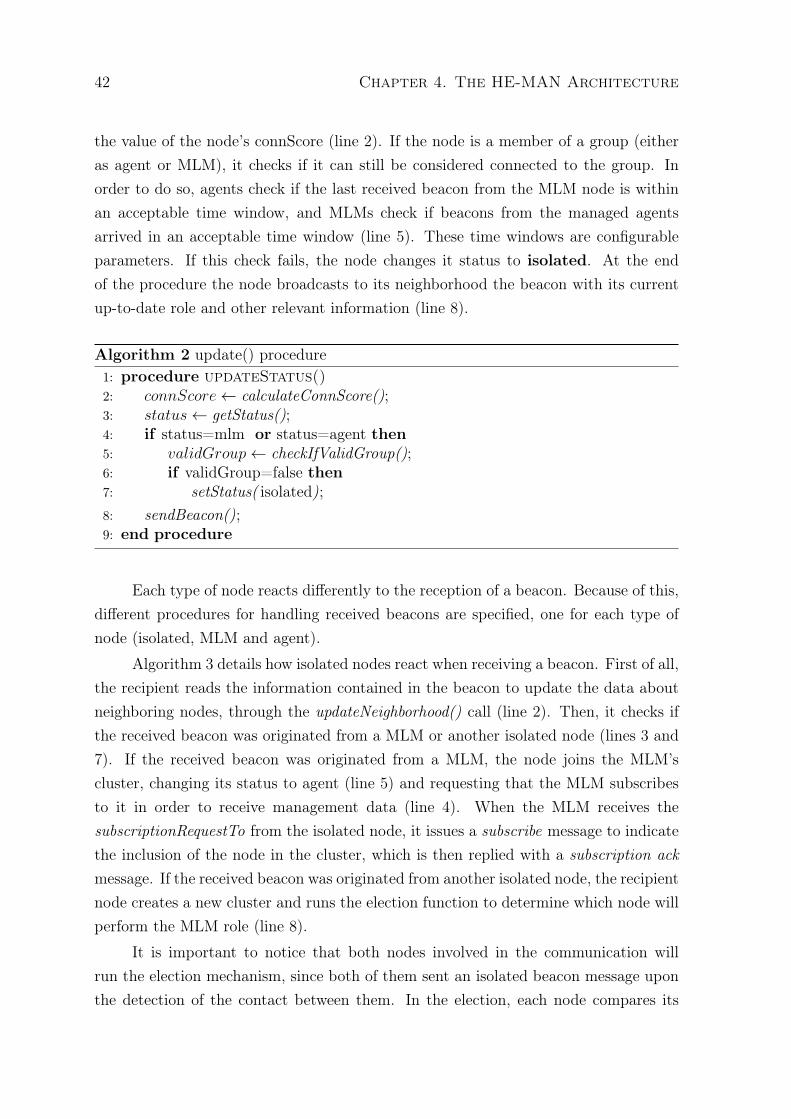
42 Chapter 4. The HE-MAN Architecture
the value of the node’s connScore (line 2). If the node is a member of a group (eitheras agent or MLM), it checks if it can still be considered connected to the group. Inorder to do so, agents check if the last received beacon from the MLM node is withinan acceptable time window, and MLMs check if beacons from the managed agentsarrived in an acceptable time window (line 5). These time windows are configurableparameters. If this check fails, the node changes it status to isolated. At the endof the procedure the node broadcasts to its neighborhood the beacon with its currentup-to-date role and other relevant information (line 8).
Algorithm 2 update() procedure1: procedure updateStatus()2: connScore← calculateConnScore();3: status← getStatus();4: if status=mlm or status=agent then5: validGroup← checkIfValidGroup();6: if validGroup=false then7: setStatus( isolated);8: sendBeacon();9: end procedure
Each type of node reacts differently to the reception of a beacon. Because of this,different procedures for handling received beacons are specified, one for each type ofnode (isolated, MLM and agent).
Algorithm 3 details how isolated nodes react when receiving a beacon. First of all,the recipient reads the information contained in the beacon to update the data aboutneighboring nodes, through the updateNeighborhood() call (line 2). Then, it checks ifthe received beacon was originated from a MLM or another isolated node (lines 3 and7). If the received beacon was originated from a MLM, the node joins the MLM’scluster, changing its status to agent (line 5) and requesting that the MLM subscribesto it in order to receive management data (line 4). When the MLM receives thesubscriptionRequestTo from the isolated node, it issues a subscribe message to indicatethe inclusion of the node in the cluster, which is then replied with a subscription ackmessage. If the received beacon was originated from another isolated node, the recipientnode creates a new cluster and runs the election function to determine which node willperform the MLM role (line 8).
It is important to notice that both nodes involved in the communication willrun the election mechanism, since both of them sent an isolated beacon message uponthe detection of the contact between them. In the election, each node compares its

4.2. Clustering Algorithm 43
connScore to the connScore of the others: whichever has the highest connScore assumesthe role of MLM. In case of a tie, the node with the highest address wins.
Finally, the elected MLM subscribes to the other node of the cluster (line 10), inorder to start monitoring them. The node that lost the election remains in the isolatedrole, waiting for the elected MLM to request the subscription. Cluster nodes, afterreceiving the subscription request, change their status to agent and reply the MLMwith a subscription ack message. Figure 4.3 shows the behavior shown by an isolatednode according to the different types of beacon messages it can receive.
Send subscription
request
Send Subscription
Ack
Set role to Agent
(see Figure 4.5)
Run election
Receive beacon message
Determine beacon
message type
Beacon from Agent Node?
Beacon from MLM Node?
Beacon from Isolated Node?
Yes
No No
No
Yes Yes
Received Subscribe Message?
No
Yes
Won election?No
Yes
Set role to MLM
(see Figure 4.4)
Start End
Figure 4.3. Behavior of isolated nodes according to the received type of beaconmessage
In HE-MAN’s clustering algorithm, there are two possibilities for the MLM roleto be transfered from one node to another:
• Group merge: a group merge occurs when MLMs of different clusters get withinthe range of each other for a period of time longer than a pre-configured threshold.In such case, the MLM with the highest connScore becomes the unique MLM ofall the clusters involved in the merging operation, and the cluster established asthe result of the merging is bounded by the transmission radius of the chosenMLM;
• MLM transfer: it occurs within a cluster, when an agent is connected to thecluster for a period of time longer than a pre-configure threshold, and it has a
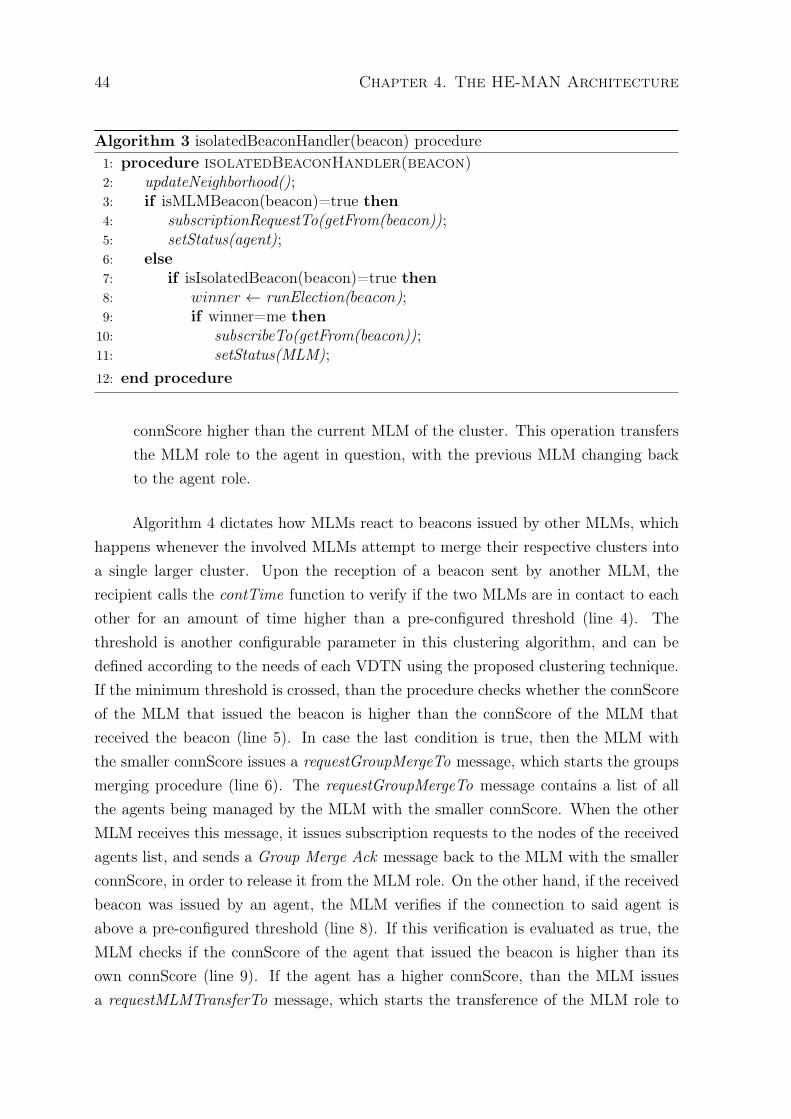
44 Chapter 4. The HE-MAN Architecture
Algorithm 3 isolatedBeaconHandler(beacon) procedure1: procedure isolatedBeaconHandler(beacon)2: updateNeighborhood();3: if isMLMBeacon(beacon)=true then4: subscriptionRequestTo(getFrom(beacon));5: setStatus(agent);6: else7: if isIsolatedBeacon(beacon)=true then8: winner ← runElection(beacon);9: if winner=me then
10: subscribeTo(getFrom(beacon));11: setStatus(MLM);12: end procedure
connScore higher than the current MLM of the cluster. This operation transfersthe MLM role to the agent in question, with the previous MLM changing backto the agent role.
Algorithm 4 dictates how MLMs react to beacons issued by other MLMs, whichhappens whenever the involved MLMs attempt to merge their respective clusters intoa single larger cluster. Upon the reception of a beacon sent by another MLM, therecipient calls the contTime function to verify if the two MLMs are in contact to eachother for an amount of time higher than a pre-configured threshold (line 4). Thethreshold is another configurable parameter in this clustering algorithm, and can bedefined according to the needs of each VDTN using the proposed clustering technique.If the minimum threshold is crossed, than the procedure checks whether the connScoreof the MLM that issued the beacon is higher than the connScore of the MLM thatreceived the beacon (line 5). In case the last condition is true, then the MLM withthe smaller connScore issues a requestGroupMergeTo message, which starts the groupsmerging procedure (line 6). The requestGroupMergeTo message contains a list of allthe agents being managed by the MLM with the smaller connScore. When the otherMLM receives this message, it issues subscription requests to the nodes of the receivedagents list, and sends a Group Merge Ack message back to the MLM with the smallerconnScore, in order to release it from the MLM role. On the other hand, if the receivedbeacon was issued by an agent, the MLM verifies if the connection to said agent isabove a pre-configured threshold (line 8). If this verification is evaluated as true, theMLM checks if the connScore of the agent that issued the beacon is higher than itsown connScore (line 9). If the agent has a higher connScore, than the MLM issuesa requestMLMTransferTo message, which starts the transference of the MLM role to
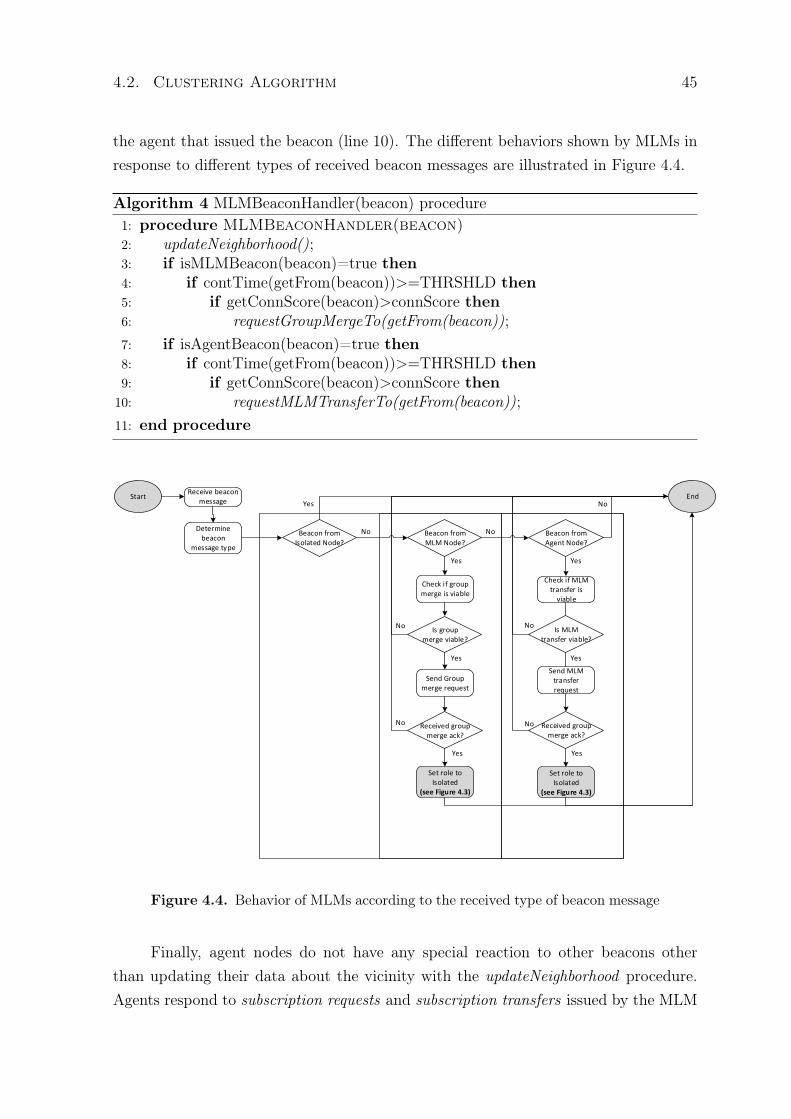
4.2. Clustering Algorithm 45
the agent that issued the beacon (line 10). The different behaviors shown by MLMs inresponse to different types of received beacon messages are illustrated in Figure 4.4.
Algorithm 4 MLMBeaconHandler(beacon) procedure1: procedure MLMBeaconHandler(beacon)2: updateNeighborhood();3: if isMLMBeacon(beacon)=true then4: if contTime(getFrom(beacon))>=THRSHLD then5: if getConnScore(beacon)>connScore then6: requestGroupMergeTo(getFrom(beacon));7: if isAgentBeacon(beacon)=true then8: if contTime(getFrom(beacon))>=THRSHLD then9: if getConnScore(beacon)>connScore then
10: requestMLMTransferTo(getFrom(beacon));11: end procedure
w
Check if group merge is viable
Send Group merge request
Set role to Isolated
(see Figure 4.3)
Check if MLM transfer is
viable
Send MLM transfer request
Receive beacon message
Determine beacon
message type
Beacon from Isolated Node?
Beacon from MLM Node?
Beacon from Agent Node?
Yes
No No
No
Yes Yes
Is group merge viable?
No
Yes
Received group merge ack?
Yes
No
Is MLM transfer viable?
No
Yes
Received group merge ack?
Set role to Isolated
(see Figure 4.3)
Yes
No
Start End
Figure 4.4. Behavior of MLMs according to the received type of beacon message
Finally, agent nodes do not have any special reaction to other beacons otherthan updating their data about the vicinity with the updateNeighborhood procedure.Agents respond to subscription requests and subscription transfers issued by the MLM
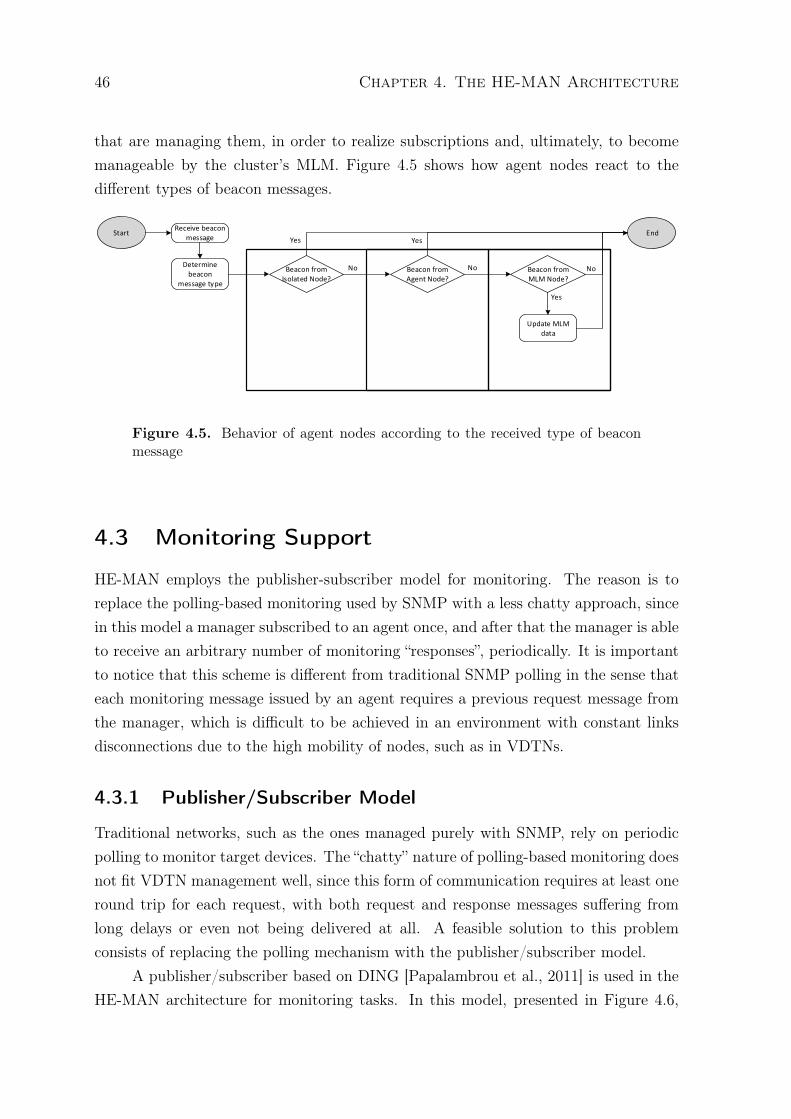
46 Chapter 4. The HE-MAN Architecture
that are managing them, in order to realize subscriptions and, ultimately, to becomemanageable by the cluster’s MLM. Figure 4.5 shows how agent nodes react to thedifferent types of beacon messages.
Update MLM data
Receive beacon message
Determine beacon
message type
Beacon from Isolated Node?
Beacon from MLM Node?
Beacon from Agent Node?
Yes
No
StartYes
No
Yes
No
End
Figure 4.5. Behavior of agent nodes according to the received type of beaconmessage
4.3 Monitoring Support
HE-MAN employs the publisher-subscriber model for monitoring. The reason is toreplace the polling-based monitoring used by SNMP with a less chatty approach, sincein this model a manager subscribed to an agent once, and after that the manager is ableto receive an arbitrary number of monitoring “responses”, periodically. It is importantto notice that this scheme is different from traditional SNMP polling in the sense thateach monitoring message issued by an agent requires a previous request message fromthe manager, which is difficult to be achieved in an environment with constant linksdisconnections due to the high mobility of nodes, such as in VDTNs.
4.3.1 Publisher/Subscriber Model
Traditional networks, such as the ones managed purely with SNMP, rely on periodicpolling to monitor target devices. The “chatty” nature of polling-based monitoring doesnot fit VDTN management well, since this form of communication requires at least oneround trip for each request, with both request and response messages suffering fromlong delays or even not being delivered at all. A feasible solution to this problemconsists of replacing the polling mechanism with the publisher/subscriber model.
A publisher/subscriber based on DING [Papalambrou et al., 2011] is used in theHE-MAN architecture for monitoring tasks. In this model, presented in Figure 4.6,
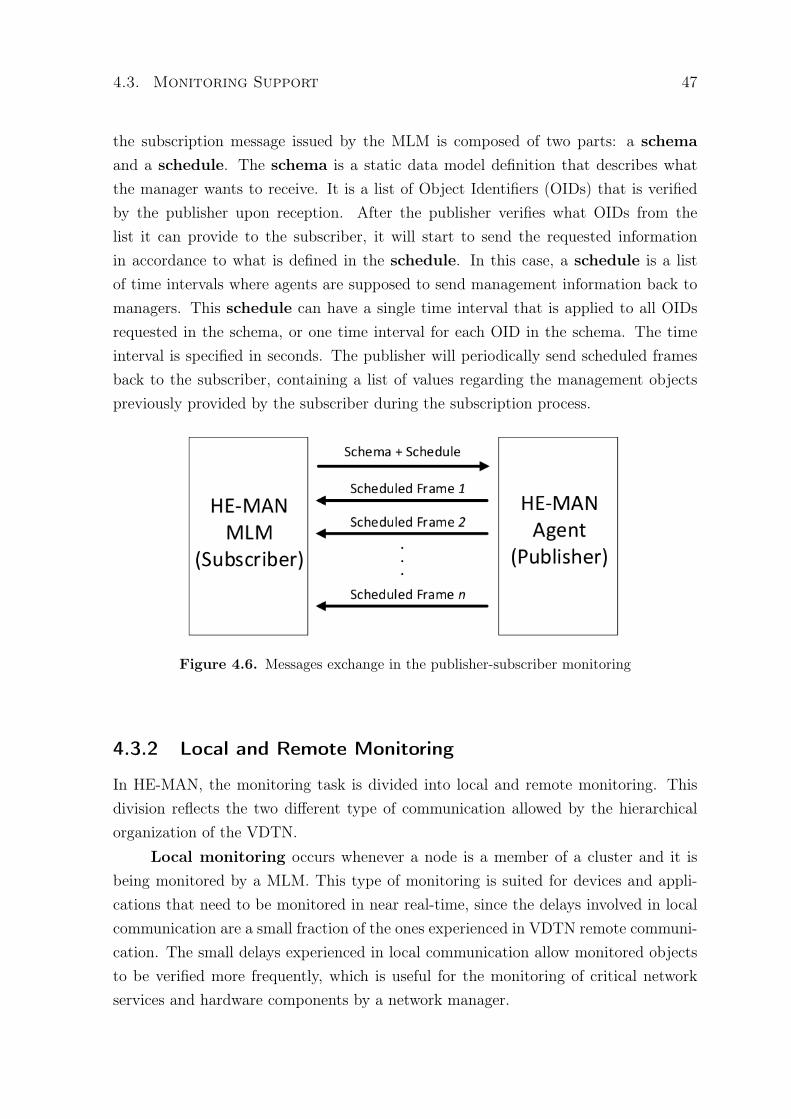
4.3. Monitoring Support 47
the subscription message issued by the MLM is composed of two parts: a schemaand a schedule. The schema is a static data model definition that describes whatthe manager wants to receive. It is a list of Object Identifiers (OIDs) that is verifiedby the publisher upon reception. After the publisher verifies what OIDs from thelist it can provide to the subscriber, it will start to send the requested informationin accordance to what is defined in the schedule. In this case, a schedule is a listof time intervals where agents are supposed to send management information back tomanagers. This schedule can have a single time interval that is applied to all OIDsrequested in the schema, or one time interval for each OID in the schema. The timeinterval is specified in seconds. The publisher will periodically send scheduled framesback to the subscriber, containing a list of values regarding the management objectspreviously provided by the subscriber during the subscription process.
Figure 4.6. Messages exchange in the publisher-subscriber monitoring
4.3.2 Local and Remote Monitoring
In HE-MAN, the monitoring task is divided into local and remote monitoring. Thisdivision reflects the two different type of communication allowed by the hierarchicalorganization of the VDTN.
Local monitoring occurs whenever a node is a member of a cluster and it isbeing monitored by a MLM. This type of monitoring is suited for devices and appli-cations that need to be monitored in near real-time, since the delays involved in localcommunication are a small fraction of the ones experienced in VDTN remote communi-cation. The small delays experienced in local communication allow monitored objectsto be verified more frequently, which is useful for the monitoring of critical networkservices and hardware components by a network manager.
48 Chapter 4. The HE-MAN Architecture
On the other hand, remote monitoring occurs whenever the TLM is the des-tination of the monitoring data. In this type of monitoring the transmitted data issubject to long delivery delays and a smaller delivery success ratio. However, the mainadvantage of remote monitoring is the fact that management data originated from dif-ferent parts of the VDTN is centralized in a single entity of the management system,which is the TLM. The centralization of “global” monitoring data in the TLM allows abetter comprehension of the network as a whole, which can support better managementdecisions by an automated system or a human operator.
A MLM can also periodically aggregate monitoring data received in a certaintime window in order to send to the VDTN’s TLM a single bundle with data regardingits whole cluster. The TLM can activate or deactivate the aggregation functionalityby issuing configuration commands to the MLMs (HE-MAN’s support to configurationcommands is explained in the next subsection). The main advantage provided bythis feature is the reduced number of bundles in the VDTN at a given moment withmonitoring data. One possible aggregation that could be implemented in the nodesis the calculation of averages and standard deviation of a given OID that deals withnumeric values. In this case, the MLM would gather the values of said OID issuedby the cluster’s agents, calculate the average and standard deviation regarding thereceived set of values and then sending to the TLM only these two calculated results,instead of a list of all values issued by each cluster member.
4.4 Configuration Support
Just as with the monitoring tasks, VDTNs’ connectivity limitations offer challenges toconfiguration tasks. Frequent link disconnections usually lead to configuration com-mands arriving too late at their destination, or not arriving at all. Because of this,management systems designed for VDTNs must provide means for the network to beable to be configured without relying exclusively on configuration commands beingissued through the Bundle Protocol Layer.
The HE-MAN architecture divides configuration-related operations into two cat-egories: local configuration and remote configuration. Local configuration is preferredwhenever the decision making process can be carried out exclusively using local in-formation gathered by the group’s MLM. On the other hand, when the configurationdepends on information regarding the VDTN as a whole, then remote configurationshould be employed. The subsections below provide further details on how local andremote configuration work in the HE-MAN architecture.
4.4. Configuration Support 49
4.4.1 Local Configuration
In HE-MAN, a configuration operation is local when a MLM issues configuration com-mands to one of the cluster members managed by it. Local configuration is suited forscenarios where delay-sensitive devices and/or services must be configured, requiringnew configurations to be transmitted in near real-time. The significant short delaysand higher delivery success ratio of local communication allows the MLM to detectissues almost instantly, similarly to what happens in regular connected networks. Be-cause of this, it is possible to implement complex interactive configuration processesinvolving successive monitoring operations followed by configuration commands beingissued. This kind of configuration cannot be achieved through the regular delay-tolerantcommunication used in VDTNs. A possible application for this type of configurationprocess is presented in Subsection 4.5.1.
4.4.2 Remote Configuration
Remote configuration occurs when the VDTN’s TLM is the entity issuing configu-ration commands. Similarly to the case of remote monitoring, remote configuration isperformed in a central point of the network where monitoring data concerning the en-tire network is stored, which usually leads to more well-founded management decisions.However, HE-MAN is able to deal with a configuration command issued by the TLMarriving at its destination too late to be still valid, due to the long transmission delays.Because of this, in HE-MAN a TLM is able to create configuration scripts containinga set of configuration commands that are executed only if certain conditions are met.These conditions are meant to assess if the issue being approached is still valid whenthe configuration message reaches its final destination. The structure of the remoteconfiguration message can be described as follows:
• Conditional expression: configuration messages carry a conditional expres-sion, primarily to check if the state of the targeted node is still the same. Eachexpression is composed of a reference to an Object IDentifier (OID), a relationaloperator (<, >, ==, <=, >=, or !=) and a constant. Relation expressions canbe connected by AND and OR operators, in order to enable the evaluation ofmultiple conditions in the destination node;
• Cluster configuration flag: when the TLM issues a configuration message toa known MLM, a special flag can be set to inform the MLM that the configu-ration must be relayed to all cluster members. The flag is ignored in case the
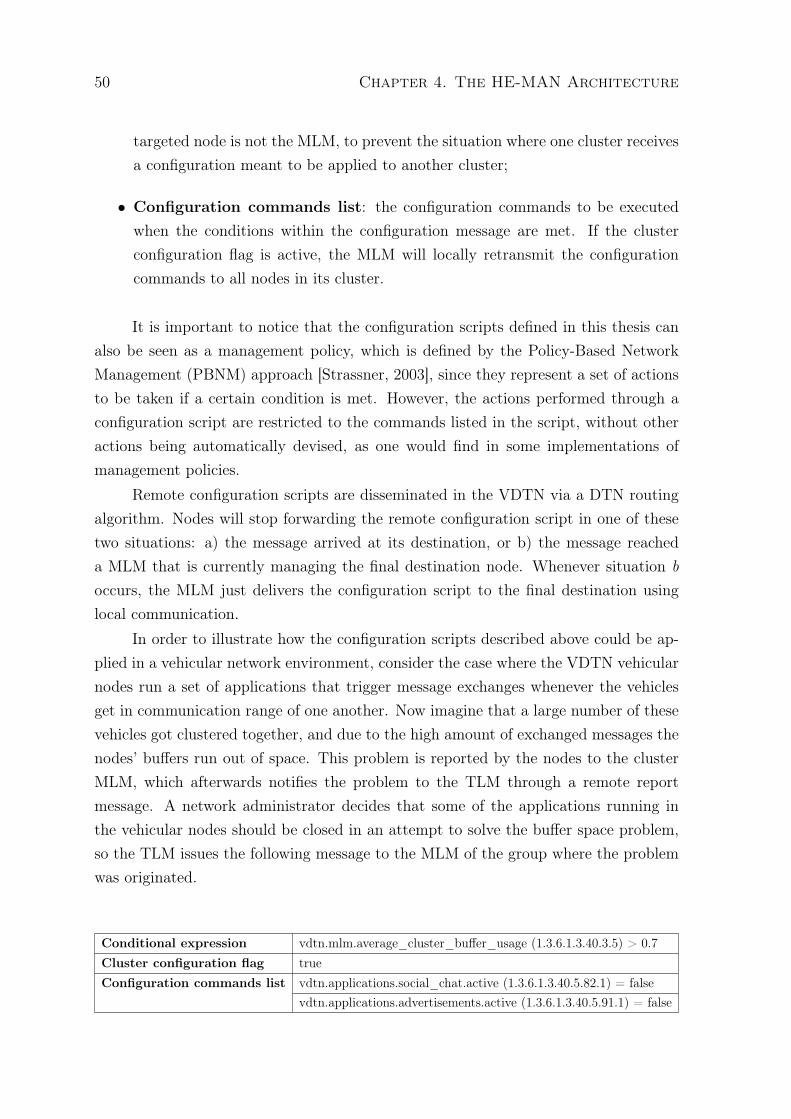
50 Chapter 4. The HE-MAN Architecture
targeted node is not the MLM, to prevent the situation where one cluster receivesa configuration meant to be applied to another cluster;
• Configuration commands list: the configuration commands to be executedwhen the conditions within the configuration message are met. If the clusterconfiguration flag is active, the MLM will locally retransmit the configurationcommands to all nodes in its cluster.
It is important to notice that the configuration scripts defined in this thesis canalso be seen as a management policy, which is defined by the Policy-Based NetworkManagement (PBNM) approach [Strassner, 2003], since they represent a set of actionsto be taken if a certain condition is met. However, the actions performed through aconfiguration script are restricted to the commands listed in the script, without otheractions being automatically devised, as one would find in some implementations ofmanagement policies.
Remote configuration scripts are disseminated in the VDTN via a DTN routingalgorithm. Nodes will stop forwarding the remote configuration script in one of thesetwo situations: a) the message arrived at its destination, or b) the message reacheda MLM that is currently managing the final destination node. Whenever situation boccurs, the MLM just delivers the configuration script to the final destination usinglocal communication.
In order to illustrate how the configuration scripts described above could be ap-plied in a vehicular network environment, consider the case where the VDTN vehicularnodes run a set of applications that trigger message exchanges whenever the vehiclesget in communication range of one another. Now imagine that a large number of thesevehicles got clustered together, and due to the high amount of exchanged messages thenodes’ buffers run out of space. This problem is reported by the nodes to the clusterMLM, which afterwards notifies the problem to the TLM through a remote reportmessage. A network administrator decides that some of the applications running inthe vehicular nodes should be closed in an attempt to solve the buffer space problem,so the TLM issues the following message to the MLM of the group where the problemwas originated.
Conditional expression vdtn.mlm.average_cluster_buffer_usage (1.3.6.1.3.40.3.5) > 0.7Cluster configuration flag trueConfiguration commands list vdtn.applications.social_chat.active (1.3.6.1.3.40.5.82.1) = false
vdtn.applications.advertisements.active (1.3.6.1.3.40.5.91.1) = false
4.5. Case Studies 51
The condition expression of the message above instructs the MLM to firstverify if the managed object vdtn.mlm.average_cluster_buffer_usage, with OID1.3.6.1.3.40.3.5, is still above 70% of usage, in order to avoid an unnecessary termi-nation of applications. If the condition is true, then the node checks the cluster con-figuration flag, which is marked as true, meaning the configuration commands shouldbe relayed to all cluster members. Finally, the configuration commands list deactivatestwo applications, represented by the managed objects vdtn.applications.social_chat(OID 1.3.6.1.3.40.5.82) and vdtn.applications.advertisements (OID 1.3.6.1.3.40.5.91).
4.5 Case Studies
This section presents three case studies for network management in order to illustratethe applications of the techniques presented in this chapter. Each case study includesa description of the applications considered in the scenario, the issues that the man-agement operations face in such scenario and how the HE-MAN architecture tries tosolve those issues. The case studies presented in this chapter are meant to be seen as aqualitative analysis of HE-MAN’s solutions for network management. A quantitativeanalysis can be found in Chapter 5.
4.5.1 Case Study One: Platoon of Autonomous Vehicles
Consider the case of an army that transports equipment and troops using autonomousterrestrial vehicles. Moreover, these vehicles are grouped into platoons that move ina standardized way, where all vehicles of the group move at consensual speed whilemaintaining a desired space between adjacent vehicles [Horowitz and Varaiya, 2000].coordination between the vehicles is necessary in order for the platoon to move as acohesive unit. This coordination is done through a series of adjustments over theirtravel direction and speed, in order to respect the accorded platoon movement speedand direction, as well as the spacing between vehicles. It is not hard to notice that thiscoordination needs to be carried out with near real-time communication, otherwise thevehicles in the platoon would break the platoon formation because of laggy coordinationcommands.
The autonomous vehicles platoon scenario can benefit from the HE-MAN archi-tecture in a few ways. First, the establishment of a coordinator in the platoon would betransparent, since the proposed clustering technique used in HE-MAN elects a MLM(cluster-head) whenever two or more nodes are in communication range of each other.Then, the MLM can assume the coordination of the platoon by subscribing itself for
52 Chapter 4. The HE-MAN Architecture
receiving monitoring data from the other vehicles of the group, using the local monitor-ing support. By having the required amount of monitoring data in a timely fashion, theMLM will then be able to issue configuration commands to the platoon’s vehicles, suchas speed and direction changes, so the platoon’s formation can be maintained duringthe entirety of the operation. Finally, the VDTN’s TLM can be installed in an oper-ational command center, which will disseminate new configuration scripts (i.e., a setof configuration commands) to specific platoons with reduced overhead (in comparisonto a pure flooding strategy).
4.5.2 Case Study Two: Bus Fleet Monitoring
For this second case study, consider a company that owns a bus fleet that transportspassengers from one city to another. Each bus of the fleet is equipped with an OBUand a set of sensors placed on vehicles’ parts that the company wishes to monitor(e.g., fuel tank, tires, etc.). Let us also assume that some of the cities the buses travelto, as well as some of the travelled roads, do not have access to any sort of mobileconnection to the Internet. The company wishes to use a fleet management systemthat aims to collect data from the vehicles of the fleet. The company wants to monitorthe trips carried out by the buses (e.g., number of passengers, number of unscheduledstops, etc.), and the “health” of the vehicles themselves (e.g., fuel consumption, tirepressure, etc.). Because of the nature of the data, the company does not have toreceive the monitoring data in real-time - there is room for some delay being tolerated,although it is preferable that the data arrives in the shortest time. The scenario usedin this case study is inspired by the land transports monitoring system in developmentby the Brazilian National Agency of Land Transports (ANTT) [Agência Nacional deTransportes Terrestres, 2014].
The main benefit the HE-MAN architecture can offer to this scenario is the re-mote monitoring feature, which takes advantage of the hierarchical organization of theVDTN to improve the usage of network resources. Whenever vehicles are clusteredtogether, MLMs subscribe to the other members of the cluster to gather monitoringdata regarding performed trips and the performance of the relevant vehicle’s parts.This monitoring data is not immediately sent to the TLM, but instead they are storedin the MLMs until the time scheduled to generate remote reports arrives. Then, eachMLM calculates statistics from the received monitoring data (e.g., average, standarddeviation, etc.), and send these statistics in a single message to the TLM. This reducesthe amount of monitoring messages being transmitted through DTN communication,consequently reducing the usage of buffer space in the vehicular nodes.
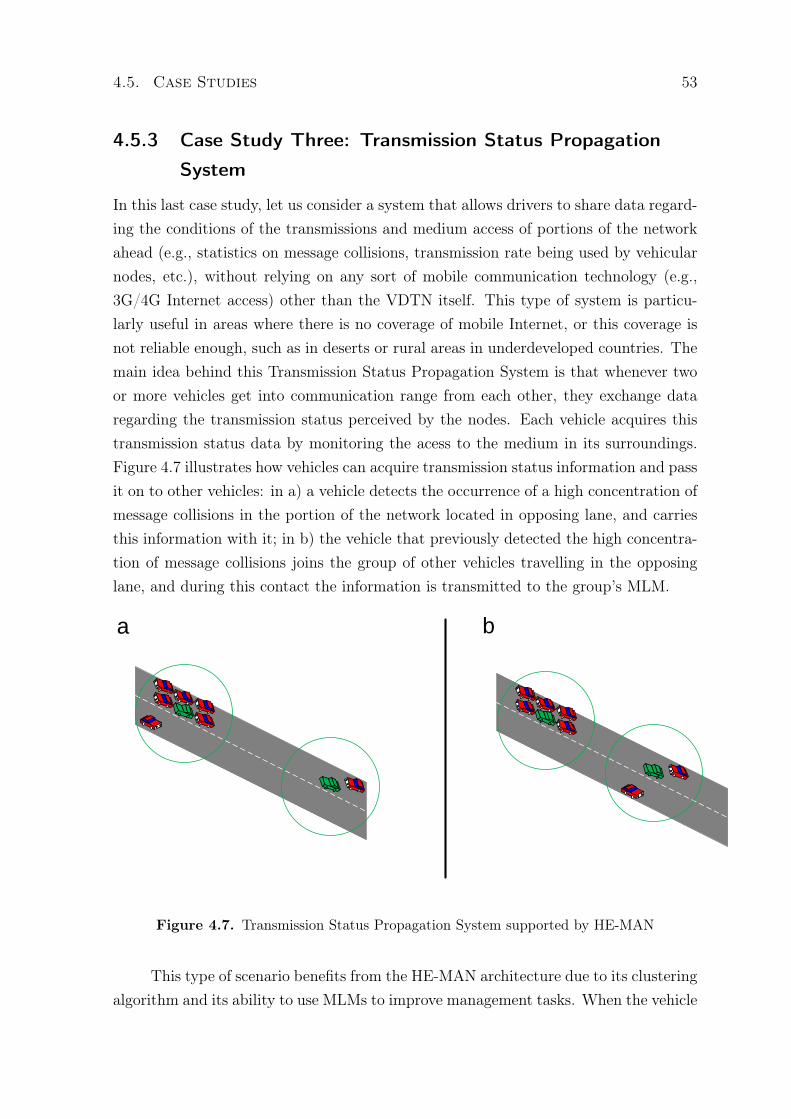
4.5. Case Studies 53
4.5.3 Case Study Three: Transmission Status Propagation
System
In this last case study, let us consider a system that allows drivers to share data regard-ing the conditions of the transmissions and medium access of portions of the networkahead (e.g., statistics on message collisions, transmission rate being used by vehicularnodes, etc.), without relying on any sort of mobile communication technology (e.g.,3G/4G Internet access) other than the VDTN itself. This type of system is particu-larly useful in areas where there is no coverage of mobile Internet, or this coverage isnot reliable enough, such as in deserts or rural areas in underdeveloped countries. Themain idea behind this Transmission Status Propagation System is that whenever twoor more vehicles get into communication range from each other, they exchange dataregarding the transmission status perceived by the nodes. Each vehicle acquires thistransmission status data by monitoring the acess to the medium in its surroundings.Figure 4.7 illustrates how vehicles can acquire transmission status information and passit on to other vehicles: in a) a vehicle detects the occurrence of a high concentration ofmessage collisions in the portion of the network located in opposing lane, and carriesthis information with it; in b) the vehicle that previously detected the high concentra-tion of message collisions joins the group of other vehicles travelling in the opposinglane, and during this contact the information is transmitted to the group’s MLM.
a b
Figure 4.7. Transmission Status Propagation System supported by HE-MAN
This type of scenario benefits from the HE-MAN architecture due to its clusteringalgorithm and its ability to use MLMs to improve management tasks. When the vehicle
54 Chapter 4. The HE-MAN Architecture
carrying the message collisions data gets in range with another cluster (Figure 4.7b) itimmediately joins said cluster to transmit to the data to the MLM. It is important tohighlight that it is thanks to the inclusive nature of the HE-MAN’s clustering algorithmthat this vehicle can immediately join a cluster, even when it is travelling in the oppositedirection of the cluster it is joining. Then, the MLM realizes through the received datathat a traffic jam is possibly occuring ahead, which results in the MLM using localconfiguration to issue commands to the cluster members travelling towards the possibletraffic jam, in order to deactivate non-essential VDTN applications (e.g., entertainmentapplications). This quickly deployed measure helps the vehicular nodes of this clusterto deal with the challenging communication environment they are about to face ahead.
4.6 Chapter Conclusions
This chapter introduced the HiErarchical MANagement (HE-MAN) Architecture,which uses the hierarchical approach to improve the reliability and the efficiency ofmanagement tasks. In the proposed hierarchical architecture, a Top-Level Manager(TLM) manages the entire network, delegating tasks to Mid-Level Managers (MLMs),which act as local managers in connected groups. The agents are the nodes managedeither by a MLM or directly by the TLM.
A new clustering algorithm for VDTNs was proposed in order to implement a log-ical hierarchical topology of the vehicular nodes. This clustering algorithm maximizesthe amount of time a node spends connected to one of the clusters, without using anysort of “filter” to prevent nodes from joining clusters for the sake of clusters’ stability.The proposed clustering technique relies on periodic beacon messages, and it uses thenodes’ connectivity history and nodes’ addresses to elect cluster-heads. The MLM isalways the cluster-head of each VDTN cluster.
Local monitoring allows near real-time management in a bounded portion ofthe network, allowing more complex and delay-sensitive applications/services, whichwould not be possible without a hierarchical network. Remote monitoring, in its turn,allows the TLM to monitor specific nodes of the VDTN without flooding the network.Both local and remote monitoring employ the publisher/subscriber model to reducethe amount of messages needed during monitoring tasks.
Connected groups of nodes also allow MLMs to perform more complex and delay-sensitive configuration tasks, through the usage of the proposed local configurationtechnique. Moreover, the TLM supports remote configuration tasks, which reducesthe risk of a node being wrongly configured because of previous monitoring data that
4.6. Chapter Conclusions 55
became outdated due to the long transmission delays involved in VDTNs.Finally, case studies are presented in order to illustrate how the proposed mon-
itoring and configuration techniques would perform in some VDTN scenarios. Thesecase studies also represent a qualitative analysis of the proposed techniques, whilequantitative analyses will be provided in the next chapter.

Chapter 5
Evaluation: Methodology andPreparation
The research described in this thesis presents a set of algorithms for VDTN manage-ment. These algorithms need to undergo validation in order to check whether they areperforming as designed or not. Section 4.5 presented a qualitative evaluation throughcase studies. This chapter presents the methodology used during the quantitativeevaluation and discusses the achieved results.
5.1 Methodology
The methodology described to evaluate the proposed architecture is composed of asequence of steps. These steps were the following:
1. Establishment of the objectives;
2. Selection of the metrics;
3. Selection of mobility traces;
4. Configuration of the simulation environment;
5. Execution of the simulations;
6. Results analysis.
The steps between the establishment of the objectives and the configuration ofthe simulation environment are explained in sections 5.2 to 5.5, while the remainingsteps can be found in sections 5.6 to 5.8.
57
58 Chapter 5. Evaluation: Methodology and Preparation
The HE-MAN architecture encompasses three main algorithms, each one ap-proaching one of the following functionalities: clustering, monitoring and configu-ration. Therefore, three groups of experiments were designed in order to evaluate theproposed algorithms. Each group has its own characteristics (e.g., objectives, metrics,parameters, etc.), because the evaluated algorithms are designed to operate in differentsituations. The type of experiments chosen for the evaluation of the proposed algo-rithms are computer simulations. The main advantage of using a simulated VDTNfor the evaluation is the benefit of a relatively high degree of realism without the highcost of implementing an actual vehicular network. The usage of testbeds with realvehicles provides the most realistic scenario for testing. However, the cost of acquiringthe needed components for the testbed (e.g., vehicles, on-board units, roadside units,etc.) and the complexity of maintaining such environment under permanent controlfor an effective evaluation, especially in large-scale networks, is too high to be affordedin the context of the research presented in this thesis.
5.2 Objectives
Each group of experiments verifies whether the proposed algorithms are effectivelyovercoming the limitations they were made to do. The defined objectives follow:
5.2.1 Objectives for the clustering algorithm
1. To determine the best value for the configurable parameters used in HE-MAN’sclustering algorithm;
2. To verify if the proposed algorithm can increase the amount of time nodes stayconnected to a cluster;
3. To evaluate the characteristics of the clusters formed through the proposed algo-rithm, such as size, duration and stability;
4. To evaluate the quality of the communication within the clusters (i.e., communi-cation delay and delivery ratio).
5.2.2 Objectives for HE-MAN monitoring
1. To verify if local monitoring can increase the delivery ratio and reduce the deliverydelay of monitoring messages;
5.3. Metrics 59
2. To evaluate the performance of remote monitoring;
3. To measure how the size of the nodes’ buffer influences the performance of mon-itoring operations;
4. To investigate how different routing techniques influence the performance of mon-itoring operations.
5.2.3 Objectives for HE-MAN configuration
1. To verify the feasibility of the distribution of remote configurations to agents andMLMs.
5.3 Metrics
Metrics were selected for each group of experiments in order to quantify importantaspects of the evaluated algorithms. This subsection introduces the selected metrics,along with their objective.
Clustering algorithm
1. Cluster-connected time: to evaluate the ability of HE-MAN’s clustering algorithmto increase the time nodes spend connected to the established clusters;
2. Cluster life time: to measure the amount of time between the creation and thedestruction of a cluster. Clusters with a long life time are desirable because thebenefits provided by local communication within the clusters are made availablefor longer period of times;
3. Number of created clusters : this metric infers the overall logical organization ofa network caused by the clustering algorithm being used, as well as the overheadof the clustering strategy;
4. Cluster size: the number of cluster members, including the cluster-head, providesinsight on the reach of the created clusters;
5. Number of cluster-head transferences per cluster : a cluster-head transfer occurswhen the cluster-head role is passed from one node to another. Stability is adesirable property for clustering algorithms, in order to avoid the overhead andpossible interruption of functionalities caused by cluster-head transference oper-ations;
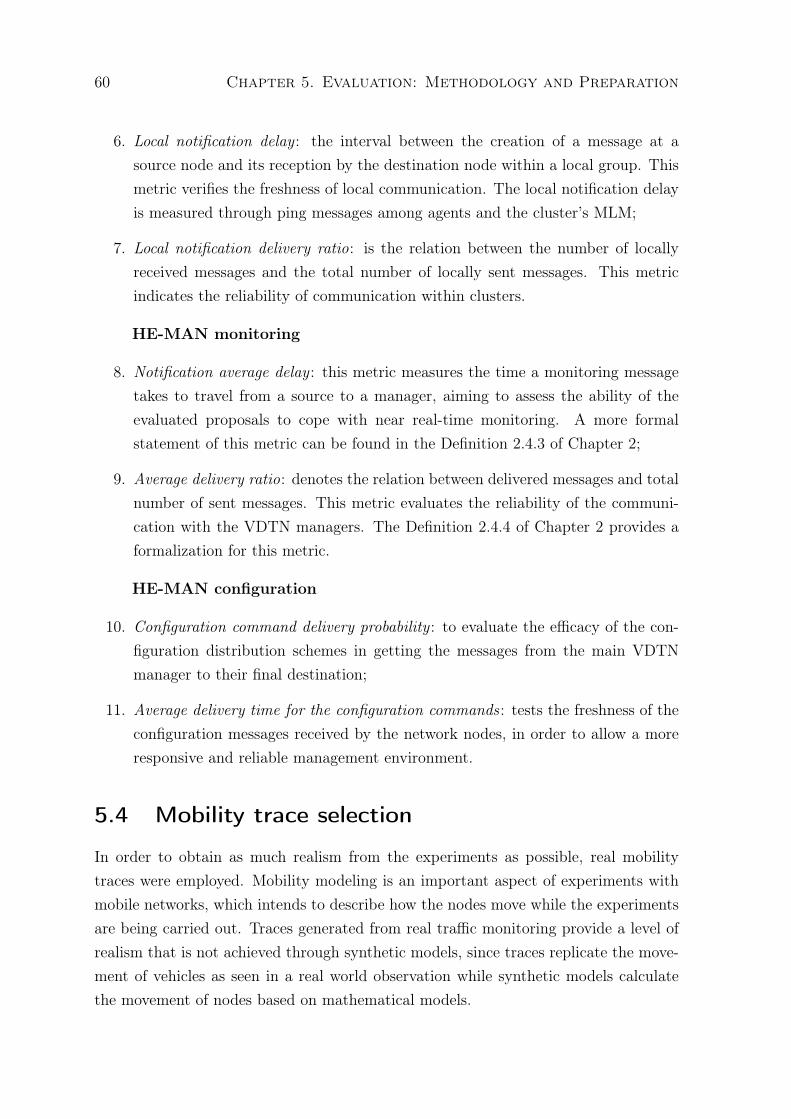
60 Chapter 5. Evaluation: Methodology and Preparation
6. Local notification delay : the interval between the creation of a message at asource node and its reception by the destination node within a local group. Thismetric verifies the freshness of local communication. The local notification delayis measured through ping messages among agents and the cluster’s MLM;
7. Local notification delivery ratio: is the relation between the number of locallyreceived messages and the total number of locally sent messages. This metricindicates the reliability of communication within clusters.
HE-MAN monitoring
8. Notification average delay : this metric measures the time a monitoring messagetakes to travel from a source to a manager, aiming to assess the ability of theevaluated proposals to cope with near real-time monitoring. A more formalstatement of this metric can be found in the Definition 2.4.3 of Chapter 2;
9. Average delivery ratio: denotes the relation between delivered messages and totalnumber of sent messages. This metric evaluates the reliability of the communi-cation with the VDTN managers. The Definition 2.4.4 of Chapter 2 provides aformalization for this metric.
HE-MAN configuration
10. Configuration command delivery probability : to evaluate the efficacy of the con-figuration distribution schemes in getting the messages from the main VDTNmanager to their final destination;
11. Average delivery time for the configuration commands : tests the freshness of theconfiguration messages received by the network nodes, in order to allow a moreresponsive and reliable management environment.
5.4 Mobility trace selection
In order to obtain as much realism from the experiments as possible, real mobilitytraces were employed. Mobility modeling is an important aspect of experiments withmobile networks, which intends to describe how the nodes move while the experimentsare being carried out. Traces generated from real traffic monitoring provide a level ofrealism that is not achieved through synthetic models, since traces replicate the move-ment of vehicles as seen in a real world observation while synthetic models calculatethe movement of nodes based on mathematical models.
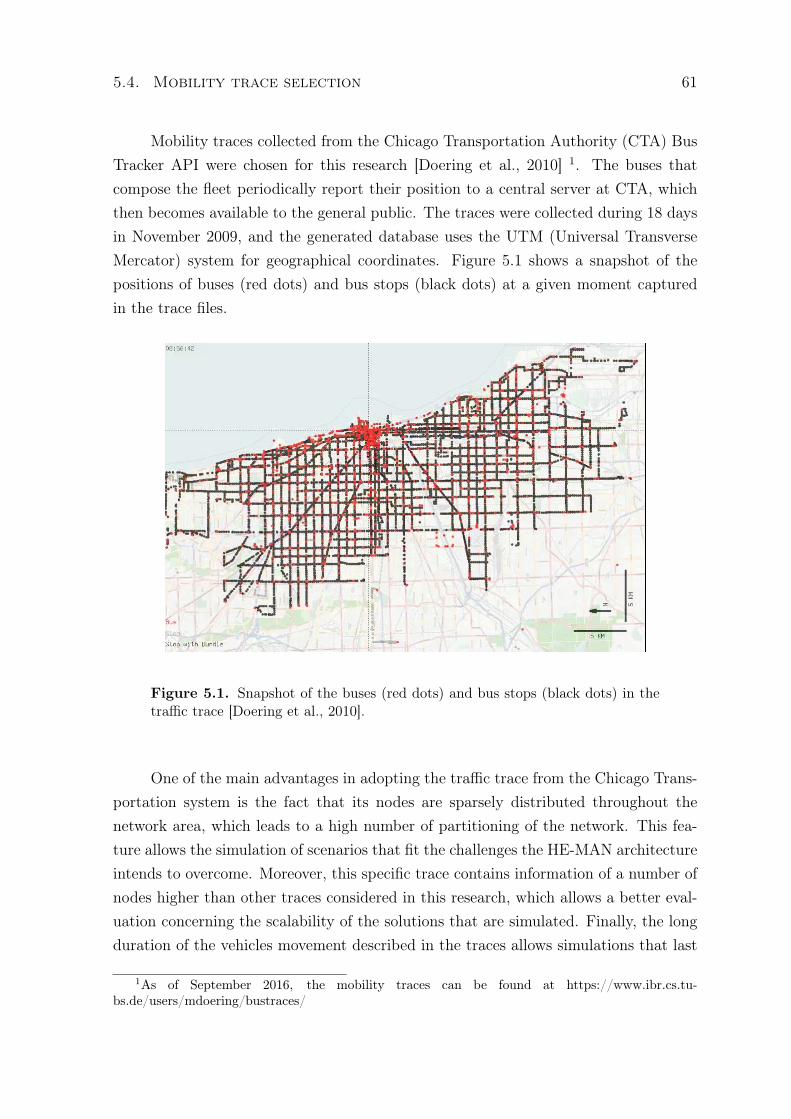
5.4. Mobility trace selection 61
Mobility traces collected from the Chicago Transportation Authority (CTA) BusTracker API were chosen for this research [Doering et al., 2010] 1. The buses thatcompose the fleet periodically report their position to a central server at CTA, whichthen becomes available to the general public. The traces were collected during 18 daysin November 2009, and the generated database uses the UTM (Universal TransverseMercator) system for geographical coordinates. Figure 5.1 shows a snapshot of thepositions of buses (red dots) and bus stops (black dots) at a given moment capturedin the trace files.
Figure 5.1. Snapshot of the buses (red dots) and bus stops (black dots) in thetraffic trace [Doering et al., 2010].
One of the main advantages in adopting the traffic trace from the Chicago Trans-portation system is the fact that its nodes are sparsely distributed throughout thenetwork area, which leads to a high number of partitioning of the network. This fea-ture allows the simulation of scenarios that fit the challenges the HE-MAN architectureintends to overcome. Moreover, this specific trace contains information of a number ofnodes higher than other traces considered in this research, which allows a better eval-uation concerning the scalability of the solutions that are simulated. Finally, the longduration of the vehicles movement described in the traces allows simulations that last
1As of September 2016, the mobility traces can be found at https://www.ibr.cs.tu-bs.de/users/mdoering/bustraces/
62 Chapter 5. Evaluation: Methodology and Preparation
longer, making it viable to study effects that can appear in the network after prolongedusage of the simulated solutions.
Figure 5.2 presents a cumulative distribution function (CDF) of the duration ofthe contacts within the traces’ nodes. The CDF shows that 25% of the contacts lastless than 48 seconds, 50% of the contacts last less than 81 seconds, and 75% of thecontacts last less then 129 seconds. The highest contact time registered is 2464 secondslong. Based on this data, one can conclude that although contacts are volatile, mostof them are long enough to allow the exchange of significant amounts of data.
0
0.2
0.4
0.6
0.8
1
0 500 1000 1500 2000 2500
Perc
enta
ge o
f co
nta
cts
Contact duration (seconds)
CDF
Figure 5.2. Cumulative distribution function (CDF) of contact duration withinthe trace files
In this research, the original trace files went through a data sanitization process,where a set of nodes with sample rate inferior to 30 seconds was selected. The reasoningbehind this selection is to provide to the experiments a detailed description of thevehicles’ movement, excluding large intervals without data about the location of avehicle, which could compromise the realism of the nodes’ movement. At the end ofthis process, 410 nodes were chosen, and the resulting trace file contains over 4 hoursof mobility data. Finally, this trace file was divided into 4 traces with approximately 1hour (3708s) of mobility data each. The number of vehicles in the simulations rangedfrom 100 to 400, and the total simulation area was approximately 30Km x 45Km(1350Km2).
5.5. Simulation environment and configuration 63
5.5 Simulation environment and configuration
The Opportunistic Network Environment (ONE) simulator [Keränen et al., 2009], ver-sion 1.4.1, was chosen to carry out the evaluations in this research. This is a DTN-specific simulator written in Java, and it is currently a well-established simulator thatwas used in a number of recent and important works regarding VDTN [Wang et al.,2015] [Xia et al., 2015].
Regarding the parameters used in the simulations, they are divided in generalparameters and specific parameters. General parameters are the ones employed inall experiments realized in this thesis, while the specific parameters apply only toindividual groups of experiments.
Table 5.1 presents the general parameters used in the simulations. Vehicles com-municate with the network using the Dedicated Short Range Communications (DSRC)technology, which has a typical communication range of 300 meters [Bai and Krishnan,2006]. The radios are configured to transmit data at 10Mbps, which is within thetypical data rate range of DSRC [IEE, 2014]. All communications are half-duplex withconstant bit-rate. The VDTN nodes are also equipped with persistent storage thatprovides 512MB for storing bundles. Simulation results are computed only after thefirst 100 seconds of the simulations, in order to allow a warmup period that allows thenetwork to reach its steady state.
Table 5.1. General parameters of the simulations
Parameter ValueTransmission Range 300m (DSRC)Transmission Speed 10 MbpsBuffer Size 512 MBAvailable Routing Algorithms Epidemic with oracle; Epidemic;
Spray and Wait; ProphetHE-MAN’s clustering beacon interval 1 second
During the execution of the simulations there is no background traffic. Themanagement traffic generated by the nodes follow the rules defined in the simulatedapplications only, and it is not based in any sort of traffic traces because, as far as thisthesis’ author is aware, such traces are not available in the literature.
For each evaluated metric the simulations are repeated four times, with eachtime using a different traffic trace having 3708 seconds of duration. The results arecalculated with a confidence interval of 95%.
The simulations can employ four different routing algorithms, all available inThe One Simulator, according to the targets of the simulations. The discard policy
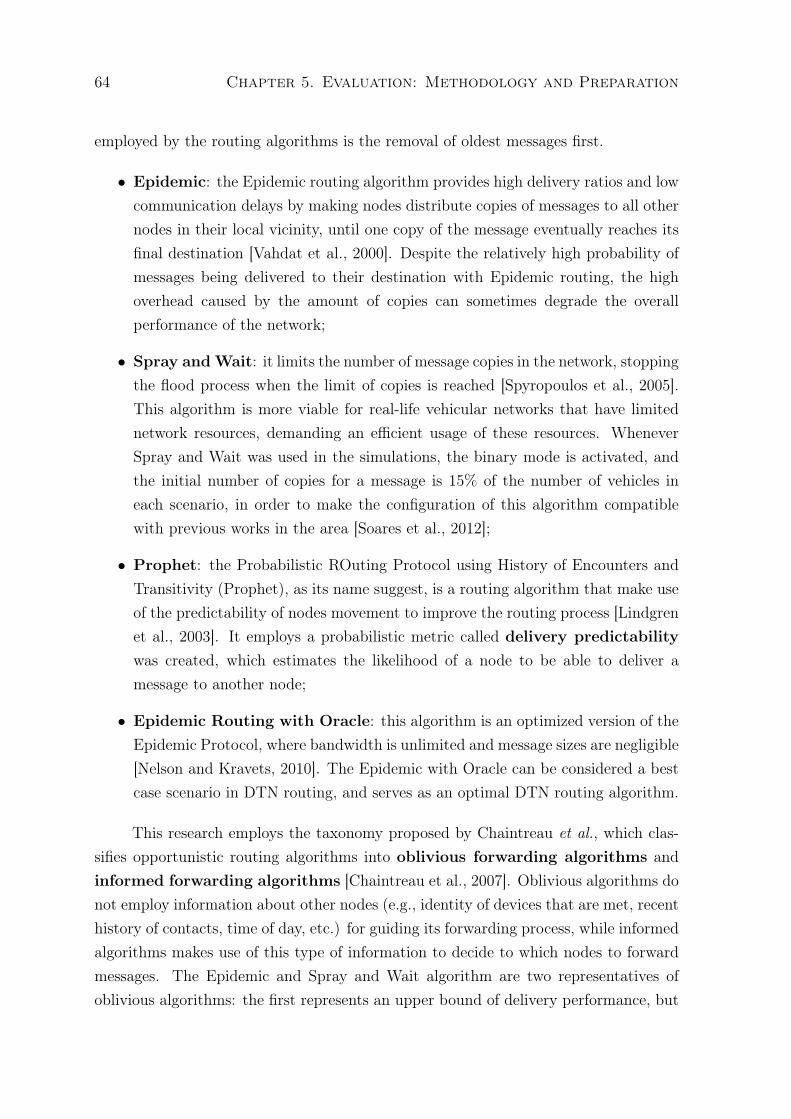
64 Chapter 5. Evaluation: Methodology and Preparation
employed by the routing algorithms is the removal of oldest messages first.
• Epidemic: the Epidemic routing algorithm provides high delivery ratios and lowcommunication delays by making nodes distribute copies of messages to all othernodes in their local vicinity, until one copy of the message eventually reaches itsfinal destination [Vahdat et al., 2000]. Despite the relatively high probability ofmessages being delivered to their destination with Epidemic routing, the highoverhead caused by the amount of copies can sometimes degrade the overallperformance of the network;
• Spray andWait: it limits the number of message copies in the network, stoppingthe flood process when the limit of copies is reached [Spyropoulos et al., 2005].This algorithm is more viable for real-life vehicular networks that have limitednetwork resources, demanding an efficient usage of these resources. WheneverSpray and Wait was used in the simulations, the binary mode is activated, andthe initial number of copies for a message is 15% of the number of vehicles ineach scenario, in order to make the configuration of this algorithm compatiblewith previous works in the area [Soares et al., 2012];
• Prophet: the Probabilistic ROuting Protocol using History of Encounters andTransitivity (Prophet), as its name suggest, is a routing algorithm that make useof the predictability of nodes movement to improve the routing process [Lindgrenet al., 2003]. It employs a probabilistic metric called delivery predictabilitywas created, which estimates the likelihood of a node to be able to deliver amessage to another node;
• Epidemic Routing with Oracle: this algorithm is an optimized version of theEpidemic Protocol, where bandwidth is unlimited and message sizes are negligible[Nelson and Kravets, 2010]. The Epidemic with Oracle can be considered a bestcase scenario in DTN routing, and serves as an optimal DTN routing algorithm.
This research employs the taxonomy proposed by Chaintreau et al., which clas-sifies opportunistic routing algorithms into oblivious forwarding algorithms andinformed forwarding algorithms [Chaintreau et al., 2007]. Oblivious algorithms donot employ information about other nodes (e.g., identity of devices that are met, recenthistory of contacts, time of day, etc.) for guiding its forwarding process, while informedalgorithms makes use of this type of information to decide to which nodes to forwardmessages. The Epidemic and Spray and Wait algorithm are two representatives ofoblivious algorithms: the first represents an upper bound of delivery performance, but
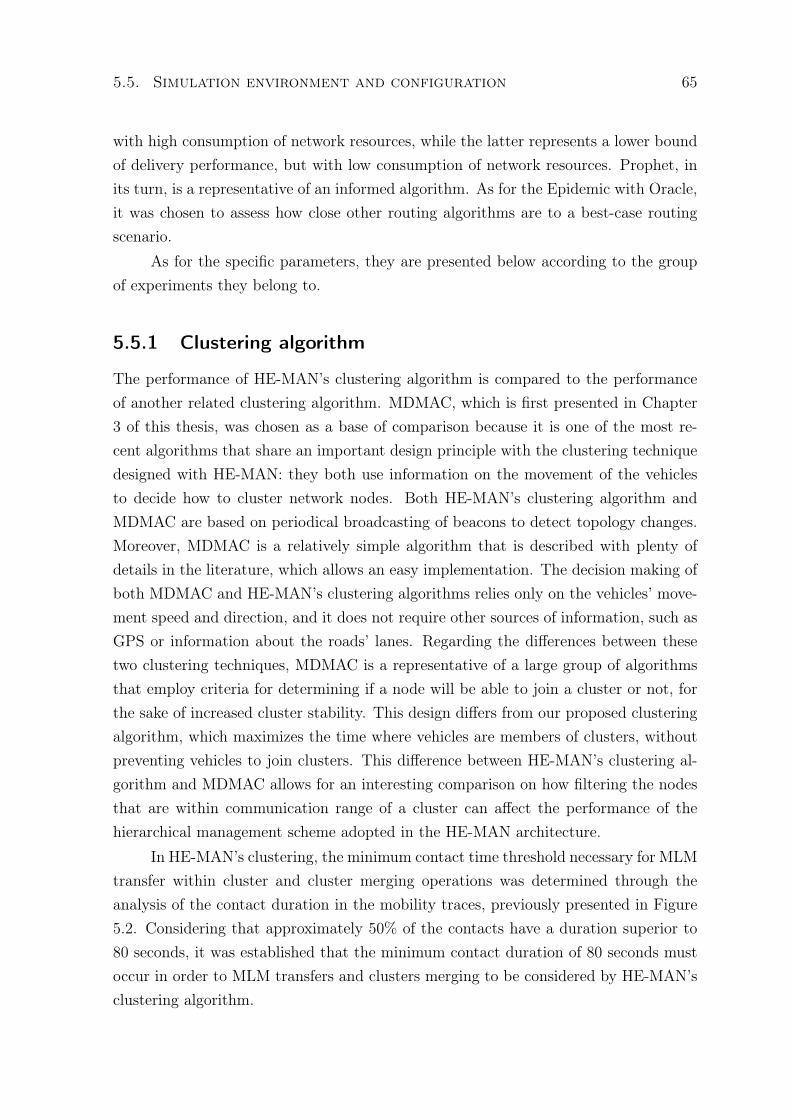
5.5. Simulation environment and configuration 65
with high consumption of network resources, while the latter represents a lower boundof delivery performance, but with low consumption of network resources. Prophet, inits turn, is a representative of an informed algorithm. As for the Epidemic with Oracle,it was chosen to assess how close other routing algorithms are to a best-case routingscenario.
As for the specific parameters, they are presented below according to the groupof experiments they belong to.
5.5.1 Clustering algorithm
The performance of HE-MAN’s clustering algorithm is compared to the performanceof another related clustering algorithm. MDMAC, which is first presented in Chapter3 of this thesis, was chosen as a base of comparison because it is one of the most re-cent algorithms that share an important design principle with the clustering techniquedesigned with HE-MAN: they both use information on the movement of the vehiclesto decide how to cluster network nodes. Both HE-MAN’s clustering algorithm andMDMAC are based on periodical broadcasting of beacons to detect topology changes.Moreover, MDMAC is a relatively simple algorithm that is described with plenty ofdetails in the literature, which allows an easy implementation. The decision making ofboth MDMAC and HE-MAN’s clustering algorithms relies only on the vehicles’ move-ment speed and direction, and it does not require other sources of information, such asGPS or information about the roads’ lanes. Regarding the differences between thesetwo clustering techniques, MDMAC is a representative of a large group of algorithmsthat employ criteria for determining if a node will be able to join a cluster or not, forthe sake of increased cluster stability. This design differs from our proposed clusteringalgorithm, which maximizes the time where vehicles are members of clusters, withoutpreventing vehicles to join clusters. This difference between HE-MAN’s clustering al-gorithm and MDMAC allows for an interesting comparison on how filtering the nodesthat are within communication range of a cluster can affect the performance of thehierarchical management scheme adopted in the HE-MAN architecture.
In HE-MAN’s clustering, the minimum contact time threshold necessary for MLMtransfer within cluster and cluster merging operations was determined through theanalysis of the contact duration in the mobility traces, previously presented in Figure5.2. Considering that approximately 50% of the contacts have a duration superior to80 seconds, it was established that the minimum contact duration of 80 seconds mustoccur in order to MLM transfers and clusters merging to be considered by HE-MAN’sclustering algorithm.
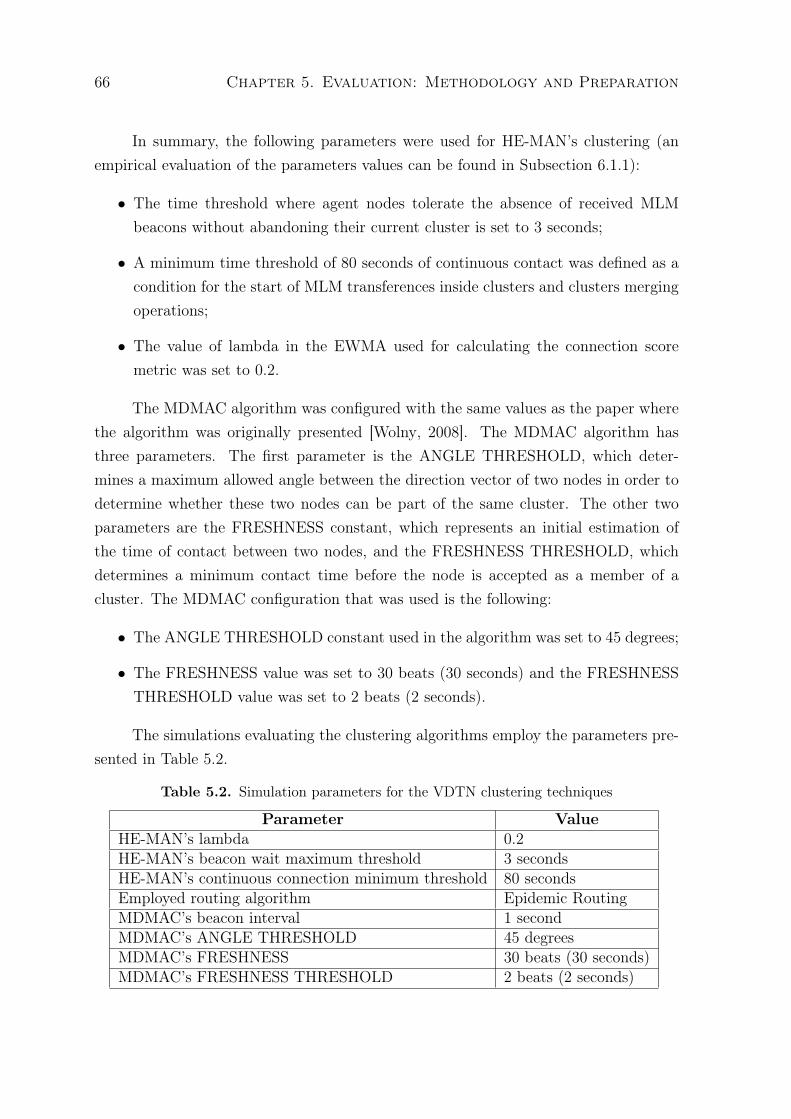
66 Chapter 5. Evaluation: Methodology and Preparation
In summary, the following parameters were used for HE-MAN’s clustering (anempirical evaluation of the parameters values can be found in Subsection 6.1.1):
• The time threshold where agent nodes tolerate the absence of received MLMbeacons without abandoning their current cluster is set to 3 seconds;
• A minimum time threshold of 80 seconds of continuous contact was defined as acondition for the start of MLM transferences inside clusters and clusters mergingoperations;
• The value of lambda in the EWMA used for calculating the connection scoremetric was set to 0.2.
The MDMAC algorithm was configured with the same values as the paper wherethe algorithm was originally presented [Wolny, 2008]. The MDMAC algorithm hasthree parameters. The first parameter is the ANGLE THRESHOLD, which deter-mines a maximum allowed angle between the direction vector of two nodes in order todetermine whether these two nodes can be part of the same cluster. The other twoparameters are the FRESHNESS constant, which represents an initial estimation ofthe time of contact between two nodes, and the FRESHNESS THRESHOLD, whichdetermines a minimum contact time before the node is accepted as a member of acluster. The MDMAC configuration that was used is the following:
• The ANGLE THRESHOLD constant used in the algorithm was set to 45 degrees;
• The FRESHNESS value was set to 30 beats (30 seconds) and the FRESHNESSTHRESHOLD value was set to 2 beats (2 seconds).
The simulations evaluating the clustering algorithms employ the parameters pre-sented in Table 5.2.
Table 5.2. Simulation parameters for the VDTN clustering techniques
Parameter ValueHE-MAN’s lambda 0.2HE-MAN’s beacon wait maximum threshold 3 secondsHE-MAN’s continuous connection minimum threshold 80 secondsEmployed routing algorithm Epidemic RoutingMDMAC’s beacon interval 1 secondMDMAC’s ANGLE THRESHOLD 45 degreesMDMAC’s FRESHNESS 30 beats (30 seconds)MDMAC’s FRESHNESS THRESHOLD 2 beats (2 seconds)
5.5. Simulation environment and configuration 67
5.5.2 HE-MAN monitoring
The performance of HE-MAN’s monitoring solution was evaluated in comparison witha hypothetical VDTN monitoring solution, based on the classic centralized monitoringapproach widely used in traditional networks. This is due to the lack of existing moni-toring solutions for VDTNs at the time of the evaluation. Both HE-MAN’s monitoringapproach and the baseline solution, called Simple VDTN Monitoring, are describedas the following:
HE-MAN’s monitoring solution: In this scenario, the VDTN is organizedwith a TLM placed in a fixed position at the center of the simulation area, and thevehicular nodes moving around the TLM, either within the established clusters (asMLMs or managed agents) or travelling in an isolated manner. The MLMs are electedusing the HE-MAN’s clustering algorithms. The publisher-subscriber monitoring modelis employed in the communications between managers and agents, with agents issuingmonitoring messages to subscribed MLMs whenever an issue is detected. Also, MLMsaggregate the remote reports issued by the event logging system of the vehicles withinthe local group in order to forward to the TLM a single remote report bundle, in orderto reduce the overhead of messages travelling through the VDTN.
Simple VDTN monitoring: This scenario, inspired in traditional networkmanagement approaches, employs a single manager at the center of the simulationarea monitoring the VDTN. For the sake of fairness, the publisher-subscriber approachwill also be employed in this scenario.
On top of the two network management strategies described above, two differentapplications were implemented to be run by the vehicular nodes during the simulations.The main purpose of these applications is to generate the messages that will be analyzedby the simulated management solutions, triggering events such as a node issuing a faultnotification message to its manager. The two applications used in the monitoring-related simulations are the following:
• The first is a safety application called Collision Avoidance. It uses sensors in-stalled in the vehicles to monitor its surroundings. Collision avoidance beaconmessages are sent every 100ms (which is the typical beacon interval for vehicularsafety applications [Kargl et al., 2008]), and each message contains data such asthe vehicles’ current position, speed, and direction. A beacon message can be-come incorrect during its transmission, due to a faulty sensor generating invalidmeasurements in the source vehicle, for example. Whenever a vehicular nodereceives one of these incorrect beacon messages, the receiver issues a fault notifi-cation message to the cluster’s MLM, in order to allow the MLM to react to the
68 Chapter 5. Evaluation: Methodology and Preparation
problem (e.g., issuing commands to correct the problem, notifying other nodesof the cluster of the existence of a faulty vehicular node, etc.). This applicationevaluates the ability of the monitoring solutions for working effectively in situa-tions involving high data rates and a demand for low response times (typicallyin the order of hundreds of milliseconds).
• The second application is an Event Logging system used for the operationalmanagement of fleets. This application ensures safety and operational efficiency,providing warnings for broken parts, unscheduled stops during a travel, or vehiclesexceeding a maximum speed threshold. The data collected by the event loggingsystem is sent periodically to a manager of the VDTN. The event logging systemtests how the monitoring solutions deal with non-real-time and low data rateapplications, which accepts delays in the order of hours or even a few days. Inour simulations, this application reports data concerning distances traveled andregistered speeds for each vehicle.
Parameter values for the monitoring evaluations can be found in Table 5.3. Thesize of the beacon messages issued by the Collision Avoidance system was 64 bytes,while the size of the fault notification messages sent by the VDTN monitoring systemwhenever a faulty beacon message is detected was 1024 bytes [Kato et al., 2013] [Biswaset al., 2006]. The probability of a beacon from the Collision Avoidance system beingcorrupted is 10%. This intentionally high probability was chosen in order to testthe ability of the evaluated monitoring systems to cope with a relatively demandingsituation. The remote reports issued by the Event Logging system have 512KB of size(hypothetical size relative to 30 minutes of monitoring data of the cluster’s members),and are sent by the vehicular nodes to a network manager every 30 minutes. Messagessent to remote nodes using DTN routing (Epidemic with Oracle, Spray and Wait orProphet) had their Time-To-Live (TTL) parameter set to 60 minutes. The TTL valuerepresents a maximum delay the bundles can tolerate, and it was set to 60 minutes inorder to approximately match the total simulation time, which is 3708 seconds.
5.5.3 HE-MAN configuration
The specific parameters regarding the simulation of the VDTN configuration scenariosare presented in Table 5.4. The configuration message size generated by the main man-ager in both scenarios is 10KB (hypothetical size of a configuration script containinga set of conditions and configuration commands). After the warmup phase, the simu-lation time is divided in configuration generation ticks, with each tick occurring every
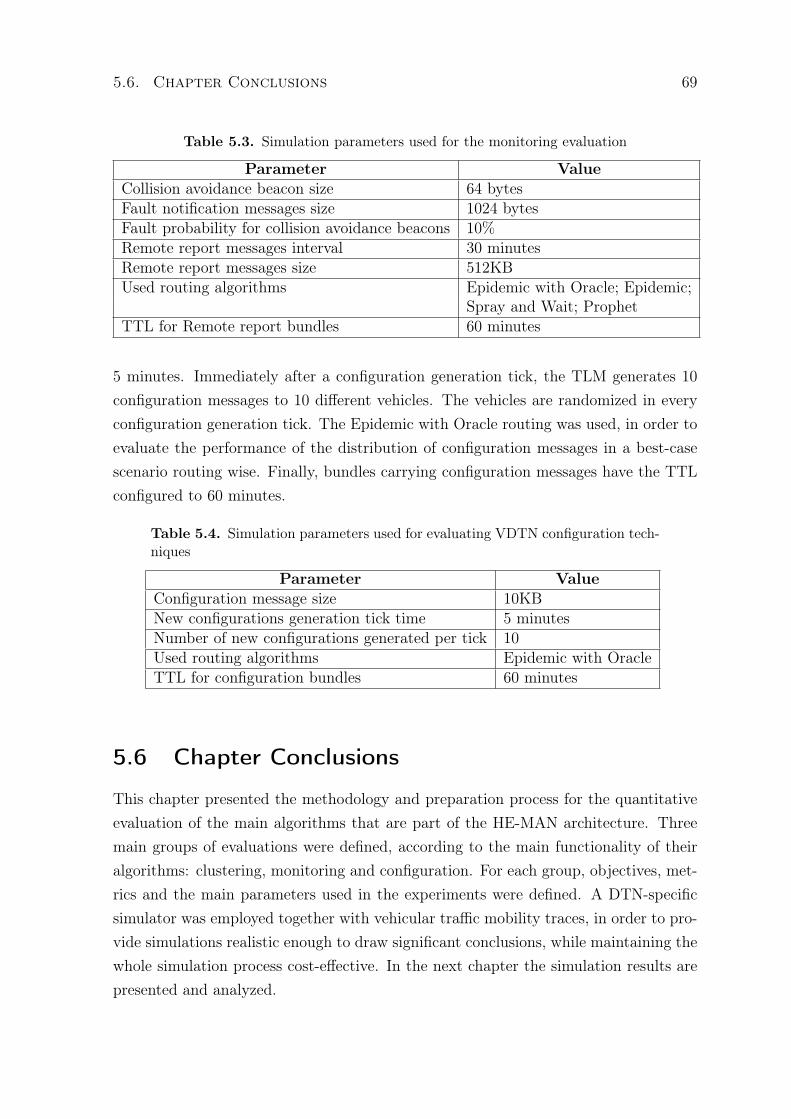
5.6. Chapter Conclusions 69
Table 5.3. Simulation parameters used for the monitoring evaluation
Parameter ValueCollision avoidance beacon size 64 bytesFault notification messages size 1024 bytesFault probability for collision avoidance beacons 10%Remote report messages interval 30 minutesRemote report messages size 512KBUsed routing algorithms Epidemic with Oracle; Epidemic;
Spray and Wait; ProphetTTL for Remote report bundles 60 minutes
5 minutes. Immediately after a configuration generation tick, the TLM generates 10configuration messages to 10 different vehicles. The vehicles are randomized in everyconfiguration generation tick. The Epidemic with Oracle routing was used, in order toevaluate the performance of the distribution of configuration messages in a best-casescenario routing wise. Finally, bundles carrying configuration messages have the TTLconfigured to 60 minutes.
Table 5.4. Simulation parameters used for evaluating VDTN configuration tech-niques
Parameter ValueConfiguration message size 10KBNew configurations generation tick time 5 minutesNumber of new configurations generated per tick 10Used routing algorithms Epidemic with OracleTTL for configuration bundles 60 minutes
5.6 Chapter Conclusions
This chapter presented the methodology and preparation process for the quantitativeevaluation of the main algorithms that are part of the HE-MAN architecture. Threemain groups of evaluations were defined, according to the main functionality of theiralgorithms: clustering, monitoring and configuration. For each group, objectives, met-rics and the main parameters used in the experiments were defined. A DTN-specificsimulator was employed together with vehicular traffic mobility traces, in order to pro-vide simulations realistic enough to draw significant conclusions, while maintaining thewhole simulation process cost-effective. In the next chapter the simulation results arepresented and analyzed.

Chapter 6
Evaluation: Results and Analyses
This chapter presents and analyzes the results of the experiments defined in Chapter 5.Once more, the experiments are grouped in three main groups: clustering algorithms,monitoring, and configuration.
6.1 Clustering algorithm evaluation
The clustering evaluation is divided into two parts: the first part aims to determine thebest possible values for the parameters in HE-MAN’s clustering algorithm. The secondpart evaluates the performance of the proposed clustering algorithm in comparisonwith MDMAC.
6.1.1 Tunning of the configurable parameters in HE-MAN’s
clustering algorithm
As presented in Chapter 4, HE-MAN’s clustering algorithm has three configurable pa-rameters: a minimum contact time threshold necessary for MLM transferences withinclusters and cluster merging operations, a maximum time threshold without the recep-tion of beacon messages for a contact to be considered extinct (contact timeout), andthe EWMA’s lambda (λ) attenuator value used for the calculation of the connectionscore metric. The minimum contact time threshold for MLM transferences is alreadyexplained in Subsection 5.5.1.
The two remainder configuration parameters are evaluated next. The lambdaused in the calculation of the connection score varied from 0.05 to 0.9. As for thecontact timeout, it varied from 1 second to 5 seconds. These two parameters willbe analyzed according to the metrics defined for clustering algorithms, in order to
71
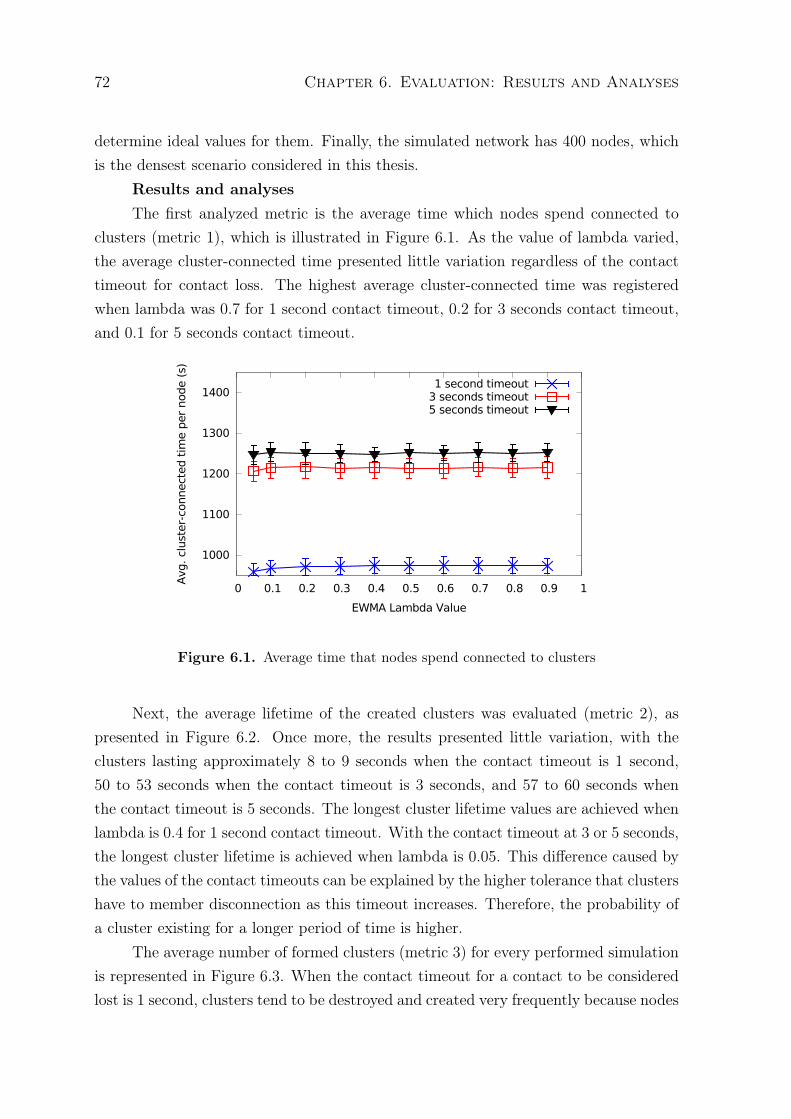
72 Chapter 6. Evaluation: Results and Analyses
determine ideal values for them. Finally, the simulated network has 400 nodes, whichis the densest scenario considered in this thesis.
Results and analysesThe first analyzed metric is the average time which nodes spend connected to
clusters (metric 1), which is illustrated in Figure 6.1. As the value of lambda varied,the average cluster-connected time presented little variation regardless of the contacttimeout for contact loss. The highest average cluster-connected time was registeredwhen lambda was 0.7 for 1 second contact timeout, 0.2 for 3 seconds contact timeout,and 0.1 for 5 seconds contact timeout.
1000
1100
1200
1300
1400
0 0.1 0.2 0.3 0.4 0.5 0.6 0.7 0.8 0.9 1
Avg
. cl
ust
er-
connect
ed t
ime p
er
node (
s)
EWMA Lambda Value
1 second timeout3 seconds timeout5 seconds timeout
Figure 6.1. Average time that nodes spend connected to clusters
Next, the average lifetime of the created clusters was evaluated (metric 2), aspresented in Figure 6.2. Once more, the results presented little variation, with theclusters lasting approximately 8 to 9 seconds when the contact timeout is 1 second,50 to 53 seconds when the contact timeout is 3 seconds, and 57 to 60 seconds whenthe contact timeout is 5 seconds. The longest cluster lifetime values are achieved whenlambda is 0.4 for 1 second contact timeout. With the contact timeout at 3 or 5 seconds,the longest cluster lifetime is achieved when lambda is 0.05. This difference caused bythe values of the contact timeouts can be explained by the higher tolerance that clustershave to member disconnection as this timeout increases. Therefore, the probability ofa cluster existing for a longer period of time is higher.
The average number of formed clusters (metric 3) for every performed simulationis represented in Figure 6.3. When the contact timeout for a contact to be consideredlost is 1 second, clusters tend to be destroyed and created very frequently because nodes
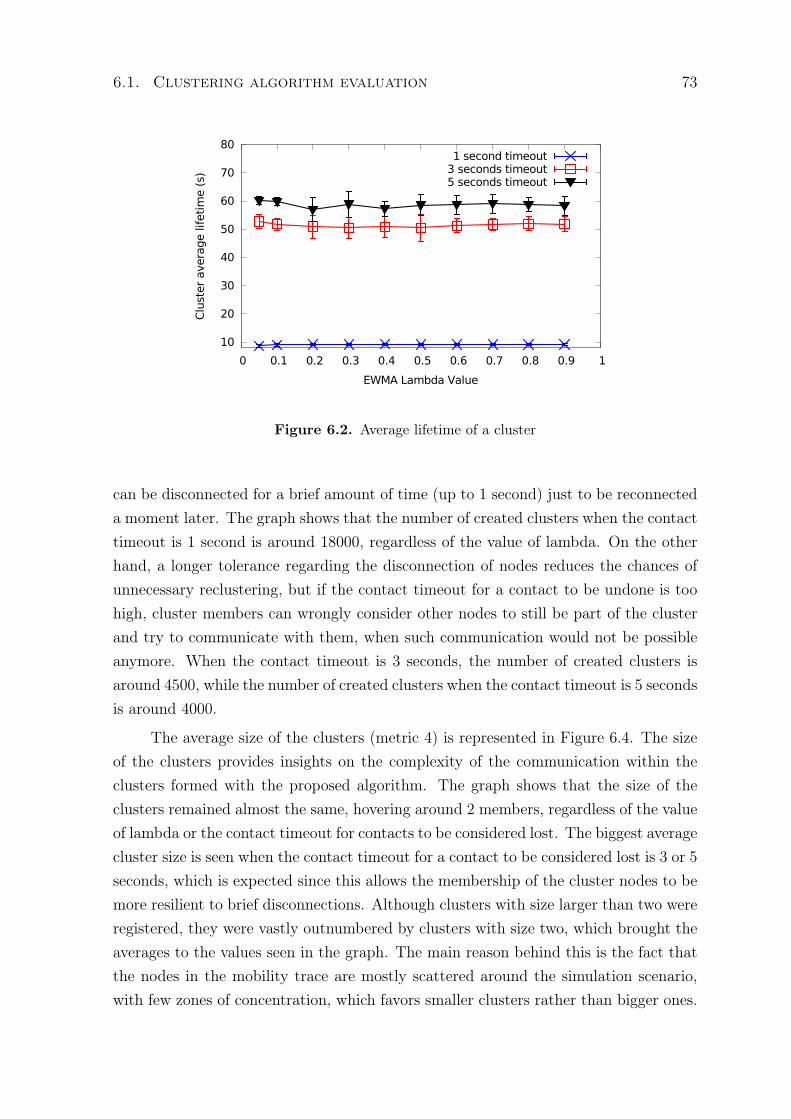
6.1. Clustering algorithm evaluation 73
10
20
30
40
50
60
70
80
0 0.1 0.2 0.3 0.4 0.5 0.6 0.7 0.8 0.9 1
Clu
ster
ave
rage li
feti
me (
s)
EWMA Lambda Value
1 second timeout3 seconds timeout5 seconds timeout
Figure 6.2. Average lifetime of a cluster
can be disconnected for a brief amount of time (up to 1 second) just to be reconnecteda moment later. The graph shows that the number of created clusters when the contacttimeout is 1 second is around 18000, regardless of the value of lambda. On the otherhand, a longer tolerance regarding the disconnection of nodes reduces the chances ofunnecessary reclustering, but if the contact timeout for a contact to be undone is toohigh, cluster members can wrongly consider other nodes to still be part of the clusterand try to communicate with them, when such communication would not be possibleanymore. When the contact timeout is 3 seconds, the number of created clusters isaround 4500, while the number of created clusters when the contact timeout is 5 secondsis around 4000.
The average size of the clusters (metric 4) is represented in Figure 6.4. The sizeof the clusters provides insights on the complexity of the communication within theclusters formed with the proposed algorithm. The graph shows that the size of theclusters remained almost the same, hovering around 2 members, regardless of the valueof lambda or the contact timeout for contacts to be considered lost. The biggest averagecluster size is seen when the contact timeout for a contact to be considered lost is 3 or 5seconds, which is expected since this allows the membership of the cluster nodes to bemore resilient to brief disconnections. Although clusters with size larger than two wereregistered, they were vastly outnumbered by clusters with size two, which brought theaverages to the values seen in the graph. The main reason behind this is the fact thatthe nodes in the mobility trace are mostly scattered around the simulation scenario,with few zones of concentration, which favors smaller clusters rather than bigger ones.
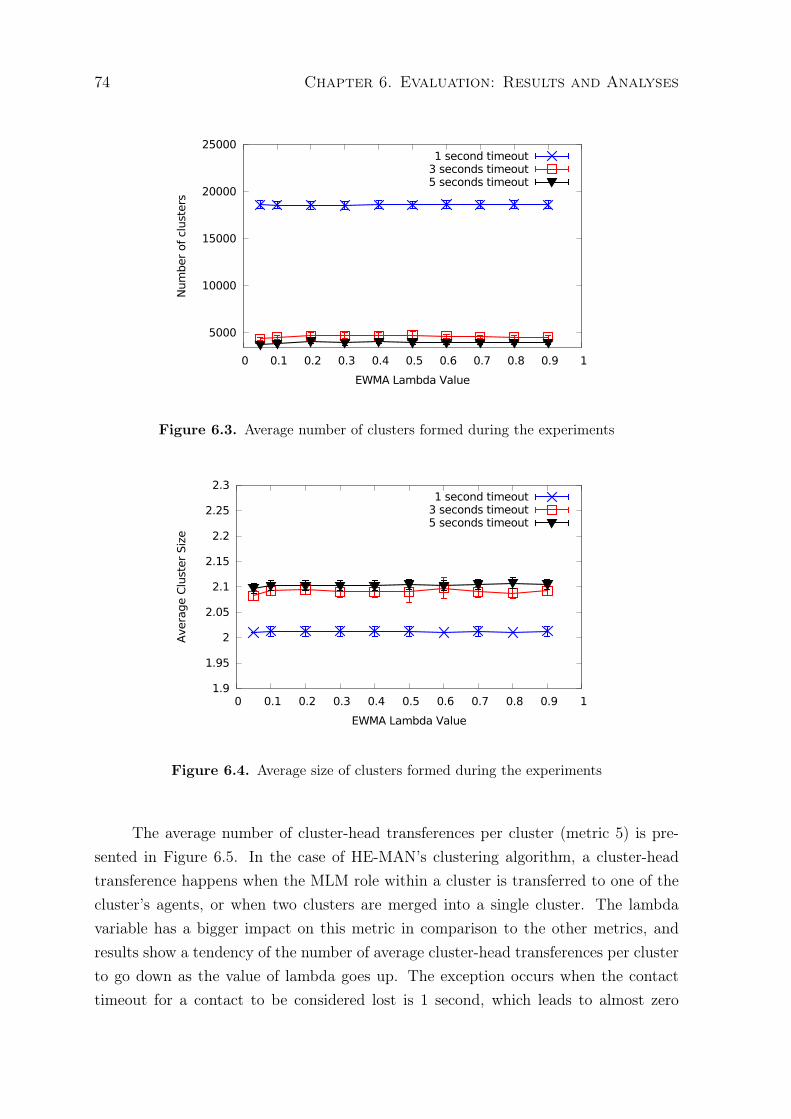
74 Chapter 6. Evaluation: Results and Analyses
5000
10000
15000
20000
25000
0 0.1 0.2 0.3 0.4 0.5 0.6 0.7 0.8 0.9 1
Num
ber
of
clust
ers
EWMA Lambda Value
1 second timeout3 seconds timeout5 seconds timeout
Figure 6.3. Average number of clusters formed during the experiments
1.9
1.95
2
2.05
2.1
2.15
2.2
2.25
2.3
0 0.1 0.2 0.3 0.4 0.5 0.6 0.7 0.8 0.9 1
Ave
rage C
lust
er
Siz
e
EWMA Lambda Value
1 second timeout3 seconds timeout5 seconds timeout
Figure 6.4. Average size of clusters formed during the experiments
The average number of cluster-head transferences per cluster (metric 5) is pre-sented in Figure 6.5. In the case of HE-MAN’s clustering algorithm, a cluster-headtransference happens when the MLM role within a cluster is transferred to one of thecluster’s agents, or when two clusters are merged into a single cluster. The lambdavariable has a bigger impact on this metric in comparison to the other metrics, andresults show a tendency of the number of average cluster-head transferences per clusterto go down as the value of lambda goes up. The exception occurs when the contacttimeout for a contact to be considered lost is 1 second, which leads to almost zero
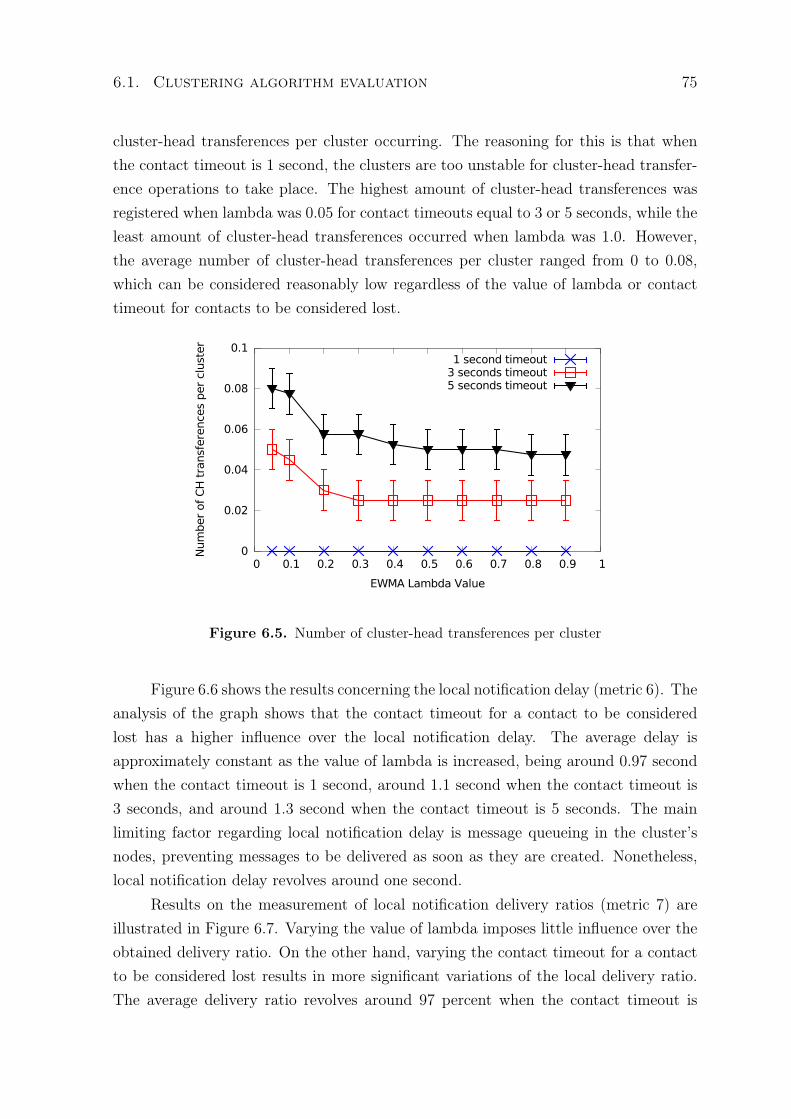
6.1. Clustering algorithm evaluation 75
cluster-head transferences per cluster occurring. The reasoning for this is that whenthe contact timeout is 1 second, the clusters are too unstable for cluster-head transfer-ence operations to take place. The highest amount of cluster-head transferences wasregistered when lambda was 0.05 for contact timeouts equal to 3 or 5 seconds, while theleast amount of cluster-head transferences occurred when lambda was 1.0. However,the average number of cluster-head transferences per cluster ranged from 0 to 0.08,which can be considered reasonably low regardless of the value of lambda or contacttimeout for contacts to be considered lost.
0
0.02
0.04
0.06
0.08
0.1
0 0.1 0.2 0.3 0.4 0.5 0.6 0.7 0.8 0.9 1
Num
ber
of
CH
tra
nsf
ere
nce
s per
clust
er
EWMA Lambda Value
1 second timeout3 seconds timeout5 seconds timeout
Figure 6.5. Number of cluster-head transferences per cluster
Figure 6.6 shows the results concerning the local notification delay (metric 6). Theanalysis of the graph shows that the contact timeout for a contact to be consideredlost has a higher influence over the local notification delay. The average delay isapproximately constant as the value of lambda is increased, being around 0.97 secondwhen the contact timeout is 1 second, around 1.1 second when the contact timeout is3 seconds, and around 1.3 second when the contact timeout is 5 seconds. The mainlimiting factor regarding local notification delay is message queueing in the cluster’snodes, preventing messages to be delivered as soon as they are created. Nonetheless,local notification delay revolves around one second.
Results on the measurement of local notification delivery ratios (metric 7) areillustrated in Figure 6.7. Varying the value of lambda imposes little influence over theobtained delivery ratio. On the other hand, varying the contact timeout for a contactto be considered lost results in more significant variations of the local delivery ratio.The average delivery ratio revolves around 97 percent when the contact timeout is
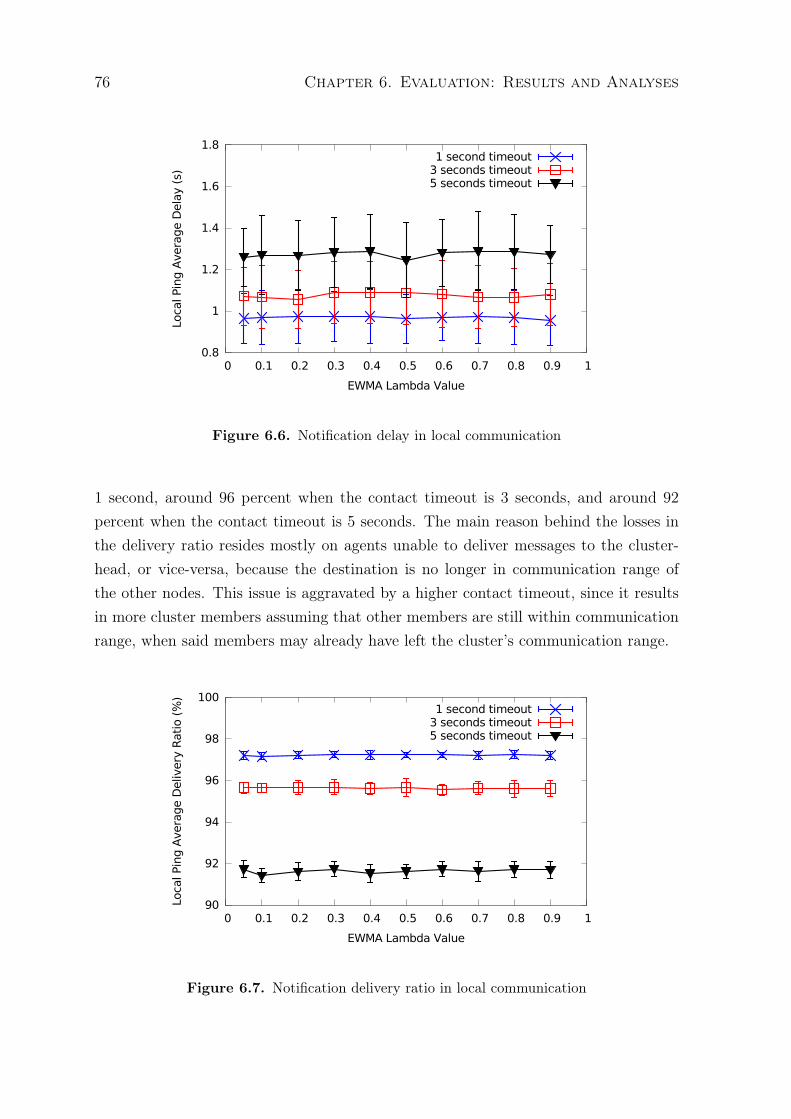
76 Chapter 6. Evaluation: Results and Analyses
0.8
1
1.2
1.4
1.6
1.8
0 0.1 0.2 0.3 0.4 0.5 0.6 0.7 0.8 0.9 1
Loca
l Pin
g A
vera
ge D
ela
y (s
)
EWMA Lambda Value
1 second timeout3 seconds timeout5 seconds timeout
Figure 6.6. Notification delay in local communication
1 second, around 96 percent when the contact timeout is 3 seconds, and around 92percent when the contact timeout is 5 seconds. The main reason behind the losses inthe delivery ratio resides mostly on agents unable to deliver messages to the cluster-head, or vice-versa, because the destination is no longer in communication range ofthe other nodes. This issue is aggravated by a higher contact timeout, since it resultsin more cluster members assuming that other members are still within communicationrange, when said members may already have left the cluster’s communication range.
90
92
94
96
98
100
0 0.1 0.2 0.3 0.4 0.5 0.6 0.7 0.8 0.9 1
Loca
l Pin
g A
vera
ge D
eliv
ery
Rati
o (
%)
EWMA Lambda Value
1 second timeout3 seconds timeout5 seconds timeout
Figure 6.7. Notification delivery ratio in local communication
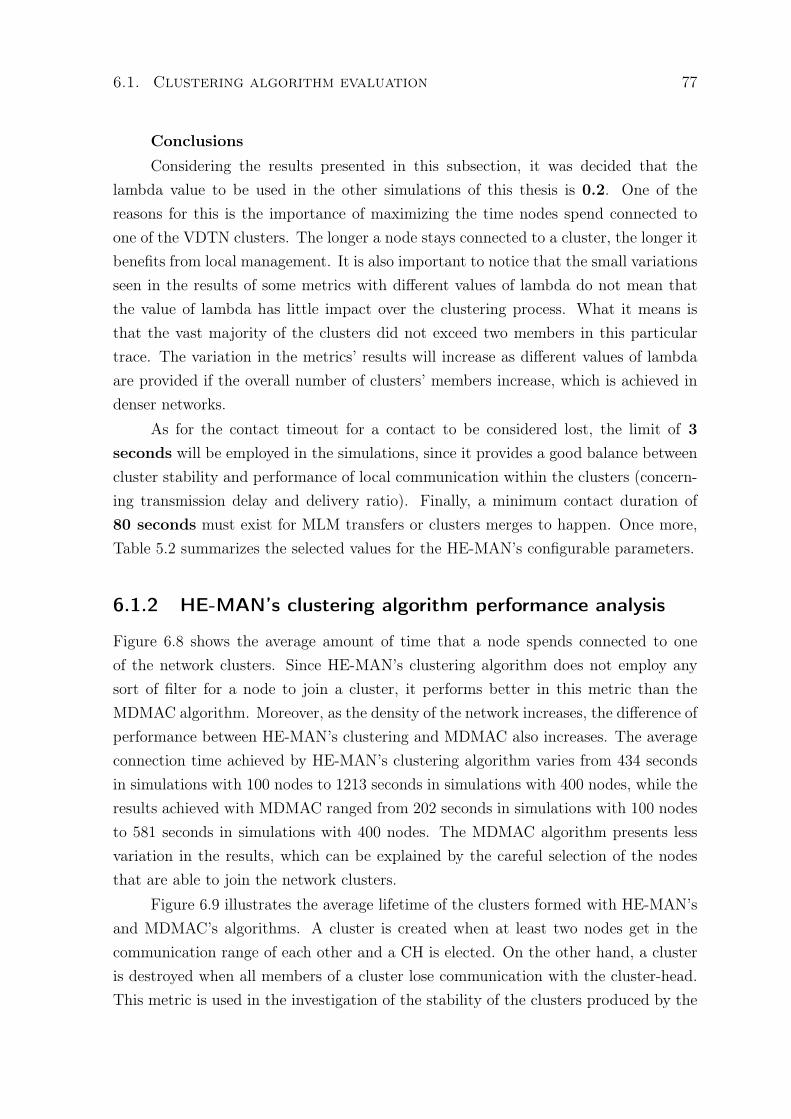
6.1. Clustering algorithm evaluation 77
Conclusions
Considering the results presented in this subsection, it was decided that thelambda value to be used in the other simulations of this thesis is 0.2. One of thereasons for this is the importance of maximizing the time nodes spend connected toone of the VDTN clusters. The longer a node stays connected to a cluster, the longer itbenefits from local management. It is also important to notice that the small variationsseen in the results of some metrics with different values of lambda do not mean thatthe value of lambda has little impact over the clustering process. What it means isthat the vast majority of the clusters did not exceed two members in this particulartrace. The variation in the metrics’ results will increase as different values of lambdaare provided if the overall number of clusters’ members increase, which is achieved indenser networks.
As for the contact timeout for a contact to be considered lost, the limit of 3seconds will be employed in the simulations, since it provides a good balance betweencluster stability and performance of local communication within the clusters (concern-ing transmission delay and delivery ratio). Finally, a minimum contact duration of80 seconds must exist for MLM transfers or clusters merges to happen. Once more,Table 5.2 summarizes the selected values for the HE-MAN’s configurable parameters.
6.1.2 HE-MAN’s clustering algorithm performance analysis
Figure 6.8 shows the average amount of time that a node spends connected to oneof the network clusters. Since HE-MAN’s clustering algorithm does not employ anysort of filter for a node to join a cluster, it performs better in this metric than theMDMAC algorithm. Moreover, as the density of the network increases, the difference ofperformance between HE-MAN’s clustering and MDMAC also increases. The averageconnection time achieved by HE-MAN’s clustering algorithm varies from 434 secondsin simulations with 100 nodes to 1213 seconds in simulations with 400 nodes, while theresults achieved with MDMAC ranged from 202 seconds in simulations with 100 nodesto 581 seconds in simulations with 400 nodes. The MDMAC algorithm presents lessvariation in the results, which can be explained by the careful selection of the nodesthat are able to join the network clusters.
Figure 6.9 illustrates the average lifetime of the clusters formed with HE-MAN’sand MDMAC’s algorithms. A cluster is created when at least two nodes get in thecommunication range of each other and a CH is elected. On the other hand, a clusteris destroyed when all members of a cluster lose communication with the cluster-head.This metric is used in the investigation of the stability of the clusters produced by the
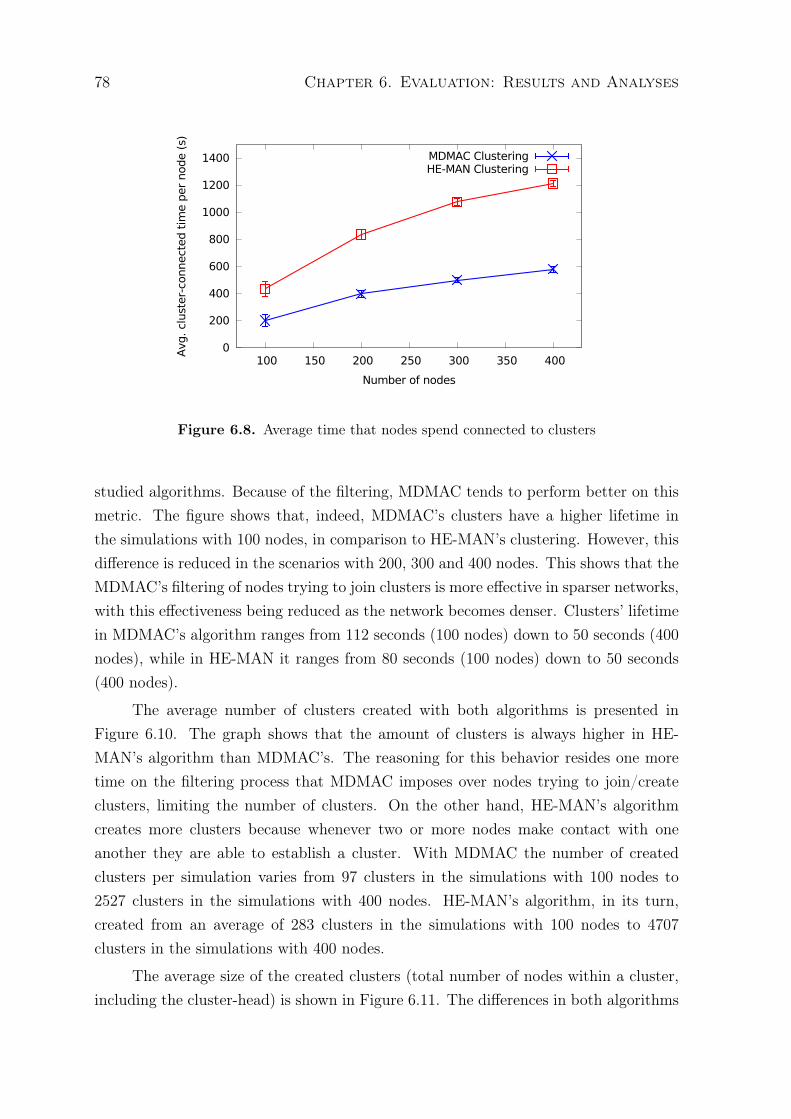
78 Chapter 6. Evaluation: Results and Analyses
0
200
400
600
800
1000
1200
1400
100 150 200 250 300 350 400
Avg
. cl
ust
er-
connect
ed t
ime p
er
node (
s)
Number of nodes
MDMAC ClusteringHE-MAN Clustering
Figure 6.8. Average time that nodes spend connected to clusters
studied algorithms. Because of the filtering, MDMAC tends to perform better on thismetric. The figure shows that, indeed, MDMAC’s clusters have a higher lifetime inthe simulations with 100 nodes, in comparison to HE-MAN’s clustering. However, thisdifference is reduced in the scenarios with 200, 300 and 400 nodes. This shows that theMDMAC’s filtering of nodes trying to join clusters is more effective in sparser networks,with this effectiveness being reduced as the network becomes denser. Clusters’ lifetimein MDMAC’s algorithm ranges from 112 seconds (100 nodes) down to 50 seconds (400nodes), while in HE-MAN it ranges from 80 seconds (100 nodes) down to 50 seconds(400 nodes).
The average number of clusters created with both algorithms is presented inFigure 6.10. The graph shows that the amount of clusters is always higher in HE-MAN’s algorithm than MDMAC’s. The reasoning for this behavior resides one moretime on the filtering process that MDMAC imposes over nodes trying to join/createclusters, limiting the number of clusters. On the other hand, HE-MAN’s algorithmcreates more clusters because whenever two or more nodes make contact with oneanother they are able to establish a cluster. With MDMAC the number of createdclusters per simulation varies from 97 clusters in the simulations with 100 nodes to2527 clusters in the simulations with 400 nodes. HE-MAN’s algorithm, in its turn,created from an average of 283 clusters in the simulations with 100 nodes to 4707clusters in the simulations with 400 nodes.
The average size of the created clusters (total number of nodes within a cluster,including the cluster-head) is shown in Figure 6.11. The differences in both algorithms
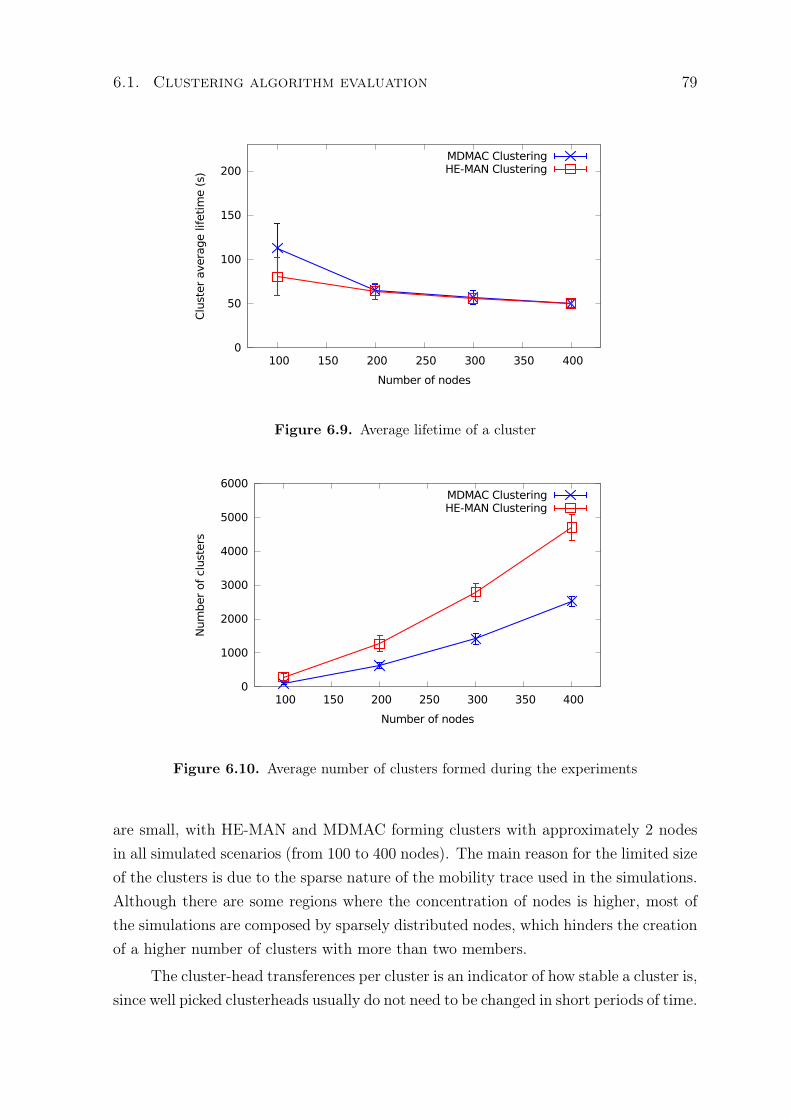
6.1. Clustering algorithm evaluation 79
0
50
100
150
200
100 150 200 250 300 350 400
Clu
ster
ave
rage li
feti
me (
s)
Number of nodes
MDMAC ClusteringHE-MAN Clustering
Figure 6.9. Average lifetime of a cluster
0
1000
2000
3000
4000
5000
6000
100 150 200 250 300 350 400
Num
ber
of
clust
ers
Number of nodes
MDMAC ClusteringHE-MAN Clustering
Figure 6.10. Average number of clusters formed during the experiments
are small, with HE-MAN and MDMAC forming clusters with approximately 2 nodesin all simulated scenarios (from 100 to 400 nodes). The main reason for the limited sizeof the clusters is due to the sparse nature of the mobility trace used in the simulations.Although there are some regions where the concentration of nodes is higher, most ofthe simulations are composed by sparsely distributed nodes, which hinders the creationof a higher number of clusters with more than two members.
The cluster-head transferences per cluster is an indicator of how stable a cluster is,since well picked clusterheads usually do not need to be changed in short periods of time.
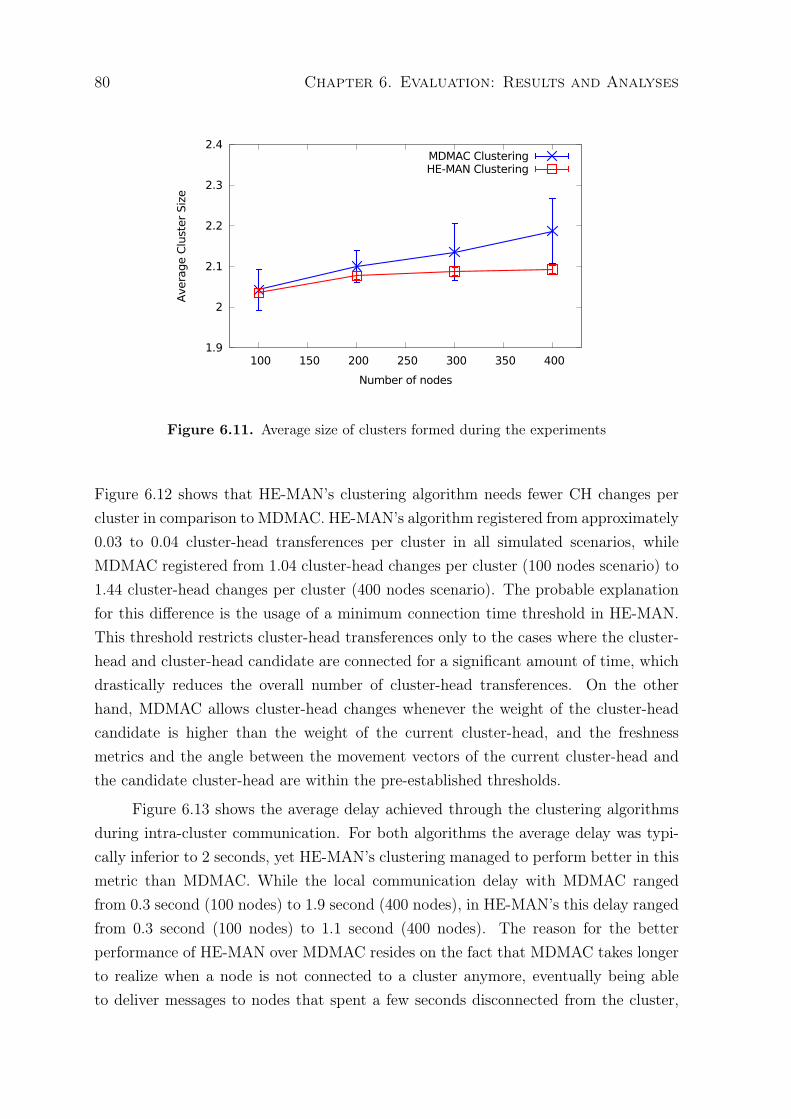
80 Chapter 6. Evaluation: Results and Analyses
1.9
2
2.1
2.2
2.3
2.4
100 150 200 250 300 350 400
Ave
rage C
lust
er
Siz
e
Number of nodes
MDMAC ClusteringHE-MAN Clustering
Figure 6.11. Average size of clusters formed during the experiments
Figure 6.12 shows that HE-MAN’s clustering algorithm needs fewer CH changes percluster in comparison to MDMAC. HE-MAN’s algorithm registered from approximately0.03 to 0.04 cluster-head transferences per cluster in all simulated scenarios, whileMDMAC registered from 1.04 cluster-head changes per cluster (100 nodes scenario) to1.44 cluster-head changes per cluster (400 nodes scenario). The probable explanationfor this difference is the usage of a minimum connection time threshold in HE-MAN.This threshold restricts cluster-head transferences only to the cases where the cluster-head and cluster-head candidate are connected for a significant amount of time, whichdrastically reduces the overall number of cluster-head transferences. On the otherhand, MDMAC allows cluster-head changes whenever the weight of the cluster-headcandidate is higher than the weight of the current cluster-head, and the freshnessmetrics and the angle between the movement vectors of the current cluster-head andthe candidate cluster-head are within the pre-established thresholds.
Figure 6.13 shows the average delay achieved through the clustering algorithmsduring intra-cluster communication. For both algorithms the average delay was typi-cally inferior to 2 seconds, yet HE-MAN’s clustering managed to perform better in thismetric than MDMAC. While the local communication delay with MDMAC rangedfrom 0.3 second (100 nodes) to 1.9 second (400 nodes), in HE-MAN’s this delay rangedfrom 0.3 second (100 nodes) to 1.1 second (400 nodes). The reason for the betterperformance of HE-MAN over MDMAC resides on the fact that MDMAC takes longerto realize when a node is not connected to a cluster anymore, eventually being ableto deliver messages to nodes that spent a few seconds disconnected from the cluster,
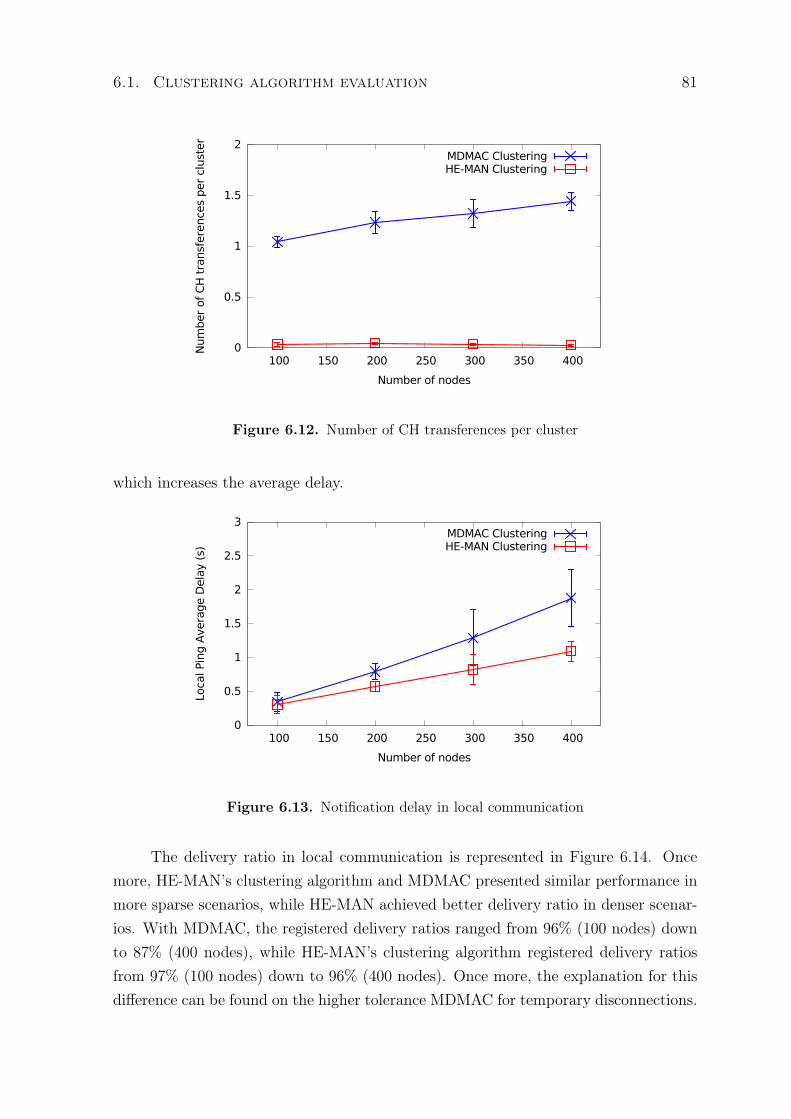
6.1. Clustering algorithm evaluation 81
0
0.5
1
1.5
2
100 150 200 250 300 350 400
Num
ber
of
CH
tra
nsf
ere
nce
s per
clust
er
Number of nodes
MDMAC ClusteringHE-MAN Clustering
Figure 6.12. Number of CH transferences per cluster
which increases the average delay.
0
0.5
1
1.5
2
2.5
3
100 150 200 250 300 350 400
Loca
l Pin
g A
vera
ge D
ela
y (s
)
Number of nodes
MDMAC ClusteringHE-MAN Clustering
Figure 6.13. Notification delay in local communication
The delivery ratio in local communication is represented in Figure 6.14. Oncemore, HE-MAN’s clustering algorithm and MDMAC presented similar performance inmore sparse scenarios, while HE-MAN achieved better delivery ratio in denser scenar-ios. With MDMAC, the registered delivery ratios ranged from 96% (100 nodes) downto 87% (400 nodes), while HE-MAN’s clustering algorithm registered delivery ratiosfrom 97% (100 nodes) down to 96% (400 nodes). Once more, the explanation for thisdifference can be found on the higher tolerance MDMAC for temporary disconnections.
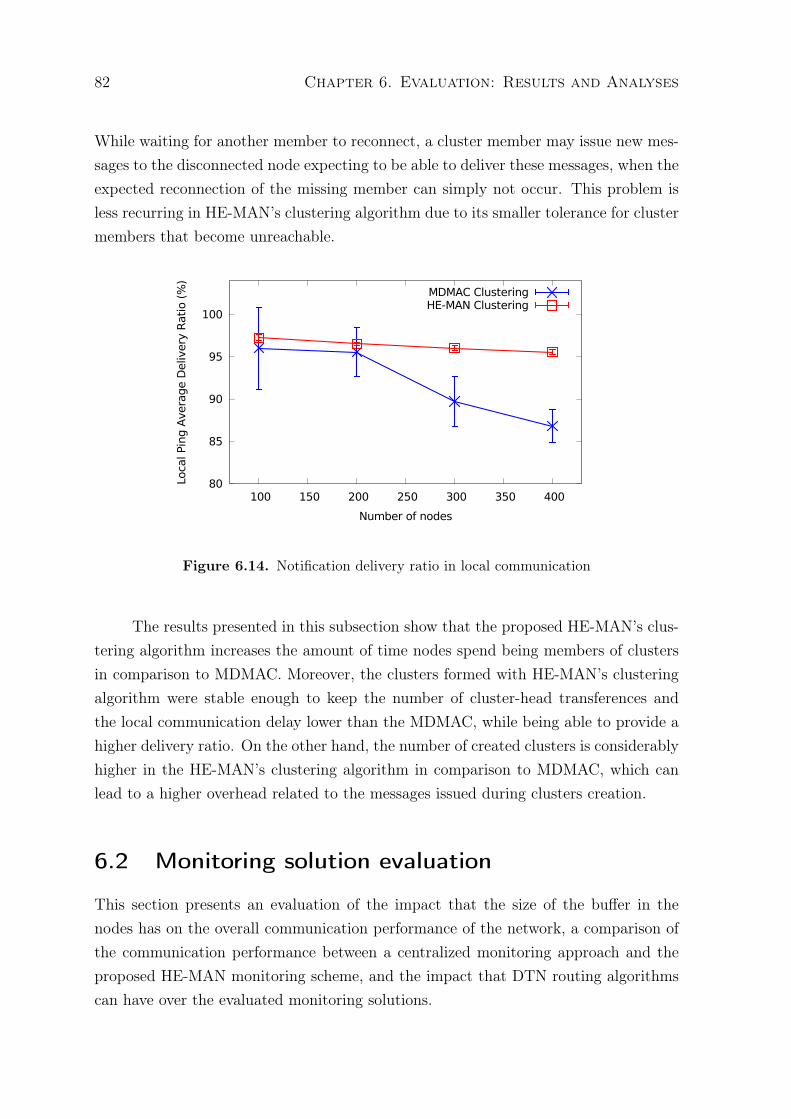
82 Chapter 6. Evaluation: Results and Analyses
While waiting for another member to reconnect, a cluster member may issue new mes-sages to the disconnected node expecting to be able to deliver these messages, when theexpected reconnection of the missing member can simply not occur. This problem isless recurring in HE-MAN’s clustering algorithm due to its smaller tolerance for clustermembers that become unreachable.
80
85
90
95
100
100 150 200 250 300 350 400
Loca
l Pin
g A
vera
ge D
eliv
ery
Rati
o (
%)
Number of nodes
MDMAC ClusteringHE-MAN Clustering
Figure 6.14. Notification delivery ratio in local communication
The results presented in this subsection show that the proposed HE-MAN’s clus-tering algorithm increases the amount of time nodes spend being members of clustersin comparison to MDMAC. Moreover, the clusters formed with HE-MAN’s clusteringalgorithm were stable enough to keep the number of cluster-head transferences andthe local communication delay lower than the MDMAC, while being able to provide ahigher delivery ratio. On the other hand, the number of created clusters is considerablyhigher in the HE-MAN’s clustering algorithm in comparison to MDMAC, which canlead to a higher overhead related to the messages issued during clusters creation.
6.2 Monitoring solution evaluation
This section presents an evaluation of the impact that the size of the buffer in thenodes has on the overall communication performance of the network, a comparison ofthe communication performance between a centralized monitoring approach and theproposed HE-MAN monitoring scheme, and the impact that DTN routing algorithmscan have over the evaluated monitoring solutions.
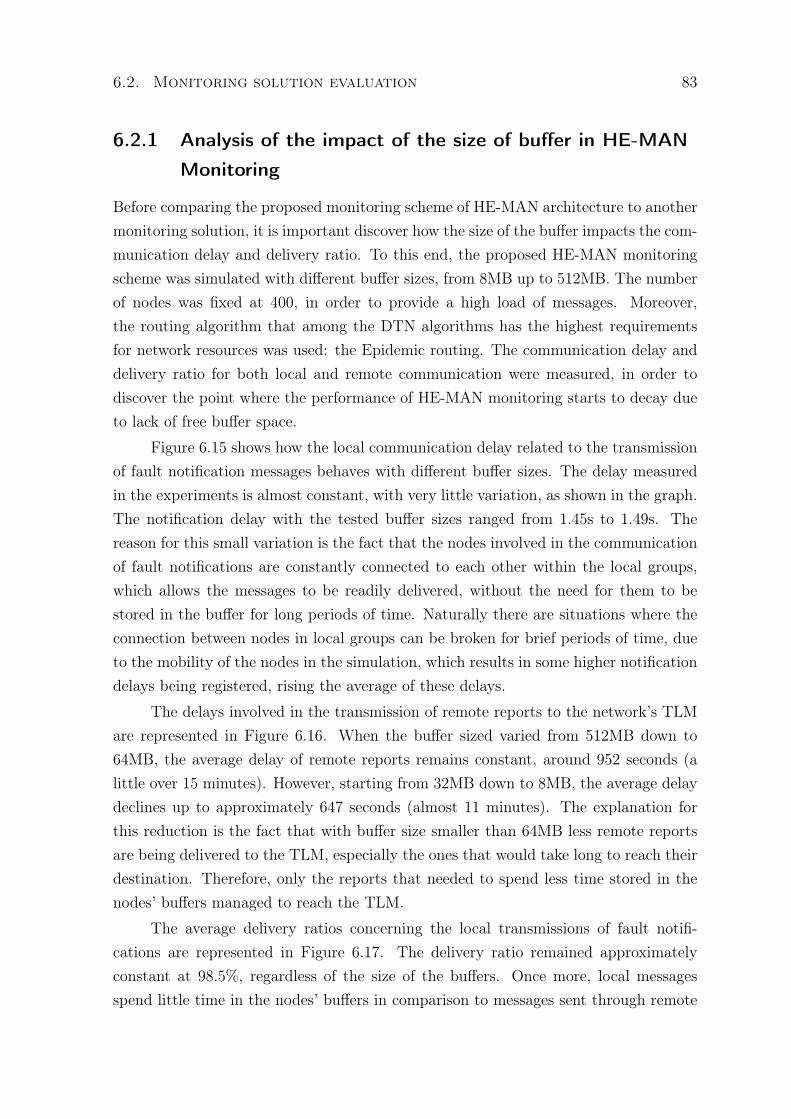
6.2. Monitoring solution evaluation 83
6.2.1 Analysis of the impact of the size of buffer in HE-MAN
Monitoring
Before comparing the proposed monitoring scheme of HE-MAN architecture to anothermonitoring solution, it is important discover how the size of the buffer impacts the com-munication delay and delivery ratio. To this end, the proposed HE-MAN monitoringscheme was simulated with different buffer sizes, from 8MB up to 512MB. The numberof nodes was fixed at 400, in order to provide a high load of messages. Moreover,the routing algorithm that among the DTN algorithms has the highest requirementsfor network resources was used: the Epidemic routing. The communication delay anddelivery ratio for both local and remote communication were measured, in order todiscover the point where the performance of HE-MAN monitoring starts to decay dueto lack of free buffer space.
Figure 6.15 shows how the local communication delay related to the transmissionof fault notification messages behaves with different buffer sizes. The delay measuredin the experiments is almost constant, with very little variation, as shown in the graph.The notification delay with the tested buffer sizes ranged from 1.45s to 1.49s. Thereason for this small variation is the fact that the nodes involved in the communicationof fault notifications are constantly connected to each other within the local groups,which allows the messages to be readily delivered, without the need for them to bestored in the buffer for long periods of time. Naturally there are situations where theconnection between nodes in local groups can be broken for brief periods of time, dueto the mobility of the nodes in the simulation, which results in some higher notificationdelays being registered, rising the average of these delays.
The delays involved in the transmission of remote reports to the network’s TLMare represented in Figure 6.16. When the buffer sized varied from 512MB down to64MB, the average delay of remote reports remains constant, around 952 seconds (alittle over 15 minutes). However, starting from 32MB down to 8MB, the average delaydeclines up to approximately 647 seconds (almost 11 minutes). The explanation forthis reduction is the fact that with buffer size smaller than 64MB less remote reportsare being delivered to the TLM, especially the ones that would take long to reach theirdestination. Therefore, only the reports that needed to spend less time stored in thenodes’ buffers managed to reach the TLM.
The average delivery ratios concerning the local transmissions of fault notifi-cations are represented in Figure 6.17. The delivery ratio remained approximatelyconstant at 98.5%, regardless of the size of the buffers. Once more, local messagesspend little time in the nodes’ buffers in comparison to messages sent through remote
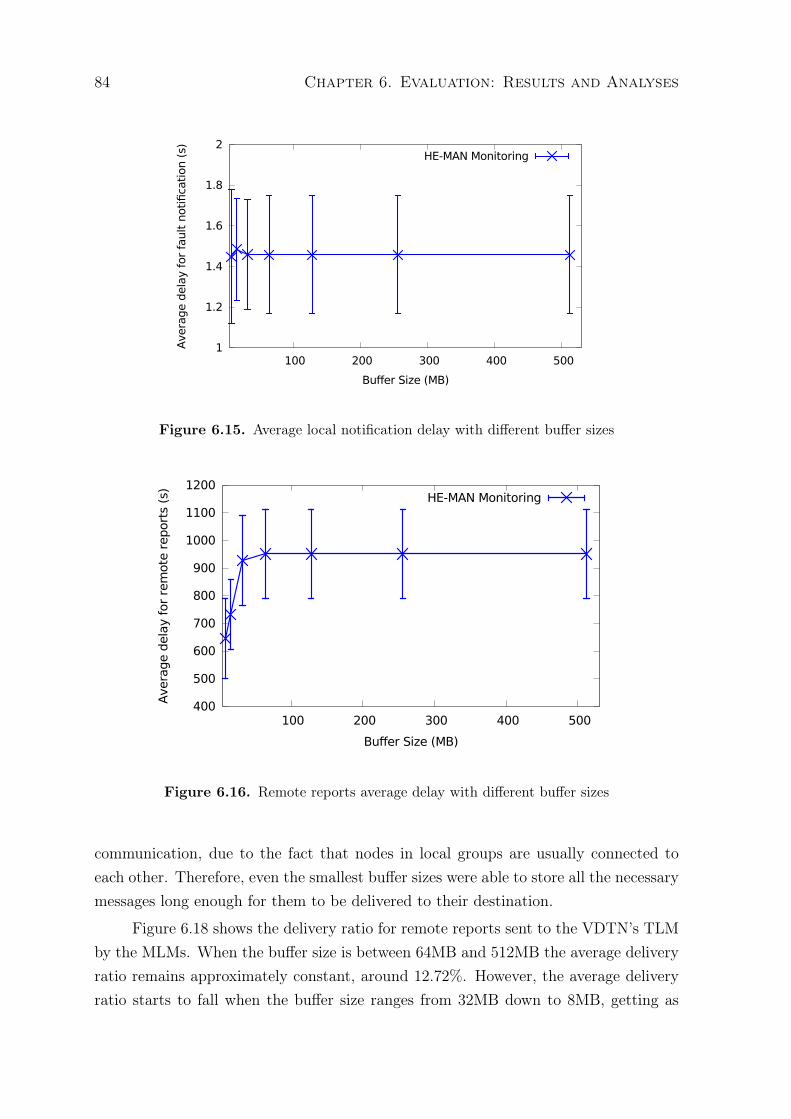
84 Chapter 6. Evaluation: Results and Analyses
1
1.2
1.4
1.6
1.8
2
100 200 300 400 500
Ave
rage d
ela
y fo
r fa
ult
notifica
tion (
s)
Buffer Size (MB)
HE-MAN Monitoring
Figure 6.15. Average local notification delay with different buffer sizes
400
500
600
700
800
900
1000
1100
1200
100 200 300 400 500
Ave
rage d
ela
y fo
r re
mote
report
s (s
)
Buffer Size (MB)
HE-MAN Monitoring
Figure 6.16. Remote reports average delay with different buffer sizes
communication, due to the fact that nodes in local groups are usually connected toeach other. Therefore, even the smallest buffer sizes were able to store all the necessarymessages long enough for them to be delivered to their destination.
Figure 6.18 shows the delivery ratio for remote reports sent to the VDTN’s TLMby the MLMs. When the buffer size is between 64MB and 512MB the average deliveryratio remains approximately constant, around 12.72%. However, the average deliveryratio starts to fall when the buffer size ranges from 32MB down to 8MB, getting as
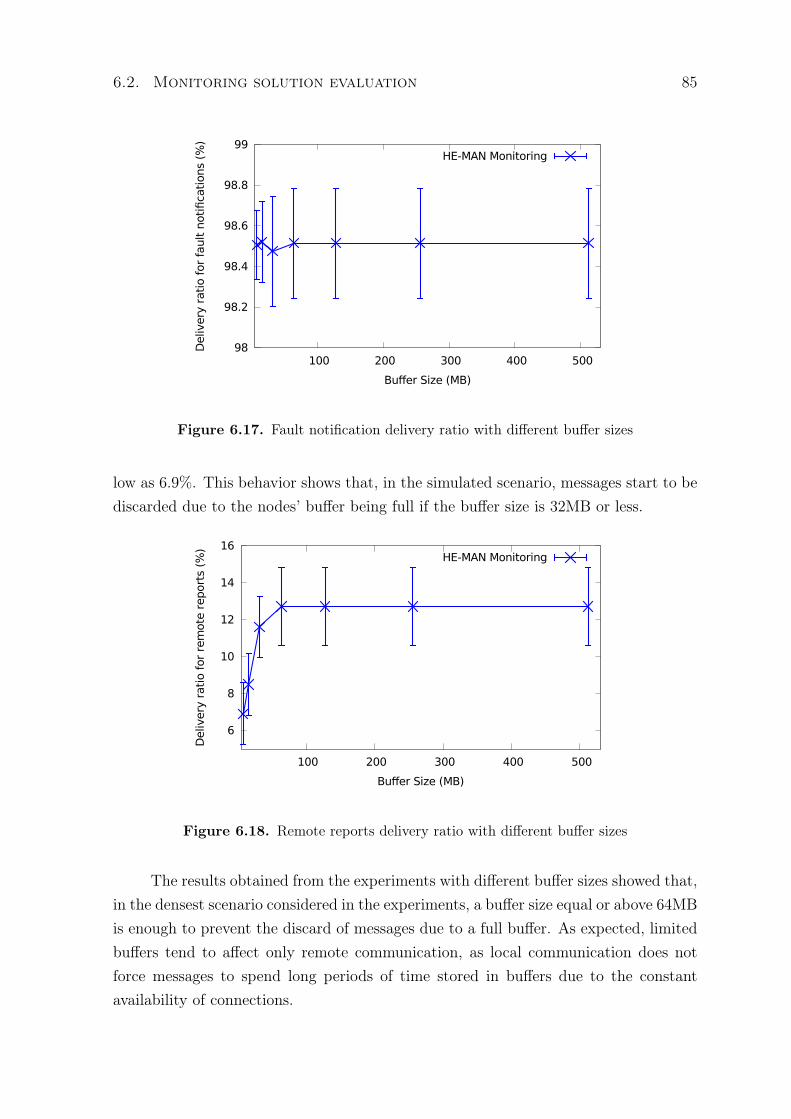
6.2. Monitoring solution evaluation 85
98
98.2
98.4
98.6
98.8
99
100 200 300 400 500
Deliv
ery
rati
o f
or
fault
notifica
tions
(%)
Buffer Size (MB)
HE-MAN Monitoring
Figure 6.17. Fault notification delivery ratio with different buffer sizes
low as 6.9%. This behavior shows that, in the simulated scenario, messages start to bediscarded due to the nodes’ buffer being full if the buffer size is 32MB or less.
6
8
10
12
14
16
100 200 300 400 500
Deliv
ery
rati
o f
or
rem
ote
report
s (%
)
Buffer Size (MB)
HE-MAN Monitoring
Figure 6.18. Remote reports delivery ratio with different buffer sizes
The results obtained from the experiments with different buffer sizes showed that,in the densest scenario considered in the experiments, a buffer size equal or above 64MBis enough to prevent the discard of messages due to a full buffer. As expected, limitedbuffers tend to affect only remote communication, as local communication does notforce messages to spend long periods of time stored in buffers due to the constantavailability of connections.
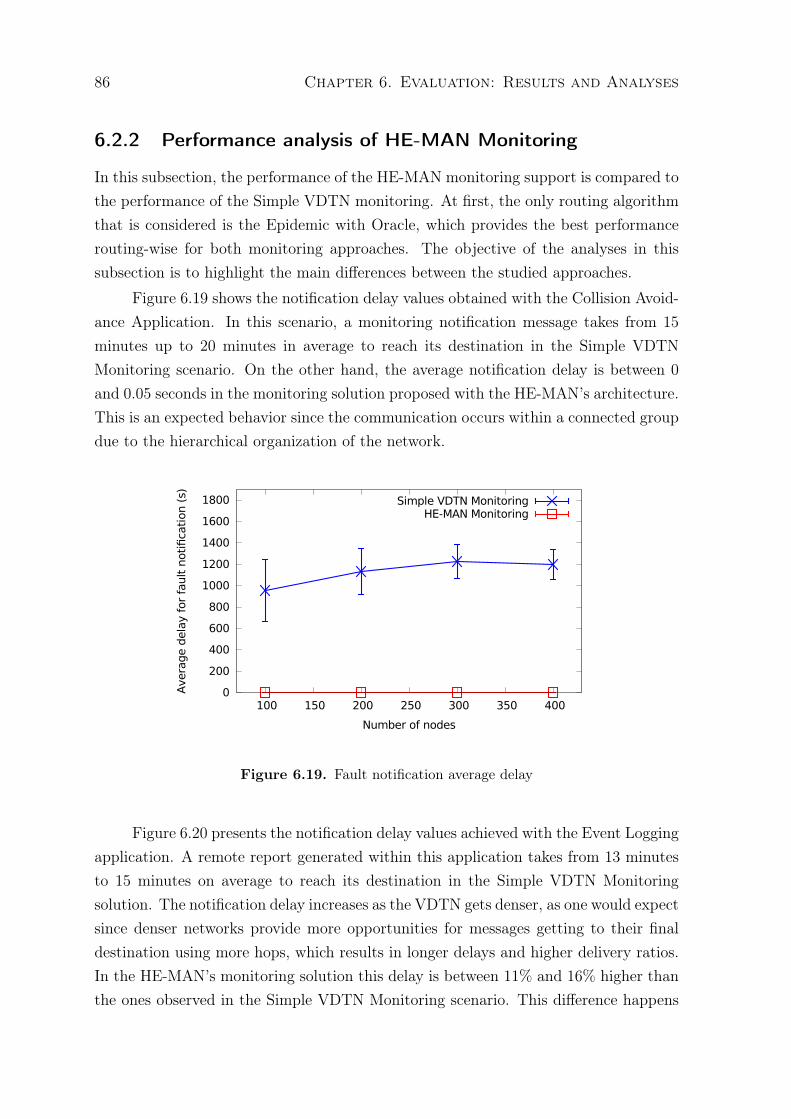
86 Chapter 6. Evaluation: Results and Analyses
6.2.2 Performance analysis of HE-MAN Monitoring
In this subsection, the performance of the HE-MAN monitoring support is compared tothe performance of the Simple VDTN monitoring. At first, the only routing algorithmthat is considered is the Epidemic with Oracle, which provides the best performancerouting-wise for both monitoring approaches. The objective of the analyses in thissubsection is to highlight the main differences between the studied approaches.
Figure 6.19 shows the notification delay values obtained with the Collision Avoid-ance Application. In this scenario, a monitoring notification message takes from 15minutes up to 20 minutes in average to reach its destination in the Simple VDTNMonitoring scenario. On the other hand, the average notification delay is between 0and 0.05 seconds in the monitoring solution proposed with the HE-MAN’s architecture.This is an expected behavior since the communication occurs within a connected groupdue to the hierarchical organization of the network.
0
200
400
600
800
1000
1200
1400
1600
1800
100 150 200 250 300 350 400
Ave
rage d
ela
y fo
r fa
ult
notifica
tion (
s)
Number of nodes
Simple VDTN MonitoringHE-MAN Monitoring
Figure 6.19. Fault notification average delay
Figure 6.20 presents the notification delay values achieved with the Event Loggingapplication. A remote report generated within this application takes from 13 minutesto 15 minutes on average to reach its destination in the Simple VDTN Monitoringsolution. The notification delay increases as the VDTN gets denser, as one would expectsince denser networks provide more opportunities for messages getting to their finaldestination using more hops, which results in longer delays and higher delivery ratios.In the HE-MAN’s monitoring solution this delay is between 11% and 16% higher thanthe ones observed in the Simple VDTN Monitoring scenario. This difference happens
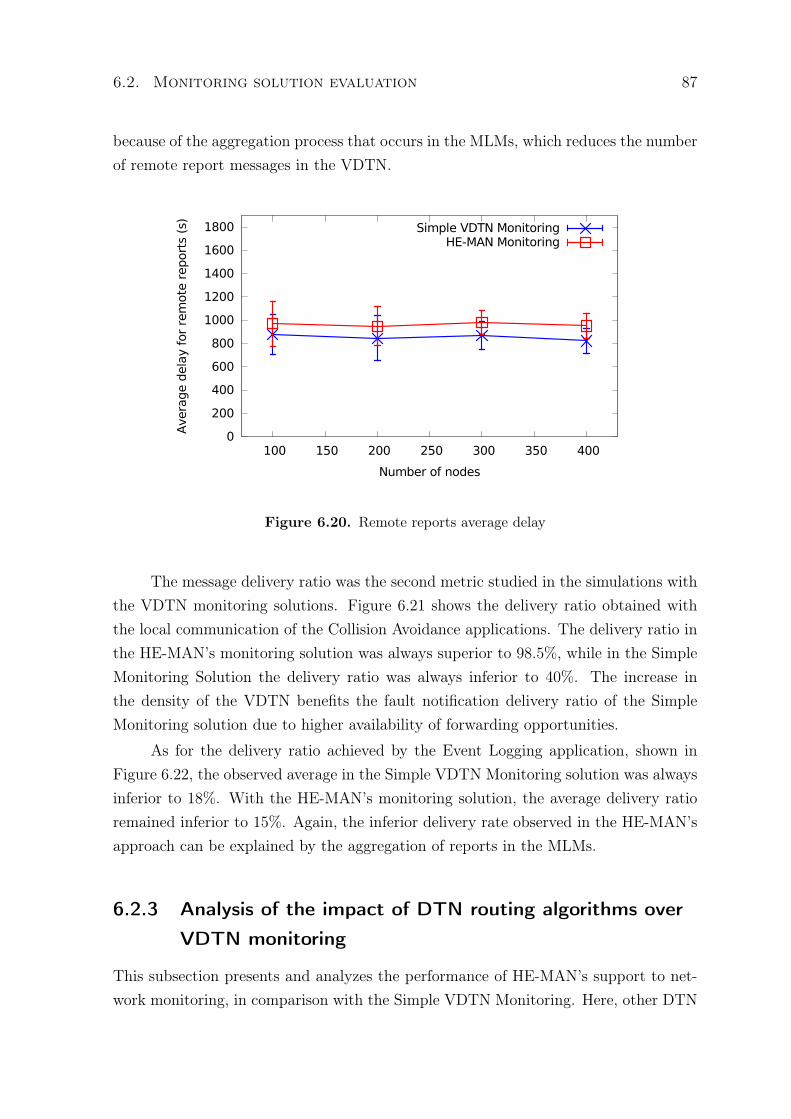
6.2. Monitoring solution evaluation 87
because of the aggregation process that occurs in the MLMs, which reduces the numberof remote report messages in the VDTN.
0
200
400
600
800
1000
1200
1400
1600
1800
100 150 200 250 300 350 400
Ave
rage d
ela
y fo
r re
mote
report
s (s
)
Number of nodes
Simple VDTN MonitoringHE-MAN Monitoring
Figure 6.20. Remote reports average delay
The message delivery ratio was the second metric studied in the simulations withthe VDTN monitoring solutions. Figure 6.21 shows the delivery ratio obtained withthe local communication of the Collision Avoidance applications. The delivery ratio inthe HE-MAN’s monitoring solution was always superior to 98.5%, while in the SimpleMonitoring Solution the delivery ratio was always inferior to 40%. The increase inthe density of the VDTN benefits the fault notification delivery ratio of the SimpleMonitoring solution due to higher availability of forwarding opportunities.
As for the delivery ratio achieved by the Event Logging application, shown inFigure 6.22, the observed average in the Simple VDTN Monitoring solution was alwaysinferior to 18%. With the HE-MAN’s monitoring solution, the average delivery ratioremained inferior to 15%. Again, the inferior delivery rate observed in the HE-MAN’sapproach can be explained by the aggregation of reports in the MLMs.
6.2.3 Analysis of the impact of DTN routing algorithms over
VDTN monitoring
This subsection presents and analyzes the performance of HE-MAN’s support to net-work monitoring, in comparison with the Simple VDTN Monitoring. Here, other DTN
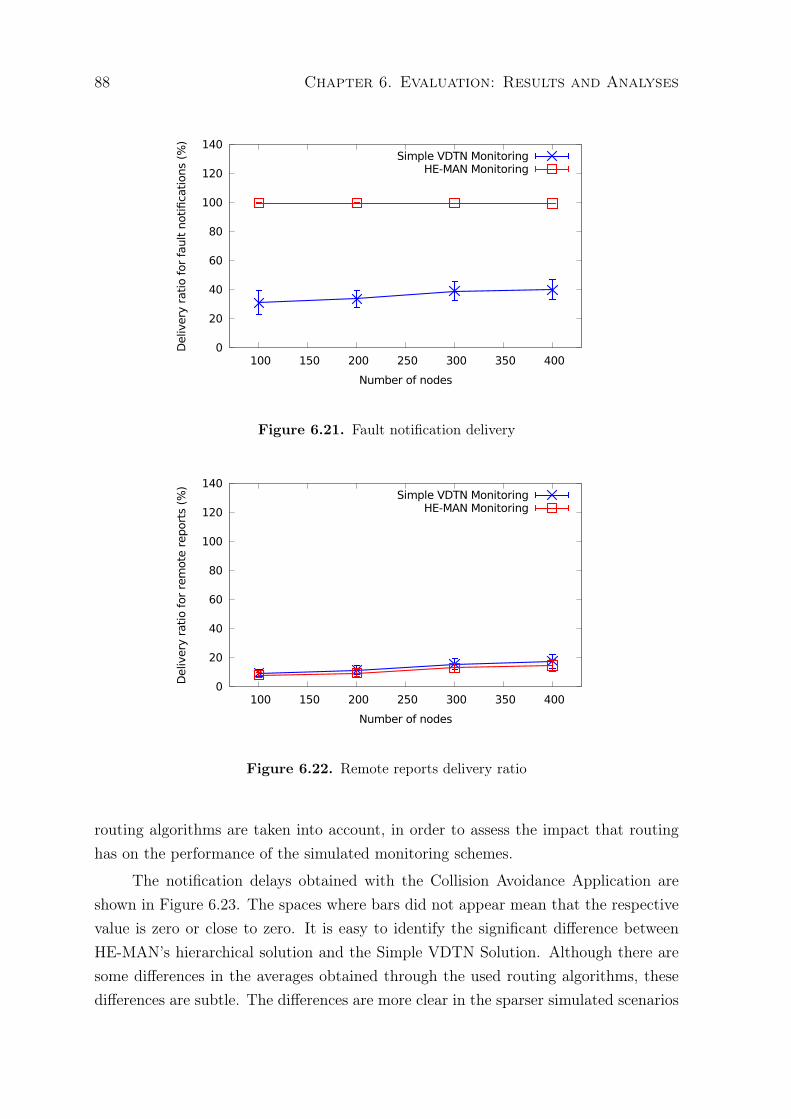
88 Chapter 6. Evaluation: Results and Analyses
0
20
40
60
80
100
120
140
100 150 200 250 300 350 400
Deliv
ery
rati
o f
or
fault
notifica
tions
(%)
Number of nodes
Simple VDTN MonitoringHE-MAN Monitoring
Figure 6.21. Fault notification delivery
0
20
40
60
80
100
120
140
100 150 200 250 300 350 400
Deliv
ery
rati
o f
or
rem
ote
report
s (%
)
Number of nodes
Simple VDTN MonitoringHE-MAN Monitoring
Figure 6.22. Remote reports delivery ratio
routing algorithms are taken into account, in order to assess the impact that routinghas on the performance of the simulated monitoring schemes.
The notification delays obtained with the Collision Avoidance Application areshown in Figure 6.23. The spaces where bars did not appear mean that the respectivevalue is zero or close to zero. It is easy to identify the significant difference betweenHE-MAN’s hierarchical solution and the Simple VDTN Solution. Although there aresome differences in the averages obtained through the used routing algorithms, thesedifferences are subtle. The differences are more clear in the sparser simulated scenarios
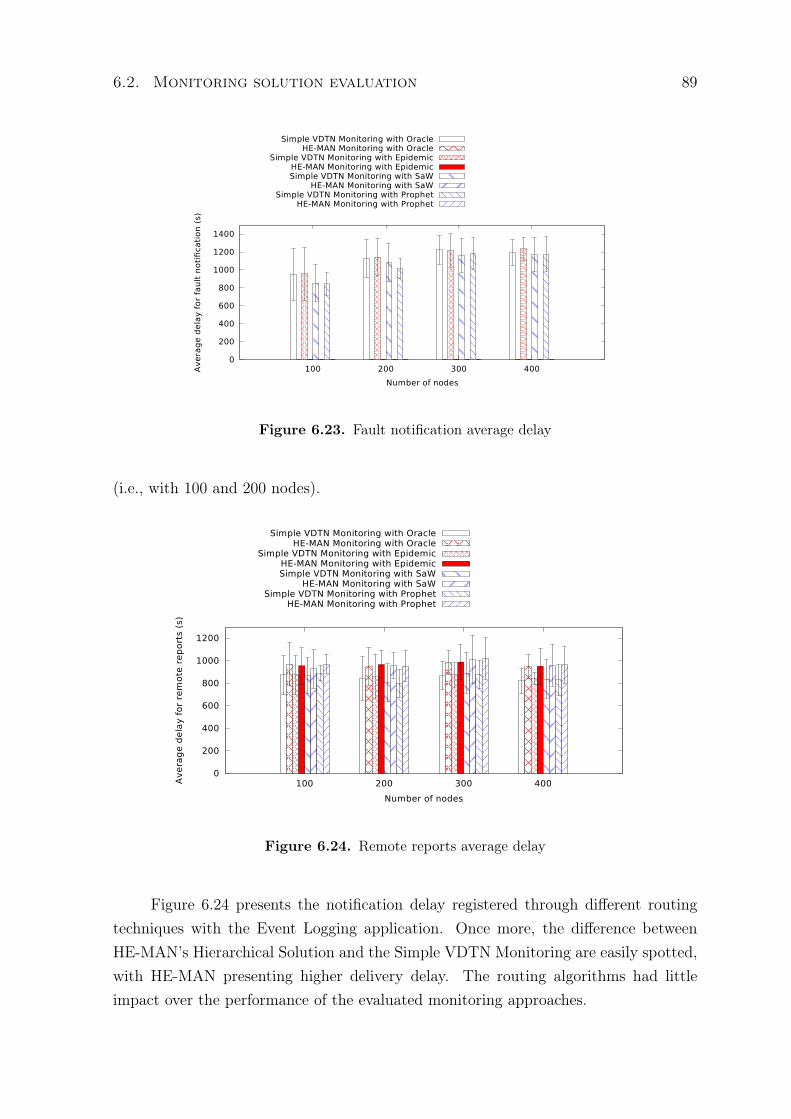
6.2. Monitoring solution evaluation 89
0
200
400
600
800
1000
1200
1400
100 200 300 400Ave
rag
e d
ela
y f
or
fau
lt n
otifi
cati
on
(s)
Number of nodes
Simple VDTN Monitoring with OracleHE-MAN Monitoring with Oracle
Simple VDTN Monitoring with EpidemicHE-MAN Monitoring with EpidemicSimple VDTN Monitoring with SaW
HE-MAN Monitoring with SaWSimple VDTN Monitoring with Prophet
HE-MAN Monitoring with Prophet
Figure 6.23. Fault notification average delay
(i.e., with 100 and 200 nodes).
0
200
400
600
800
1000
1200
100 200 300 400Ave
rag
e d
ela
y f
or
rem
ote
re
po
rts
(s)
Number of nodes
Simple VDTN Monitoring with OracleHE-MAN Monitoring with Oracle
Simple VDTN Monitoring with EpidemicHE-MAN Monitoring with EpidemicSimple VDTN Monitoring with SaW
HE-MAN Monitoring with SaWSimple VDTN Monitoring with Prophet
HE-MAN Monitoring with Prophet
Figure 6.24. Remote reports average delay
Figure 6.24 presents the notification delay registered through different routingtechniques with the Event Logging application. Once more, the difference betweenHE-MAN’s Hierarchical Solution and the Simple VDTN Monitoring are easily spotted,with HE-MAN presenting higher delivery delay. The routing algorithms had littleimpact over the performance of the evaluated monitoring approaches.
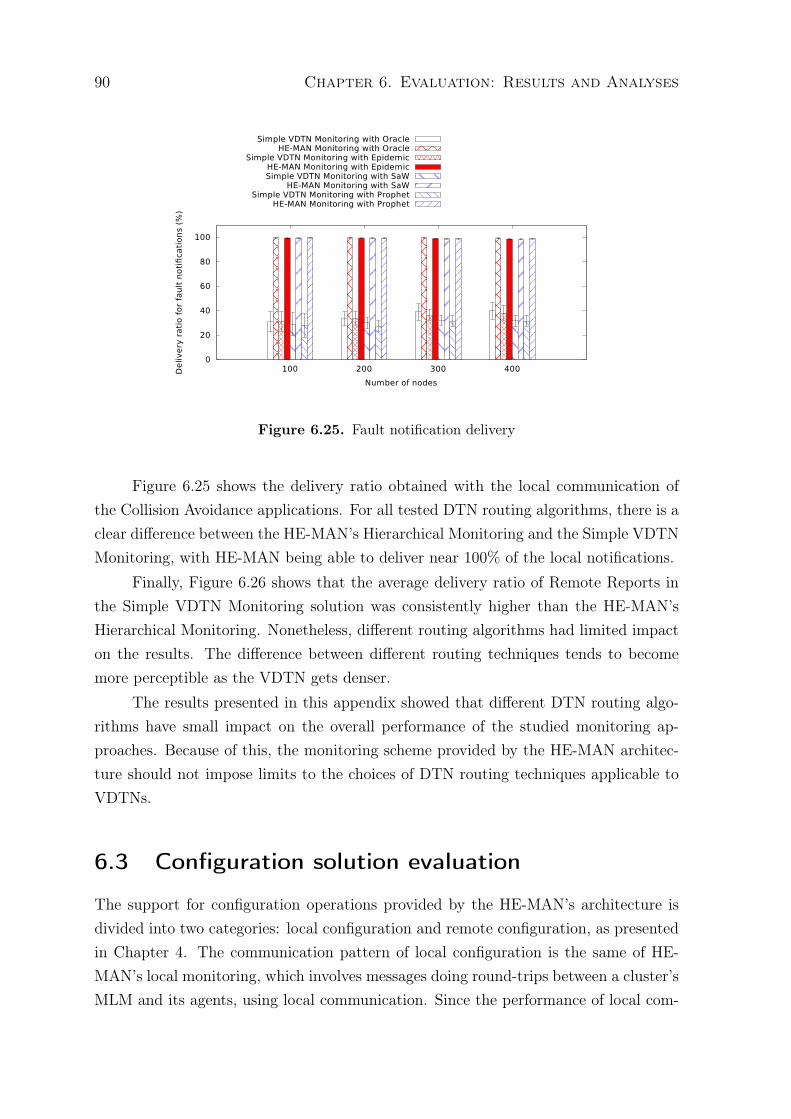
90 Chapter 6. Evaluation: Results and Analyses
0
20
40
60
80
100
100 200 300 400De
live
ry r
ati
o f
or
fau
lt n
otifi
cati
on
s (%
)
Number of nodes
Simple VDTN Monitoring with OracleHE-MAN Monitoring with Oracle
Simple VDTN Monitoring with EpidemicHE-MAN Monitoring with EpidemicSimple VDTN Monitoring with SaW
HE-MAN Monitoring with SaWSimple VDTN Monitoring with Prophet
HE-MAN Monitoring with Prophet
Figure 6.25. Fault notification delivery
Figure 6.25 shows the delivery ratio obtained with the local communication ofthe Collision Avoidance applications. For all tested DTN routing algorithms, there is aclear difference between the HE-MAN’s Hierarchical Monitoring and the Simple VDTNMonitoring, with HE-MAN being able to deliver near 100% of the local notifications.
Finally, Figure 6.26 shows that the average delivery ratio of Remote Reports inthe Simple VDTN Monitoring solution was consistently higher than the HE-MAN’sHierarchical Monitoring. Nonetheless, different routing algorithms had limited impacton the results. The difference between different routing techniques tends to becomemore perceptible as the VDTN gets denser.
The results presented in this appendix showed that different DTN routing algo-rithms have small impact on the overall performance of the studied monitoring ap-proaches. Because of this, the monitoring scheme provided by the HE-MAN architec-ture should not impose limits to the choices of DTN routing techniques applicable toVDTNs.
6.3 Configuration solution evaluation
The support for configuration operations provided by the HE-MAN’s architecture isdivided into two categories: local configuration and remote configuration, as presentedin Chapter 4. The communication pattern of local configuration is the same of HE-MAN’s local monitoring, which involves messages doing round-trips between a cluster’sMLM and its agents, using local communication. Since the performance of local com-
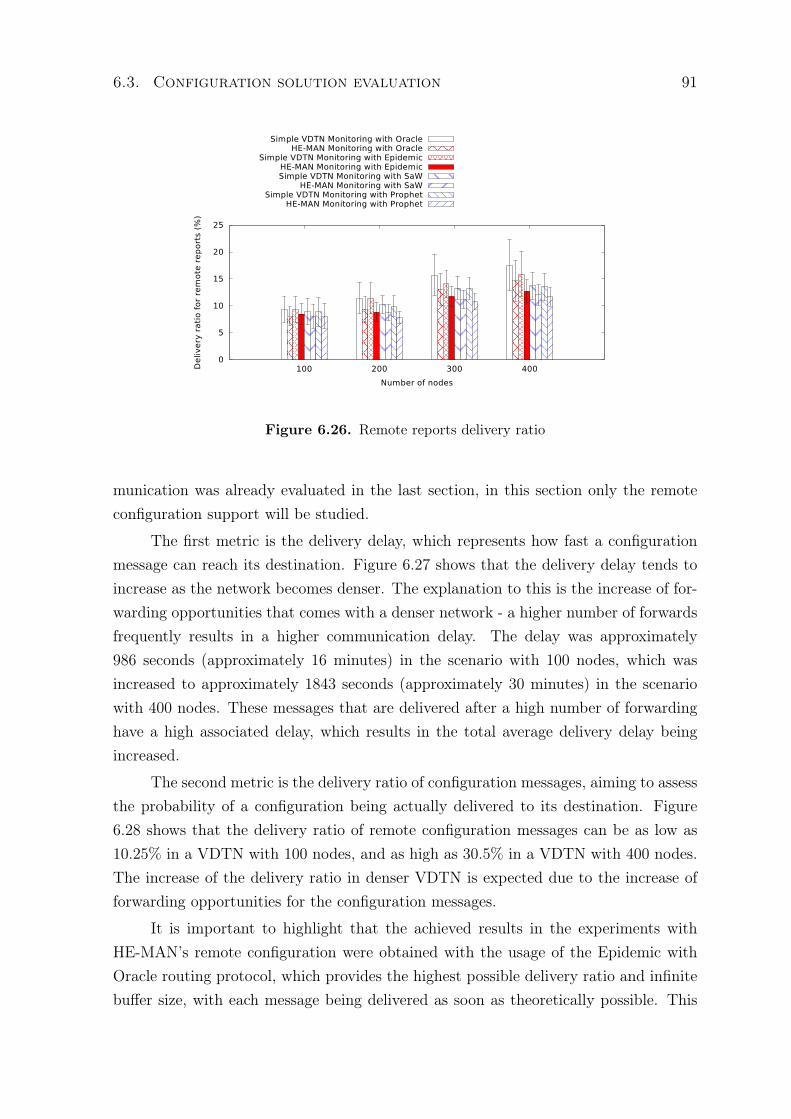
6.3. Configuration solution evaluation 91
0
5
10
15
20
25
100 200 300 400De
live
ry r
ati
o f
or
rem
ote
re
po
rts
(%)
Number of nodes
Simple VDTN Monitoring with OracleHE-MAN Monitoring with Oracle
Simple VDTN Monitoring with EpidemicHE-MAN Monitoring with EpidemicSimple VDTN Monitoring with SaW
HE-MAN Monitoring with SaWSimple VDTN Monitoring with Prophet
HE-MAN Monitoring with Prophet
Figure 6.26. Remote reports delivery ratio
munication was already evaluated in the last section, in this section only the remoteconfiguration support will be studied.
The first metric is the delivery delay, which represents how fast a configurationmessage can reach its destination. Figure 6.27 shows that the delivery delay tends toincrease as the network becomes denser. The explanation to this is the increase of for-warding opportunities that comes with a denser network - a higher number of forwardsfrequently results in a higher communication delay. The delay was approximately986 seconds (approximately 16 minutes) in the scenario with 100 nodes, which wasincreased to approximately 1843 seconds (approximately 30 minutes) in the scenariowith 400 nodes. These messages that are delivered after a high number of forwardinghave a high associated delay, which results in the total average delivery delay beingincreased.
The second metric is the delivery ratio of configuration messages, aiming to assessthe probability of a configuration being actually delivered to its destination. Figure6.28 shows that the delivery ratio of remote configuration messages can be as low as10.25% in a VDTN with 100 nodes, and as high as 30.5% in a VDTN with 400 nodes.The increase of the delivery ratio in denser VDTN is expected due to the increase offorwarding opportunities for the configuration messages.
It is important to highlight that the achieved results in the experiments withHE-MAN’s remote configuration were obtained with the usage of the Epidemic withOracle routing protocol, which provides the highest possible delivery ratio and infinitebuffer size, with each message being delivered as soon as theoretically possible. This
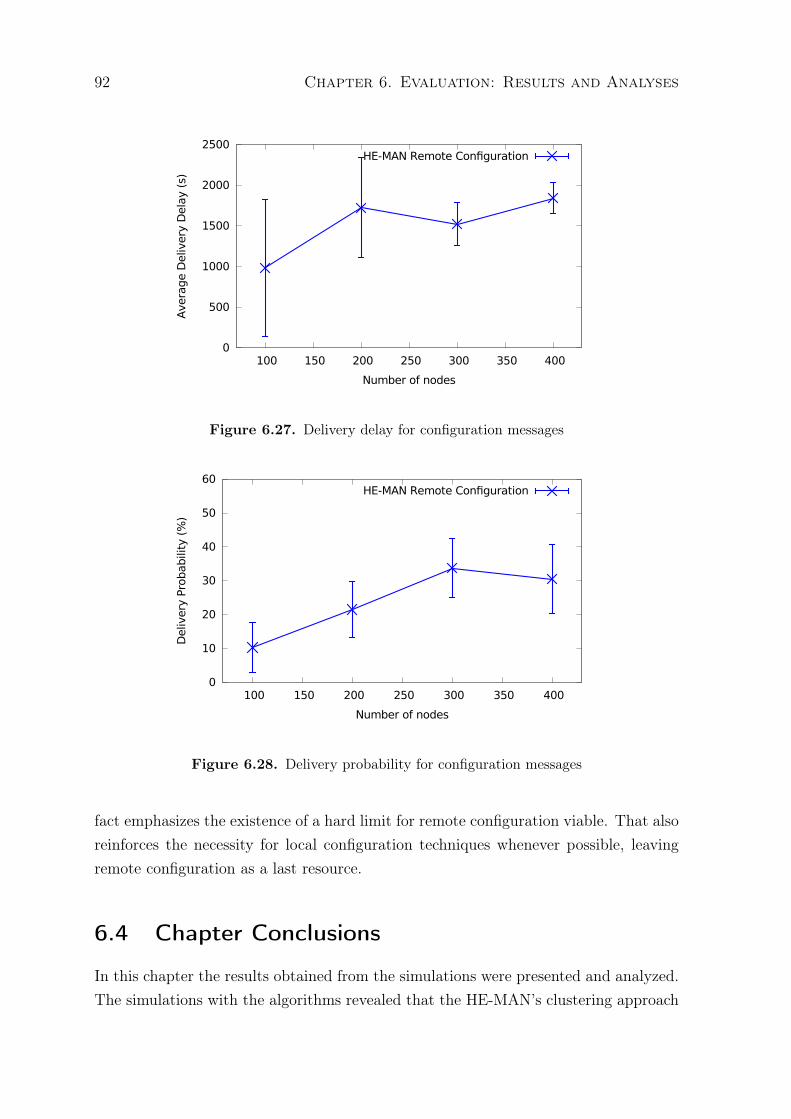
92 Chapter 6. Evaluation: Results and Analyses
0
500
1000
1500
2000
2500
100 150 200 250 300 350 400
Ave
rage D
eliv
ery
Dela
y (s
)
Number of nodes
HE-MAN Remote Configuration
Figure 6.27. Delivery delay for configuration messages
0
10
20
30
40
50
60
100 150 200 250 300 350 400
Deliv
ery
Pro
babili
ty (
%)
Number of nodes
HE-MAN Remote Configuration
Figure 6.28. Delivery probability for configuration messages
fact emphasizes the existence of a hard limit for remote configuration viable. That alsoreinforces the necessity for local configuration techniques whenever possible, leavingremote configuration as a last resource.
6.4 Chapter Conclusions
In this chapter the results obtained from the simulations were presented and analyzed.The simulations with the algorithms revealed that the HE-MAN’s clustering approach
6.4. Chapter Conclusions 93
was able to form clusters that are more inclusive to vehicular nodes in comparison toa similar clustering algorithm used as the baseline. The increase of the time nodesspent connected to clusters in HE-MAN was achieved without excessively sacrificingthe stability of said clusters. The monitoring techniques designed for the HE-MANarchitecture take advantage of the hierarchical organization of the VDTN to drasticallyreduce the communication delay and increase the message delivery ratio, which thenenables the usage of near real-time monitoring techniques within the clusters. As forthe HE-MAN’s VDTN remote configuration approach, simulations pointed out thatwhile this approach is possible, it has significant delays, as well as low delivery ratio,especially in sparse networks. Therefore, remote configuration should be used only asa last resort, giving preference to local configuration.
The next chapter presents the main conclusions drawn from this thesis, summa-rizing the lessons learnt, the achieved results and the limitations of this work. Finally,future directions of this research are presented and discussed.

Chapter 7
Conclusions and Future Work
VDTN is a research field that continues to attract attention from both the academiaand the industry, with new solutions being designed every year in order to make thistype of network more and more viable. However, even in face of the developmentsexperienced by the VDTN area, only few works try to solve the network managementproblems that are characteristic to these networks, as shown in Chapter 3 of thisthesis. The small amount of research on network management techniques for VDTNsemphasizes the importance of this thesis.
Most of the management requirements that apply to regular DTN also apply toVDTN, such as the long delays for a network manager to receive notifications fromremote nodes, or the possibility of a configuration message arriving at its destinationtoo late to be effective. Moreover, VDTNs impose challenges to management systemsthat are specific of this type of network. For instance, vehicular safety applications arevery sensitive to delays, and this characteristic affects the requirements of a VDTNmanagement system, since failing to effectively detect faults in safety systems can re-sult in road accidents. Considering that frequent link disruptions and long deliverydelays are unavoidable when it comes to remote communication in VDTNs, one of theconclusions of this research is the necessity of the management system to be aware ofthe current network topology at any given time, in order to be able to take advantageof local communication. This strategy is possibly the only way to a VDTN manage-ment system be able to perform near-real-time monitoring and configuration, althoughlimited only to connected portions of the network.
This thesis proposed an architecture designed for establishing a hierarchical man-agement of the network. The proposed architecture, called HE-MAN, provides meansfor connected groups detection and clusters formation, establishing a Mid-Level Man-ager (MLM) for each connected group of vehicular nodes. The group detection and
95
96 Chapter 7. Conclusions and Future Work
MLM election processes are made possible through a new clustering algorithm that wasdesigned specifically for the HE-MAN architecture. Once the management topologyis hierarchically organized, our proposed techniques for monitoring and configurationtake advantage of local communication for optimizing the management tasks, aimingto improve the overall responsiveness and reliability of the management systems.
Simulations showed that our proposed clustering algorithm can organize con-nected groups successfully, having as one of the main objectives the maximization ofthe amount of time a node spends connected to VDTN clusters. By doing so, nodes canbe locally monitored and configured by MLMs for a maximized amount of time, makingthese management tasks more reliable and efficient. Simulation results pointed thatHE-MAN’s clustering algorithm successfully improved the total time a vehicle spendsconnected to the clusters without completely sacrificing the stability of the clusters. Itwas also demonstrated in the simulations that the HE-MAN architecture have madepossible, within the clusters, delivery ratios and notification delays compatible with theones found in connected networks. Such results allow the usage of near-real-time mon-itoring techniques inside connected groups, for the monitoring of devices and softwarethat are delay-sensitive (e.g., road safety systems). Also, MLMs were able to gathermonitoring data from the agents in their respective clusters for forwarding it to theTLM, achieving delivery ratio and notification delay only slightly inferior to the con-sidered baseline, which consisted of every agent sending their monitoring data directlyto the central manager of the VDTN. The monitoring data aggregation that occurs inthe MLMs help reducing the amount of bundles crossing the VDTN towards the TLM.Finally, the proposed remote configuration scheme allows the TLM to issue commandsto remote nodes of the VDTN while having the means for verifying whether the situa-tion of the node upon the reception of the new configuration remains consistent to theknowledge the TLM has about it or not.
In summary, the main contributions of this research work are:
1. a review and analysis of the literature related to VDTN management (Objective1);
2. a formalization of the problem and goals of VDTN management (Objective 2);
3. the design of an architecture suitable for the management of VDTNs (Objective3);
4. the design of monitoring algorithms suitable for local and remote communication(Objective 4);
7.1. Limitations 97
5. the design of configuration algorithms suitable for local and remote communica-tion (Objective 5);
6. qualitative and quantitative evaluations of the algorithms proposed for VDTNmanagement (Objective 6)
7.1 Limitations
There are limitations regarding the research that need consideration. First of all, thisthesis investigated Fault Management and Configuration Management, which leavesplenty of room for the development of a more complete architecture for VDTN man-agement that is able to explore other management dimensions (e.g., Accounting Man-agement, Performance Management, and Security Management).
Moreover, many of the scenarios used in this thesis as base of comparison are hy-pothetical, which reduces the level of realism of the evaluation. However, this happensdue to the lack of real data about operational VDTNs at the moment this thesis waswritten.
Finally, not all characteristics found in actual hardware devices and softwareimplementations are covered by simulators, which needs to be accomplished outside ofa simulation environment.
7.2 On the Applicability of the Proposals on
Different Scenarios
All the contributions provided by this thesis took into consideration the VDTN sce-nario. However, there are other scenarios where such contributions may be applicable.Since some dominant characteristics of VDTNs are high mobility of nodes, existence ofdense and sparse regions in the network, and the opportunistic nature of the contacts,networks sharing these same characteristics may be candidates for the re-use of theresults presented in this thesis.
Some scenarios where this thesis could be applied are the following:
• Emergency Networks: this type of network shares some important character-istics with VDTNs, such as the natural occurrence of groups of nodes(usually as aresult of first responder teams moving together), the existence of a central entitymanaging the devices and services deployed in the disaster mitigation zone, and
98 Chapter 7. Conclusions and Future Work
the opportunistic nature of contacts due to the somewhat unpredictable move-ment of the network’s nodes [Calarco and Casoni, 2011];
• Pocket Switched Networks (PSNs): this type of network aims to enable net-work services for mobile users through their personal devices (e.g., mobile phones,laptops, PDAs, etc.) even when they are not in reach of Internet connectivityislands [Hui et al., 2005]. Moreover, contacts in PSNs are opportunistic, andthe nodes are likely to form islands of connectivity (e.g., grouping resulting frompeople gathering at some point of interest). All these characteristics turn PSNscandidates for the network management solutions found in HE-MAN’s architec-ture.
On the other hand, some examples of scenarios that are unlikely to be suitablefor using the contributions presented in this thesis are the following:
• VANETs (MANETs): if the vehicular network being considered does not havenetwork partition of its topology, making it behave as a conventional MANET,then problems like long notification delays in monitoring operations or configu-ration messages arriving too late at their destination would not exist, renderingthe usage of the HE-MAN architecture pointless;
• Deep Space Networks: despite this type of network suffering from frequentlink disconnections and long propagation delays, its nodes are typically travellingin an isolated manner. This behavior does not allow the formation of locallyconnected groups, which is one of the assumptions of HE-MAN.
7.3 Future Work
Considering the current limitations of the HE-MAN architecture, and the possibilitiesof extending the applicability of the solution proposed in this research to other net-working scenarios, there is a number of future research that is being considered. First,since HE-MAN’s current functionalities are focused on Fault Management and Config-uration Management, the architecture could be expanded in order to encompass otherdimensions, such as Accounting Management, Performance Management and SecurityManagement. Second, the development of a prototype implementation of HE-MANin a testbed would allow more realistic results on the performance of the architecturein a real-life environment and provide insights for improvements to HE-MAN. Finally,new studies concerning the usage of HE-MAN in delay-tolerant networking scenarios
7.4. Publications 99
other than VDTNs would be desirable, with the objective of making HE-MAN a moregeneral solution.
7.4 Publications
This section lists the publications that were direct results of the doctorate researchdescribed in this thesis.
• Salvador, E. M., Macedo, D. F., Nogueira, J. M., Almeida, V. D. D., Granville,L. Z. (2016) Hierarchy-based Monitoring of Vehicular Delay-Tolerant Networks.In Proceedings of the 13th IEEE Annual Consumer Communications and Net-working Conference (CCNC 2016). Las Vegas, 2016.
• Salvador, E. M., Mota, V., Macedo, D. F., Nogueira, J. M., Nobre, J. C., Duarte,P. A. P. R., Granville, L. Z., Tarouco, L. M. R. (2014) Uma Avaliação de Abor-dagens de Distribuição para Gerenciamento de Redes Tolerantes a Atrasos eDesconexões. In Anais do XV Workshop de Testes e Tolerância a Falhas (WTF2014), Florianópolis, 2014.
• Salvador, E. M., Macedo, D. F., Nogueira, J. M. (2011a) Gerência Autonômica deRedes DTN. In I Workshop on Autonomic Distributed Systems (WoSIDA 2011),Campo Grande, 2011.
• Salvador, E. M., Macedo, D. F., Nogueira, J. M., Nobre, J. C., Duarte, P. A. P.R., Granville, L. Z., Tarouco, L. M. R. (2011b) Work-in-progress: Towards anArchitecture for Managing Delay-Tolerant Emergency Networks. In Proceedingson the 3rd Extreme Conference on Communication (Extremecom 2011), Manaus,2011.

Bibliography
(2014). IEEE Guide for Wireless Access in Vehicular Environments (WAVE) - Archi-tecture. IEEE Std 1609.0-2013, pages 1–78.
Agência Nacional de Transportes Terrestres (2014). Automated Monitoring of the Op-eration of Interstate and International Land Passengers Transport Services - MONI-TRIIP (In Portuguese: ‘Monitoramento Automatizado da Operação dos Serviços deTransporte Rodoviário Interestadual e Internacional de Passageiros - MONITRIIP’.http://www.antt.gov.br.
Almalag, M. S. and Weigle, M. C. (2010). Using traffic flow for cluster formation invehicular ad-hoc networks. In Local Computer Networks (LCN), 2010 IEEE 35thConference on, pages 631–636. ISSN 0742-1303.
Bai, F., Elbatt, T., Hollan, G., Krishnan, H., and Sadekar, V. (2006). Towards charac-terizing and classifying communication-based automotive applications from a wirelessnetworking perspective. In Proceedings of IEEE Workshop on Automotive Network-ing and Applications (AutoNet).
Bai, F. and Krishnan, H. (2006). Reliability Analysis of DSRCWireless Communicationfor Vehicle Safety Applications. In 2006 IEEE Intelligent Transportation SystemsConference, pages 355–362. ISSN 2153-0009.
Barba, C., Mateos, M., Soto, P., Mezher, A., and Igartua, M. (2012). Smart city forVANETs using warning messages, traffic statistics and intelligent traffic lights. InIntelligent Vehicles Symposium (IV), 2012 IEEE, pages 902–907. ISSN 1931-0587.
Birrane, E. and Cole, R. G. (2010). Management of Disruption-Tolerant Networks: ASystems Engineering Approach. In SpaceOps Conference.
Birrane, E. and Ramachandran, V. (2014). Delay Tolerant Network Management Pro-tocol. draft-irtf-dtnrg-dtnmp-01.
101
102 Bibliography
Biswas, S., Tatchikou, R., and Dion, F. (2006). Vehicle-to-vehicle wireless communica-tion protocols for enhancing highway traffic safety. IEEE Communications Magazine,44(1):74–82. ISSN 0163-6804.
Burleigh, S. (2007). Interplanetary Overlay Network: An Implementation of the DTNBundle Protocol. In Consumer Communications and Networking Conference, 2007.CCNC 2007. 4th IEEE, pages 222–226.
Calarco, G. and Casoni, M. (2011). Virtual Networks and Software Router approach forWireless Emergency Networks Design. In Proc. of IEEE 73rd Vehicular TechnologyConference 2011.
Case, J. D., Fedor, M. L., and Schoffstal, J. D. (1990). Simple Network ManagementProcotol (SNMP). RFC 1157.
Cerf, V., Burleigh, S., Hooke, A., Torgerson, L., Durst, R., Scott, K., Fall, K., andWeiss, H. (2007). Delay-Tolerant Networking Architecture. RFC 4838 (Informa-tional).
Cerroni, W., Moro, G., Pasolini, R., and Ramilli, M. (2015). Decentralized detection ofnetwork attacks through P2P data clustering of SNMP data. Computers & Security,52:1--16. ISSN 01674048.
Chaintreau, A., Hui, P., Crowcroft, J., Diot, C., Gass, R., and Scott, J. (2007). Impactof Human Mobility on Opportunistic Forwarding Algorithms. IEEE Transactionson Mobile Computing, 6(6):606--620. ISSN 1536-1233.
Clemm, A. (2006). Network Management Fundamentals. Cisco Press. ISBN1587201372.
Conti, M. and Giordano, S. (2014). Mobile ad hoc networking: milestones, challenges,and new research directions. IEEE Communications Magazine, 52(1):85–96. ISSN0163-6804.
Crowcroft, J., Yoneki, E., Hui, P., and Henderson, T. (2008). Promoting Tolerance forDelay Tolerant Network Research. SIGCOMM Comput. Commun. Rev., 38(5):63--68. ISSN 0146-4833.
Daeinabi, A., Rahbar, A. G. P., and Khademzadeh, A. (2011). VWCA: An efficientclustering algorithm in vehicular ad hoc networks. Journal of Network and ComputerApplications, 34(1):207--222. ISSN 1084-8045.
Bibliography 103
Dias, J. A. F. F., Rodrigues, J. J. P. C., de Paz, J. F., and Corchado, J. M. (2016).MoM - a real time monitoring and management tool to improve the performanceof Vehicular Delay Tolerant Networks. In 2016 Eighth International Conference onUbiquitous and Future Networks (ICUFN), pages 1071–1076.
Ding, J. (2009). Advances in network management. CRC press.
Doering, M., Pögel, T., Pöttner, W.-B., and Wolf, L. (2010). A New Mobility Tracefor Realistic Large-scale Simulation of Bus-based DTNs. In Proceedings of the 5thACM Workshop on Challenged Networks, CHANTS ’10, pages 71--74, New York,NY, USA. ACM.
Eichler, S. (2007). Performance Evaluation of the IEEE 802.11pWAVE CommunicationStandard. In Vehicular Technology Conference, 2007. VTC-2007 Fall. 2007 IEEE66th, pages 2199–2203. ISSN 1090-3038.
Fall, K. (2003). A Delay-tolerant Network Architecture for Challenged Internets. InProceedings of the 2003 Conference on Applications, Technologies, Architectures, andProtocols for Computer Communications, SIGCOMM ’03, pages 27--34, New York,NY, USA. ACM.
FALL, K. and FARREL, S. (2008). DTN: An Architectural Retrospective. IEEEJournal on Selected Areas in Communications, 26(5):828–836.
Fathian, M. and Jafarian-Moghaddam, A. R. (2015). New clustering algorithms forvehicular ad-hoc network in a highway communication environment. Wireless Net-works, 21(8):2765--2780. ISSN 1572-8196.
Ferreira, A. (2002). On models and algorithms for dynamic communication networks:The case for evolving graphs. In Proceedings of 4e rencontres francophones sur lesAspects Algorithmiques des Télécommunications (ALGOTEL’2002), pages 155–161.
Ferreira, B. F., Rodrigues, J. J., Dias, J. a. a., and Isento, J. a. N. (2014). Man4VDTN- A network management solution for vehicular delay-tolerant networks. ComputerCommunications, 39:3--10. ISSN 01403664.
George, S. M., Zhou, W., Chenji, H., Won, M., Lee, Y. O., Pazarloglou, A., Stoleru,R., and Barooah, P. (2010). DistressNet: a wireless ad hoc and sensor networkarchitecture for situation management in disaster response. IEEE CommunicationsMagazine, 48(3):128--136.
104 Bibliography
Goldszmidt, G. (1993). Distributed system management via elastic servers. In SystemsManagement, 1993., Proceedings of the IEEE First International Workshop on, pages31–35.
Goonewardene, R. T., Ali, F. H., and Stipidis, E. (2009). Robust mobility adaptiveclustering scheme with support for geographic routing for vehicular ad hoc networks.IET Intelligent Transport Systems, 3(2):148–158. ISSN 1751-956X.
Grasic, S. and Lindgren, A. (2014). Revisiting a remote village scenario and its DTNrouting objective. Computer Communications, 48:133--140.
Hartenstein, H. and Laberteaux, K. (2008). A tutorial survey on vehicular ad hocnetworks. Communications Magazine, IEEE, 46(6):164–171. ISSN 0163-6804.
Hassanabadi, B., Shea, C., Zhang, L., and Valaee, S. (2014). Clustering in VehicularAd Hoc Networks using Affinity Propagation. Ad Hoc Networks, 13, Part B:535--548.ISSN 1570-8705.
Horowitz, R. and Varaiya, P. (2000). Control design of an automated highway system.Proceedings of the IEEE, 88(7):913–925. ISSN 0018-9219.
Hui, P., Chaintreau, A., Scott, J., Gass, R., Crowcroft, J., and Diot, C. (2005). PocketSwitched Networks and Human Mobility in Conference Environments. In Proceedingsof the 2005 ACM SIGCOMM Workshop on Delay-tolerant Networking, WDTN ’05,pages 244--251, New York, NY, USA. ACM.
Hunter, J. S. (1986). The Exponentially Weighted Moving Average. Journal of QualityTechnology, 18(4):203–210.
Hussain, S. A. and Gurkan, D. (2011). Management and Plug and Play of SensorNetworks Using SNMP. IEEE Transactions on Instrumentation and Measurement,60(5):1830–1837. ISSN 0018-9456.
Ivansic, W. (2009). DTN Network Management Requirements. Internet Draft (Infor-mational).
Kahani, M. and Beadle, H. W. P. (1997). Decentralised Approaches for Network Man-agement. SIGCOMM Comput. Commun. Rev., 27(3):36--47. ISSN 0146-4833.
Karagiannis, G., Altintas, O., Ekici, E., Heijenk, G. J., Jarupan, B., Lin, K., andWeil, T. (2011). Vehicular Networking: A Survey and Tutorial on Requirements,Architectures, Challenges, Standards and Solutions. IEEE Communications Surveys& Tutorials, 13(4):584--616.
Bibliography 105
Kargl, F., Papadimitratos, P., Buttyan, L., Müter, M., Schoch, E., Wiedersheim, B.,Thong, T. V., Calandriello, G., Held, A., Kung, A., and Hubaux, J. P. (2008). Se-cure vehicular communication systems: implementation, performance, and researchchallenges. IEEE Communications Magazine, 46(11):110–118. ISSN 0163-6804.
Kato, S., Hiltunen, M., Joshi, K., and Schlichting, R. (2013). Enabling vehicular safetyapplications over LTE networks. In 2013 International Conference on ConnectedVehicles and Expo (ICCVE), pages 747–752. ISSN 2378-1289.
Kayis, O. and Acarman, T. (2007). Clustering Formation for Inter-Vehicle Communi-cation. In Intelligent Transportation Systems Conference, 2007. ITSC 2007. IEEE,pages 636–641.
Keränen, A., Ott, J., and Kärkkäinen, T. (2009). The ONE Simulator for DTN ProtocolEvaluation. In 2nd International Conference on Simulation Tools and Techniques.
Kuklinski, S. and Wolny, G. (2009). Density based clustering algorithm for VANETs. InTestbeds and Research Infrastructures for the Development of Networks Communitiesand Workshops, 2009. TridentCom 2009. 5th International Conference on, pages 1–6.
Lindgren, A., Doria, A., and Schelén, O. (2003). Probabilistic Routing in IntermittentlyConnected Networks. SIGMOBILE Mob. Comput. Commun. Rev., 7(3):19--20. ISSN1559-1662.
Liu, K., Ng, J. K. Y., Lee, V. C. S., Son, S. H., and Stojmenovic, I. (2016). CooperativeData Scheduling in Hybrid Vehicular Ad Hoc Networks: VANET as a SoftwareDefined Network. IEEE/ACM Transactions on Networking, 24(3):1759–1773. ISSN1063-6692.
Maglaras, L. A. and Katsaros, D. (2012). Distributed clustering in vehicular networks.In Wireless and Mobile Computing, Networking and Communications (WiMob),2012 IEEE 8th International Conference on, pages 593–599. ISSN 2160-4886.
Martin-Flatin, J.-P., Znaty, S., and Habaux, J.-P. (1999). A Survey of DistributedEntreprise Network and Systems Management Paradigms. Journal of Network andSystems Management, 7(1):9--26. ISSN 1064-7570.
Maslekar, N., Boussedjra, M., Mouzna, J., and Labiod, H. (2011). A stable clusteringalgorithm for efficiency applications in VANETs. In Wireless Communications andMobile Computing Conference (IWCMC), 2011 7th International, pages 1188–1193.
106 Bibliography
McCloghrie, K. and Rose, M. (1988). Management Information Base for NetworkManagement of TCP/IP-based internets. RFC 1066 (Informational).
Mohinisudhan, G., Bhosale, S. K., and Chaudhari, B. S. (2006). Reliable On-boardand Remote Vehicular Network Management for Hybrid Automobiles. In Electricand Hybrid Vehicles, 2006. ICEHV ’06. IEEE Conference on, pages 1–4.
Morales, M. M. C., Hong, C. S., and Bang, Y. C. (2011). An Adaptable Mobility-AwareClustering Algorithm in vehicular networks. In Network Operations and ManagementSymposium (APNOMS), 2011 13th Asia-Pacific, pages 1–6.
National Highway Traffic Safety Administration (2014). Federal Motor Vehicle SafetyStandards: Vehicle-to-Vehicle (V2V) Communications. http://www.nhtsa.gov/
staticfiles/rulemaking/pdf/V2V/V2V-ANPRM_081514.pdf.
Nelson, S. C. and Kravets, R. (2010). Achieving Anycast in DTNs by EnhancingExisting Unicast Protocols. In Proceedings of the 5th ACM Workshop on ChallengedNetworks, CHANTS ’10, pages 63--70, New York, NY, USA. ACM.
Nobre, J., Duarte, P., Granville, L., Tarouco, L., and Bertinatto, F. (2014). On usingP2P technology to enable opportunistic management in DTNs through statisticalestimation. In IEEE International Conference on Communications (ICC), pages3124–3129.
Papadimitratos, P., Fortelle, A. D. L., Evenssen, K., Brignolo, R., and Cosenza, S.(2009). Vehicular communication systems: Enabling technologies, applications,and future outlook on intelligent transportation. IEEE Communications Magazine,47(11):84–95. ISSN 0163-6804.
Papalambrou, A., Voyiatzis, A., Serpanos, D., and Soufrilas, P. (2011). Monitoring ofa DTN2 network. In Baltic Congress on Future Internet Communications (BCFICRiga), pages 116–119.
Peoples, C., Parr, G., Scotney, B., and Moore, A. (2010). Context-aware policy-basedframework for self-management in delay-tolerant networks: A case study for deepspace exploration. IEEE Communications Magazine, 48(7):102--109. ISSN 0163-6804.
Pereira, P. R., Casaca, A., Rodrigues, J. J. P. C., Soares, V. N. G. J., Triay, J.,and Cervello-Pastor, C. (2012). From Delay-Tolerant Networks to Vehicular Delay-Tolerant Networks. IEEE Communications Surveys & Tutorials, 14(4):1166–1182.ISSN 1553-877X.
Bibliography 107
Pierce-Mayer, J. and Peinado, O. (2016). DTN Network Management. In SpaceOpsConference.
Rawashdeh, Z. Y. and Mahmud, S. M. (2012). A novel algorithm to form stableclusters in vehicular ad hoc networks on highways. EURASIP Journal on WirelessCommunications and Networking, 2012(1):1--13. ISSN 1687-1499.
Roberts, S. W. (1959). Control chart tests based on geometric moving averages. Tech-nometrics, 1:239--251.
Sachin, K., Mishra, A., and Cole, R. G. (2010). Configuration Management for DTNs.In IEEE Globecom Workshops, pages 589–594.
Schoenwaelder, J., Quittek, J., and Kappler, C. (2000). Building Distributed Manage-ment Applications with the IETF ScriptMIB. IEEE Journal on Selected Areas inCommunications, 18(5):702--714. ISSN 0733-8716.
Scott, K. and Burleigh, S. (2007). Bundle Protocol Specification. RFC 5050. [S.l.]:Internet Engineering Task Force, Network Working Group.
Silva, C. M. and Meira, W. (2015). Managing infrastructure-based vehicular networks.In 2015 16th IEEE International Conference on Mobile Data Management, volume 2,pages 19--22. IEEE.
Soares, V., Rodrigues, J., Dias, J., and Isento, J. (2012). Performance analysis of rout-ing protocols for vehicular delay-tolerant networks. In Software, Telecommunicationsand Computer Networks (SoftCOM), 2012 20th International Conference on, pages1–5.
Souza, E., Nikolaidis, I., and Gburzynski, P. (2010). "a new aggregate local mobil-ity (alm) clustering algorithm for vanets". In Communications (ICC), 2010 IEEEInternational Conference on, pages 1–5. ISSN 1550-3607.
Spyropoulos, T., Psounis, K., and Raghavendra, C. S. (2005). Spray and Wait: AnEfficient Routing Scheme for Intermittently Connected Mobile Networks. In Proceed-ings of the 2005 ACM SIGCOMM Workshop on Delay-tolerant Networking, WDTN’05, pages 252--259, New York, NY, USA. ACM.
Stallings, W. (1998). SNMP,SNMPV2,Snmpv3,and RMON 1 and 2. Addison-WesleyLongman Publishing Co., Inc., Boston, MA, USA, 3rd edition. ISBN 0201485346.
108 Bibliography
Strassner, J. (2003). Policy-based network management: solutions for the next genera-tion. Morgan Kaufmann.
Su, H. and Zhang, X. (2007). Clustering-Based Multichannel MAC Protocols for QoSProvisionings Over Vehicular Ad Hoc Networks. IEEE Transactions on VehicularTechnology, 56(6):3309–3323. ISSN 0018-9545.
Torgerson, J. L. (2014). Network Monitor and Control of Disruption-Tolerant Networks.In SpaceOps Conference.
Uzcategui, R. A., Sucre, A. J. D., and Acosta-Marum, G. (2009). Wave: A tutorial.IEEE Communications Magazine, 47(5):126–133. ISSN 0163-6804.
Vahdat, A., Becker, D., et al. (2000). Epidemic routing for partially connected ad hocnetworks.
Vodopivec, S., Bester, J., and Kos, A. (2012). A survey on clustering algorithms forvehicular ad-hoc networks. In Telecommunications and Signal Processing (TSP),2012 35th International Conference on, pages 52–56.
Wahab, O. A., Otrok, H., and Mourad, A. (2013). VANET QoS-OLSR: QoS-basedclustering protocol for Vehicular Ad hoc Networks. Computer Communications,36(13):1422 – 1435. ISSN 0140-3664.
Wang, F., Xu, Y., Zhang, H., Zhang, Y., and Zhu, L. (2015). 2FLIP: A Two-FactorLightweight Privacy Preserving Authentication Scheme for VANET. Vehicular Tech-nology, IEEE Transactions on, PP(99). ISSN 0018-9545.
Wang, S.-S. and Lin, Y.-S. (2010). Performance evaluation of passive clustering basedtechniques for inter-vehicle communications. In Wireless and Optical Communica-tions Conference (WOCC), 2010 19th Annual, pages 1–5.
Wolny, G. (2008). Modified DMAC Clustering Algorithm for VANETs. In Systemsand Networks Communications, 2008. ICSNC ’08. 3rd International Conference on,pages 268–273.
Xia, F., Liu, L., Li, J., Ahmed, A., Yang, L., and Ma, J. (2015). BEEINFO: Interest-Based Forwarding Using Artificial Bee Colony for Socially Aware Networking. Ve-hicular Technology, IEEE Transactions on, 64(3):1188–1200. ISSN 0018-9545.
Xuan, B. B., Ferreira, A., and Jarry, A. (2003). Evolving graphs and least cost journeysin dynamic networks. In WiOpt’03: Modeling and Optimization in Mobile, Ad Hocand Wireless Networks, pages 10--pages.
Bibliography 109
Zeadally, S., Hunt, R., Chen, Y.-S., Irwin, A., and Hassan, A. (2012). Vehicular ad hocnetworks (VANETS): status, results, and challenges. Telecommunication Systems,50(4):217--241. ISSN 1572-9451.
Zhang, M. and Wolff, R. (2010). A Border Node Based Routing Protocol for PartiallyConnected Vehicular Ad Hoc Networks. Journal of Communications, 5(2).
Zhang, Z., Boukerche, A., and Pazzi, R. (2011). A Novel Multi-hop Clustering Schemefor Vehicular Ad-hoc Networks. In Proceedings of the 9th ACM International Sym-posium on Mobility Management and Wireless Access, MobiWac ’11, pages 19--26,New York, NY, USA. ACM.