Embed Size (px)
Citation preview
Giant room-temperature barocaloric effects in PDMS rubber at low pressures
A. M. G. Carvalho1,*, W. Imamura1,2, E. O. Usuda1, N. M. Bom1
1Laboratório Nacional de Luz Síncrotron (LNLS), Centro Nacional de Pesquisa em Energia e
Materiais (CNPEM), CEP 13083-970, Campinas, São Paulo, Brazil.
2Faculdade de Engenharia Mecânica, UNICAMP, CEP 13083-860, Campinas, SP, Brazil.
ABSTRACT
The barocaloric effect is still an incipient scientific topic, but it has been attracting an
increasing attention in the last years due to the promising perspectives for its application in
alternative cooling devices. Here, we present giant values of barocaloric entropy change and
temperature change induced by low pressures in PDMS elastomer around room temperature.
Adiabatic temperature changes of 12.0 K and 28.5 K were directly measured for pressure changes
of 173 MPa and 390 MPa, respectively, associated with large normalized temperature changes
(~70 K GPa-1). From adiabatic temperature change data, we obtained entropy change values larger
than 140 J kg-1 K-1. We found barocaloric effect values that exceed those previously reported for
any promising barocaloric materials from direct measurements of temperature change around room
temperature. Our results stimulate the study of the barocaloric effect in elastomeric polymers and
broaden the pathway to use this effect in solid-state cooling technologies.
2
Introduction
In the beginning of the nineteenth century, John Gough detected and described the heating
of natural rubber when rapidly stretched [1]. This effect was further studied by Joule, reporting
temperature changes induced by uniaxial stress in different materials, including rubbers, metals,
and woods [2]. In fact, both scientists described what we designate elastocaloric effect (σe-CE),
the first i-caloric effect ever reported. i-caloric effects (“i” stands for intensive thermodynamics
variables) can be characterized by the adiabatic temperature change (ΔTS) and the isothermal
entropy change (ΔST) induced by an external field applied on a material.
Besides the magnetocaloric effect (h-CE) and the electrocaloric effect (e-CE), Lord Kelvin
[3] also predicted the barocaloric effect (σb-CE), which should be driven by isotropic stress
variations. As well as h-CE and e-CE, the σb-CE may be used in solid-state cooling devices through
a cooling cycle, as illustrated in Fig. 1. Both σb-CE and σe-CE are facets of the mechanocaloric
effect (σ-CE). The research into i-caloric effects has blossomed in the last decades, as a
consequence of the experimental demonstration of the giant h-CE [4] and the giant e-CE [5],
leading to significant advances in materials and prototypes. Despite the interesting results obtained
by stretching natural rubber (NR) and other polymers in the 1940 decade [6,7] or pressing glassy
polymers, such as poly (methyl methacrylate) [8], the σ-CE is the least studied i-caloric effect,
contrasting the large number of papers on h-CE and e-CE. Nevertheless, recently, there was a
resurgence of σ-CE due the practicality of applying mechanical stress in comparison to magnetic
or electrical fields.
Giant values of σe-CE and σb-CE around room temperature were reported in shape-memory
alloys (SMAs) based on Cu-Zn-Al (ΔST = -22 J kg-1 K-1 at 295 K, for Δσ = 143 MPa) [9] and Ni-
Mn-In (ΔST = -24.4 J kg-1 K-1 and ΔTS = 4.5 K at 293 K, for Δσ = 260 MPa) [10], respectively.
Other examples of giant σ-CE around room temperature are observed in Ni46Mn38Sb12Co4,
Fe49Rh51 and BaTiO3 [11–13]. Below room temperature, (NH4)2SO4 presents promising
barocaloric properties (ΔST = -60 J kg-1 K-1 for Δσ = 100 MPa) [14]. Regarding organic-inorganic
materials, large σb-CE values were obtained for several families of hybrid perovskites [15]. The
promising mechanocaloric potential of ferroics stimulated the recent development of a
regenerative elastocaloric heat pump made of a Ni-Ti alloy [16].
Alternatively to ferroics, elastomeric polymers have also attracted some attention regarding
the σ-CE [17–23]. Elastomers have shown to be particularly suitable for mechanocaloric
3
applications, since they present good fatigue properties combined with high caloric potential [24].
Moreover, all elastomers can act as mechanocaloric materials due to the contribution of polymer
chains rearrangement to the σ-CE, not depending on phase transitions (differently from ferroics).
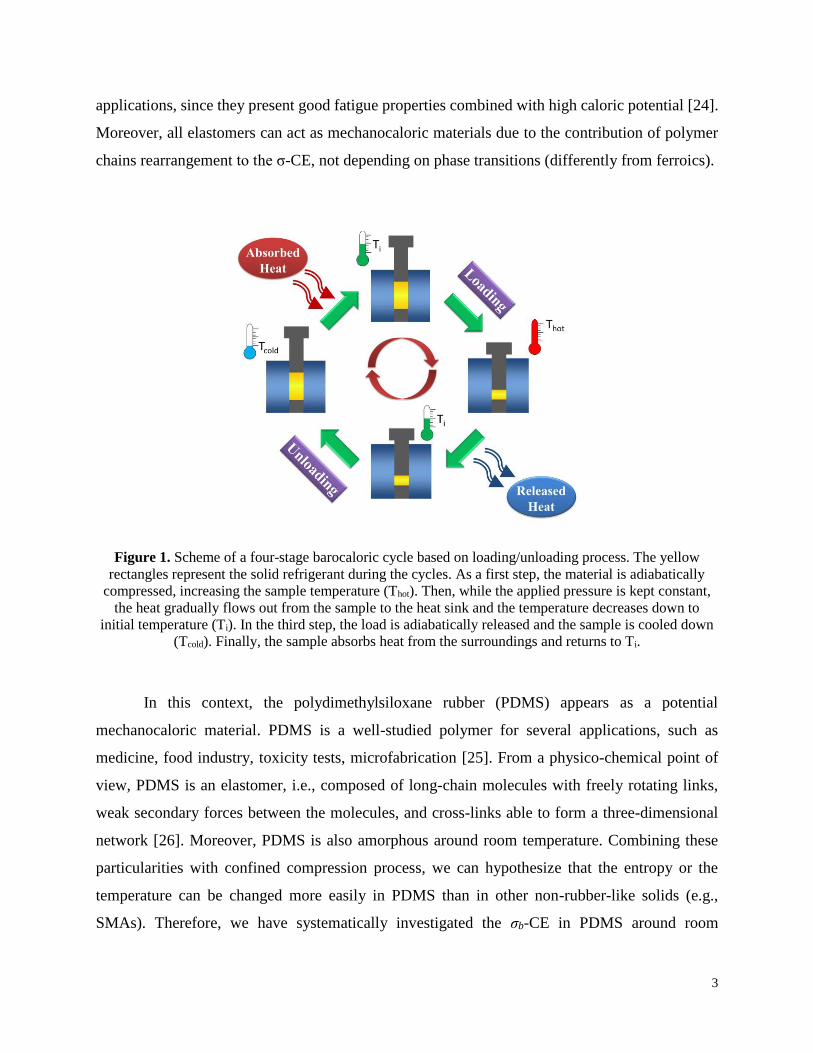
Figure 1. Scheme of a four-stage barocaloric cycle based on loading/unloading process. The yellow
rectangles represent the solid refrigerant during the cycles. As a first step, the material is adiabatically
compressed, increasing the sample temperature (Thot). Then, while the applied pressure is kept constant,
the heat gradually flows out from the sample to the heat sink and the temperature decreases down to
initial temperature (Ti). In the third step, the load is adiabatically released and the sample is cooled down
(Tcold). Finally, the sample absorbs heat from the surroundings and returns to Ti.
In this context, the polydimethylsiloxane rubber (PDMS) appears as a potential
mechanocaloric material. PDMS is a well-studied polymer for several applications, such as
medicine, food industry, toxicity tests, microfabrication [25]. From a physico-chemical point of
view, PDMS is an elastomer, i.e., composed of long-chain molecules with freely rotating links,
weak secondary forces between the molecules, and cross-links able to form a three-dimensional
network [26]. Moreover, PDMS is also amorphous around room temperature. Combining these
particularities with confined compression process, we can hypothesize that the entropy or the
temperature can be changed more easily in PDMS than in other non-rubber-like solids (e.g.,
SMAs). Therefore, we have systematically investigated the σb-CE in PDMS around room
4
temperature at relatively low pressures. Our experiments reveal that PDMS exhibits giant
temperature and entropy variations, presenting a great potential as a refrigerant in barocaloric
solid-state cooling devices.
Experimental
The PDMS samples were prepared from the commercial components supplied by Dow
Corning®. A pre-polymer base and a curing agent (Sylgard 184) were mixed together at the
recommended mass proportion of 10:1. To avoid air bubbles, the mixture was put in low vacuum
for about 45 minutes. We used two metallic cylinders with two diameters (8 and 12 mm) as a mold
for the samples. The mixture was poured into the mold over a glass plate until it was completely
filled and then placed on a hot plate (368 K) for 50 minutes. We made two samples with the
following dimensions: 12 mm (diameter) and 17 mm (length); 8 mm (diameter) and 20 mm
(length). The densities of the samples are 1026(3) and 1030(7) kg m-3, respectively. In the
experiments performed in pressures up to 173 MPa, we used the same PDMS sample with 12 mm
of diameter. For experiments above 173 MPa, the same 8-mm-diameter sample was used. We
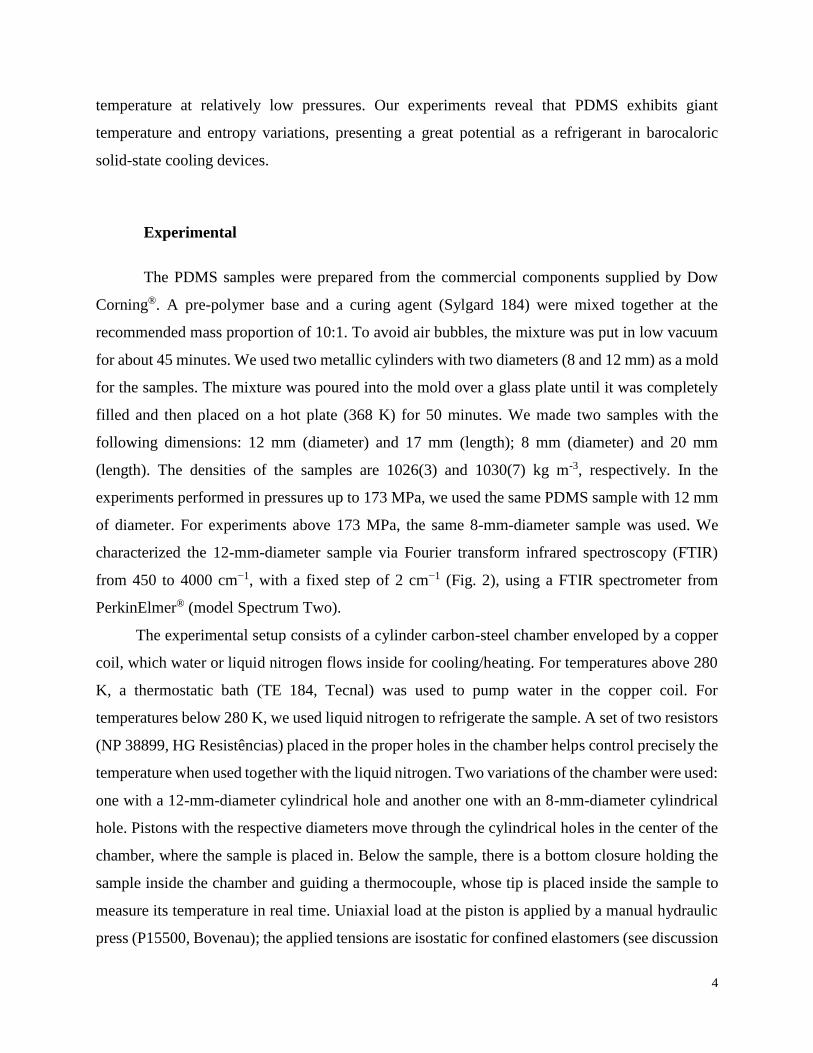
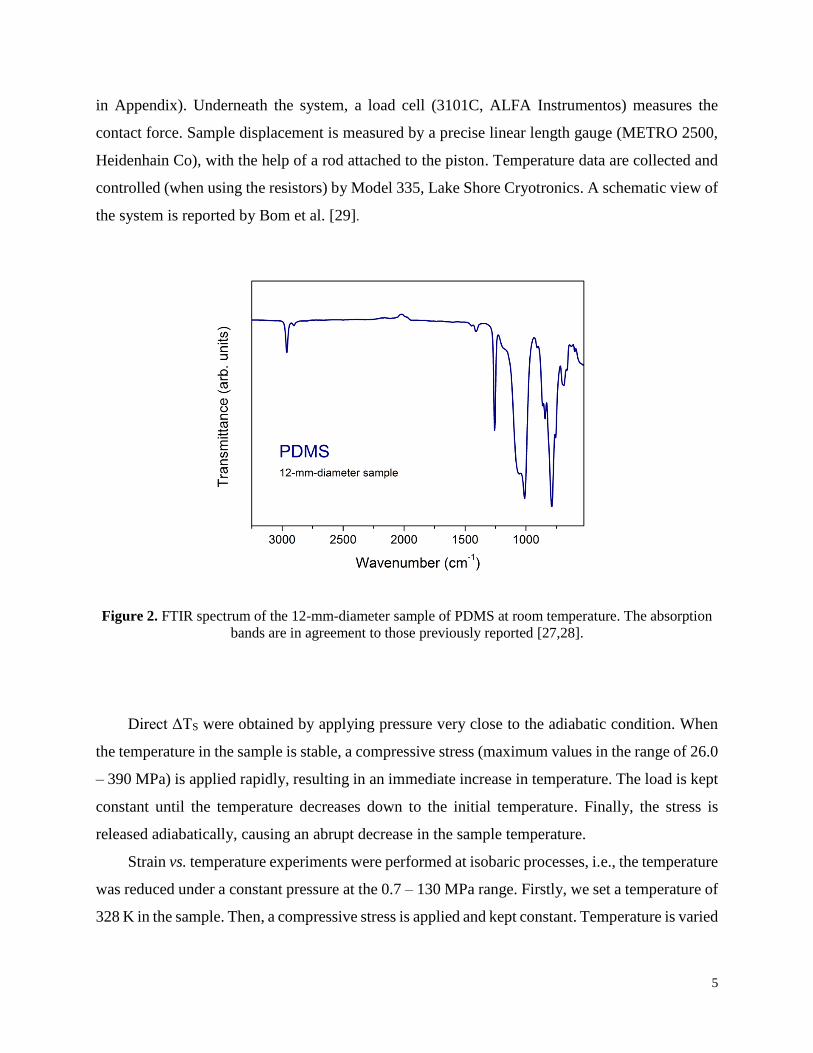
characterized the 12-mm-diameter sample via Fourier transform infrared spectroscopy (FTIR)
from 450 to 4000 cm−1, with a fixed step of 2 cm−1 (Fig. 2), using a FTIR spectrometer from
PerkinElmer® (model Spectrum Two).
The experimental setup consists of a cylinder carbon-steel chamber enveloped by a copper
coil, which water or liquid nitrogen flows inside for cooling/heating. For temperatures above 280
K, a thermostatic bath (TE 184, Tecnal) was used to pump water in the copper coil. For
temperatures below 280 K, we used liquid nitrogen to refrigerate the sample. A set of two resistors
(NP 38899, HG Resistências) placed in the proper holes in the chamber helps control precisely the
temperature when used together with the liquid nitrogen. Two variations of the chamber were used:
one with a 12-mm-diameter cylindrical hole and another one with an 8-mm-diameter cylindrical
hole. Pistons with the respective diameters move through the cylindrical holes in the center of the
chamber, where the sample is placed in. Below the sample, there is a bottom closure holding the
sample inside the chamber and guiding a thermocouple, whose tip is placed inside the sample to
measure its temperature in real time. Uniaxial load at the piston is applied by a manual hydraulic
press (P15500, Bovenau); the applied tensions are isostatic for confined elastomers (see discussion
5
in Appendix). Underneath the system, a load cell (3101C, ALFA Instrumentos) measures the
contact force. Sample displacement is measured by a precise linear length gauge (METRO 2500,
Heidenhain Co), with the help of a rod attached to the piston. Temperature data are collected and
controlled (when using the resistors) by Model 335, Lake Shore Cryotronics. A schematic view of
the system is reported by Bom et al. [29].
Figure 2. FTIR spectrum of the 12-mm-diameter sample of PDMS at room temperature. The absorption
bands are in agreement to those previously reported [27,28].
Direct ΔTS were obtained by applying pressure very close to the adiabatic condition. When
the temperature in the sample is stable, a compressive stress (maximum values in the range of 26.0
– 390 MPa) is applied rapidly, resulting in an immediate increase in temperature. The load is kept
constant until the temperature decreases down to the initial temperature. Finally, the stress is
released adiabatically, causing an abrupt decrease in the sample temperature.
Strain vs. temperature experiments were performed at isobaric processes, i.e., the temperature
was reduced under a constant pressure at the 0.7 – 130 MPa range. Firstly, we set a temperature of
328 K in the sample. Then, a compressive stress is applied and kept constant. Temperature is varied
6
continuously between ~328 – 283 K, performing the following cycle: 328 K → 283 K → 328 K
→ 283 K.
Results and discussion
Adiabatic temperature change and isothermal entropy change
Firstly, we measured ΔTS for different pressure variations (Fig. 3a). We observe a thermal
giant σb-CE of 27.7 K at ~283 K, for Δσ = 390 MPa (compression), and ΔTS = -28.5 K, at the same
initial temperature, for Δσ = -390 MPa (decompression). The difference between ΔTS values in
compression and decompression processes, for the highest pressure variations, is probably due to
the fact that the decompression process is closer to the adiabatic condition than the compression
process. Taking the process 0 MPa → 390 MPa → 0 MPa as an example, the temperature
relaxation during compression has a time constant of τcomp = 19.1 s, while the time constant is
τdecomp = 24.6 s for decompression. Then, if τcomp < τdecomp and the sample specific heat does not
change significantly during the process, the heat transfer rate for compression is larger than
decompression.
Fig. 3b displays the ΔTS as function of temperature in decompression process within the
26.0(5) – 390(12) MPa pressure range. At 303 K, for example, it was obtained a ΔTS of -12.1 K
for just 173(3) MPa, higher than observed for vulcanized natural rubber (V-NR) under the same
conditions (ΔTS = -10.5 K at 303 K, for Δσ = -173(3) MPa) [23]. Furthermore, PDMS at low
temperatures (223 and 243 K) was also analyzed for Δσ of 43.4(9) and 173(3) MPa, showing high
ΔTS even below room temperature. This behavior is interesting since ΔTS does not change
significantly in a wide temperature range (i.e., ΔTS does not decrease abruptly as in magnetocaloric
compounds [30] or SMAs [31–33]). It is worth noticing that ΔTS curves present some temperature
dependence only at the highest pressures (273 and 390 MPa). This could be explained by the fact
that an 8-mm-diameter sample was used at this pressure range, different from that measured at
lower pressures (12 mm of diameter). Although the same synthesis process was employed for both
samples, slight variations in the final product may occur, which can exert some influence on caloric
parameters.

7
Figure 3. (a) Temperature vs. time for PDMS rubber at initial temperature of ~283 K; the peaks/valleys
are related to the adiabatic temperature change (ΔTS) when the pressures of 273(8) and 390(12) MPa are
applied/released. (b) ΔTS vs. initial temperature for decompression process at different pressures (26.0(5),
43.4(9), 87(2), 173(3), 273(8) and 390(12) MPa); the dotted lines connecting the symbols are guides for
the eyes. (c) ΔTS vs. released pressure for initial temperature of 263 K; the circles are experimental data,
and the line is the fit using Eq. 1; we estimate an error of 2% for pressures up to 173 MPa and 3% above
this pressure.
For several materials presenting i-caloric effects, the maximum magnitude of the ΔTS
increases as a function of the maximum applied field, following a power law of the type ΔTS(T,i)
= 𝑎𝑖𝑛. For example, the external field in the h-CE is the magnetic field (H), and n = 2 3⁄ around
the magnetic transition. In that case, ΔTS and ΔST are proportional to 𝐻𝑚𝑎𝑥
23⁄
, which is predicted
from the Mean Field Theory [34]. For e-CE, a power law was reported for a ferroelectric polymer,
for which n = 2 (i.e., ΔTS ∝ 𝐸𝑚𝑎𝑥2 ) at low electric fields (E), and n = 2 3⁄ at higher E (i.e., ΔTS ∝
𝐸𝑚𝑎𝑥
23⁄
) [35]. Following this concept, Usuda et al. [23] also proposed a power law for σb-CE:
8
|∆𝑇𝑆(𝑇, 𝜎𝑚𝑎𝑥)| = 𝑎𝜎𝑚𝑎𝑥𝑛 , (1)
where a is the constant of proportionality, and σmax is the maximum value of the released pressure.
The fitted model for PDMS at 263 K is shown in Fig. 3c. In this case, a = 62(5) K GPa-n, and n =
0.90(6). For other temperatures, a and n parameters are shown in Table A1, in appendix. As an
informative comparison, the same parameters for V-NR [23] at 283 K are a = 51(3) K GPa-n and
n = 0.94(3). Either for PDMS or V-NR, ΔTS vs. σmax could be fitted by a power law. For PDMS,
the parameters a and n slightly increase at higher temperatures.
We have indirectly determined the ΔST from strain as a function of temperature
experimental curves (Figs A1a-b, Appendix), through the following Maxwell's relation [23,34,35]:
∆𝑆𝑇(𝑇, ∆𝜎) = −1
𝜌0∫ (
𝜕𝜀
𝜕𝑇)
𝜎𝑑𝜎
𝜎2
𝜎1 , (2)
where 𝜌0 is the density of the sample at atmospheric pressure (σ0) and ambient temperature (T0 =
293 K); σ1 is the initial pressure (σ1 ≈ σ0); σ2 is the final pressure; ε is the strain, defined as
휀(𝜎, 𝑇) ≡ (𝑙𝜎,𝑇 − 𝑙0)
𝑙0⁄ , where 𝑙𝜎,𝑇 is the final length of the sample at σ, for each temperature T,
and l0 is its initial length at σ0 and T0. The curves for ΔST as function of temperature, calculated
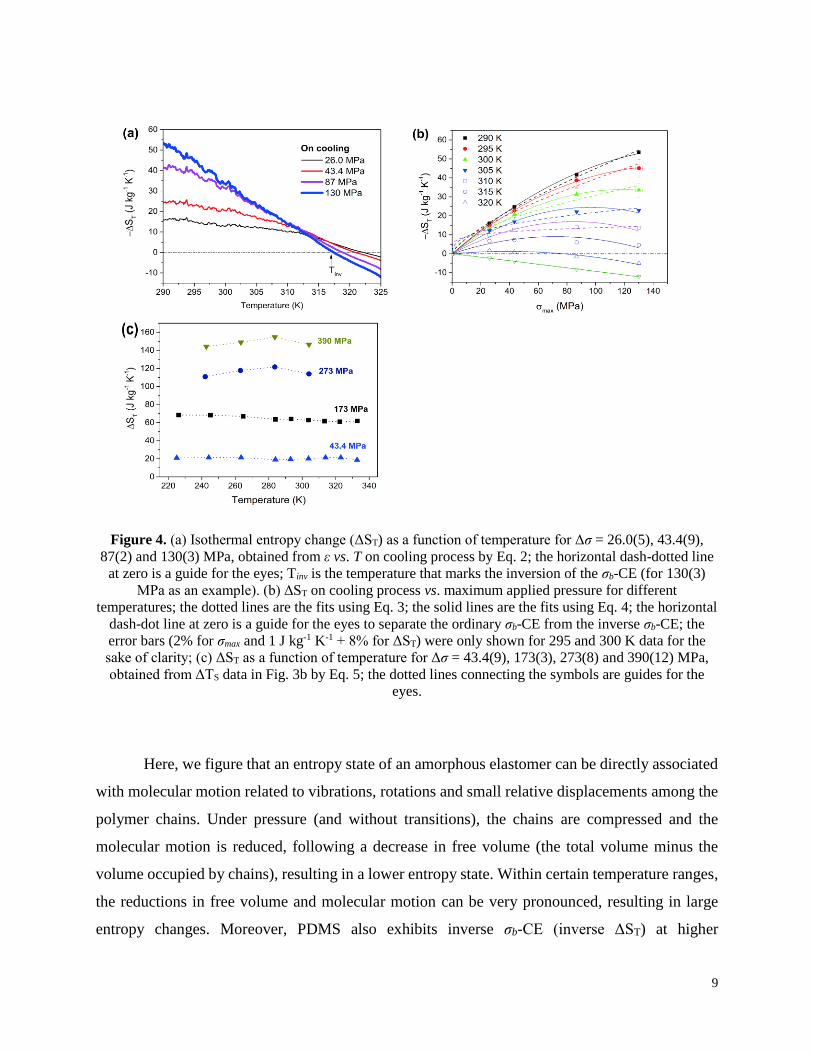
by Eq. 2, are displayed in Fig. 4a. At 290 K, we obtained a giant σb-CE of -53(5)J kg-1 K-1 for
merely Δσ = 130(3) MPa. This leads to a normalized entropy change (|∆𝑆𝑇
∆𝜎⁄ |) of 0.41(5)
kJ kg-1 K-1 GPa-1. For Δσ = 87(2) MPa, the entropy change is lower, -42(4) J kg-1 K-1, but the
normalized entropy change keeps its high value: 0.48(6) kJ kg-1 K-1 GPa-1. For the highest pressure
changes, ΔST shows a tendency of increasing at temperatures below 290 K.
9
Figure 4. (a) Isothermal entropy change (ΔST) as a function of temperature for Δσ = 26.0(5), 43.4(9),
87(2) and 130(3) MPa, obtained from ε vs. T on cooling process by Eq. 2; the horizontal dash-dotted line
at zero is a guide for the eyes; Tinv is the temperature that marks the inversion of the σb-CE (for 130(3)
MPa as an example). (b) ΔST on cooling process vs. maximum applied pressure for different
temperatures; the dotted lines are the fits using Eq. 3; the solid lines are the fits using Eq. 4; the horizontal
dash-dot line at zero is a guide for the eyes to separate the ordinary σb-CE from the inverse σb-CE; the
error bars (2% for σmax and 1 J kg-1 K-1 + 8% for ΔST) were only shown for 295 and 300 K data for the
sake of clarity; (c) ΔST as a function of temperature for Δσ = 43.4(9), 173(3), 273(8) and 390(12) MPa,
obtained from ΔTS data in Fig. 3b by Eq. 5; the dotted lines connecting the symbols are guides for the
eyes.
Here, we figure that an entropy state of an amorphous elastomer can be directly associated
with molecular motion related to vibrations, rotations and small relative displacements among the
polymer chains. Under pressure (and without transitions), the chains are compressed and the
molecular motion is reduced, following a decrease in free volume (the total volume minus the
volume occupied by chains), resulting in a lower entropy state. Within certain temperature ranges,
the reductions in free volume and molecular motion can be very pronounced, resulting in large
entropy changes. Moreover, PDMS also exhibits inverse σb-CE (inverse ΔST) at higher
10
temperatures (e.g., for Δσ = 130(3) MPa, above Tinv ≈ 317 K). The temperature Tinv, which marks
the inversion of the σb-CE in PDMS, shifts to higher values as Δσ decreases. The inverse ΔST is
due to the negative derivative observed in the higher temperature region of ε vs. temperature curves
(Fig. A1c, Appendix). The observation of an inverse σb-CE in -ΔST vs. T curves (Fig. 4a) may
seem inconsistent with the -ΔTS vs. T curves (Fig. 3b), where no anomalous behaviors are verified.
However, ΔTS and ΔST of PDMS were obtained from two different thermodynamic processes (see
Experimental section). There is some irreversibility in ε measurements, since we observe different
paths on cooling and on heating measurements (Fig. A2, Appendix). Besides, even in a cycle (ε
vs. temperature), the material does not return to its initial state. Thus, ΔST is affected by this
irreversibility, analogously to what is observed in magnetocaloric materials, which can manifest
ordinary or inverse ΔST depending on the measurement protocols [36]. Therefore, the behavior of
the directly obtained ΔTS curves and the ΔST curves from ε vs. T data may be very different.
In Fig. 4b, we show ΔST as a function of the maximum applied pressure (σmax) for different
temperatures. We fitted the ordinary σb-CE for different temperatures also using a power law as
following:
−∆𝑆𝑇(𝑇, 𝜎𝑚𝑎𝑥) = 𝑏𝜎𝑚𝑎𝑥𝑚 , (3)
where b is the constant of proportionality, and m is the power-law exponent. As examples: for 290
K, b = 0.25(2) kJ kg-1 K-1 GPa-m and m = 0.74(3); and, for 295 K, b = 0.19(3) kJ kg-1 K-1 GPa-m
and m = 0.69(7) (all fitting parameters are shown in Table A2, Appendix). It is easy to see that b
and m decrease when the temperature increases for ordinary σb-CE. Furthermore, the power law
works while (𝑑∆𝑆𝑇
𝑑𝜎𝑚𝑎𝑥)
𝑇 does not change its sign for the entire range of pressure (i.e., the power law
fails for 315 and 320 K). The behavior of the power-law parameters for ΔST (b and m) as well as
the parameters for ΔTS (a and n) need further investigation to be better understood.
We also fitted -ΔST vs. σmax for different temperatures using the following equation:
−∆𝑆𝑇(𝑇, 𝜎𝑚𝑎𝑥) = 𝑎1(𝑇)𝜎𝑚𝑎𝑥 + 𝑎2(𝑇)𝜎𝑚𝑎𝑥2 , (4)
derived from a modified Landau’s theory of elasticity (see Appendix), where a1 and a2 are
parameters to fit (Table A2, Appendix). This quadratic model fits better the experimental data than
the power-law model, and it is able to fit properly the isotherms of 315 and 320 K as well.
Another approach to calculate ΔST is through the equation below [37]:
∆𝑆𝑇(𝑇, ∆𝜎) = −𝑐𝑝(𝑇)
𝑇∆𝑇𝑆(𝑇, ∆𝜎) , (5)
11
where cp (T) is the specific heat as a function of temperature (for PDMS, see Ref. [38]). Since Eq.
5 is valid only far from transitions [37], and our PDMS does not present transitions within the
measured temperature range, the calculation of ΔST vs. T curves from direct ΔTS data is a good
approximation. In this case, it is possible to evaluate the ΔST for pressures up to Δσ = 390 MPa,
according to the experimental conditions of ΔTS collection (Fig. 3b). ΔST values obtained from
this method are displayed in Fig. 4c. One can observe that the qualitative behavior of these curves
significantly differs from those in Fig. 4a (from ε vs. T data), which exhibit a strong dependence
on temperature; these two protocols for ΔST show a similar ΔST ≈ 20 J kg-1 K-1 in the temperature
range of 290 – 300 K, for Δσ = 43.4 MPa. ΔST curves displayed in Figure 3c follow the trend
verified in ΔTS dataset (Fig. 3b). Additionally, we used Eq. 5 to estimate indirect ΔTS vs. T curves
(Fig. A3, Appendix) from ΔST (Fig. 4a) obtained from ε vs. T data; in this case, indirect and direct
ΔTS are similar between 290 and 300 K, for Δσ = 26.0, 43.4 and 87 MPa, reaching ΔTS ≈ 2, 4 and
8 K, respectively.
Performance parameters
Our obtained values of ΔTS and ΔST for PDMS are striking not only due to their magnitude,
but also because they were observed at relatively low applied pressures and strains. In tractive σe-
CE of elastomers at low stresses, ΔTS values greater than 10 K require large strain amplitudes of
400 – 700% [6,17,39]. On the other hand, giant thermal σb-CE values (> 20 K) in ferroics are
exhibited in small strain amplitudes, but often require high pressures (several hundreds of MPa)
[32]. Thus, tractive σe-CE in polymers and σb-CE in ferroics present significant drawbacks
concerning applications in cooling devices. Now, considering σb-CE in elastomers, such as PDMS
(giant ΔTS, giant ΔST, σ < 300 MPa and |ε| < 20%), this scenario seems to change.
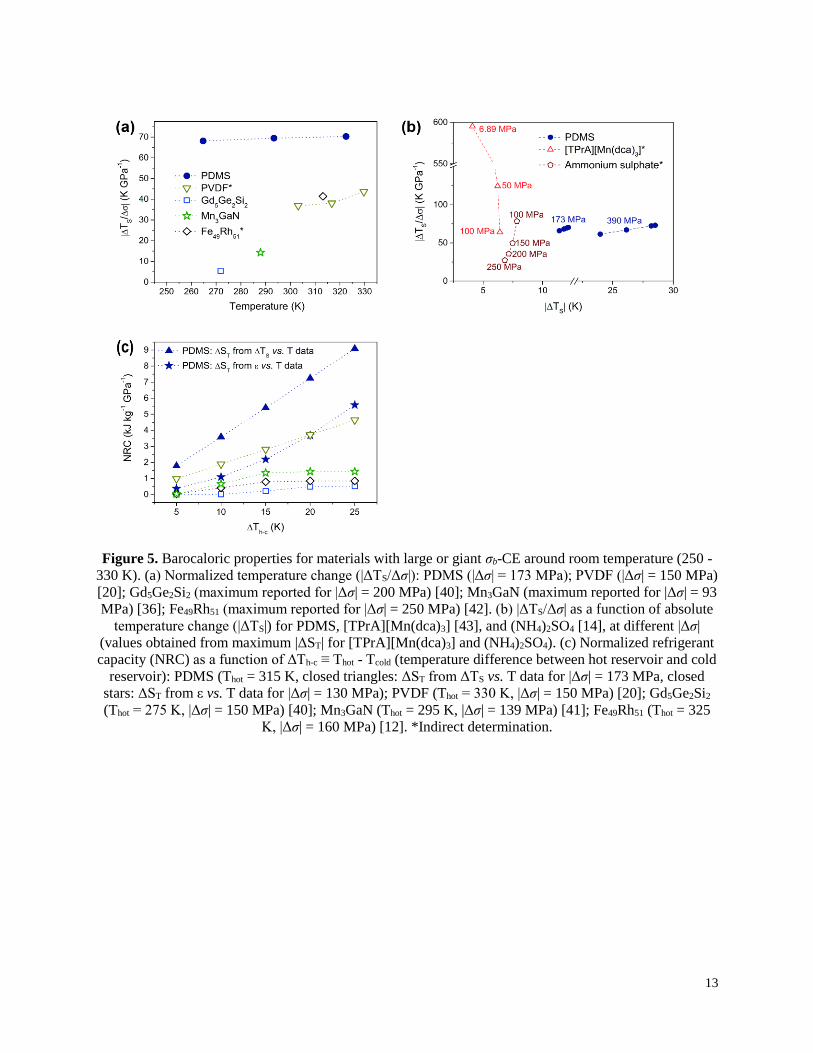
In order to compare the barocaloric properties of PDMS around room temperature with
different relevant barocaloric materials from the literature [12,14,20,40–43], we present the
normalized temperature change (|ΔTS/Δσ|) as a function of temperature (Fig. 5a) and as a function
of ΔTS (Fig. 5b). A remarkable |ΔTS/Δσ| of ~70 K GPa-1 was obtained for PDMS, which remains
practically constant within a large temperature range. Despite the fact that a few materials exceed
this value under particular conditions, PDMS presents the highest |ΔTS/Δσ| for ΔTS > 10 K.
Moreover, it is relevant to stress that our ΔTS values of PDMS were measured directly, on the
contrary of most barocaloric materials reported so far.
12
We also calculated the normalized refrigerant capacity (NRC) as a function of the
temperature difference between hot reservoir and cold reservoir (ΔTh-c ≡ Thot - Tcold). We define
the normalized refrigerant capacity for mechanocaloric effect as:
𝑁𝑅𝐶(∆𝑇ℎ−𝑐, ∆𝜎) = |1
∆𝜎∫ ∆𝑆𝑇(𝑇, ∆𝜎)𝑑𝑇
𝑇ℎ𝑜𝑡
𝑇𝑐𝑜𝑙𝑑| , (6)
For PDMS (Fig. 5c), we fixed the hot reservoir at 315 K. It is noteworthy that NRC sharply
increases as function of ΔTh-c, surpassing 5 and 9 kJ kg-1 GPa-1 for ΔST obtained from ε vs. T data
and from ΔTS vs. T, respectively. Finally, the absolute energy efficiency of a caloric material can
be evaluated by calculating the coefficient of performance (COP). This parameter can be defined
as 𝐶𝑂𝑃(𝑇, ∆𝜎) = |𝑄|/𝑊, where 𝑄 = 𝑇 ∆𝑆𝑇 and 𝑊 = 𝜌0−1 ∫ 𝜎 𝑑휀
𝜀2
𝜀1. The calculated COP values
for PDMS at 290 K, for Δσ = 130 and 87 MPa, are 4.7(7) and 8(1), respectively (using ΔST values
from Fig. 4a). Considering the maximum theoretical efficiency (i.e., Carnot efficiency) operating
at Thot = 315 K and Tcold = 290 K, the value of COPCarnot = Tcold/(Thot - Tcold) is 11.6. So, the relative
COP (η = COPPDMS/COPCarnot) is 41(6)% and 66(8)% for Δσ = 130 and 87 MPa, respectively.
13
Figure 5. Barocaloric properties for materials with large or giant σb-CE around room temperature (250 -
330 K). (a) Normalized temperature change (|ΔTS/Δσ|): PDMS (|Δσ| = 173 MPa); PVDF (|Δσ| = 150 MPa)
[20]; Gd5Ge2Si2 (maximum reported for |Δσ| = 200 MPa) [40]; Mn3GaN (maximum reported for |Δσ| = 93
MPa) [36]; Fe49Rh51 (maximum reported for |Δσ| = 250 MPa) [42]. (b) |ΔTS/Δσ| as a function of absolute
temperature change (|ΔTS|) for PDMS, [TPrA][Mn(dca)3] [43], and (NH4)2SO4 [14], at different |Δσ|
(values obtained from maximum |ΔST| for [TPrA][Mn(dca)3] and (NH4)2SO4). (c) Normalized refrigerant
capacity (NRC) as a function of ΔTh-c ≡ Thot - Tcold (temperature difference between hot reservoir and cold
reservoir): PDMS (Thot = 315 K, closed triangles: ΔST from ΔTS vs. T data for |Δσ| = 173 MPa, closed
stars: ΔST from ε vs. T data for |Δσ| = 130 MPa); PVDF (Thot = 330 K, |Δσ| = 150 MPa) [20]; Gd5Ge2Si2
(Thot = 275 K, |Δσ| = 150 MPa) [40]; Mn3GaN (Thot = 295 K, |Δσ| = 139 MPa) [41]; Fe49Rh51 (Thot = 325
K, |Δσ| = 160 MPa) [12]. *Indirect determination.
14
Conclusions
In summary, we presented outstanding results concerning the barocaloric properties of
PDMS rubber. The pressure-induced temperature changes are huge (e.g., at ~283 K, ΔTS = -28.5
K, for Δσ = -390 MPa; or ΔTS = -22.4 K, for Δσ = -273 MPa), as well as the isothermal entropy
changes (ΔST > 140 J kg-1 K-1, for 290 K and Δσ = 390 MPa). Regarding temperature changes, the
barocaloric effect values presented here surpass those for any other barocaloric material in
literature obtained from direct measurements around room temperature. Considering normalized
parameters, PDMS exhibits the normalized temperature change |ΔTS/Δσ| ≈ 70 K GPa-1 within the
temperature range of 265 – 322 K, and the normalized refrigerant capacity NRC are higher than 9
kJ kg-1 GPa-1 (ΔTh-c = 25 K). Therefore, the striking barocaloric effects of PDMS observed at low
pressures and low strains open a promising road towards solid-state cooling based on elastomeric
polymers submitted to confined compression.
Conflicts of interest
The authors declare that there are no conflicts of interest.
Acknowledgements
The authors acknowledge financial support from FAPESP (project number 2012/03480-0), CNPq,
CAPES, LNLS and CNPEM. The authors also thank Francesco G. Carotti and Maria Helena O.
Piazzetta for the support in the preparation of PDMS samples and Rafael O. Martins for technical
support.
15
Appendix
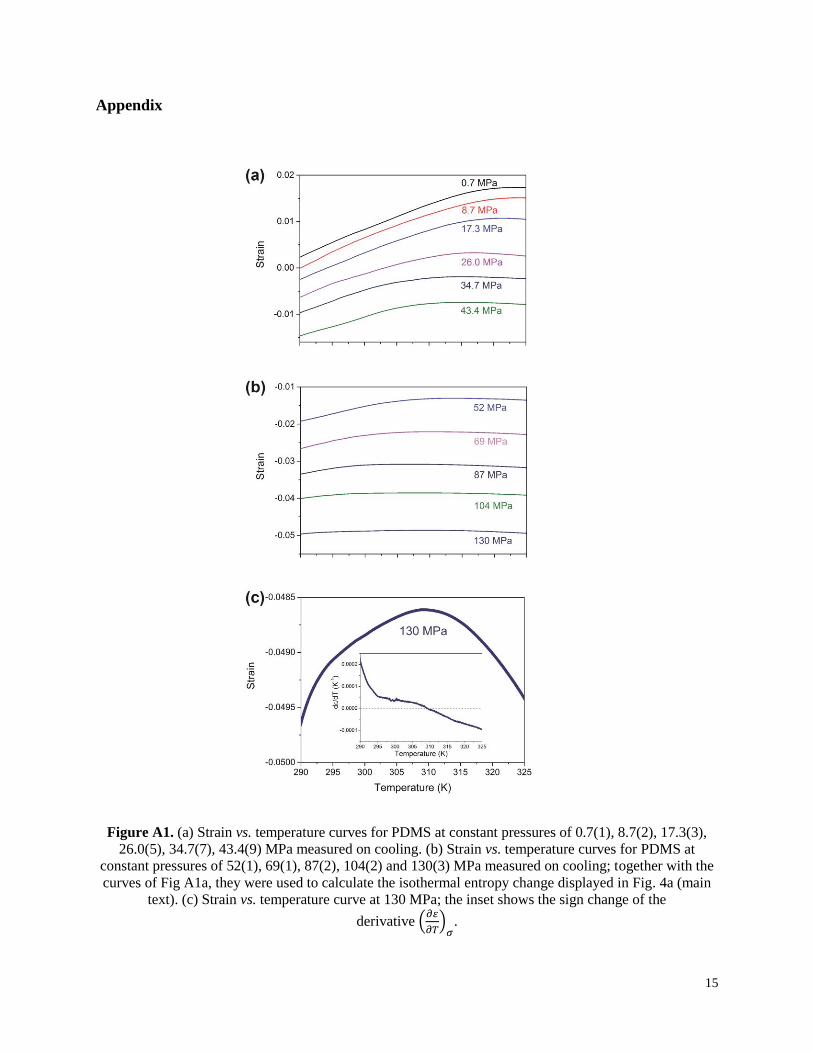
Figure A1. (a) Strain vs. temperature curves for PDMS at constant pressures of 0.7(1), 8.7(2), 17.3(3),
26.0(5), 34.7(7), 43.4(9) MPa measured on cooling. (b) Strain vs. temperature curves for PDMS at
constant pressures of 52(1), 69(1), 87(2), 104(2) and 130(3) MPa measured on cooling; together with the
curves of Fig A1a, they were used to calculate the isothermal entropy change displayed in Fig. 4a (main
text). (c) Strain vs. temperature curve at 130 MPa; the inset shows the sign change of the
derivative (𝜕𝜀
𝜕𝑇)
𝜎.
16
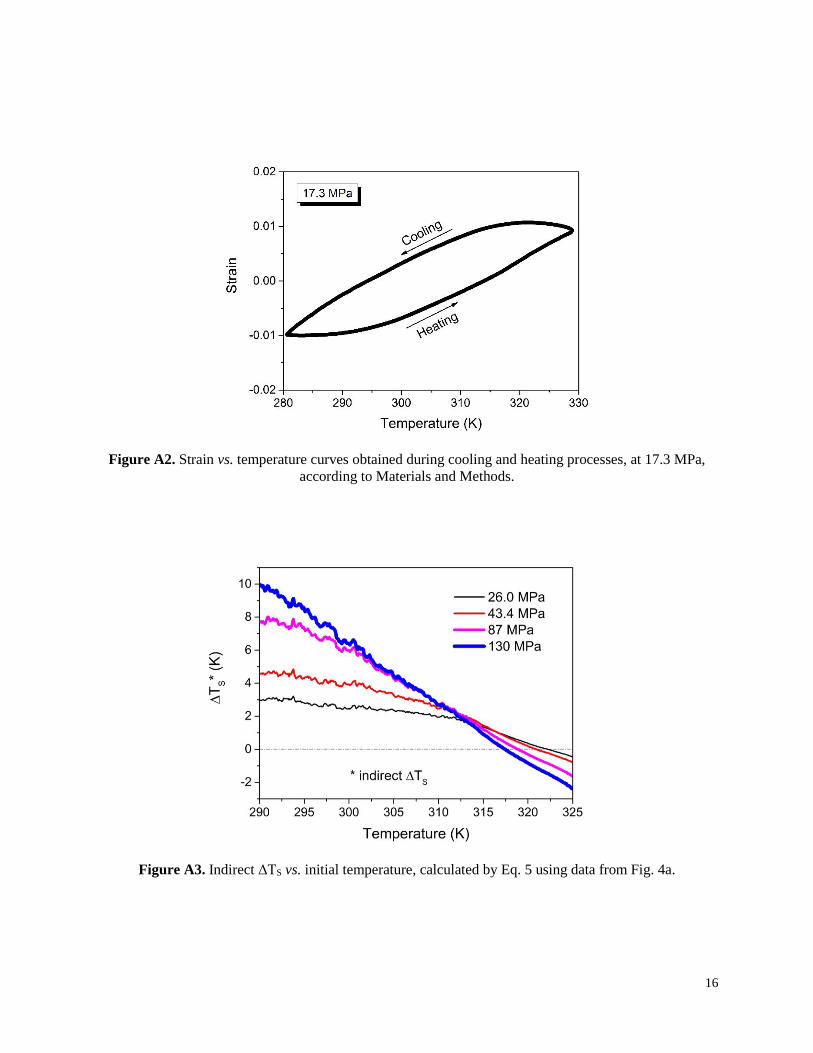
Figure A2. Strain vs. temperature curves obtained during cooling and heating processes, at 17.3 MPa,
according to Materials and Methods.
Figure A3. Indirect ΔTS vs. initial temperature, calculated by Eq. 5 using data from Fig. 4a.
17
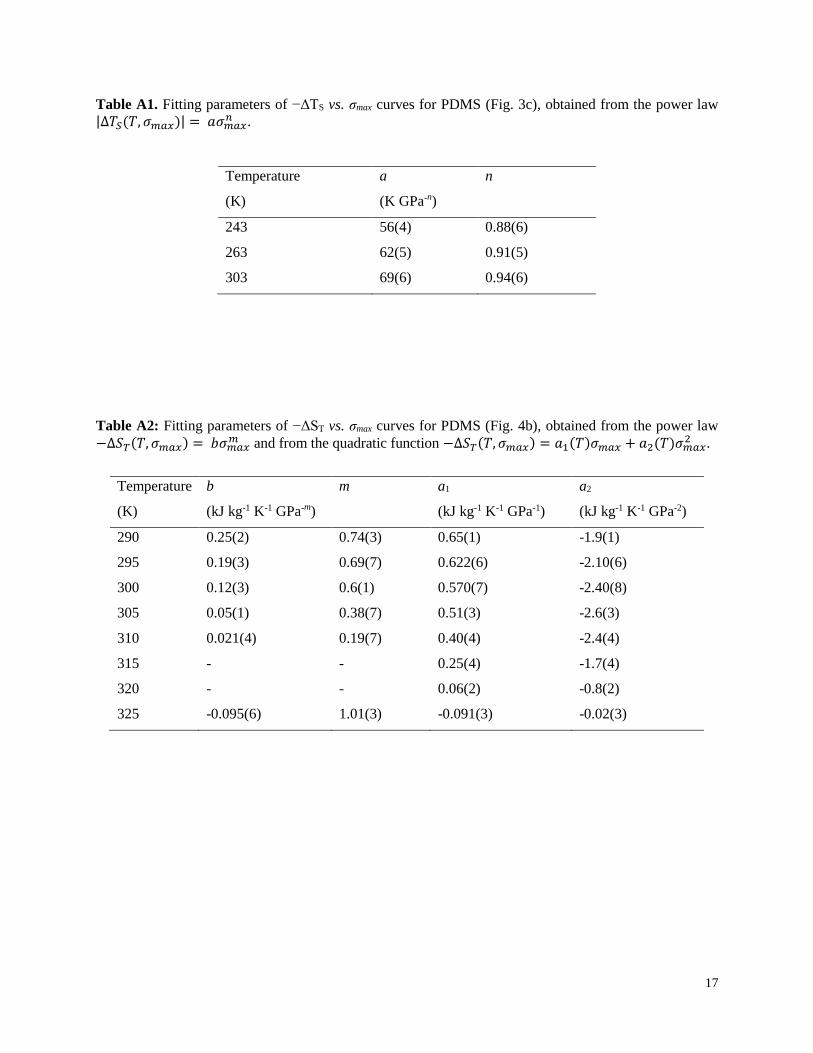
Table A1. Fitting parameters of −ΔTS vs. σmax curves for PDMS (Fig. 3c), obtained from the power law |∆𝑇𝑆(𝑇, 𝜎𝑚𝑎𝑥)| = 𝑎𝜎𝑚𝑎𝑥
𝑛 .
Temperature
(K)
a
(K GPa-n)
n
243
263
303
56(4)
62(5)
69(6)
0.88(6)
0.91(5)
0.94(6)
Table A2: Fitting parameters of −ΔST vs. σmax curves for PDMS (Fig. 4b), obtained from the power law
−∆𝑆𝑇(𝑇, 𝜎𝑚𝑎𝑥) = 𝑏𝜎𝑚𝑎𝑥𝑚 and from the quadratic function −∆𝑆𝑇(𝑇, 𝜎𝑚𝑎𝑥) = 𝑎1(𝑇)𝜎𝑚𝑎𝑥 + 𝑎2(𝑇)𝜎𝑚𝑎𝑥
2 .
Temperature
(K)
b
(kJ kg-1 K-1 GPa-m)
m a1
(kJ kg-1 K-1 GPa-1)
a2
(kJ kg-1 K-1 GPa-2)
290
295
300
305
310
315
320
325
0.25(2)
0.19(3)
0.12(3)
0.05(1)
0.021(4)
-
-
-0.095(6)
0.74(3)
0.69(7)
0.6(1)
0.38(7)
0.19(7)
-
-
1.01(3)
0.65(1)
0.622(6)
0.570(7)
0.51(3)
0.40(4)
0.25(4)
0.06(2)
-0.091(3)
-1.9(1)
-2.10(6)
-2.40(8)
-2.6(3)
-2.4(4)
-1.7(4)
-0.8(2)
-0.02(3)
18
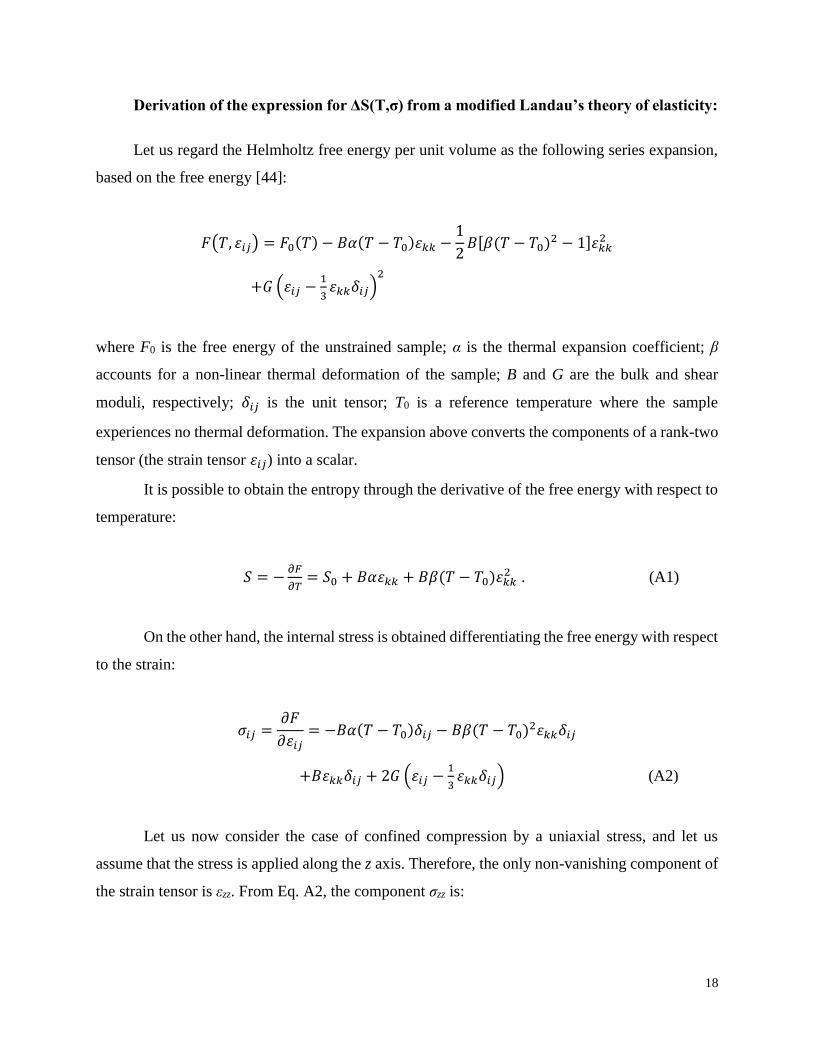
Derivation of the expression for ΔS(T,σ) from a modified Landau’s theory of elasticity:
Let us regard the Helmholtz free energy per unit volume as the following series expansion,
based on the free energy [44]:
𝐹(𝑇, 휀𝑖𝑗) = 𝐹0(𝑇) − 𝐵𝛼(𝑇 − 𝑇0)휀𝑘𝑘 −1
2𝐵[𝛽(𝑇 − 𝑇0)2 − 1]휀𝑘𝑘
2
+𝐺 (휀𝑖𝑗 −1
3휀𝑘𝑘𝛿𝑖𝑗)
2
where F0 is the free energy of the unstrained sample; α is the thermal expansion coefficient; β
accounts for a non-linear thermal deformation of the sample; B and G are the bulk and shear
moduli, respectively; 𝛿𝑖𝑗 is the unit tensor; T0 is a reference temperature where the sample
experiences no thermal deformation. The expansion above converts the components of a rank-two
tensor (the strain tensor 휀𝑖𝑗) into a scalar.
It is possible to obtain the entropy through the derivative of the free energy with respect to
temperature:
𝑆 = −𝜕𝐹
𝜕𝑇= 𝑆0 + 𝐵𝛼휀𝑘𝑘 + 𝐵𝛽(𝑇 − 𝑇0)휀𝑘𝑘
2 . (A1)
On the other hand, the internal stress is obtained differentiating the free energy with respect
to the strain:
𝜎𝑖𝑗 =𝜕𝐹
𝜕휀𝑖𝑗= −𝐵𝛼(𝑇 − 𝑇0)𝛿𝑖𝑗 − 𝐵𝛽(𝑇 − 𝑇0)2휀𝑘𝑘𝛿𝑖𝑗
+𝐵휀𝑘𝑘𝛿𝑖𝑗 + 2𝐺 (휀𝑖𝑗 −1
3휀𝑘𝑘𝛿𝑖𝑗) (A2)
Let us now consider the case of confined compression by a uniaxial stress, and let us
assume that the stress is applied along the z axis. Therefore, the only non-vanishing component of
the strain tensor is εzz. From Eq. A2, the component σzz is:
19
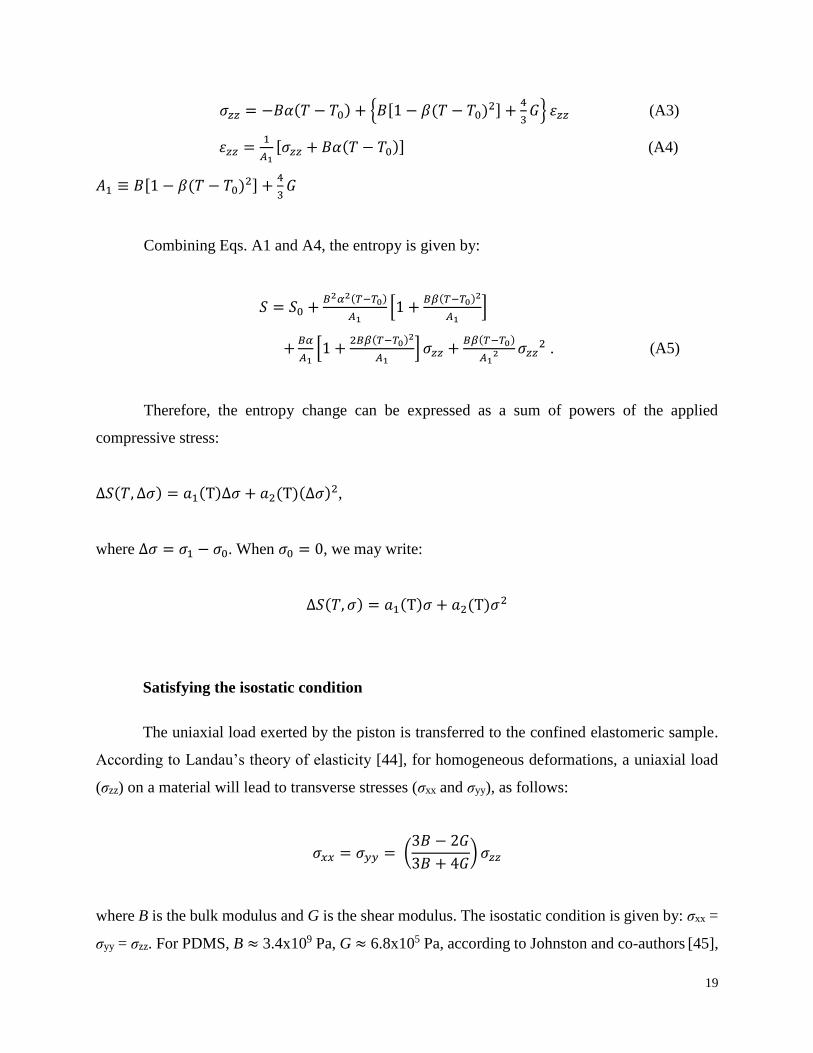
𝜎𝑧𝑧 = −𝐵𝛼(𝑇 − 𝑇0) + {𝐵[1 − 𝛽(𝑇 − 𝑇0)2] +4
3𝐺} 휀𝑧𝑧 (A3)
휀𝑧𝑧 =1
𝐴1[𝜎𝑧𝑧 + 𝐵𝛼(𝑇 − 𝑇0)] (A4)
𝐴1 ≡ 𝐵[1 − 𝛽(𝑇 − 𝑇0)2] +4
3𝐺
Combining Eqs. A1 and A4, the entropy is given by:
𝑆 = 𝑆0 +𝐵2𝛼2(𝑇−𝑇0)
𝐴1[1 +
𝐵𝛽(𝑇−𝑇0)2
𝐴1]
+𝐵𝛼
𝐴1[1 +
2𝐵𝛽(𝑇−𝑇0)2
𝐴1] 𝜎𝑧𝑧 +
𝐵𝛽(𝑇−𝑇0)
𝐴12 𝜎𝑧𝑧
2 . (A5)
Therefore, the entropy change can be expressed as a sum of powers of the applied
compressive stress:
∆𝑆(𝑇, ∆𝜎) = 𝑎1(T)∆𝜎 + 𝑎2(T)(∆𝜎)2,
where ∆𝜎 = 𝜎1 − 𝜎0. When 𝜎0 = 0, we may write:
∆𝑆(𝑇, 𝜎) = 𝑎1(T)𝜎 + 𝑎2(T)𝜎2
Satisfying the isostatic condition
The uniaxial load exerted by the piston is transferred to the confined elastomeric sample.
According to Landau’s theory of elasticity [44], for homogeneous deformations, a uniaxial load
(σzz) on a material will lead to transverse stresses (σxx and σyy), as follows:
𝜎𝑥𝑥 = 𝜎𝑦𝑦 = (3𝐵 − 2𝐺
3𝐵 + 4𝐺) 𝜎𝑧𝑧
where B is the bulk modulus and G is the shear modulus. The isostatic condition is given by: σxx =
σyy = σzz. For PDMS, B ≈ 3.4x10⁹ Pa, G ≈ 6.8x10⁵ Pa, according to Johnston and co-authors [45],

20
and then σxx = σyy = 0.9996σzz. Therefore, the applied tension is isostatic and we can name the
effect as barocaloric.
References
[1] J.A. Gough, A Description of a property of Caoutchouc or Indian Rubber, Mem. Lit.
Phyiosophical Soc. Manchester. 1 (1805) 288–295.
http://www.biodiversitylibrary.org/bibliography/49075.
[2] J.P. Joule, On some thermodynamic properties of solids, Phil. Trans. R. Soc. Lond. 149
(1859) 91–131.
[3] W. Thomson, II. On the thermoelastic, thermomagnetic, and pyroelectric properties of
matter, Philos. Mag. Ser. 5. 5 (1878) 4–27. doi:10.1080/14786447808639378.
[4] V.K. Pecharsky, K.A. Gschneidner, Jr., Giant magnetocaloric effect in Gd5(Si2Ge2), Phys.
Rev. Lett. 78 (1997) 4494–4497. doi:10.1103/PhysRevLett.78.4494.
[5] A.S. Mischenko, K. Zhang, J.F. Scott, R.W. Whatmore, N.D. Mathur, Giant Electrocaloric
Effect in Thin-Film PbZr0.950Ti0.05O3, Science. 311 (2006) 1270–1271.
doi:10.1126/science.1123811.
[6] S.L. Dart, R.L. Anthony, E. Guth, Rise of temperature on fast stretching of synthetic and
natural rubbers, Ind. Eng. Chem. 34 (1942) 1340–1342. doi:10.5254/1.3546779.
[7] S.L. Dart, E. Guth, Rise of temperature on fast stretching of butyl rubber, Rubber Chem.
Technol. 18 (1945) 803–816. doi:10.5254/1.3546779.
[8] E.L. Rodriguez, F.E. Filisko, Thermoelastic temperature changes in poly(methyl
methacrylate) at high hydrostatic pressure: Experimental, J. Appl. Phys. 53 (1982) 6536.
doi:10.1063/1.330081.
[9] E. Bonnot, R. Romero, L. Mañosa, E. Vives, A. Planes, Elastocaloric effect associated
with the martensitic transition in shape-memory alloys, Phys. Rev. Lett. 100 (2008)
125901. doi:10.1103/PhysRevLett.100.125901.
[10] L. Mañosa, D. González-alonso, A. Planes, E. Bonnot, M. Barrio, J. Tamarit, et al., Giant
21
solid-state barocaloric effect in the Ni-Mn-In magnetic shape-memory alloy, Nat. Mater. 9
(2010) 478–481. doi:10.1038/nmat2731.
[11] R. Millán-Solsona, E. Stern-Taulats, E. Vives, A. Planes, J. Sharma, A.K. Nayak, et al.,
Large entropy change associated with the elastocaloric effect in polycrystalline Ni-Mn-Sb-
Co magnetic shape memory alloys, Appl. Phys. Lett. 105 (2014) 241901.
doi:10.1063/1.4904419.
[12] E. Stern-Taulats, A. Planes, P. Lloveras, M. Barrio, J.L. Tamarit, S. Pramanick, et al.,
Barocaloric and magnetocaloric effects in Fe49Rh51, Phys. Rev. B - Condens. Matter
Mater. Phys. 89 (2014) 214105. doi:10.1103/PhysRevB.89.214105.
[13] Y. Liu, J. Wei, P.E. Janolin, I.C. Infante, X. Lou, B. Dkhil, Giant room-temperature
barocaloric effect and pressure-mediated electrocaloric effect in BaTiO3 single crystal,
Appl. Phys. Lett. 104 (2014) 162904. doi:10.1063/1.4873162.
[14] P. Lloveras, E. Stern-Taulats, M. Barrio, J.-L. Tamarit, S. Crossley, W. Li, et al., Giant
barocaloric effects at low pressure in ferrielectric ammonium sulphate, Nat. Commun. 6
(2015) 8801. doi:10.1038/ncomms9801.
[15] J.M. Bermúdez-García, M. Sánchez-Andújar, M.A. Señarís-Rodríguez, A New
Playground for Organic-Inorganic Hybrids: Barocaloric Materials for Pressure-Induced
Solid-State Cooling, J. Phys. Chem. Lett. 8 (2017) 4419–4423.
doi:10.1021/acs.jpclett.7b01845.
[16] J. Tušek, K. Engelbrecht, D. Eriksen, S. Dall’Olio, J. Tušek, N. Pryds, A regenerative
elastocaloric heat pump, Nat. Energy. 1 (2016) 16134. doi:10.1038/nenergy.2016.134.
[17] D. Guyomar, Y. Li, G. Sebald, P. Cottinet, B. Ducharne, J. Capsal, Elastocaloric modeling
of natural rubber, Appl. Therm. Eng. 57 (2013) 33–38.
doi:10.1016/j.applthermaleng.2013.03.032.
[18] Z. Xie, G. Sebald, D. Guyomar, Z. Xie, G. Sebald, D. Guyomar, Elastocaloric effect
dependence on pre-elongation in natural rubber Elastocaloric, Appl. Phys. Lett. 107
(2015) 81905. doi:10.1063/1.4929395.
[19] T. Matsuo, N. Azuma, Y. Toriyama, T. Yoshioka, Mechanocaloric properties of poly (
dimethylsiloxane ) and ethylene – propylene rubbers, J. Therm. Anal. Calorim. 123 (2016)
22
1817–1824. doi:10.1007/s10973-015-4675-0.
[20] S. Patel, A. Chauhan, R. Vaish, P. Thomas, Elastocaloric and barocaloric effects in
polyvinylidene di-fluoride-based polymers, Appl. Phys. Lett. 108 (2016) 72903.
doi:10.1063/1.4942000.
[21] Z. Xie, G. Sebald, D. Guyomar, Comparison of direct and indirect measurement of the
elastocaloric effect in natural rubber, Appl. Phys. Lett. 108 (2016) 41901.
doi:10.1063/1.4940378.
[22] Y. Yoshida, K. Yuse, D. Guyomar, J. Capsal, G. Sebald, Y. Yoshida, et al., Elastocaloric
effect in poly (vinylidene fluoride-trifluoroethylene- chlorotrifluoroethylene) terpolymer,
Appl. Phys. Lett. 108 (2016) 242904. doi:10.1063/1.4953770.
[23] E.O. Usuda, N.M. Bom, A.M.G. Carvalho, Large barocaloric effects at low pressures in
natural rubber, Eur. Polym. J. 92 (2017) 287–293. https://arxiv.org/abs/1701.05237.
[24] G. Sebald, Z. Xie, D. Guyomar, Fatigue effect of elastocaloric properties in natural rubber,
Philos. Trans. R. Soc. London A Math. Phys. Eng. Sci. 374 (2016) 439–450.
doi:10.1098/rsta.2015.0302.
[25] J.E. Mark, Polymer Data Handbook, Oxford University Press, New York, EUA, 1999.
doi:10.1021/ja907879q.
[26] L.R.G. Treloar, The physics of rubber elasticity, Oxford University Press, London, 1975.
doi:10.1016/0022-3697(59)90114-3.
[27] M. Rezakazemi, A. Vatani, T. Mohammadi, Synergistic interaction between POSS and
fumed silica on the properties of corsslinked PDMS nanocomposite membranes, RSC
Adv. 5 (2015) 82460–82470.
[28] F.L. Pissetti, P.L. De Araújo, F.A.B. Silvaa, G.Y. Poirier, Synthesis of
poly(dimethylsiloxane) networks functionalized with imidazole or benzimidazole for
copper(II) removal from water, J. Braz. Chem. Soc. 26 (2015) 266–272.
doi:10.5935/0103-5053.20140264.
[29] N.M. Bom, E.O. Usuda, G.M. Guimarães, A.A. Coelho, A.M.G. Carvalho, Note:
Experimental setup for measuring the barocaloric effect in polymers: Application to
23
natural rubber, Rev. Sci. Instrum. 88 (2017) 46103. http://arxiv.org/abs/1612.08638.
[30] K.A. Gschneidner, V.K. Pecharsky, Magnetocaloric Materials, Annu. Rev. Mater. Sci. 30
(2000) 387–429.
[31] X. Moya, S. Kar-Narayan, N.D. Mathur, Caloric materials near ferroic phase transitions,
Nat. Mater. 13 (2014) 439–450. doi:10.1038/nmat3951.
[32] B. Lu, J. Liu, Mechanocaloric materials for solid-state cooling, Sci. Bull. 60 (2015) 1638.
doi:10.1007/s11434-015-0898-5.
[33] L. Manosa, A. Planes, Mechanocaloric effects in Shape Memory Alloys, Philos. Trans. R.
Soc. London A Math. Phys. Eng. Sci. 374 (2016) 20150310. doi:10.1098/rsta.2015.0310.
[34] M.M. Vopson, Theory of giant-caloric effects in multiferroic materials, J. Phys. D. Appl.
Phys. 46 (2013) 345304. doi:10.1088/0022-3727/46/34/345304.
[35] Y. Liu, I.C. Infante, X. Lou, L. Bellaiche, J.F. Scott, B. Dkhil, Giant room-temperature
elastocaloric effect in ferroelectric ultrathin films, Adv. Mater. 26 (2014) 6132–6137.
doi:10.1002/adma.201401935.
[36] A.M.G. Carvalho, A.A. Coelho, S. Gama, P.J. von Ranke, C.S. Alves, Isothermal
variation of the entropy (delta S) for the compound Gd5Ge4 under hydrostatic pressure, J.
Appl. Phys. 104 (2008) 63915. doi:10.1063/1.2980040.
[37] A. M. Tishin and Y. I. Spichkin, “The Magnetocaloric Effect and its Applications”, 1st
edition (Institute of Physics, Bristol and Philadelphia, 2003).
[38] B. Wang, S. Krause, Properties of Dimethylsiloxane Microphases in Phase-Separated
Dimethylsiloxane Block Copolymers, Macromolecules. 20 (1987) 2201–2208.
doi:10.1021/ma00175a026.
[39] J.C. Mitchell, D.J. Meier, Rapid Stress-Induced Crystallization in Natural Rubber, J.
Polym. Sci. Part A-2 Polym. Phys. 6 (1968) 1689–1703.
[40] S. Yuce, M. Barrio, B. Emre, E. Stern-Taulats, A. Planes, J.L. Tamarit, et al., Barocaloric
effect in the magnetocaloric prototype Gd5Si2Ge2, Appl. Phys. Lett. 101 (2012) 71906.
doi:10.1063/1.4745920.
[41] D. Matsunami, A. Fujita, K. Takenaka, M. Kano, Giant barocaloric effect enhanced by the
24
frustration of the antiferromagnetic phase in Mn3GaN, Nat. Mater. 14 (2015) 73–78.
doi:10.1038/NMAT4117.
[42] E. Stern-Taulats, A. Gràcia-Condal, A. Planes, P. Lloveras, M. Barrio, J.L. Tamarit, et al.,
Reversible adiabatic temperature changes at the magnetocaloric and barocaloric effects in
Fe49Rh51, Appl. Phys. Lett. 107 (2015) 152409. doi:10.1063/1.4933409.
[43] J.M. Bermúdez-García, M. Sánchez-Andújar, S. Castro-García, J. López-Beceiro, R.
Artiaga, M.A. Señarís-Rodríguez, Giant barocaloric effect in the ferroic organic-inorganic
hybrid [TPrA][Mn(dca)3] perovskite under easily accessible pressures, Nat. Commun. 8
(2017) 15715. doi:10.1038/ncomms15715.
[44] L.D. Landau, E.M. Lifshitz, Theory of Elasticity: Vol. 7 of Course of Theoretical Physics,
Pergamon Press, Oxford, 1970. doi:10.1063/1.3057037.
[45] I.D. Johnston, D.K. McCluskey, C.K.L. Tan, M.C. Tracey, Mechanical characterization of
bulk Sylgard 184 for microfluidics and microengineering, J. Micromechanics
Microengineering. 24 (2014) 35017. doi:10.1088/0960-1317/24/3/035017.


![[Cliqueapostilas.com.Br] Vantage Pdms (2)](https://img.document.onl/doc/110x75/563db962550346aa9a9ccfd1/cliqueapostilascombr-vantage-pdms-2.jpg)