Embed Size (px)
Citation preview
GeoBGeoB
GeoBGeoB
GeoBGeoB
GeoB
JAM
GeoB
JAM
20ºS
10ºS
0º
Chl mg/m³
Si µmol/l
A : Jan - Mar B : Apr - Jun
C : Jul - Sept D : Oct - Dec
E : Jan - Mar F : Apr - Jun
G : Jul - Sept H : Oct - Dec20ºS
10ºS
0º
20ºS
10ºS
0º
20ºS
10ºS
0º
20ºS
10ºS
0º
20ºS
10ºS
20ºS
10ºS
0º
20ºS
10ºS
0º
130ºE120ºE110ºE100ºE90ºE130ºE120ºE110ºE100ºE90ºE
130ºE120ºE110ºE100ºE90ºE130ºE120ºE110ºE100ºE90ºE
0º
High Interglacial Diatom Paleoproductivity in the Western Indo-Pacific Warm Pool During the Last Glacial Cycle
To assess paleoproductivity changes in the westernmost Indo-Pacific
Warm Pool (IPWP), we study variations of diatom production during the
past 130,000 years off southern Sumatra (Figure 1).
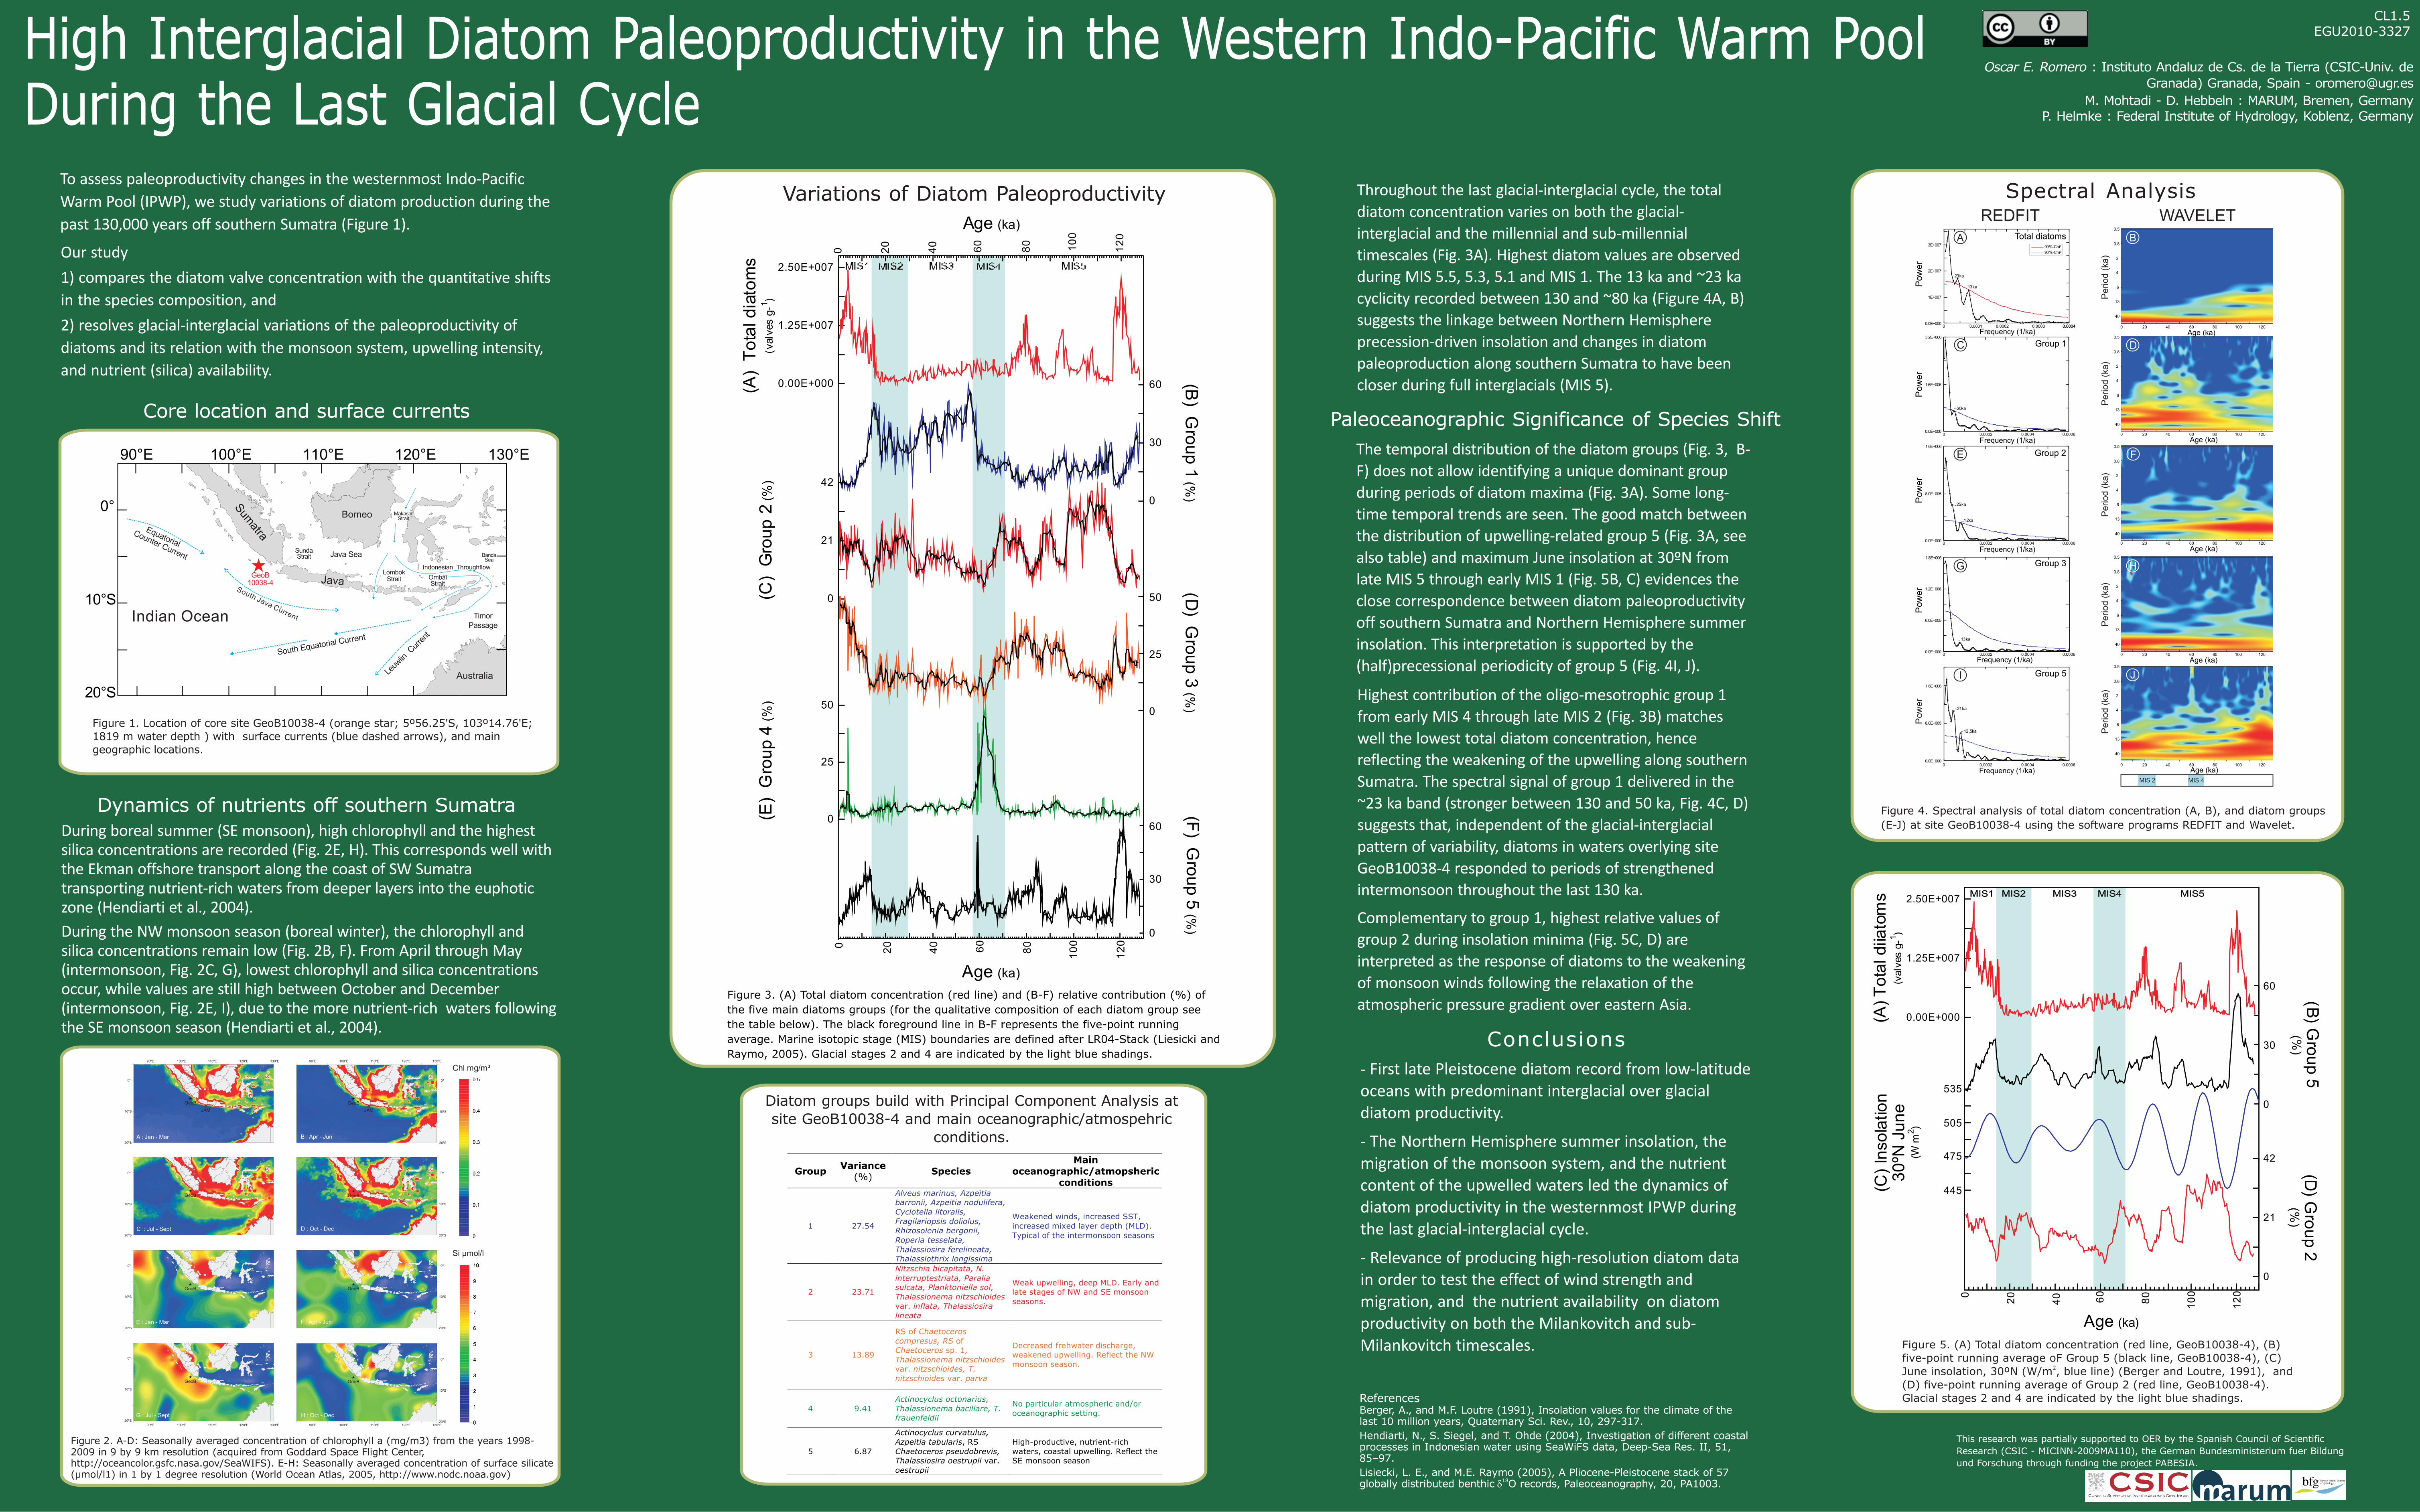
The temporal distribution of the diatom groups (Fig. 3, B-
F) does not allow identifying a unique dominant group
during periods of diatom maxima (Fig. 3A). Some long-
time temporal trends are seen. The good match between
the distribution of upwelling-related group 5 (Fig. 3A, see
also table) and maximum June insolation at 30ºN from
late MIS 5 through early MIS 1 (Fig. 5B, C) evidences the
close correspondence between diatom paleoproductivity
off southern Sumatra and Northern Hemisphere summer
insolation. This interpretation is supported by the
(half)precessional periodicity of group 5 (Fig. 4I, J).
During boreal summer (SE monsoon), high chlorophyll and the highest silica concentrations are recorded (Fig. 2E, H). This corresponds well with the Ekman offshore transport along the coast of SW Sumatra transporting nutrient-rich waters from deeper layers into the euphotic zone (Hendiarti et al., 2004).
During the NW monsoon season (boreal winter), the chlorophyll and silica concentrations remain low (Fig. 2B, F). From April through May (intermonsoon, Fig. 2C, G), lowest chlorophyll and silica concentrations occur, while values are still high between October and December (intermonsoon, Fig. 2E, I), due to the more nutrient-rich waters following the SE monsoon season (Hendiarti et al., 2004).
Figure 3. (A) Total diatom concentration (red line) and (B-F) relative contribution (%) of
the five main diatoms groups (for the qualitative composition of each diatom group see
the table below). The black foreground line in B-F represents the five-point running
average. Marine isotopic stage (MIS) boundaries are defined after LR04-Stack (Liesicki and
Raymo, 2005). Glacial stages 2 and 4 are indicated by the light blue shadings.
Throughout the last glacial-interglacial cycle, the total
diatom concentration varies on both the glacial-
interglacial and the millennial and sub-millennial
timescales (Fig. 3A). Highest diatom values are observed
during MIS 5.5, 5.3, 5.1 and MIS 1. The 13 ka and ~23 ka
cyclicity recorded between 130 and ~80 ka (Figure 4A, B)
suggests the linkage between Northern Hemisphere
precession-driven insolation and changes in diatom
paleoproduction along southern Sumatra to have been
closer during full interglacials (MIS 5).
Highest contribution of the oligo-mesotrophic group 1
from early MIS 4 through late MIS 2 (Fig. 3B) matches
well the lowest total diatom concentration, hence
reflecting the weakening of the upwelling along southern
Sumatra. The spectral signal of group 1 delivered in the
~23 ka band (stronger between 130 and 50 ka, Fig. 4C, D)
suggests that, independent of the glacial-interglacial
pattern of variability, diatoms in waters overlying site
GeoB10038-4 responded to periods of strengthened
intermonsoon throughout the last 130 ka.
Complementary to group 1, highest relative values of
group 2 during insolation minima (Fig. 5C, D) are
interpreted as the response of diatoms to the weakening
of monsoon winds following the relaxation of the
atmospheric pressure gradient over eastern Asia.
Conclusions
- First late Pleistocene diatom record from low-latitude oceans with predominant interglacial over glacial diatom productivity.
- The Northern Hemisphere summer insolation, the migration of the monsoon system, and the nutrient content of the upwelled waters led the dynamics of diatom productivity in the westernmost IPWP during the last glacial-interglacial cycle.
- Relevance of producing high-resolution diatom data in order to test the effect of wind strength and migration, and the nutrient availability on diatom productivity on both the Milankovitch and sub-Milankovitch timescales.
Our study
1) compares the diatom valve concentration with the quantitative shifts
in the species composition, and
2) resolves glacial-interglacial variations of the paleoproductivity of
diatoms and its relation with the monsoon system, upwelling intensity,
and nutrient (silica) availability.
ReferencesBerger, A., and M.F. Loutre (1991), Insolation values for the climate of the last 10 million years, Quaternary Sci. Rev., 10, 297-317.
Hendiarti, N., S. Siegel, and T. Ohde (2004), Investigation of different coastal processes in Indonesian water using SeaWiFS data, Deep-Sea Res. II, 51, 85–97.
Lisiecki, L. E., and M.E. Raymo (2005), A Pliocene-Pleistocene stack of 57 18globally distributed benthic dO records, Paleoceanography, 20, PA1003.
Figure 2. A-D: Seasonally averaged concentration of chlorophyll a (mg/m3) from the years 1998-2009 in 9 by 9 km resolution (acquired from Goddard Space Flight Center, http://oceancolor.gsfc.nasa.gov/SeaWIFS). E-H: Seasonally averaged concentration of surface silicate (µmol/l1) in 1 by 1 degree resolution (World Ocean Atlas, 2005, http://www.nodc.noaa.gov)
Spectral Analysis Variations of Diatom Paleoproductivity
Diatom groups build with Principal Component Analysis at
site GeoB10038-4 and main oceanographic/atmospehric
conditions.
0
20
40
60
80
10
0
12
0
Age (ka)
0.00E+000
1.25E+007
2.50E+007
(A)
To
tald
iato
ms
(valv
es
g-1
)
0
21
42
(C)
Gro
up
2(%
)
0
25
50
(D)
Gro
up
3(%
)
0
25
50
(E)
Gro
up
4(%
)
0
30
60
(F)
Gro
up
5(%
)
0
30
60 (B)
Gro
up
1(%
)
0 20
40
60
80
10
0
12
0
Age (ka)
TimorPassage
OmbaiStrait
LombokStrait
SundaStrait
Indian Ocean
Australia
Borneo
110°E 120°E100°E90°E
0°
10°S
Indonesian Throughflow
South Equatorial Current
South Java Current
GeoB10038-4
Leuw
iin C
urre
nt
Equatorial
Counter Current
Sum
atra
Java
Borneo
Australia
Java Sea
MakasarStrait
130°E
20°S
BandaSea
0
20
40 60
80
10
0
12
0
Age (ka)
0.00E+000
1.25E+007
2.50E+007
(A)
To
tald
iiato
ms
(valv
es
g-1 )
0
21
42
(D)
Gro
up
2(%
)
0
30
60
(B)
Gro
up
5(%
)
445
475
505
535
(C)
Inso
latio
n3
0ºN
Ju
ne
(Wm
2 )
Oscar E. Romero : Instituto Andaluz de Cs. de la Tierra (CSIC-Univ. de
Granada) Granada, Spain -
M. Mohtadi - D. Hebbeln : MARUM, Bremen, GermanyP. Helmke : Federal Institute of Hydrology, Koblenz, Germany
CL1.5EGU2010-3327
Core location and surface currents
Dynamics of nutrients off southern Sumatra
Figure 1. Location of core site GeoB10038-4 (orange star; 5º56.25'S, 103º14.76'E; 1819 m water depth ) with surface currents (blue dashed arrows), and main geographic locations.
40
13
6
4
2
0.8
0.5
0 20 40 60 80 100 120
Period (
ka)
40
13
6
4
2
0.8
0.5
40
13
6
4
2
0.8
0.5
40
13
6
4
2
0.8
0.5
40
13
6
4
2
0.8
0.5
Group 5
0 20 40 60 80 100 120
0 20 40 60 80 100 120
0 20 40 60 80 100 120
0 20 40 60 80 100 120
Age (ka)
Period (
ka)
Period (
ka)
Period (
ka)
Period (
ka)
Age (ka)
Age (ka)
Age (ka)
Age (ka)
13ka
23ka
~20ka
~13ka
~12.5ka
~21ka
0
Pow
er
0.0002 0.0004 0.0006
Frequency (1/ka)
~12ka
~25ka
0 0.0002 0.0004 0.0006
Frequency (1/ka)
0 0.0002 0.0004 0.0006
Frequency (1/ka)
0 0.0002 0.0004 0.0006
Frequency (1/ka)
0 0.0001 0.00040.0002
Frequency (1/ka)0.00040.0003
1.6E+006
8.0E+005
0.0E+000
Group 3
Group 2
Group 1
Total diatoms
Pow
er
1.8E+006
6.0E+005
0.0E+000
Pow
er
1.6E+006
8.0E+005
0.0E+000
Pow
er
3.2E+006
1.6E+006
0.0E+000
Pow
er
0.0E+000
1.2E+006
1E+007
2E+007
3E+007 99%-Chi2
90%-Chi2
MIS 2
A B
C D
H
F
J
E
G
I
MIS 4
REDFIT WAVELET
Paleoceanographic Significance of Species Shift
Figure 4. Spectral analysis of total diatom concentration (A, B), and diatom groups
(E-J) at site GeoB10038-4 using the software programs REDFIT and Wavelet.
Figure 5. (A) Total diatom concentration (red line, GeoB10038-4), (B)
five-point running average oF Group 5 (black line, GeoB10038-4), (C) 2
June insolation, 30ºN (W/m , blue line) (Berger and Loutre, 1991), and
(D) five-point running average of Group 2 (red line, GeoB10038-4).
Glacial stages 2 and 4 are indicated by the light blue shadings.
This research was partially supported to OER by the Spanish Council of Scientific
Research (CSIC - MICINN-2009MA110), the German Bundesministerium fuer Bildung
und Forschung through funding the project PABESIA.