Embed Size (px)
Citation preview

ENTIDADE REGULADORA DOS SERVIÇOS ENERGÉTICOS
CONSULTA PÚBLICA Nº 66
IMPLEMENTAÇÃO DO CÓDIGO DE REDE RELATIVO A
ESTRUTURAS TARIFÁRIAS HARMONIZADAS PARA O
TRANSPORTE DE GÁS NATURAL
Agosto 2018

This document is prepared to be printed on both sides
Rua Dom Cristóvão da Gama n.º 1-3.º 1400-113 Lisbon
Tel.: 21 303 32 00 Fax: 21 303 32 01 e-mail: [email protected]
www.erse.pt
IMPLEMENTATION OF THE NETWORK CODE ON HARMONISED TRANSMISSION TARIFF
STRUCTURES FOR GAS TABLE OF CONTENTS
i
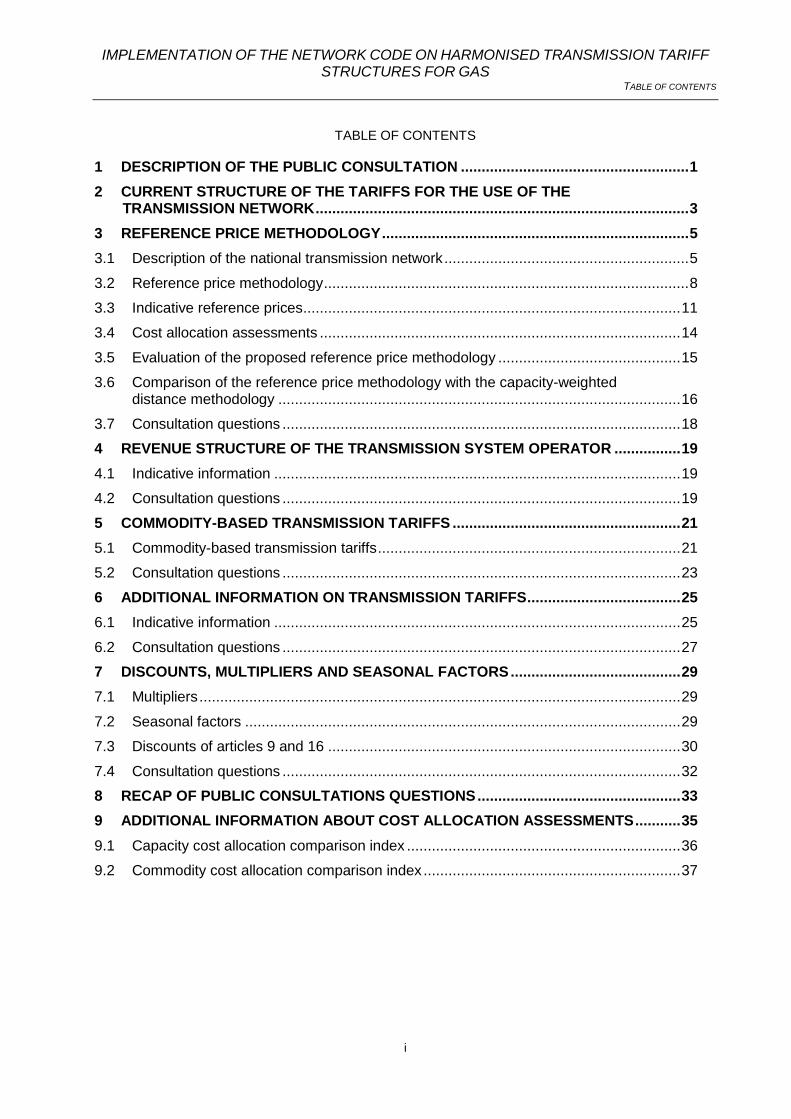
TABLE OF CONTENTS
1 DESCRIPTION OF THE PUBLIC CONSULTATION ....................................................... 1
2 CURRENT STRUCTURE OF THE TARIFFS FOR THE USE OF THE TRANSMISSION NETWORK .......................................................................................... 3
3 REFERENCE PRICE METHODOLOGY .......................................................................... 5
3.1 Description of the national transmission network ........................................................... 5
3.2 Reference price methodology ........................................................................................ 8
3.3 Indicative reference prices ........................................................................................... 11
3.4 Cost allocation assessments ....................................................................................... 14
3.5 Evaluation of the proposed reference price methodology ............................................ 15
3.6 Comparison of the reference price methodology with the capacity-weighted distance methodology ................................................................................................. 16
3.7 Consultation questions ................................................................................................ 18
4 REVENUE STRUCTURE OF THE TRANSMISSION SYSTEM OPERATOR ................ 19
4.1 Indicative information .................................................................................................. 19
4.2 Consultation questions ................................................................................................ 19
5 COMMODITY-BASED TRANSMISSION TARIFFS ....................................................... 21
5.1 Commodity-based transmission tariffs ......................................................................... 21
5.2 Consultation questions ................................................................................................ 23
6 ADDITIONAL INFORMATION ON TRANSMISSION TARIFFS ..................................... 25
6.1 Indicative information .................................................................................................. 25
6.2 Consultation questions ................................................................................................ 27
7 DISCOUNTS, MULTIPLIERS AND SEASONAL FACTORS ......................................... 29
7.1 Multipliers .................................................................................................................... 29
7.2 Seasonal factors ......................................................................................................... 29
7.3 Discounts of articles 9 and 16 ..................................................................................... 30
7.4 Consultation questions ................................................................................................ 32
8 RECAP OF PUBLIC CONSULTATIONS QUESTIONS ................................................. 33
9 ADDITIONAL INFORMATION ABOUT COST ALLOCATION ASSESSMENTS ........... 35
9.1 Capacity cost allocation comparison index .................................................................. 36
9.2 Commodity cost allocation comparison index .............................................................. 37
IMPLEMENTATION OF THE NETWORK CODE ON HARMONISED TRANSMISSION TARIFF
STRUCTURES FOR GAS TABLE OF CONTENTS
ii
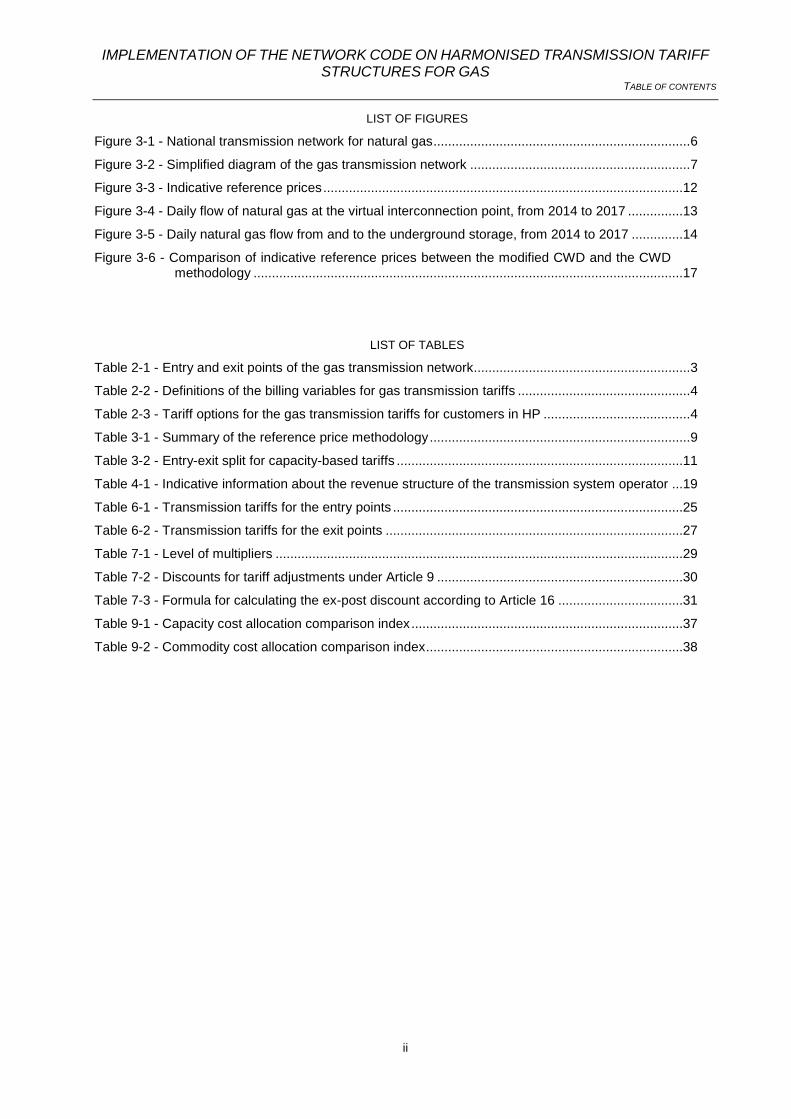
LIST OF FIGURES
Figure 3-1 - National transmission network for natural gas ...................................................................... 6
Figure 3-2 - Simplified diagram of the gas transmission network ............................................................ 7
Figure 3-3 - Indicative reference prices ..................................................................................................12
Figure 3-4 - Daily flow of natural gas at the virtual interconnection point, from 2014 to 2017 ...............13
Figure 3-5 - Daily natural gas flow from and to the underground storage, from 2014 to 2017 ..............14
Figure 3-6 - Comparison of indicative reference prices between the modified CWD and the CWD methodology .....................................................................................................................17
LIST OF TABLES
Table 2-1 - Entry and exit points of the gas transmission network........................................................... 3
Table 2-2 - Definitions of the billing variables for gas transmission tariffs ............................................... 4
Table 2-3 - Tariff options for the gas transmission tariffs for customers in HP ........................................ 4
Table 3-1 - Summary of the reference price methodology ....................................................................... 9
Table 3-2 - Entry-exit split for capacity-based tariffs ..............................................................................11
Table 4-1 - Indicative information about the revenue structure of the transmission system operator ...19
Table 6-1 - Transmission tariffs for the entry points ...............................................................................25
Table 6-2 - Transmission tariffs for the exit points .................................................................................27
Table 7-1 - Level of multipliers ...............................................................................................................29
Table 7-2 - Discounts for tariff adjustments under Article 9 ...................................................................30
Table 7-3 - Formula for calculating the ex-post discount according to Article 16 ..................................31
Table 9-1 - Capacity cost allocation comparison index ..........................................................................37
Table 9-2 - Commodity cost allocation comparison index ......................................................................38

IMPLEMENTATION OF THE NETWORK CODE ON HARMONISED TRANSMISSION TARIFF STRUCTURES
FOR GAS Description of the public consultation
1
1 DESCRIPTION OF THE PUBLIC CONSULTATION
WHAT IS THIS DOCUMENT ABOUT?
Regulation (EU) 2017/460, of 16 March 2017, establishes a network code on harmonized transmission tariff
structures for gas, including rules on the application of a reference price methodology, publication and
consultation requirements, as well as the calculation of reserve prices for standardized capacity products.
This Regulation (hereafter gas tariff network code) is binding in its entirety and directly applicable in all EU
Member States since April 2017, without prejudice to the different deadlines for entry into force for certain
matters.1
One of the key objectives to be achieved by the Regulation is to increase the transparency of tariff structures
for the transmission of natural gas and of the procedures for their definition. In this context, the publication
of information related to the determination of allowed revenues for transmission system operators and the
calculation of the different tariffs for the use of the transmission system are mandatory. These requirements
should enable network users to understand the tariffs established for transmission services and other
regulated non-transmission services provided by the transmission system operator, as well as the manner
in which tariffs are defined, their historical and future changes. In addition, network users should be able to
identify and know the costs underlying transmission tariffs and to forecast them.
The structure of this public consultation reflects the structure of the public consultation requirements set
out in Article 26(1) of the gas tariff network code (TAR NC). The public consultation is accompanied by
additional documentation, namely:
Supporting document entitled "Annex – Comparison of reference price methodologies".
Summary in English of the subjects included in the public consultation, presented in a format pre-
established by the Agency for the Cooperation of Energy Regulators (ACER).
Files in Excel format with the application of the reference price methodologies.
TARGET AUDIENCE OF THIS PUBLIC CONSULTATION
The target audience of this public consultation are all agents of the natural gas sector, in particular:
Consumers and consumer associations.
Traders.
1 In addition to the tariff network code ('TAR NC') there are three further EU network codes, namely for 'capacity allocation mechanisms' ('CAM NC'), for 'gas balancing of transmission networks' (‘BAL NC’) and for 'interoperability and data exchange rules' ('INT NC'). The CAM NC has been revised and entered into force on 6 April 2017, on the
same date as the TAR NC.

IMPLEMENTATION OF THE NETWORK CODE ON HARMONISED TRANSMISSION TARIFF STRUCTURES
FOR GAS Description of the public consultation
2
Operators of high pressure gas infrastructure: transmission network, LNG terminal and
underground storage.
Distribution network operators.
National regulatory authority for the natural gas sector in Spain.2
WHAT IS THE DURATION OF THE CONSULTATION?
The Statutes of ERSE, approved by Decree-Law 97/2002, of 12 April, in the wording given by Decree-Law
57-A / 2018, of July 13, establish in Article 10, paragraph 2, the requirement of a 30-day period during
which interested parties can provide their comments and make suggestions regarding ERSE’s public
consultations. On the other hand, the gas tariff network code requires a minimum period of two months
during which the public consultation must take place. In order to comply with both time requirements, the
present public consultation will run from 17 August 2018 to 17 October 2018.
HOW TO PARTICIPATE IN THIS CONSULTATION?
Comments on the questions put to public consultation at the end of chapters 3 to 7, and summarized in
chapter 8 of this document, should be sent to ERSE by 17 October 2018, by post, fax or, preferably,
electronic mail, to the following addresses:
Postal address: Rua D. Cristóvão da Gama nº 1, 3rd floor, 1400-113 Lisbon.
Fax: 213 033 201
E-mail: [email protected]
Comments received will be considered public, unless the author explicitly requests confidentiality. In the
latter case, a non-confidential version must also be submitted.
WHAT HAPPENS TO COMMENTS RECEIVED BY ERSE?
Contributions sent to ERSE will be analysed in a public document that will be made available to all
participants in the consultation. This document will contain the non-confidential comments received,
ERSE's comments and justification of the decisions taken.
Pursuant to Article 26(3) of the gas tariff network code, ERSE shall publish the responses to the public
consultation and their summary, including a summary in English, within one month following the end of the
consultation process.
2 The need to consult the national regulatory authority in Spain on matters covered by chapter 7 results from Article 28(1) of the gas tariff network code. Regulation of the natural gas sector in Spain lies with the ‘Comisión Nacional de
los Mercados y la Competencia’ (CNMC).
IMPLEMENTATION OF THE NETWORK CODE ON HARMONISED TRANSMISSION TARIFF STRUCTURES
FOR GAS Current structure of the tariffs for the use of the transmission network
3
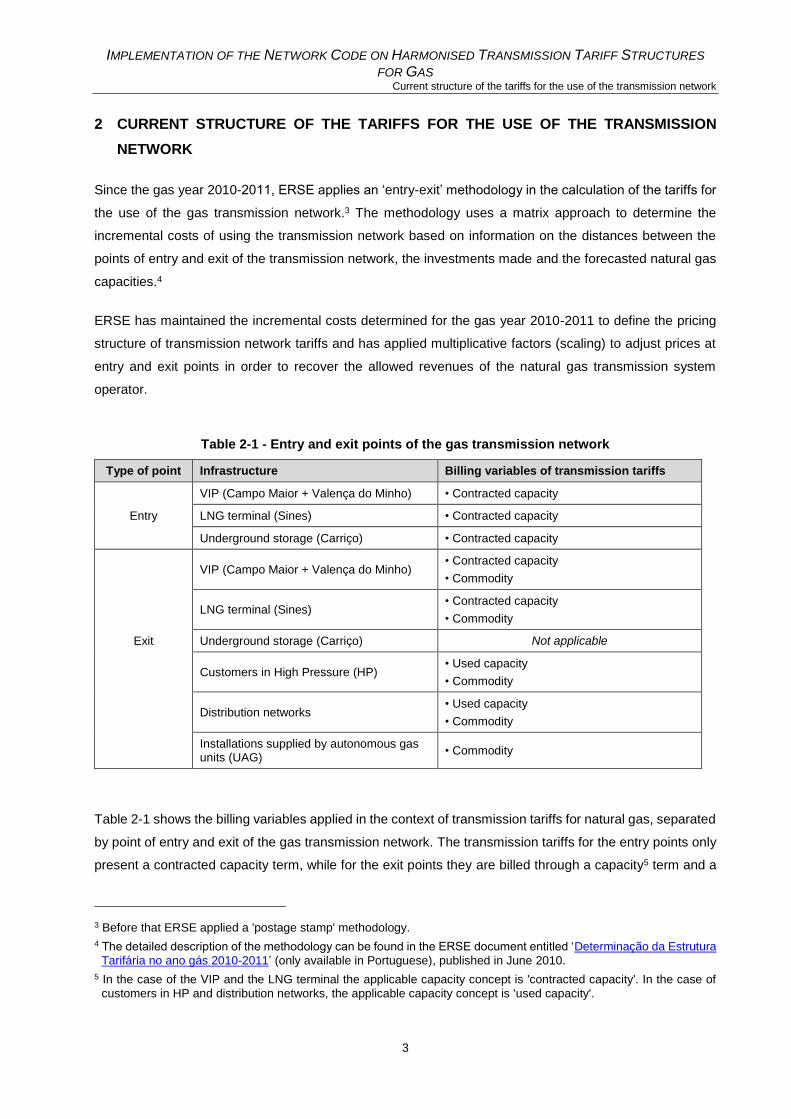
2 CURRENT STRUCTURE OF THE TARIFFS FOR THE USE OF THE TRANSMISSION
NETWORK
Since the gas year 2010-2011, ERSE applies an ‘entry-exit’ methodology in the calculation of the tariffs for
the use of the gas transmission network.3 The methodology uses a matrix approach to determine the
incremental costs of using the transmission network based on information on the distances between the
points of entry and exit of the transmission network, the investments made and the forecasted natural gas
capacities.4
ERSE has maintained the incremental costs determined for the gas year 2010-2011 to define the pricing
structure of transmission network tariffs and has applied multiplicative factors (scaling) to adjust prices at
entry and exit points in order to recover the allowed revenues of the natural gas transmission system
operator.
Table 2-1 - Entry and exit points of the gas transmission network
Type of point Infrastructure Billing variables of transmission tariffs
VIP (Campo Maior + Valença do Minho) • Contracted capacity
Entry LNG terminal (Sines) • Contracted capacity
Underground storage (Carriço) • Contracted capacity
VIP (Campo Maior + Valença do Minho) • Contracted capacity
• Commodity
LNG terminal (Sines) • Contracted capacity
• Commodity
Exit Underground storage (Carriço) Not applicable
Customers in High Pressure (HP) • Used capacity
• Commodity
Distribution networks • Used capacity
• Commodity
Installations supplied by autonomous gas units (UAG)
• Commodity
Table 2-1 shows the billing variables applied in the context of transmission tariffs for natural gas, separated
by point of entry and exit of the gas transmission network. The transmission tariffs for the entry points only
present a contracted capacity term, while for the exit points they are billed through a capacity5 term and a
3 Before that ERSE applied a 'postage stamp' methodology.
4 The detailed description of the methodology can be found in the ERSE document entitled ‘Determinação da Estrutura
Tarifária no ano gás 2010-2011’ (only available in Portuguese), published in June 2010.
5 In the case of the VIP and the LNG terminal the applicable capacity concept is 'contracted capacity'. In the case of
customers in HP and distribution networks, the applicable capacity concept is 'used capacity'.
IMPLEMENTATION OF THE NETWORK CODE ON HARMONISED TRANSMISSION TARIFF STRUCTURES
FOR GAS Current structure of the tariffs for the use of the transmission network
4
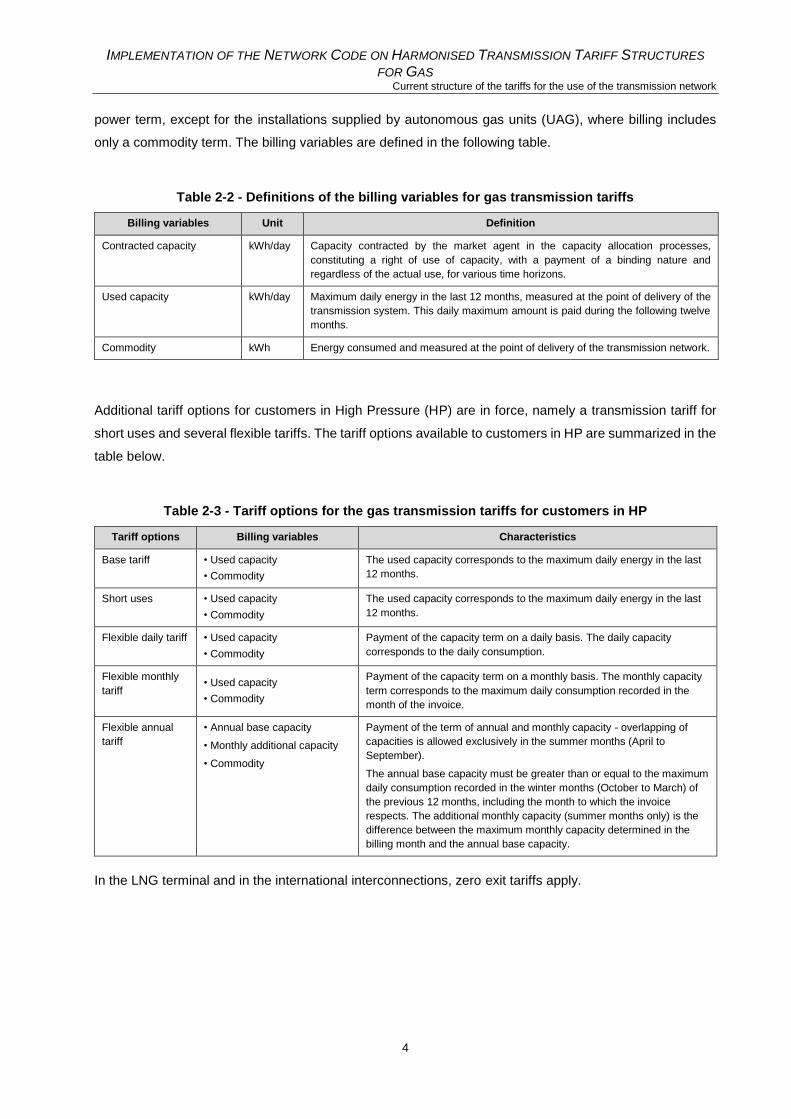
power term, except for the installations supplied by autonomous gas units (UAG), where billing includes
only a commodity term. The billing variables are defined in the following table.
Table 2-2 - Definitions of the billing variables for gas transmission tariffs
Billing variables Unit Definition
Contracted capacity kWh/day Capacity contracted by the market agent in the capacity allocation processes,
constituting a right of use of capacity, with a payment of a binding nature and
regardless of the actual use, for various time horizons.
Used capacity kWh/day Maximum daily energy in the last 12 months, measured at the point of delivery of the
transmission system. This daily maximum amount is paid during the following twelve
months.
Commodity kWh Energy consumed and measured at the point of delivery of the transmission network.
Additional tariff options for customers in High Pressure (HP) are in force, namely a transmission tariff for
short uses and several flexible tariffs. The tariff options available to customers in HP are summarized in the
table below.
Table 2-3 - Tariff options for the gas transmission tariffs for customers in HP
Tariff options Billing variables Characteristics
Base tariff • Used capacity
• Commodity
The used capacity corresponds to the maximum daily energy in the last
12 months.
Short uses • Used capacity
• Commodity
The used capacity corresponds to the maximum daily energy in the last
12 months.
Flexible daily tariff • Used capacity
• Commodity
Payment of the capacity term on a daily basis. The daily capacity
corresponds to the daily consumption.
Flexible monthly
tariff • Used capacity
• Commodity
Payment of the capacity term on a monthly basis. The monthly capacity
term corresponds to the maximum daily consumption recorded in the
month of the invoice.
Flexible annual
tariff
• Annual base capacity
• Monthly additional capacity
• Commodity
Payment of the term of annual and monthly capacity - overlapping of
capacities is allowed exclusively in the summer months (April to
September).
The annual base capacity must be greater than or equal to the maximum
daily consumption recorded in the winter months (October to March) of
the previous 12 months, including the month to which the invoice
respects. The additional monthly capacity (summer months only) is the
difference between the maximum monthly capacity determined in the
billing month and the annual base capacity.
In the LNG terminal and in the international interconnections, zero exit tariffs apply.
IMPLEMENTATION OF THE NETWORK CODE ON HARMONISED TRANSMISSION TARIFF STRUCTURES
FOR GAS Reference price methodology
5
3 REFERENCE PRICE METHODOLOGY
This section is intended to comply with Article 26(1)(a) of the gas tariff network code.
The Regulation provides for regular public consultations on the reference price methodology, which is
defined as the methodology applied to the part of transmission service revenue to be recovered through
capacity-based transmission tariffs.
According to Article 3 of the gas tariff network code, the 'reference price' is a “price for a capacity product
for firm capacity with a duration of one year, which is applicable at entry and exit points and which is used
to set capacity-based transmission tariffs". The 'reference price methodology' is intended to determine the
reference prices for the various points of entry and exit.
3.1 DESCRIPTION OF THE NATIONAL TRANSMISSION NETWORK
This section briefly describes the national gas transmission network, namely to understand the simplified
transmission network diagram that is adopted for the application of the reference price methodology.
The national natural gas transmission network, shown in Figure 3-1, consists of two axes: a north-south
axis connecting the interconnection point at Valença do Minho and the LNG terminal in Sines, and an east-
west axis, which connects the interconnection point in Campo Maior with the west coast, passing close to
the underground storage in Carriço. In 2013 the connection between two sections ending in Mangualde
and Guarda was completed, resulting in a circular section linking these two points.
The national natural gas transmission network currently has a length of 1 375 km, has transmission pipeline
diameters between 150 and 800 mm and includes 85 gas regulation and metering stations (GRMS) at the
delivery points.6
6 Data referring to the end of 2016, presented in the Ten Year Network Development Plan of the National Gas
Transmission Network, Storage Infrastructures and LNG Terminals for the period 2018-2027.

IMPLEMENTATION OF THE NETWORK CODE ON HARMONISED TRANSMISSION TARIFF STRUCTURES
FOR GAS Reference price methodology
6
Figure 3-1 - National transmission network for natural gas
Source: Based on the map of the transmission network by ‘REN Gasodutos’.

IMPLEMENTATION OF THE NETWORK CODE ON HARMONISED TRANSMISSION TARIFF STRUCTURES
FOR GAS Reference price methodology
7
The following figure shows the simplified national transmission network diagram used in the reference price
methodology to determine the distances between entry points and exit points.7
Figure 3-2 - Simplified diagram of the gas transmission network
The national gas transmission network includes four entry points, namely two interconnection points with
Spain (Campo Maior and Valença do Minho), the LNG terminal at Sines and the underground storage at
Carriço. These four entry points are also considered as exit points of the transmission network. In the case
of the interconnections and the underground storage, the infrastructure is effectively bidirectional, allowing
gas to flow in both directions. In the case of the LNG terminal, although the flow of natural gas is
7 It should be noted that this diagram represents an update of the simplified network diagram presented in the document “Natural Gas Transmission Tariffs Summary - Portugal 2018-2019”, published in June 2018 and made available on
the ERSE website.

IMPLEMENTATION OF THE NETWORK CODE ON HARMONISED TRANSMISSION TARIFF STRUCTURES
FOR GAS Reference price methodology
8
unidirectional, consubstantiating an entry point of the transmission network, the agents can, through a
contract, place gas in the terminal by reducing the physical flow of gas leaving the terminal, implying that
this facility is also considered as an exit point.
The remaining exit points of the transmission network, represented by the gas regulation and metering
stations at the delivery points, were grouped into a total of seven exit zones, and are indicated by the letters
E to K in Figure 3-2. The distances to these exit zones were determined by taking the most significant point
within each group as the reference point.
3.2 REFERENCE PRICE METHODOLOGY
The reference price methodology proposed in this public consultation will be referred to as the modified
capacity-weighted distance (modified CWD)8 methodology and uses the forecasted natural gas
capacities, the distances between the relevant points and the unit costs of the transmission system as
allocation factors to define the tariffs for the use of the transmission network. The methodology’s
designation reflects its proximity to the capacity-weighted distance (CWD) methodology, defined in Article
8 of the gas tariff network code, whose application is optional, but integrates in addition the unit costs of
the network sections.
The table below summarizes the main features of the modified CWD methodology. The methodology now
proposed adopts from the current methodology the perspective of unit costs for the various sections that
connect the entry points to the exit points of the transmission network. However, the present methodology
proposal introduces some simplifications that approximate it to the methodology defined in the gas tariff
network code, called the capacity-weighted distance methodology.
8 The acronym 'CWD' stands for the abbreviation of the capacity-weighted distance methodology defined in Article 8 of
the tariff network code.

IMPLEMENTATION OF THE NETWORK CODE ON HARMONISED TRANSMISSION TARIFF STRUCTURES
FOR GAS Reference price methodology
9
Table 3-1 - Summary of the reference price methodology
Methodology Modified capacity-weighted distance (modified CWD) methodology
Allocation factors Distance, capacity, cost of transmission network
Parameters Distance: matrix of distances between points of entry and exit.
Capacity: capacities contracted/used at points of entry and exit.
Cost of transmission network: CAPEX in transmission network.
Entry-exit split.
Other parameters are also used for reconciliation with the allowed revenues for the
transmission system operator, namely the detailed demand forecast, tariff options
applicable to exits to domestic consumption and the discounts provided for in Article 9 of
the gas tariff network code.
Steps 1. Determination of the cost matrix
– Distribution of costs taking into account the allocation factors.
2. Calculation of reference prices (pre-adjustment)
– Calculation of the pre-adjustment reference prices for the entry and exit points based
on the cost matrix and the 'entry-exit' split, together with price equalization in the
domestic exit points and at the VIP.
3. Calculation of reference prices (post-adjustment)
– Calculation of the post-adjustment reference prices by applying the discounts of
Article 9 and ensuring reconciliation with the allowed revenue.
Additional note The reference price methodology results in zero prices for the points whose use does not
entail costs for the system (for example, where the use is predominantly in reverse flow).
The choice of this new reference price methodology allows combining the virtues of the matrix model
currently in force and of the capacity-weighted distance methodology provided in the gas tariff network
code. On the side of the model currently in force, the inclusion of the concept of unit costs allows reflection
in the transmission tariffs of the costs of capacity for the use of the transmission network. In particular it is
possible to reflect the fact that for some network segments with permanent flows always in the same
direction, the contracting of capacity in reverse flow does not represent an additional cost for the network.
On the side of the capacity-weighted distance methodology, to be considered as a comparison term under
the terms of the gas tariff network code, the new methodology uses a weighted average of the capacities
and distances to allocate the allowed revenues at the points of entry and exit of the transmission network.
Compared to the current methodology, the modified CWD methodology is based on greater simplicity and
promotes transparency for the stakeholders of the sector. This simplicity is justified by the structure of the
natural gas transmission network in Portugal, which is less complex compared to transmission networks in
other countries. The decision to adopt a simpler model is also explained by the need to preserve the tariff
uniformity at the exit points to customers and distribution networks, a principle foreseen in the general legal
IMPLEMENTATION OF THE NETWORK CODE ON HARMONISED TRANSMISSION TARIFF STRUCTURES
FOR GAS Reference price methodology
10
framework9 and in the national tariff code of the natural gas sector, which limits the advantages of adopting
more complex methodologies.
The gas tariff network code indicates in Article 6(4) the possibility of introducing price adjustments after the
application of the reference price methodology. The allowable adjustments to the methodology of the
reference price are the discounts10 indicated in Article 9, adjustments based on criteria of price
competitiveness, the equalization of prices in points belonging to a homogeneous group of points and the
scaling of prices by multiplicative or additive factors. The reference price methodology proposed by ERSE
applies all these adjustments, except for the adjustment based on competitiveness criteria. In particular,
discounts are applied under Article 9 of the gas tariff network code at the entry point to and exit point from
the underground storage, as presented in chapter 7 of this document.
In the reference price methodology, the first stage corresponds to the construction of the cost matrix, which
weights the different allocation factors, namely the distances, contracted and used capacities at the relevant
points and the unit investment costs. Subsequently, the adjustments referred to in the second and third
stages are applied (see Table 3-1). The second step incorporates the adjustment of the reference price
equalization to points belonging to a homogeneous group of points.11 The price equalization applied results
in a single price for the virtual interconnection point (VIP), by grouping the two interconnection points with
Spain, and in a single price at the points of exit to customers (customers in HP and distribution networks).
The equalization of prices at exit points to customers results from the tariff uniformity principle already
mentioned. In the third step, Article 9 discounts and multiplicative scaling of prices at entry points and exit
points are included to recover allowed revenues taking into account the forecasted capacity levels.
The entry-exit split is an important parameter, since it determines the proportion of revenue to be recovered
at the entry and exit points. As a result of the evaluation of the investments in the national transmission
network, it is considered that the entry-exit split should be 40%-60%, meaning the proportion of
transmission service revenues to be recovered from capacity-based transmission tariffs at all points of entry
should be 40%, with the remaining 60% to be recovered at all exit points. Table 3-2 compares the proposed
value in the scope of this public consultation with the present tariff division for the gas year 2018-2019.
9 Decree-Law no. 30/2006, of February 15, in the wording of Decree-Law no. 230/2012, of October 26, establishes in Article 55 that the calculation and setting of regulated tariffs obey the principle of tariff uniformity, so that the tariff system applies universally to all customers.
10 Article 9 discounts shall apply at entry points from and exit points to storage facilities and at entry points from LNG facilities and infrastructure ending isolation of Member States.
11 Article 6(4)(b).

IMPLEMENTATION OF THE NETWORK CODE ON HARMONISED TRANSMISSION TARIFF STRUCTURES
FOR GAS Reference price methodology
11
Table 3-2 - Entry-exit split for capacity-based tariffs
It should be emphasized that up to now the entry-exit split was not an exogenous parameter imposed on
the tariff model, but it was endogenous to the methodology used and the revenue reconciliation processes
applied over time.12 For the new methodology it is proposed to impose an entry-exit split that must be
preserved.
The entry-exit split of 40%-60% was determined based on investments in the national transmission network
since 1997, at current values, divided into central pipelines, connections to end-users and GRMS. In this
context, it was considered that the central pipelines are used equally by the points of entry and exit, resulting
in proportions of 50%-50% to allocate these costs to the points of entry and exit, respectively. In relation to
connections to end-users and GRMS, it is considered that these investments must be exclusively allocated
to the exit points, which results in proportions of 0%-100% for the entry-exit points. The series of investment,
since 1997, for these two sets of investments results therefore in an entry-exit split of 40%-60%.
A more detailed description of the reference price methodology can be found in the supporting document
"Annex - Comparison of Reference Price Methodologies". That document presents three methodologies,
namely: (i) modified CWD methodology proposed in this public consultation, representing the reference
price methodology to be adopted using forecasted gas capacities, the distances between points of entry
and exit and unit costs of the transmission network; (ii) capacity-weighted distance methodology as
established in Article 8 of the gas tariff network code to be presented for comparison purposes; and (iii)
matrix methodology used to define the current transmission tariff structure.13 The results obtained with
these three methodologies are compared and discussed in the supporting document.
3.3 INDICATIVE REFERENCE PRICES
This section presents the indicative reference prices of the new reference price methodology. These prices
are based on the values set in the tariffs for the gas year 2018-2019 as the best estimate for the gas year
12 For example, the ERSE document ‘Determinação da Estrutura Tarifária no ano gás 2010-2011’ (only available in Portuguese), published in June 2010, showed that the optimization model pointed to an entry-exit split of total
revenues of 44% at entry points and 56% at exit points. These values resulted endogenously from the model.
13 The detailed description of the matrix methodology is found in the ERSE document entitled ‘Determinação da
Estrutura Tarifária no ano gás 2010-2011’, published in June 2010.
Entry-exit
Tariffs for gas year 2018-2019 27% - 73%
Proposal for the entry-exit split 40% - 60%

IMPLEMENTATION OF THE NETWORK CODE ON HARMONISED TRANSMISSION TARIFF STRUCTURES
FOR GAS Reference price methodology
12
2019-2020, namely in terms of allowed revenues and quantities forecasted for the various capacity
products.
These figures already include the application of discounts to the prices of storage facilities14 (Article 9(1)),
the equalization of prices at points belonging to a homogeneous group of points (Article 6(4)(b)) and
multiplicative scaling by a constant (Article 6(4)(c)) in order to recover the allowed revenue.
Figure 3-3 - Indicative reference prices
Chapter 6 presents all tariffs for the use of the transmission network, namely the different tariff options
applied to customers connected directly to the transmission network in High Pressure.
It is recalled that a zero price at the exit point of the VIP reflects the fact that the interconnection points in
the direction Portugal-Spain are used predominantly in reverse flow15, reason why their use does not
represent a cost for the gas transmission network. In fact, any contracting of capacity in the Portugal-Spain
direction, as it is satisfied by reduction of the physical flow in the Spain-Portugal direction, does not give
rise to capacity costs in the transmission network. Likewise, the contracting of transmission network
capacity for underground storage in backpressure is conditioned by the capacity of the underground storage
compressors (active restriction) and not by the exit capacity of the transmission network.16 The reference
price methodology adopted, incorporating the unit cost function in its analysis, allows integration of this
economic dimension into the entry-exit tariffs, of particular relevance for the promotion of an efficient use
14 The 95% discounts applied to the entry points from and exit points to storage facilities are presented in section 7.3.
15 Historically, there have been no physical gas flows in the Portugal-Spain direction.
16 In fact, since the latter is much higher than the capacity of the compressors, an incremental cost of zero capacity at the exit of the transmission network is justified (the underground storage compressors are not an asset of the national
transmission network).
0,1850
0,1722
0,0046
0,0000
0,0000
0,0000
0,1720
VIP
LNG terminal
Storage
VIP
LNG terminal
Storage
Domestic exits
Entr
y p
oin
tsEx
it p
oin
ts
€ / (kWh/day) per year
IMPLEMENTATION OF THE NETWORK CODE ON HARMONISED TRANSMISSION TARIFF STRUCTURES
FOR GAS Reference price methodology
13
of the transmission network. The following two figures illustrate the reverse flow situation in the VIP and
backpressure in the underground storage.
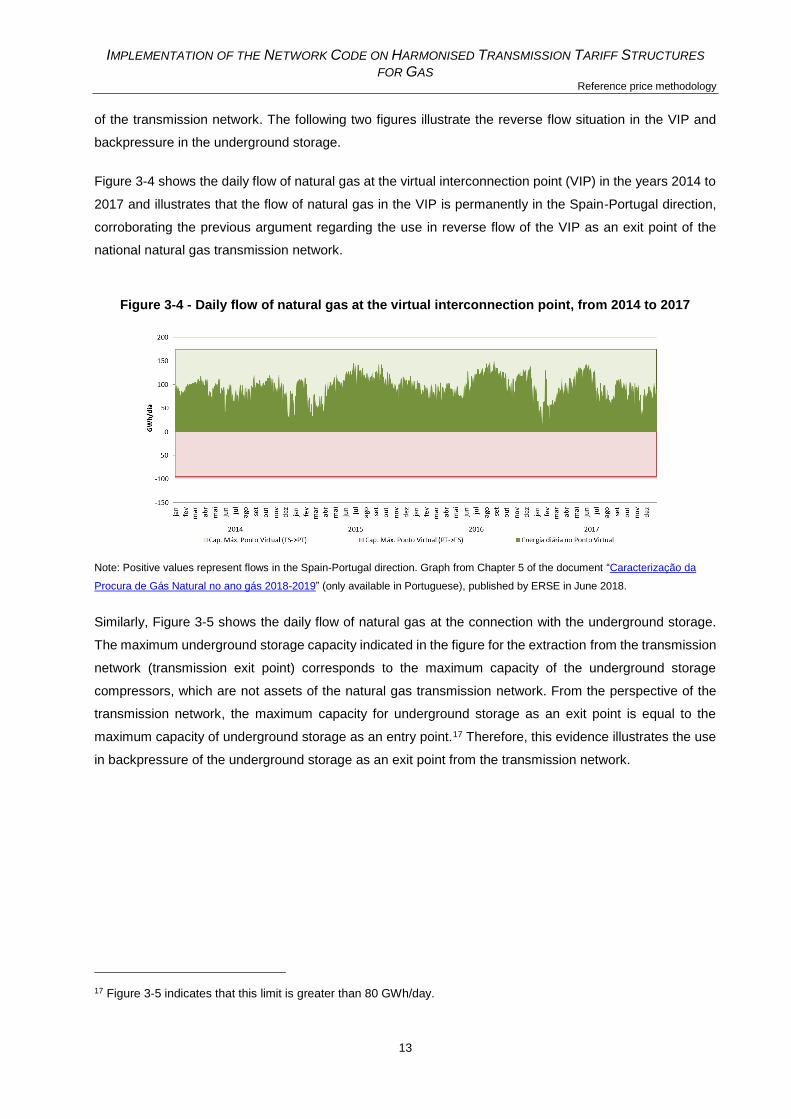
Figure 3-4 shows the daily flow of natural gas at the virtual interconnection point (VIP) in the years 2014 to
2017 and illustrates that the flow of natural gas in the VIP is permanently in the Spain-Portugal direction,
corroborating the previous argument regarding the use in reverse flow of the VIP as an exit point of the
national natural gas transmission network.
Figure 3-4 - Daily flow of natural gas at the virtual interconnection point, from 2014 to 2017
Note: Positive values represent flows in the Spain-Portugal direction. Graph from Chapter 5 of the document “Caracterização da
Procura de Gás Natural no ano gás 2018-2019” (only available in Portuguese), published by ERSE in June 2018.
Similarly, Figure 3-5 shows the daily flow of natural gas at the connection with the underground storage.
The maximum underground storage capacity indicated in the figure for the extraction from the transmission
network (transmission exit point) corresponds to the maximum capacity of the underground storage
compressors, which are not assets of the natural gas transmission network. From the perspective of the
transmission network, the maximum capacity for underground storage as an exit point is equal to the
maximum capacity of underground storage as an entry point.17 Therefore, this evidence illustrates the use
in backpressure of the underground storage as an exit point from the transmission network.
17 Figure 3-5 indicates that this limit is greater than 80 GWh/day.

IMPLEMENTATION OF THE NETWORK CODE ON HARMONISED TRANSMISSION TARIFF STRUCTURES
FOR GAS Reference price methodology
14
Figure 3-5 - Daily natural gas flow from and to the underground storage, from 2014 to 2017
Note: Positive values represent flows entering the transmission network from the underground storage. Chart of Chapter 5 of the
document “Caracterização da Procura de Gás Natural no ano gás 2018-2019” (only available in Portuguese), published by ERSE in
June 2018.
3.4 COST ALLOCATION ASSESSMENTS
According to Article 5 of the gas tariff network code, two cost allocation assessments must be carried out,
in particular to assess whether there is cross-subsidization between the use of the network at a cross-
system level (transit of natural gas crossing the country) and at an intra-system level (flows of natural gas
that are destined for domestic consumption).
Article 5 requires the calculation of two indicators, one for revenue from capacity-based tariffs and another
for commodity-based tariffs, to assess whether the recovery of revenue from cross-system and intra-system
uses is proportional to the cost drivers. The indicator for the presence of cross-subsidization varies between
0% and 200%, where 0% indicates the absence of cross-subsidization and 200% indicates the situation of
maximum cross-subsidization. Article 5(6) states that in the case of indicators exceeding 10%, the national
regulatory authority shall justify those results in its final decision referred to in Article 27(4).
Given the predictions of no contracted capacity at the exit point to the VIP, there is no forecast for the
occurrence of cross-border flows in the national gas transmission network. The cost allocation evaluations
produced the following results18:
18 In the absence of a cross-system use, the cost allocation comparison index (CACI) results in a mathematical impossibility (division by zero). For these situations, it is considered that the CACI should be zero, since cross-
subsidization cannot exist.
-60
-40
-20
0
20
40
60
80
100
jan
fev
mar
abr
mai
jun jul
ago
set
ou
t
no
v
dez jan
fev
mar
abr
mai
jun jul
ago
set
ou
t
no
v
dez jan
fev
mar
abr
mai
jun jul
ago
set
ou
t
no
v
dez jan
fev
mar
abr
mai
jun jul
ago
set
ou
t
no
v
dez
2014 2015 2016 2017
GW
h/d
ia
Cap. máx. AS (injeção na RNT) Entradas na RNT Cap. máx. AS (extracção da RNT) Saídas da RNT

IMPLEMENTATION OF THE NETWORK CODE ON HARMONISED TRANSMISSION TARIFF STRUCTURES
FOR GAS Reference price methodology
15
The capacity cost allocation comparison index results in a value of 0%, which does not exceed the
indicative value of 10%.
The commodity cost allocation comparison index results in a value of 0%, which does not exceed
the indicative value of 10%.
Chapter 9 presents the detailed calculations for the cost allocation assessments, including the results for a
second scenario with a cross-system use of the transmission network.
3.5 EVALUATION OF THE PROPOSED REFERENCE PRICE METHODOLOGY
This section assesses whether the new reference price methodology to be applied in the calculation of
tariffs for use of the transmission network in Portugal complies with the requirements of Article 7 of the gas
tariff network code and Article 13 of EC Regulation 715/2009.
According to Article 7 of the gas tariff network code, a set of requirements must be respected, namely: (i)
allow network users to reproduce the calculation of reference prices; (ii) take into account the actual costs
of the service (in view of the complexity of the transmission network); (iii) ensure non-discrimination and
avoid cross-subsidization; (iv) avoid risk assignment of gas transits to final consumers; and (v) ensure that
reference prices promote cross-border trade.
Pursuant to Article 13 of EC Regulation 715/2009, which refers to tariffs for access to networks in the natural
gas sector, i.e. tariffs for the use of the transmission system, tariffs (or the methodology for calculating
them): should be "transparent, take into account the need for system integrity and its improvement and
reflect the actual costs incurred"; should be "applied in a non-discriminatory manner"; "shall facilitate
efficient gas trade and competition, while at the same time avoiding cross-subsidies between network users
and providing incentives for investment and maintaining or creating interoperability for transmission
networks"; and "shall neither restrict market liquidity nor distort trade across borders".
In ERSE's understanding, the reference price methodology proposed in this public consultation meets the
requirements above. On the one hand, the reference price methodology is sufficiently simple and well-
documented to be transparent, allowing for calculation reproduction by the users of the national natural gas
transmission network. On the other hand, the methodology includes the main allocation factors in the use
of the transmission network, as well as the distances between the relevant points in the network, the natural
gas capacities in the points of entry and exit, as well as the unit costs of the network.
Finally, the resulting prices promote the efficient use of transmission networks, including the promotion of
cross-border trade. This latter aspect would be strongly compromised with the adoption of the CWD
methodology defined in Article 8 of the gas tariff network code, as a result of the application of a positive
price at the exit point of the VIP.

IMPLEMENTATION OF THE NETWORK CODE ON HARMONISED TRANSMISSION TARIFF STRUCTURES
FOR GAS Reference price methodology
16
3.6 COMPARISON OF THE REFERENCE PRICE METHODOLOGY WITH THE CAPACITY-WEIGHTED
DISTANCE METHODOLOGY
Where the methodology of the reference price differs from the methodology of the capacity-weighted
distance defined in Article 8 of the gas tariff network code, it is obligatory to compare it with the latter.
In this sense, it is important to underline some differences between the reference price methodology
proposed (modified CWD) in this public consultation and the capacity-weighted distance (CWD)
methodology. Firstly, the modified CWD methodology allows the identification of reverse flow scenarios, as
these situations do not contribute to the need for network expansion investments, allowing new investments
to be postponed by contributing to a more efficient use of installed assets (for instance, by mitigating
congestion problems at interconnection points). In the CWD methodology, the occurrence of reduced gas
flows, even when they occur in reverse flow, is translated into the application of significant transmission
tariffs, which does not promote an efficient use of the transmission network. Secondly, the proposed
methodology allows inclusion of the cost of the network as a determining factor for the tariff structure, while
the methodology presented in the gas tariff network code only considers distances and contracted
capacities as relevant factors. This feature allows reflection of the structural differences in the cost allocation
that are not captured by the distances between the points in the network or by the gas capacities.19 The
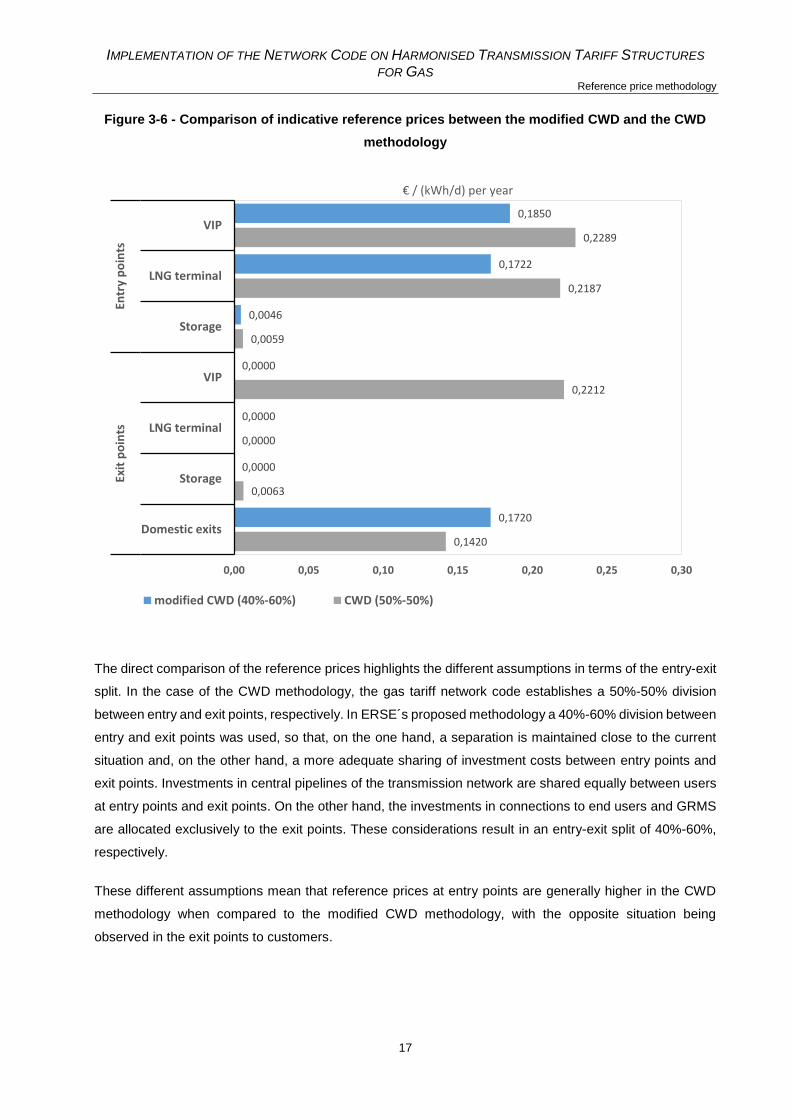
following figure shows the reference prices for the two methodologies.
19 In addition to the reverse flow situation mentioned above, another example of possible application would be transmission networks with subsea pipelines, which entail higher costs (not being the situation in Portugal, this
distinction would be relevant for countries such as the Republic of Ireland).
IMPLEMENTATION OF THE NETWORK CODE ON HARMONISED TRANSMISSION TARIFF STRUCTURES
FOR GAS Reference price methodology
17
Figure 3-6 - Comparison of indicative reference prices between the modified CWD and the CWD
methodology
The direct comparison of the reference prices highlights the different assumptions in terms of the entry-exit
split. In the case of the CWD methodology, the gas tariff network code establishes a 50%-50% division
between entry and exit points, respectively. In ERSE´s proposed methodology a 40%-60% division between
entry and exit points was used, so that, on the one hand, a separation is maintained close to the current
situation and, on the other hand, a more adequate sharing of investment costs between entry points and
exit points. Investments in central pipelines of the transmission network are shared equally between users
at entry points and exit points. On the other hand, the investments in connections to end users and GRMS
are allocated exclusively to the exit points. These considerations result in an entry-exit split of 40%-60%,
respectively.
These different assumptions mean that reference prices at entry points are generally higher in the CWD
methodology when compared to the modified CWD methodology, with the opposite situation being
observed in the exit points to customers.
0,1850
0,1722
0,0046
0,0000
0,0000
0,0000
0,1720
0,2289
0,2187
0,0059
0,2212
0,0000
0,0063
0,1420
0,00 0,05 0,10 0,15 0,20 0,25 0,30
VIP
LNG terminal
Storage
VIP
LNG terminal
Storage
Domestic exits
Entr
y p
oin
tsEx
it p
oin
ts
€ / (kWh/d) per year
modified CWD (40%-60%) CWD (50%-50%)
IMPLEMENTATION OF THE NETWORK CODE ON HARMONISED TRANSMISSION TARIFF STRUCTURES
FOR GAS Reference price methodology
18
Regarding the remaining prices at the exit points, namely at the VIP and the underground storage, the CWD
methodology sets positive prices in both points, while in the modified CWD methodology, zero prices exist
in these two exits. This last result derives directly from the assumptions used in the modified CWD
methodology, namely the consideration of zero capacity unit costs in the gas flows towards the exit point
to the VIP.20 This option promotes economic efficiency in the transmission network, inasmuch as the
contracting of capacity for these exits is carried out permanently against the gas flow, being satisfied
through nominations that contribute to the reduction of the dominant flow in the Spain-Portugal direction
and, consequently, dispensing with the need for new investments, a situation that justifies the adoption of
zero exit prices.
A similar situation applies at the exit point to the underground storage. Since underground storage is carried
out in backpressure (pressure in the transmission network is lower than the underground storage pressure)
a capacity limitation is imposed by the underground storage compression facilities and not by the capacity
of the transmission exit point. For these reasons, the modified CWD methodology considers a zero unit
cost at the exit point to the underground storage. An opposite situation is observed at the entry point from
the underground storage. In this case, as the unloading of underground storage is carried out in favor of
the pressure profile, it is considered that the capacity restriction is imposed by the transmission network.
Thus, a unit cost value is adopted for the entry point from the underground storage, identical to that of the
other exit points and entry points.
3.7 CONSULTATION QUESTIONS
Question 1 – Given the reference price methodology presented in section 3.2, do you consider that this
methodology is adequate to properly reflect the costs of the natural gas transmission network?
Question 2 – Considering the results of the cost allocation assessments in section 3.4, do you consider
that the allocation of costs between cross-system (cross-border) flows and intra-system flows (for domestic
exits) is appropriate?
Question 3 – Based on the analysis presented in section 3.5, do you consider that the reference price
methodology meets the requirements of Article 7 of the gas tariff network code and Article 13 of EC
Regulation 715/2009?
Question 4 – Given the comparison of the results of the reference price methodologies in section 3.6, how
do you evaluate the adequacy of each methodology for determining reference prices for the natural gas
transmission network in Portugal?
20 See summary of the modified CWD methodology in Table 3-1.
IMPLEMENTATION OF THE NETWORK CODE ON HARMONISED TRANSMISSION TARIFF STRUCTURES
FOR GAS Revenue structure of the transmission system operator
19
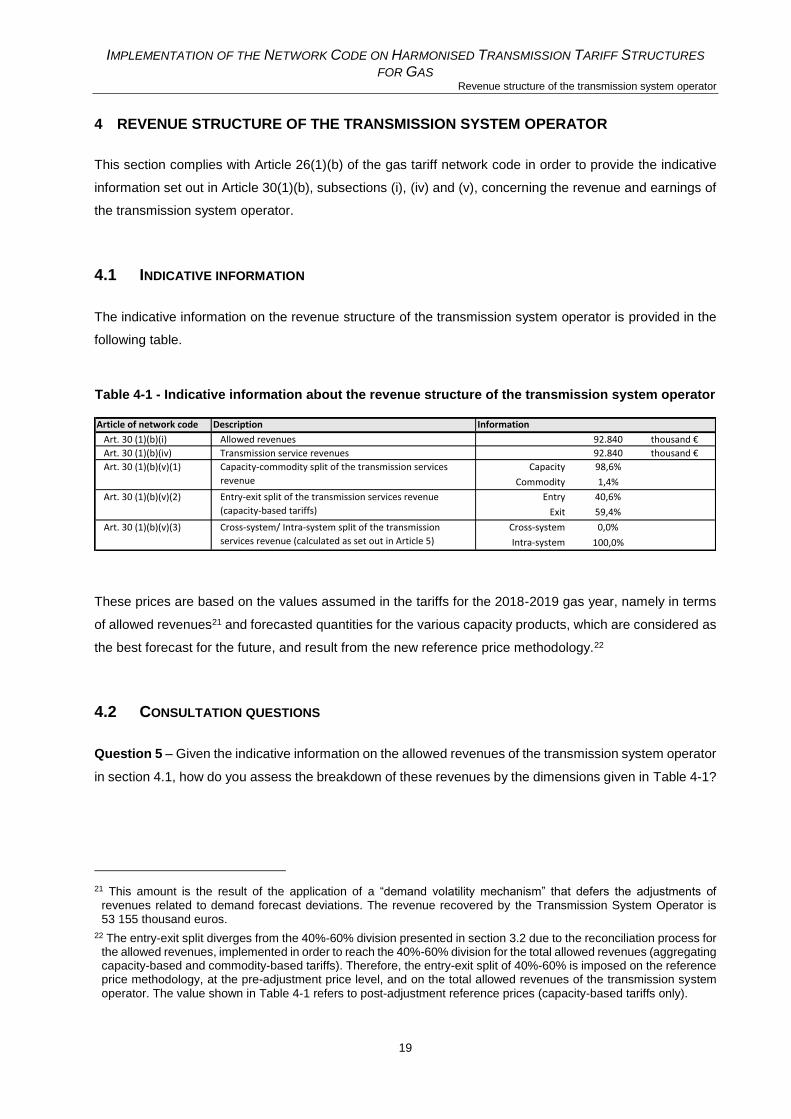
4 REVENUE STRUCTURE OF THE TRANSMISSION SYSTEM OPERATOR
This section complies with Article 26(1)(b) of the gas tariff network code in order to provide the indicative
information set out in Article 30(1)(b), subsections (i), (iv) and (v), concerning the revenue and earnings of
the transmission system operator.
4.1 INDICATIVE INFORMATION
The indicative information on the revenue structure of the transmission system operator is provided in the
following table.
Table 4-1 - Indicative information about the revenue structure of the transmission system operator
These prices are based on the values assumed in the tariffs for the 2018-2019 gas year, namely in terms
of allowed revenues21 and forecasted quantities for the various capacity products, which are considered as
the best forecast for the future, and result from the new reference price methodology.22
4.2 CONSULTATION QUESTIONS
Question 5 – Given the indicative information on the allowed revenues of the transmission system operator
in section 4.1, how do you assess the breakdown of these revenues by the dimensions given in Table 4-1?
21 This amount is the result of the application of a “demand volatility mechanism” that defers the adjustments of revenues related to demand forecast deviations. The revenue recovered by the Transmission System Operator is 53 155 thousand euros.
22 The entry-exit split diverges from the 40%-60% division presented in section 3.2 due to the reconciliation process for the allowed revenues, implemented in order to reach the 40%-60% division for the total allowed revenues (aggregating capacity-based and commodity-based tariffs). Therefore, the entry-exit split of 40%-60% is imposed on the reference price methodology, at the pre-adjustment price level, and on the total allowed revenues of the transmission system
operator. The value shown in Table 4-1 refers to post-adjustment reference prices (capacity-based tariffs only).
Article of network code Description Information
Art. 30 (1)(b)(i) Allowed revenues 92.840 thousand €
Art. 30 (1)(b)(iv) Transmission service revenues 92.840 thousand €
Art. 30 (1)(b)(v)(1) Capacity 98,6%
Commodity 1,4%
Art. 30 (1)(b)(v)(2) Entry 40,6%
Exit 59,4%
Art. 30 (1)(b)(v)(3) Cross-system 0,0%
Intra-system 100,0%
Entry-exit split of the transmission services revenue
(capacity-based tariffs)
Cross-system/ Intra-system split of the transmission
services revenue (calculated as set out in Article 5)
Capacity-commodity split of the transmission services
revenue

IMPLEMENTATION OF THE NETWORK CODE ON HARMONISED TRANSMISSION TARIFF STRUCTURES
FOR GAS Commodity-based transmission tariffs
21
5 COMMODITY-BASED TRANSMISSION TARIFFS
This section complies with Article 26(1)(c) of the gas tariff network code for commodity-based tariffs.
Article 4(3) states that revenue from transmission services must be recovered through capacity-based
transmission tariffs but that, on an exceptional basis, they can be recovered through commodity-based
transmission tariffs. The same number foresees the existence of two different modalities, namely a (i) flow-
based charge and a (ii) complementary revenue recovery charge.
5.1 COMMODITY-BASED TRANSMISSION TARIFFS
ERSE proposes to maintain the presence of commodity-based charges in the tariff structure for the use of
the transmission network, which are classified as a flow-based charge, in the unit €/kWh. This price will
apply only to the exit points of the transmission network, complementing the capacity-based prices at the
various exit points, maintaining commodity-based charges absent from the entry points.
According to Article 4(3)(a), a flow-based charge must meet the following criteria:
a) Levied for the purpose of covering the costs mainly driven by the quantity of the gas flow;
b) Be the same at all entry points and the same at all exit points; and
c) Expressed in monetary terms or in kind.
ERSE proposes to determine the flow-based charge from the OPEX costs in relation to the gas leaving the
national transmission network, determining a marginal cost for the flow-based charge. This marginal cost
measured in €/kWh is determined by the division of OPEX costs, corresponding to 1,4% of the CAPEX, by
the gas quantity delivered at the exit points. This marginal cost, measured in €/kWh, is subject to the
application of the multiplicative scaling for the purposes of recovering the allowed revenues of the
transmission system operator, provided for in Article 6(4)(c), in line with that applicable to the capacity-
based prices. The flow-based charge thus obtained will be applicable to all points of exit, including
interconnection points with Spain, the LNG terminal, underground storage, customers connected in HP and
distribution networks.
The requirement of the network code to apply the same flow-based charge at all exit points resulted in
ERSE's decision to abandon the existence of zero commodity-based prices at the exit points to the VIP and
to the LNG terminal.
It is also worth mentioning two aspects of the tariff structure in Portugal at the exit points to customers
connected to HP that should be analyzed separately, namely the existence of consumption thresholds for
commodity-based charges, applicable in some tariff options, and the tariff option for "short uses".

IMPLEMENTATION OF THE NETWORK CODE ON HARMONISED TRANSMISSION TARIFF STRUCTURES
FOR GAS Commodity-based transmission tariffs
22
With regard to the tariff options with consumption thresholds, these have different commodity-based prices
depending on the annual consumption of the user, differentiating users with an annual consumption of less
than 10 million m3 from users with a consumption equal to or greater than this value. The introduction of
this differentiation represents a necessary regulatory remedy to mitigate problems of discontinuity in the
tariff curve of the transmission tariffs according to the consumption and capacity utilization by each
customer. This remedy identified by various stakeholders as necessary to promote an efficient consumption
of natural gas was approved by ERSE in June 201623 and at that time various consumption thresholds were
introduced at different pressure levels. As a necessary regulatory remedy, ERSE proposes to maintain this
differentiation by consumption thresholds in the cases currently in force.
Regarding the tariff option for "short uses", it is available to customers directly connected to the High
Pressure transmission network and allows greater flexibility to consumers with reduced capacity utilization
values – the ratio between annual consumption and the maximum daily consumption registered in the last
twelve months. In view of the basic tariff option, the "short uses" option has a lower capacity price and a
higher commodity price.
More specifically, in the capacity price, users of this option only support the incremental cost related to the
peripheral sections of the transmission system (used by a small number of customers), while being
exempted from contributing to the central sections (used by most users).24 The commodity-based charge
of the “short uses” tariff option is then determined in order to leave a user with a reduced utilization
(modulation of 90 days) indifferent between the "short uses" option and the basic tariff option.
It should be noted that the tariff option for "short uses" also corresponds to a regulatory remedy aimed at
introducing more flexible capacity products at the exit points, fulfilling a function similar to the short-term
products available at entry points - capacity products for quarterly, monthly and daily horizons with higher
capacity prices compared to the annual capacity product by applying multipliers above the unit. It should
also be noted that the tariff option for "short uses" has the characteristics of an interruptible product, since
the delivery of natural gas under this tariff option is dependent on the absence of congestion in the national
transmission network.
23 The new consumption thresholds were approved for the network tariffs in force as of July 2016. The documents “Tarifas e preços de gás natural para o ano gás 2016-2017 e parâmetros para o período de regulação 2016-2019” and “Estrutura tarifária no ano gás 2016-2017” (both documents are only available in Portuguese) justify the decisions
taken.
24 In the scope of the national transmission network in Portugal, the connections to end-users connected at High Pressure and GRMS are classified as peripheral sections. Taking into account the analysis that led to the entry-exit split of 40%-60%, it can be concluded that at the exit points the common sections (central pipelines) represent a 40% share and that the peripheral sections (connections to end-users and GRMS) the remaining 20%. This determines that the incremental capacity costs to be applied in the "short uses" tariff option should represent one third (= 20% /
60%) of the incremental cost of capacity in the basic tariff option.

IMPLEMENTATION OF THE NETWORK CODE ON HARMONISED TRANSMISSION TARIFF STRUCTURES
FOR GAS Commodity-based transmission tariffs
23
5.2 CONSULTATION QUESTIONS
Question 6 – In view of the justification for commodity-based transmission tariffs in section 5.1, do you
agree with the definition of the flow-based charge applicable at exit points, namely exit points to the VIP
(virtual interconnection point with Spain), to the LNG terminal, to the underground storage, to customers
connected to HP and to distribution networks?
Question 7 – In view of the justification for the application of the two regulatory remedies referred to in
section 5.1, do you agree with maintaining the consumption thresholds and the tariff option for "short uses"?

IMPLEMENTATION OF THE NETWORK CODE ON HARMONISED TRANSMISSION TARIFF STRUCTURES
FOR GAS Additional information on transmission tariffs
25
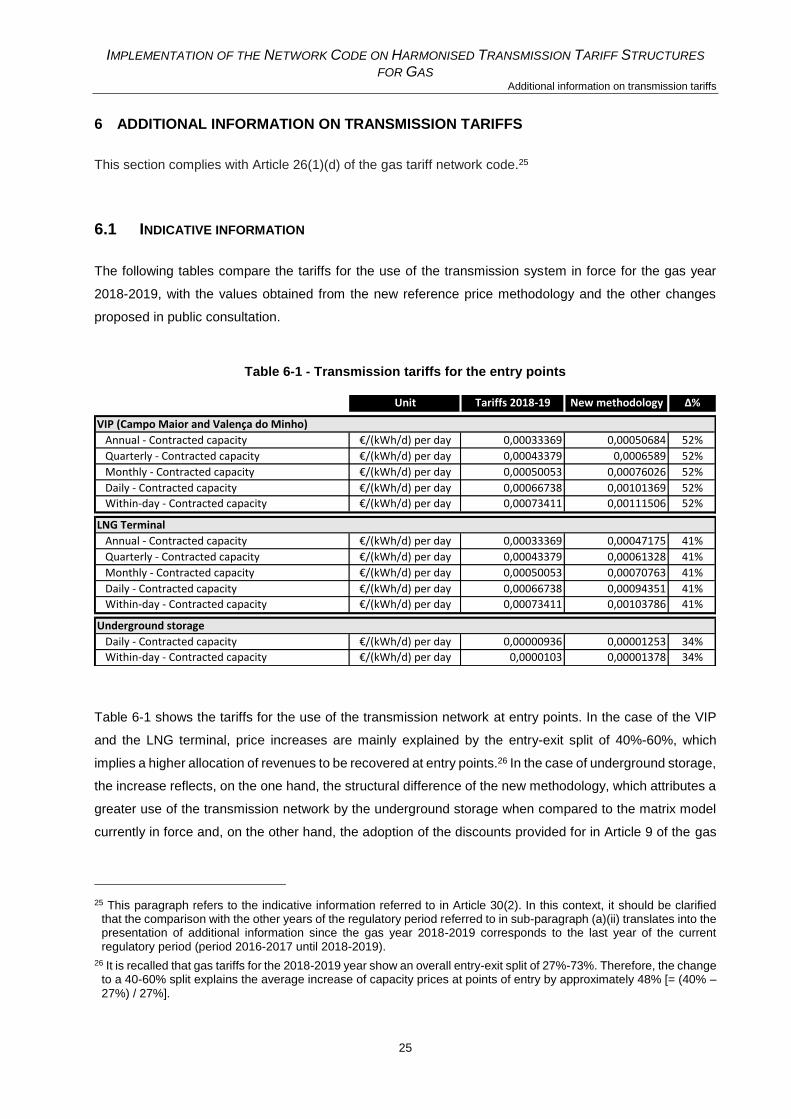
6 ADDITIONAL INFORMATION ON TRANSMISSION TARIFFS
This section complies with Article 26(1)(d) of the gas tariff network code.25
6.1 INDICATIVE INFORMATION
The following tables compare the tariffs for the use of the transmission system in force for the gas year
2018-2019, with the values obtained from the new reference price methodology and the other changes
proposed in public consultation.
Table 6-1 - Transmission tariffs for the entry points
Table 6-1 shows the tariffs for the use of the transmission network at entry points. In the case of the VIP
and the LNG terminal, price increases are mainly explained by the entry-exit split of 40%-60%, which
implies a higher allocation of revenues to be recovered at entry points.26 In the case of underground storage,
the increase reflects, on the one hand, the structural difference of the new methodology, which attributes a
greater use of the transmission network by the underground storage when compared to the matrix model
currently in force and, on the other hand, the adoption of the discounts provided for in Article 9 of the gas
25 This paragraph refers to the indicative information referred to in Article 30(2). In this context, it should be clarified that the comparison with the other years of the regulatory period referred to in sub-paragraph (a)(ii) translates into the presentation of additional information since the gas year 2018-2019 corresponds to the last year of the current regulatory period (period 2016-2017 until 2018-2019).
26 It is recalled that gas tariffs for the 2018-2019 year show an overall entry-exit split of 27%-73%. Therefore, the change to a 40-60% split explains the average increase of capacity prices at points of entry by approximately 48% [= (40% –
27%) / 27%].
Unit Tariffs 2018-19 New methodology Δ%
VIP (Campo Maior and Valença do Minho)
Annual - Contracted capacity €/(kWh/d) per day 0,00033369 0,00050684 52%
Quarterly - Contracted capacity €/(kWh/d) per day 0,00043379 0,0006589 52%
Monthly - Contracted capacity €/(kWh/d) per day 0,00050053 0,00076026 52%
Daily - Contracted capacity €/(kWh/d) per day 0,00066738 0,00101369 52%
Within-day - Contracted capacity €/(kWh/d) per day 0,00073411 0,00111506 52%
LNG Terminal
Annual - Contracted capacity €/(kWh/d) per day 0,00033369 0,00047175 41%
Quarterly - Contracted capacity €/(kWh/d) per day 0,00043379 0,00061328 41%
Monthly - Contracted capacity €/(kWh/d) per day 0,00050053 0,00070763 41%
Daily - Contracted capacity €/(kWh/d) per day 0,00066738 0,00094351 41%
Within-day - Contracted capacity €/(kWh/d) per day 0,00073411 0,00103786 41%
Underground storage
Daily - Contracted capacity €/(kWh/d) per day 0,00000936 0,00001253 34%
Within-day - Contracted capacity €/(kWh/d) per day 0,0000103 0,00001378 34%

IMPLEMENTATION OF THE NETWORK CODE ON HARMONISED TRANSMISSION TARIFF STRUCTURES
FOR GAS Additional information on transmission tariffs
26
tariff network code. However, it should be noted that the entry and exit prices at the underground storage
even without discounts are lower than the prices applicable at the VIP and the LNG terminal, which reflects
the central position that the underground storage occupies, contributing for a more efficient use of the
transmission network.27
Table 6-2 shows the tariffs for the use of the transmission network at exit points, including the different tariff
options applicable to customers connected to HP. In the case of the first part of the table, which relates to
the VIP and the LNG terminal, the zero prices in the capacity-based price are justified by the permanent
use in reverse flow of these infrastructures and consequently the adoption of zero unit costs for capacity.
In addition, as regards the exit point to the underground storage, a zero price is also adopted because the
unit cost of capacity is zero, since the capacity constraint is imposed by the compressors of the underground
storage facility and not by the capacity of the transmission network. Another point to note is the introduction
of a non-zero commodity-based price at the exit points to these infrastructures. This introduction derives
from an imposition of the gas tariff network code which requires that the flow-based charge is equal at all
exit points.28
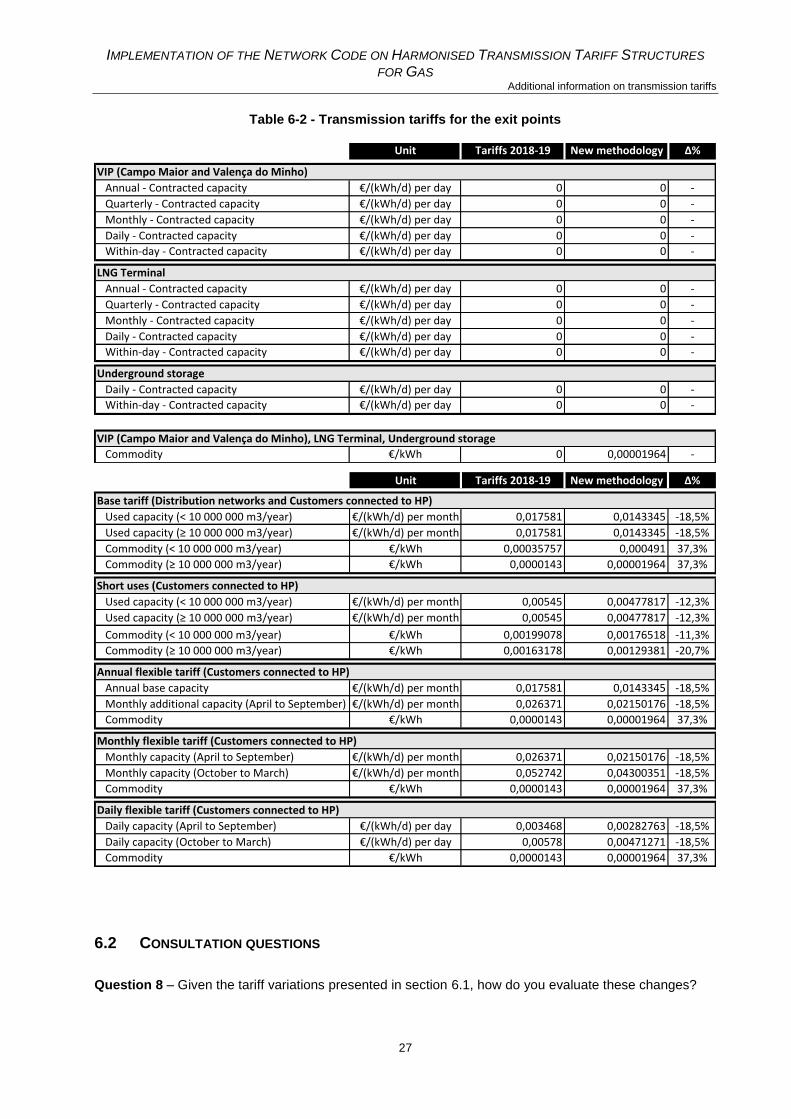
The second part of Table 6-2 shows the tariffs applicable to distribution networks and customers connected
in HP. In this context, there are essentially two developments to be highlighted. On the one hand, there is
a reduction of approximately 18,5% in capacity prices29, due to the change in the entry-exit split, resulting
in lower prices at the points of exit.30 On the other hand, there is an increase in the price of energy, due to
the new approach for determining the flow-based charge.31 Although there are significant percentage
increases in the energy term, it should be pointed out that the energy term represents a reduced weight in
the total amount recovered by the use of the transmission network.
27 The relative difference in the price of underground storage compared to the other entry prices in the methodology proposed by ERSE is relatively close to the relative difference in prices resulting from the CWD methodology.
28 Article 4(3)(a)(ii) of the tariff network code.
29 Except for the "short uses" tariff option, referred to in greater detail in 5.1.
30 The change in the entry-exit split from 27%-73% to 40%-60% explains the average decrease of capacity prices at exit points by approximately 18% [= (73% – 60%)/73% ].
31 See section 5.1.
IMPLEMENTATION OF THE NETWORK CODE ON HARMONISED TRANSMISSION TARIFF STRUCTURES
FOR GAS Additional information on transmission tariffs
27
Table 6-2 - Transmission tariffs for the exit points
6.2 CONSULTATION QUESTIONS
Question 8 – Given the tariff variations presented in section 6.1, how do you evaluate these changes?
Unit Tariffs 2018-19 New methodology Δ%
VIP (Campo Maior and Valença do Minho)
Annual - Contracted capacity €/(kWh/d) per day 0 0 -
Quarterly - Contracted capacity €/(kWh/d) per day 0 0 -
Monthly - Contracted capacity €/(kWh/d) per day 0 0 -
Daily - Contracted capacity €/(kWh/d) per day 0 0 -
Within-day - Contracted capacity €/(kWh/d) per day 0 0 -
LNG Terminal
Annual - Contracted capacity €/(kWh/d) per day 0 0 -
Quarterly - Contracted capacity €/(kWh/d) per day 0 0 -
Monthly - Contracted capacity €/(kWh/d) per day 0 0 -
Daily - Contracted capacity €/(kWh/d) per day 0 0 -
Within-day - Contracted capacity €/(kWh/d) per day 0 0 -
Underground storage
Daily - Contracted capacity €/(kWh/d) per day 0 0 -
Within-day - Contracted capacity €/(kWh/d) per day 0 0 -
VIP (Campo Maior and Valença do Minho), LNG Terminal, Underground storage
Commodity €/kWh 0 0,00001964 -
Unit Tariffs 2018-19 New methodology Δ%
Base tariff (Distribution networks and Customers connected to HP)
Used capacity (< 10 000 000 m3/year) €/(kWh/d) per month 0,017581 0,0143345 -18,5%
Used capacity (≥ 10 000 000 m3/year) €/(kWh/d) per month 0,017581 0,0143345 -18,5%
Commodity (< 10 000 000 m3/year) €/kWh 0,00035757 0,000491 37,3%
Commodity (≥ 10 000 000 m3/year) €/kWh 0,0000143 0,00001964 37,3%
Short uses (Customers connected to HP)
Used capacity (< 10 000 000 m3/year) €/(kWh/d) per month 0,00545 0,00477817 -12,3%
Used capacity (≥ 10 000 000 m3/year) €/(kWh/d) per month 0,00545 0,00477817 -12,3%
Commodity (< 10 000 000 m3/year) €/kWh 0,00199078 0,00176518 -11,3%
Commodity (≥ 10 000 000 m3/year) €/kWh 0,00163178 0,00129381 -20,7%
Annual flexible tariff (Customers connected to HP)
Annual base capacity €/(kWh/d) per month 0,017581 0,0143345 -18,5%
Monthly additional capacity (April to September) €/(kWh/d) per month 0,026371 0,02150176 -18,5%
Commodity €/kWh 0,0000143 0,00001964 37,3%
Monthly flexible tariff (Customers connected to HP)
Monthly capacity (April to September) €/(kWh/d) per month 0,026371 0,02150176 -18,5%
Monthly capacity (October to March) €/(kWh/d) per month 0,052742 0,04300351 -18,5%
Commodity €/kWh 0,0000143 0,00001964 37,3%
Daily flexible tariff (Customers connected to HP)
Daily capacity (April to September) €/(kWh/d) per day 0,003468 0,00282763 -18,5%
Daily capacity (October to March) €/(kWh/d) per day 0,00578 0,00471271 -18,5%
Commodity €/kWh 0,0000143 0,00001964 37,3%

IMPLEMENTATION OF THE NETWORK CODE ON HARMONISED TRANSMISSION TARIFF STRUCTURES
FOR GAS Discounts, multipliers and seasonal factors
29
7 DISCOUNTS, MULTIPLIERS AND SEASONAL FACTORS
This section complies with Article 28(1) of the gas tariff network code, which establishes the need to consult,
on the one hand, the national regulatory authorities of all directly linked Member States and, on the other
hand, the relevant stakeholders, on the level of the multipliers, the level of seasonal factors and the
discounts provided for in Articles 9 and 16.
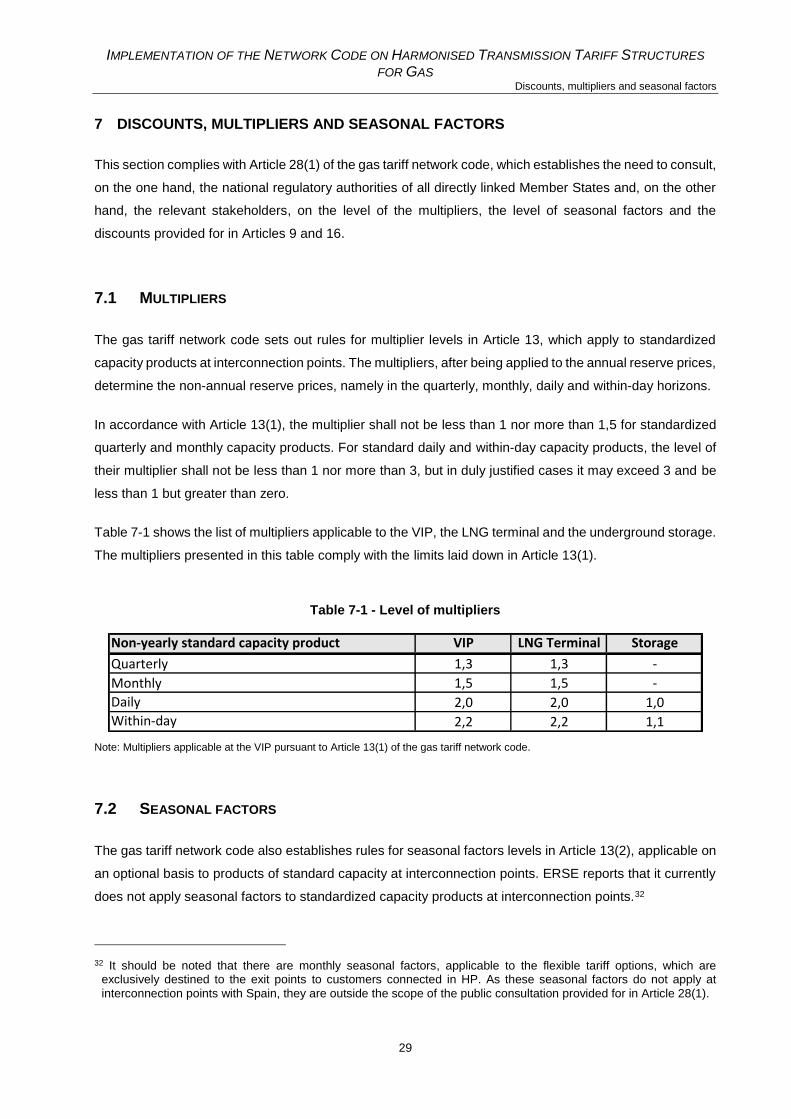
7.1 MULTIPLIERS
The gas tariff network code sets out rules for multiplier levels in Article 13, which apply to standardized
capacity products at interconnection points. The multipliers, after being applied to the annual reserve prices,
determine the non-annual reserve prices, namely in the quarterly, monthly, daily and within-day horizons.
In accordance with Article 13(1), the multiplier shall not be less than 1 nor more than 1,5 for standardized
quarterly and monthly capacity products. For standard daily and within-day capacity products, the level of
their multiplier shall not be less than 1 nor more than 3, but in duly justified cases it may exceed 3 and be
less than 1 but greater than zero.
Table 7-1 shows the list of multipliers applicable to the VIP, the LNG terminal and the underground storage.
The multipliers presented in this table comply with the limits laid down in Article 13(1).
Table 7-1 - Level of multipliers
Note: Multipliers applicable at the VIP pursuant to Article 13(1) of the gas tariff network code.
7.2 SEASONAL FACTORS
The gas tariff network code also establishes rules for seasonal factors levels in Article 13(2), applicable on
an optional basis to products of standard capacity at interconnection points. ERSE reports that it currently
does not apply seasonal factors to standardized capacity products at interconnection points.32
32 It should be noted that there are monthly seasonal factors, applicable to the flexible tariff options, which are exclusively destined to the exit points to customers connected in HP. As these seasonal factors do not apply at
interconnection points with Spain, they are outside the scope of the public consultation provided for in Article 28(1).
Non-yearly standard capacity product VIP LNG Terminal Storage
Quarterly 1,3 1,3 -
Monthly 1,5 1,5 -
Daily 2,0 2,0 1,0Within-day 2,2 2,2 1,1
IMPLEMENTATION OF THE NETWORK CODE ON HARMONISED TRANSMISSION TARIFF STRUCTURES
FOR GAS Discounts, multipliers and seasonal factors
30
7.3 DISCOUNTS OF ARTICLES 9 AND 16
The gas tariff network code provides for the application of two sets of discounts to transmission tariffs.
Firstly, Article 9 establishes the application of discounts to reference prices resulting from the reference
price methodology, in particular at entry points from and exit points to storage facilities and at entry points
from LNG facilities and infrastructure ending isolation of Member States.
Secondly, Article 16 provides for the application of discounts to standard capacity products for interruptible
capacity, which may be applied through an ex-ante discount on the basis of the probability of interruption
(before the interruption occurs) or through an ex-post discount (after the occurrence of the interruption)
which constitutes a compensation paid to network users due to the interruption.
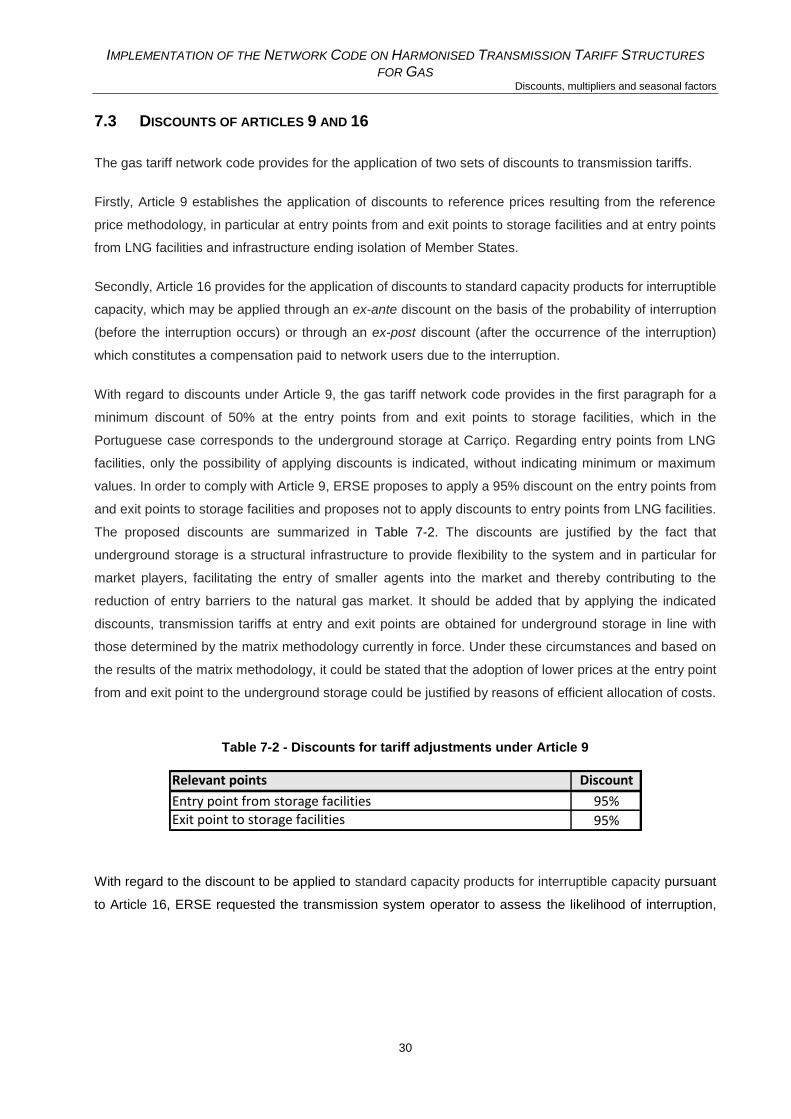
With regard to discounts under Article 9, the gas tariff network code provides in the first paragraph for a
minimum discount of 50% at the entry points from and exit points to storage facilities, which in the
Portuguese case corresponds to the underground storage at Carriço. Regarding entry points from LNG
facilities, only the possibility of applying discounts is indicated, without indicating minimum or maximum
values. In order to comply with Article 9, ERSE proposes to apply a 95% discount on the entry points from
and exit points to storage facilities and proposes not to apply discounts to entry points from LNG facilities.
The proposed discounts are summarized in Table 7-2. The discounts are justified by the fact that
underground storage is a structural infrastructure to provide flexibility to the system and in particular for
market players, facilitating the entry of smaller agents into the market and thereby contributing to the
reduction of entry barriers to the natural gas market. It should be added that by applying the indicated
discounts, transmission tariffs at entry and exit points are obtained for underground storage in line with
those determined by the matrix methodology currently in force. Under these circumstances and based on
the results of the matrix methodology, it could be stated that the adoption of lower prices at the entry point
from and exit point to the underground storage could be justified by reasons of efficient allocation of costs.
Table 7-2 - Discounts for tariff adjustments under Article 9
With regard to the discount to be applied to standard capacity products for interruptible capacity pursuant
to Article 16, ERSE requested the transmission system operator to assess the likelihood of interruption,
Relevant points Discount
Entry point from storage facilities 95%
Exit point to storage facilities 95%

IMPLEMENTATION OF THE NETWORK CODE ON HARMONISED TRANSMISSION TARIFF STRUCTURES
FOR GAS Discounts, multipliers and seasonal factors
31
and concluded on the basis of that assessment33 that at the relevant points of the transmission network,
there has been no interruption to date following physical congestion. For this reason, given the absence of
historical data usable for the calculation of probability values with adherence to practical scenarios, it is
considered that the probability of interruption assumes an infinitesimal value, whatever the standard
capacity products for interruptible capacity.
Considering the information sent by the transmission system operator and the forecasted demand
scenarios, ERSE considers that an ex-post discount should be applied.34 Thus, the prices of interruptible
capacity products are equal to the prices of firm capacity products and, in the event of an interruption, the
discount will be applied in accordance with Article 16(4), i.e. the discount to be applied shall be equal to
three times the reserve price for the daily standardized capacity products applied over the actual duration
of the interruption.
In ERSE’s understanding, the subsequent discount must be proportional to the amount of non-served
energy, guaranteeing proportionality to the interruption that affected the user. The expression for the
calculation of the subsequent discount is shown in the table below.
Table 7-3 - Formula for calculating the ex-post discount according to Article 16
𝐸𝑥-𝑝𝑜𝑠𝑡 𝑑𝑖𝑠𝑐𝑜𝑢𝑛𝑡⏟ €
= 3 ∙ 𝑅𝑒𝑠𝑒𝑟𝑣𝑒 𝑝𝑟𝑖𝑐𝑒 (𝑓𝑖𝑟𝑚 𝑑𝑎𝑖𝑙𝑦 𝑝𝑟𝑜𝑑𝑢𝑐𝑡)⏟ €/(𝑘𝑊ℎ/ℎ)
∙ 𝑁𝑜𝑛-𝑠𝑒𝑟𝑣𝑒𝑑 𝑒𝑛𝑒𝑟𝑔𝑦⏟ 𝑘𝑊ℎ
∙1
24⏟ℎ𝑜𝑢𝑟𝑠
The amount of non-served energy shall be calculated on the basis of interrupted capacity and hours of
interruption.35 ERSE's interpretation of the ex-post discount is consistent with the definitions in paragraphs
2 and 3 of Article 16, which use concepts of interrupted capacity and duration of interruptions to determine
the ex-ante discount.
The application of this discount will be made during the monthly settlement of the transmission tariffs of
each market agent. The application of the discount, with respect to daily and intraday horizons, affects and
is confined to the aggregate monthly amount of interruptible capacity contracted in these horizons, by the
respective market agent.
33 See “Avaliação da probabilidade de interrupção nos termos previstos pelo Regulamento (UE) 2017/460 da
Comissão, de 16 de março - Período tarifário de 2018/2019” (only available in Portuguese).
34 According to Article 16(4), "Such ex-post discount may only be used at interconnection points where there was no
interruption of capacity due to physical congestion in the preceding gas year.".
35 Non-served energy can be calculated using the following expression:
Non-served energy [kWh] = Interrupted capacity [kWh/h] x Hours of interruption [h]

IMPLEMENTATION OF THE NETWORK CODE ON HARMONISED TRANSMISSION TARIFF STRUCTURES
FOR GAS Discounts, multipliers and seasonal factors
32
7.4 CONSULTATION QUESTIONS
Question 9 – Given the information in section 7.1 on multipliers defined under Article 13 of the gas tariff
network code, how do you assess the suitability of these multipliers for the integration of the Iberian natural
gas market?
Question 10 – Regarding the discounts presented in section 7.3, referring to Article 9 of the gas tariff
network code, how do you assess the suitability of these discounts?
Question 11 – In relation to the subsequent discount defined in section 7.3, referring to Article 16 of the
gas tariff network code, how do you evaluate the adequacy of this discount?

IMPLEMENTATION OF THE NETWORK CODE ON HARMONISED TRANSMISSION TARIFF STRUCTURES
FOR GAS List of questions from the public consultation
33
8 RECAP OF PUBLIC CONSULTATIONS QUESTIONS
For convenience, this chapter brings together the various questions in this public consultation.
3 Reference price methodology
Question 1 – Given the reference price methodology presented in section 3.2, do you consider that
this methodology is adequate to properly reflect the costs of the natural gas transmission network?
Question 2 – Considering the results of the cost allocation assessments in section 3.4, do you
consider that the allocation of costs between cross-system (cross-border) flows and intra-system
flows (for domestic exits) is appropriate?
Question 3 – Based on the analysis presented in section 3.5, do you consider that the reference
price methodology meets the requirements of Article 7 of the gas tariff network code and Article 13
of EC Regulation 715/2009?
Question 4 – Given the comparison of the results of the reference price methodologies in section
3.6, how do you evaluate the adequacy of each methodology for determining reference prices for the
natural gas transmission network in Portugal?
4 Revenue structure of the transmission system operator
Question 5 – Given the indicative information on the allowed revenues of the transmission system
operator in section 4.1, how do you assess the breakdown of these revenues by the dimensions
given in Table 4-1?
5 Commodity-based transmission tariffs
Question 6 – In view of the justification for commodity-based transmission tariffs in section 5.1, do
you agree with the definition of the flow-based charge applicable at exit points, namely exit points to
the VIP (virtual interconnection point with Spain), to the LNG terminal, to the underground storage,
to customers connected to HP and to distribution networks?
Question 7 – In view of the justification for the application of the two regulatory remedies referred to
in section 5.1, do you agree with maintaining the consumption thresholds and the tariff option for
"short uses"?
6 Additional information on transmission tariffs
Question 8 – Given the tariff variations presented in section 6.1, how do you evaluate these
changes?
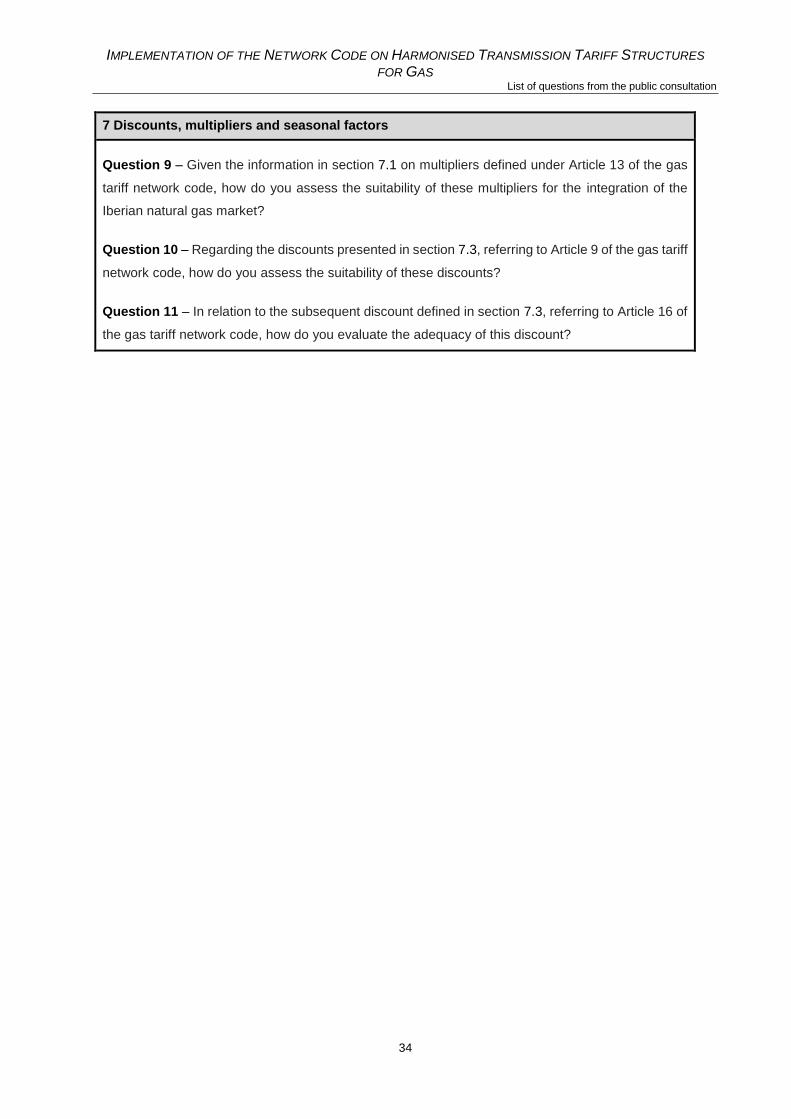
IMPLEMENTATION OF THE NETWORK CODE ON HARMONISED TRANSMISSION TARIFF STRUCTURES
FOR GAS List of questions from the public consultation
34
7 Discounts, multipliers and seasonal factors
Question 9 – Given the information in section 7.1 on multipliers defined under Article 13 of the gas
tariff network code, how do you assess the suitability of these multipliers for the integration of the
Iberian natural gas market?
Question 10 – Regarding the discounts presented in section 7.3, referring to Article 9 of the gas tariff
network code, how do you assess the suitability of these discounts?
Question 11 – In relation to the subsequent discount defined in section 7.3, referring to Article 16 of
the gas tariff network code, how do you evaluate the adequacy of this discount?

IMPLEMENTATION OF THE NETWORK CODE ON HARMONISED TRANSMISSION TARIFF STRUCTURES
FOR GAS Additional information about the cost allocation assessments
35
9 ADDITIONAL INFORMATION ABOUT COST ALLOCATION ASSESSMENTS
This chapter presents in greater detail the calculations underlying the cost allocation assessments in
accordance with Article 5 of the gas tariff network code.36
The starting point for the cost allocation assessments is the determination of ratios (𝑅𝑎𝑡𝑖𝑜𝑥) between
transmission tariff revenues (𝑅𝑒𝑣𝑒𝑛𝑢𝑒𝑥) and a given cost driver37 (𝐷𝑟𝑖𝑣𝑒𝑟𝑥):
𝑅𝑎𝑡𝑖𝑜𝑥 =𝑅𝑒𝑣𝑒𝑛𝑢𝑒𝑥
𝐷𝑟𝑖𝑣𝑒𝑟𝑥 , 𝑤𝑖𝑡ℎ 𝑥 = 𝑖𝑛𝑡𝑟𝑎, 𝑐𝑟𝑜𝑠𝑠
This ratio is determined separately for intra-system use (𝑥 = 𝑖𝑛𝑡𝑟𝑎) and for cross-system use (𝑥 = 𝑐𝑟𝑜𝑠𝑠).38
Having determined the values of 𝑅𝑎𝑡𝑖𝑜𝑖𝑛𝑡𝑟𝑎 and 𝑅𝑎𝑡𝑖𝑜𝑐𝑟𝑜𝑠𝑠 , the cost allocation comparison index (𝐶𝐴𝐶𝐼) is
determined by the following expression:
𝐶𝐴𝐶𝐼 =2 × |𝑅𝑎𝑡𝑖𝑜𝑖𝑛𝑡𝑟𝑎 − 𝑅𝑎𝑡𝑖𝑜𝑐𝑟𝑜𝑠𝑠|
𝑅𝑎𝑡𝑖𝑜𝑖𝑛𝑡𝑟𝑎 + 𝑅𝑎𝑡𝑖𝑜𝑐𝑟𝑜𝑠𝑠× 100%
As already mentioned in section 3.4, this indicator varies between 0% and 200%, where 0% indicates the
absence of cross-subsidization and 200% indicates the situation of maximum cross-subsidization.39 It
should be noted that the cost allocation comparison index is calculated separately for capacity-based and
for commodity-based tariffs.
An important element for calculating the cost allocation indicator is the wording of Article 5(5), which sets
out the assumptions applicable to the cross-system use of entry points. In accordance with paragraph 5,
an amount of capacity or energy equal to the amount of capacity or energy at the exit points, respectively,
shall be considered at entry points for cross-system use (cross-border flow). This hypothesis reflects the
idea that the cross-border flow leaving the system also had to enter the system in advance, thereby paying
tariffs at entry points.40 The intra-system use is then calculated as the difference compared to the aggregate
use of the transmission system.
36 The results of the cost allocation assessments were presented in section 3.4.
37 Article 5 of the network code defines in paragraph 1 the variables that can be used as a cost driver for the cost allocation assessments.
38 The use of the grid at an intra-system level refers to the flows of natural gas that are destined for national consumption. The use of the network at a cross-system level refers to natural gas transits passing through the transmission network.
39 The situation of maximum cross-subsidization (200%) occurs when an intra-system use or a cross-system use does not contribute to transmission tariff revenues.
40 This is the case of a system without domestic production of natural gas, as is the case in Portugal.
IMPLEMENTATION OF THE NETWORK CODE ON HARMONISED TRANSMISSION TARIFF STRUCTURES
FOR GAS Additional information about the cost allocation assessments
36
It should be noted that the cost allocation assessments presented here use the post-adjustment reference
prices as they reflect the prices paid by the users of the transmission system.41
9.1 CAPACITY COST ALLOCATION COMPARISON INDEX
In order to determine the capacity CACI, two demand scenarios were considered to derive the indicative
reference prices resulting from the reference price methodology.
Article 5(1)(a) establishes that the forecasted contracted capacity can be used as a cost driver in the
calculation of the capacity CACI. Given the scenario of forecasted contracted capacity that was used in the
reference price methodology, no cross-border flows are expected to occur in the transmission network,
which implies, by definition, the lack of cross-subsidization between intra-system and cross-system use.
In order to make the analysis more robust, the capacity CACI was also determined for an alternative
scenario where there is cross-border use at the exit point to the VIP. Analyzing the most recent and
complete capacity year, the exit point to the VIP with Spain presented contracted capacity during a single
day.42 Thus, to determine the alternative scenario, an amount of daily contracted capacity at the exit point
to the VIP was added to the base scenario, with a value equal to the one registered in the capacity year
2016-2017. In addition, and taking into account article 5(5), this value of contracted capacity was also added
to the entry points, also in the format of a daily product.43
Table 9-1 shows the capacity CACI for the two scenarios mentioned. In the base scenario, without cross-
border flows, and therefore without cross-system use, the capacity CACI will be null. In the case of the
alternative scenario, which included the contracting of a daily product at the exit point to the VIP, there is a
value of 6,7% for the capacity CACI. Therefore, in both scenarios presented, the maximum indicative value
of 10% is not exceeded, leading to the conclusion that there is no cross-subsidization between cross-
system and intra-system use.
The lack of cross-subsidization in the alternative scenario can be interpreted as follows: although the
capacity price applied at the exit point to the VIP is null, it is important to take into account that the use of
this exit point currently has an infrequent pattern, in the form of daily or within-day products. Taking into
account the assumption that this amount of capacity will also have to be contracted at entry points, with the
41 Post-adjustment reference prices include the following adjustments to prices resulting from the reference price methodology: application of Article 9 discounts, price equalization (exit points to domestic consumption and VIP) and multiplicative scaling for reconciliation with allowed revenues subject to the entry-exit split.
42 Data for the period from 1 October 2016 to 30 September 2017 (information available on the transmission system
operator’s webpage).
43 The capacity value was attributed to the entry point from the LNG terminal as it is the most plausible entry point for
cross-border flows, taking advantage of the terminal in Sines as the LNG gateway to Europe.

IMPLEMENTATION OF THE NETWORK CODE ON HARMONISED TRANSMISSION TARIFF STRUCTURES
FOR GAS Additional information about the cost allocation assessments
37
same maturity, multipliers greater than 1 applicable to daily and intraday products will compensate for the
lack of revenue at the exit point to the VIP.
Table 9-1 - Capacity cost allocation comparison index
Finally, it is important to note that the capacity CACI is very volatile for situations where the cross-system
use has a residual character, as in the Portuguese case. A marginal change in revenues from cross-
system use, while keeping cost drivers constant, translates into a significant change in the capacity CACI,
which substantially influences the conclusion on the existence of cross-subsidization.
It is also recalled that in ERSE’s perspective the contracted capacity in reverse flow at the exit point of the
VIP does not induce costs for the transmission system.44
9.2 COMMODITY COST ALLOCATION COMPARISON INDEX
In order to determine the commodity cost allocation comparison index, the two demand scenarios
mentioned in section 9.1 were used to derive the indicative reference prices resulting from the reference
price methodology. The base scenario uses the gas flow quantities used to determine the indicative
reference prices presented in Chapter 6. The alternative scenario adds to these data a cross-border gas
flow based on information from the most recent and complete capacity year.45
Table 9-2 shows the commodity CACI for the two demand scenarios. In the base scenario, without cross-
border flows, and therefore without cross-system use, the commodity CACI is null. In the case of the
alternative scenario, where a cross-border flow was included, the index takes a value of 8,4%. Therefore,
44 See justification in section 3.3.
45 During the period from 1 October 2016 to 30 September 2017, the exit point to the VIP registered contracted capacity during one single day (information available on the transmission system operator’s webpage). This daily capacity
value has been transformed into an energy flow assuming full utilization of the contracted capacity.
Base scenario Alternative scenario
Revenues (% of aggregate)
Intra-system 100,000% 99,997%
Cross-system 0,000% 0,003%
Driver (Forecasted contracted capacity in GWh/day)
Intra-system 248,559 248,559
Cross-system 0,000 0,008
Ratio (Revenues/Driver)
Intra-system 0,00402 0,00402
Cross-system - 0,00376
Capacity cost allocation comparison index (in %) 0,0% 6,7%

IMPLEMENTATION OF THE NETWORK CODE ON HARMONISED TRANSMISSION TARIFF STRUCTURES
FOR GAS Additional information about the cost allocation assessments
38
in both scenarios presented, the maximum indicative value of 10% is not exceeded, leading to the
conclusion that there is no cross-subsidization between cross-system and intra-system use.
Table 9-2 - Commodity cost allocation comparison index
The lack of cross-subsidization in the alternative scenario can be interpreted as follows: with the application
of a commodity price equal at all entry points and equal at all exit points46, there is no cross-subsidization
between cross-system and intra-system uses. However, the alternative scenario presents a non-zero value
for the commodity CACI due to the existence of regulatory remedies at the exit points to customers
connected to HP, namely the tariff option for "short uses" and the consumption thresholds.47
46 In accordance with Article 4(3)(a)(ii).
47 See justification in section 5.1.
Base scenario Alternative scenario
Revenues (% of aggregate)
Intra-system 100,000% 99,995%
Cross-system 0,000% 0,005%
Driver (Energy in GWh)
Intra-system 59.220,69 59.217,68
Cross-system 0,00 3,01
Ratio (Revenues/Driver)
Intra-system 0,00002 0,00002
Cross-system - 0,00002
Commodity cost allocation comparison index (in %) 0,0% 8,4%


IMPLEMENTATION OF THE NETWORK CODE ON HARMONISED TRANSMISSION TARIFF STRUCTURES
FOR GAS Additional information about the cost allocation assessments
40


![tcmKn-bpsS km£y ]{Xw - INFLIBNETshodhganga.inflibnet.ac.in/bitstream/10603/25754/14/14_appendices.pdf · Appendix - 2 PERSONAL DATA SHEET Prepared by Dr.P.P.Aravindan, MBBS, DTCD,](https://img.document.onl/doc/110x75/5e0f12e765d2571aab349578/tcmkn-bpss-kmy-xw-appendix-2-personal-data-sheet-prepared-by-drpparavindan.jpg)