Embed Size (px)
Citation preview
INSTITUTO NACIONAL DE PESQUISAS DA AMAZÔNIA
PROGRAMA DE PÓS-GRADUAÇÃO EM ECOLOGIA
Érik Henrique de Lacerda Choueri
Manaus – Amazonas
Junho/2015
GENÉTICA DE POPULAÇÕES DE ESPÉCIES INSULARES DE
THAMNOPHILIDAE (AVES): UMA ABORDAGEM FILOGEOGRÁFICA NO
BAIXO CURSO DO RIO NEGRO.

Érik Henrique de Lacerda Choueri
GENÉTICA DE POPULAÇÕES DE ESPÉCIES INSULARES DE
THAMNOPHILIDAE (AVES): UMA ABORDAGEM FILOGEOGRÁFICA NO
BAIXO CURSO DO RIO NEGRO
ORIENTADORA: Dra. Camila Cherem Ribas
COORIENTADORES: Dr. Sérgio Henrique Borges
Dra. Chrysoula Gkoumpili
Dissertação de mestrado apresentada ao Instituto Nacional de Pesquisas da Amazônia - INPA, como parte dos requisitos para obtenção do título de Mestre em Biologia (Ecologia).
Manaus - Amazonas
Agosto/2015

II
BANCA EXAMINADORA DA DEFESA ORAL PÚBLICA
Dr. Igor Kaefer
(UFAM)
Dra. Cintia Cornelius
(UFAM)
Dra. Marina Anciães
(INPA)
Aprovado por unanimidade

III
B552g Choueri, Érik Henrique de Lacerda
Genética de populações de espécies insulares de
Thamnophilidae (Aves): uma abordagem filogeográfica no
baixo curso do rio Negro / Érik Henrique de Lacerda Choueri.
--- Manaus: [s.n.], 2015.
xi, 79 f. : il., color.
Dissertação (Mestrado) --- INPA, Manaus, 2015.
Orientador: Camila Cherem Ribas.
Coorientador : Sérgio Henrique Borges, Chrysoula
Gkoumpili.
Área de concentração : Biologia (Ecologia)
1.Filogeografia 2.Genética de populações. 3. Aves -
Thamnophilidae – Rio Negro. I.Título
CDD
598.7
Sinopse
Estudou-se a dinâmica populacional de quatro espécies da família Thamnophilidae (AVES) em ilhas
do baixo Rio Negro, avaliando a relação destas populações com às de outros rios amazônicos. Para
se compreender o cenário atual, informações relacionadas ao fluxo gênico e diversidade genética
foram acessadas. Estimativas referentes ao número populacional histórico e tempo de divergência
entre linhagens foram consideradas para se compreender a influência do paleoambiente sobre estes
animais.
Palavras-chave: Anavilhanas, Amazônia central, ilhas fluviais, Jaú, dinâmica de populações
IV
AGRADECIMENTOS
Primeiramente gostaria de agradecer aos meus orientadores Camila Ribas, Sérgio
Borges e Chrysoula Gkoumpili por compartilharem seus conhecimentos, proporcionando
um acréscimo incalculável em minha formação. Estas pessoas foram as responsáveis
por me apresentarem a complexidade do apaixonante universo amazônico, promovendo
meios para tentar compreendê-lo. As lições oferecidas por estes serão levadas para toda
minha vida profissional!
Também gostaria de agradecer às instituições que forneceram suporte para que
este trabalho fosse possível: ao CNPq pela concessão da bolsa de pesquisa ao longo
destes anos, ao Instituto Nacional de Pesquisas da Amazônia pelo suporte técnico e
logístico e ao Instituto Chico Mendes de Conservação da Biodiversidade, que através do
convênio ICMBio-ARPA forneceram apoio logístico para as expedições de campo. Neste
contexto, também agradeço aos pesquisadores que forneceram algumas das sequências
que utilizei em minhas análises e à Fundação Vitória Amazônica pelo suporte técnico e
logístico.
Dentro destas instituições algumas pessoas foram fundamentais. Desta forma,
gostaria de fazer um agradecimento especial para Priscila Santos (gestora do ICMBio em
Anavilhanas) e ao pessoal do Laboratório Temático de Biologia Molecular do INPA,
principalmente à Kyara Formiga, Paula Barbosa e Giselle Moura.
Cabe salientar que as expedições de coleta só foram possíveis considerando o
auxílio do Gerlei, Antenor e Seu Dino, os guias que me acompanharam em campo. Essas
pessoas se tornaram grandes amigos devido a alegria, humildade e simplicidade,
característica marcante de todos os ribeirinhos que conheci durante estas atividades.
Também agradeço às pessoas que me auxiliaram à distância: minha família.
Primeiramente, minha avó Maria por me acompanhar desde meus primeiros passos,
sempre com sábios conselhos recheados de amor, carinho e dignidade. Dignidade,
palavra que não posso dizer sem pensar em meus pais: Erô e Miguel. Estas duas
pessoas batalhadoras são meus maiores exemplos e as considero como as mais
importantes de minha vida! O amor e carinho incondicional fornecido por esses dois
servem como um porto seguro durante as etapas de minha vida. Todas minhas

V
conquistas ofereço a vocês! Também agradeço aos outros familiares: irmãos, primos,
tios, sobrinhos... não vou citar todos porque só de irmãos são seis!
Como falar em família sem pensar em minha família manauara? Faço questão de
começar agradecendo à mãe Paula por conseguir conviver numa casa com três homens,
sempre sendo uma pessoa divertida e comunicativa (exceto pelas manhãs!). Agradeço
ao Layon (Fada) e ao Peterson (Bambu) pelo companheirismo e amizade cultivados
desde os tempos da saudosa UNESP Rio Claro. Agradeço à Guta, pelas festas, cervejas
e discussões infinitas! É muito bom saber que posso contar com amigos sinceros e
verdadeiros como vocês!
Também agradeço outros amigos fora deste “núcleo familiar”, mas que mesmo
assim são como irmãos! Maria Júlia, Carol, Capuchino, Yuri e Jaspion, a companhia de
vocês foi fundamental! Obrigado por tudo!
Por fim, gostaria de agradecer aos integrantes do grupo de Biogeografia de Aves,
principalmente ao Mateus, Romina, Roberta, Érico e Glauco. Compartilhar o ambiente de
trabalho com vocês foi uma experiência fantástica. Obrigado pelas dicas, discussões e
momentos de descontração!
VI
RESUMO
As planícies alagáveis da Amazônia correspondem à um mosaico de ambientes que
ocupam mais de 10% da bacia e abrigam inúmeras espécies de animais e plantas. Neste
contexto, a avifauna associada apresenta graus distintos de dependência ao uso de
determinados microhabitats. Apesar de sua relevância ecológica, pouco se conhece
sobre a dinâmica populacional dos organismos que utilizam estes ambientes, assim como
os mecanismos históricos que influenciaram a formação destas paisagens. Desta forma,
o presente estudo avaliou a dinâmica populacional de quatro espécies de aves florestais
de planícies alagáveis da Amazônia. Dentre estas, foi considerada uma espécie
generalista no uso deste habitat (Hypocnemoides melanopogon) e outras três que
utilizam preferencialmente ilhas fluviais (Myrmotherula assimilis, Myrmoborus lugubris e
Thamnophilus nigrocinereus), ambientes dispostos de forma discreta na paisagem.
Quando considerados os arquipélagos do baixo Rio Negro, apesar de evidências de fluxo
gênico entre ilhas, foram encontrados sinais de distribuição heterogênea da diversidade
genética na paisagem para as espécies especialistas no uso de ambientes insulares. Em
escala geográfica mais ampla, linhagens das três espécies especializadas no uso de
ambientes insulares apresentaram distinção entre o Negro outros grandes rios
amazônicos. Estes resultados são contrastantes com outros estudos que indicaram
ausência de estruturação genética em aves de planícies de fluviais amazônicas. Cabe
salientar que tal reposta não foi observada para a espécie generalista de áreas alagadas,
sugerindo que as características ecológicas dos organismos podem influenciar sua
diversidade genética nestes habitats. A congruência temporal das divergências entre
estas linhagens dos Negro e Solimões evidencia que processos paleoclimáticos e
geológicos relacionados à formação da paisagem no passado recente (Pleistoceno)
foram possivelmente responsáveis por reger a organização atual destes organismos. Por
fim, as espécies estudadas não apresentaram sinais marcantes de expansão
populacional recente, resultado concordante ao obtido para outras aves de planícies
alagadas, mas que contrastam com aqueles obtidos para organismos de Terra Firme. Tal
resposta pode ser um indicativo de disponibilidade constante dos habitats alagáveis
amazônicos durante a transição entre Pleistoceno/Holoceno.
VII
ABSTRACT
Amazon floodplains is a mosaic of environments who occupy more than 10% of basin
and harbor countless species of animals and plants. In this context, the associeted
avifauna exhibit different degrees of dependence related to use of microhabitats. Despite
its ecological importance, the organisms’ population dynamics that use these
environments are not well known, as well as the historical mechanisms that influenced
the formation of these landscapes. Thus, this study evaluated the population dynamics
of four forest birds species specialized in the Amazon floodplains use. Among these, were
evaluated a generalist specie in the floodplain use (Hypocnemoides melanopogon) and
three species that use preferably fluvial islands (Myrmotherula assimilis, Myrmoborus
lugubris and Thamnophilus nigrocinereus), environments arranged discretely in
landscape. When considering archipelagos situated in lower Negro River, despite
evidences of gene flow between islands, subtle signals indicate that genetic diversity is
heterogeneously distributed across the landscape to species specialized in insular
environments. In a broader geographic scale, lineages of birds specialists of insular
environments exhibited distinctions between Negro and other great rivers of Amazon.
These results contrast with other studies that indicated no genetic structure in specialized
birds in the amazon’s floodplains. It should be noted that such response was not observed
in the generalist specie of flooded areas, suggesting that the organisms’ ecological
characteristics can influence genetic diversity in these habitats. The temporal congruence
of divergences between lineages of Negro and Solimões are evidences that paleoclimatic
and geologic process related to the formation of landscape in recent past (Pleistocene)
were possibly responsible by the current organization of these species. Finally, the
species studied does not showed remarkable signals of population expansion, a similar
result to that achieved for other floodplains’ birds, but are contrasting to those obtained
in lowland (Terra Firme) organisms. This answer can be an idicative of constant
avaliability of floodplains during the transition Pleistocene/Holocene.

VIII
SUMÁRIO
LISTA DE TABELAS ....................................................................................................... X
LISTA DE FIGURAS ...................................................................................................... XI
INTRODUÇÃO GERAL .................................................................................................. 12
OBJETIVOS ................................................................................................................... 19
CAPÍTULO 1 .................................................................................................................. 20
ABSTRACT ................................................................................................................. 21
INTRODUCTION......................................................................................................... 23
MATHERIALS AND METHODS .................................................................................. 25
Study region ............................................................................................................. 25
Study species and sampling .................................................................................... 25
Molecular data ......................................................................................................... 26
Nuclear DNA analyses ............................................................................................. 27
Mitochondrial DNA analyses .................................................................................... 27
RESULTS ................................................................................................................... 29
Phylogeographical context of the Negro basin samples .......................................... 29
Population structure at the Negro basin ................................................................... 30
Historical demography at the Negro basin ............................................................... 31
DISCUSSION .............................................................................................................. 32
Historical connections among Amazonian insular birds ........................................... 32
Population dynamics of Negro river basin insular birds ........................................... 33
Biogeography of Negro river basin island birds in an Amazonian context ............... 35
Implications for Amazonian biogeography and conservation ................................... 37
ACKNOWLEDGEMENTS ........................................................................................... 37
REFERENCES ........................................................................................................... 38
SUPPORTING INFORMATION INDEX ...................................................................... 45
BIOSKETCH ............................................................................................................... 46
TABLES ...................................................................................................................... 47
FIGURES .................................................................................................................... 51
SUPPORTING INFORMATION .................................................................................. 56
Appendix S1 ............................................................................................................ 56
Appendix S2 ............................................................................................................ 62

IX
Appendix S3 ............................................................................................................ 65
CONCLUSÕES .............................................................................................................. 75

X
LISTA DE TABELAS
Table 1. Number of samples per species from each locality.............................................47
Table 2. Summary of the nuDNA data obtained for samples from Negro River basin......48
Table 3. Percentage of genetic variation per geographic scale for both molecular
markers............................................................................................................................49
Table 4. Mitochondrial DNA summary statistics and neutrality tests per different localities
and total...........................................................................................................................50
Table S1. Morphological and ecological characteristics of studied species......................56
Table S2. Samples used includind Locality, species identification, voucher institution,
voucher number and geographical coordinates...............................................................57
Table S3. Mitochondrial primers for cytb and ND2...........................................................63
Table S4. Microsatellite primers and annealing temperature for each species.................64
Table S5. Nuclear DNA summary satistics per loci...........................................................65
Table S6. Pairwise matrices of dissimilarity between archipelagos per species...............69

XI
LISTA DE FIGURAS
Figure 1. Study area and sampled islands......................................................................52
Figure 2. Haplotype networks per species......................................................................53
Figure 3. Divergence times among intra specific lineages of the four studied species...54
Figure 4. Extended Bayesian Skyline Plots for each species..........................................55
Figure S1. Phylogenetic trees obtained in the MrBayes analysis based on mtDNA
sequences.......................................................................................................................72
Figure S2. Mantel’s test plots..........................................................................................73
Figure S3. Plots of maximum likelihood (LnP(k)) for different number of clusters (k),
followed by correspondent barplot...................................................................................74

12
INTRODUÇÃO GERAL
A região amazônica é composta por um complexo mosaico de ambientes
responsável por moldar a distribuição de vários organismos, sendo que a diferenciação
de determinadas unidades evolutivas pode ser relacionada com os processos históricos
que formaram a paisagem (Aleixo, 2004; Ribas et al., 2012). Dentre os condutores e
mantenedores desta diversidade, os grandes rios são considerados um dos principais
agentes, os quais atuaram tanto como barreira vicariante em espécies ancestrais de
ampla distribuição (Wallace, 1852), quanto como barreiras atuais em zonas de contato
secundário (Fernandes et al., 2012). Por esta razão, muitos interflúvios apresentam-se
como zonas de endemismo para diversas espécies de aves (Cracraft, 1985; Borges & Da
Silva, 2012).
Outros papéis relevantes sobre essas drenagens relacionam-se com seu potencial
de influenciar habitats vinculados às suas planícies de inundação, além de atuarem como
facilitadores para a dispersão de determinados organismos nessas regiões (Schleuning
et al., 2011; Montero et al., 2012). Os ambientes em questão abrigam diferentes
fisionomias vegetacionais, desde áreas abertas à florestais, cobrindo cerca de 600.000
km2 de extensão, o que corresponde a aproximadamente 10% da bacia amazônica
(Melack & Hess, 2010; Wittmann et al., 2010). Devido sua magnitude e complexidade,
15% da avifauna do bioma é especializada no uso destes habitats (Remsen & Parker,
1983).
A heterogeneidade ambiental encontrada nas planícies alagadas é reflexo
principalmente das características físico-químicas e geológicas dos rios as quais estão
associadas (Prance, 1979). Cursos possuindo nascentes próximas às regiões andinas
apresentam grande carga sedimentar e resultam na formação dos ambientes de várzea,
enquanto que rios que correm pelos antigos escudos cristalinos geralmente transportam
um volume sedimentológico menor e estão associados aos ambientes de igapó (Prance
1979). Como consequência desta diferenciação, a produtividade primária e vegetação
são distintos entre tais ambientes (Prance 1979). Cabe salientar ainda que os mesmos
sofrem influências drásticas relacionadas ao pulso de inundação sazonal dos rios e

13
apresentam evidências de intensa dinâmica geológica (Junk et al. 1989; Latrubesse &
Franzinelli 2005; Almeida-filho & Miranda 2007; Nogueira et al. 2013). O resultado deste
conjunto de condições peculiares é a formação de uma ampla gama de habitats
ecologicamente diferenciados que incluem florestas em distintos estágios sucessionais,
ilhas fluviais, lagos, bancos de areia, entre outros.
Alguns destes ambientes localizados ao longo dos rios amazônicos podem atuar
como corredores para o fluxo de indivíduos e genes. De fato, um estudo realizado com
uma ave de campos de várzea sazonalmente alagáveis (Chrysomus icterocephalus)
demonstrou fracos sinais de diferenciação genética ao longo de sua extensa distribuição
geográfica (Cadena et al., 2011). Resposta similar foi obtida em um trabalho com o
gênero Xiphorhynchus onde, apesar de ocorrer diferenciações relacionadas à
diversidade genética entre populações, não foram identificadas estruturas filogeográficas
distintas dentro da ampla distribuição das espécies abordadas (Aleixo, 2006). Neste
contexto, cabe salientar que a presença de populações geneticamente similares nos
habitats em questão está relacionada às características ecológicas intrínsecas das
espécies avaliadas (Burney & Brumfield, 2009).
Em ambos os casos citados acima, as aves estudadas ocupam ambientes abertos
ou contínuos, os quais podem atuar como facilitadores ao fluxo gênico (Bates et al.,
2003). Desta forma, cabe-se questionar se os padrões observados podem também ser
aplicados às espécies que ocupam habitats fragmentados inseridos no contexto fluvial.
Tal pergunta é apropriada ao se considerar que ilhas são comumente encontradas nos
grandes rios amazônicos, exibindo aves especializadas em planícies alagáveis que
dependem intimamente destes microhabitats (Rosenberg, 1990; Cintra et al., 2007). Para
estas espécies, aspectos relacionados à dinâmica histórica das ilhas podem ter deixado
marcas nas linhagens estabelecidas nestes locais (Avise, 2000). Desta forma,
compreender a história dos organismos insulares também seria um modo de entender a
evolução destes ambientes (Baker et al., 2014), os quais ainda são motivos de debate no
meio geológico.
Uma das formas mais viáveis e informativas para acessar este tipo de questão se
dá através do uso de ferramentas moleculares, sendo tal abordagem utilizada em

14
diversos estudos considerando diferentes escalas geográficas e temporais (Werneck et
al., 2012; Woltmann et al., 2012; Wallace et al., 2015). Desta forma, torna-se ideal o uso
combinado de marcadores mitocondriais e nucleares por estas moléculas oferecerem
informações complementares sobre a dinâmica histórica e recente das populações
estudadas (Frankham et al. 2008). Neste contexto, pelo fato do DNA mitocondrial
apresentar características conhecidas em relação à sua forma de evolução, torna-se
possível a compreensão das relações entre linhagens estabelecidas no passado, assim
como da dinâmica populacional ancestral (Sorenson et al., 1999; Weir & Schluter, 2008;
Capurucho et al., 2013). Para acessar respostas vinculadas à dinâmica populacional em
escala temporal recente, é interessante o uso de marcadores vinculados ao DNA nuclear
que sejam sensíveis à eventos de estruturação ou fluxo gênico, como os microssatélites.
Pelo fato da molécula em questão ser recombinante e de origem biparental, estes
marcadores são mais sensíveis para se avaliar o fluxo gênico entre organismos e níveis
de diversidade genética das populações avaliadas (Frankham et al. 2008).
Além da ferramenta a ser implementada, cabe-se escolher quais organismos
serão utilizados como modelo. Neste caso é relevante considerar espécies que
fundamentalmente sejam sensíveis à insularidade devido características ecológicas e
comportamentais. Para tanto, a família Thamnophilidae é ideal por apresentar diversas
espécies florestais sedentárias que geralmente evitam cruzar ambientes abertos (Zimmer
& Isler 2003; Fernandes et al. 2012). Desta forma, para o presente estudo, foram
selecionados representantes apresentando diferenças em relação ao uso dos habitats:
Myrmoborus lugubris (Cabanis 1847), Myrmotherula assimilis (Pelzeln 1868) e
Thamnophilus nigrocinereus (Sclater 1855), por utilizarem preferencialmente os
ambientes insulares foram considerados como “especialistas de ilhas”, e Hypocnemoides
melanopogon (Sclater 1857), uma espécie generalista de áreas alagadas também foi
abordada. Tal distinção é relevante, considerando que animais com diferentes hábitos de
vida podem apresentar respostas distintas ao uso dos ambientes. Outro ponto importante
refere-se à escolha dos arquipélagos trabalhados. Neste caso, as ilhas de Anavilhanas e
Parque Nacional do Jaú, situam-se no baixo Rio Negro, região aonde processos
tectônicos e sedimentológicos influenciaram a dinâmica recentemente da paisagem
(Almeida-filho & Miranda 2007; Latrubesse & Franzinelli 2005). Devida sua complexidade,

15
a formação da área em questão ainda é alvo de debate no meio geológico. Desta forma,
estudar a organização dos organismos que habitam estes arquipélagos pode levantar
informações relevantes para a melhor compreensão dos mecanismos que atuaram no
baixo Rio Negro.
Referências
Aleixo A. (2004) Historical diversification of a terra-firme forest bird superspecies: a
phylogeographic perspective on the role of different hypotheses of Amazonian
diversification. Evolution; international journal of organic evolution, 58, 1303–1317.
Aleixo A. (2006) Historical diversification of floodplain forest specialist species in the
Amazon: A case study with two species of the avian genus Xiphorhynchus (Aves:
Dendrocolaptidae). Biological Journal of the Linnean Society, 89, 383–395.
Almeida-filho R. & Miranda F.P. (2007) Mega capture of the Rio Negro and formation of
the Anavilhanas Archipelago , Central Amazônia , Brazil : Evidences in an SRTM
digital elevation model. Remote Sensing of Enviroment, 110, 387–392.
Avise J.C. (2000) Phylogeography: The history and formation of species.
Baker P. a., Fritz S.C., Dick C.W., Eckert A.J., Horton B.K., Manzoni S., Ribas C.C.,
Garzione C.N., & Battisti D.S. (2014) The emerging field of geogenomics:
Constraining geological problems with genetic data. Earth-Science Reviews, 135,
38–47.
Bates J.M., Tello J.G., & Da Silva J.M.C. (2003) Initial Assessment of Genetic Diversity in
Ten Bird Species of South American Cerrado. Studies on Neotropical Fauna and
Environment, 38:2, 87–94.
Borges S.H. & Da Silva J.M.C. (2012) A New Area of Endemism for Amazonian Birds in
the Rio Negro Basin. The Wilson Journal of Ornithology, 124, 15–23.

16
Burney C.W. & Brumfield R.T. (2009) Ecology predicts levels of genetic differentiation in
neotropical birds. The American naturalist, 174, 358–68.
Cadena D., Gutiérrez-Pinto N., Dávila N., & Chesser R.T. (2011) No population genetic
structure in a widespread aquatic songbird from the Neotropics. Molecular
Phylogenetics and Evolution, 58, 540–545.
Capurucho J.M.G., Cornelius C., Borges S.H., Cohn-haft M., Aleixo A., Metzger J.P., &
Ribas C.C. (2013) Combining phylogeography and landscape genetics of Xenopipo
atronitens ( Aves : Pipridae ), a white sand campina specialist , to understand
Pleistocene landscape evolution in Amazonia. Biological Journal of the Linnean
Society, 1–17.
Cintra R., Sanaiotti T., Cohn-Haft M. (2007) Spatial distribution and habitat of the
Anavilhanas Archipelago bird community in the Brazilian Amazon. Biodiversity and
Conservation, 16, 313-336.
Cracraft J. (1985) Historical biogeography and patterns of differentiation within the south
amercian avifauna: Areas of endemism. Ornithological Monographs, 36, 49–84.
Fernandes A.M., Wink M., & Aleixo A. (2012) Phylogeography of the chestnut-tailed
antbird (Myrmeciza hemimelaena) clarifies the role of rivers in Amazonian
biogeography. Journal of Biogeography, 39, 1524–1535.
Latrubesse E.M. & Franzinelli E. (2005) The late Quaternary evolution of the Negro River,
Amazon, Brazil: Implications for island and floodplain formation in large anabranching
tropical systems. Geomorphology, 70, 372–397.
Melack J.M. & Hess L.L. (2010) Remote Sensing of the Distribution and Extent of
Wetlands in the Amazon Basin. Amazonian Floodplain Forests: Ecophysiology,
Biodiversity and Sustainable Management pp. 43–59.
17
Montero J.C., Piedade M.T.F., & Wittmann F. (2012) Floristic variation across 600 km of
inundation forests (Igapó) along the Negro River, Central Amazonia. Hydrobiologia,
1–18.
Nogueira A.C.R., Silveira R., & Guimarães J.T.F. (2013) Neogene–Quaternary
sedimentary and paleovegetation history of the eastern Solimões Basin, central
Amazon region. Journal of South American Earth Sciences, 46, 89–99.
Prance G.T. (1979) Notes on the vegetation of Amazonia III. The terminology of
amazonian forest types subject to inundation. Brittonia, 31, 26–38.
Remsen J. V. & Parker T.A. (1983) Contribution of river-created habitats to bird species
richness in Amazonia. Biotropica, 15, 223–231.
Ribas C.C., Aleixo A., Nogueira A.C.R., Miyaki C.Y., Cracraft J., & Andre A. (2012) A
palaeobiogeographic model for biotic diversification within Amazonia over the past
three million years. Proceedings Biological sciences The Royal Society, .
Rosenberg G.H. (1990) HABITAT SPECIALIZATION AND FORAGING BEHAVIOR BY
BIRDS OF AMAZONIAN RIVER ISLANDS IN NORTHEASTERN PERU. The
Condor, 92, 427.
Schleuning M., Becker T., Vadillo G.P., Hahn T., Matthies D., & Durka W. (2011) River
dynamics shape clonal diversity and genetic structure of an Amazonian understorey
herb. Journal of Ecology, 99, 373–382.
Sorenson M.D., Ast J.C., Dimcheff D.E., Yuri T., & Mindell D.P. (1999) Primers for a PCR-
based approach to mitochondrial genome sequencing in birds and other vertebrates.
Molecular phylogenetics and evolution, 12, 105–14.
Wallace, A. (1852) On the mokeys of the Amazon. Proceedings of the Zoological Society
of London, 110-169

18
Wallace S.J., Wolf S.G., Bradley R.W., Laurie Harvey A., & Friesen V.L. (2015) The
influence of biogeographical barriers on the population genetic structure and gene
flow in a coastal Pacific seabird. Journal of Biogeography, 390–400.
Weir J.T. & Schluter D. (2008) Calibrating the avian molecular clock. Molecular ecology,
17, 2321–8.
Werneck F.P., Gamble T., Colli G.R., Rodrigues M.T., & Sites J.W. (2012) Deep
diversification and long-term persistence in the south american “dry diagonal”:
Integrating continent-wide phylogeography and distribution modeling of geckos.
Evolution, 66, 3014–3034.
Wittmann F., Schöngart J., & Junk W.J. (2010) Phytogeography, Species Diversity,
Community Structure and Dynamics of Central Amazonian Floodplais Forests.
Amazonian Floodplain Forests: Ecophysiology, Biodiversity and Sustainable
Management (ed. by W.J. Junk, M.T.F. Piedade, F. Wittmann, J. Schöngart, and P.
Parolin), Springer, New York.
Woltmann S., Kreiser B.R., & Sherry T.W. (2012) Fine-scale genetic population structure
of an understory rainforest bird in Costa Rica. Conservation Genetics, 13, 925–935.

19
OBJETIVOS
Compreender as relações encontradas entre populações de quatro espécies
florestais de Thamnophilidae com ecologias distintas em fina escala geográfica, com
ênfase nas ilhas do curso baixo do Rio Negro; avaliar a relação dos grupamentos destas
localidades com os presentes em outros rios amazônicos; e acessar informações
relacionadas à história destas espécies nas ilhas do baixo Rio Negro, visando uma melhor
compreensão dos ambientes que habitam.

CAPÍTULO 1
__________________________________________
Choueri, E.L.; Borges, S.H.; Gubili, C.; Thom, G. & Ribas,
C.C. Phylogeography and population dynamics of Antbirds
(Thamnophilidae) from Amazonian fluvial islands.
Manuscrito em preparação para Journal of Biogeography.

21
Original Article
Population dynamics of Antbirds (Thamnophilidae) in fluvial islands: distinct
ecologies influence historical and current patterns of genetic diversity.
Choueri, Érik Lacerda1,*; Borges, Sérgio Henrique2; Gubili, Chrysoula2; Thom, Gregory3;
Ribas, Camila Cherem2
1Programa de Pós-Graduação em Ecologia, INPA, Manaus, Amazonas, Brazil.
2Coordenação de Biodiversidade, INPA, Manaus, Amazonas, Brazil.
3Departamento de Genética e Biologia Evolutiva, USP, São Paulo, São Paulo, Brazil.
*Corresponding author
Correspondence: Érik Lacerda Choueri, Instituto Nacional de Pesquisas da Amazônia,
CEP 69080-971, Manaus-AM, Brazil.
E-mail: [email protected]
Running head: Population dynamics of Antbirds in fluvial islands
ABSTRACT
Aim To investigate the evolution of the avifauna associated to Amazonian flooded habitats
analyzing the genetic diversity of four Thamnophilidae species from the Negro River fluvial
islands.
Locations Fluvial islands in the Amazon Basin.
Methods One generalist floodplain species (Hypocnemoides melanopogon) and three
river island specialists (Myrmotherula assimilis, Myrmoborus lugubris and Thamnophilus
nigrocinereus) were studied. We sequenced two mitochondrial genes and genotyped
eight microsatellite loci. Phylogenetic relationships among intraspecific lineages and
divergence times were estimated using Bayesian Inference. Haplotype networks, AMOVA
22
and Mantel tests were used to evaluate the spatial organization of genetic diversity. Gene
flow and population structure were evaluated using dissimilarity index, Bayesian inference
and allele frequencies. Historical demography was inferred through neutrality tests and
EBSP.
Results River island specialists present distinct lineages in different Amazonian
tributaries, but very weak population structure within the Negro river basin. The floodplain
species had no population structure along the Amazon basin or within the Negro river
basin. For all species signal of very slight and recent (Pleistocene) population expansion
was recovered.
Main conclusions River island species have stronger population structure within
Amazonia than floodplain generalists, with a common spatial and temporal pattern of
divergence between populations from the Negro islands and from western Amazonia
(upper and middle Solimões), which may be related to Amazonian drainage evolution.
Island specialists had low genetic diversity within the Negro basin, while the higher and
unstructured diversity pattern found in the floodplain generalist species may be a
consequence of higher dispersal caused by the seasonal flooding pulse. River island
populations have a recent and dynamic history of contact and isolation, but with small
historical fluctuation of population sizes, in sharp contrast with the patterns that have been
described for upland forest birds.
Keywords: Anavilhanas, central Amazonia, fluvial islands, insular habitats, Jaú, Negro
river, population dynamics.
Abstract: 286 words
Main body: 6682 words
23
INTRODUCTION
Even for species inhabiting the same geographical region, and thus subject to the same
landscape history, intrinsic ecological characteristics such as dispersal ability and different
strategies of habitat use may influence gene flow and resulting population genetic patterns
(Nevo et al., 1984; Burney & Brumfield, 2009). In Amazonia, lineages of several species
or species complexes specialized in lowland forest habitats (terra firme forests) have their
distributions delimited by large rivers (Haffer, 1969; Ayres & Clutton-Brock, 1992; Kaefer
et al., 2012; Ribas et al., 2012). These species often have limited dispersal capacity or
tend to avoid open areas (e.g. Fernandes et al., 2012, 2014), so that river channels and
floodplains are strong barriers to dispersal, favoring genetic structuring of populations
(Beja et al., 2010; Fernandes et al., 2014). Paradoxically, these same rivers can facilitate
gene flow for floodplain specialists, implying in a lack of genetic structure for such species
throughout the basin (Aleixo, 2006; Cadena et al., 2011; Schleuning et al., 2011).
Nevertheless, to consider the Amazon river and its tributaries simply as corridors to gene
flow can be a biased view, considering the high diversity of habitats found in their
floodplains and the diverse ways in which species can use them.
Beyond barriers or corridors, Amazonian rivers are responsible for regulating habitats that
occupy approximately 300,000 km2 of the basin (Wittmann et al., 2010). The
physicochemical characteristics of their waters create the environments of várzea (in
white water rivers) and igapó (rivers of black or clear waters) which show distinct
physiognomies, primary productivity and plant species diversity and composition (Prance,
1979; Parolin et al., 2004; Wittmann et al., 2010). Amazon rivers floodplains are subjected
to strong seasonal cycles whose duration and amplitude are highly spatially and
temporally variable through the basin (Junk et al., 2011). Additionally, geological and
paleoclimatic evolution are also responsible for shaping these landscapes through time
(Franzinelli & Igreja, 2002; Latrubesse & Franzinelli, 2005; Irion et al., 2009).
As a result of these multiple ecological and historical processes, Amazon floodplains
harbor a great diversity of habitats, including flooded forests, grasslands, fluvial islands,
oxbow lakes, beaches and sandbars (Remsen & Parker, 1983; Parolin et al., 2004;

24
Wittmann et al., 2006; Albernaz et al., 2007). Consequently, a highly specialized and
endemic fauna and flora occupies river-created habitats, with about 15% of non-aquatic
Amazonian birds being restricted to floodplains ( Remsen & Parker, 1983, Wittmann et
al., 2010). Because the seasonal flooding of Amazonian rivers create fleeting habitats, it
is expected that these birds have high dispersion potential in order to find new available
habitats during flooding peaks (Remsen & Parker, 1983). The high dynamic and continuity
of flooded habitats could explain the lack of genetic structure found in the few floodplain
specialist species that have been studied so far (Aleixo, 2006; Cadena et al., 2011).
Nevertheless, some floodplain resident birds show a high level of microhabitat
specialization with a clear preference for using fluvial islands (Rosenberg, 1990). At least
20 Amazonian bird species are recognized to be fluvial island specialists, although some
of them can also use disturbed mainland habitats (Rosenberg, 1990; Armacost-Jr &
Capparella, 2012). Island specialists are partially or totally dependent on a habitat with
spatially limited distribution in the riverine landscape (Rosenberg, 1990; Armacost-Jr &
Capparella, 2012), and it is not known if the pattern of little population structure would hold
in these cases. In addition, the evolution of Amazonian rivers may have strong effects on
the evolution of river island specialists, especially historical changes in sedimentation
dynamics and water level (Latrubesse & Franzinelli, 2005; Irion et al., 2009).
In this study, we aimed to examine the genetic diversity and population dynamics of four
antbird species (Thamnophilidae) that occur in fluvial islands at the Negro River Basin,
one of the largest tributaries of the Amazon River. To assess the influence of ecological
characteristics on the genetic patterns, the species chosen include a floodplain generalist
and three fluvial islands specialists (Rosenberg, 1990). In addition, to evaluate the
relationship between these groups with conspecifics in other Amazonian fluvial islands,
we include a more limited sampling obtained from other river systems. Information about
geological and paleoclimatic events were also discussed, seeking to know how the
paleoenvironment affected population dynamics in Negro River archipelagos.
25
MATHERIALS AND METHODS
Study region
Our study focused in lower course of the Negro River, located in central Amazonia, Brazil
(Figure 1). This region includes two archipelagos, one within the Jaú National Park and
another one in the Anavilhanas National Park. While the Jaú archipelago is smaller and
located in a narrow channel zone, Anavilhanas is a conspicuous landscape feature with
approximately 300 islands with distinct geomorphological physiognomies (Latrubesse &
Franzinelli, 2005). Other island habitats close to these two archipelagos include a third
archipelago, Mariuá, 60km upstream of the Jaú islands, in the middle Rio Negro, and
some fluvial islands in the Branco, Solimões, Madeira, Tapajós and Amazonas rivers
(Figure 1).
These environments are affected seasonally by the flood pulse, that alters the connectivity
among islands and habitat availability (Sioli, 1984; Latrubesse & Franzinelli, 2005).
Geologic and climatic historical processes also influenced this region, with evidences of a
dynamic palaeoenviroment, with palaeochannels and fluvial deposits being found in
interfluvial areas (Almeida-filho & Miranda, 2007; Santos et al., 2015).
Study species and sampling
Antbirds (Thamnophilidae) is one of the most diverse bird families on the Amazon basin
(Zimmer & Isler, 2003). Some species occur in fluvial islands, with varying degrees of
dependence on these environments (Remsen & Parker, 1983; Cintra et al., 2007). While
floodplain generalists use the islands in an opportunistic manner, they are apparently
fundamental to maintain populations of island specialists (Rosenberg, 1990).
Four species with different degrees of island specialization were selected.
Hypocnemoides melanopogon (Sclater, 1857) is a floodplain generalist that uses forest
edges close to lakes and rivers, and occurs in a large portion of northern Amazon basin
(Zimmer & Isler, 2003). Myrmoborus lugubris (Cabanis, 1847), Myrmotherula assimilis
(Pelzeln, 1868) and Thamnophilus nigrocinereus (Sclater, 1855) are island specialists,
occasionally found on river margins (Remsen & Parker, 1983; Rosenberg, 1990;

26
Armacost-Jr & Capparella, 2012). This habitat specialization is reflected in their
geographic distribution, which is restricted to large river channels (Zimmer & Isler, 2003).
For more information about species characteristics, see Table S1.
To understand population dynamics in the complex insular system of the lower Negro
River, dense sampling was conducted on these islands, including six and nine islands of
Jaú and Anavilhanas respectively (Table 1). Mist nets were operated in continuous net-
lines for eight hours (from 06:00am to 14:00pm). Blood and tissue samples and specimens
were deposited in the Genetic Resources and Bird Collections of the National Institute of
Amazonian Researches (INPA). In these two archipelagos, 51 samples of H.
melanopogon, 31 of M. lugubris, 32 M. assimilis and 27 T. nigrocinereus were collected
(more details in Table 1 and Supplementary Material Table S2). Samples from other
localities were obtained from collections (Table 1, S2).
Molecular data
Genomic DNA was extracted using Wizard® Genomic DNA Purification Kit (Promega)
according to the manufacturer’s protocol (see Supplementary Information). Mitochondrial
DNA genes cytochrome b (cytb) and NADH Dehydrogenase 2 (ND2) were amplified using
primers L14990-H16065 and L5204-H6313 respectively (Sorenson et al., 1999, Table
S3).
Eight microsatellite heterologous primer pairs developed for Thamnophilidae were used
to assess variability in nuclear DNA (Ágreda et al., 2006; Barnett et al., 2007; Feldheim et
al., 2010; Table S4). These were submitted to transferability tests with temperature
gradient to verify their amplification success (for more details, see Supplementary
material). Allele sizes were determined on ABI-3130 DNA Sequencer (Applied
Biosystems). Genotypic data were acquired using GeneMarker 2.6
(http://www.softgenetics.com/GeneMarker.html)

27
Nuclear DNA analyses
The occurrence of null alleles was verified with MicroChecker 2.2.3 (Oosterhout et al.,
2004). Deviation from Hardy-Weinberg’s equilibrium (HWE), estimates of inbreeding
coefficient (Fis) and Linkage Disequilibrium (LD) were detected using the GenePop online
version (http://genepop.curtin.edu.au/). Bonferroni corrections were applied for HWE and LD
multiple comparison analysis (Rice, 1989).
To access information about genetic diversity, indexes of observed and expected
heterozygosities (Ho and He, respectively) were inferred using Arlequin 3.5 (Excoffier &
Lischer, 2010). The first index regards the estimated fraction of heterozygotes on the
populations while the second is the real frequency of heterozygotes detected. Allele
richness (Ar) was calculated using Fstat 2.9.3.2 (Goudet, 2001). A hierarchical analysis
of molecular variance (AMOVA) was used to examine how the genetic variability of each
species is distributed across the landscape in Arlequin 3.5 (Excoffier & Lischer, 2010).
Here, we assumed three geographic hierarchical scales for comparison: individuals within
islands, between islands within archipelagos and between archipelagos. We also verified
correlations between genetic and geographic distances using Mantel tests.
To evaluate gene flow, pairwise FST comparing archipelagos were employed per species
using FreeNA with 10,000 randomizations (Chapuis & Estoup, 2007). This software
calculates corrected FST values considering occurrence of null alleles, a common artifact
when heterologous primers are used Chapuis & Estoup (2007).
Population structure based on allele frequencies was inferred using Structure 2.3.4
(Pritchard et al., 2000) with 100,000 generations, 10% burn-in and five iterations. Plots of
the absolute values of ln Pr(X|K) were generated by Structure Harvester 0.6.93 (Earl &
vonHoldt, 2012).
Mitochondrial DNA analyses
The model of sequence evolution per codon was defined by Bayesian Information
Criterion in PartitionFinder 1.1.0 (Lanfear, 2012). Bayesian phylogenetic analysis was
performed in MrBayes 3.2 (Ronquist et al., 2012) to evaluate relationships of lineages
28
from the Negro basin (Anavilhanas, Jaú, Mariuá and Branco) to samples from other
Amazonian rivers. For these phylogenetic analyses we used closely related species as
outgroups. We used four parallel MCMC (Markov Chain Monte Carlo) chains and
1,000,000 generations sampling every 100 generations. Initial 10% of generations were
discarded as burn-in.
We used a coalescent approach to estimate the timing of origin of the Negro basin clades
using BEAST 1.8 (Drummond & Rambaut, 2007). For this analysis, Hypocnemoides
maculicauda was used as the outgroup for H. melanopogon, while for the other three
species conspecific lineages from other Amazonian rivers were used as outgroups, based
on well supported clades found in the previous phylogenetic analysis (MrBayes). The Yule
speciation process was selected and a rate of evolution of 2.1% divergence per million
years for cytb (Weir & Schluter, 2008) was employed with an uncorrelated lognormal
relaxed clock (Drummond et al., 2006). We ran MCMC with 10,000,000 of generations,
discarding 10% as burn-in. Convergence of the runs was confirmed in TRACER 1.6
(Rambaut et al., 2014). FigTree 1.4.2 (Rambaut, 2012) was used to visualize the
phylogenetic trees.
The genealogy of haplotypes was evaluated in Network 4.6 (http://www.fluxus-
engineering.com/sharenet.htm) (Bandelt et al., 1999), including samples from the Negro basin
(Anavilhanas, Jaú, Mariuá and Branco). To verify the occurrence of population structure,
we estimated the number of clusters (k) using Bayesian posterior probability in BAPS 6.0
(Corander et al., 2013). The mixture model was applied to test for groups of individuals
using four iterations of k ranging from one to ten. No prior information about sampling
localities was provided.
Summary statistics related to number of haplotypes (Hn), haplotype diversity (Hd) and
nucleotide diversity (π) were calculated in DnaSP 5.0 (Librado & Rozas, 2009). To verify
hierarchical structure of the genetic variation, a hierarchical AMOVA was performed using
the same scenarios evaluated for the nuclear markers, based on global values of genetic
distance-based Фst. Also in this context, a pairwise matrix of dissimilarity index Фst
comparing the different Negro basin archipelagos was built. To evaluate the relationship

29
between geographic and genetic distances, Mantel tests were employed. These analyses
were computed in Arlequin 3.5 (Excoffier & Lischer, 2010).
To assess information about historical population demography within the Negro river
basin, Tajima’s D (Tajima, 1989) and Fu’s Fs (Fu, 1997) were used based on 10,000
coalescent simulations in DnaSP 5.0 (Librado & Rozas, 2009). Also in this context,
Extended Bayesian Skyline Plots (EBSP) were generated to infer variations on effective
population size through time using BEAST 1.8 (Drummond & Rambaut, 2007). Selection
of evolutionary models and evolutionary rates used were the same used to estimate
divergence times (described above). Setting of priors, operators and demographic
indicators followed recommendations of Heled & Drummond (2008). The Bayesian MCMC
was performed for 100,000,000 generations sampling every 100 generations, whilst
discarding the initial 10% of samples as burn-in. Finally, the convergence of runs was
evaluated on TRACER 1.6 (Rambaut et al., 2014).
RESULTS
Phylogeographical context of the Negro basin samples
As all studied species have distributions that are larger than the Negro basin,
phylogeographical analyses were performed using the mtDNA dataset to determine the
evolutionary relationships of the samples from this region on a larger spatial context. In H.
melanopogon samples from the western portion of the Amazon basin (upper Solimões)
appeared within the Negro river basin clade (Figure S1). Within M. assimilis samples from
western Amazon (upper Solimões) appeared as the sister group to an eastern clade
including samples from the Negro basin and from the lower Solimões and the
Amazon/Madeira/Tapajós rivers (Figure S1). Divergence between western and eastern
Amazonia was dated to about 400 ky (Figure 3). For both T. nigrocinereus and M. lugubris
the Negro river basin samples formed a monophyletic clade (Figure S1) that originated at
about 500 ky and 600 ky, respectively (Figure 3).

30
Population structure at the Negro basin
Microsatellite data
Eight microsatellite loci were polymorphic for H. melanopogon and T. nigrocinereus, while
five exhibited polymorphism in M. lugubris and M. assimilis (Table 2). Linkage
disequilibrium was not detected in any species. Considering differences between
observed and expected heterozygosity, several loci in all species were not in HWE after
Bonferroni correction, with some deviations being restricted to specific archipelagos
(Table S5). The possible occurrence of null alleles was indicated for these loci. The mean
observed heterozygosity ranged between 0.18 (M. lugubris) and 0.53 (T. nigrocinereus)
(Table 2).
Most nuclear genetic diversity has no correlation with geography, with 77.51% (M.
lugubris) to 92.05% (T. nigrocinereus) of the molecular variation occurring within islands
(Table 3). The absence of genetic structure associated with geographic features within
the Negro river basin was also evident for T. nigrocinereus by a significant correlation
between genetic and geographic distances found in the Mantel test (Figure S2).
Accordingly, despite STRUCTURE results indicated k=5 for H. melanopogon and M.
lugubris, and k=2 for M. assimilis (Figure S3), the small difference between likelihood
values and barplots interpretation indicates the occurrence of just one population
(Pritchard et al., 2000). Pairwise FST matrix between archipelagos ranged from -0.07
(tending to zero) to 0.03 (comparison between Jaú and Anavilhanas to M. assimilis),
indicating genetic similarity among islands of lower Negro and, consequently, gene flow
(Table S6).
Mitochondrial data
Sequences of cytb (911 to 1020bp) and ND2 (944 to 1027bp) were obtained for 175
individuals of the four studied species. The generalist floodplain species H. melanopogon
exhibited 29 haplotypes within the Negro River basin, with nucleotide diversity varying
from 0.4% in Anavilhanas to 0.7% in Jaú (Table 4). In contrast, the number of haplotypes
found for the specialist species in the same region ranged from 17 (M. lugubris) to 19 (T.
31
nigrocinereus), with lower nucleotide diversities when compared to H. melanopogon
(Table 4).
Accordingly, H. melanopogon haplotypes were differentiated by several mutational steps,
did not exhibit any relationship with geographic regions and only one population was
identified in the BAPS analysis (Figure 2). Within island specialist species some
geographic signal was present, but there were shared haplotypes between Anavilhanas
and Jaú (M. lugubris and M. assimilis) and among Anavilhanas, Jaú and Branco river (T.
nigrocinereus) (Figure 2). Population structure analysis identified two lineages for M.
lugubris and T. nigrocinereus, and three for M. assimilis (dashed lines, Figure 2).
Although most of the mitochondrial genetic diversity was within islands for all species (i.e.,
no geographic structure), a considerable proportion of genetic diversity was attributed to
comparisons between archipelagos for M. lugubris (24.04%) and M. assimilis (21.55%)
and between islands for H. melanopogon (29.03%) (Table 3). Pairwise dissimilarity index
between Jaú and Anavilhanas archipelagos was significant for M. lugubris (Table S6),
suggesting restricted gene flow.
Historical demography at the Negro basin
Demographic analyzes based on summary statistics detected signal of population
expansion in the Negro river basin for all the species (Table 4). Despite this, when the
archipelagos were analyzed independently, small demographic expansion was detected
for H. melanopogon in both Anavilhanas and Jaú. Among the island specialists, the signal
of demographic change were subtle or inexistent: in M. lugubris, just Tajima’s D in Jaú
was significant (D=-2.07). T. nigrocinereus exhibited expansion in Anavilhanas (Fs=-3.82)
and M. assimilis did not present signal of population demographic changes in any
archipelago.
Bayesian Skyline Plots corroborate the trends of population expansion within the Negro
river basin (Figure 4). Expansion events are not very pronounced and occurred at
approximately 50,000 years in H. melanopogon and M. lugubris, while in M. assimilis and
32
T. nigrocinereus, the expansion events were older, happening at 80,000 and 100,000
years before present, respectively.
DISCUSSION
Historical connections among Amazonian insular birds
This study is one of the first efforts to understand population dynamics in Amazonian
fluvial island birds. These naturally fragmented environments represent a significant area
of floodplains and harbor specialized fauna and flora communities, which exhibit
mechanisms for dealing with seasonal changes in flooding level (Piedade et al., 2005;
Cintra et al., 2007). For this reason, different patterns recovered in species with distinct
ecological characteristics are possibly related to differing strategies to use these flooded
habitats.
In a broader geographic scale, the identification of distinct lineages within M. lugubris, M.
assimilis and T. nigrocinereus associated to different Amazonian rivers may be an
indication of higher restriction to gene flow in islands specialist species when compared
to floodplain generalist species. The discrete distribution of genetic diversity in these
floodplain species contradicts the proposal of river-created habitats as “corridors” to gene
flow. Indeed, Aleixo (2006) found a lack of population structure in two Dendrocolaptidae
species that occupy floodplains. Xiphorhynchus obsoletus and X. kienerii exhibited one
haplotype widely shared throughout the species distributions, and AMOVA results
indicated high genetic variation within populations (Aleixo, 2006). These patterns may be
due to the use of continuous environments at the rivers banks in a generalist manner by
these species. A similar pattern was observed in Chrysomus icterocephalus (Icteridae),
with one ancestral haplotype represented throughout its whole distribution (Cadena et al.,
2011), but in this case, besides habitat connectivity, the use of open vegetation areas by
these birds may also promote gene flow (Bates et al., 2003).
On the other hand, considering the high microhabitat specialization of island specialist
Antbirds, it may be expected that there are limitations to dispersal in regions where islands
are rare or absent. The results obtained for T. nigrocinereus agree with the hypothesis
that microhabitat continuity rules gene flow in specialist species. In the lower Negro River

33
archipelagos, where distances among islands are smaller, the genetic differentiation of
nuclear DNA correlates with geographic distances, a pattern that is expected in
continuous habitat conditions. Besides, AMOVA results for both markers in this species
exhibited more than 90% of variation occurring without relationship to geographic
structure<distance?>, similar to the result obtained in X. obsoletus and X. kienerii (Aleixo,
2006). In contrast, different lineages of T. nigrocinereus were found in islands from other
Amazonian rivers (Solimões, Madeira, Tapajós and Amazonas). The absence of islands
in the final stretch of lower Negro may act as a barrier to dispersal for this species. Another
peculiarity of this region that may reduce gene flow are the poorly developed floodplains
in river banks (Franzinelli & Igreja, 2002). Therefore, even the occasional use of the river
margins by T. nigrocinereus is impaired, which may have interrupted connectivity and,
consequently, isolated populations from the Negro basin.
Population dynamics of Negro river basin insular birds
Even considering the restricted mobility and territorialism typical of the Thamnophilidae,
we found evidence of varying degrees of gene flow among islands and archipelagos of
the Negro river basin for the four studied species. Most of the genetic variation occurred
without relationship to geography, pairwise dissimilarity indexes comparing Anavilhanas
and Jaú were not significant in most cases, nuclear DNA variation indicates one single
population within each species, and there were shared haplotypes among areas.
Despite this lack of population structure related to the distinct archipelagos, genetic
diversity is not homogeneously distributed in the landscape. The percentage of molecular
variation related to geographic structure (i.e., between islands or between archipelagos)
were considerably high in H. melanopogon, M. assimilis and M. lugubris. It should also be
noted that this last species exhibits significant values of Фst when comparing mtDNA data
for the Anavilhanas and Jaú archipelagos, and that population structure analysis of this
same dataset indicates the presence of more than one population for the three island
specialists. Accordingly, for the nuDNA, deviations in HWE restricted to a specific
geographic area may indicate differences in allele frequencies as a result of population
substructure (Bradic et al., 2012).

34
The fact that stronger indication of population structure among archipelagos was found in
the mtDNA dataset but not in the nuDNA may reflect the differences on effective
population size for the two kinds of marker. Population size of island species may be low,
and even lower for the haploid and maternally inherited mtDNA, making this marker faster
in fixing differences among populations. It is also possible that the indication of population
structure found for the mtDNA data refers to a historical isolation, with gene flow being
recently re-established due to wetter conditions since the last glacial or to increased
formation of island environments after the recent evolution of the lower Negro river
(Latrubesse & Franzinelli, 2005).
The use of islands by generalist floodplain species also occurs in a different manner when
compared to other floodplain environments. While X. obsoletus, X. kienerii and C.
icterocephalus shared haplotypes across their ranges and did not exhibit any evidence of
geographic<genetic?> structure (Aleixo, 2006; Cadena et al., 2011), H. melanopogon has
greater nucleotide diversity, exhibiting just few haplotypes shared among individuals.
Burney & Brumfield (2009) evaluated the effect of physiographic barriers on 40 bird
species from the Neotropical lowlands and concluded that organisms that use different
vegetation strata have distinct patterns of genetic variation, with canopy species exhibiting
low genetic variation due their higher dispersal ability, while understory species were more
sensitive to barriers (Burney & Brumfield, 2009). In fluvial islands this pattern cannot be
expected. Birds that occupy midstory or canopy are possibly less vulnerable to water level
variation, while organisms that use understory (as H. melanopogon) have to go through
vertical or horizontal displacement in flooding periods. The pattern of genetic diversity
found in H. melanopogon is possibly a result of several events of displacement from
islands with subsequent re-colonization, due to seasonal unavailability of the islands
understory. A similar pattern was observed in small rodents that occupy lower vegetation
stratum of insular habitats in the Araguaia River (Rocha et al., 2014). In contrast, fluvial
island specialists remain on these environments throughout the year by having adaptive
features to deal with the seasonal flooding (Rosenberg, 2009). Possibly these birds
moving on vegetation strata, shifting vertically.
35
Biogeography of Negro river basin island birds in an Amazonian context
Although all of them occupy the same river islands, the four species studied here have
distinct phylogeographic patterns (Figure 2). Hypocnemoides melanopogon does not
show a clear geographic structure of its genetic diversity, while the three island specialist
species exhibit some genetic structure related to island systems from different rivers. For
these three species, the Negro basin clade diverged from populations from western
Amazonia (upper and middle Solimões) during the Pleistocene, and, despite large
confidence intervals, the estimated dates for this split overlap at about 500 ky before
present.
The Anavilhanas archipelago probably formed due to Holocene sediment deposition
(Latrubesse & Franzinelli, 2005), so that the origin of Negro River basin island specialist
lineages predates the origin of this archipelago. This suggests an intense dynamic of
island habitats availability in the lower Negro river region, which may have created fleeting
insular environments that were occupied by ancestral lineages. This scenario is possible
considering the influence of Quaternary climatic and eustatic changes on the discharge
and sedimentation rates of Amazonian rivers (Iriondo & Latrubesse, 1994; Irion et al.,
2009). Concerning the Negro River, rising sea levels in interglacial periods may have
caused a backwater effect that promoted lentic conditions, favoring deposition of fine
material and island formation (Irion et al., 2009), but also complete flooding of some island
systems close to river mouths. Subsequently, glacial periods led to an increase in the
energy of the drainage system, causing erosion of island fine grained sediments, and
deposition of larger particles (Irion et al., 2009). It is not clear what were the real effects
of these processes on insular habitats availability, but they possibly promoted the
origination, evolution and extinction of islands and archipelagos, interfering on the
establishment of ancestral populations in the lower Negro river region.
Accordingly, slight signals of population expansion events in the four species were dated
to the Pleistocene. These events, though, seem much less pronounced than population
expansions that have been reported for Amazonian upland forest species (Fernandes et
36
al., 2012; Ribas et al., 2012). Contrary to most upland forest species, floodplain organisms
seem to have smaller populations of more constant size through recent times (Aleixo,
2006). Possibly, river-created environments suffer spatial rearrangements and changes
in connectivity, but not large variations in habitat availability during glacial periods (Aleixo,
2006; Irion et al., 2009).
The congruent timing of the divergence between lineages from the Negro and western
Amazonian (upper and middle Solimões) islands may be related to geologic events that
affected the establishment of channels and islands in central Amazonia (Almeida-Filho &
Miranda 2007, Santos et al 2015). This region was probably very dynamic due to the
recent connection between the formerly independent drainage systems of eastern and
western Amazonia (Nogueira et al., 2013), which may have generated current patterns of
genetic diversity found in several organisms. East-west variations in biological
communities of flooded forests (várzea) have been described for trees, ants, spiders and
fishes, being the confluence between the Negro and the Solimões rivers a common
geographical limit for changes in composition or abundance of species (Albernaz et al.,
2007; Vasconcelos, 2007; Venticinque et al., 2007; Zuanon et al., 2007). Furthermore,
several várzea bird species distributions are have their limits at this same region (Cohn-
Haft et al., 2007), and phylogeographic breaks in this area have been detected for
Brotogeris sanctithomae (Canton, 2014) and for discus fishes (Symphysodon spp.)
(Farias & Hrbek, 2008). This dynamic history of central Amazonian riverine habitats is
especially evident in the recent history of the lower Negro river. A complex network of
palaeochannels linked the middle Negro river with the Manacapuru River, a tributary of
the Solimões (Almeida-filho & Miranda, 2007). When active, these channels may have
allowed the connection between populations from the middle Negro and lower Solimões
through small islands or riverbanks. Thereafter, neotectonic events promoted a mega
capture of the lower Negro river (Almeida-filho & Miranda, 2007), which originated the
current channel and interrupted the connectivity between these two regions. Even with
the development of the Anavilhanas archipelago, Negro river basin lineages remain
isolated because the final stretch of the lower Negro has no insular habitats.
37
Implications for Amazonian biogeography and conservation
Large Amazonian rivers are known to influence distribution and genetic diversity patterns
of upland forest birds (Cracraft, 1985; Ribas et al 2012), but diversification patterns of
species that occupy river-created habitats are still poorly known. Thus, understanding the
history and organization of lineages from floodplain or riverine habitats may offer important
information on drainage evolution and, consequently, on the origins of Amazonian
biodiversity. Here we show that birds from riverine islands have a dynamic history of
contact and isolation, but with small historical fluctuation of population sizes, in sharp
contrast with the patterns that have been described for upland forest birds. The small
genetic distances across the basin, even when there is spatial structuring of the genetic
diversity, points to a recent history of the island avifauna, and possibly to a recent
origination of the Amazonian flooded habitats that we know today, greatly influenced and
adapted to the annual flood pulse.
Amazonian flooded habitats are currently under special pressure due to the focus on
developmental projects directed to generating hydroelectric power through the
construction of large dams. These dams will disrupt the natural flooding pulse and
permanently flood several river islands. Species as T. nigrocinereus and M. lugubris are
already considered near threatened due the possible habitat reduction in the next years
(IUCN, 2015). Understanding population structure and habitat use in island specialist
species is important to access and mitigate these impacts.
ACKNOWLEDGEMENTS
We thank the curators and staff of Instituto Nacional de Pesquisas da Amazônia, Manaus,
Brazil (INPA), Laboratório de Genética e Evolução Molecular de Aves, São Paulo, Brazil
(LGEMA), Museu Paraense Emílio Goeldi, Belém, Brazil (MPEG), and Zoological
Museum of Cambridge University, England (ZMCU) for providing samples. We are also
grateful to the staff of the Laboratório Temático de Biologia Molecular (INPA). We thank
Instituto Chico Mendes de Conservação da Biodiversidade (ICMBio) and the Anavilhanas
National Park, which through the ARPA consortium provided logistic and financial support
38
to field work. Fundação Vitória Amazônica (FVA) also provided logistic support to field
work. Finally, we are grateful to financial support provided by CNPq (grant #014/2011,
fellowship # 307951/2012-0 to CCR), and by NSF, NASA and FAPESP (Dimensions US-
BIOTA-Sao Paulo: Assembly and evolution of the Amazonian biota and its environment:
an integrated approach; NSF grant #1241066, FAPESP grant #2012/50260-6).
REFERENCES
Ágreda A., Lieckfeldt D., Schmidt A., & Pitra C. (2006) Characterization of polymorphic
microsatellite loci in Castelnau’s Antshrike, Thamnophilus cryptoleucus (Aves:
Thamnophilidae). Molecular Ecology Notes, 6, 434–436.
Albernaz A.L., Moreira M.P., Ramos J., Assunção P.A. & Franciscon C.H. (2007)
Contribuição ao conhecimento da distribuição de árvores. Conservação da Várzea:
Identificaçao e caraterizaçao de regiões biogeográficas (ed. by A.L. Albernaz), pp.
354. ProVárzea/IBAMA, Manaus.
Aleixo A. (2006) Historical diversification of floodplain forest specialist species in the
Amazon: A case study with two species of the avian genus Xiphorhynchus (Aves:
Dendrocolaptidae). Biological Journal of the Linnean Society, 89, 383–395.
Almeida-filho R. & Miranda F.P. (2007) Mega capture of the Rio Negro and formation of
the Anavilhanas Archipelago , Central Amazônia , Brazil : Evidences in an SRTM
digital elevation model. Remote Sensing of Enviroment, 110, 387–392.
Armacost-Jr J.W. & Capparella A.P. (2012) Use of Mainland Habitats by Supposed River-
Island Obligate Birds along the Amazon River in Peru. The Condor, 114, 56–61.
Ayres J.M. & Clutton-Brock T.H. (1992) River boundaries and species range size in
Amazonian primates. The American Naturalist, 140, 531–537.
39
Bandelt H.J., Forster P., & Röhl a (1999) Median-joining networks for inferring intraspecific
phylogenies. Molecular biology and evolution, 16, 37–48.
Barnett J.R., Woltmann S., Stenzler L., Bogdanowicz S.M., & Lovette I.J. (2007) Isolation
and characterization of microsatellite markers from the chestnut-backed antbird,
Myrmeciza exsul. Molecular Ecology Notes, 7, 1070–1072.
Bates J.M., Tello J.G., & Da Silva J.M.C. (2003) Initial Assessment of Genetic Diversity in
Ten Bird Species of South American Cerrado. Studies on Neotropical Fauna and
Environment, 38:2, 87–94.
Beja P., Santos C.D., Santana J., Pereira M.J., Marques J.T., Queiroz H.L., & Palmeirim
J.M. (2010) Seasonal patterns of spatial variation in understory bird assemblages
across a mosaic of flooded and unflooded Amazonian forests. Biodiversity and
Conservation, 19, 129–152.
Bradic M., Beerli P., García-de León F.J., Esquivel-Bobadilla S., & Borowsky R.L. (2012)
Gene flow and population structure in the Mexican blind cavefish complex (Astyanax
mexicanus). BMC Evolutionary Biology, 12, 9.
Burney C.W. & Brumfield R.T. (2009) Ecology predicts levels of genetic differentiation in
neotropical birds. The American naturalist, 174, 358–68.
Cadena D., Gutiérrez-Pinto N., Dávila N., & Chesser R.T. (2011) No population genetic
structure in a widespread aquatic songbird from the Neotropics. Molecular
Phylogenetics and Evolution, 58, 540–545.
Canton R. de C. (2014) Análise da variaçao fenotípica e genotípica do complexo
Brotogeris sanctithomae (Aves:Psittaciformes). Instituto Nacional de Pesquisas da
Amazônia,
Chapuis M.P. & Estoup A. (2007) Microsatellite null alleles and estimation of population
differentiation. Molecular Biology and Evolution, 24, 621–631.

40
Cintra R., Sanaiotti T.M., & Cohn-Haft M. (2007) Spatial distribution and habitat of the
Anavilhanas Archipelago bird community in the Brazilian Amazon. Biodiversity and
Conservation, 16, 313–336.
Cohn-Haft M., Naka L., & Fernandes A. (2007) Padrões de distribuiçao da Avifauna da
várzea dos rios Solimões e Amazonas. Conservação da Várzea: Identificaçao e
caraterizaçao de regiões biogeográficas (ed. by A.L. Albernaz), pp. 354.
ProVárzea/IBAMA, Manaus.
Corander J., Cheng L., Marttinen P., & Tang J. (2013) BAPS : Bayesian Analysis of
Population Structure. Manual v 6.0. Bioinformatics, 1–28.
Cracraft J. (1985) Historical biogeography and patterns of differentiation within the south
amercian avifauna: Areas of endemism. Ornithological Monographs, 36, 49–84.
Drummond A.J., Ho S.Y.W., Phillips M.J., & Rambaut A. (2006) Relaxed phylogenetics
and dating with confidence. PLoS Biology, 4, 699–710.
Drummond A.J. & Rambaut A. (2007) BEAST: Bayesian evolutionary analysis by
sampling trees. BMC evolutionary biology, 7, 214.
Earl D. a. & vonHoldt B.M. (2012) STRUCTURE HARVESTER: A website and program
for visualizing STRUCTURE output and implementing the Evanno method.
Conservation Genetics Resources, 4, 359–361.
Excoffier L. & Lischer H.E.L. (2010) Arlequin suite ver 3.5: A new series of programs to
perform population genetics analyses under Linux and Windows. Molecular Ecology
Resources, 10, 564–567.
Farias I.P. & Hrbek T. (2008) Patterns of diversification in the discus fishes (Symphysodon
spp. Cichlidae) of the Amazon basin. Molecular Phylogenetics and Evolution, 49, 32–
43.

41
Feldheim K.A., Woltmann S., & Kreiser B.R. (2010) Characterization of 20 additional
microsatellite loci for Myrmeciza exsul (Aves: Thamnophilidae: chestnut-backed
antbird). Molecular Ecology Resources, 10, 404–408.
Fernandes A.M., Cohn-haft M., Hrbek T., & Farias I.P. (2014) Rivers acting as barriers for
bird dispersal in the Amazon. 22, 363–373.
Fernandes A.M., Wink M., & Aleixo A. (2012) Phylogeography of the chestnut-tailed
antbird (Myrmeciza hemimelaena) clarifies the role of rivers in Amazonian
biogeography. Journal of Biogeography, 39, 1524–1535.
Franzinelli E. & Igreja H. (2002) Modern sedimentation in the Lower Negro River ,.
Geomorphology, 44, 259–271.
Fu Y.X. (1997) Statistical tests of neutrality of mutations against population growth,
hitchhiking and background selection. Genetics, 147, 915–925.
Haffer J. (1969) Speciation in Amazonian Forest Birds. Science, 165, 131–137.
Heled J. & Drummond A.J. (2008) Bayesian inference of population size history from
multiple loci. BMC evolutionary biology, 8, 289.
Irion G., Müller J., & Morais J. (2009) The impact of Quaternary sea level changes on the
evolution of the Amazonian lowland. Hydrological Processes, 3172, 3168–3172.
Iriondo M. & Latrubesse E.M. (1994) A PROBABLE SCENARIO FOR A DRY CLIMATE
IN CENTRAL AMAZONIA DURING THE LATE QUATERNARY. Quaternary
International, 21, 121–128.
IUCN (2015) The IUCN Red List of Threatened Species. Version 2015.1.
<http://www.iucnredlist.org>.

42
Junk W.J., Piedade M.T.F., Schöngart J., Cohn-Haft M., Adeney J.M., & Wittmann F.
(2011) A classification of major naturally-occurring amazonian lowland wetlands.
Wetlands, 31, 623–640.
Kaefer I.L., Tsuji-Nishikido B.M., Mota E.P., Farias I.P., & Lima A.P. (2012) The Early
Stages of Speciation in Amazonian Forest Frogs: Phenotypic Conservatism Despite
Strong Genetic Structure. Evolutionary Biology, 40, 228–245.
Lanfear R. (2012) PartitionFinder v1.1.0 and PartitionFinderProtein v1.1.0 Manual. 29,
1695–1701.
Latrubesse E.M. & Franzinelli E. (2005) The late Quaternary evolution of the Negro River,
Amazon, Brazil: Implications for island and floodplain formation in large anabranching
tropical systems. Geomorphology, 70, 372–397.
Librado P. & Rozas J. (2009) DnaSP v5: A software for comprehensive analysis of DNA
polymorphism data. Bioinformatics, 25, 1451–1452.
Nevo E., Beiles A., & Ben-Shlomo R. (1984) Evolutionary Dynamics of Genetic Diversity:
Ecological, Demographic and Life History Correlates. University of Haifa, Haifa.
Nogueira A.C.R., Silveira R., & Guimarães J.T.F. (2013) Neogene–Quaternary
sedimentary and paleovegetation history of the eastern Solimões Basin, central
Amazon region. Journal of South American Earth Sciences, 46, 89–99.
Oosterhout C. Van, Hutchinson W.F., Wills D.P.M., & Shipley P. (2004) MICRO-
CHECKER: Software for identifying and correcting genotyping errors in microsatellite
data. Molecular Ecology Notes, 4, 535–538.
Parolin P., De Simone O., Haase K., Waldhoff D., Rottenberger S., Kuhn U., Kesselmeier
J., Kleiss B., Schmidt W., Piedade M.T.F., & Junk W.J. (2004) Central Amazonian
Floodplain Forests: Tree Adaptations in a Pulsing System. The Botanical Review, 70,
357–380.
43
Piedade M.T.F., Junk W.J., Adis J., & Parolin P. (2005) Ecologia , zonação e colonização
da vegetação arbórea das ilhas de Anavilhanas. Pesquisas Botânicas, 56, 117–144.
Prance G.T. (1979) Notes on the vegetation of Amazonia III. The terminology of
amazonian forest types subject to inundation. Brittonia, 31, 26–38.
Pritchard J.K., Stephens M., & Donnelly P. (2000) Inference of population structure using
multilocus genotype data. Genetics, 155, 945–959.
Rambaut A., Suchard M.A., Xie D., & Drummond A.J. (2014) TRACER v1.6. 1–13.
Remsen J. V. & Parker T.A. (1983) Contribution of river-created habitats to bird species
richness in Amazonia. Biotropica, 15, 223–231.
Ribas C.C., Aleixo A., Nogueira A.C.R., Miyaki C.Y., Cracraft J., & Andre A. (2012) A
palaeobiogeographic model for biotic diversification within Amazonia over the past
three million years. Proceedings Biological sciences The Royal Society, .
Rice W.R. (1989) Analyzing Tables of Statistical Tests. Evolution, 43, 223–225.
Rocha R.G., Ferreira E., Fonseca C., Justino J., Leite Y.L.R., & Costa L.P. (2014)
Seasonal flooding regime and ecological traits influence genetic structure of two small
rodents. Ecology and Evolution, 4, 4598–4608.
Ronquist F., Teslenko M., van der Mark P., Ayres D.L., Darling A., Höhna S., Larget B.,
Liu L., Suchard M. a, & Huelsenbeck J.P. (2012) MrBayes 3.2: efficient Bayesian
phylogenetic inference and model choice across a large model space. Systematic
biology, 61, 539–42.
Rosenberg G.H. (1990) HABITAT SPECIALIZATION AND FORAGING BEHAVIOR BY
BIRDS OF AMAZONIAN RIVER ISLANDS IN NORTHEASTERN PERU. The
Condor, 92, 427.

44
Santos J.O., Munita C.S., & Soares E.A.A. (2015) Provenance studies in Amazon basin
by means of elemental chemistry composition obtained by INAA. J Radional Nucl
Chem, .
Schleuning M., Becker T., Vadillo G.P., Hahn T., Matthies D., & Durka W. (2011) River
dynamics shape clonal diversity and genetic structure of an Amazonian understorey
herb. Journal of Ecology, 99, 373–382.
Sioli H. (1984) The Amazon and its main afluents: Hydrography, morphology of the river
courses and river types. The Amazon: Limnology and landscape ecology of a mighty
tropical river and its basin (ed. by H. Sioli), pp. 127–165. Springer Netherlands,
Sorenson M.D., Ast J.C., Dimcheff D.E., Yuri T., & Mindell D.P. (1999) Primers for a PCR-
based approach to mitochondrial genome sequencing in birds and other vertebrates.
Molecular phylogenetics and evolution, 12, 105–14.
Tajima F. (1989) Statistical method for testing the neutral mutation hypothesis by DNA
polymorphism. Genetics, 123, 585–95.
Vasconcelos H.L. (2007) Padrões de distribuição de formigas na várzea Amazônica.
Conservação da Várzea: Identificaçao e caraterizaçao de regiões biogeográficas (ed.
by A.L. Albernaz), pp. 354. ProVárzea/IBAMA, Manaus.
Venticinque E.M., Rego F.N.A.A., Brescovit A.D., Rheims C.A. & Ruiz., G.R.S. (2007) A
araneofauna (Arachnida, Araneae) das várzeas do Rio Amazonas: padõres de
distribuição e estado do conhecimento atual. Conservação da Várzea: Identificaçao
e caraterizaçao de regiões biogeográficas (ed. by A.L. Albernaz), pp. 354.
ProVárzea/IBAMA, Manaus.
Weir J.T. & Schluter D. (2008) Calibrating the avian molecular clock. Molecular ecology,
17, 2321–8.
Wittmann F., Schöngart J., & Junk W.J. (2010) Phytogeography, Species Diversity,
Community Structure and Dynamics of Central Amazonian Floodplais Forests.

45
Amazonian Floodplain Forests: Ecophysiology, Biodiversity and Sustainable
Management (ed. by W.J. Junk, M.T.F. Piedade, F. Wittmann, J. Schöngart, and P.
Parolin), Springer, New York.
Wittmann F., Schöngart J., Montero J.C., Motzer T., Junk W.J., Piedade M.T.F., Queiroz
H.L., & Worbes M. (2006) Tree species composition and diversity gradients in white-
water forests across the Amazon Basin. Journal of Biogeography, 33, 1334–1347.
Zimmer K.J. & Isler M.L. (2003) Family Thamnophilidae (Typical Antbirds). Handbook of
the Birds of the World: Broadbills to Tapaculos. (ed. by Hoyo J.D., Elliot A. & Christie
D.A.) pp. 448-681. 8 ed. Lynx Edicions. Barcelona.
Zuanon J., Py-Daniel L.H.R., Ferreira E.J.G., Claro-Jr L.H. & Mendonça F.P. (2007)
Padrões de distribuição da ictiofauna na várzea do sistema Solimões-Amazonas,
entre Tabatinga (AM) e Santana (AP). Conservação da Várzea: Identificaçao e
caraterizaçao de regiões biogeográficas (ed. by A.L. Albernaz), pp. 354.
ProVárzea/IBAMA, Manaus.
SUPPORTING INFORMATION INDEX
Additional information may be found in the online version of this article:
Appendix S1 Summarized species characteristics and list of samples containing
vouchers, institutions and species used in this study.
Appendix S2 Collaborators, laboratorial procedures and table of primers.
Appendix S3 Supplementary results: full table of nuclear DNA summary analyzes,
pairwise FST matrices, Mantel test and Structure.

46
BIOSKETCH
Érik Choueri is a Masters student at the postgraduate program in Ecology, Instituto
Nacional de Pesquisas da Amazônia. Has interest in Island Biogeography, with emphasis
in population dynamics of birds in fluvial habitats and the evolution of these landscapes.
Author contributions: E.C. conducted the research and the writing as part of requirements
to achieved his Master degree; C.R and S.B. designed the study, contributed in the
discussion and writing of the manuscript; C.G. helped with laboratory procedures, data
analyzes and interpretation, and manuscript revision; G. T. Provided samples and
preliminary analysis. E.C. and S.B. also collected most of the samples from Anavilhanas
and Jaú National Park archipelagos.

47
TABLES
Table 1. Number of samples per species from each locality. Hm: Hypocnemoides.
melanopogon, Ml: Myrmoborus lugubris, Ma = Myrmotherula assimilis and Tn =
Thamnophilus nigrocinereus. *Sample correspondent to Thamnophilus cryptoleucus,
which is the taxon from the Solimões within the T. nigrocinereus-T, cryptoleucus
"species complex".
Rivers Reachs Hm Ml Ma Tn Total
Lower (Anavilhanas) 25 14 23 10 72
Negro Lower (Jaú) 26 22 8 17 73
Middle (Mariuá) 2 - 1 - 3
Branco Middle 2 2 1 2 7
Lower - - - 2 2
Upper - - 2 - 2
Solimões Middle 1 2 2 1* 6
Lower - - 2 - 2
Madeira Middle - 1 1 1 3
Tapajós Middle - - - 1 1
Amazon Upper - 1 2 - 3
Lower - - - 1 1
Total 56 42 42 35 175

48
Table 2. Summary of the nuDNA data obtained for samples from the Negro river basin
(Anavilhanas, Jaú, Mariuá and Branco islands). n, number of individuals; Na, number of
alleles; Ar, allele richness; Ho, observed heterozygosity; He, expected heterozygosity;
Fis, inbreeding coefficient.
n Na Ar Ho He Fis
H. melanopogon
Anavilhanas 25 7.75 7.42 0.42 0.63 0.30
Jaú 26 8.00 7.85 0.40 0.63 0.33
Total 56 11.12 10.8 0.41 0.65 0.33
M. lugubris
Anavilhanas 14 4.00 3.73 0.18 0.57 0.68
Jaú 28 7.23 6.78 0.24 0.62 0.57
Total 42 7.62 7.27 0.24 0.64 0.62
M. assimilis
Anavilhanas 23 5.40 5.33 0.48 0.57 0.16
Jaú 08 4.02 3.61 0.40 0.58 0.12
Total 35 7.42 7.18 0.46 0.60 0.20
T. nigrocinereus
Anavilhanas 10 4.87 4.49 0.46 0.64 0.26
Jaú 17 6.75 6.75 0.53 0.65 0.21
Total 27 7.87 7.65 0.50 0.66 0.25

49
Table 3. Percentage of genetic variation per geographic scale for both molecular
markers. Values in parenthesis refer to global dissimilarity indices FST (nuclear DNA)
and Фst (mitochondrial DNA). Bold values are significative (p-value ≤ 0.05).
H. melanopogon M. lugubris M. assimilis T. nigrocinereus
nuDNA mtDNA nuDNA mtDNA nuDNA mtDNA nuDNA mtDNA
Between
archipelagos
3.12
(0.00)
5.95
(0.06)
2.85
(0.02)
24.04
(0.24)
7.46*
(0.07)
21.55
(0.22)
5.76
(0.06)
2.68
(0.02)
Between
islands
11.17
(0.10)
29.03
(0.31)
19.64
(0.21)
3.72
(0.05)
4.80
(0.05)
15.52
(0.20)
2.18
(0.02)
-2.09
(-0.21)
Within islands
85.71
(0.10)
65.04
(0.35)
77.51
(0.22)
72.25
(0.28)
87.00
(0.12)
62.94
(0.37)
92.05
(0.08)
99.42
(0.00)
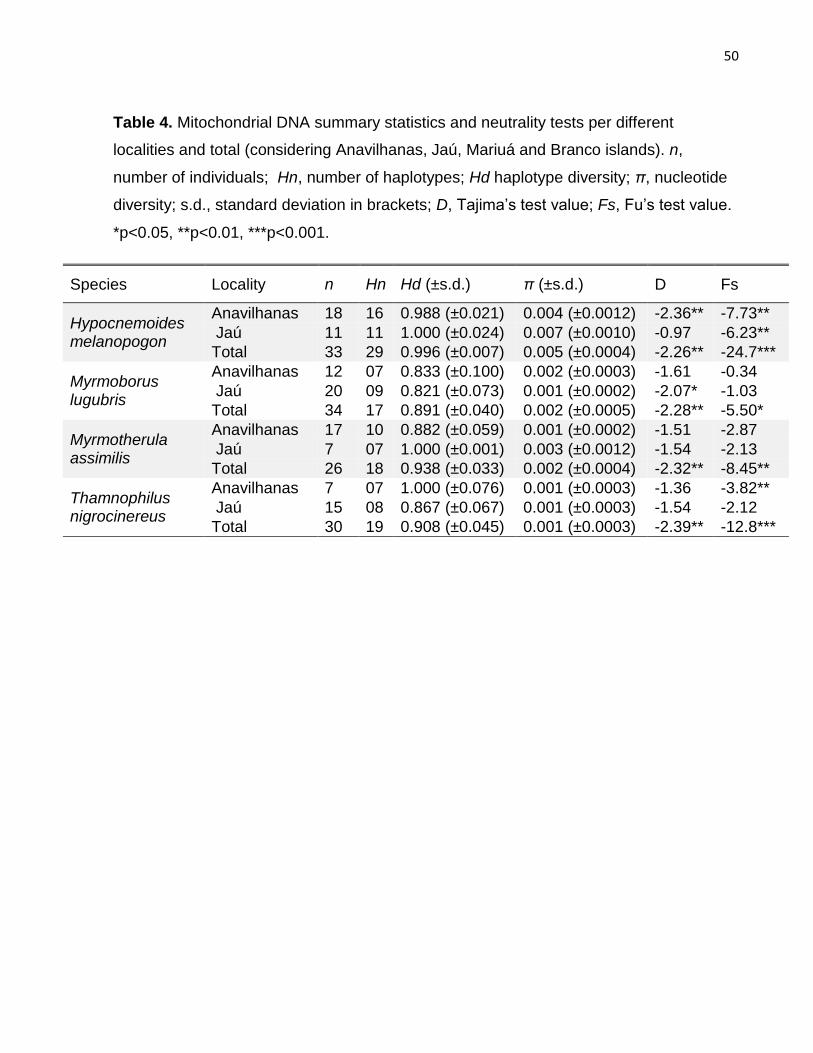
50
Table 4. Mitochondrial DNA summary statistics and neutrality tests per different
localities and total (considering Anavilhanas, Jaú, Mariuá and Branco islands). n,
number of individuals; Hn, number of haplotypes; Hd haplotype diversity; π, nucleotide
diversity; s.d., standard deviation in brackets; D, Tajima’s test value; Fs, Fu’s test value.
*p<0.05, **p<0.01, ***p<0.001.
Species Locality n Hn Hd (±s.d.) π (±s.d.) D Fs
Hypocnemoides melanopogon
Anavilhanas 18 16 0.988 (±0.021) 0.004 (±0.0012) -2.36** -7.73**
Jaú 11 11 1.000 (±0.024) 0.007 (±0.0010) -0.97 -6.23**
Total 33 29 0.996 (±0.007) 0.005 (±0.0004) -2.26** -24.7***
Myrmoborus lugubris
Anavilhanas 12 07 0.833 (±0.100) 0.002 (±0.0003) -1.61 -0.34
Jaú 20 09 0.821 (±0.073) 0.001 (±0.0002) -2.07* -1.03
Total 34 17 0.891 (±0.040) 0.002 (±0.0005) -2.28** -5.50*
Myrmotherula assimilis
Anavilhanas 17 10 0.882 (±0.059) 0.001 (±0.0002) -1.51 -2.87
Jaú 7 07 1.000 (±0.001) 0.003 (±0.0012) -1.54 -2.13
Total 26 18 0.938 (±0.033) 0.002 (±0.0004) -2.32** -8.45**
Thamnophilus nigrocinereus
Anavilhanas 7 07 1.000 (±0.076) 0.001 (±0.0003) -1.36 -3.82**
Jaú 15 08 0.867 (±0.067) 0.001 (±0.0003) -1.54 -2.12
Total 30 19 0.908 (±0.045) 0.001 (±0.0003) -2.39** -12.8***

51
FIGURES
Figure 1. Study area and sampled islands.
Figure 2. Haplotype networks per species. Colors refers to locality: Yellow: Anavilhanas;
Red: Jaú; Green: Solimões; Pink: Branco; Blue: Mariuá. Dashed lines indicate
populations inferred by the BAPS analysis.
Figure 3. Divergence times among intra specific lineages of the four studied species.
Numbers close to nodes are posterior probabilities. Nodes without these values had
support lower than 0.95. Blue bars are confidence intervals of divergence time
estimates. Vertical bars indicate collection localities: Green: upper and middle Solimões;
light green: lower Solimões; Orange: Amazon/Madeira/Tapajós; Pink: Branco River;
Blue: Mariuá archipelago; Gold: lower Negro islands. Birds’ images were adapted from
HBW Alive (http://hbw.com). ** outgroup: Hypocnemoides maculicauda
Figure 4. Extended Bayesian Skyline Plots for each species. Black line indicate
estimated mean. Gray background is the confidence interval.

52
Figure 1.
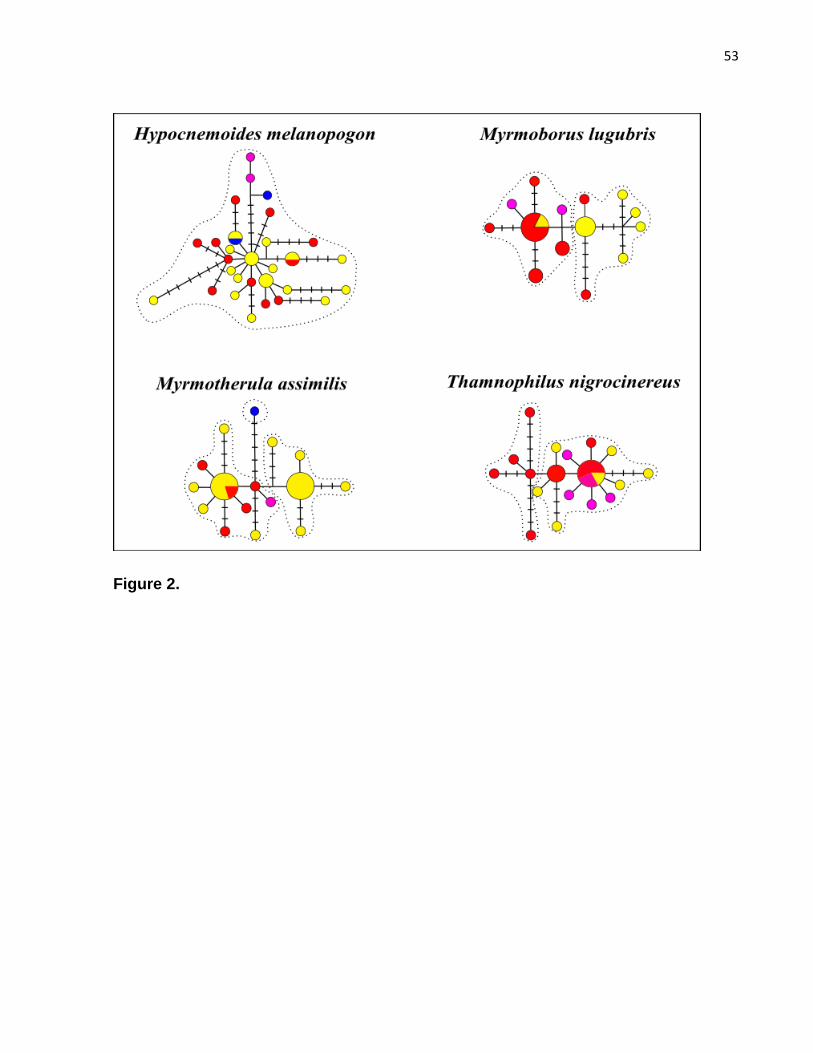
53
Figure 2.

54
Figure 3.

55
Figure 4.

56
SUPPORTING INFORMATION
Appendix S1
Table S1. Morphological and ecological characteristics of studied species as described
by Zimmer & Isler (2003, 1) and personal observations (2).
Species Average
size (cm)1
Average
weight (g)1
Ratio wing
length/weight2
Vegetation
Stratum2
Hypocnemoides
melanopogon 12 14 4.90
Understory
(0 – 2 m)
Myrmoborus lugubris 13 21 2.97 Understory
(0 – 3 m)
Myrmotherula assimilis 09 09 5.60 Understory/
mid-story
Thamnophilus
nigrocinereus 16 30 2.58
Understory/
mid-story

57
Table S2. Samples used including Locality, Species identification, voucher institution,
voucher number and geographical coordinates.
Locality Specie Institution Voucher # LAT LONG
NA Gymnocichla nudiceps LSUMZ 2228 NA NA
Anavilhanas Hypocnemoides melanopogon INPA A-16761 -2.49767 -61.0462
Anavilhanas Hypocnemoides melanopogon INPA A-16763 -2.49767 -61.0462
Anavilhanas Hypocnemoides melanopogon INPA A-16770 -2.60948 -60.8759
Anavilhanas Hypocnemoides melanopogon INPA A-16774 -2.60948 -60.8759
Anavilhanas Hypocnemoides melanopogon INPA A-16781 -2.60948 -60.8759
Anavilhanas Hypocnemoides melanopogon INPA A-16974 -2.60948 -60.8759
Anavilhanas Hypocnemoides melanopogon INPA A-16975 -2.60948 -60.8759
Anavilhanas Hypocnemoides melanopogon INPA A-16978 -2.60019 -60.9261
Anavilhanas Hypocnemoides melanopogon INPA A-16996 -2.37669 -61.0136
Anavilhanas Hypocnemoides melanopogon INPA A-16994 -2.37669 -61.0136
Anavilhanas Hypocnemoides melanopogon INPA A-16990 -2.33978 -61.0455
Anavilhanas Hypocnemoides melanopogon INPA A-16992 -2.33978 -61.0455
Anavilhanas Hypocnemoides melanopogon INPA A-16993 -2.33978 -61.0455
Anavilhanas Hypocnemoides melanopogon INPA A-17003 -2.57064 -60.7767
Anavilhanas Hypocnemoides melanopogon INPA A-17012 -2.68614 -60.7698
Anavilhanas Hypocnemoides melanopogon INPA A-17013 -2.68614 -60.7698
Anavilhanas Hypocnemoides melanopogon INPA A-17018 -2.68614 -60.7698
Anavilhanas Hypocnemoides melanopogon INPA A-17021 -2.68614 -60.7698
Anavilhanas Hypocnemoides melanopogon INPA A-17022 -2.68614 -60.7698
Anavilhanas Hypocnemoides melanopogon INPA A-17023 -2.68614 -60.7698
Anavilhanas Hypocnemoides melanopogon INPA A-17027 -2.69386 -60.6498
Anavilhanas Hypocnemoides melanopogon INPA A-17028 -2.69386 -60.6498
Anavilhanas Hypocnemoides melanopogon INPA A-17040 -2.69386 -60.6498
Anavilhanas Hypocnemoides melanopogon INPA A-17041 -2.74236 -60.7625
Anavilhanas Hypocnemoides melanopogon INPA A-17048 -2.74236 -60.7625
Jaú Hypocnemoides melanopogon INPA A-10595 -1.84383 -61.3801
Jaú Hypocnemoides melanopogon INPA A-10596 -1.84383 -61.3801
Jaú Hypocnemoides melanopogon INPA A-10509 -1.87567 -61.3671
Jaú Hypocnemoides melanopogon INPA A-10575 -1.87567 -61.3671
Jaú Hypocnemoides melanopogon INPA A-10577 -1.87567 -61.3671
Jaú Hypocnemoides melanopogon INPA A-10594 -1.87567 -61.3671
Jaú Hypocnemoides melanopogon INPA A-10601 -1.87567 -61.3671
Jaú Hypocnemoides melanopogon INPA A-4511 -1.88512 -61.4228
Jaú Hypocnemoides melanopogon INPA A-4512 -1.88512 -61.4228
Jaú Hypocnemoides melanopogon INPA A-4513 -1.88512 -61.4228
Jaú Hypocnemoides melanopogon INPA A-4514 -1.88512 -61.4228
Jaú Hypocnemoides melanopogon INPA A-15775 -1.855 -61.4383

58
Jaú Hypocnemoides melanopogon INPA A-15778 -1.855 -61.4383
Jaú Hypocnemoides melanopogon INPA A-15779 -1.855 -61.4383
Jaú Hypocnemoides melanopogon INPA A-15780 -1.855 -61.4383
Jaú Hypocnemoides melanopogon INPA A-15789 -1.855 -61.4383
Jaú Hypocnemoides melanopogon INPA A-15790 -1.855 -61.4383
Jaú Hypocnemoides melanopogon INPA A-15791 -1.855 -61.4383
Jaú Hypocnemoides melanopogon INPA A-15792 -1.855 -61.4383
Jaú Hypocnemoides melanopogon INPA A-15793 -1.855 -61.4383
Jaú Hypocnemoides melanopogon INPA A-15794 -1.855 -61.4383
Jaú Hypocnemoides melanopogon INPA A-15795 -1.855 -61.4383
Jaú Hypocnemoides melanopogon INPA A-15822 -1.68083 -61.4925
Jaú Hypocnemoides melanopogon INPA A-15826 -1.68083 -61.4925
Jaú Hypocnemoides melanopogon INPA A-15831 -1.68083 -61.4925
Jaú Hypocnemoides melanopogon INPA A-15832 -1.68083 -61.4925
Rio Branco Hypocnemoides melanopogon INPA A-8378 -0.53 -61.7992
Rio Branco Hypocnemoides melanopogon INPA A-8380 -0.53 -61.7992
Mariuá Hypocnemoides melanopogon INPA A-2273 -1.13333 -62.3833
Mariuá Hypocnemoides melanopogon INPA A-2274 -1.13333 -62.3833
Solimões Hypocnemoides melanopogon INPA A-052 -3.90278 -62.8222 Mato Grosso (Midwest Brazil)
Hypocnemoides maculicauda ZMCU S1301 -9.6 -55.9
Anavilhanas Myrmoborus lugubris INPA A-16773 -2.60948 -60.8759
Anavilhanas Myrmoborus lugubris INPA A-16799 -2.60019 -60.9261
Anavilhanas Myrmoborus lugubris INPA A-16792 -2.60019 -60.9261
Anavilhanas Myrmoborus lugubris INPA A-16793 -2.60019 -60.9261
Anavilhanas Myrmoborus lugubris INPA A-16808 -2.33978 -61.0455
Anavilhanas Myrmoborus lugubris INPA A-16809 -2.33978 -61.0455
Anavilhanas Myrmoborus lugubris INPA A-17001 -2.57064 -60.7767
Anavilhanas Myrmoborus lugubris INPA A-17002 -2.57064 -60.7767
Anavilhanas Myrmoborus lugubris INPA A-17010 -2.68614 -60.7698
Anavilhanas Myrmoborus lugubris INPA A-17011 -2.68614 -60.7698
Anavilhanas Myrmoborus lugubris INPA A-17017 -2.68614 -60.7698
Anavilhanas Myrmoborus lugubris INPA A-17035 -2.69386 -60.6498
Anavilhanas Myrmoborus lugubris INPA A-17042 -2.74236 -60.7625
Anavilhanas Myrmoborus lugubris INPA A-17043 -2.74236 -60.7625
Jaú Myrmoborus lugubris INPA A- 3419 -1.84383 -61.3801
Jaú Myrmoborus lugubris INPA A- 3566 -1.84383 -61.3801
Jaú Myrmoborus lugubris INPA A- 10504 -1.84383 -61.3801
Jaú Myrmoborus lugubris INPA A- 10505 -1.84383 -61.3801
Jaú Myrmoborus lugubris INPA A- 10592 -1.84383 -61.3801
Jaú Myrmoborus lugubris INPA A- 15798 -1.84383 -61.3801

59
Jaú Myrmoborus lugubris INPA A- 15803 -1.84383 -61.3801
Jaú Myrmoborus lugubris INPA A- 15804 -1.84383 -61.3801
Jaú Myrmoborus lugubris INPA A- 15805 -1.84383 -61.3801
Jaú Myrmoborus lugubris INPA A- 15806 -1.84383 -61.3801
Jaú Myrmoborus lugubris INPA A- 15807 -1.84383 -61.3801
Jaú Myrmoborus lugubris INPA A- 15808 -1.84383 -61.3801
Jaú Myrmoborus lugubris INPA A- 15809 -1.84383 -61.3801
Jaú Myrmoborus lugubris INPA A- 15810 -1.84383 -61.3801
Jaú Myrmoborus lugubris INPA A- 15812 -1.84383 -61.3801
Jaú Myrmoborus lugubris INPA A- 15815 -1.84383 -61.3801
Jaú Myrmoborus lugubris INPA A- 3095 -1.87567 -61.3671
Jaú Myrmoborus lugubris INPA A- 3100 -1.87567 -61.3671
Jaú Myrmoborus lugubris INPA A- 3103 -1.87567 -61.3671
Jaú Myrmoborus lugubris INPA A- 10508 -1.87567 -61.3671
Jaú Myrmoborus lugubris INPA A- 10589 -1.87567 -61.3671
Jaú Myrmoborus lugubris INPA A- 10591 -1.87567 -61.3671
Rio Branco Myrmoborus lugubris INPA A-8376 -0.53 -61.7992
Rio Branco Myrmoborus lugubris INPA A-8379 -0.53 -61.7992
Solimões Myrmoborus lugubris INPA A-960 -3.78106 -64.0254
Solimões Myrmoborus lugubris INPA A-971 -3.84583 -63.8301
Madeira Myrmoborus lugubris LGEMA ETA-438 NA NA
Amazonas Myrmoborus lugubris LGEMA ETA-518 NA NA
Anavilhanas Myrmotherula assimilis INPA A-16758 -2.49767 -61.0462
Anavilhanas Myrmotherula assimilis INPA A-16759 -2.49767 -61.0462
Anavilhanas Myrmotherula assimilis INPA A-16760 -2.49767 -61.0462
Anavilhanas Myrmotherula assimilis INPA A-16765 -2.49767 -61.0462
Anavilhanas Myrmotherula assimilis INPA A-16766 -2.49767 -61.0462
Anavilhanas Myrmotherula assimilis INPA A-16967 -2.49767 -61.0462
Anavilhanas Myrmotherula assimilis INPA A-16968 -2.49767 -61.0462
Anavilhanas Myrmotherula assimilis INPA A-16970 -2.60948 -60.8759
Anavilhanas Myrmotherula assimilis INPA A-16976 -2.60948 -60.8759
Anavilhanas Myrmotherula assimilis INPA A-16982 -2.37669 -61.0136
Anavilhanas Myrmotherula assimilis INPA A-16985 -2.37669 -61.0136
Anavilhanas Myrmotherula assimilis INPA A-16995 -2.37669 -61.0136
Anavilhanas Myrmotherula assimilis INPA A-17000 -2.33978 -61.0455
Anavilhanas Myrmotherula assimilis INPA A-17005 -2.57064 -60.7767
Anavilhanas Myrmotherula assimilis INPA A-17009 -2.68614 -60.7698
Anavilhanas Myrmotherula assimilis INPA A-17015 -2.68614 -60.7698
Anavilhanas Myrmotherula assimilis INPA A-17019 -2.68614 -60.7698
Anavilhanas Myrmotherula assimilis INPA A-17026 -2.69386 -60.6498
Anavilhanas Myrmotherula assimilis INPA A-17029 -2.69386 -60.6498
Anavilhanas Myrmotherula assimilis INPA A-17036 -2.69386 -60.6498
Anavilhanas Myrmotherula assimilis INPA A-17037 -2.69386 -60.6498

60
Anavilhanas Myrmotherula assimilis INPA A-17051 -2.74236 -60.7625
Anavilhanas Myrmotherula assimilis INPA A-17052 -2.74236 -60.7625
Jaú Myrmotherula assimilis INPA A-15802 -1.84383 -61.3801
Jaú Myrmotherula assimilis INPA A-15811 -1.84383 -61.3801
Jaú Myrmotherula assimilis INPA A-15813 -1.84383 -61.3801
Jaú Myrmotherula assimilis INPA A-15788 -1.855 -61.4383
Jaú Myrmotherula assimilis INPA A-15796 -1.855 -61.4383
Jaú Myrmotherula assimilis INPA A-15797 -1.855 -61.4383
Jaú Myrmotherula assimilis INPA A-15823 -1.68083 -61.4925
Jaú Myrmotherula assimilis INPA A-15834 -1.68083 -61.4925
Mariuá Myrmotherula assimilis INPA A-2270 -1.13333 -62.3833
Rio Branco Myrmotherula assimilis INPA A-8346 -0.53 -61.7992
Solimões Myrmotherula assimilis INPA A-937 -3.78106 -64.0254
Solimões Myrmotherula assimilis LGEMA ETA-212 -3.37944 -64.6411
Solimões Myrmotherula assimilis LGEMA ETA-046 -4.32436 -69.8862
Solimões Myrmotherula assimilis LGEMA ETA-051 -4.32436 -69.8862
Solimões Myrmotherula assimilis LGEMA ETA-336 -3.28775 -60.215
Solimões Myrmotherula assimilis LGEMA ETA-338 -3.28775 -60.215
Madeira Myrmotherula assimilis LGEMA ETA-399 -4.37547 -60.9542
Amazonas Myrmotherula assimilis LGEMA ETA-490 -3.15878 -58.3703
Amazonas Myrmotherula assimilis LGEMA ETA-549 -2.57986 -56.6792
NA Thamnomanes caesius LSUMZ B-9482 NA NA
NA Thamnophilus punctatus USNM B-4172 NA NA
Anavilhanas Thamnophilus nigrocinereus INPA A-16771 -2.60948 -60.8759
Anavilhanas Thamnophilus nigrocinereus INPA A-16785 -2.60948 -60.8759
Anavilhanas Thamnophilus nigrocinereus INPA A-16786 -2.60948 -60.8759
Anavilhanas Thamnophilus nigrocinereus INPA A-16798 -2.60019 -60.9261
Anavilhanas Thamnophilus nigrocinereus INPA A-16804 -2.37669 -61.0136
Anavilhanas Thamnophilus nigrocinereus INPA A-16817 -2.69386 -60.6498
Anavilhanas Thamnophilus nigrocinereus INPA A-16980 -2.60019 -60.9261
Anavilhanas Thamnophilus nigrocinereus INPA A-17038 -2.69386 -60.6498
Anavilhanas Thamnophilus nigrocinereus INPA A-17046 -2.74236 -60.7625
Anavilhanas Thamnophilus nigrocinereus INPA A-17049 -2.74236 -60.7625
Jaú Thamnophilus nigrocinereus INPA A- 4153 -1.87394 -61.3954
Jaú Thamnophilus nigrocinereus INPA A- 3093 -1.84383 -61.3801
Jaú Thamnophilus nigrocinereus INPA A- 3104 -1.84383 -61.3801
Jaú Thamnophilus nigrocinereus INPA A- 3565 -1.84383 -61.3801
Jaú Thamnophilus nigrocinereus INPA A- 10583 -1.84383 -61.3801
Jaú Thamnophilus nigrocinereus INPA A- 15799 -1.84383 -61.3801
Jaú Thamnophilus nigrocinereus INPA A- 15800 -1.84383 -61.3801
Jaú Thamnophilus nigrocinereus INPA A- 15801 -1.84383 -61.3801
Jaú Thamnophilus nigrocinereus INPA A- 15814 -1.84383 -61.3801
Jaú Thamnophilus nigrocinereus INPA A- 15816 -1.84383 -61.3801

61
Jaú Thamnophilus nigrocinereus INPA A- 15817 -1.84383 -61.3801
Jaú Thamnophilus nigrocinereus INPA A- 3099 -1.87567 -61.3671
Jaú Thamnophilus nigrocinereus INPA A- 3101 -1.87567 -61.3671
Jaú Thamnophilus nigrocinereus INPA A- 10585 -1.87567 -61.3671
Jaú Thamnophilus nigrocinereus INPA A- 4721 -1.88512 -61.4228
Jaú Thamnophilus nigrocinereus INPA A- 4722 -1.88512 -61.4228
Jaú Thamnophilus nigrocinereus INPA A- 15786 -1.855 -61.4383
Branco Thamnophilus nigrocinereus INPA A-5621 0.8827 -61.4338
Branco Thamnophilus nigrocinereus INPA A-5622 0.8827 -61.4338
Branco Thamnophilus nigrocinereus INPA A-8360 -0.53 -61.7992
Branco Thamnophilus nigrocinereus INPA A-8394 -1.29528 -61.8625
Solimões Thamnophilus cryptoleucus INPA A-943 -3.78106 -64.0254
Madeira Thamnophilus nigrocinereus INPA A-295 -5.34932 -60.7337
Tapajós Thamnophilus nigrocinereus INPA A-12366 -5.35292 -56.9646 Amazonas Thamnophilus nigrocinereus MPEG MAYA-003 -0.38684 -50.5541

62
Appendix S2
Laboratory procedures
To amplify mitochondrial regions, approximately 50 ng of DNA were used in Polymerase
Chain Reaction (PCR). The PCR mix consisted of PCR Green GoTaq® Flexi Buffer (5x),
Magnesium Chloride (25.0 mM), dNTP (2 mM), specific primers at 10 mM and 5U of Taq
Polymerase (Invitrogen) with the following profile: initial denaturation of 4 min at 94°C;
30 cycles of 60s at 94°C to denature, 60s at specific primer’s annealing temperature
(Table S2) and 2 min at 72°C. A final extension step of 10 min at 72°C finish the cycles.
PCR product was purified using PEG 8000 (Polyethylene glycol, NaCl and Milli-q water).
Purified products were sequenced with Big Dye® Terminator Kit XTerminator v3.1
cyclosequencing (Applied Biosystems), following the manufacturer’s protocol on a ABI
3130 Genetic Analyzer (Applied Biosystems).
Microsatellite variability was assessed using the following protocol: 4 min at 94°C,
followed by 30 cycles at 94°C for 30 s, 45 s at specific annealing temperature (Table S3)
and 45 at 72°C, and 8cycles at 94°C for 30 s, 45 s at 53°C and 72°C for 45 seconds,
finishing at 72°C for 10 min. Genotyping was performed on a ABI 3130 Genetic Analyzer
(Applied Biosystems) using GeneScan™ 500 ROX Size Standard (Applied Biosystems),
according to the manufacturer’s protocol.
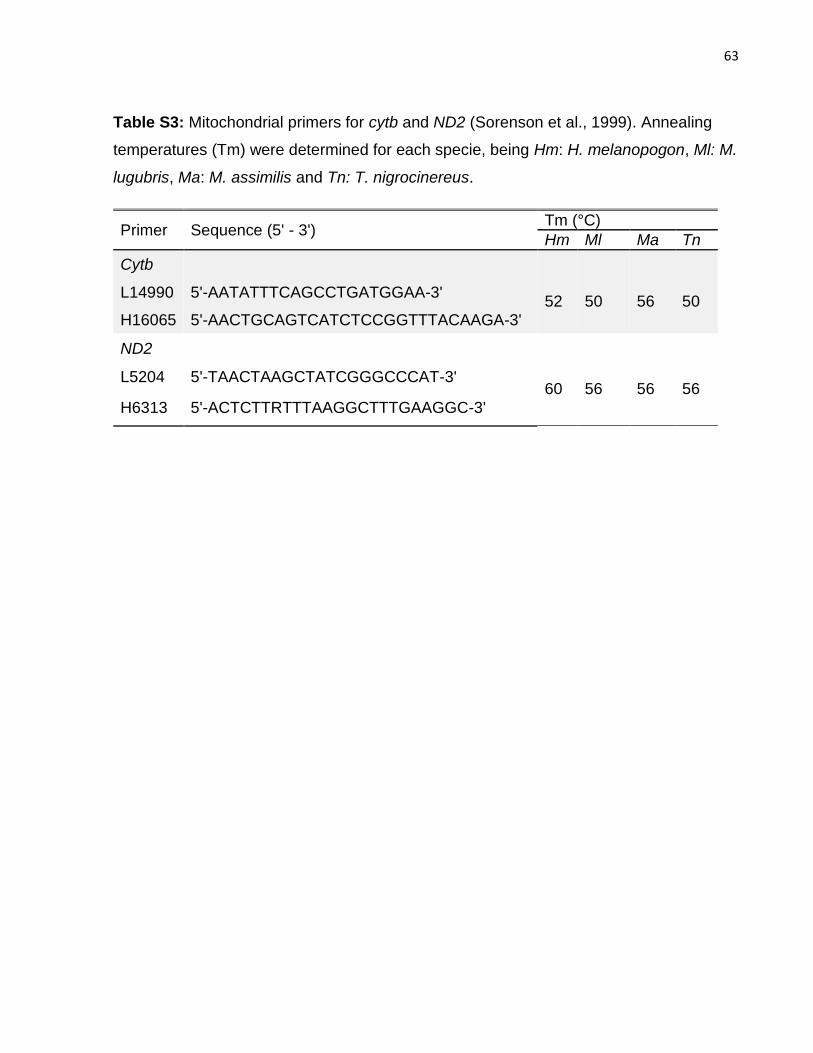
63
Table S3: Mitochondrial primers for cytb and ND2 (Sorenson et al., 1999). Annealing
temperatures (Tm) were determined for each specie, being Hm: H. melanopogon, Ml: M.
lugubris, Ma: M. assimilis and Tn: T. nigrocinereus.
Primer Sequence (5' - 3') Tm (°C)
Hm Ml Ma Tn
Cytb 52
50
56
50
L14990 5'-AATATTTCAGCCTGATGGAA-3'
H16065 5'-AACTGCAGTCATCTCCGGTTTACAAGA-3'
ND2
60
56
56
56
L5204 5'-TAACTAAGCTATCGGGCCCAT-3'
H6313 5'-ACTCTTRTTTAAGGCTTTGAAGGC-3'

64
Table S4: Microsatellite primers and annealing temperature (Tm) for each species
(Ágreda et al., 2006; Barnett et al., 2007; Feldheim et al., 2010). Hm: Hypocnemoides
melanopogon, Ml: Myrmoborus lugubris, Ma: Myrmotherula assimilis e Tn:
Thamnophilus nigrocinereus.
Primer Repeat motif Size (pb)
Sequence (5’-3’) Tm (°C)
Hm Ml Ma Tn
Mex 033
(TATC)13 220-252 GGTGGGATGAACCTTATCTAAAA
56 56 56 56 GGAGCAAATCTGGGACAAAT
Mex 178
(TGGA)14 229-253 GGCCACTACAGCAGATTTCA
55 57 55 55 AATTAAACTCATGGCCGAGGT
My Ex041
(GGAT)16 233-261 TGGCACCTCACTTGTAGGATGTAG
49 53 57 57 CAGAGTTCCCTAGCCTGGATTTAC
My Ex052
(GT)2TT(GT) 9TT(GT)8
213-283 GAGGCCAGTCAGTATGCTTTTCTG
52 56 57 59 CTGGCACCAAGTTTCACTAACACA
Thamno MicA11
(CW)43 274-306 AAGAAAATTGTGGAGGCATGTCTGC
60 60 60 60 ACCTTAGGGACTGGAGAGGCAC
Thamno MicD07
(CA)14 181-191 GCCATGCTGGCTGCATCCTTGTG
57 57 57 57 CAGAGAGTTCGGTTCTGAAGCGGTG
Thamno MicD09
(GAGT)11 190-230 ACAGTTAATGTGACTCCCCTAG
60 60 60 60 CACAGGGAACTGTCAACAAGC
Thamno MicG03
(GGAT)10 (AGAY)3 (GGAT)11
302-370 TGAAAGTGTTGTCTAAATGCTACC
53 58 58 58 ATCTCTCAATCTCCCCTCAGAC
References
Ágreda A., Lieckfeldt D., Schmidt A., & Pitra C. (2006) Characterization of polymorphic microsatellite loci in Castelnau’s Antshrike, Thamnophilus cryptoleucus (Aves: Thamnophilidae). Molecular Ecology Notes, 6, 434–436.
Barnett J.R., Woltmann S., Stenzler L., Bogdanowicz S.M., & Lovette I.J. (2007) Isolation and characterization of microsatellite markers from the chestnut-backed antbird, Myrmeciza exsul. Molecular Ecology Notes, 7, 1070–1072.
Feldheim K.A., Woltmann S., & Kreiser B.R. (2010) Characterization of 20 additional microsatellite loci for Myrmeciza exsul (Aves: Thamnophilidae: chestnut-backed antbird). Molecular Ecology Resources, 10, 404–408.
Sorenson M.D., Ast J.C., Dimcheff D.E., Yuri T., & Mindell D.P. (1999) Primers for a PCR-based approach to mitochondrial genome sequencing in birds and other vertebrates. Molecular phylogenetics and evolution, 12, 105–14.

65
Appendix S3
Table S5. Nuclear DNA summary statistics per loci. n, number of individuals; Na,
number of alleles; Ar, allele richness; Ho, heterozygosity observed; He, heterozygosity
expected; Fis, inbreeding coefficient. Asterisks represents significates deviations in
HWE after Bonferroni correction. “Total” include samples of Anavilhanas, Jaú, Branco
and Mariuá.
Species Locality (n)
Locus Na Ar Ho He Fis
H. m
ela
nop
ogo
n
An
avilh
an
as (
n=
25
)
Mex033 3 2.80 0.12 0.12 -0.02
ThamnoMicA11 5 4.92 0.16 0.36 0.55*
Mex178 9 9.00 0.75 0.80 0.06
ThamnoMicD07 4 3.79 0.36 0.46 0.23
MyEx041 13 12.15 0.56 0.90 0.38*
ThamnoMicD9 9 8.66 0.50 0.85 0.41*
MyEx052 9 8.33 0.21 0.71 0.70*
ThamnoMicG03 10 9.55 0.76 0.87 0.13
Mean 7.75 7.4 0.4275 0.63 0.30
Ja
ú (
n=
13
)
Mex033 3 2.92 0.08 0.07 -0.01
ThamnoMicA11 3 2.92 0.03 0.24 0.84*
Mex178 8 8.00 0.70 0.84 0.16
ThamnoMicD07 6 5.76 0.73 0.60 -0.21
MyEx041 12 11.68 0.76 0.87 0.12
ThamnoMicD9 6 6.00 0.40 0.63 0.37
MyEx052 17 16.67 0.26 0.94 0.71*
ThamnoMicG03 9 8.91 0.26 0.85 0.69*
Mean 8 7.85 0.40 0.63 0.33
To
tal (n
=5
5)
Mex033 3 2.99 0.09 0.09 -0.02 ThamnoMicA11 6 5.96 0.09 0.32 0.73* Mex178 11 11.0 0.69 0.82 0.17 ThamnoMicD07 6 5.81 0.54 0.53 0.00 MyEx041 18 17.25 0.68 0.90 0.25* ThamnoMicD9 10 9.96 0.45 0.79 0.44* MyEx052 24 23.04 0.23 0.91 0.75* ThamnoMicG03 11 10.68 0.53 0.87 0.37* Mean 11.12 10.83 0.41 0.65 0.33

66
Table S5. Continuation
Species Locality (n)
Locus Na Ar Ho He Fis M
. lu
gu
bris
An
avilh
an
as
(n=
14
)
ThamnoMicA11 3 2.88 0.14 0.56 0.75*
Mex178 6 6.00 0.11 0.83 0.87*
ThamnoMicD7 4 3.52 0.50 0.61 0.19
ThamnoMicD9 4 3.61 0.09 0.33 0.73*
MyEx052 3 2.64 0.07 0.53 0.87*
Mean 4 3.73 0.182 0.572 0.682
Ja
ú (
n=
22
)
ThamnoMicA11 4 3.90 0.36 0.43 0.23*
Mex178 9 8.89 0.16 0.85 0.67*
ThamnoMicD07 10 8.70 0.54 0.63 0.28*
ThamnoMicD9 6 6.00 0.13 0.68 0.76*
MyEx052 7 6.44 0.04 0.52 0.93*
Mean 7.2 6.786 0.246 0.622 0.574
To
tal (n
=3
8)
ThamnoMicA11 4 3.92 0.31 0.54 0.44*
Mex178 10 10.00 0.20 0.85 0.73*
ThamnoMicD07 10 8.90 0.52 0.66 0.26*
ThamnoMicD9 7 7.00 0.14 0.61 0.77*
MyEx052 7 6.54 0.05 0.56 0.91*
Mean 7.6 7.272 0.244 0.644 0.622
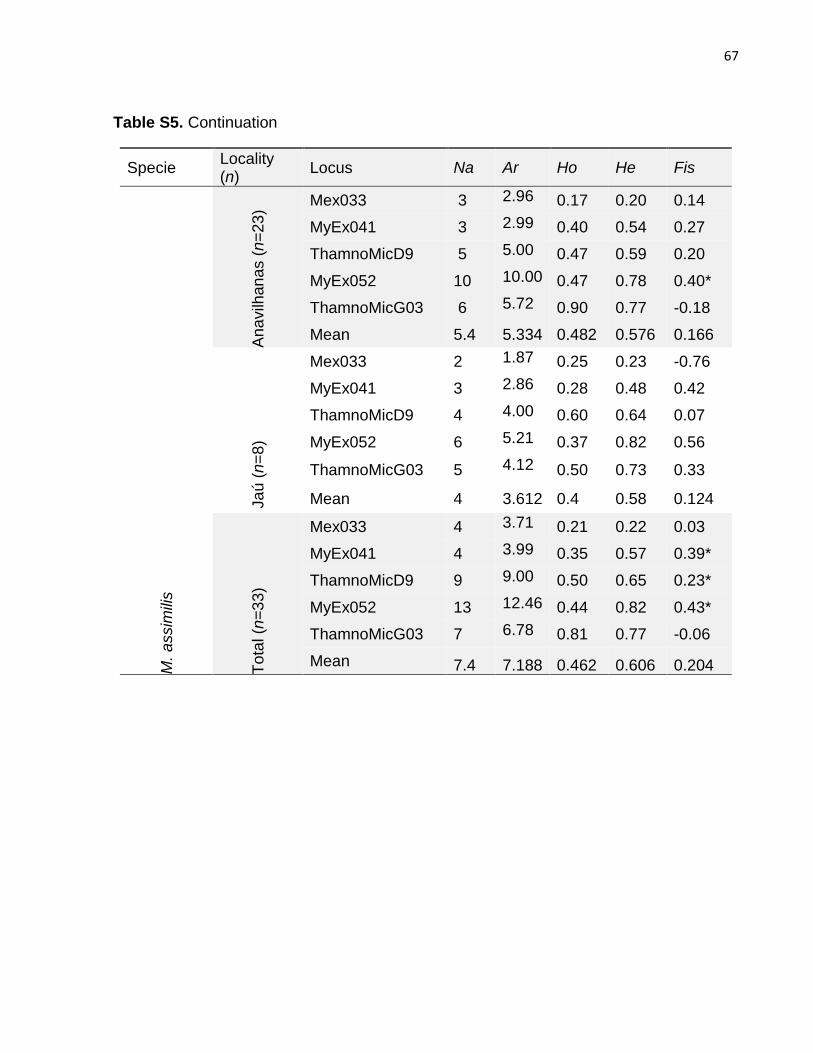
67
Table S5. Continuation
Specie Locality (n)
Locus Na Ar Ho He Fis M
. a
ssim
ilis
An
avilh
an
as (
n=
23
)
Mex033 3 2.96 0.17 0.20 0.14
MyEx041 3 2.99 0.40 0.54 0.27
ThamnoMicD9 5 5.00 0.47 0.59 0.20
MyEx052 10 10.00 0.47 0.78 0.40*
ThamnoMicG03 6 5.72 0.90 0.77 -0.18
Mean 5.4 5.334 0.482 0.576 0.166
Ja
ú (
n=
8)
Mex033 2 1.87 0.25 0.23 -0.76
MyEx041 3 2.86 0.28 0.48 0.42
ThamnoMicD9 4 4.00 0.60 0.64 0.07
MyEx052 6 5.21 0.37 0.82 0.56
ThamnoMicG03 5 4.12 0.50 0.73 0.33
Mean 4 3.612 0.4 0.58 0.124
To
tal (n
=3
3)
Mex033 4 3.71 0.21 0.22 0.03
MyEx041 4 3.99 0.35 0.57 0.39*
ThamnoMicD9 9 9.00 0.50 0.65 0.23*
MyEx052 13 12.46 0.44 0.82 0.43*
ThamnoMicG03 7 6.78 0.81 0.77 -0.06
Mean 7.4 7.188 0.462 0.606 0.204

68
Table S5. Continuation
Species Locality (n)
Locus Na Ar Ho He Fis T
. n
igro
cin
ere
us
An
avilh
an
as (
n=
10
)
Mex033 3 2.79 0.40 0.35 -0.14
ThamnoMicA11 7 6.36 0.30 0.82 0.64
Mex178 3 2.80 0.10 0.51 0.81
ThamnoMicD07 4 3.93 0.50 0.64 0.23
MyEx041 4 4.00 0.62 0.72 0.14
ThamnoMicD9 5 4.56 0.80 0.67 -0.19
MyEx052 8 6.93 0.40 0.70 0.44
ThamnoMicG03 5 4.60 0.60 0.72 0.18
Mean 4.87 4.49 0.46 0.64 0.26
Ja
ú (
n=
17
)
Mex033 5 5.00 0.23 0.36 0.36
ThamnoMicA11 11 11.00 0.47 0.81 0.43*
Mex178 3 3.00 0.05 0.51 0.88*
ThamnoMicD07 7 7.00 0.58 0.66 0.11
MyEx041 7 7.00 0.58 0.66 0.12
ThamnoMicD9 5 5.00 1.00 0.72 -0.40
MyEx052 9 9.00 0.41 0.73 0.45*
ThamnoMicG03 7 7.00 0.94 0.75 -0.24
Mean 6.75 6.75 0.53 0.65 0.21
Total (n=28)
Mex033 6 5.70 0.28 0.34 0.17
ThamnoMicA11 13 12.83 0.39 0.89 0.56*
Mex178 4 3.92 0.07 0.49 0.85*
ThamnoMicD07 7 6.91 0.53 0.63 0.15
MyEx041 8 8.00 0.61 0.70 0.13
ThamnoMicD9 6 5.84 0.92 0.72 -0.29
MyEx052 11 10.16 0.39 0.73 0.47*
ThamnoMicG03 8 7.91 0.82 0.80 -0.01
Mean 7.87 7.65 0.50 0.66 0.25

69
Table S6: Pairwise matrices of dissimilarity between archipelagos per species. FST
values (nuclear DNA) below the diagonal, Фst (mitochondrial DNA) above. Bold values
are significant after Bonferroni’s correction. Values with asterisks should not be
considered due small sample size. Negative values tend to zero.
Hypocnemoides melanopogon
Archipelagos Mariuá Jaú Anavilhanas Branco
Mariuá - 0.052* 0.203* 0.600*
Jaú -0.001 - 0.061 0.267*
Anavilhanas -0.007 0.000 - 0.367 *
Branco -0.171* -0.026* -0.054* -
Myrmoborus lugubris
Archipelagos Jaú Anavilhanas Branco
Jaú - 0.291 -0.002*
Anavilhanas -0.001 - 0.215*
Branco 0.043* 0.11* -
Myrmotherula assimilis
Archipelagos Mariuá Branco Jaú Anavilhanas
Mariuá - 0,100 * 0,069* 0,130*
Branco -0,010* - 0,031* 0,031*
Jau 0,030* 0,050* - 0,126
Anavilhanas 0,090 -0,080* 0,030 -

70
Table S6: Continuation
Thamnophilus nigrocinereus
Archipelago Jaú Anavilhanas Branco
Jaú - 0.084 -0.460
Anavilhanas -0.020 - -0.683
Branco 0.057* 0.006 -
71
Figure S1: Phylogenetic trees obtained in the MrBayes analysis based on mtDNa sequences (cytb and ND2). Values above nodes are posterior probabilities. Colored bars refer to sampling locality, being: Gold: lower Negro archipelagos; Pink: Branco River; Blue: Mariuá archipelago; Green: Solimões; Light green: lower Solimões; Orange: Amazon, Madeira or Tapajós rivers.
Figure S2: Mantel’s test plots. p-values refer to statistical significance, while r is linear regression adjustment.
Figure S3: Plots of maximum likelihood (LnP(k)) for different numbers of clusters (k),
followed by correspondent barplot (except for T. nigrocinereus, as k=1). Numbers below
barplots represent geographic area, being: 1: Solimões; 2: Jaú; 3: Anavilhanas; 4:
Branco; 5: Mariuá.

72
Figure S1.

73
Figure S2.

74
Figure S3.
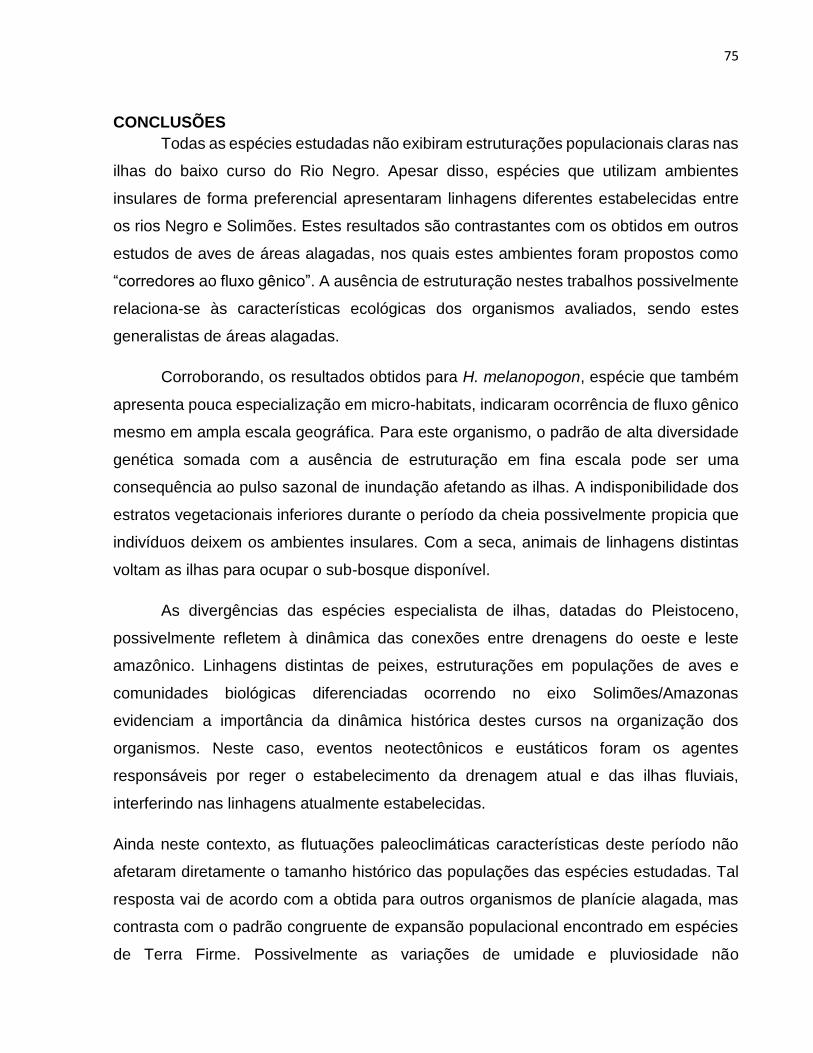
75
CONCLUSÕES
Todas as espécies estudadas não exibiram estruturações populacionais claras nas
ilhas do baixo curso do Rio Negro. Apesar disso, espécies que utilizam ambientes
insulares de forma preferencial apresentaram linhagens diferentes estabelecidas entre
os rios Negro e Solimões. Estes resultados são contrastantes com os obtidos em outros
estudos de aves de áreas alagadas, nos quais estes ambientes foram propostos como
“corredores ao fluxo gênico”. A ausência de estruturação nestes trabalhos possivelmente
relaciona-se às características ecológicas dos organismos avaliados, sendo estes
generalistas de áreas alagadas.
Corroborando, os resultados obtidos para H. melanopogon, espécie que também
apresenta pouca especialização em micro-habitats, indicaram ocorrência de fluxo gênico
mesmo em ampla escala geográfica. Para este organismo, o padrão de alta diversidade
genética somada com a ausência de estruturação em fina escala pode ser uma
consequência ao pulso sazonal de inundação afetando as ilhas. A indisponibilidade dos
estratos vegetacionais inferiores durante o período da cheia possivelmente propicia que
indivíduos deixem os ambientes insulares. Com a seca, animais de linhagens distintas
voltam as ilhas para ocupar o sub-bosque disponível.
As divergências das espécies especialista de ilhas, datadas do Pleistoceno,
possivelmente refletem à dinâmica das conexões entre drenagens do oeste e leste
amazônico. Linhagens distintas de peixes, estruturações em populações de aves e
comunidades biológicas diferenciadas ocorrendo no eixo Solimões/Amazonas
evidenciam a importância da dinâmica histórica destes cursos na organização dos
organismos. Neste caso, eventos neotectônicos e eustáticos foram os agentes
responsáveis por reger o estabelecimento da drenagem atual e das ilhas fluviais,
interferindo nas linhagens atualmente estabelecidas.
Ainda neste contexto, as flutuações paleoclimáticas características deste período não
afetaram diretamente o tamanho histórico das populações das espécies estudadas. Tal
resposta vai de acordo com a obtida para outros organismos de planície alagada, mas
contrasta com o padrão congruente de expansão populacional encontrado em espécies
de Terra Firme. Possivelmente as variações de umidade e pluviosidade não

76
proporcionaram drásticas alterações na disponibilidade dos habitats de várzea e igapó,
permitindo que o tamanho populacional das espécies estabelecidas fosse relativamente
constante.

77
ANEXO I (Ata de Qualificação)

78
ANEXO II (Ata de Defesa)