Embed Size (px)
Citation preview

Instituto Nacional de Pesquisas Espaciais – INPE
Centro de Ciência do Sistema Terrestre – CCST
Workshop de Apresentação da Ferramenta GLOBIO
para a Projeção de Cenários para Biodiversidade
Modelagem da Interação Biosfera-Atmosfera no INPE
Gilvan Sampaio
Rio de Janeiro – 25Mar2009
Regional Climate Change Over Eastern Amazonia
Caused by Pasture and Soybean Cropland
Expansion
Gilvan Sampaio1*, Carlos Nobre1, Marcos H. Costa2,
Prakki Satyamurty1, Britaldo S. Soares-Filho3 and
Manoel F. Cardoso1
1 CPTEC/INPE2 UFV
3 UFMG
Geophys. Res. Lett., 34, L17709.
13sep2007
EFFECTS OF LARGE SCALE DEFORESTTION
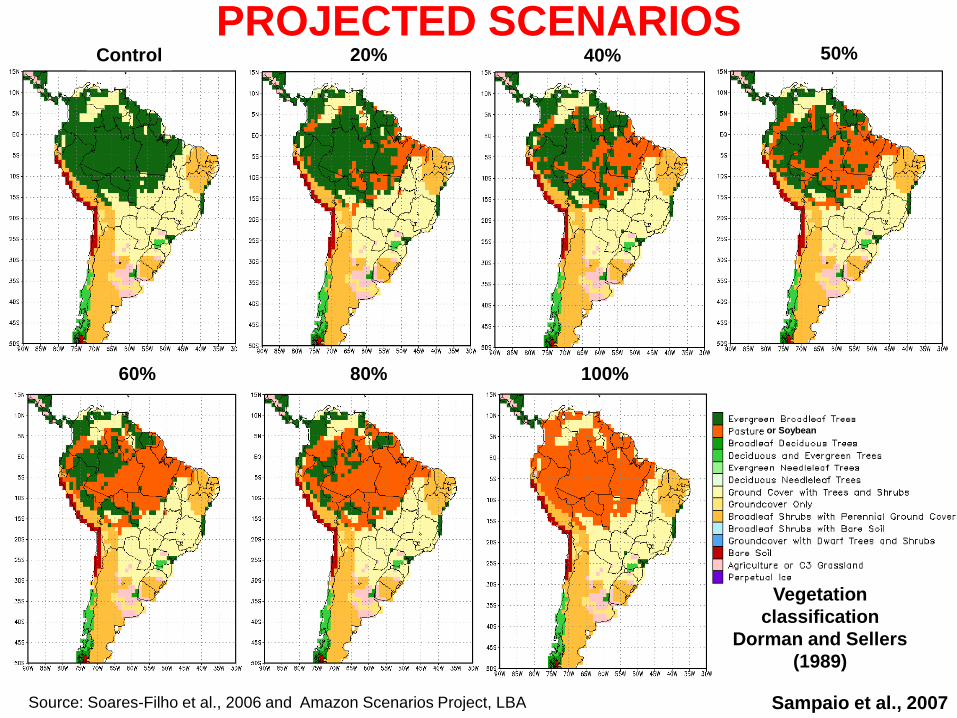
PROJECTED SCENARIOSControl 20% 40% 50%
60% 80% 100%
or Soybean
Source: Soares-Filho et al., 2006 and Amazon Scenarios Project, LBA Sampaio et al., 2007
Vegetation
classification
Dorman and Sellers
(1989)

Random Deforestation Scenarios (example of 50% deforestation)
Sampaio 2008
PhD Thesis

ALEAT Period All Pasture All Soybean
Annual -18,2% -25,8%
ASO -42,0% -47,4%
Precipitation (100% de desf.)
decrease in precipitation associated
with pasture or soybean expansion
PASTURE
PASTURE
SOYBEAN
The reduction in precipitation occurs mainly
during the dry season, and is more evident
when the deforested area is larger than
40% !Sampaio et al., 2007
Geophys. Res. Lett., 34

Elaboração de representação espacial atualizada do uso e
cobertura da terra na Amazônia e no NE brasileiro.

• The Potential Vegetation Model (PVM) uses 5 climate
parameters to represent the (SiB) biome classification.
• CPTEC-PVM is able to represent quite well the world’s
biome distribution.
• A dynamical vegetation model was constructed by
coupling CPTEC-PVM to the CPTEC Atmospheric
GCM (CPTEC-DVM).
CPTEC Potential Vegetation Model – CPTEC-PVMOyama and Nobre (2003, 2004)

Vegetation = f1 (climate variables)
= f1 (g0, g5, Tc, h, s)
g0 = degree-days above 0 C
g5 = degree-days above 5 C
Tc = mean temperature of the coldest month
h = aridity index
s = sesonality index
f1 is a highly nonlinear function
Climate = f2 (vegetation)
= f2 (AGCM coupled to vegetated land surface scheme)
f2 is also a nonlinear function
CPTEC-PVM was coupled to the CPTEC AGCM
Vegetation Model
CPTEC PVM
Atmospheric
Model
CPTEC AGCM
COUPLING

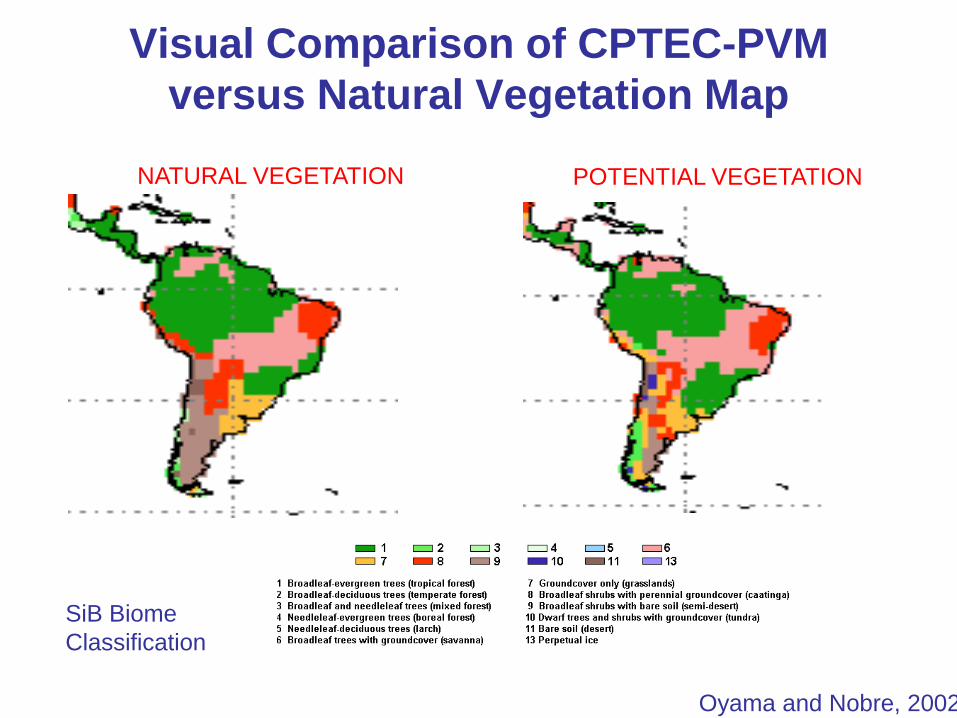
Visual Comparison of CPTEC-PVM
versus Natural Vegetation Map
Oyama and Nobre, 2002
CPTEC-PBM
SiB Biome
Classification
62% agreement on a global 2 deg x 2 deg grid
Visual Comparison of CPTEC-PVM
versus Natural Vegetation Map
SiB Biome
Classification
NATURAL VEGETATION POTENTIAL VEGETATION
Oyama and Nobre, 2002

Climate change consequences on the biome
distribution in tropical South America
Luis Salazar1, C. Nobre1 and M. D. Oyama2 (2007)
1 CPTEC/INPE2 IAE-CTA
Geophys. Res. Lett., 34, L09708,
doi:10.1029/2007GL029695

Climate Change Scenarios for Amazonia
Results from 15 AOGCMs for the SRES
A2 and B1 emissions scenarios,
prepared for the IPCC/AR4.
Models: BCCR-BCM2.0, CCSM3, CGCM3.1(T47),
CNRM-CM3, CSIRO-MK3, ECHAM5, GFDL-CM2,
GFDL-CM2.1, GISS-ER, INM-CM3, IPSL-CM4,
MIROC3.2 (MEDRES), MRI-CGCM2.3.2,
UKMO-HADCM3, ECHO-G

Projected distribution of natural biomes in South America for 2090-2099 from 15
AOGCMs for the A2 emissions scenarios.
Climate Change Consequences on the Biome distribution in
tropical South America
Salazar et al., 2007
Substituição da floresta tropical por savana !
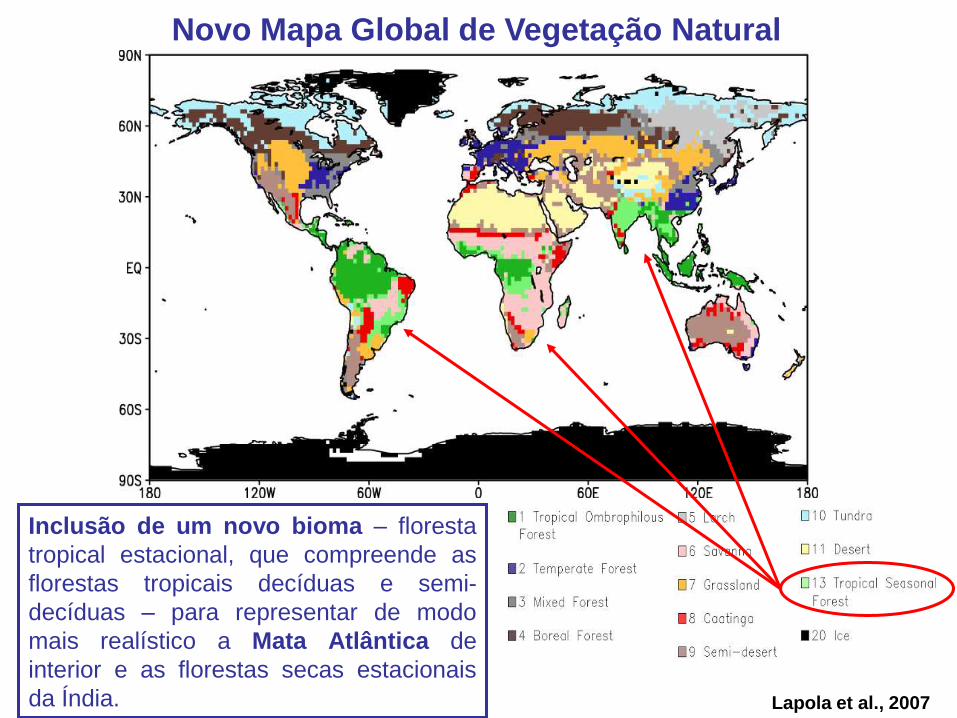
Novo Mapa Global de Vegetação Natural
Inclusão de um novo bioma – floresta
tropical estacional, que compreende as
florestas tropicais decíduas e semi-
decíduas – para representar de modo
mais realístico a Mata Atlântica de
interior e as florestas secas estacionais
da Índia. Lapola et al., 2007
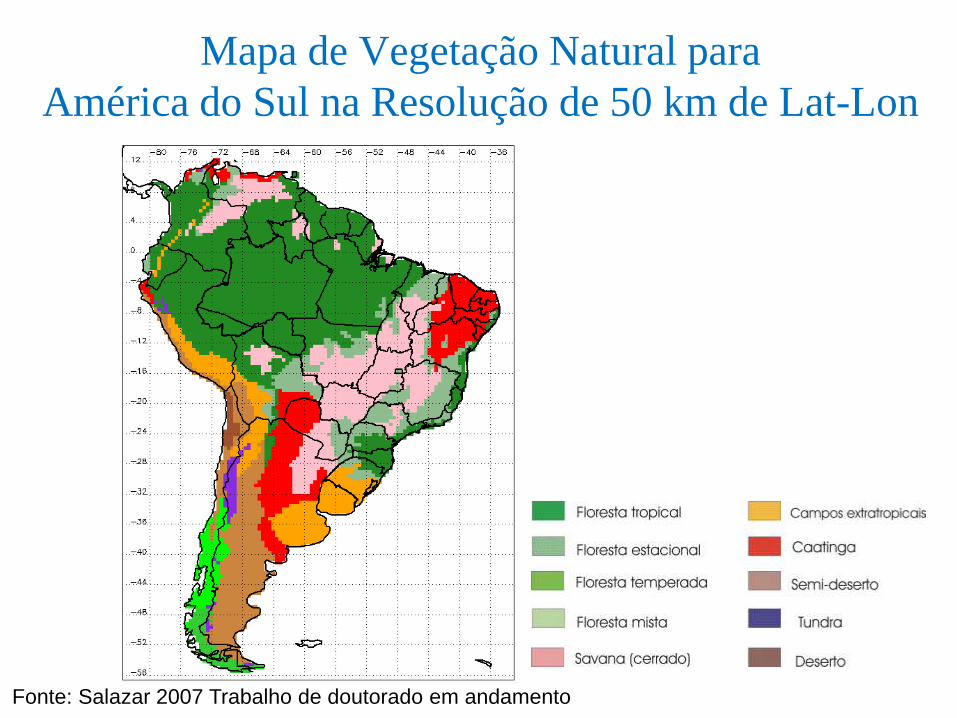
Mapa de Vegetação Natural para
América do Sul na Resolução de 50 km de Lat-Lon
Fonte: Salazar 2007 Trabalho de doutorado em andamento

Long-term potential for fires in estimates of
the occurrence of savannas in the tropics
Manoel F. Cardoso1, Carlos A. Nobre1, David M. Lapola1,
Marcos D. Oyama2 and Gilvan Sampaio1
Global Ecology and Biogeography, (2007)
DOI: 10.1111/j.1466-8238.2007.00356.x
1 CPTEC/INPE2 IAE-CTA

Cardoso et al. (2007), in press
Impact of using the new fire parameterization in the biomeestimates of the CPTEC Potential Vegetation Model:
Accounting for fires corrected important differences between previousmodel estimates and reference data for the position of natural savannasin the tropics. In specific, large areas in India and SE Asia that wereinitially estimated as savannas are now corrected to dry forests.
Major vegetation types:(1) broadleaf-evergreen trees (tropical forest), (2) broadleaf-deciduous trees (temperate forest)(3) broadleaf and needleleaf trees (mixed forest)(4) needleleaf-evergreen trees (boreal forest)(5) needleleaf-deciduous trees (larch), (6) broadleaf trees with groundcover (savanna)(7) groundcover only (prairie, steppes)(8) broadleaf shrubs with perennial groundcover (caatinga)(9) broadleaf shrubs with bare soil (semi-desert)(10) dwarf trees and shrubs with groundcover (tundra)(11) bare soil (desert)(13) ice.
Introduzindo um sub-modelo de carbono no
Potential Vegetation Model para estudos com
concentrações variáveis de CO2 (paleoclima e
climas futuros)

Inclusão do Ciclo de Carbono no CPTEC PVM
FOTOSSÍNTESE
BALANÇO
HÍDRICO
RESPIRAÇÃO
MICROBIANA
RESPIRAÇÃO
VEGETAL
T e P
Vm
LAI
E
w
rc
NPP
Diagrama esquemático simplificado do sub-modelo de ciclo de carbono proposto, apresentando os processos
que influenciam em cada compartimento. T: temperatura; P: precipitação; w: água no solo; Vm: taxa de
carboxilação da Rubisco; LAI: índice de área foliar; NPP: produtividade primária líquida; rc: resistência do
dossel; E: evapotranspiração. Fonte: Lapola, 2007.
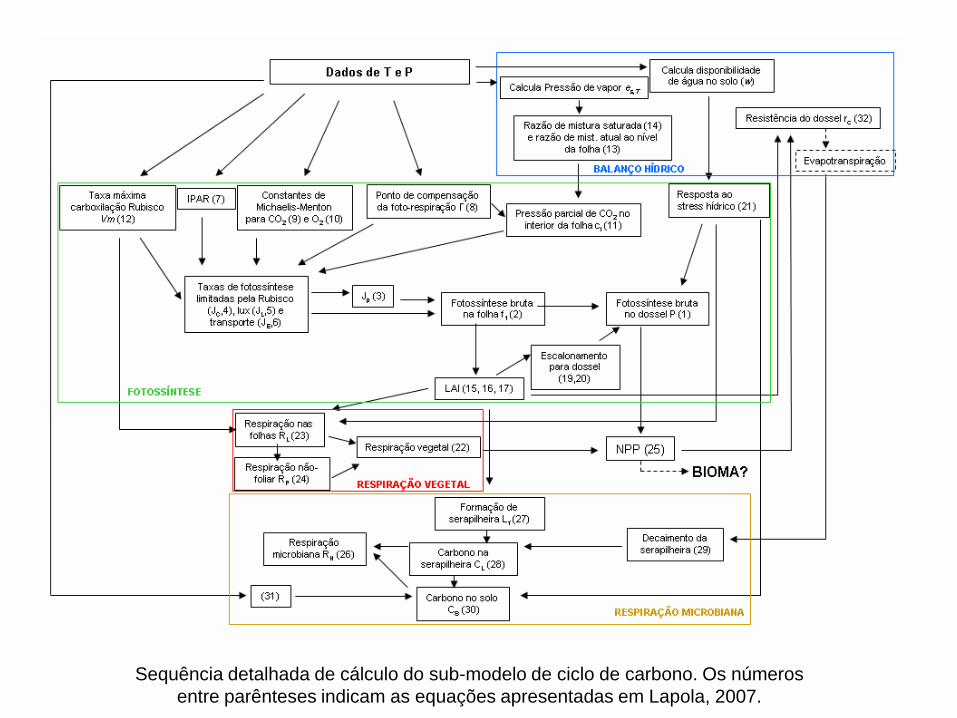
Sequência detalhada de cálculo do sub-modelo de ciclo de carbono. Os números
entre parênteses indicam as equações apresentadas em Lapola, 2007.
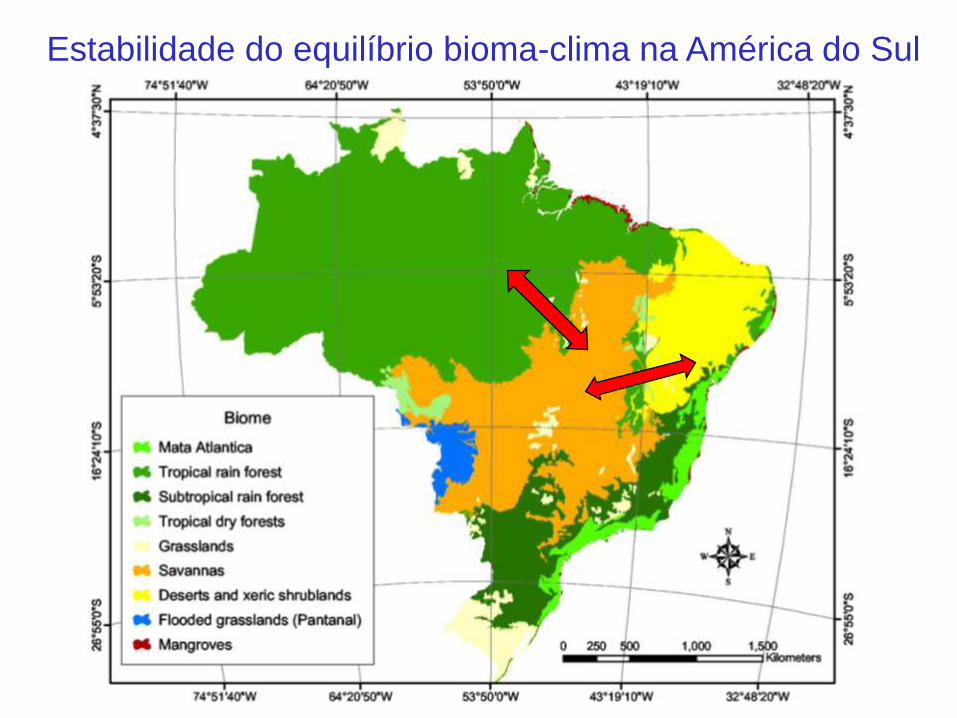
Estabilidade do equilíbrio bioma-clima na América do Sul

Modelo Simples
(linha de um SIM –
Simple Integrated
Model)
)(1
),,,(
),,,(
),,,(
2
3
2
2
2
1
SGAB
SHDFWft
S
GHDFWft
G
AHDFWft
A
x
x
x
Sub-
modelo de
balanço
hídrico (W)
Sub-modelo
balanço de
carbono (D)
Sub-
modelo de
fogo
natural (F)
Sub-modelo
de fatores
antrópicos
(H)
Entradas:
P e T
Saídas:
A, G, S e B(fração de área
coberta por cada
uma das
vegetações, %)
Intervalos Limites(a partir de resultados preliminares):
floresta, se A > 65%,
transição, se 46% < A < 65%,
e assim por diante...
Distribuição da vegetação
na AS tropical:
Floresta, Cerrado, Caatinga e
Transições
Alteração de
vegetação?
NÃO
SIMcálculo do
feedback IBA:
verificar retas
P
T
*
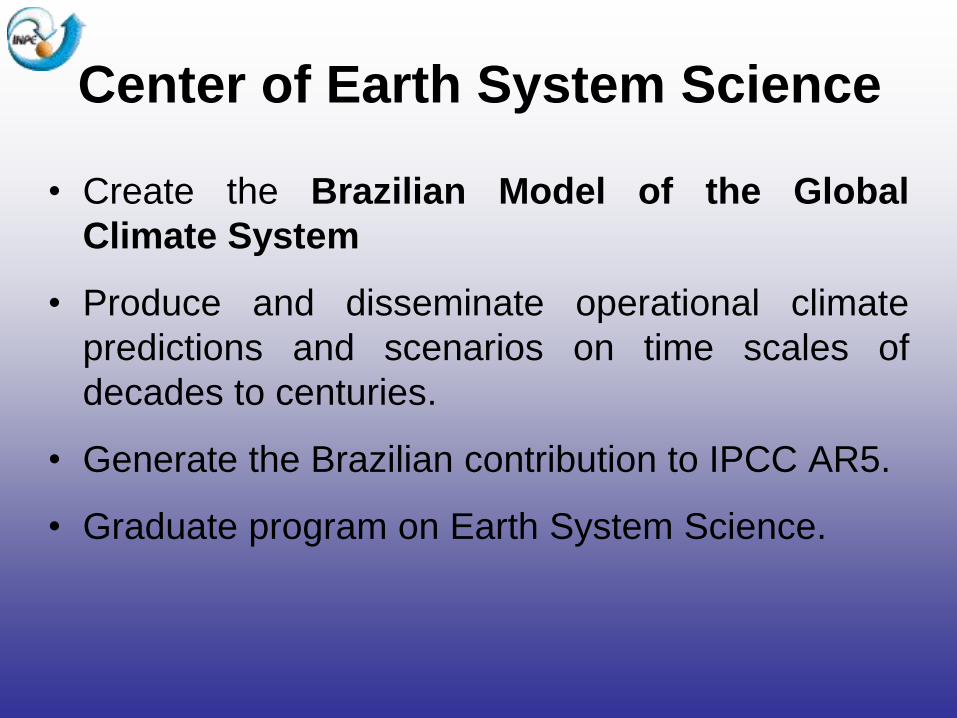
Center of Earth System Science
• Create the Brazilian Model of the Global
Climate System
• Produce and disseminate operational climate
predictions and scenarios on time scales of
decades to centuries.
• Generate the Brazilian contribution to IPCC AR5.
• Graduate program on Earth System Science.
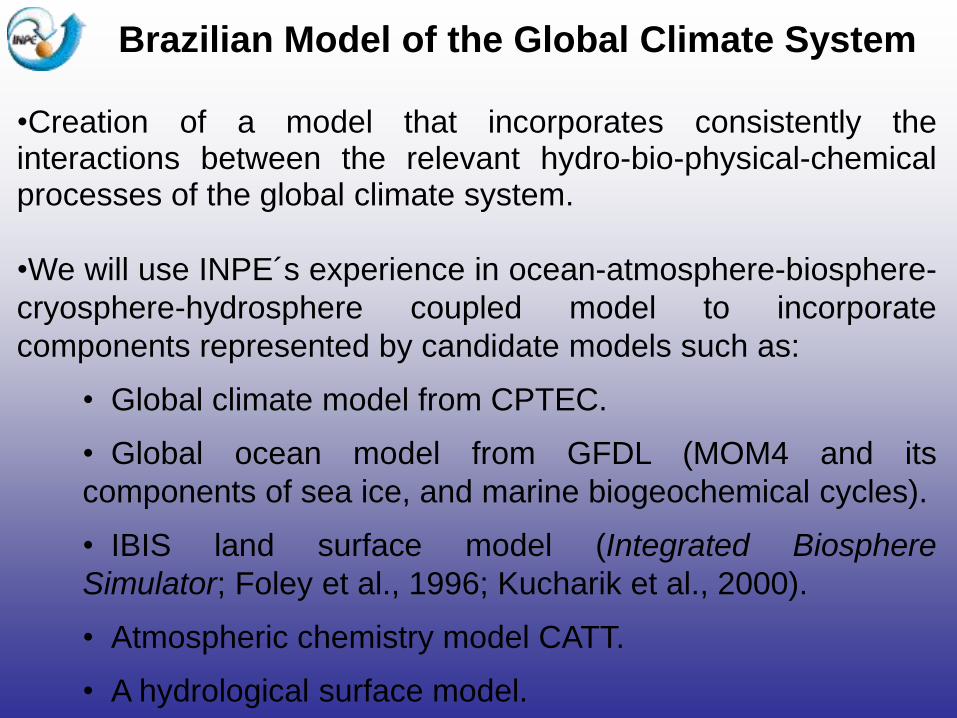
Brazilian Model of the Global Climate System
•Creation of a model that incorporates consistently theinteractions between the relevant hydro-bio-physical-chemicalprocesses of the global climate system.
•We will use INPE´s experience in ocean-atmosphere-biosphere-
cryosphere-hydrosphere coupled model to incorporate
components represented by candidate models such as:
• Global climate model from CPTEC.
• Global ocean model from GFDL (MOM4 and its
components of sea ice, and marine biogeochemical cycles).
• IBIS land surface model (Integrated Biosphere
Simulator; Foley et al., 1996; Kucharik et al., 2000).
• Atmospheric chemistry model CATT.
• A hydrological surface model.
Main Institutions:• INPE• University of Viçosa (UFV)• University of São Paulo (USP)• Brazilian Community with expertise in climate modeling
Established partnership with other Institutions:
NCAR, UK Hadley Centre, Max Planck Institut, University of Wisconsin,University of Minnesota, Woods Hole Research Center, MIT, CNRS, Universityof Toronto, University of British Columbia
Close and synergic cooperation with the Brazilian Climate ChangeNetwork (Rede CLIMA) and the FAPESP Global Climate Change ResearchProgram.
New Brazilian Supercomputer Laboratory is being implemented at the NationalInstitute for Space Research (INPE).
Brazilian Model of the Global Climate System

Processes to be represented
Recovery of abandoned land
Ice sheets
Anthropogenic land use (deforestation)
Fires (ignition, combustion, spreading, emissions)
Seasonal flooded areas
Crops Agro-IBIS/IBIS 2.9
IBIS 2.9Specific representation of South American ecosystems
IBIS 2.6
IBIS 2.6
IBIS 2.6
IBIS 2.6
Vegetation dynamics
Complete terrestrial carbon cycle
Fluxes of radiation, energy and mass
Effects of nutrient stress of the vegetation recovery
First release
First release
First release
First release
First release

Land Surface Modeling
• Represent processes that are important to us and maybe considered secondary in other models
• Benefit from and integrate with multiple large researchprograms in Brazil, like LBA, PRODES, GEOMA, etc.
• Simulate effects of deforestation and rising CO2
concentration on the Amazon climate and feedbacks onforest structure, considering
– biophysical effects (exchange of mass & energy)
– physiological effects
– biogeochemical feedbacks through atmospheric CO2
concentrations
Brazilian Model of the Global Climate System