Embed Size (px)
Citation preview

ANA RITA CAMPOS
INTELLIGENT DECISION SUPPORT SYSTEMS FOR COLLABORATION IN
INDUSTRIAL PLANTS
Dissertação apresentada para obtenção do Grau de
Doutor em Sistemas de Informação Industriais,
Engenharia Electrotécnica, pela Universidade Nova de
Lisboa, Faculdade de Ciências e Tecnologia.
Lisboa
2010


iii
ACKNOW LEDGMENTS
I would like to acknowledge the consortiums of the projects PICK (IST-1999-10442), AIM
(IST-2001-52222), FOKSai (COOP-CT-2003-508637), InLife (FP6-2005-NMP2-CT-517018),
InAmI (FP6-2004-IST-NMP-2-16788) and K-NET (FP7-ICT-1-215584), all of which were
partially funded by the Research Framework Programs of the European Union. The research
partners of these projects always provided me useful insights and fruitful discussions about
the research topics being developed. The industrial companies of these consortiums have
contributed quite significantly to my experience in different domains and sectors. These
industrial companies have given their time, experience and information that enabled me to
learn about industrial environments and test the approaches presented in this thesis.
I would like to thank all the companies that answered my questionnaire about decision-
making practices in industry. Their collaboration is invaluable for this thesis, particularly to
provide an overview of how companies do make their decisions.
My ten years of professional life have been equally divided in two five-year periods, between
two research institutes. ATB, Institut für angewandte Systemtechnik Bremen GmbH, in
Bremen, Germany, was my first workplace. This institute provided me the opportunity of
working in several European projects, gathering experience from working with international
and multi-disciplinary teams. All the staff members helped me to grow professionally.
However, I would like to highlight the special role of Dr. Dragan Stokic and Dr. Uwe Kirchhoff.
Dr. Kirchhoff taught me relevant lessons in the areas of best practices and industry in
general. Dr. Dragan Stokic was a true mentor for five years, teaching me a bit of everything
from technical, writing, administrative and personal skills. I will always be thankful to them for
the role they played in my life.
The latest five years, I have been working in UNINOVA, Instituto de Desenvolvimento de
Novas Tecnologias, in Caparica, Portugal. I would like to thank the researchers of UNINOVA
who have contributed to my work with productive conversations and insights about different
topics and also contributed to increase and improve my experience in projects. Additionally, I
would like to thank to Dr. Rui Neves-Silva, whom I profoundly respect and admire, and who
accepted the difficult task of supervising this work and from whom I have learned in an
immeasurable way. I will always be thankful to Dr. Neves-Silva for his support through this
long and winding road.

v
SUMÁRIO
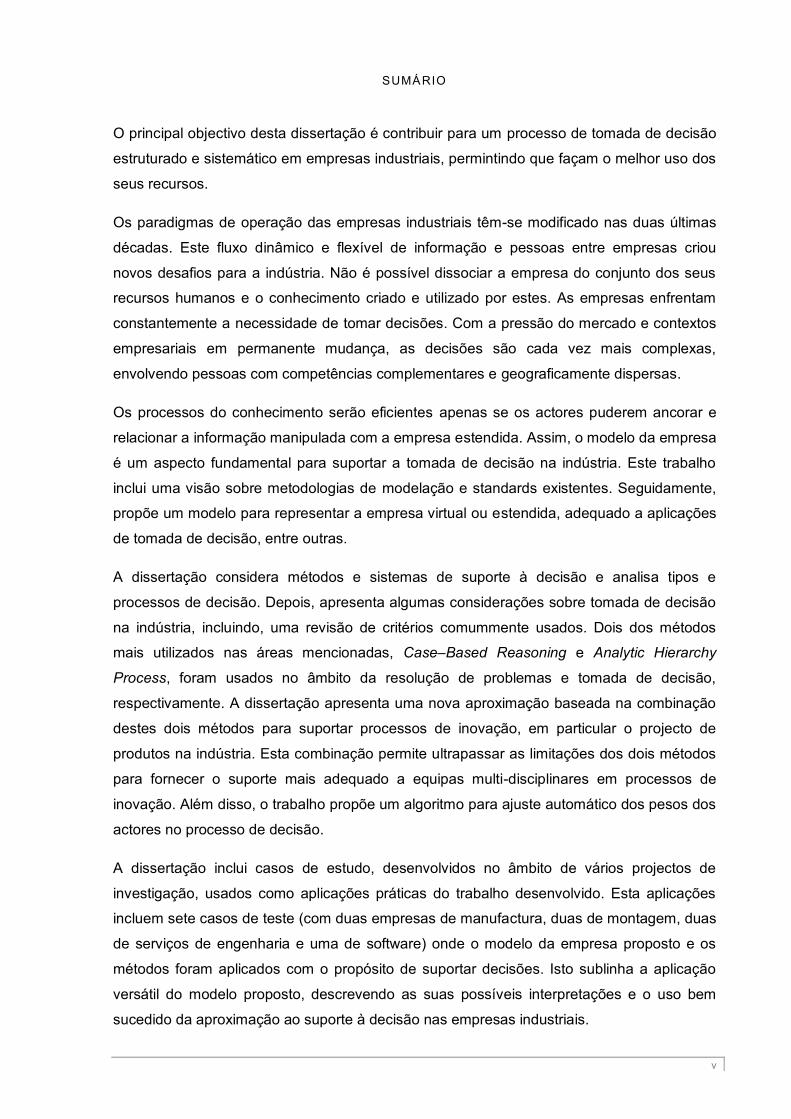
O principal objectivo desta dissertação é contribuir para um processo de tomada de decisão
estruturado e sistemático em empresas industriais, permintindo que façam o melhor uso dos
seus recursos.
Os paradigmas de operação das empresas industriais têm-se modificado nas duas últimas
décadas. Este fluxo dinâmico e flexível de informação e pessoas entre empresas criou
novos desafios para a indústria. Não é possível dissociar a empresa do conjunto dos seus
recursos humanos e o conhecimento criado e utilizado por estes. As empresas enfrentam
constantemente a necessidade de tomar decisões. Com a pressão do mercado e contextos
empresariais em permanente mudança, as decisões são cada vez mais complexas,
envolvendo pessoas com competências complementares e geograficamente dispersas.
Os processos do conhecimento serão eficientes apenas se os actores puderem ancorar e
relacionar a informação manipulada com a empresa estendida. Assim, o modelo da empresa
é um aspecto fundamental para suportar a tomada de decisão na indústria. Este trabalho
inclui uma visão sobre metodologias de modelação e standards existentes. Seguidamente,
propõe um modelo para representar a empresa virtual ou estendida, adequado a aplicações
de tomada de decisão, entre outras.
A dissertação considera métodos e sistemas de suporte à decisão e analisa tipos e
processos de decisão. Depois, apresenta algumas considerações sobre tomada de decisão
na indústria, incluindo, uma revisão de critérios comummente usados. Dois dos métodos
mais utilizados nas áreas mencionadas, Case–Based Reasoning e Analytic Hierarchy
Process, foram usados no âmbito da resolução de problemas e tomada de decisão,
respectivamente. A dissertação apresenta uma nova aproximação baseada na combinação
destes dois métodos para suportar processos de inovação, em particular o projecto de
produtos na indústria. Esta combinação permite ultrapassar as limitações dos dois métodos
para fornecer o suporte mais adequado a equipas multi-disciplinares em processos de
inovação. Além disso, o trabalho propõe um algoritmo para ajuste automático dos pesos dos
actores no processo de decisão.
A dissertação inclui casos de estudo, desenvolvidos no âmbito de vários projectos de
investigação, usados como aplicações práticas do trabalho desenvolvido. Esta aplicações
incluem sete casos de teste (com duas empresas de manufactura, duas de montagem, duas
de serviços de engenharia e uma de software) onde o modelo da empresa proposto e os
métodos foram aplicados com o propósito de suportar decisões. Isto sublinha a aplicação
versátil do modelo proposto, descrevendo as suas possíveis interpretações e o uso bem
sucedido da aproximação ao suporte à decisão nas empresas industriais.


vii
ABSTRACT
The objective of this thesis is to contribute for a structured and systematic decision-making
process for industrial companies, particularly involving several actors, helping them make the
best use of their resources.
The paradigms of how industrial companies operate have been progressively changing over
the last two decades. The flexible and dynamic flow of information and persons over
companies has created new challenges and opportunities for industry. It is not possible to
dissociate an enterprise from its human resources and the knowledge they create and use.
Companies face decisions constantly, involving several actors and situations. With the
market pressure and rapid changing environments, decisions are becoming more complex,
and involving more people with complementary expertise.
The knowledge processes are only efficient if the actors can anchor and relate the
information handled to the extended enterprise. Therefore, an enterprise model is a
fundamental aspect to support decision-making in industry. This work includes an overview
of existing modelling methodologies and standards. Afterwards, it proposes an enterprise
model to represent an extended or virtual enterprise, suitable not only for decision-making
applications but also for others.
This thesis considers methods and systems to support decision and analyses decision types
and processes. Afterwards, the thesis presents some considerations on decision-making in
industry and a generic decision-making process, including, a review of decision criteria
commonly used in industry. Two of the methods widely used in some of the mentioned
areas, case-based reasoning and the analytic hierarchy process, have been used in the
scope of problem solving and decision-making, respectively. This thesis presents an
approach based on a combination of case-based reasoning and analytic hierarchy process to
support innovation, particularly product design in industry. The combination overcomes
shortcomings of both methods to provide the most adequate decision support for multi-
disciplinary teams in innovation processes. Moreover, the work presented proposes an
algorithm for automatic adjustment of the weight of the actors in the decision process.
This thesis includes case studies, developed in the scope of several research projects, used
as practical applications of the work developed. These practical applications include seven
test cases (with two manufacturing companies, two assembling companies, two engineering
services companies and one software company) where the proposed enterprise model and
methods have been applied with the purpose of supporting decisions. This highlights the
wide application of the proposed model, describing its possible interpretations and the
successful use of the decision support approach in industrial companies.

ix
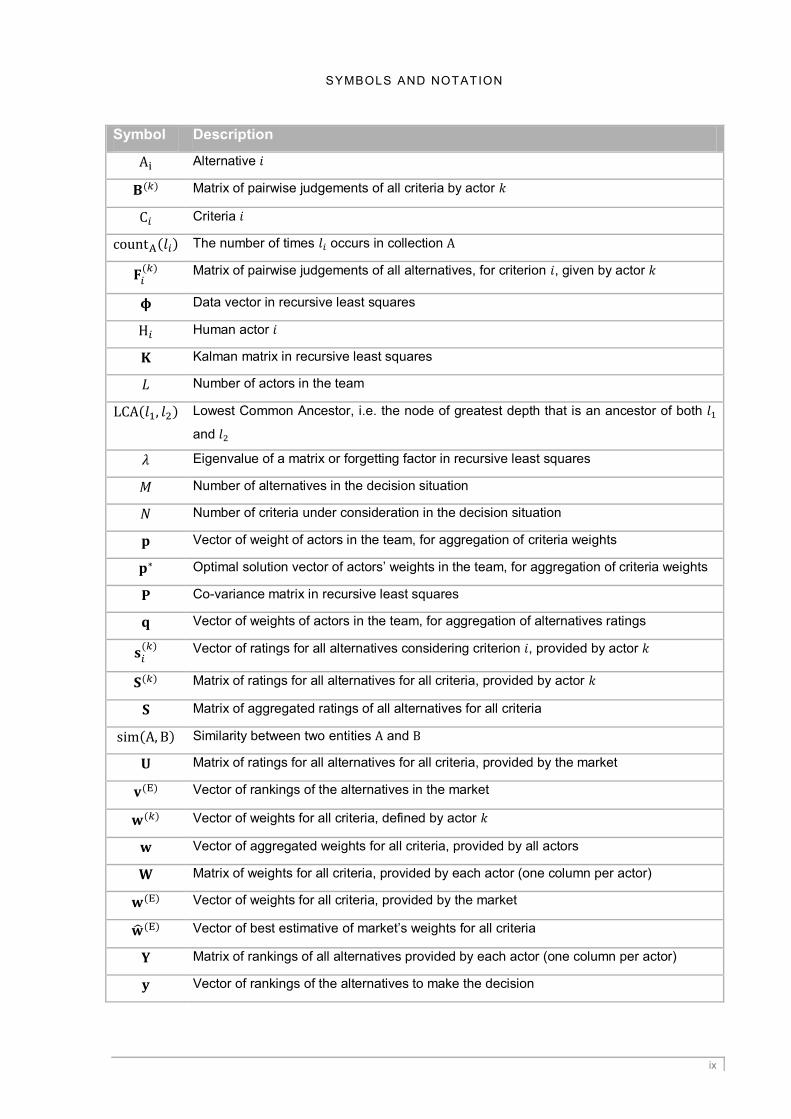
SYMBOLS AND NOTATION
Symbol Description
Alternative
Matrix of pairwise judgements of all criteria by actor
Criteria
The number of times occurs in collection
Matrix of pairwise judgements of all alternatives, for criterion , given by actor
Data vector in recursive least squares
Human actor
Kalman matrix in recursive least squares
Number of actors in the team
Lowest Common Ancestor, i.e. the node of greatest depth that is an ancestor of both
and
Eigenvalue of a matrix or forgetting factor in recursive least squares
Number of alternatives in the decision situation
Number of criteria under consideration in the decision situation
Vector of weight of actors in the team, for aggregation of criteria weights
Optimal solution vector of actors‘ weights in the team, for aggregation of criteria weights
Co-variance matrix in recursive least squares
Vector of weights of actors in the team, for aggregation of alternatives ratings
Vector of ratings for all alternatives considering criterion , provided by actor
Matrix of ratings for all alternatives for all criteria, provided by actor
Matrix of aggregated ratings of all alternatives for all criteria
Similarity between two entities and
Matrix of ratings for all alternatives for all criteria, provided by the market
Vector of rankings of the alternatives in the market
Vector of weights for all criteria, defined by actor
Vector of aggregated weights for all criteria, provided by all actors
Matrix of weights for all criteria, provided by each actor (one column per actor)
Vector of weights for all criteria, provided by the market
Vector of best estimative of market‘s weights for all criteria
Matrix of rankings of all alternatives provided by each actor (one column per actor)
Vector of rankings of the alternatives to make the decision

x
ACRONYMS AND ABBREVIATIONS
Acronym Description
AHP Analytic Hierarchy Process
ARIS Architecture of Information Systems
CAD Computer-Aided Design
CBR Case-Based Reasoning
CDM Collaborative Decision Making
CEN European Committee for Standardization
CEO Chief Executive Officer
CIMOSA Computer Integrated Manufacturing Open System Architecture
CORBA Common Object Request Broker Architecture
CRM Customer Relationship Management
DSS Decision Support System
ebXML eXtensible Markup Language
GDSS Group Decision Support System
GERAM Generalised Enterprise Reference Architecture and Methodology
GRAI Groupe de Recherche en Automatisation Intégrée
GRAI-GIM Groupe de Recherche en Automatisation Intégrée – Integrated Methodology
IDSS Intelligent Decision Support System
IEC International Electrotechnical Commission
IFAC International Federation of Automatic Control
IFIP International Federation for Information Processing
ISO International Organization for Standardization
MDA Model Driven Architecture
OASIS Organisation for the Advancement of Structures Information Standards
OMG Object Management Group
PERA Purdue Enterprise Reference Architecture
PLC Programmable Logic Controller
PLM Product Lifecycle Management
RBR Rule-Based Reasoning
RLS Recursive Least Squares
SCOR Supply Chain Operations Reference Model
STEP Standard for Product Data Representation and Exchange
STEP Standard for the Exchange of Product Model Data
TOVE Toronto Virtual Enterprise
UML Unified Modelling Language
UN/CEFACT United Nations Centre for Trade Facilitation and Electronic Business

xi
GLOSSARY
active decision-making support systems. Intelligent decision-making support systems
that take the initiative without getting specific orders.
collaborative decision making. Process of decision making in a collaborative
environment where problems can be addressed through argumentative discourse and
collaboration among the users involved.
collaborative decision support systems. Technologies or systems that enable or
enhance the ability of the participants involved in collaborative decision-making processes.
craft production. Production focused on craft, where highly skilled people transformed
materials to produce something, using mostly inexpensive tools.
decision. Choice, which is to realise a certain goal by analysing subjective-objective
conditions, generating alternatives, and choosing the most appropriate one among them.
decision-making. Process of reaching a conclusion after considering several alternatives.
decision support systems. Interactive computer-based information systems designed to
help human decision makers, by processing data and models in order to identify, structure,
and solve semi-structured or unstructured problems.
enterprise model. Abstraction of an enterprise domain that represents enterprise entities,
their interrelationships, their decomposition and detailing to the extent necessary to convey
what it intends to accomplish and how it operates.
enterprise modelling. Conceptual modelling techniques to describe the structure and
business processes of an enterprise, its missions and objectives with the way these
objectives may be operationalised onto systems components.
extended enterprise. Formation of closer co-ordination in the design, development, costing
and the co-ordination of the respective manufacturing schedules of co-operating independent
manufacturing enterprises and related suppliers.
group decision support systems. Interactive computer-based systems that facilitate the
solution of ill-structured problems by a set of decision makers that work together as a team.
intelligent decision support systems. Information systems to generate knowledge to
support decision-making, combining the research fields of decision support, artificial
intelligence and knowledge management.
knowledge acquisition. Process of gathering information from any source.

xii
knowledge elicitation. Sub-task of knowledge gathering that deals with gathering
knowledge from human experts.
lean production. Combination of craft and mass production, using multi-skilled workers and
flexible automated machines.
mass production. Production of inexpensive goods, using highly sophisticated machines
operated by relatively unskilled operators
virtual enterprise. Temporary alliance of enterprises that come together to share skills or
core competencies and resources in order to better respond to business opportunities, and
whose cooperation is supported by computer networks.

xiii
TABLE OF CONTENTS
1. Introduction .......................................................................................................................... 1
1.1. Motivation ..................................................................................................................... 1
1.2. Original contributions ................................................................................................... 5
1.3. Organisation of the Thesis ........................................................................................... 6
2. Enterprise model ................................................................................................................. 9
2.1. Existing modelling technologies ................................................................................ 10
2.2. Existing modelling standards ..................................................................................... 12
2.3. Proposed model ......................................................................................................... 13
2.3.1. Static knowledge ................................................................................................ 17
2.3.2. Dynamic knowledge ........................................................................................... 21
2.4. Modelling methodology .............................................................................................. 24
3. Decision support in industrial environments ..................................................................... 29
3.1. Methods to support decision-making ......................................................................... 30
3.2. Systems to support decision ...................................................................................... 36
3.3. A generic decision-making process ........................................................................... 39
3.4. Types of decisions and the process of making a decision ........................................ 41
3.5. Team decision-making process type ......................................................................... 43
3.6. Industrial criteria ......................................................................................................... 44
3.7. Decision-making in industry ....................................................................................... 47
4. Problem solving and innovation in industry ...................................................................... 51
4.1. Case-based reasoning ............................................................................................... 52
4.2. The Analytic Hierarchy Process ................................................................................ 58
4.2.1. Hierarchical representation of a problem ........................................................... 59
4.2.2. Comparing the decision criteria (individual judgements) ................................... 62
4.2.3. Analysing judgement consistency ...................................................................... 64
4.2.4. Defining individual criteria weight ....................................................................... 67
4.2.5. Calculating group criteria weight ........................................................................ 69
4.2.6. Individual classification of alternatives ............................................................... 71
4.2.7. Calculating group classification of alternatives .................................................. 72

xiv
4.2.8. Ordering alternatives .......................................................................................... 73
4.3. Combining AHP and CBR ......................................................................................... 84
4.4. Actor‘s weights adaptation by market ranking feedback .......................................... 86
4.4.1. The market ......................................................................................................... 86
4.4.2. The decision making group ................................................................................ 87
4.4.3. Feedback information from market .................................................................... 91
4.4.4. Examples with ranking uncertainty .................................................................... 98
4.4.5. Adaptive actors‘ weights from market feedback .............................................. 104
4.5. Remarks .................................................................................................................. 107
5. Case studies ................................................................................................................... 109
5.1. Manufacturing Companies ...................................................................................... 109
5.2. Assembling Companies .......................................................................................... 115
5.3. Engineering Services Companies ........................................................................... 122
5.4. Software Company .................................................................................................. 129
5.5. Remarks .................................................................................................................. 132
6. Conclusions and future work .......................................................................................... 135
Annex A. Model Specification .......................................................................................... 149
Annex B. Modelling Methodology Tools .......................................................................... 165
Annex C. Decision-making questionnaire........................................................................ 167

xv
LIST OF FIGURES
Figure 2.1. Proposed enterprise model. ................................................................................... 15
Figure 2.2. Overview of model‘s static knowledge. ................................................................. 18
Figure 2.3. Overview of model‘s dynamic knowledge. ............................................................ 22
Figure 3.1. Hierarchical representation of decision criteria. .................................................... 46
Figure 3.2. Costs criteria to make a decision. .......................................................................... 46
Figure 3.3. Benefits criteria to make a decision. ...................................................................... 47
Figure 4.1. Effect of parameter in the computation of similarity value. ................................. 57
Figure 4.2. Hierarchical representation of a problem. ............................................................. 60
Figure 4.3. Hierarchical representation of a problem with defined criteria. ............................. 61
Figure 4.4. Hierarchical representation of problem‘s costs. .................................................... 62
Figure 4.5. Hierarchical representation of problem‘s benefits. ................................................ 62
Figure 4.6. Hierarchical representation of example of problem to meet customer‘s
requirements. ............................................................................................................................ 75
Figure 4.7. Criteria priorities assigned by each actor. ............................................................. 78
Figure 4.8. Sub-criteria priorities assigned by each actor. ...................................................... 78
Figure 4.9. Criteria weights defined by the team. .................................................................... 79
Figure 4.10. Rating of alternatives by the team. ...................................................................... 83
Figure 4.11. Ranking of the alternatives. ................................................................................. 83
Figure 4.12. Approach combining CBR and AHP. ................................................................... 85
Figure 4.13. Values and criteria for alternatives in Example 4.4. .......................................... 90
Figure 4.14. Values and criteria for alternatives in Example 4.5. .......................................... 92
Figure 4.15. Actors‘ weights in Example 4.6. ......................................................................... 94
Figure 4.16. values and criteria for alternatives in Example 4.7. ........................................... 97
Figure 4.17. Values and criteria for alternatives in Example 4.8. .......................................... 99
Figure 4.18. Values and criteria for alternatives in Example 4.9. ........................................ 100
Figure 4.19. Actors‘ weights in Example 4.10. ..................................................................... 101
Figure 4.20. Values and criteria for alternatives in Example 4.11. ...................................... 103
Figure 4.21. Market‘s weights estimation in Example 4.12. ................................................ 106
Figure 4.22. Actors‘ weights estimation in Example 4.12. ................................................... 106
Figure 5.1. Manufacturing plant of a rear axle. ...................................................................... 110
Figure 5.2. Production units of manufacturing company 1. ................................................... 111
Figure 5.3. States of manufacturing company 1. ................................................................... 111
Figure 5.4. Process of necking and testing cans. .................................................................. 113
Figure 5.5. Examples of problems in manufacturing company 2. ......................................... 114
Figure 5.6. Details of a problem‘s description. ....................................................................... 115
Figure 5.7. Assembling plant of a figther aircraft. .................................................................. 116

xvi
Figure 5.8. Assembling of large-scale air conditioning units. ................................................ 118
Figure 5.9. Production units defined for assembling company 2. ......................................... 120
Figure 5.10. Examples of problems defined for assembling company 2. ............................. 121
Figure 5.11. Similar problems identified by CBR in assembling company 2. ....................... 121
Figure 5.12. Cutting form and fixture. .................................................................................... 123
Figure 5.13. Product parts modelled in enginnering services company 1. ........................... 124
Figure 5.14. Problem types defined for engineering services company 1. ........................... 125
Figure 5.15. Actions defined for engineering services company 1. ...................................... 125
Figure 5.16. Example of a customised spray painting solution. ............................................ 126
Figure 5.17. List of problems from engineering services company 2. .................................. 127
Figure 5.18. CBR analysis of problems from engineering services company 2. .................. 128
Figure 5.19. Overview of reservations ICT system. .............................................................. 130

xvii
LIST OF TABLES
Table 2.1. Mapping ISO19440 to the proposed model. ........................................................... 14
Table 3.1. Decision-making phases and steps. ....................................................................... 40
Table 4.1. Similarity values for uniform p.d.f. of an unknown variable. ................................... 58
Table 4.2. Criteria pairwise comparison table. ......................................................................... 63
Table 4.3. Scale to represent criteria judgement. .................................................................... 64
Table 4.4. Calculated values of random index. ........................................................................ 65
Table 4.5. Alternatives pairwise comparison table. ................................................................. 71
Table 4.6. Individual judgemements of criteria by actor 1. ...................................................... 76
Table 4.7. Revision of some individual judgemements of criteria by actor 1. ......................... 76
Table 4.8. Individual judgemements of criteria by actor 2. ...................................................... 77
Table 4.9. Individual judgemements of criteria by actor 3. ...................................................... 77
Table 4.10. Individual judgemements of alternatives by actor 1. ............................................ 80
Table 4.11. Individual judgemements of alternatives by actor 2. ............................................ 81
Table 4.12. Individual judgemements of alternatives by actor 3. ............................................ 82
Table 5.1. Results from tests in manufacturing company 1. ................................................. 112
Table 5.2. Results from tests in manufacturing company 2. ................................................. 115
Table 5.3. Examples of problems in assembling company 1. ............................................... 117
Table 5.4. Results from tests in assembling company 1. ...................................................... 118
Table 5.5. Results from tests in assembling company 2. ...................................................... 122
Table 5.6. Results from tests in engineering services company 1. ....................................... 125
Table 5.7. Results from tests in engineering services company 2. ....................................... 128
Table 5.8. Examples of problems in software company. ....................................................... 131
Table 5.9. Results from tests in software company. .............................................................. 132


1
1. INTRODUCTION
The main objective of this thesis is to contribute for a structured and systematic decision-
making process for industrial companies, helping them make the best use of their resources.
This first chapter of the thesis describes the motivation for the work performed, how it was
structured and the main original contributions proposed.
1.1. MOTIVATION
People have always used information in any aspect of their daily lives. It is not possible to
think, act, decide or even feel without having information processed by our brains. In
business companies, the same happens. Companies have been using information to handle
the business. Until not long ago, companies‘ information was the people‘s information. This
means that the only source of knowledge within a business was its employees. This was
possible because businesses were less complex and the majority of people stayed their
complete productive life in the same job and company. The structure of the society and
economy encouraged and permitted the ―job for life‖. However, this situation does no longer
hold.
The phenomenon of globalisation, which appeared in the 80s, has changed our world in a
very significant way. The overall education of people around the world has increased and the
jobs have changed. Local, regional and even national companies have been transformed into
global business, operating in multiple countries. As people change jobs several times in their
productive working life, they accumulate knowledge, but also move this knowledge from one
place to another. Businesses have been losing information and knowledge, and not only
employees. Therefore, companies started noticing the need to retain information in a way
that did not entirely depend on the employees.
The paradigms of how companies, and especially manufacturing companies, operate have
changed deeply over the last century. Before World War I, production focused on craft,
where highly skilled people transformed materials to produce something, using mostly
inexpensive tools. The process was expensive and extensive. After World War I, two
automotive companies, Ford and General Motors, were responsible for introducing the

2
paradigm of mass production. The objective was to produce inexpensive goods, using highly
sophisticated machines operated by relatively unskilled operators. However, the expensive
and highly specialised machines were somehow less tolerant to modifications, which
required companies to produce vast amounts of the same product, for as long as possible.
Henry Ford described the process best with his sentence ―Any customer can have a car
painted any colour that he wants so long as it is black.‖ After World War II, another
automotive company, Toyota, pioneered the paradigm of lean production. This paradigm
combines craft and mass production, using multi-skilled workers and flexible automated
machines. The objective was to use less human efforts, fewer tools, less manufacturing
space and less investment, when compared to mass production.
The need for flexibility made companies analyse their internal structures and hierarchies,
which were very pyramid-like. Businesses discovered several layers of middle management
that were involved neither in any decision-making process nor in leading the companies. In
fact, some of these middle layers were only relaying information, representing filters that
were retaining some information, representing loss of information. The re-structuring of
companies, cutting down the middle management, represented the movement of lean
production (Womack and Jones, Lean Thinking 1996).
More recently, globalisation brought an immense increase in relations among businesses.
Companies seldom represent a complete supply chain to deliver any product to market.
Global market demands for high quality, customised but inexpensive products, which have
forced companies to establish short, medium and long-term relations with others. Emerging
information and communication technologies foster the specific characteristics of this
paradigm: collaboration, decentralisation and inter-organisational integration (O'Neill and
Sackett 1994). In this context, two main concepts have emerged, to classify alliances:
extended enterprise and virtual enterprise. Extended enterprise is the formation of closer co-
ordination in the design, development, costing and the co-ordination of the respective
manufacturing schedules of co-operating independent manufacturing enterprises and related
suppliers (Jagdev and Browne 1998). This allows a company to take advantage of
competencies and resources without owning them. A virtual enterprise is a temporary
alliance of enterprises that come together to share skills or core competencies and resources
in order to better respond to business opportunities, and whose cooperation is supported by
computer networks (Camarinha-Matos, Afsarmanesh and Garita, et al. 1998). It is commonly
agreed that the extended enterprises focus on long-term relationships across the value
chain, while the virtual enterprises suggest a more dynamic environment where individual
companies work together for a relatively short time to satisfy a specific market demand
quickly (Browne and Zhang 1999) (Camarinha-Matos and Afsarmanesh, Virtual Enterprise
Modeling and Support Infrastructures: Applying Multi-agent System Approaches 2006). In

3
addition, extended enterprises centre their core competencies in one dominant company,
while virtual enterprises have core competencies distributed over the participating companies
(Jagdev and Browne 1998).
Increasing relations brought two main challenges for companies: flexibility and exchange of
information. This made companies focus more on their information and knowledge, where to
get it from and especially how to represent it. Exchanging information is only possible and
efficient from the organisation viewpoint if a formal structuring is in place.
The recent advances in information and communication technologies have moved the
industrial world from highly data-driven environments to a more cooperative
information/knowledge-driven environment, taking into account more of the enterprise know-
how, common-sense, and application semantics (Vernadat 2002).
The way people work has changed together with the operation paradigms of companies.
Individuals not only work for several companies during their productive life, but the way
people and companies are connected has also adjusted. Market constraints for companies to
decrease their costs, and individual requirements of people who need to balance personal
and professional lives, fostered the appearance of new ways of work, which are highly
facilitated by technology, especially information and communication technologies, and
particularly the Internet. Concepts such as freelancer, e-lancing, e-work, telework and
telecommute are quite often nowadays. The number of freelancers, for example, reached 12
million in the end of 2009, in the United States, and the number of web sites to support e-
lancing is also growing (Working in the digital age: a clouded future 2010).
This flexible and dynamic flow of information and persons over companies has created new
challenges for industry. It is not possible to dissociate an enterprise from its human
resources and the knowledge they create and use. A company can be seen as just a
processor of information created by the individuals (Simon, Administrative Behaviour 1997),
or the amplifier of knowledge created by the individuals (Nonaka and Takeuchi 1995). In any
of the situations, what companies make with the knowledge they have is of key importance.
Many tasks in an industrial environment relate to reaching a conclusion after considering
several alternatives, i.e. making a decision. Companies face decisions constantly, involving
several actors and situations (e.g. developing a new product, fixing a machine, hiring a new
employee). With the market pressure and rapid changing environments, decisions are
becoming more and more complex, and involve more people with complementary expertise,
not necessarily from the same company or geographical location. Quite often, decision-
making processes involve different actors within the extended or virtual enterprise, with
diverse backgrounds and expertise and located in disperse places. This thesis aims at

4
contributing to support decision-making processes, particularly involving several actors,
which are designated by collaborative decision-making.
The recent economic downturn, which started in 2007, has led companies to cut their costs
and many have underinvested in their information infrastructure. A recent study by the
American consultant Gartner (Schlegel, et al. 2008) stated, ―most organisations find they do
not have the information, processes and tools needed by their managers to make informed,
responsive decisions.‖ The same report estimates that through 2012, more than 35% of the
top 5000 global companies will fail to make insightful decisions about significant changes in
their business and markets due to underinvestment in their information infrastructure and
business user tools.
Companies need a systematic approach to support decision-making processes, which
enables traceability and accountability. Companies need the best information and rules to
make a decision, but they also need to learn from what went right and what went wrong.
Being able to replicate a successful situation and avoid a downfall has to be part of a
company‘s strategic thinking.
Many sciences have studied topics relevant for decision-making, including neuro-sciences,
psychology, management science, operations research, control, artificial intelligence,
business intelligence and the recent behavioural economics. Already more than twenty years
ago, Nobel Prize laureate Herbert Simon had said (Simon, Two heads are better than one:
collaboration between AI and OR 1987):
JOINING HANDS WITH ARTIFICIAL INTELLIGENCE,
MANAGEMENT SCIENCE AND OPERATIONS RESEARCH CAN
ASPIRE TO TACKLE EVERY KIND OF PROBLEM-SOLVING
TASK THE HUMAN MIND CONFRONTS.
There has been a convergence among the research fields of decision support, artificial
intelligence and knowledge management, developing a number of information systems to
generate knowledge to support decision-making. Collectively, these systems can be called
intelligent decision support systems (Hans and Peter 1992). These systems integrate the
functions of decision support systems and knowledge-based systems to assist decision
makers in performing decision analysis, and explain conclusions and recommendations
(Hunsaker and Hunsaker 1981) (Tansley and Hayball 1993) (Sensiper 1998) (Silverman
1994).
The research has produced impressive results in the area of decision-making, as described
in Chapter 3, Decision support in industrial environments, but often failed at focusing the
application of its results to industrial companies. One of the main issues has been

5
segmentation between information, knowledge and their application. Companies invest
heavily in expert systems for specific applications within the enterprise. Often, companies
have several systems, which are completely independent, and are not able to communicate
and use different and sometimes redundant information. The extended and virtual
enterprises need tailored support for decision-making, which includes:
Full use of the enterprise‘s information and knowledge. Companies need to have one
model independent of the applications, which means only one knowledge base.
Efficient and methodical procedure to model and acquire knowledge in an extended or
virtual enterprise. Companies need to be able to identify and select the knowledge
relevant for the desired applications.
Systematic and clear approach to support decision-making processes involving
complex teams with diverse expertise and geographical dispersed. Companies need to
be able to review past decisions and learn from them.
The objective of this thesis is to contribute to minimise these state-of-the-art gaps, in order to
help industrial companies in having an appropriate approach for decision support. The work
presented has the objective of modelling extended enterprises for decision-making
applications, and contribute to providing a systematic procedure to support accountable and
repeatable decisions in industrial companies.
1.2. ORIGINAL CONTRIBUTIONS
The main objective of this thesis is, in general terms:
Develop a systematic methodology to support industrial companies in making and revisiting
decisions, using the best resources available.
The work developed includes the following main original contributions:
1. An enterprise model, considering state-of-the-art methodologies and standards, to
represent an extended or virtual enterprise, enabling decision support applications,
among others. The model includes the necessary constructs for companies to model
their physical elements, operations and resources to anchor dynamic information
related to decision situations. The enterprise model includes a modelling methodology
to support industrial companies in modelling their enterprises with limited use of
external knowledge modelling experts. This modelling methodology details a set of
phases for companies to follow in the process of knowledge acquisition and includes
some tools to support knowledge elicitation from human actors (e.g. questionnaire for
semi-structured interviews).

6
2. A combination of case-based reasoning and the analytic hierarchy process to
support decision-making situations in industrial enterprises, particularly in the scope of
innovation processes. This combination overcomes the bottlenecks of each method
individually, namely how to adapt the most similar case suggested by case-based
reasoning and how to identify and formulate the hierarchy to use in the analytic
hierarchy process. This proposed approach is tightly connected to the enterprise model
and comprehends a hierarchy of criteria that can be applied in diverse decision
situations in industrial environments.
3. An algorithm to adapt actor’s weights in a team by considering market ranking
feedback and enterprise strategy. This method uses information about the
implementation of decisions to potentiate the role of actors that systematically take
decisions aligned with the company‘s strategy. The proposed algorithm is presented as
a possible approach to support companies in learning from the implementation of
decisions and adapting their decision making process to reinforce the most successful
decisions.
4. A collection of case studies that represent tests of parts of the work presented in this
thesis in industrial environments. The seven test cases include two manufacturing
companies, two assembling companies, two services engineering companies and one
software company. The enterprise model was applied in the seven test cases proving
its diversity and showcasing different interpretations to the set of constructs proposed.
The case-based reasoning method was also tested in the seven companies, allowing
to show its successful application and enabling its continuous development. One of the
test cases was used to perform a preliminary study on the analytic hierarchy process
approach, providing results that supported the refinement of the approach.
1.3. ORGANISATION OF THE THESIS
This thesis is organised in six chapters, as described in the following text.
Chapter 1, Introduction, presents the motivation for the work developed, describing the
background that led to the topic, namely in a business and industrial perspective. This
chapter also describes the structure of the thesis and identifies its main original contributions.
Chapter 2, Enterprise model, discusses the structure used to represent an enterprise. This
chapter starts with an overview of existing modelling methodologies and standards, and
afterwards details the model developed to represent an extended or virtual enterprise for the
purpose of decision-making applications.

7
Chapter 3, Decision support in industrial environments, introduces the topic of decision-
making with a particular industrial focus. The chapter begins with a review of different
systems to support decision, followed by a definition of decision types and the process of
making a decision. Afterwards, the chapter presents some considerations on decision-
making in industry and a generic decision-making process. This chapter finalises with a
review of criteria commonly used in decision-making in industry.
Chapter 4, Problem solving and innovation in industry, focus on decision-making applications
in industrial companies. This chapter describes several systematic approaches to support
industrial decision-making, namely based on case-based reasoning, the analytic hierarchy
process and a combination of both. Additionally, this chapter proposes an algorithm to
automatically adjust actors‘ weights in a team using information about the success of the
implemented decisions.
Chapter 5, Case studies, presents the experimental part of this thesis, with detailed
descriptions of practical applications of the model and methods developed.
Chapter 6, Conclusions and future work, finalises this thesis summarising the work
performed and identifying future directions.


9
2. ENTERPRISE MODEL
Providing decision support for industrial companies requires the ability of modelling the
extended enterprise and the decision process. This chapter proposes an enterprise model to
represent an extended enterprise, suitable not only for decision-making applications but for
others as well. The concept‘s foundation is that any application in an extended enterprise
involves handling and exchanging knowledge. The knowledge processes are only efficient if
the actors can anchor and relate the information handled to the extended enterprise.
With the increased relations among companies, the concern of representing information in a
formal and structured way soon became a major concern (Nagarajan, Whitman and
Cheraghu 1999). Companies started storing all bits of data and information, even if not
relevant at all. Another aspect is also that each system inside the company (CRM, CAD,
PLM etc.) uses its own information structure, making for a lot of redundancy in a less positive
sense. However, the efficiency of a virtual or extended enterprise, once formed, is greatly
determined by the speed and efficiency with which information can be exchanged and
managed among business partners (Browne and Zhang 1999). Sharing information among
partners of a supply chain will not only reduce the operation costs of each of the partners, but
the efficiency of this ‗trust‘ based business transaction will give rise to a sense of ‗customer
satisfaction‘ along the value chain (Jagdev and Browne 1998).
There are situations where extended and/or virtual organisations include competitors. Even
in these situations, companies should not see as a disadvantage sharing information and
knowledge, as it is an essential feature. Knowledge, even if public, may not be an obvious
source of competitive advantage; what each company does with the knowledge, in terms of
applying it to value-creating tasks, matters more than its public availability (von Krogh, Ichijo
and Nonaka 2000).
Companies in an extended or virtual enterprise need to coordinate their processes, and
efficiently exchange information and knowledge. All things to be integrated and coordinated
need to be modelled to some extent (Vernadat 2002). The goal of an enterprise modelling
approach is not to model the entire enterprise in all of its details, although it might be
theoretical possible. The size and scope of the model must be decided by the business
users, according to finality to be achieved.

10
Most industrial companies have a main concern in problem solving, because unsolved
problems cause delays, increases waste and consumes resources ineffectively. In addition,
companies want to extend their products by incorporating in them knowledge and expertise
from all participants of the value chain (Sorli, et al. 2006). This added-value knowledge often
comes from what it is possible to learn during the product lifecycle, especially from solving
problems. Industrial companies usually use accumulated knowledge, especially from what
went wrong (i.e. from solving problems) to innovate their products and processes. This thesis
introduces a model to represent industrial enterprises, especially targeting problem-solving
applications. The need for such a model came when developing problem-solving approaches
for manufacturing industry, using methods such as reasoning. Companies lack an overview
of their products, processes and resources, needed to document any problems occurring in
the manufacturing processes. Additionally, companies were involved in extended and virtual
enterprises and needed to document problems occurring all over the supply chain, i.e. in
process of distinct companies.
2.1. EXISTING MODELLING TECHNOLOGIES
Enterprise knowledge modelling, or enterprise modelling, is a generic name that refers to a
collection of conceptual modelling techniques for describing the structure and business
processes of an enterprise, its missions and objectives with the way these objectives may be
operationalised onto systems components (Loucopoulos and Kavakli 1999).
The majority of enterprise modelling techniques provides concise descriptions of what an
enterprise ―does‖ in order to operate. To this end, they usually involve two kinds of sub-
models: an entity (or data, or information) model and a process (or functional) model.
There are several methodologies and tools that facilitate business process management,
from the enterprise integration perspective, trying to support the life-cycle stages of the
integrated manufacturing enterprise (Szegheo and Andersen 1999) (Kosanke, Comparison
of Enterprise Modelling Methodologies 1996).
Computer integrated manufacturing open system architecture (CIMOSA) provides a process
oriented modelling concept that captures both the process functionality and the process
behaviour (Kosanke, CIMOSA: enterprise engineering and integration 1999). CIMOSA
consists on a generic and a partial modelling and supports three modelling levels of the
complete life cycle of enterprise operations: requirements definition, design specification and
implementation description. Each modelling level supports different views on the particular
enterprise model. CIMOSA has defined four different modelling views: function, information,
resource and organisation (CIMOSA: A Primer on key concepts, purpose and business value
n.d.).
11
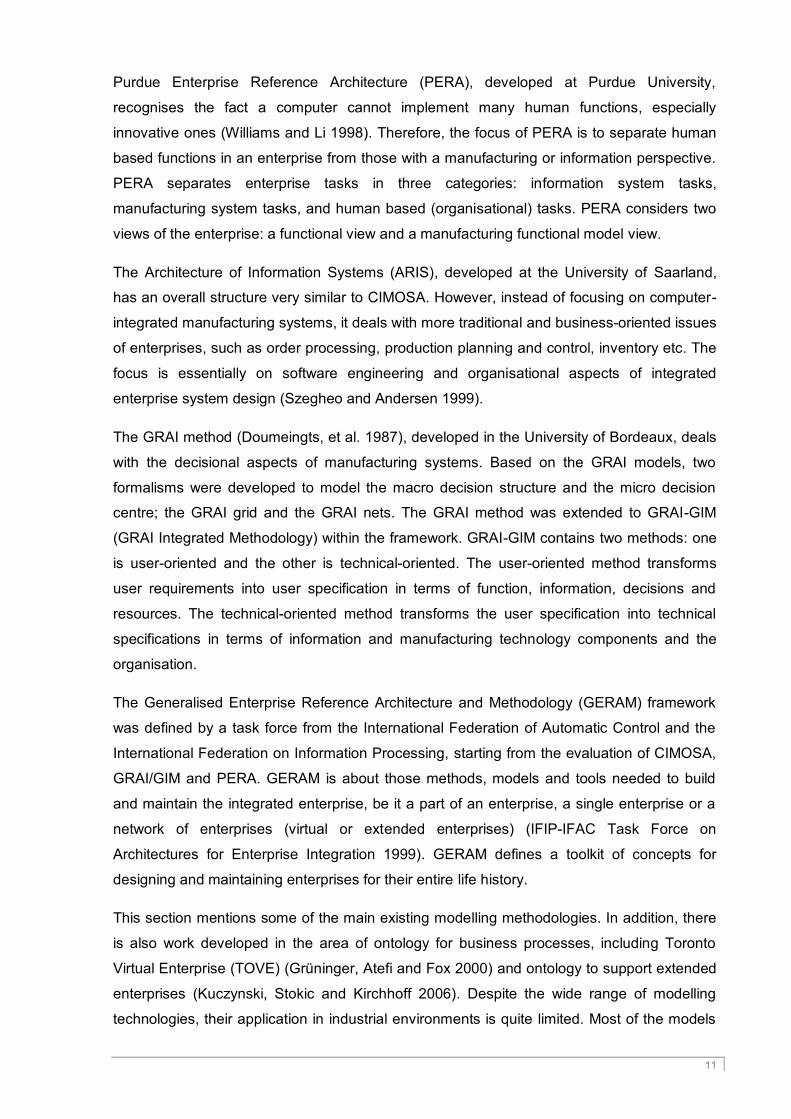
Purdue Enterprise Reference Architecture (PERA), developed at Purdue University,
recognises the fact a computer cannot implement many human functions, especially
innovative ones (Williams and Li 1998). Therefore, the focus of PERA is to separate human
based functions in an enterprise from those with a manufacturing or information perspective.
PERA separates enterprise tasks in three categories: information system tasks,
manufacturing system tasks, and human based (organisational) tasks. PERA considers two
views of the enterprise: a functional view and a manufacturing functional model view.
The Architecture of Information Systems (ARIS), developed at the University of Saarland,
has an overall structure very similar to CIMOSA. However, instead of focusing on computer-
integrated manufacturing systems, it deals with more traditional and business-oriented issues
of enterprises, such as order processing, production planning and control, inventory etc. The
focus is essentially on software engineering and organisational aspects of integrated
enterprise system design (Szegheo and Andersen 1999).
The GRAI method (Doumeingts, et al. 1987), developed in the University of Bordeaux, deals
with the decisional aspects of manufacturing systems. Based on the GRAI models, two
formalisms were developed to model the macro decision structure and the micro decision
centre; the GRAI grid and the GRAI nets. The GRAI method was extended to GRAI-GIM
(GRAI Integrated Methodology) within the framework. GRAI-GIM contains two methods: one
is user-oriented and the other is technical-oriented. The user-oriented method transforms
user requirements into user specification in terms of function, information, decisions and
resources. The technical-oriented method transforms the user specification into technical
specifications in terms of information and manufacturing technology components and the
organisation.
The Generalised Enterprise Reference Architecture and Methodology (GERAM) framework
was defined by a task force from the International Federation of Automatic Control and the
International Federation on Information Processing, starting from the evaluation of CIMOSA,
GRAI/GIM and PERA. GERAM is about those methods, models and tools needed to build
and maintain the integrated enterprise, be it a part of an enterprise, a single enterprise or a
network of enterprises (virtual or extended enterprises) (IFIP-IFAC Task Force on
Architectures for Enterprise Integration 1999). GERAM defines a toolkit of concepts for
designing and maintaining enterprises for their entire life history.
This section mentions some of the main existing modelling methodologies. In addition, there
is also work developed in the area of ontology for business processes, including Toronto
Virtual Enterprise (TOVE) (Grüninger, Atefi and Fox 2000) and ontology to support extended
enterprises (Kuczynski, Stokic and Kirchhoff 2006). Despite the wide range of modelling
technologies, their application in industrial environments is quite limited. Most of the models

12
referred in this section are quite complex or general to make their application possible in an
industrial environment, by the actors of the extended enterprise. When the models are
applicable in industry, they are usually very resource consuming, because they imply long
hours not only from staff within the extended enterprise but also outsourced resources as
knowledge experts.
2.2. EXISTING MODELLING STANDARDS
There has been significant work developed in trying to develop standards to unify
approaches in enterprise engineering and integration. The International Organization for
Standardization (ISO) and the International Electrotechnical Commission (IEC) on the
international level and the European Committee for Standardization (CEN) on the European
level have produced an important set of standards. However, there is still significant work to
do, especially regarding human-related aspects. Recently, these organisations have joint
efforts to produce comprehensive standards, unifying their previous work.
Some important standards lay important rules and concepts in a general perspective. In this
category, it is important to refer ISO 14258, Concepts and Rules for Enterprise Models, and
ISO IS 15704, Requirements for Enterprise Reference Architectures and Methodologies.
These two documents describe fundamental concepts and objectives to be met by enterprise
models.
In addition, there are standards defining framework that aim to improve business process
interoperability, and standards structuring languages that provide languages for modelling
different perspectives of enterprises. In the framework section, three standards are relevant:
CEN/ISO 19439 Framework for Modelling, ISO 15745 Framework for Application Integration
and ISO 15288 Life Cycle Management. Regarding languages, three other standards
appear: CEN/ISO 19440 Constructs for Modelling, ISO 18629 Process Specification
Language and ISO/IEC 15414 ODP Enterprise Language.
In addition to standards to model enterprises, there has also been considerable work in
achieving interoperability among systems and companies. Interoperability between systems
depends on standards to represent data, knowledge and services. The Object Management
Group (OMG) develops enterprise integration standards that include the Unified Modelling
Language (UML), Model Driven Architecture (MDA) and the Common Object Request Broker
Architecture (CORBA), all of which are highly used in various domains. ISO developed the
ISO 10303 standard, known as STEP, Product Data Representation and Exchange, and the
Organisation for the Advancement of Structures Information Standards (OASIS), together
with the United Nations Centre for Trade Facilitation and Electronic Business (UN/CEFACT),
developed the Electronic Business using eXtensible Markup Language (ebXML). The work of

13
interoperability among services has gained major relevance because of the changes in
computing paradigms (e.g. service-oriented architecture, web services). Some research work
has been developing combinations of existing standards to improve interoperability among
companies (Jardim-Gonçalves, Grilo and Steiger-Garção 2006).
For the work presented, the most interesting standard is CEN/ISO 19440 because it is, not
only the most recent, but defines a general set of constructs that are considered essential
when modelling an enterprise. As described below, this standard was used as basis for the
model proposed.
2.3. PROPOSED MODEL
The work presented was realised in the context of developing a comprehensive approach for
problem solving applications in industry, initially with manufacturing companies. The starting
point was the need of some companies to quickly solve problems occurred in their shop-
floor, while avoiding waste of resources. However, these companies recognised that about
95% of the problems occurred were repetitions of previous situations. This means that only
5% of the problems represented new situations in the machines. Therefore, the simple
possibility of accessing what maintenance staff had done in a previous situation could
enhance the problem solving approach in the companies. This simple fact uncovered the
problem that companies do not record occurred problems in a structured way, enabling its
future use.
The research work of how to represent and model problems occurred in a manufacturing
shop floor cannot be isolated from the enterprise. Problems occur in specific machines,
registering precise measures and conditions, and are handled in an exact way by
employees. Therefore, all this information had to be part of describing a problem.
Companies also lack an overview of their structure and operation. They are missing an
enterprise model, which is defined as an abstraction of an enterprise domain that represents
enterprise entities, their interrelationships, their decomposition and detailing to the extent
necessary to convey what it intends to accomplish and how it operates (ISO 2006).
This work presents an enterprise model appropriate for the context of problem solving in
manufacturing enterprises. As will be described later (see chapter 5 Case studies), this
model was also applied in companies not related to manufacturing with satisfactory results.
Because the objective was to develop a model for a wide application, it was necessary to
consider existing standards. The first basis for this model was the European Pre-Standard
ENV12204, and later updated to comply with ISO 19440 (ISO 2007). Table 2.1 shows a
mapping between the constructs indicated in the international standard ISO 19440 and the
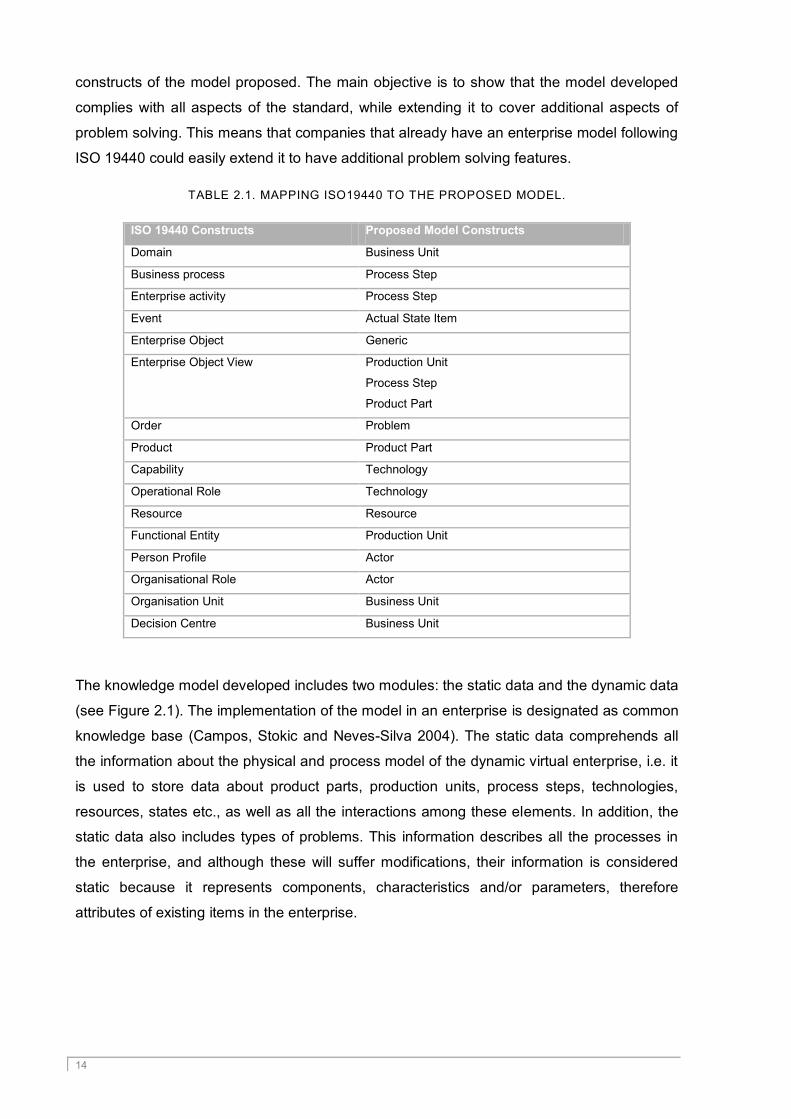
14
constructs of the model proposed. The main objective is to show that the model developed
complies with all aspects of the standard, while extending it to cover additional aspects of
problem solving. This means that companies that already have an enterprise model following
ISO 19440 could easily extend it to have additional problem solving features.
TABLE 2.1. MAPPING ISO19440 TO THE PROPOSED MODEL.
ISO 19440 Constructs Proposed Model Constructs
Domain Business Unit
Business process Process Step
Enterprise activity Process Step
Event Actual State Item
Enterprise Object Generic
Enterprise Object View Production Unit
Process Step
Product Part
Order Problem
Product Product Part
Capability Technology
Operational Role Technology
Resource Resource
Functional Entity Production Unit
Person Profile Actor
Organisational Role Actor
Organisation Unit Business Unit
Decision Centre Business Unit
The knowledge model developed includes two modules: the static data and the dynamic data
(see Figure 2.1). The implementation of the model in an enterprise is designated as common
knowledge base (Campos, Stokic and Neves-Silva 2004). The static data comprehends all
the information about the physical and process model of the dynamic virtual enterprise, i.e. it
is used to store data about product parts, production units, process steps, technologies,
resources, states etc., as well as all the interactions among these elements. In addition, the
static data also includes types of problems. This information describes all the processes in
the enterprise, and although these will suffer modifications, their information is considered
static because it represents components, characteristics and/or parameters, therefore
attributes of existing items in the enterprise.

15
FIGURE 2.1. PROPOSED ENTERPRISE MODEL.
The dynamic data comprises information about actual data for a specific instant of time, i.e.
specific values for any element, attribute or relation defined in the common knowledge base.
This set of information represents problems, process deviations, specific values of machine
states, probable causes for problems and actions.
The static data of the common knowledge base represents the complete infrastructure of the
enterprise, and its modification reflects a business decision. The dynamic data of the
common knowledge base contains information on the actual state of the enterprise's
variables, which is described using components from the static set of the common
knowledge base.
The model comprehends many relationships that enable to save interactions among
elements, which constitute a major source of information in the enterprises.
Following the application of the ISO 19440 standard, the constructs that define the proposed
enterprise model are described using a common structure and template. Each model
construct is described, according to ISO 19440, by (ISO 2007):
a textual description consisting of brief text defining the modelling language construct in
terms of a purpose, its description and its intended usage, and
a construct template, which organises and defines the attributes for the modelling
language construct.
Static Knowledge
used in realised in
valid for
affected by
controlled by
assigned toowned by
used in
Production
Unit (PU)
Process
Step (PS)
Product
Part (PP)
Business
Unit(Ext.Enterprise)
assigned
to
belong
to
constrained
by
Dynamic Knowledge
defined
by
refers
to
defined by
occur at Problem
involved
in
Generic
(PU/PS/PP)
Actual
State
Item
valid for
CausesProblem
TypeActions
associated to
Probable
Causes
defined by
related to
caused by
Influence
Technology
StateState
Item
reported by
Actorknown by
sold to
caused by
enable
removed by
supplied by
supplied by
reported by

16
The template is described in an informal manner but using a common pro forma. In
turn, the construct template shall have the form described below:
a) Header part having the same attributes for each modelling language construct and
containing attributes relating to the identity of a construct instance and to its context.
It shall be structured as follows:
1) construct label (a literal string denoting the kind of construct);
2) identifier (a literal string that is unique for each occurrence of the modelling
language construct within the model);
3) name (the name of the instance of the modelling language construct);
4) authority for model design (i.e. the identifier of the Organisational Role or
Organisational Unit responsible for the design of this construct): for all construct
and for all attributes concerned with authorities or responsibilities, the identifier or
name of the Organisational Unit may be omitted in the Concept Identification and
Requirements Definition modelling phases.
b) Body part containing the particular attributes that are specific to each construct and
whose description is derived from the particular modelling language construct
definition. Body parts shall then be structured ion two further partitions as follows:
1) descriptives, containing descriptive attributes that comprise
construct-identifying description in textual form,
construct attributes that are predefined,
additional construct attributes that may be defined by the user to meet
particular needs, such as those required by additional model views, and
attribute qualifications – statements that are made about whether attribute
values are mandatory or optional, when they are applicable, etc.
2) relationships, containing relationship attributes that can include
Operational relationships, that are responsibility and authority for model
operation (i.e. the identifier of the Organisational Role and Organisational Unit
responsible for the operational usage of this construct or authorised to change
its usage),
Specialisation_of relationships, representing relationships between a
specialisation and its generalisation,
Part_of relationships, representing relationships between this construct
instance and the whole aggregated from such instances,
Consists_of relationships, representing relationships between this construct
instance and its constituent parts, and
Association relationships for other forms of relationships, either predefined or
user-defined (such as provision or usage of a Capability instance by Resource
or Enterprise Activity instances).
17
The work done includes a full specification of the proposed model following this structure, to
be compliant to the standard. However, this structure is not very suitable to present the
proposed constructs in this thesis. Therefore, the following sections include a textual
description of the model, presenting the same information requested by the standard
template, while the standard-compliant forms are in Annex A, Model Specification.
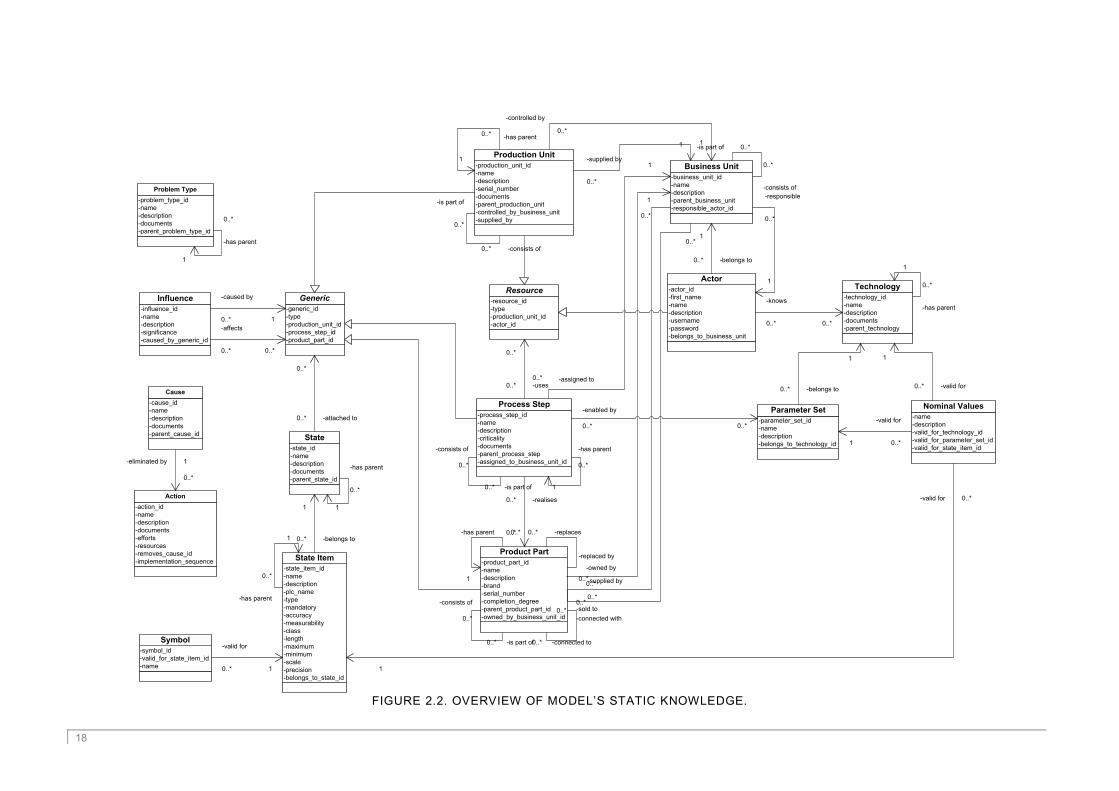
2.3.1. STATIC KNOWLEDGE
The static knowledge represents a model of the product and process models of the
enterprise. Figure 2.2 represents the main objects in the static knowledge. Several
inheritance relationships mark the model, which represent the complete hierarchy of the
industrial companies, and especially the manufacturing processes. The hierarchy enables
the representation of repeatable similar objects, with unique characteristics. This is a key
aspect for the companies, which helped to ease the knowledge acquisition process.
The following text describes briefly each object of the static knowledge model. All the main
objects of this model include attributes for identifier, name, description and documents.
A business unit represents the organisational structure of the enterprise, according to its
decomposition. A business unit can represent one company or one of its departments or
units. The business unit corresponds to a domain, i.e. the boundary and the content of an
enterprise or a portion of an enterprise for which an enterprise model is to be created. The
business units are leading elements in the model because they control the production
elements, i.e. process steps, product parts and production units. Business units are defined
using attributes for identifier, name, description, documents and responsible. This last
attribute characterises the person responsible for the business unit and is an actor. Business
units have two relationships defined among themselves. A hierarchy defines a parent_of
relation that represents a generalisation between two elements. A decomposition relationship
defined by consists_of and part_of indicates the organisational chart of the company. When
modelling a multi-site company, it is possible to have one business unit ―maintenance
department‖ which is the parent of ―maintenance city A‖ and ―maintenance city B‖. The two
children are a specialisation of the parent business unit. On the other hand, it would be
possible to define that business unit ―maintenance city A‖ consists_of two different business
units called ―routine maintenance‖ and ―emergency response‖.
An actor describes an employee of the extended or virtual enterprise, using attributes for
identifier, surname, name, username, password, email, and phone. Actors always belong to
one business unit, providing the information of which organisational structure (department or
even company) the person represents. This is registered in the attribute belongs to business
unit.
18
FIGURE 2.2. OVERVIEW OF MODEL‘S STATIC KNOWLEDGE.
-production_unit_id
-name
-description
-serial_number
-documents
-parent_production_unit
-controlled_by_business_unit
-supplied_by
Production Unit
-process_step_id
-name
-description
-criticality
-documents
-parent_process_step
-assigned_to_business_unit_id
Process Step
-product_part_id
-name
-description
-brand
-serial_number
-completion_degree
-parent_product_part_id
-owned_by_business_unit_id
Product Part
-business_unit_id
-name
-description
-parent_business_unit
-responsible_actor_id
Business Unit
-actor_id
-first_name
-name
-description
-username
-password
-belongs_to_business_unit
Actor
-resource_id
-type
-production_unit_id
-actor_id
Resource
-controlled by
0..*
1
1
-belongs to0..*
1
-has parent0..*
-consists of0..*
-is part of
0..*
-technology_id
-name
-description
-documents
-parent_technology
Technology
-knows
0..* 0..*
1
-has parent
0..*
0..*
-uses0..*
-is part of 0..*
-consists of
0..*
-influence_id
-name
-description
-significance
-caused_by_generic_id
Influence
-generic_id
-type
-production_unit_id
-process_step_id
-product_part_id
Generic-caused by
0..* 1
-affects
0..* 0..*
-state_id
-name
-description
-documents
-parent_state_id
State
0..*
-attached to0..* -parameter_set_id
-name
-description
-belongs_to_technology_id
Parameter Set
1
-belongs to0..*
-name
-description
-valid_for_technology_id
-valid_for_parameter_set_id
-valid_for_state_item_id
Nominal Values
1
-valid for0..*
1
-valid for
0..*-has parent
0..*
1-is part of0..*
-consists of
0..*
-enabled by
0..* 0..*
-realises0..*
0..*-has parent 0..*
1
-is part of0..*
-consists of
0..*
-connected to0..*
-connected with
0..*
-replaced by
0..*
-replaces0..*
-state_item_id
-name
-description
-plc_name
-type
-mandatory
-accuracy
-measurability
-class
-length
-maximum
-minimum
-scale
-precision
-belongs_to_state_id
State Item
1
-belongs to0..*
-symbol_id
-valid_for_state_item_id
-name
Symbol-valid for
0..* 1
1
-assigned to0..*
-owned by
0..*
1-responsible
0..*
1
-supplied by
0..*
0..*
-sold to0..*
0..*
-has parent
0..*
1
-has parent
0..*
1
-cause_id
-name
-description
-documents
-parent_cause_id
Cause
-problem_type_id
-name
-description
-documents
-parent_problem_type_id
Problem Type
1
-has parent
0..*
-action_id
-name
-description
-documents
-efforts
-resources
-removes_cause_id
-implementation_sequence
Action
0..*
-eliminated by 1
1
-valid for 0..*
-supplied by
0..*
1

19
A technology represents application of scientific knowledge or techniques in the company‘s
operational life. It describes all the techniques used in assembling or manufacturing and
services, and for which knowledge is needed within the enterprise. This object comprehends
attributes for identifier, name, description, equation and documents. There is a relationship
between technologies and actors, since technologies represent actors‘ expertise, i.e. actors
know technologies. In addition, technologies have a relationship among themselves,
representing a hierarchy of scientific subjects, through the parent_of relation.
A production unit describes a physical resource of the enterprise used to realise an activity.
In most cases, a production unit is some kind of machine used to produce something.
Production units include attributes for identifier, name, description, and serial number. Each
production unit belongs to one business unit, through the attribute controlled_by, providing
information about its location and responsibility. Production units relate to business units,
through relation supplied_by, since some organisational structure supplies each production
unit, being a department within the company or another company in the extended enterprise.
Production units have two relationships defined among themselves: a hierarchy defines a
parent_of relation that represents a generalisation between two elements; and a
decomposition relationship is defined by consists_of and part_of.
A resource is a generalisation of two existing objects, representing physical and human
assets of the extended enterprise. Therefore, a resource is always either a production unit or
an actor.
A process step is an activity of the enterprise that represents part of process functionality
needed to realise a basic task within the enterprise. Each process step comprehends
attributes for identifier, name, description, documents and criticality. Each process step is
assigned to a business unit of the extended enterprise, through the attribute assigned_to,
providing information about its exact location. Process steps have two relationships defined
among themselves: a hierarchy defines parent_of relation that represents a generalisation
between two elements; and a decomposition relationship defines consists_of and part_of.
Technologies enable process steps, in the sense that to produce an activity it is necessary to
have some specific scientific knowledge. As a process step is an activity, it uses resources of
the extended enterprise, i.e. it uses actors and production units.
A product part represents a complete product, a part of it, or even raw material used in the
company, which connects in any way with other product parts and/or transformed to result in
a whole product. Product parts include attributes for identifier, name, description, brand,
serial number and completion degree. Each product part relates to a business unit, through
the attribute owned_by, which provides exact information about where in the extended
enterprise the product part is used. Additionally, business units within the extended
20
enterprise also supply and sell product parts. Product parts have four relationships among
themselves: a hierarchy defines parent_of relationship that represents a generalisation
between two elements; a decomposition relationship defines consists_of and part_of; a
relationship connected_to and connected_with defines product parts that are attached or
united; and the relationship replaced_by and replaces defines possible substitutions of
product parts to use in case of stock rupture. Product parts are the result of a process step,
defined in the relationship results_in.
A generic is a generalisation of three existing objects, representing the three main elements
of the extended enterprise: production units, process steps and product parts. Generics exist
to ease several relationships among different elements and the three objects.
An influence represents power or constraints that one generic may have upon others. It is
quite common, in an extended enterprise, that for example one machine affects how other
machines work (e.g. a controller affects machines beneath it). Influences comprehend
attributes for identifier, name, description and significance. Each influence is cause by one
generic, defined in the attribute caused by generic, and can affect several generics, defined
in the relationship affects.
A state represents a group of characteristics that can describe a generic, especially
measurable information. A state includes attributes for identifier, name, description and
documents. States have a relationship among themselves that defines a hierarchy,
parent_of, which represents a generalisation between two elements. This hierarchy is
extremely important for problem solving applications, since it implies inheritance of
characteristics from parent to child. States relate to generics, through the relationship
attached_to.
A state item represents a specific variable of a generic, i.e. a characteristic that can be
measured at a certain instant of time. This information is especially useful to provide
additional knowledge in the occurrence of a problem. State items are organised in categories
defined by states, and divided into five types: Boolean, text, date, numeric and symbolic.
State items include attributes for identifier, name, description, programmable logic controller
(PLC) name, type, mandatory, accuracy, measurability and class. State items have additional
attributes that are specific for each type. When the state item has the type text, then it is also
necessary to define the attribute length, which defines the maximum number of characters
allowed. When defining date or Boolean state items, there is no need for any additional
attributes. In case of numeric state items, it is essential to define attributes for minimum,
maximum, scale and precision. These identify the range allowed for the numeric state item,
as well as number of decimal and total digits permitted. Finally, when defining symbolic state
items, it is required to define a list of allowed symbols to choose from. State items have a

21
relationship among themselves that defines a hierarchy, parent_of, which represents a
generalisation between two elements.
A parameter set establishes a set of variables that connect process steps and technologies.
Parameter sets have attributes for identifier, name and description. Parameter sets have a
relationship to process steps, enables, and another relationship to technology, belongs_to.
A nominal value is a specific variable of the parameter set, which indicates the measures
that are available for each technology and process step. A nominal value includes attributes
for name and description. Variables that can be measured for the physical elements of the
extended enterprise are already part of the model, defined as state items. Therefore, nominal
values are actually a combination of three relationships of the type valid_for. Nominal values
are valid for a specific technology, a parameter set and a state item.
A problem type provides classification of typical problems that occur in the extended
enterprise. Problem types provide a first classification of a problem detected, and are defined
according to the enterprise‘s know-how. Problem types comprehend attributes for identifier,
name, description and documents.
A cause defines standard problem origins in the extended enterprise. While some problems
can occur unexpectedly, others are predictable, and even described in troubleshoot sections
of manuals. Therefore, it is possible to define a list of typical problems, which define problem
types, and their origin, the causes. Causes include attributes for identifier, name, description,
and documents.
An action defines an act carried out to eliminate a problem‘s cause. Similar to causes and
problem types, this information exists in the extended enterprise expertise, often in manuals
and employees‘ know-how. Actions include attributes for identifier, name, description,
resources, and efforts. Each action relates to a cause with a sequence number, since several
actions may be required to eliminate a cause.
Causes and actions have a semi-dynamic nature because the initial static set of instances
defined grows more dynamically than any other construct in the static data. Although it is
possible to define an initial set of instances for these two constructs, it increases substantially
with the use of the problem-solving application.
2.3.2. DYNAMIC KNOWLEDGE
Once all the static data of the extended enterprise is collected and modelled, it is then
possible to define the dynamic part of the model. Figure 2.3 represents the main constructs
of the model‘s dynamic knowledge.
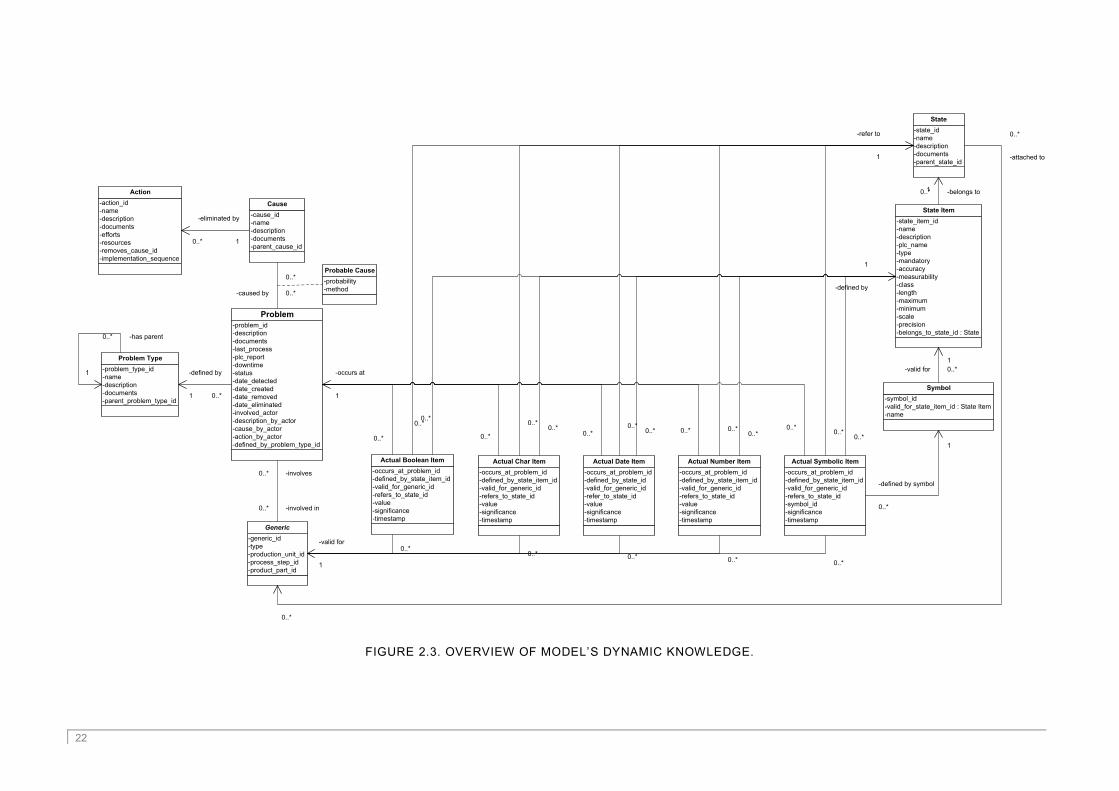
22
FIGURE 2.3. OVERVIEW OF MODEL‘S DYNAMIC KNOWLEDGE.
-problem_id
-description
-documents
-last_process
-plc_report
-downtime
-status
-date_detected
-date_created
-date_removed
-date_eliminated
-involved_actor
-description_by_actor
-cause_by_actor
-action_by_actor
-defined_by_problem_type_id
Problem
-generic_id
-type
-production_unit_id
-process_step_id
-product_part_id
Generic
-problem_type_id
-name
-description
-documents
-parent_problem_type_id
Problem Type
1
-has parent0..*
1
-defined by
0..*
-involves0..*
-involved in0..*
-cause_id
-name
-description
-documents
-parent_cause_id
Cause-action_id
-name
-description
-documents
-efforts
-resources
-removes_cause_id
-implementation_sequence
Action
0..*
-eliminated by
1
-occurs_at_problem_id
-defined_by_state_item_id
-valid_for_generic_id
-refers_to_state_id
-value
-significance
-timestamp
Actual Boolean Item
-occurs_at_problem_id
-defined_by_state_item_id
-valid_for_generic_id
-refers_to_state_id
-value
-significance
-timestamp
Actual Char Item
-occurs_at_problem_id
-defined_by_state_id
-valid_for_generic_id
-refer_to_state_id
-value
-significance
-timestamp
Actual Date Item
-occurs_at_problem_id
-defined_by_state_item_id
-valid_for_generic_id
-refers_to_state_id
-value
-significance
-timestamp
Actual Number Item
-occurs_at_problem_id
-defined_by_state_item_id
-valid_for_generic_id
-refers_to_state_id
-symbol_id
-significance
-timestamp
Actual Symbolic Item
-state_id
-name
-description
-documents
-parent_state_id
State
0..*
-attached to
0..*
-state_item_id
-name
-description
-plc_name
-type
-mandatory
-accuracy
-measurability
-class
-length
-maximum
-minimum
-scale
-precision
-belongs_to_state_id : State
State Item
1 -belongs to0..*
-symbol_id
-valid_for_state_item_id : State Item
-name
Symbol
-valid for 0..*
1
-occurs at
1
0..* 0..* 0..* 0..*0..*
-defined by symbol
0..*
1
-valid for
1
0..*0..* 0..* 0..*
0..*
0..*
-refer to
1
-defined by
1
0..* 0..*0..* 0..*
0..* 0..*0..* 0..*
0..*
-probability
-method
Probable Cause0..*
0..*-caused by
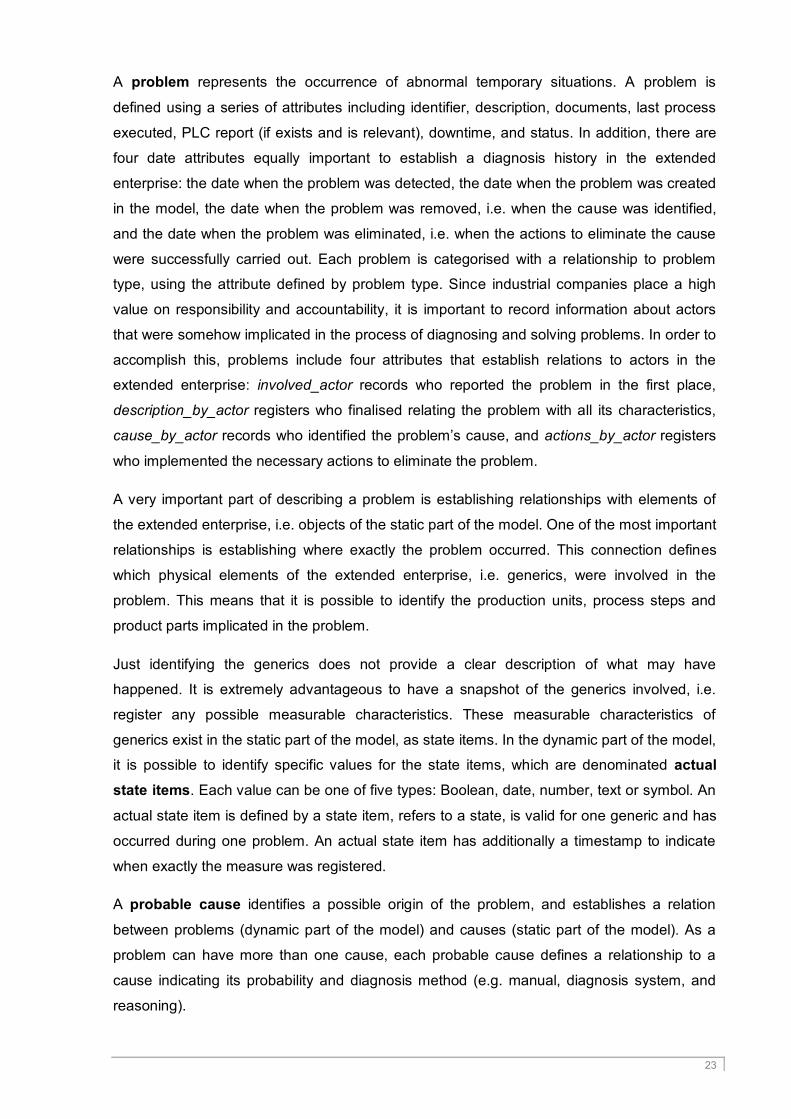
23
A problem represents the occurrence of abnormal temporary situations. A problem is
defined using a series of attributes including identifier, description, documents, last process
executed, PLC report (if exists and is relevant), downtime, and status. In addition, there are
four date attributes equally important to establish a diagnosis history in the extended
enterprise: the date when the problem was detected, the date when the problem was created
in the model, the date when the problem was removed, i.e. when the cause was identified,
and the date when the problem was eliminated, i.e. when the actions to eliminate the cause
were successfully carried out. Each problem is categorised with a relationship to problem
type, using the attribute defined by problem type. Since industrial companies place a high
value on responsibility and accountability, it is important to record information about actors
that were somehow implicated in the process of diagnosing and solving problems. In order to
accomplish this, problems include four attributes that establish relations to actors in the
extended enterprise: involved_actor records who reported the problem in the first place,
description_by_actor registers who finalised relating the problem with all its characteristics,
cause_by_actor records who identified the problem‘s cause, and actions_by_actor registers
who implemented the necessary actions to eliminate the problem.
A very important part of describing a problem is establishing relationships with elements of
the extended enterprise, i.e. objects of the static part of the model. One of the most important
relationships is establishing where exactly the problem occurred. This connection defines
which physical elements of the extended enterprise, i.e. generics, were involved in the
problem. This means that it is possible to identify the production units, process steps and
product parts implicated in the problem.
Just identifying the generics does not provide a clear description of what may have
happened. It is extremely advantageous to have a snapshot of the generics involved, i.e.
register any possible measurable characteristics. These measurable characteristics of
generics exist in the static part of the model, as state items. In the dynamic part of the model,
it is possible to identify specific values for the state items, which are denominated actual
state items. Each value can be one of five types: Boolean, date, number, text or symbol. An
actual state item is defined by a state item, refers to a state, is valid for one generic and has
occurred during one problem. An actual state item has additionally a timestamp to indicate
when exactly the measure was registered.
A probable cause identifies a possible origin of the problem, and establishes a relation
between problems (dynamic part of the model) and causes (static part of the model). As a
problem can have more than one cause, each probable cause defines a relationship to a
cause indicating its probability and diagnosis method (e.g. manual, diagnosis system, and
reasoning).
24
2.4. MODELLING METHODOLOGY
Gathering, modelling, structuring and storing information are difficult tasks. Industrial
companies usually search help for such processes, turning to experts in knowledge and
information and communication technologies, frequently designated as knowledge
engineers. Knowledge acquisition is the task of gathering information from any source, and
knowledge elicitation is the sub-task of gathering knowledge from human experts (Shadbolt
and Burton 1989). There are a number of tools to support knowledge acquisition and
elicitation, but they require considerable experience to ensure an efficient process.
With the objective of supporting industrial companies in minimising the need for external
support, the proposed model is not a stand-alone development. It is accompanied by a
comprehensive methodology to help industrial companies in modelling their extending
enterprises, with limited support from knowledge modelling experts. The objective of the
methodology is to provide industrial actors with guidelines that allow them to identify the
relevant information to be modelled within the extended enterprise, and also methods on how
to efficiently acquire that information.
There have been several representations of steps or stages for a knowledge acquisition
process. Buchanan et al. suggest five stages for knowledge acquisition: identification,
conceptualisation, formalisation, implementation and testing (Buchanan, et al. 1983). Rook
and Croghan further specify this knowledge acquisition process, by defining seven steps:
knowledge framework specification, knowledge resource identification, macro-knowledge
extraction, knowledge partitioning, micro-knowledge extraction, knowledge formalisation and
knowledge encoding (Rook and Croghan 1989). Grover developed a simplified knowledge
acquisition cycle comprehending three phases: domain definition, fundamental knowledge
formulation and basal knowledge consolidation (Grover 1983).
All the knowledge acquisition processes start with a stage of defining the domain and
objectives, which includes determining the type of information to be acquired and who is
involved in the process. Afterwards there is the stage of knowledge acquisition and
elicitation, where usually knowledge engineers try to collect the necessary information from
all actors identified in the domain. The final stage is to validate the information collected and,
if possible and desirable, extract additional knowledge based on the information collected,
e.g. rules. These are the main stages of every knowledge acquisition process, which appear
sometimes further detailed in more steps.

25
The current methodology proposes a process in four phases:
1. define the domain and actors;
2. collect static data;
3. collect dynamic data; and
4. extract rules.
The first phase is simpler than in many methodologies because of the model proposed,
because companies do not need to formulate which type of information they need to model
or acquire. The objective is to collect information to model all the classes defined in the
enterprise model proposed. Therefore, the first phase aims at finding the most appropriate
modelling team within the extended or virtual enterprise. To define the enterprise model,
qualified staff must be involved. For this, it is necessary to build a project team with staff of all
concerned areas, departments and even companies within the extended enterprise. This
project team shall include staff from production, quality assurance, process development and
information technology areas. As one of the objectives is to model information to be used in
problem solving applications, it is essential to have staff experienced with current problems
and the process connections. To ensure an efficient introduction, the project management
shall be realised by an employee with experience on the implementation of information
systems as well as on the application cases. The knowledge engineers support the
management in identifying the actors involved in each phase of the process and relate to the
appropriate data classes.
Because the proposed enterprise model is divided into a static and dynamic part, and the
latter depends on the former‘s definition, the second phase focus on collecting instances of
static data. The description of object instances in the enterprise model is a decisive
procedure to get useful and efficient applications. If the instances defined are unsuitable, it
might be possible that e.g. the numbers of relations between instances are unnecessarily
increased. This decreases the efficiency of the model and limits its potential use.
Therefore, it is necessary to consider the following basic requirements for the definition of
instances:
minimum number of instances;
clarity of instances (e.g. problems can only be assigned to one single problem
type);
simple extension of instances (the objects are defined in a way to be easily
extended and the definition of new objects avoids the redefinition of existing
objects).

26
The proposed model has many possible relationships among the objects. The full use of
these relationships, especially hierarchies, supports the definition of a minimum number of
instances for each object.
The modelling team shall provide the enterprise‘s static data in a specific order, to facilitate
the process. Therefore, this second phase includes acquiring information on business units,
actors, process steps, production units, product parts, technologies, states, and state items.
The company areas and business processes essentially describe the organisational
construction of the extended enterprise and the activities are a functional description. For the
collection of the information, respective reference models are a good basis (e.g. Supply-
Chain Operations Reference Model, SCOR). Moreover, an extended enterprise normally has
different process models. The modelling team has to consider these different models while
collecting the process information.
The proposed methodology provides a checklist and a questionnaire for a structured
interview aiming at eliciting the static data from the enterprise actors (see Annex B, Modelling
Methodology Tools). The interviews are performed by knowledge engineers or by actors
within the enterprise, following the guidelines provided. The purpose of the first set of
interviews is to identify instances of the classes, including a detailed description. After the
interviews, a second round of sessions uses teach-back tools where the team leader of the
modelling process describes the information acquired so that experts can identify and correct
errors and complete the information. After having identified the instances of each class, the
team needs to define the relations among instances, which are an important part of the
proposed enterprise model. The methodology proposes the use of laddering and card sorting
techniques that allow actors to organise instances in hierarchies, using e.g. tree diagrams,
and grouping instances by specific characteristics.
After having defined the enterprise information, it is possible to start collecting data about
problem types, possible problem causes and actions. Usually the companies have a good
categorisation of problem types, which appear listed in manuals and quality procedures. In
addition to their own expertise, actors use existing information on causes to fill out the tables
comprehended in the methodology. To support this work, the methodology includes tables
with a pre-defined list of groups to structure the causes. The method to collect information on
problem causes is based on the well-known Ishikawa or cause-and-effect diagrams
(Ishikawa 1982). The methodology uses, as pre-defined groups, the 5 M‘s: Man, Machine,
Material, Method and Mother Nature (or Environment). The objective of the team is then to
decompose further each group into more specific causes. When the extended enterprise has
no information available about problem causes, the methodology suggests performing a
cause analysis for several concrete problems, using an Ishikawa diagram. The experts can
27
identify the causes by attempting to answer a list of questions provided for each of the 5M‘s
groups.
Apart from the problem causes information, it is also required to collect data over possible
actions realised to eliminate the causes. Therefore, actors apply a similar procedure to the
one used for problem causes. Actors collect enterprise available information on actions (e.g.
from action forms according to DIN EN ISO 9000ff standards) and document it in the tables
provided in the methodology. For a better survey, the methodology introduces groups,
following the groups for problem causes, i.e. 5 M‘s. If the application targeted within the
extended enterprise is very wide, the modelling team should consider introducing several
hierarchy levels, which are supported by the proposed model and methodology. An example
is to assign the 5 M‘s to each business process in the extended enterprise.
The team responsible for the enterprise model has to consider constantly the readability of
the information defined and collected. For example, actors need to describe actions to
eliminate problem causes as detailed as possible, enabling any actor to perform them
afterwards. The methodology suggests the use of matrix-based techniques to map the
possible causes to their usual actions.
Modelling the extended enterprise is a strongly iterative process. After defining a new
instance, it is often necessary to adjust and complete the other instances or relations
according to the new information and findings.
The third phase of the modelling process is to collect the dynamic data of the enterprise, i.e.
occurrences of problems. In some situations, companies need to start using problem-solving
tools immediately, such as case-based reasoning. These tools depend on instances defined
in a knowledge base, which means that companies need to collect as many past instances of
dynamic data, as possible. The phase of collecting dynamic data can therefore occur before
starting to use any applications (because information is needed) or it runs during the
standard use of an application system. Companies frequently document non-conformities
following quality procedures. This information is extremely useful to document instances of
problems occurred. The methodology proposes to complement this with interview and
commentary techniques, where actors can explain what they usually do in specific situations.
It is possible to observe the normal work of some actors, or ask them to comment and
explain specific situations that are, for example, presented in videos.
Several authors identify knowledge acquisition and elicitation as the bottleneck for the
successful implementation and adoption of knowledge-based systems. The objective of the
proposed model and methodology is to contribute for companies to have an accessible
mechanism to collect and re-use information for different applications. The approach was
tested in several companies, in different domains, as described in chapter 5, Case studies.

28
All the applications presented relate to decision-making processes, and particularly problem
solving. However, the model proposed includes a comprehensive set of static data capable
of supporting other applications.

29
3. DECISION SUPPORT IN INDUSTRIAL ENVIRONMENTS
Many tasks in an industrial environment are somehow related to reaching a conclusion after
considering several alternatives, i.e. making a decision. Companies face decisions everyday,
involving several actors and situations (e.g. developing a new product, fixing a machine,
hiring a new employee). With the market pressure and rapid changing environments,
decisions are becoming more and more complex, and they involve more people, not
necessarily from the same company. Quite often, decision-making processes involve
different actors within the extended enterprise.
Improving individuals and groups abilities to solve problems and make decisions is an
important issue in many sectors in a society such as education, industry, government and the
military. Many researchers are turning to collaboration as a way to make such decisions
(Grand 1999) (Klein 1999).
The evolution of telecommunications network technology has dramatically facilitated the
sharing of information and the participation of individuals in the decision-making process
(Karacapilidis, An Overview of Future Challenges of Decision Support Techniques 2006).
Group decision-making becomes a necessity in the contemporary enterprise (Fjermestad
and Hiltz 2000); the more different perspectives are taken into account, the smaller the
chances of addressing the wrong problem and reaching an inadequate solution (Vennix
1996).
Decision making in a distributed environment through mutual collaboration of the participants
has been termed as collaborative decision making (CDM). A definition of CDM, according to
Karacapilidis (Karacapilidis, Dimitris and Costas, Computer-Mediated Collaborative Decision
Making: Theoretical and Implementation Issues 1999), is the ―process of decision making in
a collaborative environment where the problems can be addressed through argumentative
discourse and collaboration among the users involved.‖
Collaborative decision making and the respective supporting systems address several
research and development areas. Issues such as collecting, creating, eliciting, integrating,
sharing and re-using data, information and knowledge are essential in a collaborative
framework to make decisions. In addition, CDM has to comprehend a structured
methodology to address decision-making analysis, argumentation among participants,
30
negotiation and conflict resolution, and consensus management. Furthermore, a
collaborative decision support system can only be efficient if it enables the integration of the
several decision-making processes and tools, while stimulating human participation.
3.1. METHODS TO SUPPORT DECISION-MAKING
Decision-making is usually performed through debates and negotiations among a group of
people (Boose, et al. 1993), and depends largely on the data and knowledge available. The
decision making process involves the art of managing qualitative data and analysing it, i.e.,
integrating ideas developed in one area with ideas developing in another area, and then
transferring it to those groups.
The knowledge necessary for decision-making is attained with different degrees of
confidence at different stages of decision-making, and sometimes, incomplete knowledge is
acquired. Collaboration is conducted under virtual dynamic team environment, and
knowledge is shared with inadequate understanding. Decisions are made under the influence
of many uncertain factors. Thus, the ability to handle different types of uncertainty in
decision-making becomes extremely important (Qiu, Chui and Helander 2004).
However, despite the centrality of uncertainty in the decision-making, only few studies
addressed this question (Lipshitz and Strauss 1997). In (Qiu, Chui and Helander 2004) it is
proposed a model of knowledge-based collaborative decision-making, where three sources
of uncertainties are identified: imprecise knowledge, dynamic team environment and conflict
of system support. Decision-making usually involves knowledge from different sources that
are vague, uncertain, default-based, or judgemental, and which have different degrees of
reliability. Imprecise knowledge acquired by decision makers can be misleading in decision-
making. There are inherent obstacles of virtual teams that come with uncertainties, such as
the dynamic of trust. Dynamic team environment increases inadequate understanding of
team objectives and update progress of project, and it also increases the difficulty in
communication among teammates. The introduction of any tool into an environment has the
potential to serve as a catalyst for change. The conflicts of system support exist in the
following three categories: conflict with the natural flow of decision-making process, conflict
in supporting the right team member and conflict in conveying the precise knowledge. The
model presented in (Qiu, Chui and Helander 2004) comprehends methodologies on how to
reduce uncertainties in knowledge-based collaborative decision-making.
One important issue in collaborative decision-making and collaborative decision support
systems is the implementation of argumentation support systems for different types of groups
and application areas. Such systems address the needs of a user to interpret and reason
about knowledge during a discourse (Karacapilidis, Dimitris and Costas, Computer-Mediated
31
Collaborative Decision Making: Theoretical and Implementation Issues 1999). For instance,
QuestMap (Conklin 1996) captures the key issues and ideas during meetings and creates
shared understanding in a knowledge team, showing the history of an online conversation
that led to key decisions and plans. Euclid (Smolensky, et al. 1987) is another system that
provides a graphical representation language for generic argumentation. JANUS (Fischer,
McCall and Morch 1989) is based on acts of analysing existing knowledge in order to foster
the understanding of a design process. SEPIA (Streitz, Hannemann and Thuering 1989) is a
knowledge-based authoring and idea processing tool for creating and revising hyper
documents. Finally, Belvedere (Tan and Pearl 1994) uses a rich graphical language to
represent different logical and rhetorical relations within a debate. Although these systems do
not have decision-making capabilities, they provide a cognitive argumentation environment
that stimulates discussion among participants (Karacapilidis, Dimitris and Costas, Computer-
Mediated Collaborative Decision Making: Theoretical and Implementation Issues 1999)
(Karacapilidis, Computer Supported Argumenation and Collaborative Decision Making: The
HERMES System 2001).
Numerous web-based conferencing systems have also been deployed, such as AltaVista
Forum Center, Open Meeting, NetForum and UK Web‘s Focus etc. They usually provide
means for discussion structuring and user administration tools, while the more sophisticated
ones allow for sharing of documents, online calendars, embedded e-mail and chat tool etc.
However, there is a lack of consensus seeking abilities and decision-making methods
(Hurwitz and Mallery 1995).
A prerequisite for computer-mediated CDM tools is the ability for the computer to
―understand‖ (at least partially) the dialogue in a decision-related argument between people,
and the discourse structure used in presenting supportive material in a document. This
requires a computational model of the discourse acts, which are used in these cases.
Although there has been work in artificial intelligence on dialogue and discourse in
collaboration and negotiation (De Michelis and Grasso 1994) (Di Eugenio, et al. 1997) (Grosz
and Sidner 1990) (Merin 1997), that work is not sufficient for modelling dialogues in the CDM
context. More specifically, it is rather general and not explicitly oriented towards real-life CDM
environments (Karacapilidis, Dimitris and Costas, Computer-Mediated Collaborative Decision
Making: Theoretical and Implementation Issues 1999).
In (Sidner 1994), it is presented a model of collaborative negotiation based on the idea of
establishing mutual beliefs, that is, beliefs that agents hold in common. This model rests
upon the non-existence of deception, and appears fragile in the presence of mutual
misunderstandings. The work of Cohen and Levesque (Cohen and Lavesque 1990) and of
Smith and Cohen (Smith and Cohen 1996) is very similar to Sidner‘s work, but relies in
addition on the primitive notion of joint goals. Core and Allen (Core and Allen 1997) introduce
32
a scheme for annotating communication acts in dialogue, which ignores the formation of
opinion by hearers about speakers.
An understanding of the implications in the CDM process requires a model of the mental
attitudes of the agents involved (their beliefs, desires, intentions, goals etc.) as they pertain
to the task at hand. Further, it requires a model for the particular form of discourse acts that
agents use to communicate their knowledge and intentions, and affect the attitudes of others.
In addition, it requires a model of the actions that relate to the argument process itself.
HERMES (Karacapilidis, Dimitris and Costas, Computer-Mediated Collaborative Decision
Making: Theoretical and Implementation Issues 1999) is a web-based system that enhances
group decision-making by providing an argumentation framework to the agents involved.
Argumentation is performed through a set of discourse acts, especially designed for the CDM
context following an artificial intelligence perspective. HERMES provides the appropriate
machinery for automating processes such as discussion structure, consistency checking and
reasoning for decision-making. Moreover, it includes further assistance modules with
information retrieval, natural language processing and argument building features. However,
this system focuses only on asynchronous collaboration.
CDM usually includes intricate debates and the need for negotiation among the individuals
involved in the decision-making. Conflicts of interest are inevitable and support for achieving
a consensus is a prominent part of the collaborative decision making process (Kim, et al.
2004).
Increased emphasis on collaborative decision-making processes has led to the development
of consensus management techniques to develop a solution. The use of consensus
monitoring tools has improved the likelihood of consensus attainment (Bhargava and Power
2001).
Conflicts generally arise during a collaborative process when individuals or groups hold
different ideas about a specific issue or have divergent solutions to a particular problem and
fail to arrive at a common goal. Conditions that promote effective conflict management focus
on the problem or issue at hand, consideration of a wide range of alternative solutions, a
cooperative climate, an organised and orderly process, and avoidance of artificial conflict-
reducing devices such as voting or having the leader make the decision. Conflicts can often
be successfully managed and resolved through collaboration and the effective support of the
collaborative decision support system provided (Smari, et al. 2005).
Action Evaluation is a collaborative, goal-setting and evaluation process used for conflict
management (Friedman, et al. 2003) (Rothman 1997). Action Evaluation is a value-driven

33
process that has been successfully applied in dozens of large and small-scale projects to
help groups and individuals forge agreements and develop strategies for success.
In (Smari, et al. 2005), Action Evaluation is used as a knowledge elicitation tool, to build a
textual database of individuals and groups views and ideas that can be fused into their
groups‘ shared purposes. Ultimately, these diverse purposes are integrated into one shared
view and a shared action plan for all the groups and stakeholders of the collaboration.
Having participants in an organisation develop a shared view of a decision requires a
collaborative process, simply defined as a mechanism by which people decide together.
Developing a shared view for a decision differs from consensus in that it allows people in
positions of authority (i.e. in a hierarchical enterprise such as a military organisation) to have
final control over the decision reached (Smari, et al. 2005).
CDM presumes inevitable conflicts but supports reaching a shared view of a decision
(Ngwenyama, Bryson and Mobolurin 1996). Deciding on the best solution requires the
simultaneous consideration of a large amount of criteria, related to one another in intricately
and often conflicting ways. Multi-Criteria Decision Making approaches (Triantaphyllou 2000)
concentrate on problems with discrete decision spaces where the set of decision alternatives
has been predetermined. Multi-Objective Decision Making applies when continuous decision-
making revisions are used (Smari, et al. 2005).
Several methodologies support the decision process, i.e. methods that help actors making a
choice. Although, some of these methodologies are not strictly related to CDM, they are
relevant in supporting the choice process. The main methodologies were analysed in the
scope of this state-of-the-art.
Analytical Hierarchy Process is especially suitable for complex decisions involving the
comparison of decision elements which are difficult to quantify. It is based on the assumption
that when faced with a complex decision, the natural human reaction is to cluster the
decision elements according to their common characteristics. It involves building a hierarchy
(ranking) of decision elements and then making comparisons between each possible pair in
each cluster (as a matrix). This gives a weighting for each element within a cluster (or level of
the hierarchy) and also a consistency ratio (useful for checking the consistency of the data)
(T. Saaty 1980).
Criteria Rating Form and Weighted Ranking are suitable methodologies when it is necessary
to select among several alternatives, to make a decision objectively or have a group agree
on a decision. The criteria ranking form is an appropriate method to take into account the
inputs and opinions of several participants, making it a suitable method to support CDM.

34
Gap analysis consists of defining the present state, the desired or ‗target‘ state and hence
the gap between them. In the later stages of problem solving, the aim is to look at ways to
bridge the gap defined and this may often be accomplished by backward-chaining logical
sequences of actions or intermediate states from the desired state to the present state. Gap
analysis alone, however, is not adequate for all problem situations as goals may evolve and
emerge during the course of problem solving. In addition, some problems have many
alternative solutions, in which case backward-chaining search strategies will have little
practical use.
A crucial stage in the formulation of operations strategy is the derivation of a ranked (or
rated) list of competitive factors such as quality, flexibility, cost, etc. This list is used either to
infer an appropriate set of strategic operations decisions or, in conjunction with an
independently derived list of the organisation‘s performance, to prioritise each of the
competitive factors. The method of Importance/Performance Matrix consists of building a
matrix representing the importance scale in the -axis and the performance in the -axis. The
list of competitive factors is then represented in the matrix. A matrix of
importance/performance can be used but may be found too crude, while the most common
uses the 9-point importance and performance scales.
Quantitative decision-making methods are suitable for situations where the objective is
clearly stated, or where there are several alternative courses of action, or there is a
calculable measure of the benefit or worth of the various alternatives. Uncertainties for which
allowance must be made or probabilities calculated may include events beyond the control of
the decision maker and uncertainty concerning which outcome (or external events) will
actually happen. Given these conditions, standard statistical techniques using normal
distribution data and probability calculation can be used to inform decision-making.
Strategic Assessment Model decomposes a strategic problem into clearly defined
components in which all alternatives, factors, weights, and probabilities are depicted. Next,
objective information and subjective judgements of experts are integrated by utilising several
methods of problem structuring and information processing. This decomposition and
evaluation is not intended to replace the decision-makers, rather, it provides a systematic
approach to support, supplement, and ensure the internal consistency of their judgements
through a series of logically sound techniques. Strategic Assessment Model divides the
decision making environment into three parts: internal environment, the set of relevant
factors that form the profile of the internal operations of the organisation; task environment,
the set of relevant factors that have direct transactions with the organisation and the
influence between these factors is reciprocal; and general environment, the set of relevant
factors that can exert considerable influence on the organisation.

35
Strategic Assumptions Surfacing and Testing is a process which reveals the underlying
assumptions of a policy or plan and helps create a map for exploring them. Strategic
Assumptions Surfacing and Testing incorporates the following principles: adversarial – based
on the premise that the best way to test an assumption is to oppose it; participative – based
on the premise that the knowledge and resources necessary to solve and implement the
solution to a complex problem is distributed among a group of individuals; integrative –
based on the premise that a unified set of assumptions and action plan are needed to guide
decision making, and that what comes out of the adversarial and participative elements can
be unified; and managerial mind supporting – based on the premise that exposure to
assumption deepens the manager‘s insight into an organisation and its policy, planning, and
strategic problems.
The Strategic Choice Approach is used in face-to-face workshops of a decision making
group. Strategic choice is viewed as an ongoing process in which the planned management
of uncertainty plays a crucial role. The Strategic Choice Approach focuses on decisions to be
made in a particular planning situation, whatever their timescale and whatever their
substance. This method highlights the subtle judgements involved in agreeing how to handle
the uncertainties which surround the decision to be addressed – whether these are technical,
political or procedural. The approach is an incremental one, rather than one which looks
towards an end product of a comprehensive strategy at some future point in time. This
principle is expressed through a framework known as a ‗commitment package‘. In this, an
explicit balance is agreed between decisions to be made now and those to be left open until
specified time horizons in the future. The approach is interactive, in the sense that it is
designed not for use by experts in a backroom setting, but as a framework for
communication and collaboration between people with different backgrounds and skills.
There are many decision situations in which the information cannot be assessed precisely in
a quantitative form but may be in a qualitative one, and thus, the use of a linguistic approach
is necessary (Herrera and Herrera-Viedma, Linguistic decision analysis: steps for solving
decision problems under linguistic information 2000). In CDM, criteria and preferences are
often vaguely qualitative and cannot be estimated by exact numerical values. Therefore, a
more realistic approach may be to use linguistic assessments instead of numerical values by
means of linguistic variables (Delgado and Verdegay 1992) (Herrera e Verdegay, A linguistic
decision process in group decision making 1996) (Herrera, Herrera-Viedma and Verdegay, A
model of consensus in group decision making under linguistic assessments 1996) (Herrera,
Herrera-Viedma and Verdegay, A rational consensus model in group decision making using
linguistic assessments 1997) (Herrera and Verdegay, Linguistic assessments in group
decision 1993), that is, variables whose values are not numbers but words or sentences in a
natural or artificial language. Each linguistic value is characterised by a syntactic value or

36
label and a semantic value or meaning. The label is a word or sentence belonging to a
linguistic term set and the meaning is a fuzzy subset in a universe of discourse. The
application of fuzzy set theory to decision-making problems, when only qualitative or
uncertain information is available, has been the subject of much research over the last
decades, e.g. (Chen and Hwang 1992) (Kacprzyk and Ferizzi 1990) (Tong and Bonissone
1984) (Yager 1981), and many others.
In (Huynh and Nakamori 2005), a new model is proposed, based on the probabilistic-based
approach for the multi-expert decision-making problem under linguistic assessments. This
approach is based on the ordered-structure-based semantics of linguistic term sets, which
may be accepted universally, while fuzzy-set-based semantics of linguistic terms is often
defined subjectively and context-dependently. Furthermore, by performing direct computation
on linguistic terms, the burden of quantifying a qualitative concept is eliminated. It is also
especially necessary and useful in situations where the fuzzy-set-based semantics is
inapplicable due to the nature of linguistic information.
Computing facilities and information technologies enable the efficient transferring and
sharing of knowledge across organisational boundaries, and allow collaborating individuals to
benefit from experiences of other group members and experts. Information and
communication technologies have been widely exploited in all areas of industry.
In the CDM domain, case-based reasoning and learning techniques have been particularly
useful due to their resemblance to the way people evaluate a potential future action by using
past experience, the scarcity (or even absence) of explicitly stated rules, and the ill-
structured definitions of the associated problems (Aamodt and Plaza 1996) (Karacapilidis,
Dimitris and Costas, Computer-Mediated Collaborative Decision Making: Theoretical and
Implementation Issues 1999).
After a decision is made, it is vital to translate it into an implementation plan, i.e. elaborating
a list of tasks with responsible to be carried out. If this step fails, the decision, however good
it was, fails. Therefore, an important field of supporting decision-making is the decision
implementation and follow-up. In this scope, there has been some work developed, relating
decision meetings to the activities following them, and especially collecting automatic
feedback about decision implementation (Valle, Prinz and Jarke 2006) (Borges, Pino and
Valle 2005).
3.2. SYSTEMS TO SUPPORT DECISION
Over the past three, four decades, organisations have been using computers for a variety of
tasks ranging from everyday secretarial work to more complex business processes and

37
workflows. Many of these tasks involve certain level of decision-making ability on the part of
the system. Quite a few tools, popularly called Decision Support Systems, have been
developed in this regard (Eddy, et al. 2000). The aim of decision support systems is to
produce a trusted and reasonable set of recommendations for helping the decision maker
through the process.
The initial vision of decision support systems fostered the idea that the system should
progressively replace the human judgement. This vision was supported, in the early 80s, by
an explosion of research in topics such as artificial intelligence, information technologies and
cognitive sciences. However, in the 90s, the focus of decision support systems changed from
the system to the user. Because decision makers are not necessarily proficient in computer
science and information technology, they need appropriate tools to easily follow the
processes involved. Such tools should stimulate their participation giving them an active role,
and enable human actors to use their instincts. In addition, industrial companies do not want
to lose the accountability of a decision to a human actor. Therefore, this parallels the vision
of the decision support systems community pioneers, that is, by supporting and not replacing
human judgement, the system comes in second and the users first.
Decision support systems have significantly evolved during the last few decades (Ekbia
2006). The definition of decision support systems has changed from support technologies in
semi-structured domains (Keen and Scott-Morton 1978) through interactive data models
(Sprague and Carlson 1982) and group decision support systems (DeSanctis and Guadalupe
1987) to adaptable and domain-specific representational models (Turban 1992) and social
decision support systems (Turoff, et al. 2002). More recently, Shim et al. (Shim, et al. 2002)
have identified a trend towards the personalisation of decision support systems user
interface, the use of Web-based technologies, and ubiquitous computing. These authors
have also prescribed the development of active and intelligent systems as a promising path
for the future.
In current literature, it is easy to find several notions and definitions of systems to support the
process of decision-making. It is sometimes difficult to differentiate these systems, what is
their focus and main functionality. This section presents a possible classification of the
different systems to support decision-making, attempting to collect the several definitions
found in the literature.
Decision support systems are interactive computer-based information systems designed to
help human decision makers. These systems process data and models in order to identify,
structure, and solve semi-structured or unstructured problems (R. Sprague 1980) (Zolghadri,
Lecompte e Bourrieres s.d.). These systems were the first to appear in the field, and may still
be used to embrace all the existing systems.
38
A more generic and tool-oriented definition, states that decision-making support systems
encompass a collective set of computerised support tools, including decision support
systems, executive information systems, expert systems, knowledge-based systems, and
other standalone systems (Forgionne, et al. 2002).
Although the two definitions of decision-making and decision support systems slightly differ,
they present the focus of such systems in collecting, analysing and presenting information in
a structured form, to help a decision maker when realising a choice.
Companies are being pressured to excel in their capabilities. One form they have
found to do this is to join efforts. This combination of resources in some activities has
fostered group and teamwork in all types of companies in industrial environments.
Nowadays, less and less tasks are executed by one individual alone. Even the new work
trends, such as freelancers, is part of teams or networks, supported by information and
communication technologies. This trend has also made its way in decision-support with the
appearance of group and collaborative decision-making.
Group decision support systems have been defined as interactive computer-based systems
that facilitate the solution of ill-structured problems by a set of decision makers that work
together as a team (Kreamer and King 1988). The main objective of a group decision support
system is to augment the effectiveness of decision groups through the interactive sharing of
information between the group members and the computer (Huber 1984). This can be
achieved by removing communication impediments, providing techniques for content of the
discussion and systematically directing the pattern, timing, or content of the discussion
(DeSanctis and Guadalupe 1987).
Technologies or systems that enable or enhance the ability of the participants involved in
collaborative decision-making processes have been termed as collaborative decision support
systems. These systems have been defined (Kreamer and King 1988) (Karacapilidis,
Computer Supported Argumenation and Collaborative Decision Making: The HERMES
System 2001) as ―interactive computer-based systems which facilitate the solution of ill-
structured or semi structured problems, by a group of decision makers working as a team‖.
These systems represent a step further in relation to group decision support systems,
because they not only provide team support but they actually foster collaboration. Thus, the
main objective of these systems is to augment the effectiveness of decision groups through
the interactive sharing of information and knowledge among group members supported by
computer facilities (Smari, et al. 2005). This can be achieved by (i) removing communication
impediments, and (ii) providing techniques for structuring the decision analysis and
systematically directing the pattern, timing, or content of the discussion (Karacapilidis,

39
Dimitris and Costas, Computer-Mediated Collaborative Decision Making: Theoretical and
Implementation Issues 1999).
More recently, there was a convergence among the research fields of decision support,
artificial intelligence and knowledge management. From this, a number of information
systems exist to generate knowledge for decision-making support. Collectively, these
systems can be called intelligent decision support systems (Hans and Peter 1992). These
systems integrate the functions of decision support systems and knowledge based systems
to assist decision makers in building analytical models, offer advice on specific problem
tasks, assist decision makers in performing decision analysis, and explain conclusions and
recommendations (Hunsaker and Hunsaker 1981) (Tansley and Hayball 1993) (Sensiper
1998) (Silverman 1994).
Active decision-making support systems are a kind of intelligent decision-making support
systems that take the initiative without getting specific orders. They respond to non-standard
requests and commands when dealing with tasks in problem solving that are ambiguous
and/or complex (Pistolesi 2006). Some of these systems remove the human actor from the
loop, having the initiative and the decision made by the system.
Summarising, there is a wide variety of systems to support decision-making processes.
However, most decision support programs can only calculate satisfaction levels. There is a
need for adding unique analysis and reporting features, including: probability that a particular
alternative is the best choice; assessment of the level of consensus for each alternative;
guidance on what should be done next; and documentation of the entire decision-making
process (Zha and Sririam, Knowledge-intensive Collaborative Decision Support for Design
Process 2006). In addition, most of the systems do not address specific issues of industrial
environments, such as company policy and hierarchy, the concept of extended enterprise,
i.e. supporting all actors involved in the value and supply chain, issues of responsibility and
tracking of actions and decisions, and fast response for changing demands. The approach
presented in this thesis aims at contributing to decrease the state-of-the-art gap in supporting
collaborative decision-making in industrial environments.
3.3. A GENERIC DECISION-MAKING PROCESS
There are several models on how the decision-making process should be. One of the most
popular is Simon‘s Model of three phases (Simon, Administrative Behaviour 1997), which
has been widely used by managers, researcher and decision-makers in general. Recent
work extended this model to become a five-phase model (Mora, et al. 2003). This model is
presented in Table 3.1 and is adopted here to support collaborative decision-making.

40
TABLE 3.1. DECISION-MAKING PHASES AND STEPS.
Phase Step Description
Intelligence
Data Gathering Observation of reality and collecting of any relevant
qualitative and quantitative data is done for the
general situation of interest.
Problem Recognition Based on the interpretation of collected data, a well-
focused problem statement and general objective is
defined.
Design
Model Formulation Using the well-focused problem, a predefined model
is instanced with a set of courses of action,
outcomes criteria, set of uncontrolled events and
parameters, and the relationships between these
variables. If a predefined model is unavailable, a new
model must be developed.
Model Analysis Face validity and pilot test of the model is conducted
to reduce any potential source of significant error.
Choice
Generation & Evaluation With a validated model, all courses of action are
evaluated (or dynamically generated) and what-if,
sensitivity and goal-seeking analysis are conducted,
in terms of the outcomes criteria.
Selection Best course of action is finally suggested, using an
optimisation, satisfaction criteria, or other approach.
Implementation
Result Presentation Selected course of action is reported to top
management team for final organisation
authorisation (a decision can be taken but not
implemented).
Task Planning Decision authorised, is scheduled in a set of specific
actions, where financial, human and material
resources are estimated.
Task Tracking The set of specific actions are conducted and
monitored until the planned end action is achieved.
Learning
Outcome-process
Analysis
Process and outcome metrics are collected from
decision-making team and organisation.
Outcome-process
Synthesis
Learned lessons on the top of decision-making
process are identified and communicated to the top
management and other team members.

41
3.4. TYPES OF DECISIONS AND THE PROCESS OF MAKING A
DECISION
Besides the identified different systems to support decision-making, it is possible to distinct
several types of decisions, and also methods to make them.
Generally speaking, a decision is a choice, which is to realise a certain goal by analysing
subjective-objective conditions, generating alternatives, and choosing the most appropriate
one among them (Zha and Sririam, Knowledge-intensive Collaborative Decision Support for
Design Process 2006).
Simon divided decisions in two general categories: programmed and non-programmed
(Simon, Administrative Behaviour 1997). Decisions are programmed to the extent that they
are repetitive and routine, to the extent that a definite procedure has been worked out for
handling them so they do not have to be treated from scratch each time they occur. On the
other hand, decisions are non-programmed to the extent that they are novel, unstructured
and unusually consequential.
It is possible to extend this categorisation considering the situation associated with the
decision. The last reference suggests four types of situations requiring a decision.
Routine: The same circumstances repeat and when they appear, it is necessary to choose
a proved course of action.
Emergency: Represent situations without precedent, which often require immediate
decisions following course of events. These situations are usually very time-consuming
because they imply considerable amount of hours dedicated in a short period of time.
Strategic: The most demanding type because it implies strategic choices such as deciding
on purpose and objectives and converting them into specific plans for the company or sub-
decisions.
Operational: Decisions related to the regular running of the company, including hiring and
firing employees (human resources). These situations frequently require very sensitive
handling.
People make decisions in different ways, which is also valid for companies. The capacity of
decision-making has in fact been identified as a unique human capability. Several types of
decision-making are presented by Shah (Shah and Shah, Types of Decision-Making n.d.).
Irreversible: These decisions, once made, cannot be unmade. Whatever is decided has its
repercussions for a long time to come. It commits one irrevocably when there is no other

42
satisfactory option to the chosen course. A manager should never use it as an all-or-nothing
instant escape from general indecision.
Reversible: These are the decisions that can be changed completely, before, during or after
the agreed action begins. Such type of decisions allows one to acknowledge a mistake early
in the process rather than perpetuate it. This decision-making type is effective for situations
with changing circumstances where reversal is necessary.
Experimental: This type of decisions is not final until the first results appear and prove to be
satisfactory. It requires positive feedback before one can decide on a course of action. It is
useful and effective when a correct move is unclear but there is a clarity regarding general
direction of action.
Trial and Error: In this type of decisions, actors derive knowledge from past mistakes. The
team selects a certain course of action and tries it out. If the results are positive, the action is
carried further, if the results appear negative, another course is adopted and another trial is
made. This iterative process continues until the actors achieve the right combination. It
allows the manager to adopt and adjust plans continuously before the full and final
commitment. It uses both, the positive and negative feedback before selecting one particular
course of action.
Made in Stages: In this decision-making type, the team involved makes decisions in steps
until they achieve the whole action. It allows close monitoring of risks as one accumulates
the evidence of outcomes and obstacles at every stage. It permits feedback and further
discussion before proceeding to the next stage of the decision.
Cautious: It allows time for contingencies and problems that may crop up later at the time of
implementation. The decision-makers hedge their best efforts to adopt the right course. It
helps to limit the risks inherent to decision-making, but may also limit the final gains. It allows
one to scale down those projects that look too risky in the first instance.
Conditional: Decision-makers can alter these decisions if certain foreseen circumstances
arise. It is an ‗either/or‘ kind of decision with all options kept open. It prepares one to react if
the competition makes a new move or if the game plan changes radically. It enables one to
react quickly to the ever-changing circumstances of competitive markets.
Delayed: In this type of decisions, actors put the decision on hold until they feel the time is
right. The team gives a go-ahead only when all required elements are in place. It prevents
one from making a decision at the wrong time or before all the facts are known. At times, it
may result into forgoing opportunities in a market that needs fast action.

43
These types of decision-making are not completely exclusive. In fact, quite often, a decision-
making process is a combination of several of these types.
3.5. TEAM DECISION-MAKING PROCESS TYPE
The process of collaborative decision-making involves the work of a team in the process.
However, this does not mean that all team members will in fact make the decision. It can
happen that everyone is involved in the activities of collecting information, and even rating
criteria, but only one person makes the decision in the end.
The method proposed aims at supporting different operation modes in teams, adjusting how
each member contributes for the final decision. The approach presented supports the
following team processes (Shah and Shah, Types of Decision-Making n.d.).
Majority Vote: Each person has a vote (expressed by hand or secret ballot) and the
majority make the decision. This method is quick, efficient and offers a sense of finality, i.e.
that the decision is made and final. However, it is possible to have a decision made with an
opposition as large as 49% of the team. In addition, this method can rush the process to a
vote without fully exploring all perspectives of the situation. This method is indicated when:
there is a need for fast, participatory decisions; people already know the various issues and
perspectives; the outcome will not have a significant adverse impact on the ―losing‖ side;
there is a need of obtaining a ‗sense of group‘ prior to making a formal decision; or as a
fallback strategy when consensus did not work out.
Unanimity: This method means that all team members agree in the same decision. This has
the advantage of representing a string buy-in and requiring the participation of everyone.
However, this is a very difficult process to achieve and one or two people have the capacity
of holding the group hostage. This process is indicated when: the stakes are high and there
is a great need for complete endorsement (solidarity); there is a desire to build community; or
it is intended to send a message that ―no one will be left out or left behind‖.
Consensus: This process type indicates that everyone‘s ideas have been heard and are
included and people agree to support the decision and feel valuable. On the other hand, this
process can be time consuming and can still result in post-meeting sabotage (derived from
the feeling ―That really was not my choice or preference!‖). Consensus should be used when:
decisions can be contemplated beforehand; people feel empowered to speak and express
opinions at public meetings; organisational culture tolerates dissention and disagreement;
the decision will have a high level of impact on each stakeholder; or the decision involves
politically charged issues or the potential for ―deep change‖.

44
Committee: This process allows for delegation of tasks and frees others to do other things,
and enables smaller groups to make decisions efficiently. These committees can also have a
hierarchy defined following the company‘s structure or according to the situation at hand, for
example building a hierarchy according to expertise or experience of the team members.
This method has the disadvantages of possibly missing inputs from key people, or allowing
people to feel left out from the decision-making, and requiring others to let go of control.
Committees should be used when: particular competency or knowledge rests in a few
people; there is a need for diverse viewpoints and/or skills; multiple decisions need to be
made simultaneously; want to empower stakeholders selected for the committee; there is a
great need to delegate responsibility; or want to stimulate creativity and want to build and
foster relationships among participants.
Autonomous: This is an extremely efficient method where someone alones makes the
decision, enabling also to protect privacy in sensitive matters. This method implies few
checks or balances and brings no benefit of others‘ skills and insights. This process should
be used when: there is only one person who is affected by the decision; there is a need to
preserve confidence; the issues are of low-level importance; or in situations where the time
to decide will not allow to setup a group decision process.
3.6. INDUSTRIAL CRITERIA
This work includes the elaboration of list of decision criteria to consider when making any
decision in industry. The objective was to produce one general list of criteria, based on inputs
gathered from industrial companies, covering all types of decisions. In each individual
situation, actors rate the complete list, with the ability of ignoring any criteria on the list.
The list translates the need to maximise and/or minimise specific conditions, namely
comprehending the following industrial decision criteria:
equipment costs represent the expenses in acquiring tools or other devices;
operating costs characterise the price of utilising the machines;
training costs stand for the charge for instructing and preparing employees, e.g. to
operate machines or realise new tasks;
personnel costs symbolise the expense with the workforce;
expertise costs represent the charge of hiring or sub-contracting temporary
technical skills;
market share characterises the percentage of total market segment that is serviced
by the company;
strategic partners symbolises the need to increase the number of alliances
established with other companies (customers, suppliers or other business partners);

45
return on investment is the ratio of money gained or lost on an investment relative
to the amount of money invested;
profitability represents how lucrative the company is,
growth potential describes the prospective for a company to enlarge its business
in terms of market capitalisation, production, sales, revenue, employment or
management;
customer satisfaction describes how the products and services supplied by a
company meet or exceed the customers‘ expectations;
product/service quality represents the ability of a product or service to perform its
functions, measured in several factors that usually include reliability and ease of
use;
process efficiency symbolises the maximum amount of output (e.g. number of
items assembled, number of products maintained) that can come out of a process
without increasing resources;
employee productivity defines the ratio of output per labour hours;
material/machine productivity stands for the ratio of output produced per
material used or per hours of machine operation;
efficient allocation of resources symbolises that the maximum output is being
achieved from the existing resources;
time to implement decision defines the amount of hours needed to implement
the selected alternative;
efforts to implement decision characterises the materials, machines and
employees necessary to implement the selected course of action;
company’s image defines how a business is perceived by the market and public in
general, including its brand;
company’s strategy represents the objectives of the business in short, medium
and long-term, including aspects such as markets to address, sustainability,
contribution to society, among others; and
sustainability defines the development that meets the needs of the present without
compromising the ability of future generations to meet their own needs.
This list of criteria is general and can be applied to any decision in an industrial company.
However, when making a decision it might be useful to group the criteria in categories,
making its analysis easier. When examining a hierarchy of criteria, human actors can identify
if any criteria is not applicable to a specific situation. In addition, actors can also add or refine
existing criteria. The list of criteria is then organised in a hierarchy, as presented in Figure
3.1.

46
FIGURE 3.1. HIERARCHICAL REPRESENTATION OF DECISION CRITERIA.
In some decision situations, it is also useful to make a cost benefit analysis when choosing a
specific alternative. In order to accomplish this, the criteria should be separated in costs and
benefits, which are independently evaluated. The list of criteria proposed includes the costs
represented in Figure 3.2.
FIGURE 3.2. COSTS CRITERIA TO MAKE A DECISION.
The criteria proposed include also benefits, as presented in Figure 3.3.
Goal
Financial Customers Internal Process Organisation
Equipment costs
Personnel costs
Training costs
Operating costs
Market share
Strategic partners
Return on Investment
Profitability
Costs
Customer satisfaction
Product quality
Growth potential
Service quality
Process efficiency
Employee productivity
Material/machine
productivity
Efficient resource
allocation
Time to implement
decision
Efforts to implement
decision
Company‘s image
Company‘s strategy
Sustainability
Expertise costs
Costs
Equipment costs Personnel costsTraining costsOperating costsTime to implement
decision
Efforts to implement
decisionExpertise costs

47
FIGURE 3.3. BENEFITS CRITERIA TO MAKE A DECISION.
In each decision-making situation, the human actors can choose the most appropriate
representation of criteria, i.e. list, hierarchy or cost-benefit.
This list of criteria was included in a questionnaire distributed to industrial companies, as
described in the next section. The criteria were refined according to the answers provided.
3.7. DECISION-MAKING IN INDUSTRY
The work developed includes the elaboration of a questionnaire with the objective of
ascertaining what are the common current practices in industry, with respect to decision-
making. The questionnaire uses the definitions and classifications presented in the previous
sections. The resulting questionnaire, which is presented in Annex C, Decision-making
questionnaire, was distributed among several industrial companies. However, the task of
obtaining answers to such a document can be quite challenging. The results include twenty
filled questionnaires, where some were not complete. Although the relatively small number
makes the statistical analysis feeble, it is possible to identify trends in the common industrial
practices, complemented by the author‘s experience in contacts with industrial partners, in
the scope of several research projects.
The current section describes the tendencies presented by the questionnaires answered by
industrial companies.
BENEFITS
Financial
Customers
Internal Process
Organisation
Market share
Strategic partners
Return on
Investment
Profitability
Customer
satisfaction
Product quality
Growth potential
Service quality
Process efficiency
Employee
productivity
Material/machine
productivity
Efficient resource
allocation
Company‘s image
Company‘s
strategy
Sustainability
48
Most of the companies state that there are no systematic approaches established to support
decision-making. This means that the process is highly influenced by the personal style of
the people involved, but also by the organisational culture present.
Strategic and operational decisions are commonly made by small senior groups (including
CEO or equivalent), business unit leaders and the CEO or equivalent. Frontline and shop
floor employees usually make routine decisions, while emergency decisions seem to be quite
wide spread through the company. However, the role of interdisciplinary teams is still quite
reduced, and when present, it is limited to routine and emergency decisions.
Regarding the personal style of making decisions, there seems to be a balance between an
emotional/intuitive and a logical/rational approach. With the exception of emotion or
sensibility, which are rarely considered (or admitted), the companies seem to use hints and
imagination, while using analysis, knowledge, ability, experience and logic to reach their
conclusions.
When the culture, attitude, approach and policy of the companies‘ management towards the
employees are considered, there is quite a conservative position. Companies focus primarily
on the clients‘ needs, and the well-being of the company is always above any individual
success. Moreover, employees said that it is quite difficult to change the organisation‘s
thinking process. However, it is possible to see that the conservative trend is also changing,
because issues such as acceptance of new ideas, personnel autonomy, motivation,
innovation and exploitation of new opportunities are gaining relevance.
Considering types of decision-making, companies make use of the eight categories
identified: irreversible, reversible, experimental, trial and error, made in stages, cautious,
conditional and delayed. There is not a dominant style. Nevertheless, trial and error is often
used for routine, strategic and operational decisions, while emergency decisions tend to use
a cautious approach.
Whenever the decision-making process involves a team, its members are usually selected
among the employees from the department most affected by the decision. Often, the team
includes also employees from other departments that have valuable expertise for the
decision-making. However, rarely or never is the CEO or other equivalent senior
management representative involved, or any external consultants. Once the team is formed,
the decision-making process often follows the company‘s hierarchy, or a special hierarchy
created for the occasion, or consensus among all team members. A decision made by
voting, where each team member has one vote is rarely or never used.
49
The industrial criteria listed in the questionnaire is extensively used in the four types of
decisions, being very difficult to identify a predominance, especially considering the small
amount of companies considered.
Regarding the sources used to collect information necessary to make a decision, there is a
wide range considered in the answers analysed. The most searched sources are internal
statistics, financial forecasts from the company, co-workers, researchers, external contacts,
competitors, seminars and the Internet. On the other hand, sources such as company‘s
library, academic experts, consultants and economic/market studies are rarely used. This
classification is highly related to the types of decisions and the job description of the persons
who answered the questionnaire. Most of the answers came from people in technical areas
of the companies who are usually involved in making routine and emergency decisions.
There were very few answers from people in higher ranks, who are usually occupied with
strategic and operational decisions. This might explain the answers regarding the resources
used, as the ones most selected are more suitable for routine and emergency situations,
while the ones less identified are indicated for strategic and operational decisions.
Once the information is collected, decision-makers evaluate it based primarily on the
expertise and experience of the person who provided the information. In addition, the
hierarchical ranking of the information source, and the consistency and completeness of the
information are also often considered.


51
4. PROBLEM SOLVING AND INNOVATION IN INDUSTRY
Innovation is a complex process, especially in companies, involving actors with different
expertise and often geographically dispersed. Designing a new product, for example, follows
an organisational procedure involving activities such as collecting requirements (from market
or customers), designing the product, designing the manufacturing process, etc. Naturally,
several problems arise during the process, which have to be handled by the team. Solving
the problem means identifying any abnormal symptoms, describing the objective to be
achieved, identifying options to consider, choosing the best alternative, and implementing the
decision. This is an iterative and complex process when done by one individual, and can
become an impossible task when it involves a multi-disciplinary team.
Two of the methods widely used in some of the mentioned areas are case-based reasoning
(CBR) and the analytic hierarchy process (AHP). The two methods have been used, in this
work, in the scope of problem solving and decision-making, respectively.
Case-based reasoning is a form of analogical reasoning, which consists in using examples to
solve new problems, using a degree of similarity (Russell and Norvig 1995). Case-based
reasoning keeps a memory of stored cases recording prior episodes, and generates a new
solution by retrieving the most relevant cases from memory and adapting them to fit new
situations (Leake 1996). However, when this memory is extensive, it can be difficult to select
among the most relevant cases, i.e. to decide the course of action.
The Analytic Hierarchy Process is a theory of measurement concerned with deriving
dominance priorities from paired comparisons of homogeneous elements with respect to a
common criterion or attribute (T. Saaty 1991). This process uses a series of one-on-one
comparisons to rate a series of alternatives to arrive at the best decision. The problem here
is how to identify and formulate the alternatives to be considered.
This thesis presents an approach based on a combination of case-based reasoning and
analytic hierarchy process to support innovation, particularly product design in industry
involving several actors. The objective of the work is to overcome shortcomings of both
methods in order to provide the most adequate support for multi-disciplinary teams when
making decisions in innovation processes.

52
4.1. CASE-BASED REASONING
Case-based reasoning (CBR) uses what several studies have demonstrated to be a human
capability, i.e. reasoning and making associations. Humans use prior examples when
learning something new, or when trying to address a new situation. Humans are robust
problem solvers; they routinely solve hard problems despite limited and uncertain knowledge,
and their performance improves with experience (Leake 1996). The objective of CBR is to
enhance and foster this capability. It is possible to divide CBR tasks into two classes,
interpretive CBR and problem-solving CBR. Interpretive CBR uses prior cases as reference
points for classifying or characterising new situations; problem-solving CBR uses prior cases
to suggest solutions that might apply to new circumstances. There are several tools that
support the development of CBR solutions, where jColibri (GAIA n.d.) is one of the most
popular. There are also out-of-the-box integrated solutions with complete functionality
packages to companies, e.g. eGain (eGain n.d.) or SpotLight (CaseBank n.d.). However,
these tools are only appropriate for companies that want to start from scratch regarding to
software, i.e. not using any existing system or repository. CBR has been used since the
beginning of the 1990s in several domains such as medical, legal, accounting, finance,
manufacturing, fault detection, diagnosis, etc. In industrial domains, especially in applications
related with problem solving, there have been continuous development and applications
(Gilboa and Schmeidler 2000) (Lian, Wang and Cheng 2010) (Ignat-Coman, et al. 2008) (Wu
and Chen 2007) (Fan, et al. 2010) (Campos, Stokic and Neves-Silva 2004) (Campos and
Neves-Silva 2010).
This section presents a CBR approach developed to support problem solving in industrial
applications. The work developed uses and combines several methods found in literature
and is based on the model presented in chapter 2 Enterprise model. Like other CBR
applications, the proposed method stores cases in a repository or memory. When a new
situation occurs, the method compares it to previous cases and finds the most similar ones.
Problems that occur in any process of the company are stored as cases in a repository, to be
used by CBR. Each problem is described using the attributes described in the construct of
Problem, defined in section 2.3.2 Dynamic knowledge. The most important characteristics for
the CBR application are the following:
description represents a textual explanation of what is observed as abnormal;
reporting actor identifies the person who reported the problem;
involved generics recognises within the company‘s catalogue the class(es) to
which the product, process or machine involved in the problem belongs to; and

53
actual state items describes a set of characteristics that can be measured for the
generics involved in the problem (e.g. value of electrical current, level of oil in
machine, colour code in PLC).
When a new problem occurs, designated current case, or , CBR computes the similarity
between the attributes of the new problem and the ones stored in the repository, the stored
cases, or , to identify a set of similar situations. CBR uses a weight-sum metric to calculate
the similarity between a case and a target query , i.e.
(4.1)
where and represent the attribute in the stored and current cases and represents
the weight of attribute in the similarity calculation. All the cases have attributes and each
of them contributes with a weight for the similarity calculation. As described, problems
have a set of attributes, but case-based reasoning does not use the textual description. As
this work does not cover any language parsing or semantic interpretation, it would be useless
to compare text. Therefore, the calculation of similarity uses reporting actor, involved
generics and all available actual state items as attributes.
The similarity of reporting actor is a binary value: 1 if both problems were reported by the
same actor and 0 if the problems were reported by different actors.
Companies need to define their enterprise model, especially the physical elements, using the
constructs for Product Part, Production Unit and Process Step defined in section 2.3.1 Static
knowledge. These three entities, collectively designated generics, include a hierarchical
structure to group generics according to their inherited characteristics. Each type of generic
(product parts, process steps or production units) uses the tree to represent all items of a
company using a generalisation to specialisation approach. When reporting a problem, it is
possible to identify only one involved generic, which is somewhere located in the tree
catalogue, or several. It is actually quite common to have several generics involved in the
same problem. For example, when a problem occurs in the shop floor of a manufacturing
company, it might be possible to identify the product being handled, in which process and
using which machine (three different generics). Calculating the similarity of the attribute
involved generics means, therefore, determining the similarity of two sets of nodes in a tree
structure.
For this, the use of the Generalised Vector-Space Model approach (Ganesan, Garcia-Molina
and Widom 2003) is proposed. In the vector-space model, each element in the domain is a
dimension in a vector space. A vector represents a collection, with components along exactly
those dimensions corresponding to elements in the collection. The Cosine-Similarity

54
Measure defines the similarity between two vectors to be the cosine of the angle between
them.
Let be a rooted tree, with all nodes carrying a distinct label. Each node can have arbitrary
fanout, and the leaves of can be at different levels. Let be the set of all labels in . Let
be the set of all labels on the leaves of . is the element domain, on which there is a
superimposed hierarchy described by . Since there is a hierarchical structure imposed on
, a collection induces a tree, a subgraph of that consists of the ancestral paths of
each leaf in . The depth of a node in the hierarchy is the number of edges on the path from
the root of to that node. Given any two leaves and in , the Lowest Common Ancestor
is the node of greatest depth that is an ancestor of both and . This LCA is
always well defined, since the two leaves have at least one common ancestor – the root
node – and no two common ancestors can have the same depth.
The unit vector corresponding to a leaf is represented by . According to the traditional
cosine-similarity measure, all leaf unit vectors are perpendicular to each other, which means
that the dot product of any two of them is zero. The dot product of a unit vector with itself is
equal to 1.
The similarity between two nodes, and , of the product catalogue tree is calculated using
equation (4.2).
(4.2)
This definition is consistent, since the right side of this equation always lies between 0 and 1.
Note that the dot product is equal to 1 if and only if .
Let the set of leaf labels be . Let be the number of times
occurs in collection . Then, collection is represented by the vector , where
for , and where represents the weight of the leaf . One
problem can have several generics involved in it, defined by the collection of generics, .
According to the generics‘ hierarchy, it is not possible to assume that the different
―components‖ of a vector are perpendicular to each other. It is still possible to measure
similarity by the cosine-similarity measure after dropping this assumption. If collection is
represented by the vector and by the vector , then
(4.3)
where stands for the dot product between the two vectors.

55
This equation is identical to the standard Vector-Space Model, except that is not equal
to 0 whenever . Finally, the cosine similarity between and is given by the traditional
formula
(4.4)
Equation (4.4) defines the Generalised Cosine-Similarity Measure (Ganesan, Garcia-Molina
and Widom 2003).
Each generic has a set of measurable characteristics, designated actual state items, such as
dimensions, colour, and applications. These characteristics can have one of five different
types: Boolean, text, discrete non-numerical variables, discrete numerical variables and
continuous variables. This type range covers a very wide range of possibilities. The actual
state items define characteristics verified in products, processes or machines when a
problem occurred. This allows the actor to register a snapshot of the installation when the
problem was detected. Analogous to the problem‘s field for description, CBR does not use
the actual state items with type text. The similarity of the actual state items is the arithmetic
mean of the several possible characteristics (Campos and Neves-Silva 2010).
Considering two Boolean variables and , the similarity is defined as
(4.5)
If one of the variables is defined as , then the similarity is defined as the
probability of the two variables being equal, i.e.
(4.6)
where is the conditional probability of given .
If the and results have the same probability for each unknown variable, the
similarity is equal to 0.5.
Considering two discrete non-numerical, i.e. symbolic, variables, and , the similarity
is defined as
(4.7)
If some of the variables are defined as , then the similarity is defined as
the probability of the two variables being equal, i.e.

56
(4.8)
where denotes the number of possible values. If the results have the same probability
for each unknown variable, then the similarity is given by
(4.9)
The Boolean variables are a special case of discrete non-numerical variables, with only two
possible values. Therefore, when one of the values is the similarity between two
Boolean variables is .
For numerical variables, it is useful to introduce the notion of distance between two variables
D(x,y), and relate it with the similarity function through
(4.10)
which means
(4.11)
Considering two discrete numerical variables, and , the distance is defined as
(4.12)
where is a scaling factor. In case of the variables is classified as , the similarity
is the average similarity for all values in the set
(4.13)
Considering two continuous variables, and , the distance is defined as
(4.14)
where is a scaling factor. From (4.10), the similarity is defined as
(4.15)
EXAMPLE 4.1: EFFECT OF FACTOR IN COMPUTING SIMILARITY VALUE
This example illustrates the effect of the factor in the computation of the similarity value. Consider
two continuous variables (the same conclusion drawn for the discrete numerical case) and in the
interval and let . Figure 4.1 plots the value of similarity using equation (4.15) for

57
several values of the factor . The value of can be established from a more intuitive value such as
the 50% similarity width using the formula
(4.16)
FIGURE 4.1. EFFECT OF PARAMETER IN THE COMPUTATION OF SIMILARITY VALUE.
If one of the variables is defined as , with probability density function (p.d.f.) ,
then the similarity is defined as the average similarity for the interval
(4.17)
EXAMPLE 4.2: COMPUTING SIMILARITY FOR A UNIFORM P.D.F. OF AN UNKNOWN
VARIABLE
This example illustrates the computation of similarity for a uniform p.d.f. of an unknown variable.
Consider two continuous variables, and , in the interval and let be unknown. Let the p.d.f. of
be given by
(uniform distribution). Then, the similarity computed from (4.17) is
given by
(4.18)
Table 4.1 shows some values of similarity for several combinations of the known variable and the
factor . It is seen that for a uniform p.d.f., the maximum of similarity occurs when the known variable
0 1 2 3 4 5 6 7 8 9 100
0.1
0.2
0.3
0.4
0.5
0.6
0.7
0.8
0.9
1
x
S(x
,y)
Similarity

58
is in the midpoint of the interval and that the similarity decreases with the factor , since the similarity
band is narrower.
TABLE 4.1. SIMILARITY VALUES FOR UNIFORM P.D.F. OF AN UNKNOWN VARIABLE.
0.0 0.63 0.24 0.06
0.3 0.76 0.41 0.12
0.5 0.79 0.43 0.13
0.7 0.76 0.41 0.12
The number of problems to be retrieved should be pre-determined and depends on the
applications. The set of similar problems enables the appearance of situations that are
different enough to have different causes. The human actor will then analyse the cause of
the most similar problem and adapt it to the current problem, trying to implement the actions
realised to eliminate the problem.
4.2. THE ANALYTIC HIERARCHY PROCESS
The Analytic Hierarchy Process (AHP) (T. Saaty 1991) is a powerful and flexible decision
making process to help people set priorities and make the best decision when both
qualitative and quantitative aspects of a decision need to be considered. By reducing
complex decisions to a series of one-on-one comparisons, then synthesising the results,
AHP not only helps decision makers arrive at the best decision, but also provides a clear
rationale of what is the best.
The AHP is widely recognised as a useful tool to support multi-attribute decision-making. It is
a compositional approach where a multi-attribute problem is first structured into a hierarchy
of interrelated elements, and then a paired comparison of elements in terms of their
dominance is elicited. Using AHP, an actor involved in the decision-making process is
capable of choosing weights by comparing the importance of two criteria subjectively. Each
human actor involved in the decision-making process owns a matrix of judgements, which is
used to compute the individual weights given to each criterion by each user.
Researchers have been using AHP in various domains with successful results. Application
fields include, as examples, supporting evaluating technologies (Sarkis and Sundarraj 2006),
selecting business partners (Cao, et al. 2003) (Liu, Zhou and Tao 2006), analysing projects
(Korpela and Tuominen 1997) (Meade and Presley 2002) or selecting location for a new

59
plant (Yu and Li 2001). Additionally, researchers have combined AHP with other methods.
The most found combination is of AHP and fuzzy, explored in different contexts (Cao, et al.
2003) (Mikhailov and Singh 2003) (Buyukozkan, Feyzioglu and D 2007). Other combinations
include the Bayesian priorisation procedure (Altuzarra, Moreno-Jimenez and Salvador 2007)
and neural networks (Matsuda, A Neural Network Model for the Decision-Making Process
Based on AHP 2005) (Matsuda, A Neural Network Model for the Decision-Making Process
Based on ANP 2006).
This thesis proposes an approach that applies AHP to support decision-making in the scope
of solving problems in industrial environments, particularly problems that arise when
designing new products or re-engineering existing ones.
The application of AHP to support decision-making involves the following steps:
1. Represent the decision problem in a hierarchical form, including all the criteria to be
considered and the alternatives from which to choose.
2. Actors provide their individual judgements on criteria, comparing it in pairs.
3. Analyse the consistency of the judgements given by each actor.
4. Determine the criteria priority for each actor, from individual judgements.
5. Calculate group‘s criteria priority, from individual priorities.
6. Provide actors‘ individual judgements on alternatives, comparing them in pairs, and
determine alternatives rating from individual judgements given by each actor.
7. Calculate group‘s alternatives rating, from individual ratings.
8. Calculate ranking of alternatives to make the decision.
The following sections describe each of these steps.
4.2.1. HIERARCHICAL REPRESENTATION OF A PROBLEM
The AHP reflects what appears to be an innate method of operation of the human mind.
When presented with a multitude of elements, controllable or not, which comprise a complex
situation, it aggregates them into groups, according to whether they share certain properties.
The model of this brain function allows a repetition of this process, in that the groups are
considered, or rather their identifying common properties, as the elements of a new level in
the system. These elements may, in turn, be grouped according to another set of properties,
generating the elements of yet another ―higher‖, level, until a single ―top‖ element is reached,
which can often be identified as the goal of the decision-making process.
This description corresponds to what is commonly called a hierarchy, i.e. a system of
stratified levels, each consisting of so many elements, or factors. The central question is, in

60
terms of this hierarchy: how strongly do the individual factors of the lowest level influence its
top factor, the overall goal?
When facing a decision-making scenario, it is always necessary to consider objectives and
criteria, in order to select one of several possible outcome scenarios, or alternatives. This
process is actually about building the hierarchy corresponding to the situation at hand, which
can be complex and time-consuming. Therefore, one of the objectives of this method is to
provide part of this hierarchy, which can be re-used and adapted for every situation.
In principle, a hierarchy representing a decision-making process can have any number of
levels, according to the complexity of the situation. However, any hierarchy has to have at
least three levels, as presented in Figure 4.2.
FIGURE 4.2. HIERARCHICAL REPRESENTATION OF A PROBLEM.
The top level of the hierarchy identifies the ultimate goal to be achieved, i.e. what is the
objective of the decision. This objective can include issues as ―hiring a new employee‖,
―designing a new product‖ or ―fixing an oil leak in a machine‖. The second or middle level
represents the criteria to be considered when making the decision, i.e. the characteristics to
be met when selecting an alternative. The third and last level identifies the several possible
outcomes for the decision-making process. Deciding is choosing one of several alternatives,
which implicates the previous definition of these alternatives. The several scenarios will be
―measured‖ against the same criteria, of level two, as explained in the following sections.
This methodology provides a structure for the second level of the hierarchy adopted, while
levels one and three will be specific to each situation. According to this, the second level
comprehends the industrial criteria identified in section 3.6 Industrial criteria. There are
several ways to structure a decision, and especially the criteria to be considered. It is
GOAL / FOCUS
Criterion 1 Criterion 2 Criterion 3 Criterion 4 Criterion N
Alternative 1 Alternative 2 Alternative M
. . .
. . .
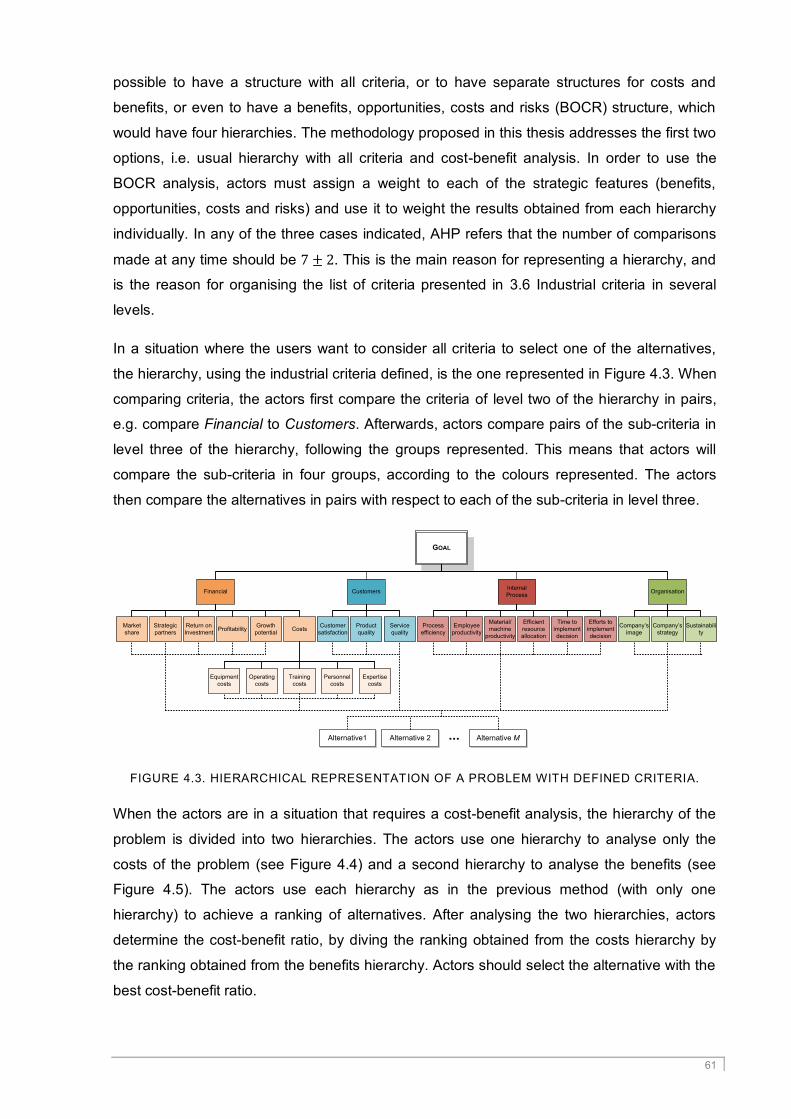
61
possible to have a structure with all criteria, or to have separate structures for costs and
benefits, or even to have a benefits, opportunities, costs and risks (BOCR) structure, which
would have four hierarchies. The methodology proposed in this thesis addresses the first two
options, i.e. usual hierarchy with all criteria and cost-benefit analysis. In order to use the
BOCR analysis, actors must assign a weight to each of the strategic features (benefits,
opportunities, costs and risks) and use it to weight the results obtained from each hierarchy
individually. In any of the three cases indicated, AHP refers that the number of comparisons
made at any time should be . This is the main reason for representing a hierarchy, and
is the reason for organising the list of criteria presented in 3.6 Industrial criteria in several
levels.
In a situation where the users want to consider all criteria to select one of the alternatives,
the hierarchy, using the industrial criteria defined, is the one represented in Figure 4.3. When
comparing criteria, the actors first compare the criteria of level two of the hierarchy in pairs,
e.g. compare Financial to Customers. Afterwards, actors compare pairs of the sub-criteria in
level three of the hierarchy, following the groups represented. This means that actors will
compare the sub-criteria in four groups, according to the colours represented. The actors
then compare the alternatives in pairs with respect to each of the sub-criteria in level three.
FIGURE 4.3. HIERARCHICAL REPRESENTATION OF A PROBLEM WITH DEFINED CRITERIA.
When the actors are in a situation that requires a cost-benefit analysis, the hierarchy of the
problem is divided into two hierarchies. The actors use one hierarchy to analyse only the
costs of the problem (see Figure 4.4) and a second hierarchy to analyse the benefits (see
Figure 4.5). The actors use each hierarchy as in the previous method (with only one
hierarchy) to achieve a ranking of alternatives. After analysing the two hierarchies, actors
determine the cost-benefit ratio, by diving the ranking obtained from the costs hierarchy by
the ranking obtained from the benefits hierarchy. Actors should select the alternative with the
best cost-benefit ratio.
GOAL
Financial Customers Internal
Process Organisation
Equipment
costs
Personnel
costs
Training
costs
Operating
costs
Market
share
Strategic
partners
Return on
InvestmentProfitability Costs
Customer
satisfaction
Product
quality
Growth
potential
Service
quality
Process
efficiency
Employee
productivity
Material/
machine
productivity
Efficient
resource
allocation
Time to
implement
decision
Efforts to
implement
decision
Company‘s
image
Company‘s
strategy
Sustainabili
ty
Expertise
costs
Alternative1 Alternative 2 Alternative M...

62
FIGURE 4.4. HIERARCHICAL REPRESENTATION OF PROBLEM‘S COSTS.
FIGURE 4.5. HIERARCHICAL REPRESENTATION OF PROBLEM‘S BENEFITS.
In any decision, whatever the choice of consolidated hierarchy or cost-benefit analysis, the
actors involved have the power to start by defining the hierarchy. This means that the
hierarchies provided here are a guidance, but in any specific situation, actors can simply
remove or add criteria, as they see fit.
4.2.2. COMPARING THE DECISION CRITERIA (INDIVIDUAL JUDGEMENTS)
Each actor has to define how important each criterion is, on his/her individual perspective.
However, this can be a very difficult process, which can compromise the overall decision-
making process. Instead of defining that one criterion is very important, it is quite often much
easier to say that one specific criterion is more important than another one. Therefore, the
AHP uses paired comparison of criteria, calling it collecting judgement from users.
The objective of this method is to derive, from the group‘s quantified judgement (i.e. from the
relative values associated with pairs of criteria), a set of weights to be associated with
individual criteria; in a sense, these weights should reflect the group‘s quantified judgements.
Considering the hierarchy presented, given the elements of one level, e.g. the second, and
one element of the next higher level, the elements of level two are compared in pairs in
their strength of influence on . This judgement produces a paired comparison matrix with
rows and columns (because the hierarchy has criteria). By convention, the comparison
of strength is always done of an activity appearing in the column on the left against an
GOAL
Equipment costs Personnel costsTraining costsOperating costsTime to implement
decision
Efforts to
implement
decision
Expertise costs
Alternative 1 Alternative 2 Alternative M...
GOAL
Financial Customers Internal
Process Organisation
Market
share
Strategic
partners
Return on
InvestmentProfitability
Customer
satisfaction
Product
quality
Growth
potential
Service
quality
Process
efficiency
Employee
productivity
Material/
machine
productivity
Efficient
resource
allocation
Company‘s
image
Company‘s
strategySustainability
Alternative 1 Alternative 2 Alternative M...
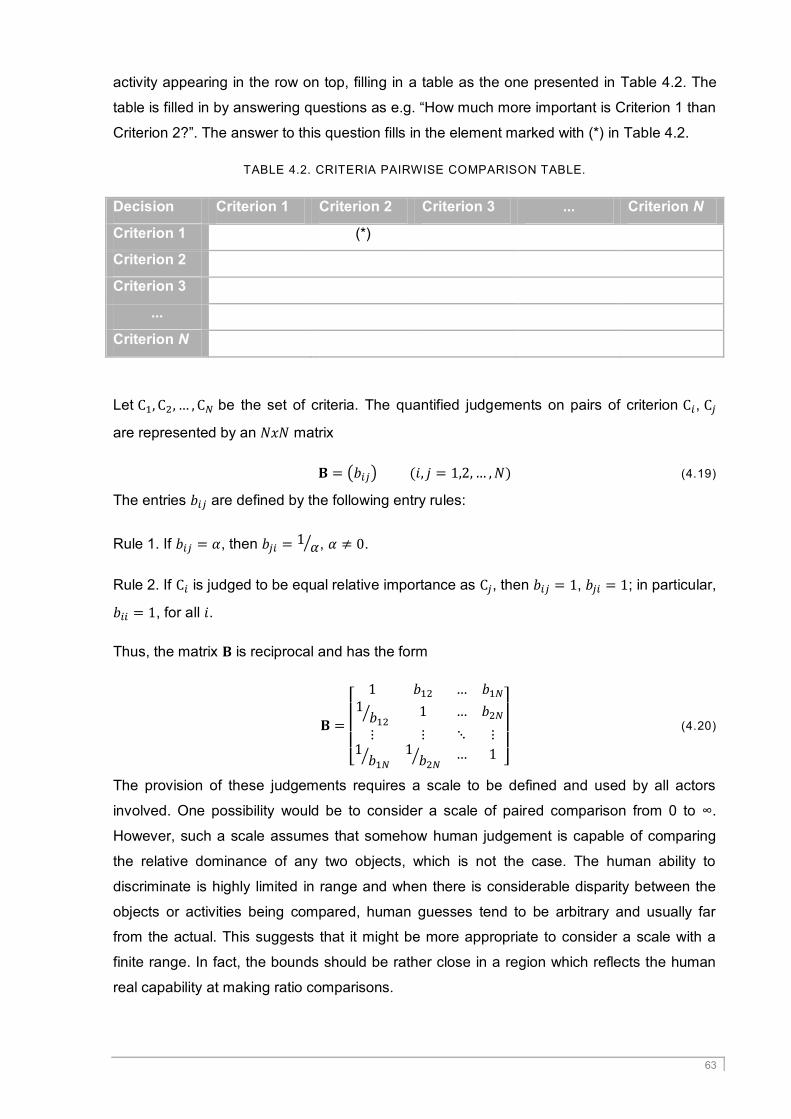
63
activity appearing in the row on top, filling in a table as the one presented in Table 4.2. The
table is filled in by answering questions as e.g. ―How much more important is Criterion 1 than
Criterion 2?‖. The answer to this question fills in the element marked with (*) in Table 4.2.
TABLE 4.2. CRITERIA PAIRWISE COMPARISON TABLE.
Decision Criterion 1 Criterion 2 Criterion 3 ... Criterion N
Criterion 1 (*)
Criterion 2
Criterion 3
...
Criterion N
Let be the set of criteria. The quantified judgements on pairs of criterion ,
are represented by an matrix
(4.19)
The entries are defined by the following entry rules:
Rule 1. If , then , .
Rule 2. If is judged to be equal relative importance as , then , ; in particular,
, for all .
Thus, the matrix is reciprocal and has the form
(4.20)
The provision of these judgements requires a scale to be defined and used by all actors
involved. One possibility would be to consider a scale of paired comparison from 0 to ∞.
However, such a scale assumes that somehow human judgement is capable of comparing
the relative dominance of any two objects, which is not the case. The human ability to
discriminate is highly limited in range and when there is considerable disparity between the
objects or activities being compared, human guesses tend to be arbitrary and usually far
from the actual. This suggests that it might be more appropriate to consider a scale with a
finite range. In fact, the bounds should be rather close in a region which reflects the human
real capability at making ratio comparisons.
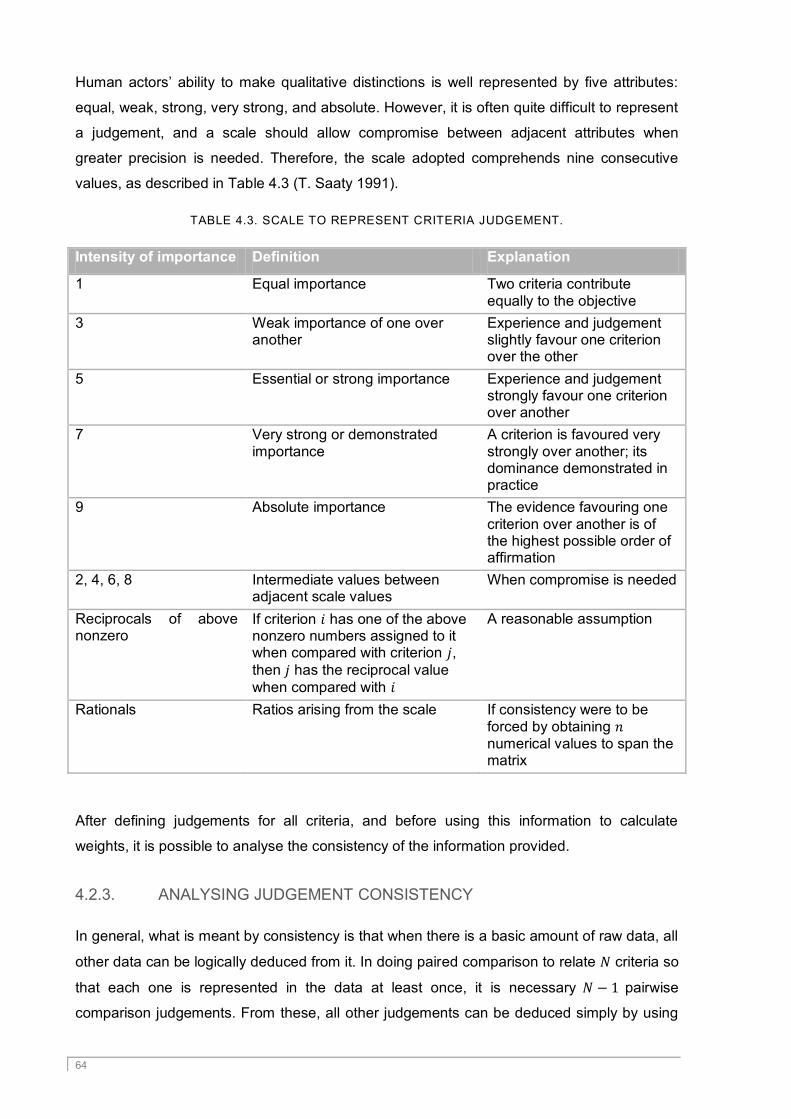
64
Human actors‘ ability to make qualitative distinctions is well represented by five attributes:
equal, weak, strong, very strong, and absolute. However, it is often quite difficult to represent
a judgement, and a scale should allow compromise between adjacent attributes when
greater precision is needed. Therefore, the scale adopted comprehends nine consecutive
values, as described in Table 4.3 (T. Saaty 1991).
TABLE 4.3. SCALE TO REPRESENT CRITERIA JUDGEMENT.
Intensity of importance Definition Explanation
1 Equal importance Two criteria contribute equally to the objective
3 Weak importance of one over another
Experience and judgement slightly favour one criterion over the other
5 Essential or strong importance Experience and judgement strongly favour one criterion over another
7 Very strong or demonstrated importance
A criterion is favoured very strongly over another; its dominance demonstrated in practice
9 Absolute importance The evidence favouring one criterion over another is of the highest possible order of affirmation
2, 4, 6, 8 Intermediate values between adjacent scale values
When compromise is needed
Reciprocals of above nonzero
If criterion has one of the above nonzero numbers assigned to it when compared with criterion , then has the reciprocal value
when compared with
A reasonable assumption
Rationals Ratios arising from the scale If consistency were to be forced by obtaining numerical values to span the matrix
After defining judgements for all criteria, and before using this information to calculate
weights, it is possible to analyse the consistency of the information provided.
4.2.3. ANALYSING JUDGEMENT CONSISTENCY
In general, what is meant by consistency is that when there is a basic amount of raw data, all
other data can be logically deduced from it. In doing paired comparison to relate criteria so
that each one is represented in the data at least once, it is necessary pairwise
comparison judgements. From these, all other judgements can be deduced simply by using

65
the following kind of relation: if criterion is 3 times more dominant than criterion and
criterion is 6 times more dominant than criterion . It should follow that should be
twice as dominant as and should have half of the dominance of . If the numerical
value of the judgement in the (2, 3) position is different from 2 then the matrix is inconsistent.
This can actually happen quite frequently. Even if one has the whole real numbers to use for
judgements, unless the person occupies full attention methodically to build up the
judgements from basic ones, the numbers provided are not likely to be fully consistent.
In addition, for most problems it is very difficult to identify judgements which relate all
criteria and of which one is absolutely certain.
As explained before, denotes the number indicating the strength of when compared
with . The matrix of these numbers is denoted , or
(4.21)
As noted before,
, that is, the matrix is reciprocal.
Considering a perfect judgement in all comparisons made, then for all , , and
the matrix is called consistent.
The consistency of a positive reciprocal matrix is equivalent to the requirements that its
maximum eigenvalue should be equal to . It is also possible to estimate the departure
from consistency, or Consistency Index (C.I.) by
(4.22)
It is noted that is always true. It is possible to estimate how bad the consistency is
in a given problem by comparing its value of the consistency index with the value from
randomly chosen judgements and corresponding reciprocals in the reverse positions in a
matrix of the same size. The consistency index of a randomly generated reciprocal matrix
from the scale 1 to 9, with reciprocals forced, is called the random index (R.I.). The average
values of random index for matrices of order 1 to 15 have been calculated by researchers,
using the scale 1 to 9, with sample size of 500 (until order 11) and 100 (upwards). Table 4.4
indicates these calculated values.
TABLE 4.4. CALCULATED VALUES OF RANDOM INDEX.
Matrix
order
1 2 3 4 5 6 7 8 9 10 11 12 13 14 15
Average
R.I.
0.00 0.00 0.58 0.90 1.12 1.24 1.32 1.41 1.45 1.49 1.51 1.48 1.56 1.57 1.59

66
The consistency ratio (C.R.) is the ratio of C.I. to the average R.I. for the same order matrix.
An acceptable matrix should have a consistency ratio of 0.10 or less. When the consistency
ratio is higher than 0.10, the actors should revise their judgements before continuing.
However, the team should have rules on how to realise this iteration of judgements. This
methodology provides some ideas, but each team should have rules pre-defined before
starting the decision process. It is necessary to consider that inconsistency is not related to
consensus. The objective of minimising inconsistency is not related to harmonising dissident
opinions in the group. Actors will still maintain different opinions among them, but each actor
will have consistent opinions. If there is the objective of avoiding any inconsistency
altogether, than actors should only provide judgements for criteria. This is the
minimum number of comparisons needed. The other values can be calculated from the
judgements provided. However, in most situations, the team leader should not block
inconsistency, as it brings opinions that are more diverse. In any case, the actors have to
provide
judgements to compare criteria. There are two options to revise
judgements, according to the following text.
Option 1: Revise individual judgments
Each actor provides a matrix, , with their individual judgements, and for which there is a
consistency index and ratio. The team leader identifies the actors that have a consistency
ration higher than 0.10 for their respective judgement matrix, . The team leader asks the
most inconsistent actors to revise their individual judgements. The team leader should not
ask modifications outside a range of 10%. The objective of this is to avoid having actors
believe they have to change their minds. The aim is to make small modifications in the matrix
of judgements to make it more consistent.
After the actors have revised their judgements, the new matrixes are built and new
consistency indexes and ratios calculated. If necessary, the process should be performed
again. If there was no improvement at all in consistency, the team leader should analyse if
the actors did revise their opinions. In cases where an impasse comes up, the team leader
has to intervene and modify the criteria or the team.
Option 2: Revise individual judgments based on individual priorities
This second options is used to revise judgements after the individual priorities are
determined from each matrix of judgements. The team leader does the following:
1. Identifies any judgements in all the matrixes that do not match the requirement of
. Most of the times, this situation is prevented by the system used by the
actors to provide the judgements. This means that usually actors only provide half of
67
the judgements, to fill in the matrix from the main diagonal up, while the rest is
automatically filled in.
2. The team leader identifies the most inconsistent judgements, independent of the actors
who provided them. A consistent judgement always verifies
, where and
are the weights of influence. Therefore, it is necessary to calculate the deviation for
all judgments of all actors, according to , where for consistent
judgements. The team leader should identify actors who provided judgements with
, to use the same 10% rule again. The team leader asks the actors to revise
the identified judgements only in order to improve inconsistency.
The matrixes are adjusted with the new judgements and new consistency indexes and ratios
calculated. If necessary, the process is performed again. If there was no improvement at all
in consistency, the team leader should analyse if the actors did revise their opinions. In
cases where an impasse comes up, the team leader has to intervene and modify the criteria
or the team.
4.2.4. DEFINING INDIVIDUAL CRITERIA WEIGHT
Having recorded the quantified judgements on pairs as numerical entries in the
matrix , the problem now is to assign to the contingencies a set of numerical
weights that would ―reflect the recorded judgements‖.
Considering the elements of the second level of our hierarchy, the objective is to
find weights of influence on the element ―Goal‖ of the highest level, based on
the matrix of numbers, representing the judgement of paired comparisons, which is the basic
tool.
As stated before, the matrix is reciprocal, i.e. . In addition, it was also stated
that matrix would be consistent if for all , and .
An obvious case of a consistent matrix is one in which comparisons are based on exact
measurements; that is, the weights are already known. Then,
(4.23)
and thus
(4.24)
Also, of course,
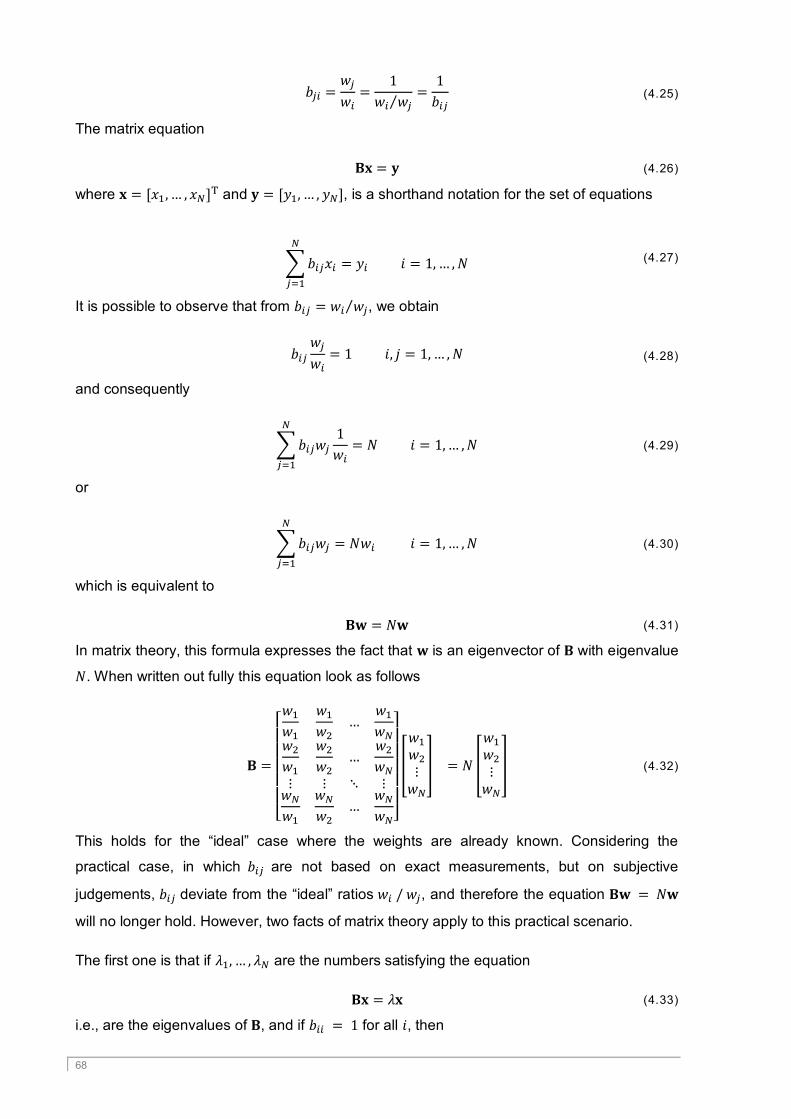
68
(4.25)
The matrix equation
(4.26)
where and , is a shorthand notation for the set of equations
(4.27)
It is possible to observe that from , we obtain
(4.28)
and consequently
(4.29)
or
(4.30)
which is equivalent to
(4.31)
In matrix theory, this formula expresses the fact that is an eigenvector of with eigenvalue
. When written out fully this equation look as follows
(4.32)
This holds for the ―ideal‖ case where the weights are already known. Considering the
practical case, in which are not based on exact measurements, but on subjective
judgements, deviate from the ―ideal‖ ratios , and therefore the equation
will no longer hold. However, two facts of matrix theory apply to this practical scenario.
The first one is that if are the numbers satisfying the equation
(4.33)
i.e., are the eigenvalues of , and if for all , then

69
(4.34)
Therefore, if holds, then all eigenvalues are zero, except one, which is . Clearly,
then, in the consistent case, is the largest eigenvalue of .
The second fact is that if one changes the entries of a positive reciprocal matrix by
small amounts, then the eigenvalues change by small amounts.
Combining these results, it is possible to conclude that if the diagonal of a matrix consists
of ones ( ), and if is consistent, then small variations of the keep the largest
eigenvalue, , close to , and the remaining eigenvalues close to zero.
Therefore, the problem is this: if is the matrix of paired comparison values, in order to find
the priority vector, it is necessary to find the vector that satisfies
(4.35)
Since (4.35) does not provide a unique solution but a direction for , it is necessary to select
the normalised solution that guarantees .
The result of this methodology step is a vector containing the weight of each criterion
considered, given by the normalised eigenvector correspondent to the maximum eigenvalue
of . Therefore, considering the criteria , each user has registered judgements that
led to the definition of the vector
(4.36)
If the decision-making process involves a team with members, then the result
comprehends vectors like the one presented in (4.36). The next step consists on how to
combine the individual opinions, to define the group‘s definition of weight for each criterion.
4.2.5. CALCULATING GROUP CRITERIA WEIGHT
Considering the decision-making process includes a team with actors, and each of them
has provided individual judgements, leading to the definition of different vectors
representing the individual criteria weights. The opinion of each team member is expressed
in a vector
(4.37)
where indicates the index of the actor in the team.

70
Each person represents a ―piece‖ of the team, which can be distributed in different ways.
This means that each team member has an individual weight, identifying his/her ―position‖ in
the team. This weight can be the same for all team members, in cases of equal voting, but it
can happen that some members have a more relevant position than others (e.g. in cases of
committees).
There are two possibilities to aggregate the individual opinions of different actors: aggregate
individual judgements (provided by matrixes ), or aggregate individual priorities (provided
by vectors w). Teams use the first method when the group acts together as a unit, i.e. when
individuals are willing to, or must, renounce to their own preferences for the sake of the
group. In these situations, the group becomes a new individual. On the other hand, teams
use the second method when the group represents a collection of separate individuals. In
industrial environments, there is always a major concern with accountability and
responsibility of actors in any situation. Therefore, companies do not want to lose the
individual identities in group decision-making. Consequently, the methodology presented in
this thesis uses aggregation of individual priorities to support collaborative decision-making
that still represents individuals as well. In order to aggregate individual priorities, it is possible
to use either an arithmetic or geometric mean (Forman and Peniwati 1998). Regarding this
aspect, the methodology here proposed has chosen to use the arithmetic mean, also
because of industrial requirements. Actors in industrial environments tend to be suspicious of
methods and particularly systems they do not know, and especially that they do not
understand. The arithmetic average is identified with an arithmetic progression, which is
considered linear, simpler and easier to understand. Even if actors do not all have the some
weight in the team, they understand that their role is directly weighted by a simple constant.
Supposing that each expert in the team has a weight, , with , then the total
weight of the group for one specific criterion, , is given by
(4.38)
Therefore, the vector representing the total criteria weight, i.e. considering all the individual
judgements provided is represented by:
(4.39)
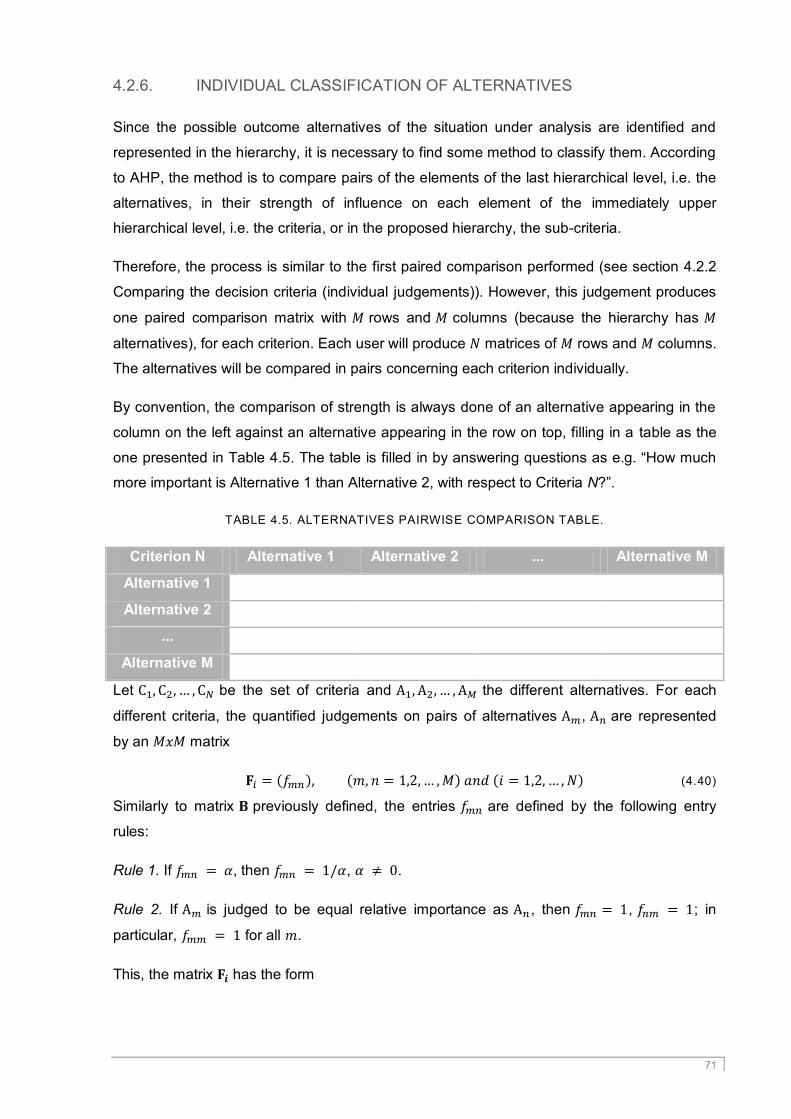
71
4.2.6. INDIVIDUAL CLASSIFICATION OF ALTERNATIVES
Since the possible outcome alternatives of the situation under analysis are identified and
represented in the hierarchy, it is necessary to find some method to classify them. According
to AHP, the method is to compare pairs of the elements of the last hierarchical level, i.e. the
alternatives, in their strength of influence on each element of the immediately upper
hierarchical level, i.e. the criteria, or in the proposed hierarchy, the sub-criteria.
Therefore, the process is similar to the first paired comparison performed (see section 4.2.2
Comparing the decision criteria (individual judgements)). However, this judgement produces
one paired comparison matrix with rows and columns (because the hierarchy has
alternatives), for each criterion. Each user will produce matrices of rows and columns.
The alternatives will be compared in pairs concerning each criterion individually.
By convention, the comparison of strength is always done of an alternative appearing in the
column on the left against an alternative appearing in the row on top, filling in a table as the
one presented in Table 4.5. The table is filled in by answering questions as e.g. ―How much
more important is Alternative 1 than Alternative 2, with respect to Criteria N?‖.
TABLE 4.5. ALTERNATIVES PAIRWISE COMPARISON TABLE.
Criterion N Alternative 1 Alternative 2 ... Alternative M
Alternative 1
Alternative 2
...
Alternative M
Let be the set of criteria and the different alternatives. For each
different criteria, the quantified judgements on pairs of alternatives , are represented
by an matrix
(4.40)
Similarly to matrix previously defined, the entries are defined by the following entry
rules:
Rule 1. If , then , .
Rule 2. If is judged to be equal relative importance as , then , ; in
particular, for all .
This, the matrix has the form

72
. (4.41)
Therefore, the problem is this: if is the matrix of paired comparison values, in order to find
the priority vector, it is necessary to find the vector s that satisfies
(4.42)
Since (4.35) does not provide a unique solution but a direction for , it is necessary to select
the normalised solution that guarantees .
For each criteria , each user compares the alternatives considered. As a result, each
user k defines a group of N vectors of the type
(4.43)
There are decision problems in which the main concern is to choose the best alternative
independently of what other alternatives may come to light after the initial rating. In other
problems, the best alternative may depend on what other alternatives are added. When there
is dependence among alternatives, it is necessary to use the paired comparisons of
alternatives together with the normalisation. This is the distributive mode in AHP, and results
in
defined by (4.43). On the other hand, when the alternatives are independent, it is
necessary to preserve the initial rating from changing if irrelevant alternatives are added. In
these cases, the elements of vector
are divided by its maximum element. This is the
ideal mode in AHP.
The vectors
can be combined in one matrix , expressing the weights defined by
the user to the alternatives, regarding the criteria considered. The matrix is composed
with the terms , where is the alternative (in the rows) and indicates the criteria
(represented in columns):
(4.44)
4.2.7. CALCULATING GROUP CLASSIFICATION OF ALTERNATIVES
As defined previously, each expert has a role in the team. This role may be different in the
distinct phases of the decision process. Therefore, the methodology proposed in this thesis
allows the possibility of one actor having one role when defining criteria‘s weights and a

73
different role when rating the alternatives. According to this, each actor has, in this step, a
weight , with , representing the respective role in the group. This weight is
necessary to compute the total view of the group about the several alternatives individually
judged. The matrices defined are combined, taking into account the user‘s role, resulting
that the rating of one alternative j regarding one criteria is given by
(4.45)
Therefore, the matrix representing the total alternatives ratings, i.e. considering all the
individual judgements provided is represented by:
(4.46)
The matrix provides the total ratings of all alternatives regarding the criteria, i.e. how each
alternative satisfy each criterion.
4.2.8. ORDERING ALTERNATIVES
After providing judgements on the importance of the criteria, resulting in criteria weights, and
judgements on the satisfaction of each alternative, it is possible to finally order the
alternatives to find out the most satisfactory one.
The final ranking of the alternatives is given by
(4.47)
which is equivalent to
(4.48)
resulting in
(4.49)
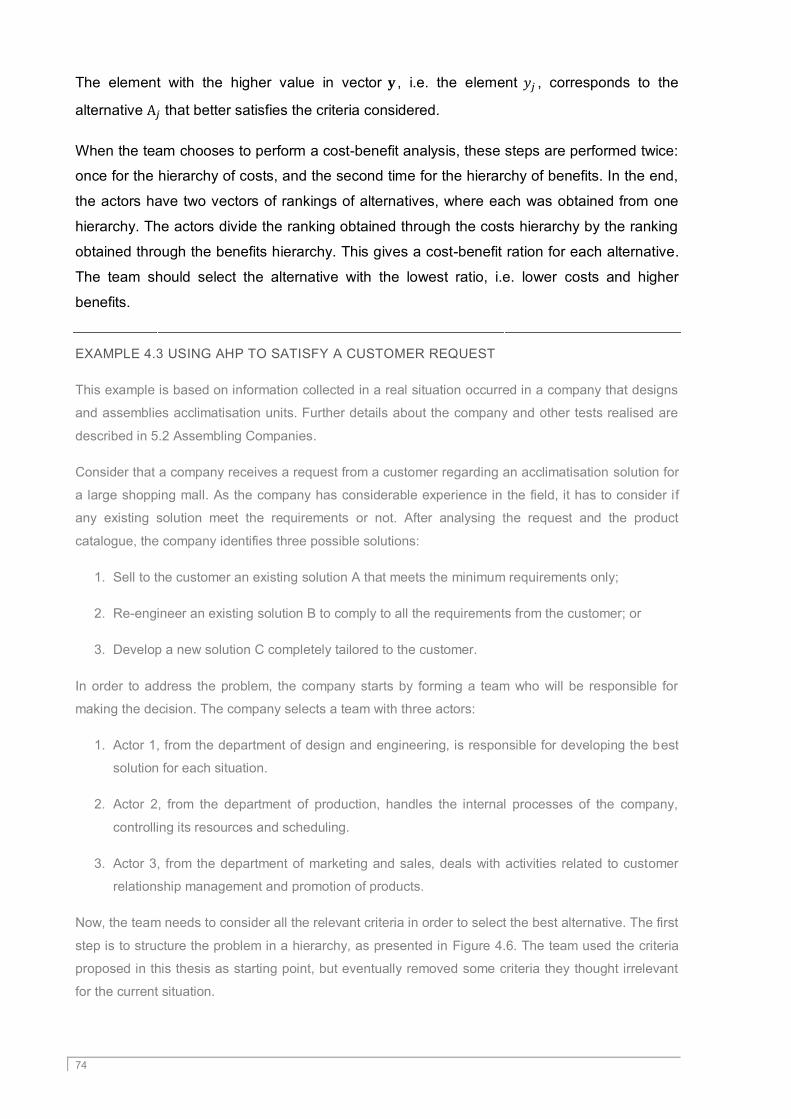
74
The element with the higher value in vector , i.e. the element , corresponds to the
alternative that better satisfies the criteria considered.
When the team chooses to perform a cost-benefit analysis, these steps are performed twice:
once for the hierarchy of costs, and the second time for the hierarchy of benefits. In the end,
the actors have two vectors of rankings of alternatives, where each was obtained from one
hierarchy. The actors divide the ranking obtained through the costs hierarchy by the ranking
obtained through the benefits hierarchy. This gives a cost-benefit ration for each alternative.
The team should select the alternative with the lowest ratio, i.e. lower costs and higher
benefits.
EXAMPLE 4.3 USING AHP TO SATISFY A CUSTOMER REQUEST
This example is based on information collected in a real situation occurred in a company that designs
and assemblies acclimatisation units. Further details about the company and other tests realised are
described in 5.2 Assembling Companies.
Consider that a company receives a request from a customer regarding an acclimatisation solution for
a large shopping mall. As the company has considerable experience in the field, it has to consider if
any existing solution meet the requirements or not. After analysing the request and the product
catalogue, the company identifies three possible solutions:
1. Sell to the customer an existing solution A that meets the minimum requirements only;
2. Re-engineer an existing solution B to comply to all the requirements from the customer; or
3. Develop a new solution C completely tailored to the customer.
In order to address the problem, the company starts by forming a team who will be responsible for
making the decision. The company selects a team with three actors:
1. Actor 1, from the department of design and engineering, is responsible for developing the best
solution for each situation.
2. Actor 2, from the department of production, handles the internal processes of the company,
controlling its resources and scheduling.
3. Actor 3, from the department of marketing and sales, deals with activities related to customer
relationship management and promotion of products.
Now, the team needs to consider all the relevant criteria in order to select the best alternative. The first
step is to structure the problem in a hierarchy, as presented in Figure 4.6. The team used the criteria
proposed in this thesis as starting point, but eventually removed some criteria they thought irrelevant
for the current situation.
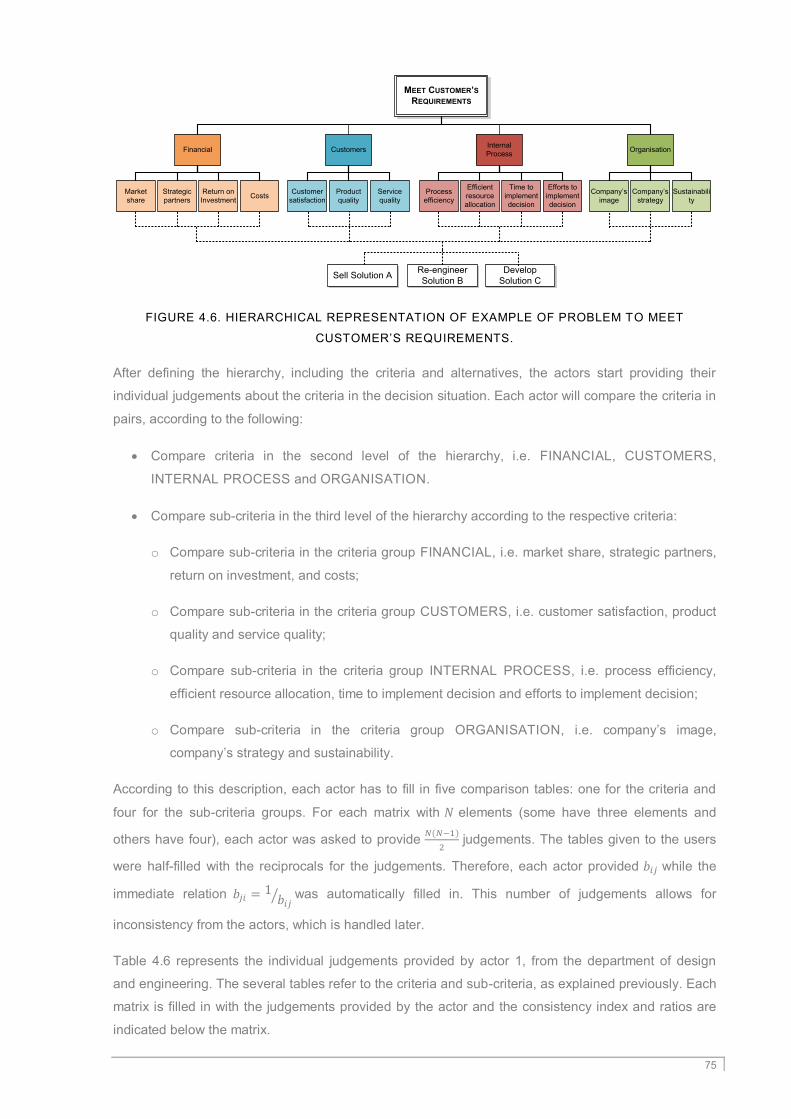
75
FIGURE 4.6. HIERARCHICAL REPRESENTATION OF EXAMPLE OF PROBLEM TO MEET
CUSTOMER‘S REQUIREMENTS.
After defining the hierarchy, including the criteria and alternatives, the actors start providing their
individual judgements about the criteria in the decision situation. Each actor will compare the criteria in
pairs, according to the following:
Compare criteria in the second level of the hierarchy, i.e. FINANCIAL, CUSTOMERS,
INTERNAL PROCESS and ORGANISATION.
Compare sub-criteria in the third level of the hierarchy according to the respective criteria:
o Compare sub-criteria in the criteria group FINANCIAL, i.e. market share, strategic partners,
return on investment, and costs;
o Compare sub-criteria in the criteria group CUSTOMERS, i.e. customer satisfaction, product
quality and service quality;
o Compare sub-criteria in the criteria group INTERNAL PROCESS, i.e. process efficiency,
efficient resource allocation, time to implement decision and efforts to implement decision;
o Compare sub-criteria in the criteria group ORGANISATION, i.e. company‘s image,
company‘s strategy and sustainability.
According to this description, each actor has to fill in five comparison tables: one for the criteria and
four for the sub-criteria groups. For each matrix with elements (some have three elements and
others have four), each actor was asked to provide
judgements. The tables given to the users
were half-filled with the reciprocals for the judgements. Therefore, each actor provided while the
immediate relation
was automatically filled in. This number of judgements allows for
inconsistency from the actors, which is handled later.
Table 4.6 represents the individual judgements provided by actor 1, from the department of design
and engineering. The several tables refer to the criteria and sub-criteria, as explained previously. Each
matrix is filled in with the judgements provided by the actor and the consistency index and ratios are
indicated below the matrix.
MEET CUSTOMER’S
REQUIREMENTS
Customers Internal
Process Organisation
Market
share
Strategic
partners
Return on
InvestmentCosts
Customer
satisfaction
Product
quality
Service
quality
Process
efficiency
Efficient
resource
allocation
Time to
implement
decision
Efforts to
implement
decision
Company‘s
image
Company‘s
strategy
Sustainabili
ty
Sell Solution ARe-engineer
Solution B
Develop
Solution C
Financial

76
TABLE 4.6. INDIVIDUAL JUDGEMEMENTS OF CRITERIA BY ACTOR 1.
As stated in section 4.2.3 Analysing judgement consistency, it is desirable to have all judgements
matrixes with a consistency ratio below than 0.10. However, it is possible to see that actor 1 has
provided some inconsistent judgements when comparing the sub-criteria of the criteria group
organisation. The last matrix indicated by actor 1 has a consistency ratio of 0.254. This methodology
proposes the calculation of for all elements in the inconsistent matrix. The result of this
calculation is represented in the left part of Table 4.7. It is possible to see that the comparison
between sustainability and company‘s image has , which means that the judgement
provided by the actor is too small. On the other hand, the comparisons between company‘s strategy
and company‘s image, and between sustainability and company‘s strategy have and
, which means these two judgements have values that are too high. The actor was then
asked to re-consider revising these three judgements, changing the values provided by one step (from
1/3 to 1/5) or even half-a-step (from 1/3 to 1/4). The actor accepted, and the new judgements are
represented in the right part of Table 4.7, with a consistent ratio of 0.033.
TABLE 4.7. REVISION OF SOME INDIVIDUAL JUDGEMEMENTS OF CRITERIA BY ACTOR 1.
Actor 1 Fin
anci
al
Cu
sto
mer
s
Inte
rnal
Pro
cess
Org
anis
atio
n
Pri
ori
ty
Actor 1 Mar
ket
shar
e
Stra
tegi
c
par
tner
s
Ret
urn
on
inve
stm
ent
Co
sts
Loca
l Pri
ori
ty
Glo
bal
Pri
ori
ty
Financial 1.000 0.333 0.200 1.000 0.099 Market share 1.000 1.000 1.000 0.333 0.167 0.016
Customers 3.000 1.000 0.333 3.000 0.263 Strategic partners 1.000 1.000 1.000 0.333 0.167 0.016
Internal Process 5.000 3.000 1.000 3.000 0.523 Return on investment 1.000 1.000 1.000 0.333 0.167 0.016
Organisation 1.000 0.333 0.333 1.000 0.116 Costs 3.000 3.000 3.000 1.000 0.500 0.049
C.I. 0.039 1.000 C.I. 0.000 1.000 0.099
C.R. 0.043 C.R. 0.000
Actor 1 Cu
sto
mer
sati
sfac
tio
n
Pro
du
ct
qu
alit
y
Serv
ice
qu
alit
y
Pri
ori
ty
Glo
bal
Pri
ori
ty
Actor 1 Pro
cess
effi
cien
cyEf
fici
ent
reso
urc
e
allo
cati
on
Tim
e to
mak
e
a d
ecis
ion
Effo
rts
to
mak
e a
dec
isio
n
Loca
l Pri
ori
ty
Glo
bal
Pri
ori
ty
Customer satisfaction 1.000 1.000 3.000 0.429 0.113 Process efficiency 1.000 1.000 1.000 0.333 0.175 0.092
Product quality 1.000 1.000 3.000 0.429 0.113 Efficient resource allocation 1.000 1.000 1.000 1.000 0.241 0.126
Service quality 0.333 0.333 1.000 0.143 0.038 Time to implement decision 1.000 1.000 1.000 0.333 0.175 0.092
C.I. 0.000 1.000 0.263 Efforts to implement decision 3.000 1.000 3.000 1.000 0.409 0.214
C.R. 0.000 C.I. 0.052 1.000 0.523
C.R. 0.057
Actor 1 Co
mp
any'
s
imag
e
Co
mp
any'
s
stra
tegy
Sust
ain
abili
ty
Pri
ori
ty
Glo
bal
Pri
ori
ty
Company's image 1.000 5.000 3.000 0.651 0.075
Company's strategy 0.200 1.000 3.000 0.223 0.026
Sustainability 0.333 0.333 1.000 0.127 0.015
C.I. 0.147 1.000 0.116
C.R. 0.254
Actor 1 Co
mp
any'
s
imag
e
Co
mp
any'
s
stra
tegy
Sust
ain
abili
ty
Actor 1 Co
mp
any'
s
imag
e
Co
mp
any'
s
stra
tegy
Sust
ain
abili
ty
Pri
ori
ty
Glo
bal
Pri
ori
ty
Company's image 1.000 1.710 0.585 Company's image 1.000 3.000 5.000 0.637 0.074
Company's strategy 0.585 1.000 1.710 Company's strategy 0.333 1.000 3.000 0.258 0.030
Sustainability 1.710 0.585 1.000 Sustainability 0.200 0.333 1.000 0.105 0.012
C.I. 0.019 1.000 0.116
C.R. 0.033

77
Table 4.8 and Table 4.9 represent the individual judgements provided by actors 2 and 3 for the criteria
and sub-criteria. It is possible to see that all matrixes have consistency ratios below 0.10.
TABLE 4.8. INDIVIDUAL JUDGEMEMENTS OF CRITERIA BY ACTOR 2.
TABLE 4.9. INDIVIDUAL JUDGEMEMENTS OF CRITERIA BY ACTOR 3.
Actor 2 Fin
anci
al
Cu
sto
mer
s
Inte
rnal
Pro
cess
Org
anis
atio
n
Pri
ori
ty
Actor 2 Mar
ket
shar
e
Stra
tegi
c
par
tner
s
Ret
urn
on
inve
stm
ent
Co
sts
Loca
l Pri
ori
ty
Glo
bal
Pri
ori
ty
Financial 1.000 0.200 0.143 0.200 0.051 Market share 1.000 1.000 1.000 1.000 0.250 0.013
Customers 5.000 1.000 0.200 0.333 0.145 Strategic partners 1.000 1.000 1.000 1.000 0.250 0.013
Internal Process 7.000 5.000 1.000 1.000 0.449 Return on investment 1.000 1.000 1.000 1.000 0.250 0.013
Organisation 5.000 3.000 1.000 1.000 0.355 Costs 1.000 1.000 1.000 1.000 0.250 0.013
C.I. 0.068 1.000 C.I. 0.000 1.000 0.051
C.R. 0.076 C.R. 0.000
Actor 2 Cu
sto
mer
sati
sfac
tio
n
Pro
du
ct
qu
alit
y
Serv
ice
qu
alit
y
Pri
ori
ty
Glo
bal
Pri
ori
tyActor 2 P
roce
ss
effi
cien
cyEf
fici
ent
reso
urc
e
allo
cati
on
Tim
e to
mak
e
a d
ecis
ion
Effo
rts
to
mak
e a
dec
isio
n
Loca
l Pri
ori
ty
Glo
bal
Pri
ori
ty
Customer satisfaction 1.000 0.143 0.200 0.072 0.010 Process efficiency 1.000 1.000 7.000 5.000 0.441 0.198
Product quality 7.000 1.000 3.000 0.649 0.094 Efficient resource allocation 1.000 1.000 5.000 5.000 0.404 0.181
Service quality 5.000 0.333 1.000 0.279 0.040 Time to implement decision 0.143 0.200 1.000 1.000 0.075 0.033
C.I. 0.032 1.000 0.145 Efforts to implement decision 0.200 0.200 1.000 1.000 0.081 0.036
C.R. 0.056 C.I. 0.005 1.000 0.449
C.R. 0.005
Actor 2 Co
mp
any'
s
imag
e
Co
mp
any'
s
stra
tegy
Sust
ain
abili
ty
Pri
ori
ty
Glo
bal
Pri
ori
ty
Company's image 1.000 1.000 1.000 0.333 0.118
Company's strategy 1.000 1.000 1.000 0.333 0.118
Sustainability 1.000 1.000 1.000 0.333 0.118
C.I. 0.000 1.000 0.355
C.R. 0.000
Actor 3 Fin
anci
al
Cu
sto
mer
s
Inte
rnal
Pro
cess
Org
anis
atio
n
Pri
ori
ty
Actor 3 Mar
ket
shar
e
Stra
tegi
c
par
tner
s
Ret
urn
on
inve
stm
ent
Co
sts
Loca
l Pri
ori
ty
Glo
bal
Pri
ori
ty
Financial 1.000 1.000 7.000 5.000 0.417 Market share 1.000 5.000 3.000 1.000 0.419 0.175
Customers 1.000 1.000 7.000 5.000 0.417 Strategic partners 0.200 1.000 0.200 0.333 0.070 0.029
Internal Process 0.143 0.143 1.000 0.200 0.045 Return on investment 0.333 5.000 1.000 1.000 0.239 0.100
Organisation 0.200 0.200 5.000 1.000 0.122 Costs 1.000 3.000 1.000 1.000 0.272 0.113
C.I. 0.070 1.000 C.I. 0.062 C.R. 0.069 1.000 0.417
C.R. 0.077
Actor 3 Cu
sto
mer
sati
sfac
tio
n
Pro
du
ct
qu
alit
y
Serv
ice
qu
alit
y
Pri
ori
ty
Glo
bal
Pri
ori
ty
Actor 3 Pro
cess
effi
cien
cyEf
fici
ent
reso
urc
e
allo
cati
on
Tim
e to
mak
e
a d
ecis
ion
Effo
rts
to
mak
e a
dec
isio
n
Loca
l Pri
ori
ty
Glo
bal
Pri
ori
ty
Customer satisfaction 1.000 3.000 3.000 0.600 0.250 Process efficiency 1.000 1.000 0.200 0.200 0.083 0.004
Product quality 0.333 1.000 1.000 0.200 0.083 Efficient resource allocation 1.000 1.000 0.200 0.200 0.083 0.004
Service quality 0.333 1.000 1.000 0.200 0.083 Time to implement decision 5.000 5.000 1.000 1.000 0.417 0.019
C.I. 0.000 1.000 0.417 Efforts to implement decision 5.000 5.000 1.000 1.000 0.417 0.019
C.R. 0.000 C.I. 0.000 1.000 0.045
C.R. 0.000
Actor 3 Co
mp
any'
s
imag
e
Co
mp
any'
s
stra
tegy
Sust
ain
abili
ty
Pri
ori
ty
Glo
bal
Pri
ori
ty
Company's image 1.000 5.000 5.000 0.714 0.087
Company's strategy 0.200 1.000 1.000 0.143 0.017
Sustainability 0.200 1.000 1.000 0.143 0.017
C.I. 0.000 1.000 0.122
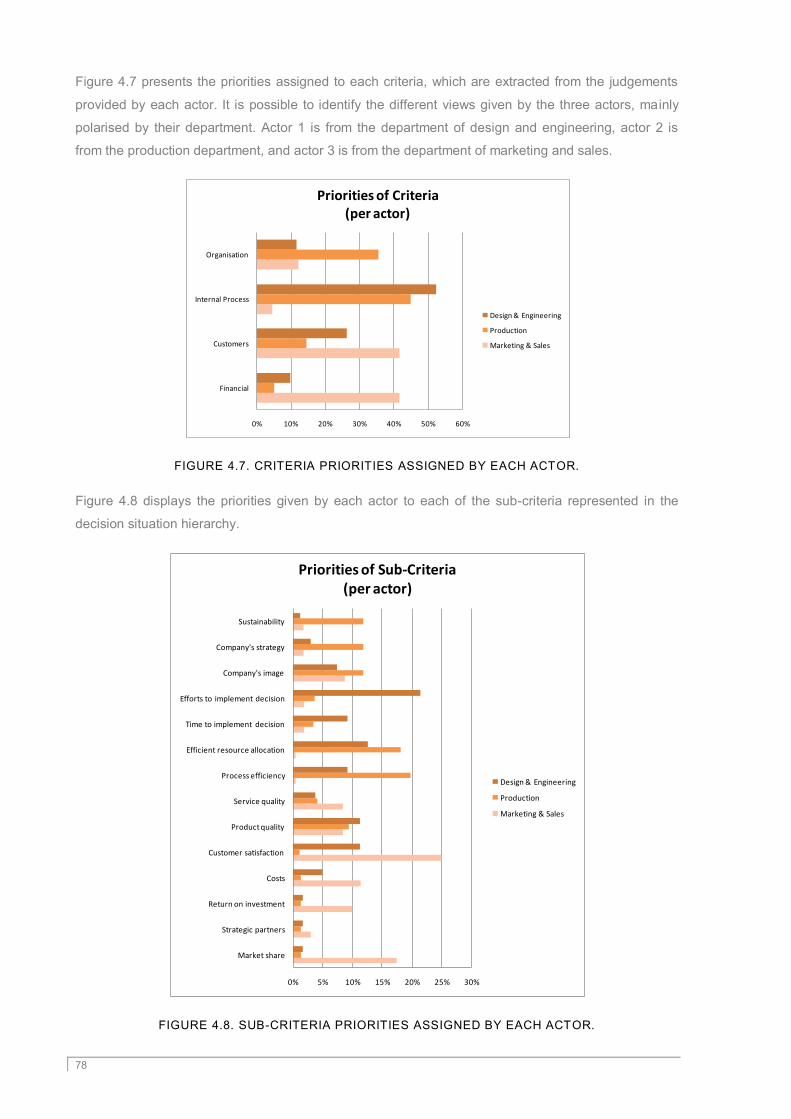
78
Figure 4.7 presents the priorities assigned to each criteria, which are extracted from the judgements
provided by each actor. It is possible to identify the different views given by the three actors, mainly
polarised by their department. Actor 1 is from the department of design and engineering, actor 2 is
from the production department, and actor 3 is from the department of marketing and sales.
FIGURE 4.7. CRITERIA PRIORITIES ASSIGNED BY EACH ACTOR.
Figure 4.8 displays the priorities given by each actor to each of the sub-criteria represented in the
decision situation hierarchy.
FIGURE 4.8. SUB-CRITERIA PRIORITIES ASSIGNED BY EACH ACTOR.
0% 10% 20% 30% 40% 50% 60%
Financial
Customers
Internal Process
Organisation
Priorities of Criteria(per actor)
Design & Engineering
Production
Marketing & Sales
0% 5% 10% 15% 20% 25% 30%
Market share
Strategic partners
Return on investment
Costs
Customer satisfaction
Product quality
Service quality
Process efficiency
Efficient resource allocation
Time to implement decision
Efforts to implement decision
Company's image
Company's strategy
Sustainability
Priorities of Sub-Criteria(per actor)
Design & Engineering
Production
Marketing & Sales

79
From the individual criteria priorities, the calculation of the group‘s criteria weights is straightforward. In
order to aggregate the individual priorities for the criteria, each team member is assigned a role, or
weight. For this purpose, the team has the following role distribution: actors 1 and 2 have weights of
40% each, and actor 3 has a weight of 20%. The total weight of each criterion is the weighted
arithmetic mean of the individual priorities. The result of the group‘s criteria priorities is presented in
Figure 4.9.
FIGURE 4.9. CRITERIA WEIGHTS DEFINED BY THE TEAM.
After having the weights for the criteria, the teams need to compare the three alternatives regarding
each sub-criteria. This means that each actor will fill in 14 matrixes with dimension . In order to
define these judgements, the actors had to provide three values, while the reciprocals were
automatically determined. The process is actually quite similar to the one where actors provided
judgements on criteria.
Table 4.10, Table 4.11 and Table 4.12 provide an overview of the individual judgements provided by
the three actors, when comparing the possible alternatives to the sub-criteria identified in the
hierarchy. Each of the fourteen matrixes provided by the three actors was analysed with respect to the
consistency index and ration, as indicated in the tables. All the judgements provided by the actors in
this phase were in the range of consistency accepted, i.e. with a consistency ration lower than 0.10.
Market share5%
Strategic partners2%
Return on investment3%
Costs5%
Customer satisfaction10%
Product quality10%
Service quality5%Process efficiency
12%
Efficient resource allocation
12%
Time to implement decision
5%
Efforts to implement decision
10%
Company's image9%
Company's strategy6%
Sustainability6%
Priorities of Sub-Criteria

80
TABLE 4.10. INDIVIDUAL JUDGEMEMENTS OF ALTERNATIVES BY ACTOR 1.
Market share Sell
Solu
tio
n A
Re-
engi
nee
r
Solu
tio
n B
Dev
elo
p
Solu
tio
n C
Pri
ori
ty
Strategic partners Sell
Solu
tio
n A
Re-
engi
nee
r
Solu
tio
n B
Dev
elo
p
Solu
tio
n C
Pri
ori
ty
Sell Solution A 1.000 1.000 0.200 0.156 Sell Solution A 1.000 0.333 0.333 0.143
Re-engineer Solution B 1.000 1.000 0.333 0.185 Re-engineer Solution B 3.000 1.000 1.000 0.429
Develop Solution C 5.000 3.000 1.000 0.659 Develop Solution C 3.000 1.000 1.000 0.429
C.I. 0.015 1.000 C.I. 0.000 1.000
C.R. 0.025 C.R. 0.000
Return on investment Sell
Solu
tio
n A
Re-
engi
nee
r
Solu
tio
n B
Dev
elo
p
Solu
tio
n C
Pri
ori
ty
Costs Sell
Solu
tio
n A
Re-
engi
nee
r
Solu
tio
n B
Dev
elo
p
Solu
tio
n C
Pri
ori
ty
Sell Solution A 1.000 1.000 1.000 0.333 Sell Solution A 1.000 3.000 3.000 0.600
Re-engineer Solution B 1.000 1.000 1.000 0.333 Re-engineer Solution B 0.333 1.000 1.000 0.200
Develop Solution C 1.000 1.000 1.000 0.333 Develop Solution C 0.333 1.000 1.000 0.200
C.I. 0.000 1.000 C.I. 0.000 1.000
C.R. 0.000 C.R. 0.000
Customer satisfaction Sell
Solu
tio
n A
Re-
engi
nee
r
Solu
tio
n B
Dev
elo
p
Solu
tio
n C
Pri
ori
ty
Product quality Sell
Solu
tio
n A
Re-
engi
nee
r
Solu
tio
n B
Dev
elo
p
Solu
tio
n C
Pri
ori
ty
Sell Solution A 1.000 0.200 0.143 0.072 Sell Solution A 1.000 1.000 1.000 0.333
Re-engineer Solution B 5.000 1.000 0.333 0.279 Re-engineer Solution B 1.000 1.000 1.000 0.333
Develop Solution C 7.000 3.000 1.000 0.649 Develop Solution C 1.000 1.000 1.000 0.333
C.I. 0.032 1.000 C.I. 0.000 1.000
C.R. 0.056 C.R. 0.000
Service quality Sell
Solu
tio
n A
Re-
engi
nee
r
Solu
tio
n B
Dev
elo
p
Solu
tio
n C
Pri
ori
ty
Process efficiency Sell
Solu
tio
n A
Re-
engi
nee
r
Solu
tio
n B
Dev
elo
p
Solu
tio
n C
Pri
ori
ty
Sell Solution A 1.000 1.000 1.000 0.333 Sell Solution A 1.000 1.000 1.000 0.333
Re-engineer Solution B 1.000 1.000 1.000 0.333 Re-engineer Solution B 1.000 1.000 1.000 0.333
Develop Solution C 1.000 1.000 1.000 0.333 Develop Solution C 1.000 1.000 1.000 0.333
C.I. 0.000 1.000 C.I. 0.000 1.000
C.R. 0.000 C.R. 0.000
Efficient resource allocation Sell
Solu
tio
n A
Re-
engi
nee
r
Solu
tio
n B
Dev
elo
p
Solu
tio
n C
Pri
ori
ty
Time to implement decision Sell
Solu
tio
n A
Re-
engi
nee
r
Solu
tio
n B
Dev
elo
p
Solu
tio
n C
Pri
ori
ty
Sell Solution A 1.000 1.000 0.333 0.200 Sell Solution A 1.000 5.000 9.000 0.751
Re-engineer Solution B 1.000 1.000 0.333 0.200 Re-engineer Solution B 0.200 1.000 3.000 0.178
Develop Solution C 3.000 3.000 1.000 0.600 Develop Solution C 0.111 0.333 1.000 0.070
C.I. 0.000 1.000 C.I. 0.015 1.000
C.R. 0.000 C.R. 0.025
Efforts to implement
decision Sell
Solu
tio
n A
Re-
engi
nee
r
Solu
tio
n B
Dev
elo
p
Solu
tio
n C
Pri
ori
ty
Company's image Sell
Solu
tio
n A
Re-
engi
nee
r
Solu
tio
n B
Dev
elo
p
Solu
tio
n C
Pri
ori
ty
Sell Solution A 1.000 5.000 9.000 0.751 Sell Solution A 1.000 1.000 1.000 0.333
Re-engineer Solution B 0.200 1.000 3.000 0.178 Re-engineer Solution B 1.000 1.000 1.000 0.333
Develop Solution C 0.111 0.333 1.000 0.070 Develop Solution C 1.000 1.000 1.000 0.333
C.I. 0.015 1.000 C.I. 0.000 1.000
C.R. 0.251 C.R. 0.000
Company's strategy Sell
Solu
tio
n A
Re-
engi
nee
r
Solu
tio
n B
Dev
elo
p
Solu
tio
n C
Pri
ori
ty
Sustainability Sell
Solu
tio
n A
Re-
engi
nee
r
Solu
tio
n B
Dev
elo
p
Solu
tio
n C
Pri
ori
ty
Sell Solution A 1.000 1.000 0.200 0.143 Sell Solution A 1.000 1.000 0.200 0.143
Re-engineer Solution B 1.000 1.000 0.200 0.143 Re-engineer Solution B 1.000 1.000 0.200 0.143
Develop Solution C 5.000 5.000 1.000 0.714 Develop Solution C 5.000 5.000 1.000 0.714
C.I. 0.000 1.000 C.I. 0.000 1.000
C.R. 0.000 C.R. 0.000

81
TABLE 4.11. INDIVIDUAL JUDGEMEMENTS OF ALTERNATIVES BY ACTOR 2.
Market share Sell
Solu
tio
n A
Re-
engi
nee
r
Solu
tio
n B
Dev
elo
p
Solu
tio
n C
Pri
ori
ty
Strategic partners Sell
Solu
tio
n A
Re-
engi
nee
r
Solu
tio
n B
Dev
elo
p
Solu
tio
n C
Pri
ori
ty
Sell Solution A 1.000 1.000 1.000 0.333 Sell Solution A 1.000 0.333 0.200 0.105
Re-engineer Solution B 1.000 1.000 1.000 0.333 Re-engineer Solution B 3.000 1.000 0.333 0.258
Develop Solution C 1.000 1.000 1.000 0.333 Develop Solution C 5.000 3.000 1.000 0.637
C.I. 0.000 1.000 C.I. 0.019 1.000
C.R. 0.000 C.R. 0.033
Return on investment Sell
Solu
tio
n A
Re-
engi
nee
r
Solu
tio
n B
Dev
elo
p
Solu
tio
n C
Pri
ori
ty
Costs Sell
Solu
tio
n A
Re-
engi
nee
r
Solu
tio
n B
Dev
elo
p
Solu
tio
n C
Pri
ori
ty
Sell Solution A 1.000 1.000 3.000 0.429 Sell Solution A 1.000 3.000 5.000 0.637
Re-engineer Solution B 1.000 1.000 3.000 0.429 Re-engineer Solution B 0.333 1.000 3.000 0.258
Develop Solution C 0.333 0.333 1.000 0.143 Develop Solution C 0.200 0.333 1.000 0.105
C.I. 0.000 1.000 C.I. 0.019 1.000
C.R. 0.000 C.R. 0.033
Customer satisfaction Sell
Solu
tio
n A
Re-
engi
nee
r
Solu
tio
n B
Dev
elo
p
Solu
tio
n C
Pri
ori
ty
Product quality Sell
Solu
tio
n A
Re-
engi
nee
r
Solu
tio
n B
Dev
elo
p
Solu
tio
n C
Pri
ori
ty
Sell Solution A 1.000 0.333 0.333 0.143 Sell Solution A 1.000 1.000 1.000 0.333
Re-engineer Solution B 3.000 1.000 1.000 0.429 Re-engineer Solution B 1.000 1.000 1.000 0.333
Develop Solution C 3.000 1.000 1.000 0.429 Develop Solution C 1.000 1.000 1.000 0.333
C.I. 0.000 1.000 C.I. 0.000 1.000
C.R. 0.000 C.R. 0.000
Service quality Sell
Solu
tio
n A
Re-
engi
nee
r
Solu
tio
n B
Dev
elo
p
Solu
tio
n C
Pri
ori
ty
Process efficiency Sell
Solu
tio
n A
Re-
engi
nee
r
Solu
tio
n B
Dev
elo
p
Solu
tio
n C
Pri
ori
ty
Sell Solution A 1.000 1.000 1.000 0.333 Sell Solution A 1.000 3.000 0.333 0.258
Re-engineer Solution B 1.000 1.000 1.000 0.333 Re-engineer Solution B 0.333 1.000 0.200 0.105
Develop Solution C 1.000 1.000 1.000 0.333 Develop Solution C 3.000 5.000 1.000 0.637
C.I. 0.000 1.000 C.I. 0.019 1.000
C.R. 0.000 C.R. 0.033
Efficient resource allocation Sell
Solu
tio
n A
Re-
engi
nee
r
Solu
tio
n B
Dev
elo
p
Solu
tio
n C
Pri
ori
ty
Time to implement decision Sell
Solu
tio
n A
Re-
engi
nee
r
Solu
tio
n B
Dev
elo
p
Solu
tio
n C
Pri
ori
ty
Sell Solution A 1.000 3.000 0.333 0.258 Sell Solution A 1.000 5.000 9.000 0.751
Re-engineer Solution B 0.333 1.000 0.200 0.105 Re-engineer Solution B 0.200 1.000 3.000 0.178
Develop Solution C 3.000 5.000 1.000 0.637 Develop Solution C 0.111 0.333 1.000 0.070
C.I. 0.019 1.000 C.I. 0.015 1.000
C.R. 0.033 C.R. 0.025
Efforts to implement
decision Sell
Solu
tio
n A
Re-
engi
nee
r
Solu
tio
n B
Dev
elo
p
Solu
tio
n C
Pri
ori
ty
Company's image Sell
Solu
tio
n A
Re-
engi
nee
r
Solu
tio
n B
Dev
elo
p
Solu
tio
n C
Pri
ori
ty
Sell Solution A 1.000 5.000 9.000 0.751 Sell Solution A 1.000 1.000 1.000 0.333
Re-engineer Solution B 0.200 1.000 3.000 0.178 Re-engineer Solution B 1.000 1.000 1.000 0.333
Develop Solution C 0.111 0.333 1.000 0.070 Develop Solution C 1.000 1.000 1.000 0.333
C.I. 0.015 1.000 C.I. 0.000 1.000
C.R. 0.025 C.R. 0.000
Company's strategy Sell
Solu
tio
n A
Re-
engi
nee
r
Solu
tio
n B
Dev
elo
p
Solu
tio
n C
Pri
ori
ty
Sustainability Sell
Solu
tio
n A
Re-
engi
nee
r
Solu
tio
n B
Dev
elo
p
Solu
tio
n C
Pri
ori
ty
Sell Solution A 1.000 1.000 0.333 0.200 Sell Solution A 1.000 1.000 1.000 0.333
Re-engineer Solution B 1.000 1.000 0.333 0.200 Re-engineer Solution B 1.000 1.000 1.000 0.333
Develop Solution C 3.000 3.000 1.000 0.600 Develop Solution C 1.000 1.000 1.000 0.333
C.I. 0.000 1.000 C.I. 0.000 1.000
C.R. 0.000 C.R. 0.000

82
TABLE 4.12. INDIVIDUAL JUDGEMEMENTS OF ALTERNATIVES BY ACTOR 3.
Market share Sell
Solu
tio
n A
Re-
engi
nee
r
Solu
tio
n B
Dev
elo
p
Solu
tio
n C
Pri
ori
ty
Strategic partners Sell
Solu
tio
n A
Re-
engi
nee
r
Solu
tio
n B
Dev
elo
p
Solu
tio
n C
Pri
ori
ty
Sell Solution A 1.000 0.333 0.143 0.088 Sell Solution A 1.000 0.333 0.143 0.088
Re-engineer Solution B 3.000 1.000 0.333 0.243 Re-engineer Solution B 3.000 1.000 0.333 0.243
Develop Solution C 7.000 3.000 1.000 0.669 Develop Solution C 7.000 3.000 1.000 0.669
C.I. 0.004 1.000 C.I. 0.004 1.000
C.R. 0.006 C.R. 0.006
Return on investment Sell
Solu
tio
n A
Re-
engi
nee
r
Solu
tio
n B
Dev
elo
p
Solu
tio
n C
Pri
ori
ty
Costs Sell
Solu
tio
n A
Re-
engi
nee
r
Solu
tio
n B
Dev
elo
p
Solu
tio
n C
Pri
ori
ty
Sell Solution A 1.000 1.000 1.000 0.333 Sell Solution A 1.000 3.000 3.000 0.600
Re-engineer Solution B 1.000 1.000 1.000 0.333 Re-engineer Solution B 0.333 1.000 1.000 0.200
Develop Solution C 1.000 1.000 1.000 0.333 Develop Solution C 0.333 1.000 1.000 0.200
C.I. 0.000 1.000 C.I. 0.000 1.000
C.R. 0.000 C.R. 0.000
Customer satisfaction Sell
Solu
tio
n A
Re-
engi
nee
r
Solu
tio
n B
Dev
elo
p
Solu
tio
n C
Pri
ori
ty
Product quality Sell
Solu
tio
n A
Re-
engi
nee
r
Solu
tio
n B
Dev
elo
p
Solu
tio
n C
Pri
ori
ty
Sell Solution A 1.000 0.200 0.111 0.058 Sell Solution A 1.000 3.000 3.000 0.600
Re-engineer Solution B 5.000 1.000 0.200 0.207 Re-engineer Solution B 0.333 1.000 1.000 0.200
Develop Solution C 9.000 5.000 1.000 0.735 Develop Solution C 0.333 1.000 1.000 0.200
C.I. 0.059 1.000 C.I. 0.000 1.000
C.R. 0.101 C.R. 0.000
Service quality Sell
Solu
tio
n A
Re-
engi
nee
r
Solu
tio
n B
Dev
elo
p
Solu
tio
n C
Pri
ori
ty
Process efficiency Sell
Solu
tio
n A
Re-
engi
nee
r
Solu
tio
n B
Dev
elo
p
Solu
tio
n C
Pri
ori
ty
Sell Solution A 1.000 3.000 3.000 0.600 Sell Solution A 1.000 1.000 1.000 0.333
Re-engineer Solution B 0.333 1.000 1.000 0.200 Re-engineer Solution B 1.000 1.000 1.000 0.333
Develop Solution C 0.333 1.000 1.000 0.200 Develop Solution C 1.000 1.000 1.000 0.333
C.I. 0.000 1.000 C.I. 0.000 1.000
C.R. 0.000 C.R. 0.000
Efficient resource allocation Sell
Solu
tio
n A
Re-
engi
nee
r
Solu
tio
n B
Dev
elo
p
Solu
tio
n C
Pri
ori
ty
Time to implement decision Sell
Solu
tio
n A
Re-
engi
nee
r
Solu
tio
n B
Dev
elo
p
Solu
tio
n C
Pri
ori
ty
Sell Solution A 1.000 1.000 1.000 0.333 Sell Solution A 1.000 1.000 3.000 0.429
Re-engineer Solution B 1.000 1.000 1.000 0.333 Re-engineer Solution B 1.000 1.000 3.000 0.429
Develop Solution C 1.000 1.000 1.000 0.333 Develop Solution C 0.333 0.333 1.000 0.143
C.I. 0.000 1.000 C.I. 0.000 1.000
C.R. 0.000 C.R. 0.000
Efforts to implement
decision Sell
Solu
tio
n A
Re-
engi
nee
r
Solu
tio
n B
Dev
elo
p
Solu
tio
n C
Pri
ori
ty
Company's image Sell
Solu
tio
n A
Re-
engi
nee
r
Solu
tio
n B
Dev
elo
p
Solu
tio
n C
Pri
ori
ty
Sell Solution A 1.000 1.000 3.000 0.429 Sell Solution A 1.000 0.200 0.111 0.058
Re-engineer Solution B 1.000 1.000 3.000 0.429 Re-engineer Solution B 5.000 1.000 0.200 0.207
Develop Solution C 0.333 0.333 1.000 0.143 Develop Solution C 9.000 5.000 1.000 0.735
C.I. 0.000 1.000 C.I. 0.059 1.000
C.R. 0.000 C.R. 0.101
Company's strategy Sell
Solu
tio
n A
Re-
engi
nee
r
Solu
tio
n B
Dev
elo
p
Solu
tio
n C
Pri
ori
ty
Sustainability Sell
Solu
tio
n A
Re-
engi
nee
r
Solu
tio
n B
Dev
elo
p
Solu
tio
n C
Pri
ori
ty
Sell Solution A 1.000 0.333 0.143 0.088 Sell Solution A 1.000 1.000 1.000 0.333
Re-engineer Solution B 3.000 1.000 0.333 0.243 Re-engineer Solution B 1.000 1.000 1.000 0.333
Develop Solution C 7.000 3.000 1.000 0.669 Develop Solution C 1.000 1.000 1.000 0.333
C.I. 0.004 1.000 C.I. 0.000 1.000
C.R. 0.006 C.R. 0.000

83
The judgements given by each actor are used to determine the ratings of the alternatives against the
sub-criteria defined. The individual ratings are aggregated into a team rating using again a weighted
arithmetic mean. However, in this step of the decision process, the actors have slightly different roles.
Actor 1, from engineering and design, and actor 2, from production, have both a weight of 35%, while
actor 3, from marketing and sales, has a weight of 30%. Figure 4.10 presents the aggregated rating
provided by the team, according to each sub-criteria.
FIGURE 4.10. RATING OF ALTERNATIVES BY THE TEAM.
With the weights defined for the sub-criteria and the ratings of the alternatives for each sub-criteria,
the ranking of the alternatives is immediate. It is a matter of weighting each rating to the weight
defined for the respective sub-criteria. Figure 4.11 presents the resulting ranking of alternatives.
FIGURE 4.11. RANKING OF THE ALTERNATIVES.
The team concluded that developing a new solution is the best of action to take to meet this
customer‘s requirements and fulfil the company‘s criteria.
0% 10% 20% 30% 40% 50% 60% 70%
Market share
Strategic partners
Return on investment
Costs
Customer satisfaction
Product quality
Service quality
Process efficiency
Efficient resource allocation
Time to implement decision
Efforts to implement decision
Company's image
Company's strategy
Sustainability
Ratings of the Alternatives
Sell Solution A
Re-engineer Solution B
Develop Solution C
Sell Solution A34%
Re-engineer Solution B
26%
Develop Solution C
40%
Ranking of the Alternatives

84
4.3. COMBINING AHP AND CBR
This proposed approach combines case-based reasoning and the analytic hierarchy process,
in order to support a team in solving problems that come up in an innovative process, such
as designing a new product. These problems are usually more complex than the ones
related to maintenance in the shop-floor and are also less specific in terms of variables
defined, and therefore require a more elaborated approach. The two methods described in
the previous sections of this chapter, CBR and AHP, will be used to support decision-making
processes.
This thesis proposes CBR to support decision-making in the scope of problem solving, where
the user has access to previous similar situations and tries to adapt one to the current
problem. CBR is highly recommended for well-structured problems and the similarity results
depend highly on the information provided in the cases. For example, a company that has a
repository with problems very well documented with specific variable values (i.e. actual state
items) will obtain better results from CBR than a company that only registers e.g. the product
involved in the problem. The diversity of information is directly related to the detail of the
similarity measure. When the first company obtains a similarity of 100%, it means that the
two problems are exactly the same, i.e. same products with the same measured variables,
and the same involved actor. However, when the second company obtains a similarity of
100% it may just mean that both problems had the same actor and product involved. This is
often not enough to select an appropriate solution and adapt it to the current situation.
Usually, the problems registered in the scope of an innovation process have fewer details
because they relate to products under development that have less possible measures. When
using CBR in an innovation process, the similar problems may just be too general to enable
a selection by the actors involved.
The AHP approach proposed in this thesis is appropriate for complex decision-making
processes that require the analysis of multiple alternatives regarding multiple criteria, and
involving several actors. This is usually the situation of innovation processes in industrial
companies. However, in order to use the AHP approach, actors must start by structuring the
problem in a hierarchy. For this, actors must identify the criteria and all the alternatives. The
methodology presented in this thesis proposes a hierarchy of criteria that actors can use or
adapt. However, in most situations, it might not be easy to identify and describe the
alternatives, from which the choice will be made.
CBR has the bottleneck of providing results that may be too general to be adapted
immediately by the actors, without any additional processing. AHP has the disadvantage of
having to specify the alternatives in the beginning of the process.

85
In order to try to overcome the bottlenecks of each of the methods when dealing with
innovation in industrial environments, this thesis proposes a combination of CBR and AHP,
as presented in Figure 4.12 (Campos and Neves-Silva 2010).
CBR AHP
Problemdefinition
Elicitedsolution
Casesrepository
Problem definitionFound solution
Criteria selection
Ranking of alternatives
SIMILARPROBLEMS GROUPING ALTERNATIVE
SOLUTIONS
FIGURE 4.12. APPROACH COMBINING CBR AND AHP.
If a problem comes up when designing a new product, the team describes the problem,
including identifying the product in the company‘s catalogue and the requirements (actual
state items) to be met. This problem is then compared with previous situations, which are
stored as cases in a repository. The CBR computes similarity between the new problem and
stored cases, producing a list of most similar cases (Campos, Stokic and Neves-Silva 2004).
CBR will only use solved cases for comparison with the current problem. This means that all
the problems identified as similar have one single cause identified as the reason for the
problem. According to the model proposed (see chapter 2 Enterprise model), each cause is
removed by one or a set of actions, pre-defined in the model. Therefore, each similar
problem has one identified cause and a list of actions implemented to eliminate the problem.
The objective of AHP is to support the team of actors in selecting the most appropriate
choice to follow. Therefore, the objective is to identify possible groups of actions as
alternatives to feed to the AHP.
This list of similar problems is processed to identify a set of distinct causes among all the
similar problems. According to the model proposed, each cause has its own list of actions,
i.e. the same action is not applied to two different causes. Identifying distinct causes is
equivalent to identifying distinct set of actions implemented. Each list of actions is an
alternative, including the documentation of the problems where it was used.
The alternatives, i.e. lists of actions, are fed into the AHP. The team of actors selects criteria
to make the decision and judge the alternatives according to the selected criteria. The result
of this process is an ordered ranking of alternatives, considering the opinion of all team
members. The first alternative is considered the best solution for the problem.

86
4.4. ACTOR‘S WEIGHTS ADAPTATION BY MARKET RANKING
FEEDBACK
The work presented in the previous section of this thesis assumes that the success of a
decision results from a deterministic evaluation of the merits of an alternative over a set of
criteria. Based on this, would it be possible to analyse the success of a decision made by a
group of human actors and use it to adapt the weight each actor should represent in future
decisions? This section deals with this research problem. If companies can learn from the
implementation of decisions, they can adapt their decision making process to reinforce the
most successful decisions. More specifically, if a company can identify the actors in a team
that contributed the most for a successful decision, these specific actors could have a more
relevant role in future decisions.
This work proposes a Cartesian approach to the problem where each criterion represents an
orthogonal direction. The orthogonality is not a fundamental condition, but derives from the
assumption that the overall ranking of an alternative , , available for decision results from
the weighted average of the merits in the several different criteria , i.e.
(4.50)
where the weights sum 1. This equation derives directly for each element in the vector
defined in equation (4.49).
4.4.1. THE MARKET
Let us use the term market to represent the final evaluator of the decision‘s merit once
implemented and define
T (4.51)
as the vector of weights that the market will use to evaluate the selected decision. In normal
conditions, these values are unknown to the decision makers.
Additionally, consider a set of available and pre-identified alternatives for
decision and let the matrix
(4.52)

87
represent the values (i.e. measured merits) of the alternatives in the criteria, where is the
value of alternative in criterion . Thus,
T (4.53)
represents the column-vector where is the market value of alternative . Without any
additional criteria, the best decision would be to select for implementation the alternative with
the maximum value, i.e.
A
(4.54)
Again, it is underlined that the decision makers, usually, are not aware of the values of these
quantities. If this reality is known there is no need for any decision making process.
4.4.2. THE DECISION MAKING GROUP
In the scenario of group decision making, several (human) actors are involved
in establishing the importance (i.e. weight) of the criteria and rating the alternatives.
According to their beliefs about the market‘s behaviour, as well as other factors considered
relevant for the success of the decision, each actor indicates their individual weights for the
criteria. A weighting matrix combines all the weights defined by all the actors
(4.55)
where each column of the matrix represents the weights of each actor for all criteria . In any
decision process, it is natural to have deviations among actors regarding the importance of
criteria. These deviations are not only due to misperceptions on market‘s behaviour. The
expertise, background and position of the person in the company affect the opinion of what is
more relevant. In addition, while the CEO of a company always has the ―big picture‖ in mind,
some employees in areas that are more technical or in positions of middle management,
tend to prioritise their departments. For example a person can legitimately try to optimise a
local long-term cost functional not entirely aligned with the global short-term success of the
decision.
Additionally, analogously to what the true market has been modelled to do, the actors
evaluate the merits of each alternative individually for each criterion resulting in a compiled
matrix

88
(4.56)
where is the best estimation of the true rating of alternative in criterion ,
polluted with some measuring deviation . Using (4.55) and (4.56), it is possible to derive
the expected value of each alternative by each actor, given by
(4.57)
where each line represents the expected value of one alternative for the several actors. The
index of the maximum element of each column represents the index of the alternative that
each actor, individually, would select as best. However, the objective is to make a unique
decision and the weighted arithmetic mean is a common approach (Forman and Peniwati
1998). This means that it is possible to compute the group‘s expectation of the alternatives
market value from
(4.58)
where T is the weight of each actor for aggregating , where each element
represents the voting weight of an actor. Alternatively, it is possible to compute the expected
market value from
(4.59)
where
(4.60)
is the group criteria vector. The vector is a column-vector with as many inputs as
alternatives under consideration. Without any additional restriction, the group will select as
best for implementation the alternative with the maximum value, i.e.
A
(4.61)
which could be different from the market‘s best defined by (4.54).
EXAMPLE 4.4: DECISION PROBLEM WITH TWO CRITERIA AND THREE ACTORS
Consider the following decision problem with criteria, , where the market‘s best criteria
weights are given by T .
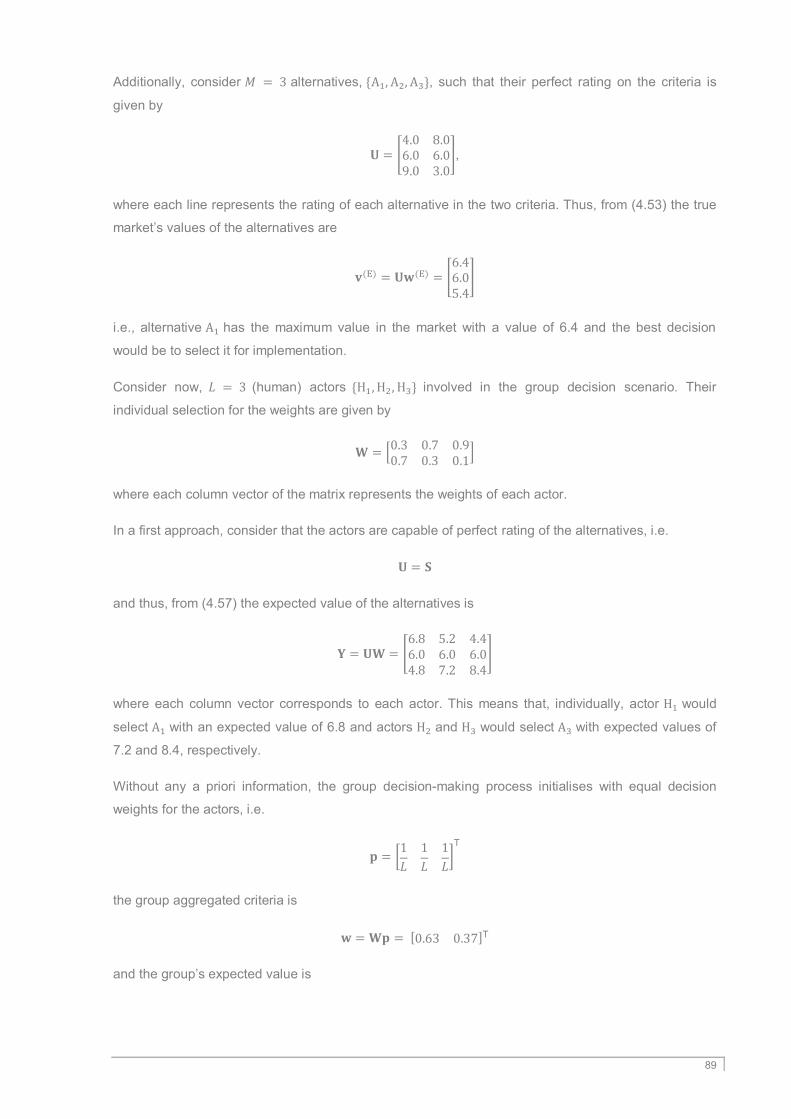
89
Additionally, consider alternatives, , such that their perfect rating on the criteria is
given by
,
where each line represents the rating of each alternative in the two criteria. Thus, from (4.53) the true
market‘s values of the alternatives are
i.e., alternative has the maximum value in the market with a value of 6.4 and the best decision
would be to select it for implementation.
Consider now, (human) actors involved in the group decision scenario. Their
individual selection for the weights are given by
where each column vector of the matrix represents the weights of each actor.
In a first approach, consider that the actors are capable of perfect rating of the alternatives, i.e.
and thus, from (4.57) the expected value of the alternatives is
where each column vector corresponds to each actor. This means that, individually, actor would
select with an expected value of 6.8 and actors and would select with expected values of
7.2 and 8.4, respectively.
Without any a priori information, the group decision-making process initialises with equal decision
weights for the actors, i.e.
T
the group aggregated criteria is
T
and the group‘s expected value is
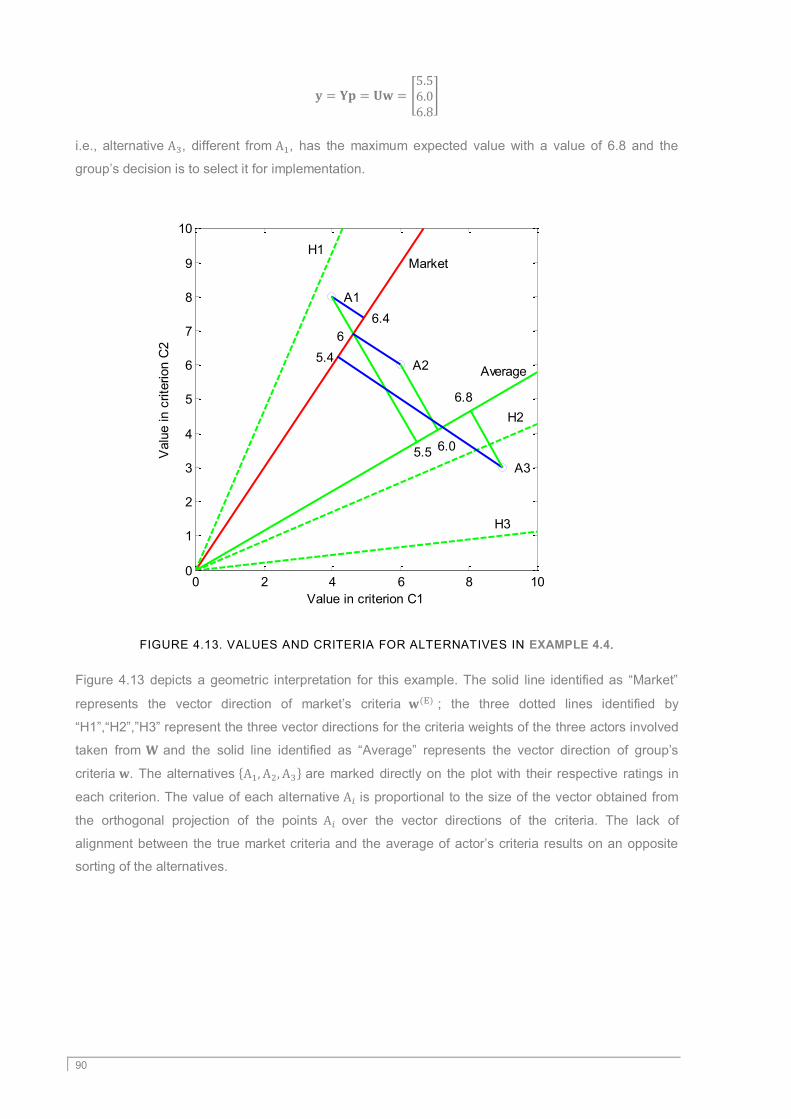
90
i.e., alternative , different from , has the maximum expected value with a value of 6.8 and the
group‘s decision is to select it for implementation.
FIGURE 4.13. VALUES AND CRITERIA FOR ALTERNATIVES IN EXAMPLE 4.4.
Figure 4.13 depicts a geometric interpretation for this example. The solid line identified as ―Market‖
represents the vector direction of market‘s criteria ; the three dotted lines identified by
―H1‖,―H2‖,‖H3‖ represent the three vector directions for the criteria weights of the three actors involved
taken from and the solid line identified as ―Average‖ represents the vector direction of group‘s
criteria . The alternatives are marked directly on the plot with their respective ratings in
each criterion. The value of each alternative is proportional to the size of the vector obtained from
the orthogonal projection of the points over the vector directions of the criteria. The lack of
alignment between the true market criteria and the average of actor‘s criteria results on an opposite
sorting of the alternatives.
0 2 4 6 8 100
1
2
3
4
5
6
7
8
9
10
Market H1
H2
H3
Average
A1
6.4
5.5
A2
6
6.0
A3
5.4
6.8
Value in criterion C1
Valu
e in c
rite
rion C
2
91
4.4.3. FEEDBACK INFORMATION FROM MARKET
As initially formulated, the objective of this development is to incorporate some feedback
from the market to modify the weights each actor should have in the decision making
process.
Assuming that it is possible to measure the success of an implemented decision in the same
referential framework used to support the decision-making process, the problem of adapting
actors‘ weights has to answer the following:
Is there a set of actor‘s weights in the team, such that, in the presence of perfect ranking
capability and noiseless measuring of the true value of the implemented alternative, the
expected value matches exactly the measured one?
The answer to this question can be divided in two parts:
Find the market criteria weights from the provided feedback; and
From the best estimative on the market criteria weights find the adequate
actors‘ weights, .
The first part is equivalent to asking if there is a valid solution for
A (4.62)
Where the alternative , is the implemented one and thus the only source for feedback and
is the unit vector that has unity in its position and zeros elsewhere. Adding the
restriction that the elements of must sum 1, when the number of criteria is larger than
two, (4.62) has infinite solutions. This means that, to estimate a market with N criteria, it is
necessary to have at least independent decision-making processes, i.e. with
different implemented alternatives.
The following example illustrates the determination of for the special case when ,
including a geometric interpretation of the solution.
EXAMPLE 4.5: PROCESSING FEEDBACK FROM MARKET IN DECISION PROBLEM WITH 2
CRITERIA AND 3 ACTORS
Consider again the scenario described in Example 4.4. After the implementation of the decision with
the maximum expected value, i.e. with expected value of 6.8, it was measured the true value of this
alternative, . Then, the estimated market‘s criteria weights are given by the solution of

92
where the first two terms represent the ratings of alternative taken from matrix. Additionally, the
solution is restricted by , i.e. the weights sum 1. Thus, for this example, the estimated
market‘s criteria weights is the solution of
which is
T
FIGURE 4.14. VALUES AND CRITERIA FOR ALTERNATIVES IN EXAMPLE 4.5.
Figure 4.14 depicts a geometric interpretation of this solution. The dotted curve (in green) represents
the projection of alternative over all possible values for weights given by the group of actors. In
particular, this curve passes in the individual criteria values (rankings 3.0 and 9.0) on the point itself
and on the selected decision. The solid curve (in red) represents the geometric place of all alternatives
that are valued 5.4 over all possible values for weights given by the group of actors. In particular, this
curve passes in the pairs and ; and in the projection of over the market‘s direction.
These two curves intercept in the direction given by the markets, i.e. providing the solution for the best
criteria weights.
The second part of determining the actors‘ weights is about the capability of the actors‘
directions, as vectors, to compose the market direction (i.e. market‘s criteria weights). In
0 2 4 6 8 100
1
2
3
4
5
6
7
8
9
10
Market
Average
A3
5.4
6.8
Value in criterion C1
Valu
e in c
rite
rion C
2

93
normal conditions, this would result simply in a requirement for orthogonality, such that a
minimum set of actors be a basis, in the mathematical sense. However, it is necessary to
introduce the additional restriction that none of the actors have negative weights, which
directly implies that none of the actors will have a weight larger than 1.
The determination of the actors‘ weights is equivalent to ask if there is a valid solution for
(4.63)
under the restriction that all elements of
T respect
(4.64)
where is the estimative obtained, if possible, from (4.62). The solution of (4.63)-(4.64)
depends on the relation between the number of actors and the number of criteria.
Case 1: the number of actors equals the number of criteria , i.e. .
This case is straightforward and the solution of (4.63) exists if is non-singular. In that case,
the solution is given by
(4.65)
If the solution verifies (4.64), it is taken as valid; if not, no solution exists. The singularity
condition means that all actors‘ opinions are relevant regarding the criteria‘s weights.
Case 2: the number of actors is larger than the number of criteria , i.e. .
Now, the number of unknown variables – the actors‘ weights – is larger than the number of
equations. Then, the solution set has infinite elements. In fact, for this case there are
actors that can be stated as irrelevant if the remaining are enough to build up a Case 1
scenario with a valid solution.
However, it is interesting, at this point, to introduce some additional limitations to narrow the
infinite set of solutions without discarding the participation of some of the actors. This will be
of particular interest in the presence of ranking and measuring uncertainty. For selection
strategy, it is important to consider the participation of all actors to be as large as possible.
Then the problem is an optimisation problem finding
(4.66)
under the restrictions given by (4.63)-(4.64).
The following example illustrates the characterisation of this solution.

94
EXAMPLE 4.6: DETERMINING BEST WEIGHTS FOR THREE ACTORS FROM MARKET
FEEDBACK IN DECISION PROBLEM WITH TWO CRITERIA
Using the scenario extended in Example 4.5, consider now – under the assumption of deterministic
ranking and market‘s value measure – the determination of the best weights for the actors using the
knowledge of . The problem is rather straightforward as one intends that the weighted average of
the actors‘ criteria result in the market‘s criteria. This is
i.e. for this example
which does not have a unique solution due to the existence of more actors than criteria. A possible
solution can be selected as
T
ignoring the contribution of actor .
Alternatively, using the proposed strategy of maximising the minimum contribution of all actors
described by (4.66), it is possible to obtain the solution by numerical methods, yielding
T
FIGURE 4.15. ACTORS‘ WEIGHTS IN EXAMPLE 4.6.
0 0.1 0.2 0.3 0.4 0.5 0.6 0.7 0.8 0.9 10
0.1
0.2
0.3
0.4
0.5
0.6
0.7
0.8
0.9
1
p1
pi,
min
{pi}
p1
p2
p3
min{ pi }

95
Figure 4.15 depicts the solution space for this example and presents the solution of the maximisation
problem.
At this point, one question arises. If it is possible to estimate directly the market‘s criteria,
what is the point in representing these as actors‘ weights? The ultimate goal is to find out the
criteria to use in the decision process and the market‘s criteria would work perfectly if it is
known. The answer, according with the strategy here proposed, is that the actors as
intelligent entities, with different levels and directions of polarisation, have a cognitive
perception of the market‘s behaviour, including perception on the trends under varying
conditions. The goal of the proposed algorithm is to take advantage of that perception
capability and filter out the polarisations by weighted averaging of the opinions expressed.
Case 3: the number of actors is less than the number of criteria , i.e. .
In a real case complex scenario, this case should be the most common one, having several
aspects under evaluation (i.e. criteria) and a group of experts from the several departments
involved in the decision-making problem.
Now, (4.63) has more equations that unknown variables and, unless some of the equations
are not independent, there will be no direct solution. Let be the subspace generated by the
span of columns. In vector space terms, this means that the space generated by the
individual criteria (i.e. the column-vectors of ) of the actors is not sufficient to cover all
possible market criteria , which ultimately could be . The best it can be done is to look
for the vector in that most approximates , which is the same as the orthogonal
projection of in . In line with this proposal, a least square approach to (4.63) yields the
solution
T (4.67)
if the columns of are linearly independent. The last independency condition just means
that the actors have to think differently about the criteria weights, which is a basic
assumption for the approach.
The following example illustrates the characterisation of this solution.
EXAMPLE 4.7: DECISION PROBLEM WITH THREE CRITERIA AND TWO ACTORS
Consider the following decision problem with criteria, , where the market‘s best
criteria weights are given by
T
96
Additionally, consider alternatives, , such that their perfect rating on the criteria is given
by
where each line represents the ratings of each alternative in the 3 criteria. Thus, from (4.53), the true
market‘s values of the alternatives are
i.e., alternative has the maximum value in the market with a value of 5.0 and the best decision
would be to select it for implementation.
Consider now, (human) actors, , involved in the group decision scenario. Their individual
selection for the weights are given by
where each column vector of the matrix represents the weights of each actor summing 1.
Again, consider that the actors are capable of perfect rating of the alternatives, i.e.
and thus, from (4.57) the expected value of the alternatives is
where each column vector corresponds to each actor. This means that, individually, actor would
select with an expected value of 5.0 and actor would select with an expected value of 6.3.
Without any a priori information, the group decision-making process initialises with equal decision
weights for the actors, i.e.
T
the group aggregated criteria is
T
and the group‘s expected value is
i.e., alternative , different from , has the maximum expected value with a value of 5.10 and the
group‘s decision is to select it for implementation.

97
FIGURE 4.16. VALUES AND CRITERIA FOR ALTERNATIVES IN EXAMPLE 4.7.
Figure 4.16 depicts a geometric interpretation for this example. The solid (red) line identified as
―Market‖ represents the vector direction of market‘s criteria ; the two dotted lines identified by
―H1‖,―H2‖ represent the two vector directions for the criteria weights of the two actors involved taken
from and the solid (green) line identified as ―Average‖ represents the vector direction of group‘s
criteria . The alternatives are marked directly on the plot with their respective ratings in each
criterion. The value of each Alternative is proportional to the size of the vector obtained from the
orthogonal projection of the points over the vector directions of the criteria. The lack of alignment
between the true market criteria and the average of actor‘s criteria results on an opposite sorting of the
alternatives.
Additionally, after estimating the market criteria using (4.62), the solution (4.67) yields
T
The group criteria weights are now given by
T
0
2
4
6
8
10
0
2
4
6
8
10
0
2
4
6
8
10
H2
A2
Value in criterion C2
3.80
3.85
5.10
5.00
H1
A1
Value in criterion C1
Valu
e in c
rite
rion C
3
Average
Market
w

98
which is the orthogonal projection of the market criteria vector in the linear span of the column-vectors
of and represented in Figure 4.16 with a solid (blue) line marked .
To finish the example, it is important to verify which alternative would be selected using these actors‘
weights. Now, the group‘s expected value is
and alternative has the maximum expected value with a value of 4.39 and the group‘s decision
would be to select it for implementation. This final part is not represented in Figure 4.16 for the sake of
simplicity.
4.4.4. EXAMPLES WITH RANKING UNCERTAINTY
The proposed approach presented in this chapter considers the complete decision-making
process under noisy rating by human actors. However, despite this, the four examples
presented in the previous sections were built with the assumption
The following examples repeat Example 4.4 to Example 4.7 in the presence of ranking
uncertainty.
EXAMPLE 4.8: DECISION PROBLEM WITH TWO CRITERIA AND THREE ACTORS, UNDER
UNCERTAINTY
Consider again the scenario described in Example 4.4 where the market‘s best criteria weights were
given by
T
and the alternatives , with true market‘s ranking on the criteria given by
Consider the (human) actors involved in the group decision scenario with the same
individual weights
T

99
Now, the actors are rating the alternatives with an error, in the example
and thus the expected value of the alternatives is
again, where each column vector corresponds to each actor. This means that, individually, actor
would select with an expected value of 6.93 and actors and would select with expected
values of 6.78 and 8.11, respectively.
As in Example 4.4, without any a priori information, the group decision making process initialises with
equal decision weights for the actors, the group aggregated criteria is (again)
T
and the group‘s expected value is
i.e., alternative has the maximum expected value with a value of 6.34 and the group‘s decision is to
select it for implementation.
FIGURE 4.17. VALUES AND CRITERIA FOR ALTERNATIVES IN EXAMPLE 4.8.
0 2 4 6 8 100
1
2
3
4
5
6
7
8
9
10
Market
H1
H2
H3
Average
A1
6.4
5.68
A2
6
6.30
A3
5.4
6.34
Value in criterion C1
Valu
e in c
rite
rion C
2

100
Figure 4.17 depicts the geometric interpretation for this example and it is directly compared with Figure
4.13. The alternatives are marked directly on the plot with their respective true ratings in
each criterion – marked with circles – and their ranking evaluated by the group of actors – marked with
squares.
EXAMPLE 4.9: PROCESSING FEEDBACK FROM MARKET IN DECISION PROBLEM WITH
TWO CRITERIA AND THREE ACTORS, UNDER UNCERTAINTY
Following the previous example, after the implementation of the decision with the maximum expected
value, i.e. with expected value of 6.34, the estimated market‘s criteria weights are given by the
solution of
where the true value of this alternative is still . Thus, for this example, the estimated market‘s
criteria weights is the solution of
which is
T
FIGURE 4.18. VALUES AND CRITERIA FOR ALTERNATIVES IN EXAMPLE 4.9.
0 2 4 6 8 100
1
2
3
4
5
6
7
8
9
10
Market
M.Estimation
Average
A3
5.4
6.3
Value in criterion C1
Valu
e in c
rite
rion C
2
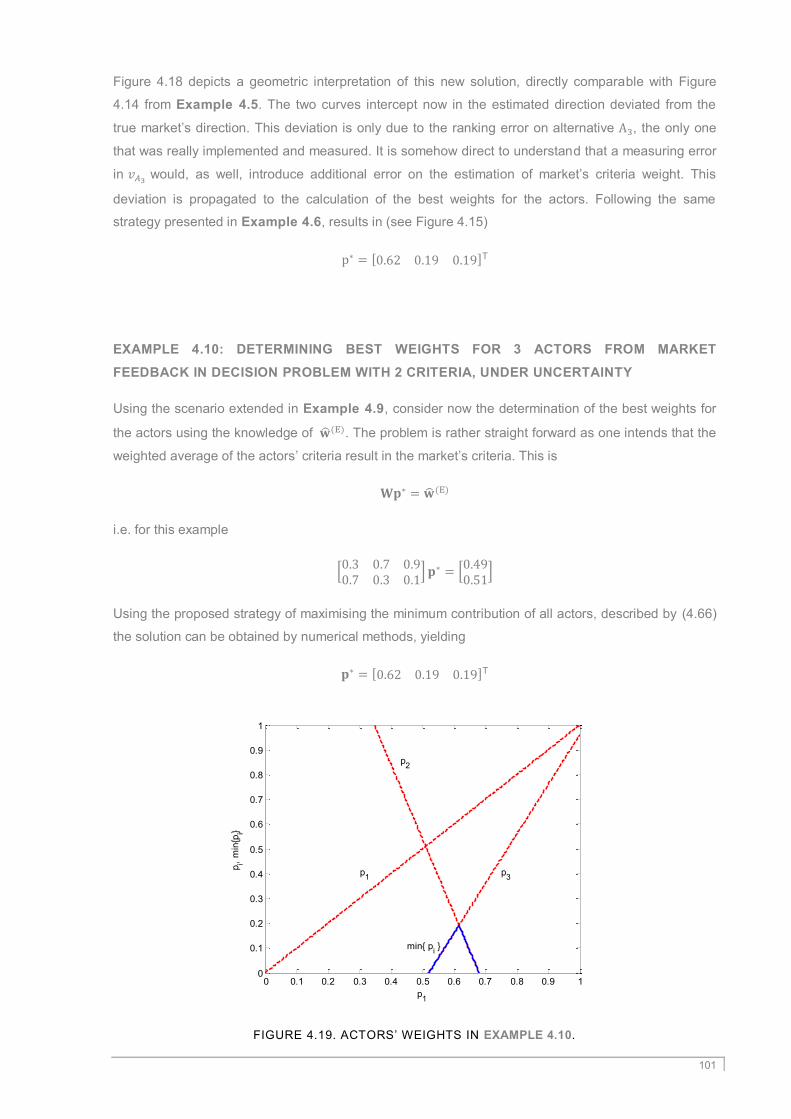
101
Figure 4.18 depicts a geometric interpretation of this new solution, directly comparable with Figure
4.14 from Example 4.5. The two curves intercept now in the estimated direction deviated from the
true market‘s direction. This deviation is only due to the ranking error on alternative , the only one
that was really implemented and measured. It is somehow direct to understand that a measuring error
in would, as well, introduce additional error on the estimation of market‘s criteria weight. This
deviation is propagated to the calculation of the best weights for the actors. Following the same
strategy presented in Example 4.6, results in (see Figure 4.15)
T
EXAMPLE 4.10: DETERMINING BEST WEIGHTS FOR 3 ACTORS FROM MARKET
FEEDBACK IN DECISION PROBLEM WITH 2 CRITERIA, UNDER UNCERTAINTY
Using the scenario extended in Example 4.9, consider now the determination of the best weights for
the actors using the knowledge of . The problem is rather straight forward as one intends that the
weighted average of the actors‘ criteria result in the market‘s criteria. This is
i.e. for this example
Using the proposed strategy of maximising the minimum contribution of all actors, described by (4.66)
the solution can be obtained by numerical methods, yielding
T
FIGURE 4.19. ACTORS‘ WEIGHTS IN EXAMPLE 4.10.
0 0.1 0.2 0.3 0.4 0.5 0.6 0.7 0.8 0.9 10
0.1
0.2
0.3
0.4
0.5
0.6
0.7
0.8
0.9
1
p1
pi,
min
{pi}
p1
p2
p3
min{ pi }

102
Figure 4.19 depicts the solution space for this example and presents the solution of the maximisation
problem.
EXAMPLE 4.11: DECISION PROBLEM WITH THREE CRITERIA AND TWO ACTORS, UNDER
UNCERTAINTY
Following Example 4.7, consider again the decision problem with criteria where the
market‘s best criteria weights are given by
T
Additionally, consider alternatives , such that their perfect rating on the criteria is given
by
where each line represents the rating of each alternative in the 3 criteria. Thus, from (4.53), the true
market‘s values of the alternatives are
i.e., alternative has the maximum value in the market with a value of 5.0 and the best decision
would be to select it for implementation.
Consider now, (human) actors involved in the group decision scenario. Their individual
selection for the weights are given by
where each column vector of the matrix represents the weights of each actor summing 1.
Now, the actors are ranking the alternatives with an error, in the example
and thus the expected value of the alternatives is
where each column vector corresponds to each actor. This means that, individually, actor would
select with an expected value of 5.30 and actor would select with an expected value of 6.15.
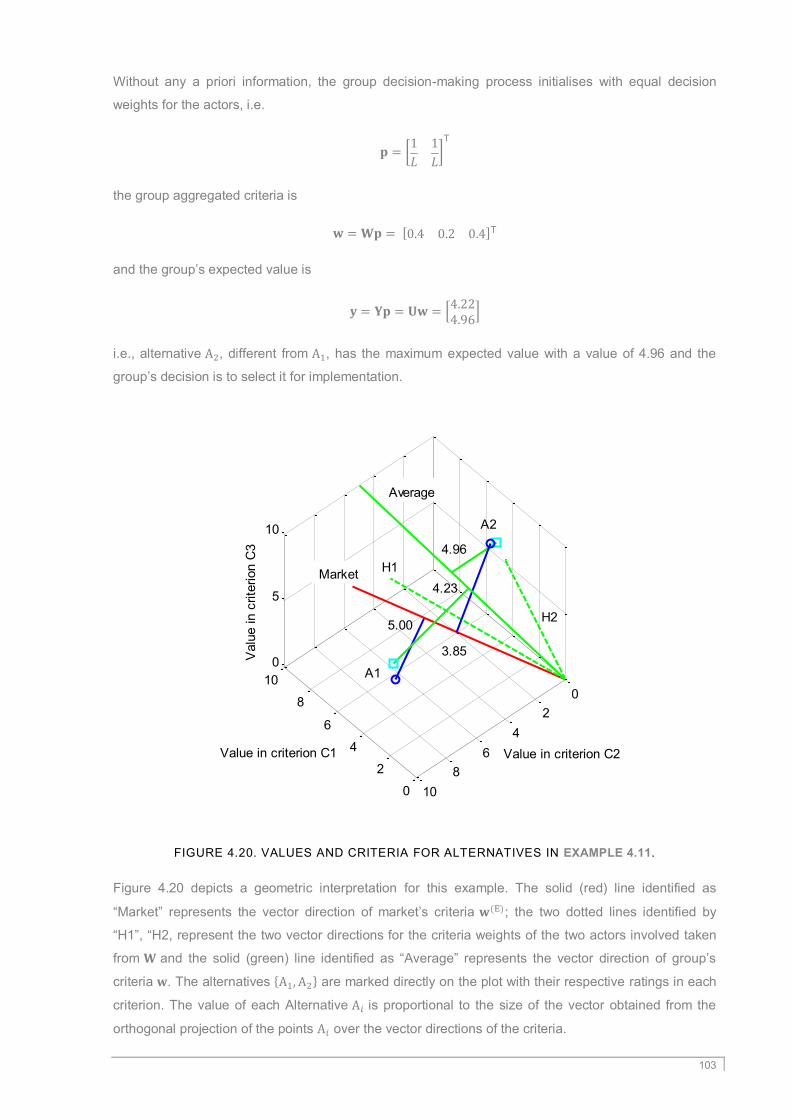
103
Without any a priori information, the group decision-making process initialises with equal decision
weights for the actors, i.e.
T
the group aggregated criteria is
T
and the group‘s expected value is
i.e., alternative , different from , has the maximum expected value with a value of 4.96 and the
group‘s decision is to select it for implementation.
FIGURE 4.20. VALUES AND CRITERIA FOR ALTERNATIVES IN EXAMPLE 4.11.
Figure 4.20 depicts a geometric interpretation for this example. The solid (red) line identified as
―Market‖ represents the vector direction of market‘s criteria ; the two dotted lines identified by
―H1‖, ―H2, represent the two vector directions for the criteria weights of the two actors involved taken
from and the solid (green) line identified as ―Average‖ represents the vector direction of group‘s
criteria . The alternatives are marked directly on the plot with their respective ratings in each
criterion. The value of each Alternative is proportional to the size of the vector obtained from the
orthogonal projection of the points over the vector directions of the criteria.
0
2
4
6
8
100
2
4
6
8
10
0
5
10
H2
Value in criterion C2
A2
3.85
4.96
4.23
5.00
H1
A1
Value in criterion C1
Valu
e in c
rite
rion C
3
Average
Market

104
4.4.5. ADAPTIVE ACTORS‘ WEIGHTS FROM MARKET FEEDBACK
The final purpose of this methodology is to use all information available from past decisions
to select the best weights for the actors in the group decision-making process. The previous
sections have demonstrated that, in the presence of uncertainty, the estimations for market
criteria become deviated from the true value. It is proposed to use a learning mechanism
based on recursive least squares (RLS) to continuously refine the weights of the actors.
Thus, consider again the model (4.53)
This gives the estimation model
T
where
is the output with the measured market value of the implemented decision and
is the data vector with the ranking of that alternative in the several criteria, both at decision
process . The vector is the best estimation of the true market criteria at the decision
process .
The adaptation algorithm iterates at each decision process as follows.
Algorithm for adaptation of actor’s weights based on market feedback
1. Initialise vector with the best estimation for criteria. This can be directly
derived from (4.60) and equal weights for all actors, i.e.
T
Additionally, initialise the covariance matrix with
where is a constant with a high value.
2. At each implemented decision process iterate the following equations:
T

105
T
T
where is the forgetting factor.
3. Perform normalisation on such that its elements sum up 1.
4. Use the current estimation of the market criteria to update the actors‘ weights
according to the feedback methods (4.65)-(4.67) for the specific situation.
As long as the observations and estimation noise are uncorrelated, the estimative will
converge to the optimal weights. In fact, the error in estimation of the value of the alternatives
is independent of the measuring error on the true value of the implemented decision.
The following example illustrate the convergence properties of the proposed algorithm.
EXAMPLE 4.12: ADAPTING ACTORS’ WEIGHTS FROM MARKET FEEDBACK
Consider again the decision problem of Example 4.11 with criteria where the
market‘s best criteria weights are given by
T
Additionally, consider sets of alternatives , such that their perfect rating on the criteria is
given by a random with inputs in the interval . Thus, from (4.53), the true market‘s values of
the alternatives are and different for each decision process.
As in the previous example, consider (human) actors involved in the group decision
scenario. Their individual selection for the criteria weights are given by
where each column vector of the matrix represents the weights of each actor summing 1.
The actors are rating the alternatives with an error , where is the Gaussian
matrix where each element has zero mean and 0.25 variance. Thus, the expected value of the
alternatives is .
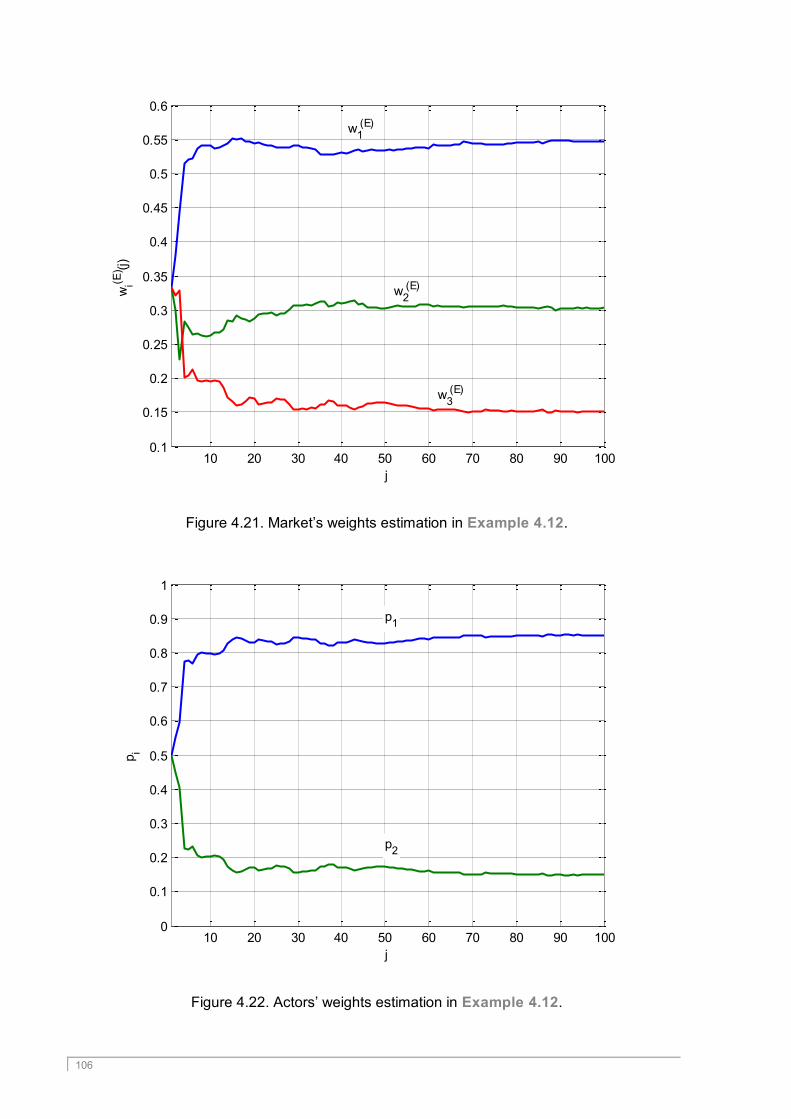
106
Figure 4.21. Market‘s weights estimation in Example 4.12.
Figure 4.22. Actors‘ weights estimation in Example 4.12.
10 20 30 40 50 60 70 80 90 1000.1
0.15
0.2
0.25
0.3
0.35
0.4
0.45
0.5
0.55
0.6
j
wi (
E) (j
)
w2 (E)
w3 (E)
w1 (E)
10 20 30 40 50 60 70 80 90 1000
0.1
0.2
0.3
0.4
0.5
0.6
0.7
0.8
0.9
1
j
pi
p1
p2

107
Figure 4.21 and Figure 4.22 depict the evolution of the inputs of vectors and with iteration
time , respectively. The final values of this simulation match the market weights of 0.55, 0.30 and
0.15. Additionally, the majority of the convergence happens in the first 10 iterations. The final values of
the actors‘ weights of 0.85 and 0.15 in are in accordance with equation (4.67). For this simulation,
the introduction of the feedback and adaptive adjustment of the weights lowered the rate of wrong
decisions from 20% to 10%.
4.5. REMARKS
This chapter presented three approaches to support decision-making situations in industrial
environments. These approaches use two well-known methods, CBR and AHP, and their
respective combination. The chapter highlights that while CBR is suitable for problem solving
applications, especially of routine problems, AHP and the combination of CBR and AHP are
especially suited to support decisions in the scope of innovation processes. The decisions
made in these situations tend do be more complex and involve larger and more diverse
teams.
This chapter also proposes an algorithm to adjust the weights of each actor in the decision
team based on information about the decision implementation. The objective is to use
decision follow-up information to adjust the role of actors in decision-making situations.

109
5. CASE STUDIES
In the scope of several research projects, it was possible to implement and test some of the
work presented in the previous chapters of this thesis. The work related to the enterprise
model, presented in chapter 2 Enterprise model, started in the scope of manufacturing
companies, and has expanded to other industrial areas. Therefore, this section presents
seven test cases where the proposed model has been successfully applied, always with the
purpose of supporting decisions, particularly problem solving applications. In addition, the
decision support methods proposed in this work, namely case-based reasoning, analytic
hierarchy process and the combination of the two, were applied in some of the test cases.
According to this, the results have been validated in two manufacturing companies, two
assembling companies, two engineering services companies and one software company.
The objective of this section is to highlight the wide application of the proposed model,
describing possible interpretations of the classes introduced and the successful use of the
decision support approach in industrial companies.
5.1. MANUFACTURING COMPANIES
Two large manufacturing companies were modelled following the approach proposed, with
the objective of supporting a problem-solving scenario.
The first company is a well-known manufacturer of high-quality vehicles that uses advanced
manufacturing technology to maintain their market position. The company wanted to improve
its problem solving approach in the shop floor, by reducing the time needed to diagnose and
eliminate a problem. In addition, the manufacturer was also interested in improving the
exchange of knowledge, by improving the methods for knowledge acquisition and storage.
This last objective would be valuable for training employees, particularly newcomers.
This company tested the proposed enterprise model and the case-based reasoning
approach. As the company has many manufacturing plants, with considerable dimensions, it
was necessary to define a limited scope to enable the success of the testing procedure. The
company chose to validate the approach in a part of one of its manufacturing plants,
dedicated to the production of rear axles for cars. This area was selected because of its high
complexity and high level of automation, which allowed some automatic collection of dynamic

110
information and a high impact in problem solving (if successful). The rear axle of a car is
composed of many small parts and it takes 38 welding cells, 62 welding robots and 14
handling robots to manufacture it (Fischer and Stokic 2002). Each welding cell contains
fixture devices that develop the axle progressively. All the cells, robots and fixture devices
are controlled by a Programmable Logic Controller (PLC), as represented in Figure 5.1.
FIGURE 5.1. MANUFACTURING PLANT OF A REAR AXLE.
Prior to these tests, the company stored the outputs from the PLC, without any thorough
analysis. These reports were only used by employees, who examined them and mainly
talked to each other to try to solve any problem in the shop-floor. The company wanted to
store any occurred problems, comprehending a description of what happened, what was
measured, what was the cause diagnosed, and what was done to remove it. This approach
would allow any employee to quickly see a past problem that could support in solving a
current situation.
The model developed includes a detailed description of the manufacturing processes, the
tools and machines used and all the parts produced until the final product, in this case the
rear axle, was complete. In addition, the model included the actors involved in each of the
processes, and their respective expertise in terms of technologies used in the processes.
Each physical element (process, part and machine) was described in detail, including a list of
all variables that can be measured, where most of them could be obtained from the PLC.
Moreover, the company identified a set of typical problems that could be used as categories,
to list as problem types. Finally, the model included the causes of the typical problems, and
also the actions implemented to remove those causes. The modelling process was led by the
process engineering department of the company, which is responsible, among other tasks,
for continuous improvement in the company.
Figure 5.2 and Figure 5.3 show some examples of production units and states defined in the
model of this manufacturing company.

111
FIGURE 5.2. PRODUCTION UNITS OF MANUFACTURING COMPANY 1.
FIGURE 5.3. STATES OF MANUFACTURING COMPANY 1.
The resulting model was quite complex in amount of instances and especially interactions
among them, but provided a straightforward application of the enterprise model proposed.
After the described definition of the static model, the company was ready to start registering
problems.
The person responsible for the modelling process in this company identified the model to be
a significant result. Having only one knowledge base with a detailed description of all
processes, machines, products, people and problems of a part of the manufacturing plant
was something non-existent. Before this implementation, information was widespread
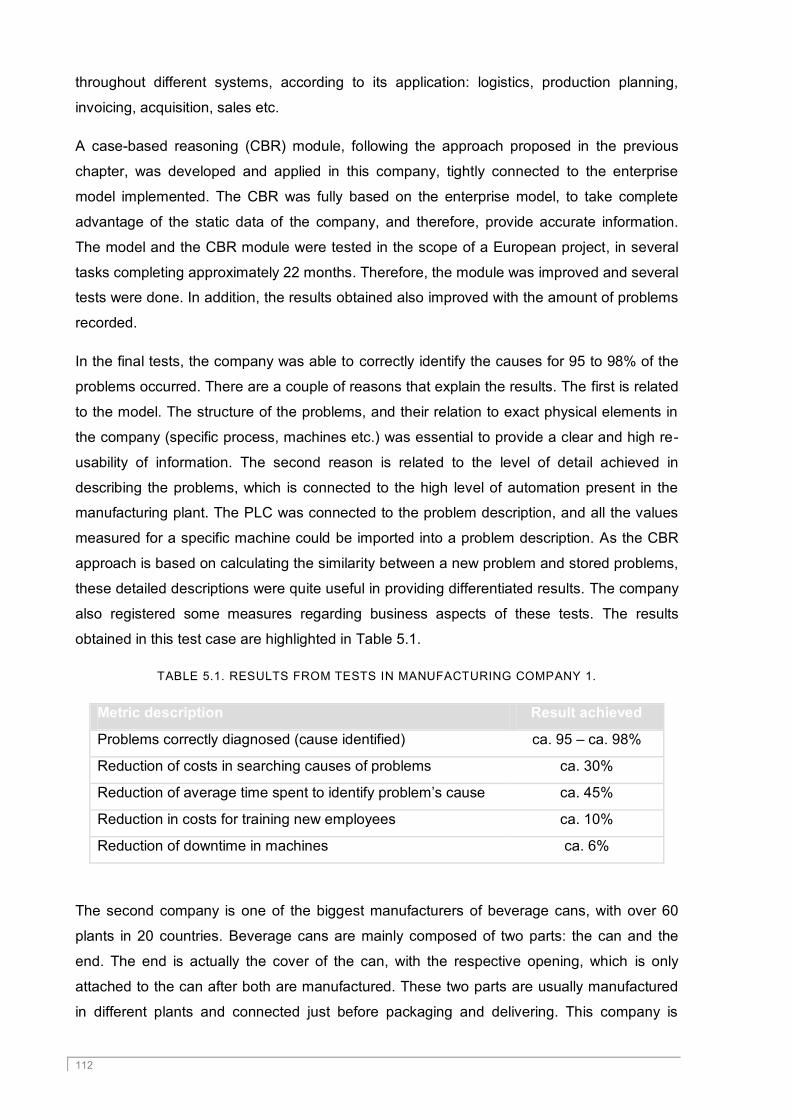
112
throughout different systems, according to its application: logistics, production planning,
invoicing, acquisition, sales etc.
A case-based reasoning (CBR) module, following the approach proposed in the previous
chapter, was developed and applied in this company, tightly connected to the enterprise
model implemented. The CBR was fully based on the enterprise model, to take complete
advantage of the static data of the company, and therefore, provide accurate information.
The model and the CBR module were tested in the scope of a European project, in several
tasks completing approximately 22 months. Therefore, the module was improved and several
tests were done. In addition, the results obtained also improved with the amount of problems
recorded.
In the final tests, the company was able to correctly identify the causes for 95 to 98% of the
problems occurred. There are a couple of reasons that explain the results. The first is related
to the model. The structure of the problems, and their relation to exact physical elements in
the company (specific process, machines etc.) was essential to provide a clear and high re-
usability of information. The second reason is related to the level of detail achieved in
describing the problems, which is connected to the high level of automation present in the
manufacturing plant. The PLC was connected to the problem description, and all the values
measured for a specific machine could be imported into a problem description. As the CBR
approach is based on calculating the similarity between a new problem and stored problems,
these detailed descriptions were quite useful in providing differentiated results. The company
also registered some measures regarding business aspects of these tests. The results
obtained in this test case are highlighted in Table 5.1.
TABLE 5.1. RESULTS FROM TESTS IN MANUFACTURING COMPANY 1.
Metric description Result achieved
Problems correctly diagnosed (cause identified) ca. 95 – ca. 98%
Reduction of costs in searching causes of problems ca. 30%
Reduction of average time spent to identify problem‘s cause ca. 45%
Reduction in costs for training new employees ca. 10%
Reduction of downtime in machines ca. 6%
The second company is one of the biggest manufacturers of beverage cans, with over 60
plants in 20 countries. Beverage cans are mainly composed of two parts: the can and the
end. The end is actually the cover of the can, with the respective opening, which is only
attached to the can after both are manufactured. These two parts are usually manufactured
in different plants and connected just before packaging and delivering. This company is

113
characterised by high automation manufacturing processes and an extremely high
production volume. In Germany alone, four plants produce 4 billion cans per year, and an
additional plant produces 6 billion ends per year. The company wanted to provide the highest
production availability and continuously improve its manufacturing processes. The company
has several ICT systems, which are not integrated, and produce results that have to be
analysed by managers in time-consuming meetings. In addition, prior to these tests, the
company had some paper-based records of problems, which were not related to any
machine data. There was also an identified issue of problems arising in the beginning of a
shift, due to lack of communication between shifts.
The company chose a specific part of the can manufacturing process to test the proposed
approach. The production of a can starts with cutting tin plate to form small cups, which are
then stretched and ironed until they form a cylinder with the height of the desired can. These
cylinders are washed, coated and dried. However, a can is not a perfect cylinder. Therefore,
the top part of the cylinder needs to be adjusted to its final form, before adding the end, or
top. The process of reducing the upper section of the can, called necking, is performed in
fifteen consecutive stations, where each reduces the diameter of the can by one millimetre.
One the desired diameter is reached, it is necessary to create a flange to seal the filled can
securely to its end. The fifteen stations of necking and the flanging are all done in one very
complex machine called the Necker, which processes 2400 cans per minute. After the
Necker, there is a compartment with a camera to test the cans and provide information about
each piece (see Figure 5.4). The Necker was the main focus of the tests performed, because
it is responsible for 25% of the scrap of the whole production.
FIGURE 5.4. PROCESS OF NECKING AND TESTING CANS.

114
The enterprise model developed includes the complete manufacturing plant for cans, with the
process steps, production units and product parts. The production units are the most
important element of the model, and represented with more detail. The manufacturing plant
modelled has two lines to produce cans, and all its machines were modelled. The product
parts were represented in a generalised form, e.g. cup or necked can, without specific
instances. With the objective of applying a CBR approach to problem solving, based on
comparison with past problems, the company did not emphasise modelling the human
actors. Employees are users of the supporting system but not a key element in the model.
The information provided by the testing system following the Necker provides important
measures about the cans, modelled as state items.
After defining all the static part of the model, the company invested some time in registering
problems occurred, which existed in paper-form. This registration of problems allowed
starting using the system with a collection of problem cases, enabling from the beginning
appropriate results from the CBR. The test of the system over a period of 21 months allowed
improving the knowledge base, increasing the number of cases, and therefore advancing the
results obtained.
Figure 5.5 shows a list of examples of the problems diagnosed with the approach tested and
Figure 5.6 details the registration of one problem occurred in the manufacturing shop floor.
FIGURE 5.5. EXAMPLES OF PROBLEMS IN MANUFACTURING COMPANY 2.

115
FIGURE 5.6. DETAILS OF A PROBLEM‘S DESCRIPTION.
The enterprise model of this company is, similarly to the first manufacturing company, a
direct application of the model proposed in chapter 2 Enterprise model. The results achieved
in this test case are summarised in Table 5.2.
TABLE 5.2. RESULTS FROM TESTS IN MANUFACTURING COMPANY 2.
Metric description Result achieved
Problems correctly diagnosed (cause identified) ca. 90 – ca. 95%
Reduction of costs in searching causes of problems ca. 25%
Reduction of average time spent to identify problem‘s cause ca. 35%
Reduction of waste associated with problems ca. 10%
5.2. ASSEMBLING COMPANIES
Two assembling companies were also involved in testing the proposed approach. These two
applications have similarities with the manufacturing companies, but also some differences,
caused by the low-level of automation in the companies.
The first assembling company develops, produces and supports military aircrafts. The
company has more than fifty years of experience in assembling aircraft structures and
systems. This experience has developed in the company expertise in dealing with a large
numbers of components and the associated tolerance problems it brings. The company was
producing a multi-role fighter aircraft which uses state-of-the-art technology. This single-seat
fighter is capable of performing an extensive range of Air-to-Air, Air-to-Surface and
reconnaissance missions employing the most modern range of weapons. The company

116
aimed at meeting the demands of current and future warfare threats, while at the same time
meeting strict requirements for flight safety, reliability, training efficiency and low operating
costs. Although the product in question is of undeniable complexity, the production process
was mainly manual, i.e. assembling, performed by highly specialised and skilled workers, as
presented in Figure 5.7.
FIGURE 5.7. ASSEMBLING PLANT OF A FIGTHER AIRCRAFT.
The department involved in modelling this enterprise is directly responsible for process
improvements and quality in the plant. Especially in the area of fuselage assembly, there are
needs to establish a system that enables integrating knowledge from different departments in
order to efficiently perform changes in the products and processes and increase productivity
and quality within the transition phase (after product changes). This company wanted to
decrease the problems occurred in the assembling processes and whenever possible access
problems occurred in similar processes, even if already discontinued.
This test case involved mainly the assembly company, with little use of the extended
enterprise. As most of the processes are based on assembling, the company does not use
complex machines in its plant. Therefore, the model focused much more on process steps,
i.e. the assembling activities, and on the product parts used as input and output. The object
production unit received very little attention in this test case, due to its low relevance in the
problems occurred. On the other hand, the employees and their respective expertise were of
key importance in this company. The human actors are the ones fully reporting and solving
problems.
This test case used the enterprise model combined with a case-based reasoning module to
support problem solving. The main objective was to increasingly acquire and register some
of the implicit knowledge used daily by the employees to solve problems.

117
This company had an approach to register, in paper, problems occurred. These problems
were described by one employee, diagnosed and solve by the same person or a colleague,
and checked by someone in the quality department. The paper forms included some textual
description of the problem, cause and actions, but especially timestamps of each phase and
the person responsible for each step. Accountability is a key issue for companies, especially
when dealing with very sensitive products, as is this case. It was possible to translate these
paper records in problem descriptions, ready to be used by the CBR module. This process
required a joint effort with the company‘s quality staff. Table 5.3 lists some examples of the
problems registered using the software tested and solved with the approach proposed.
TABLE 5.3. EXAMPLES OF PROBLEMS IN ASSEMBLING COMPANY 1.
Problem description Problem type Product Part Process
Step
Cause
Part cannot be mounted Operator Wing Assembly Lack of a part
Collision between
parts/tools
Operator Cockpit Assembly Distance
between parts
incorrect
Part cannot be mounted Operator Cockpit Assembly Part damaged
Part cannot be mounted Operator Wing Assembly Part produced
faulty
Fuel leak Test & function Fuel system Final
inspection
Fuel system
faulty
Electrical problem Cleaning Cockpit Final
inspection
Dirt and debris
found
The CBR module, combined with the enterprise model, enabled the correct diagnosis of
around 50% of the problems occurred. This number is considerable lower than the one
registered in the manufacturing companies. The main reason for this is the lack of
automation in the shop-floor of this assembling company, while in the manufacturing
companies the detailed definition of almost all variables is enabled by all machines involved
in any problem. In this test case, any measurements are based on what employees can
register, which happens usually running some diagnosis software after the problem has
occurred. Sometimes, it is difficult to identify if the measures belong to the current problem or
a previous one. The CBR approach does not take full advantage of the implicit expertise of
human actors, which was extremely important in this test case. Therefore, the diagnostics
tool was complemented with a rule-based reasoning (RBR) module (Campos, Stokic and
Neves-Silva 2004). The company‘s employees have invaluable years of experience and

118
know that when something happens it is usually because of a finite number of options. The
use of both reasoning methods raised the number of problems diagnosed to 90%. The tests
performed involved several incremental versions of the modules, and occurred during a
period of 22 months. The results achieved in this test case (using CBR and RBR) are
presented in Table 5.4.
TABLE 5.4. RESULTS FROM TESTS IN ASSEMBLING COMPANY 1.
Metric description Result achieved
Problems correctly diagnosed (cause identified) ca. 90%
Amount of problems diagnosed with the approach tested ca. 85%
Reduction of costs in searching causes of problems ca. 27%
Reduction of average time spent to identify problem‘s cause ca. 40%
Reduction of downtime of workers ca. 10%
The second assembling company designs, produces and trades air conditioning equipment
for residential, commercial and industrial use (see Figure 5.8). The company has its own
brand name but it is also an original equipment manufacturer for other brands. The
production process of the company comprehends the manufacturing of all metallic
components, copper kits (refrigeration) and electrical boards as well as the subsequent
assembly of those half-finished products and other components.
FIGURE 5.8. ASSEMBLING OF LARGE-SCALE AIR CONDITIONING UNITS.

119
In addition, the company also invests in designing and developing customised solutions for
specific applications, such as hospital or military infrastructures. As a part of the company‘s
strategy to establish itself in a very competitive market, there was a strong investment in
providing not only products but also services. Maintenance and after-sales services have a
strong impact on the brand image, and consequently on sales and costs, while the price
must remain attractive.
This company was looking for support in two different areas: provide an effective
maintenance service for its commercial and industrial customers, which have large-scale
acclimatisation units; and design customised solutions meeting the specifications of large
customers.
In addition, this test case has a twofold objective: remote maintenance and design. This test
case brought a major focus to the extended enterprise. The business units modelled include
the several departments of the company, the customers and some third-party companies that
are sometimes sub-contracted for maintenance services. The process steps are not relevant
in this test case, as both applications (problem solving and design) are more directly related
to people. Some generic process steps were modelled for the air conditioning company. The
air conditioning units could either be modelled as production units, seen as tools used in a
process of the customer, or product parts, seen as items assembled and sold by the
assembling company. All the air conditioning units were modelled as production units, in a
very detailed way. Production units include, in this model, a well structured hierarchy
representing the company‘s catalogue. The modelled production units include specific
instances, with the relation to which company they belong. This information was very
important for the problem solving application. Moreover, actors play an important role in this
test case. Customers usually have contact persons, and the assembly company assigns
specific employees to each customer. The model includes the actors of the extended
enterprise, from the several companies involved, identifying their expertise and their
responsibilities regarding business units and production units.
Problems also have a dual approach in this test case, as they are used for both applications,
i.e. remote maintenance and design. The two classes of problems are differentiated in the
system through a flag.
In problem solving, problems are registered, including any measures recorded by the air
conditioning unit that is malfunctioning. The problem record can be analysed both at
customer‘s site and at the assembling company. The CBR approach allows actors to search
previous similar problems and obtain some diagnosis on what could be the cause and what
to do to eliminate it.

120
In supporting the design process, this company tested the AHP approach and also the
combination of AHP with CBR. For this purpose, problems are used to model customer
requirements on what they need as customised solution. The description includes a set of
variables to be met by the air conditioning unit to be designed, which are considered future
state items (using the constructs for actual state items). When receiving a new customer‘s
request, the company fills in the problem description and can use CBR to identify if any
similar products, meaning products with similar requirements, have been previously
designed. The previous designs are then considered as alternatives by the design team,
which includes employees from design, production, maintenance and sales. Some
preliminary tests have been made using AHP to rate the criteria to be considered in the
decision and rate the possible alternatives, in order to choose the most suitable design for
each situation. These tests have inspired Example 4.3, in section 4.2 The Analytic Hierarchy
Process.
Figure 5.9 presents some of the production units defined for the model of this assembling
company. Figure 5.10 and Figure 5.11 display, respectively, a list of examples of problems
and a list of similar problems provided by CBR.
FIGURE 5.9. PRODUCTION UNITS DEFINED FOR ASSEMBLING COMPANY 2.

121
FIGURE 5.10. EXAMPLES OF PROBLEMS DEFINED FOR ASSEMBLING COMPANY 2.
FIGURE 5.11. SIMILAR PROBLEMS IDENTIFIED BY CBR IN ASSEMBLING COMPANY 2.
The model, CBR and AHP modules were progressively tested in the company through a
period of 19 months. The company has identified that one of the main benefits achieved from
this test case was the structuring of information. The company has now a model that allows
several applications, a detailed record of problems occurred in units installed at customers,
and a detailed record of customer requirements and the subsequent designed products.
These are intangible benefits, which have improved the company‘s operation and impact on
the brand image. Other benefits registered by the company are summarised in Table 5.5.
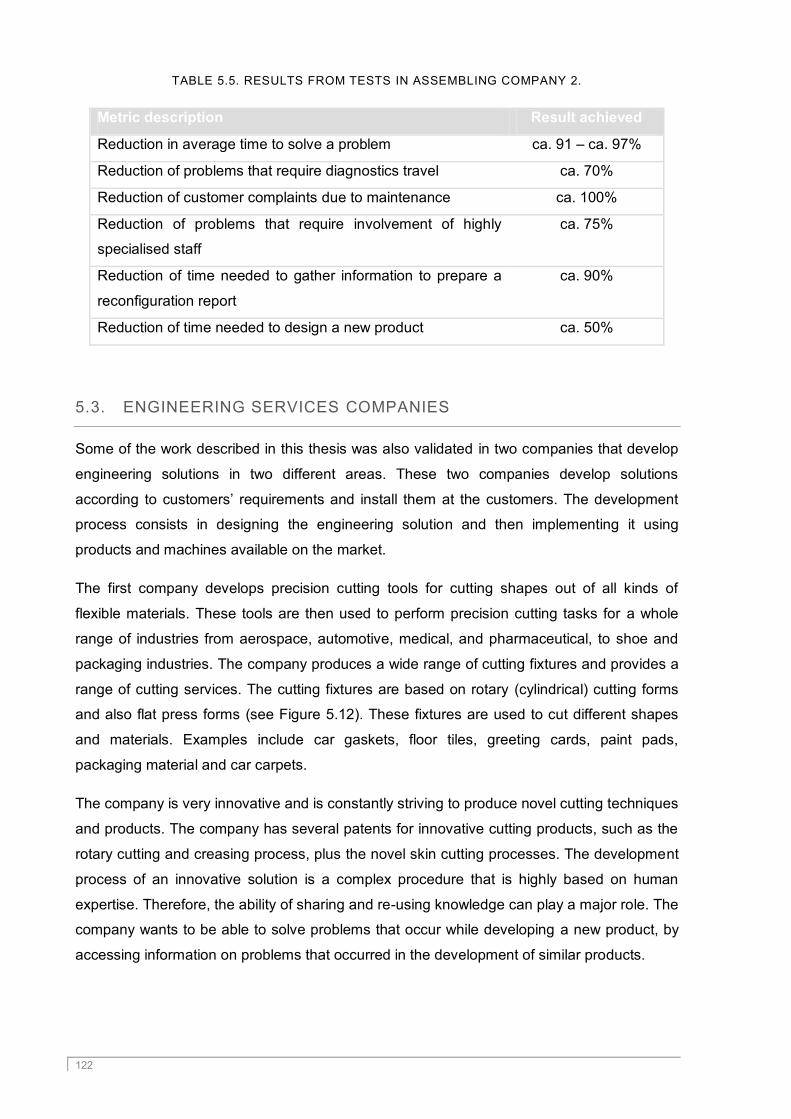
122
TABLE 5.5. RESULTS FROM TESTS IN ASSEMBLING COMPANY 2.
Metric description Result achieved
Reduction in average time to solve a problem ca. 91 – ca. 97%
Reduction of problems that require diagnostics travel ca. 70%
Reduction of customer complaints due to maintenance ca. 100%
Reduction of problems that require involvement of highly
specialised staff
ca. 75%
Reduction of time needed to gather information to prepare a
reconfiguration report
ca. 90%
Reduction of time needed to design a new product ca. 50%
5.3. ENGINEERING SERVICES COMPANIES
Some of the work described in this thesis was also validated in two companies that develop
engineering solutions in two different areas. These two companies develop solutions
according to customers‘ requirements and install them at the customers. The development
process consists in designing the engineering solution and then implementing it using
products and machines available on the market.
The first company develops precision cutting tools for cutting shapes out of all kinds of
flexible materials. These tools are then used to perform precision cutting tasks for a whole
range of industries from aerospace, automotive, medical, and pharmaceutical, to shoe and
packaging industries. The company produces a wide range of cutting fixtures and provides a
range of cutting services. The cutting fixtures are based on rotary (cylindrical) cutting forms
and also flat press forms (see Figure 5.12). These fixtures are used to cut different shapes
and materials. Examples include car gaskets, floor tiles, greeting cards, paint pads,
packaging material and car carpets.
The company is very innovative and is constantly striving to produce novel cutting techniques
and products. The company has several patents for innovative cutting products, such as the
rotary cutting and creasing process, plus the novel skin cutting processes. The development
process of an innovative solution is a complex procedure that is highly based on human
expertise. Therefore, the ability of sharing and re-using knowledge can play a major role. The
company wants to be able to solve problems that occur while developing a new product, by
accessing information on problems that occurred in the development of similar products.

123
FIGURE 5.12. CUTTING FORM AND FIXTURE.
This company has a strong relation to its customers, who require custom designed solutions,
and to its long-term suppliers, who provide the cutting blades and are often involved in the
design of new solutions. The process of creating a new cutting solution is a collaborative
practice involving actors from the extended enterprise: the customer who specifies the
requirements to be met, the company who design the solution, and the supplier who provides
some of the parts and suggestions on how to use them.
The process of creating a new cutting solution starts with a customer‘s request with some
specifications, which are forwarded to the product development. The design department
works on devising a solution in collaboration with the customer and the suppliers. The
solution is produced and assembled. This production step is the development of the form,
which is the base on which the cutting blades, rubbers, punches etc. are placed. The forms
can be cylindrical (rotary cutting) or flat (flatbed cutting). Once the solution is fully
implemented, it is tested and refined and finally delivered.
The enterprise was modelled focusing on the product parts, which represent the products
used (e.g. cutting blades) and assembled to produce the final cutting solution. The processes
of this model are not very detailed and almost match the company‘s departments (design,
testing etc.). The extended enterprise is very important in this test case, since the model
includes companies that supply the cutting blades and the companies that buy the cutting
solutions. Therefore, the actors of the extended enterprise and their respective expertise are
very important in this model. The production units of this model are almost nonexistent and
represent tools such as CAD system, or screwdriver. These production units were modelled
mainly as a company‘s exercise of achieving a complete extended enterprise model, but they
were not really used in this application.

124
This company wanted to reduce the time needed to design a new cutting solution, by re-
using information from similar previous projects. To achieve this, problems were interpreted
as requirements from the customers, specifying the solution needed. The description of the
requirement included specifications to be met (e.g. number of items to be cut per hour,
dimensions etc.) were modelled as state items and attached to the requirements as future
state items (using the constructs for actual state items specified in the enterprise model).
During the process of designing the new solution, i.e. solving the requirement, the group of
actors involved could contribute with ideas for the design process. The employees could use
CBR to identify similar previous design processes (of similar cutting solutions) to re-use
ideas and solutions.
The company used the model and the CBR approach to support the design of new products.
The approach allowed the company to better structure customer requirements, allowing for
an efficient re-use of information. The time needed to develop a new solution was reduced
together with the amount of iterations needed between the company, the customer and the
suppliers. In addition, the approach tested fostered an improved involvement of the
employees in the design process, increasing their participation and motivation in the
company‘s processes and strategy.
Figure 5.13, Figure 5.14 and Figure 5.15 display some examples of entities modelled for this
engineering services company, namely, product parts, problem types and actions.
FIGURE 5.13. PRODUCT PARTS MODELLED IN ENGINNERING SERVICES COMPANY 1.
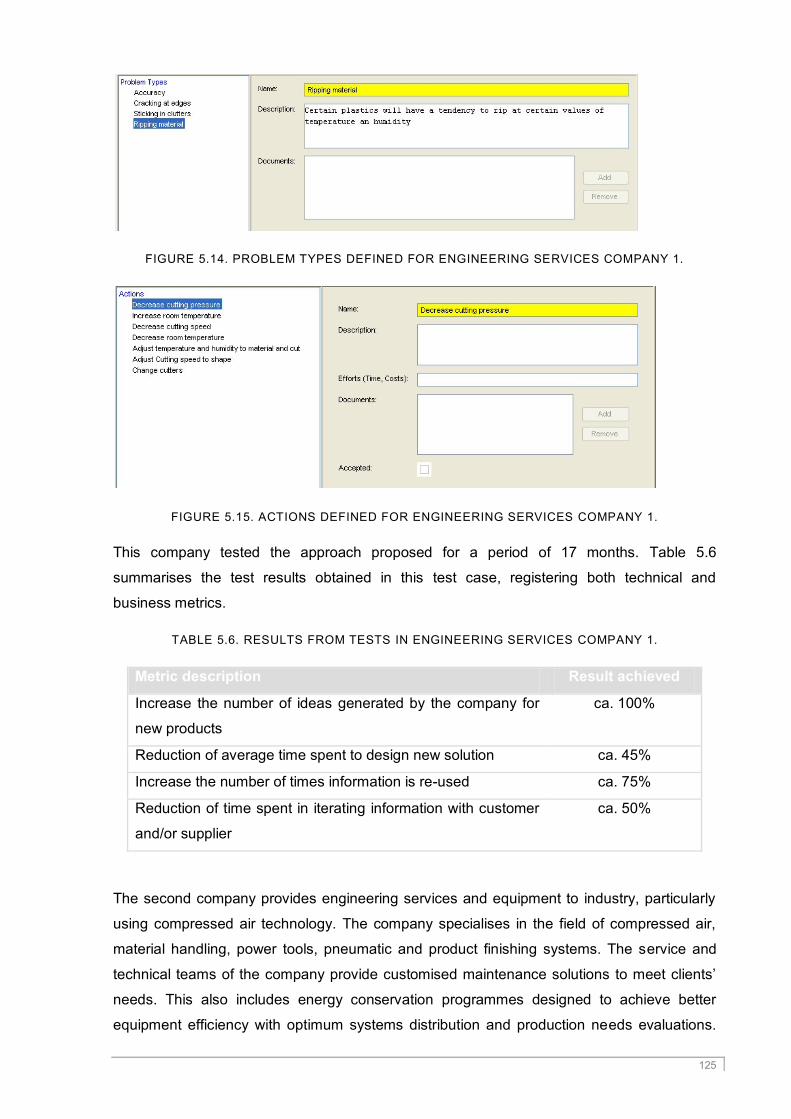
125
FIGURE 5.14. PROBLEM TYPES DEFINED FOR ENGINEERING SERVICES COMPANY 1.
FIGURE 5.15. ACTIONS DEFINED FOR ENGINEERING SERVICES COMPANY 1.
This company tested the approach proposed for a period of 17 months. Table 5.6
summarises the test results obtained in this test case, registering both technical and
business metrics.
TABLE 5.6. RESULTS FROM TESTS IN ENGINEERING SERVICES COMPANY 1.
Metric description Result achieved
Increase the number of ideas generated by the company for
new products
ca. 100%
Reduction of average time spent to design new solution ca. 45%
Increase the number of times information is re-used ca. 75%
Reduction of time spent in iterating information with customer
and/or supplier
ca. 50%
The second company provides engineering services and equipment to industry, particularly
using compressed air technology. The company specialises in the field of compressed air,
material handling, power tools, pneumatic and product finishing systems. The service and
technical teams of the company provide customised maintenance solutions to meet clients‘
needs. This also includes energy conservation programmes designed to achieve better
equipment efficiency with optimum systems distribution and production needs evaluations.
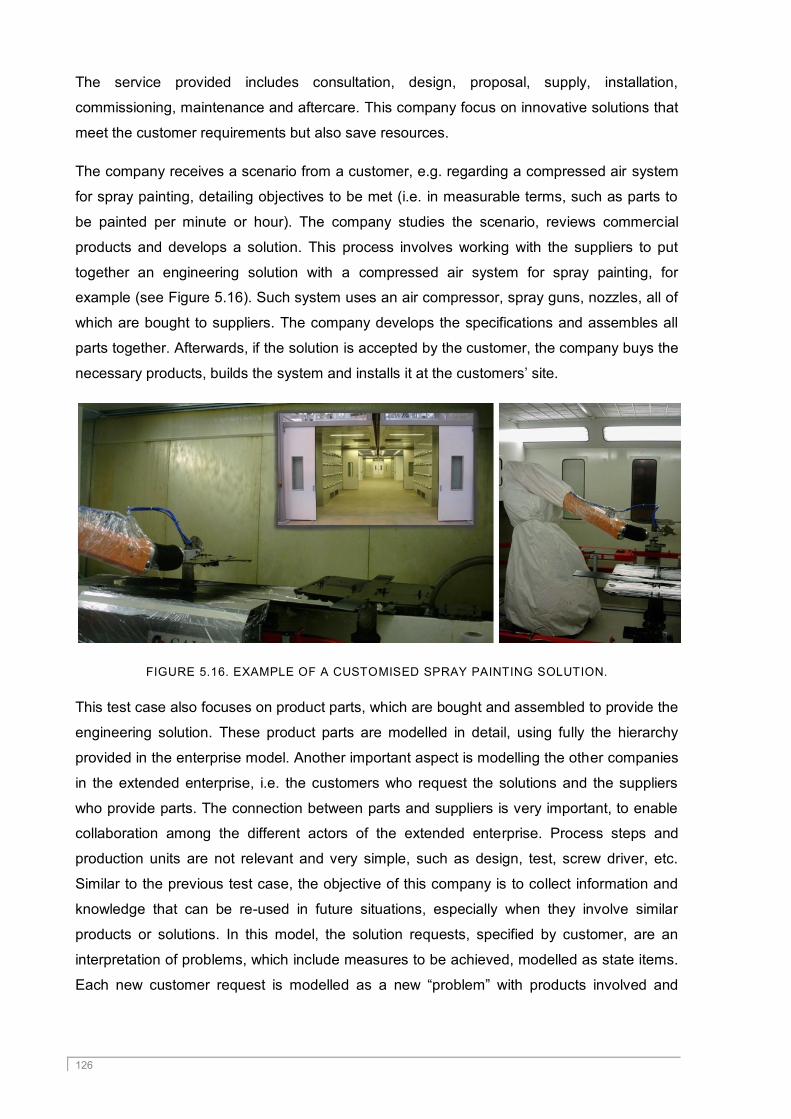
126
The service provided includes consultation, design, proposal, supply, installation,
commissioning, maintenance and aftercare. This company focus on innovative solutions that
meet the customer requirements but also save resources.
The company receives a scenario from a customer, e.g. regarding a compressed air system
for spray painting, detailing objectives to be met (i.e. in measurable terms, such as parts to
be painted per minute or hour). The company studies the scenario, reviews commercial
products and develops a solution. This process involves working with the suppliers to put
together an engineering solution with a compressed air system for spray painting, for
example (see Figure 5.16). Such system uses an air compressor, spray guns, nozzles, all of
which are bought to suppliers. The company develops the specifications and assembles all
parts together. Afterwards, if the solution is accepted by the customer, the company buys the
necessary products, builds the system and installs it at the customers‘ site.
FIGURE 5.16. EXAMPLE OF A CUSTOMISED SPRAY PAINTING SOLUTION.
This test case also focuses on product parts, which are bought and assembled to provide the
engineering solution. These product parts are modelled in detail, using fully the hierarchy
provided in the enterprise model. Another important aspect is modelling the other companies
in the extended enterprise, i.e. the customers who request the solutions and the suppliers
who provide parts. The connection between parts and suppliers is very important, to enable
collaboration among the different actors of the extended enterprise. Process steps and
production units are not relevant and very simple, such as design, test, screw driver, etc.
Similar to the previous test case, the objective of this company is to collect information and
knowledge that can be re-used in future situations, especially when they involve similar
products or solutions. In this model, the solution requests, specified by customer, are an
interpretation of problems, which include measures to be achieved, modelled as state items.
Each new customer request is modelled as a new ―problem‖ with products involved and

127
goals to be achieved. The company can then use CBR to search for previous similar
situations and try to re-use or adapt previous solutions.
One of the main objectives of this company was to achieve an appropriate way to register
problems and customer requests in a structure that allowed efficient re-use. This goal was
considered successfully met by the approach tested. The approach also enabled to
strengthen and tighten relations with customers and suppliers, allowing them to have a more
active role in designing the engineering solutions. The company managed to achieve
products with higher quality, but whose design consumed less time. Overall, the company
feels that these benefits contributed to improve its brand image.
Figure 5.17 represents a list of examples of problems registered in this company, and Figure
5.18 displays the analysis performed by the CBR approach to diagnose the cause of one
problem.
FIGURE 5.17. LIST OF PROBLEMS FROM ENGINEERING SERVICES COMPANY 2.

128
FIGURE 5.18. CBR ANALYSIS OF PROBLEMS FROM ENGINEERING SERVICES COMPANY 2.
This company tested the proposed approach during 17 months. The results achieved in the
tests performed in this company are summarised in Table 5.7.
TABLE 5.7. RESULTS FROM TESTS IN ENGINEERING SERVICES COMPANY 2.
Metric description Result achieved
Increase the number of ideas generated by the company for
new products
ca. 100%
Increase number of ideas provided by customers and/or
suppliers
ca. 50%
Reduction of average time spent to design new solution ca. 35%
Reduction of time and efforts to solve a problem when
designing a new product
ca. 40%
The two engineering solution companies provide custom-made solutions to their customers,
based on specifications and requirements provided. Both companies were looking for
support in making their design processes more structured and efficient, especially by re-
using past information. The two companies were modelled with a strong focus on product
parts, representing both components bought and the final products developed. In addition,

129
these two engineering companies have models with the spotlight on the extended enterprise
components. For both companies, the relations with customers and suppliers are very
important, as well as the relations between the physical elements of the engineering
company (the product parts) and the other companies of the extended enterprise.
Both companies were modelled following the extended enterprise model proposed in chapter
2 Enterprise model. The same constructs were used to model these companies and all the
previous ones. However, these engineering companies have a stronger focus on the other
companies of the extended enterprise, when compared with the manufacturing companies.
In addition, these companies required a ―re-interpretation‖ of problems defined in the
enterprise model. In the manufacturing and assembling companies, problems are
malfunctions or anomalies that occur in processes or products of the extended enterprise.
Here, problems are faced as requirements to be met by some product that has yet to be
designed or developed.
5.4. SOFTWARE COMPANY
Some of the work presented in the previous chapters of this thesis was also applied in an
information technology system and service provider, which delivers complete information and
communication technology (ICT) systems to its customers. This company specifies and
develops the software solutions, but also overtakes the complete installation and
maintenance. The solutions provided include network infrastructure, specific hardware,
customised market available software systems, customer specific software, and all related
training and on-line support. This company also overtakes the systems installation at the
customers‘ sites and their complete maintenance. One of the company‘s objectives is to
provide a high quality after sales service, contributing to long term customers. Therefore,
reaction time to solve a problem and minimisation of problems occurred are important
aspects of the company‘s operation.
The objective of this company is to improve customer support, by providing the best
maintenance service possible. In order to achieve this, it is essential for the company to have
an efficient problem solving process. The company chose one of its most important products
to test the approach proposed in this thesis: an ICT system for reservation, booking and
selling of tickets for passenger ships (see Figure 5.19). This ICT system is used in several
customers, and its booking activities occur mainly 1 or 2 hours before the ship‘s departure.
System failures or any performance degradation during this time are critical and require
immediate reaction by the company maintaining the ICT system.

130
FIGURE 5.19. OVERVIEW OF RESERVATIONS ICT SYSTEM.
The company wanted to record problems that occur at their customer, the shipping company,
where their product is installed. This approach is different from the manufacturing
companies, for example, who were recording problems occurring in-house. According to this,
this test case has a significant component on the extended enterprise, with the need to
model this company and its customers, as business units. The problems occur at the
customer companies, when they are operating their daily processes. In the model developed,
the product parts, production units and process steps are spread throughout the extended
enterprise, and do not belong to the same company. With the objective of modelling what
happens in the customer‘s operation, the process steps of the ICT company are actually not
important. The focus is on maintenance provided by the ICT company, and all its other
process steps are not involved. Therefore, the model has to include instead the process
steps of the customer, which are in this case, reserving, booking, selling, printing ticket etc.
The model allows each process step to belong to one business unit, which defines the
relation between the process step and the company operating it. These process steps use a
production unit, i.e. a tool, which is the software system provided by the ICT company. While
this software system is a product of the ICT company, it is a production unit of the customer.
The software may not be a typical tool, but it is a utensil needed for the customer to fulfil a
process step. The product parts of this model are the tickets issued and printed by the
shipping company.
This approach allows modelling how different instances of the same software system
(production unit) are used in different process steps, of different customers (business units).
The software company uses the model to centralise all the information about problems
occurred with their software product, independent of the customer where they are installed.
This allows the company to re-use knowledge among customers and even prevent the
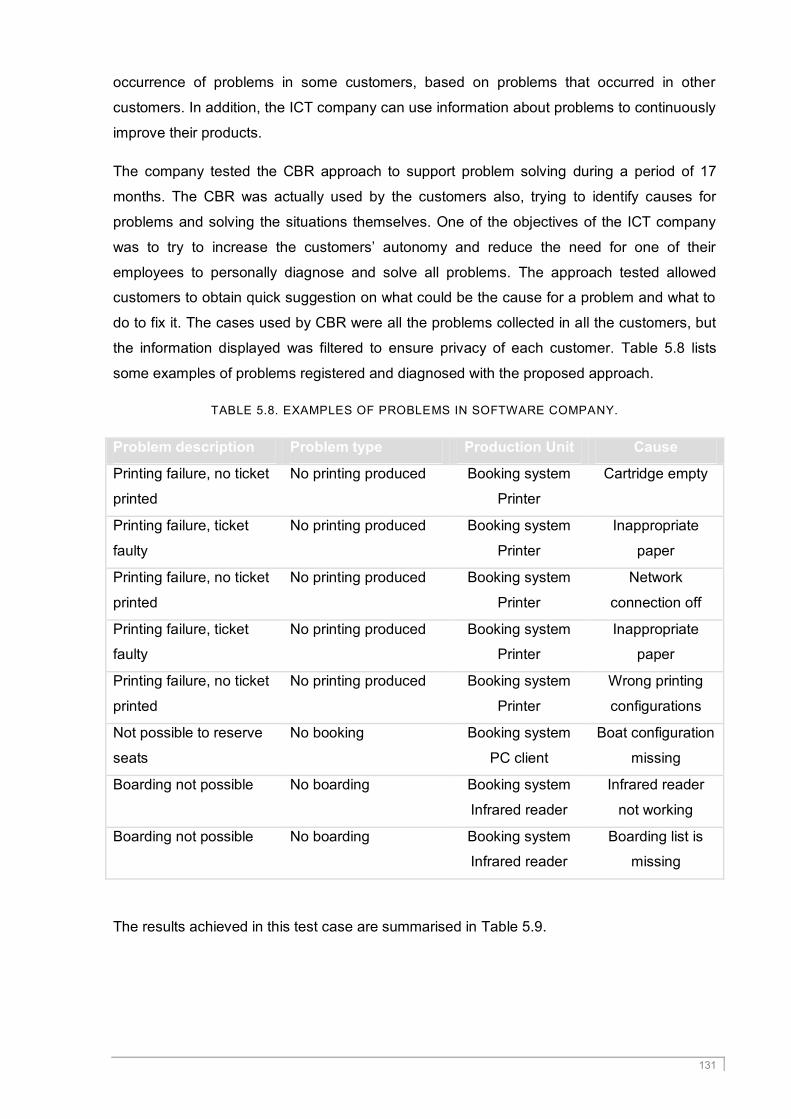
131
occurrence of problems in some customers, based on problems that occurred in other
customers. In addition, the ICT company can use information about problems to continuously
improve their products.
The company tested the CBR approach to support problem solving during a period of 17
months. The CBR was actually used by the customers also, trying to identify causes for
problems and solving the situations themselves. One of the objectives of the ICT company
was to try to increase the customers‘ autonomy and reduce the need for one of their
employees to personally diagnose and solve all problems. The approach tested allowed
customers to obtain quick suggestion on what could be the cause for a problem and what to
do to fix it. The cases used by CBR were all the problems collected in all the customers, but
the information displayed was filtered to ensure privacy of each customer. Table 5.8 lists
some examples of problems registered and diagnosed with the proposed approach.
TABLE 5.8. EXAMPLES OF PROBLEMS IN SOFTWARE COMPANY.
Problem description Problem type Production Unit Cause
Printing failure, no ticket
printed
No printing produced Booking system
Printer
Cartridge empty
Printing failure, ticket
faulty
No printing produced Booking system
Printer
Inappropriate
paper
Printing failure, no ticket
printed
No printing produced Booking system
Printer
Network
connection off
Printing failure, ticket
faulty
No printing produced Booking system
Printer
Inappropriate
paper
Printing failure, no ticket
printed
No printing produced Booking system
Printer
Wrong printing
configurations
Not possible to reserve
seats
No booking Booking system
PC client
Boat configuration
missing
Boarding not possible No boarding Booking system
Infrared reader
Infrared reader
not working
Boarding not possible No boarding Booking system
Infrared reader
Boarding list is
missing
The results achieved in this test case are summarised in Table 5.9.

132
TABLE 5.9. RESULTS FROM TESTS IN SOFTWARE COMPANY.
Metric description Result achieved
Reduction of resources to support a product ca. 25%
Reduction of customer complaints about products ca. 50%
Increase problem solving actions performed by the customer ca. 35%
Reduction of number of re-occurrences of a problem ca. 40%
5.5. REMARKS
This chapter described the application of some of the work presented in the previous
chapters of this thesis in seven industrial companies. The objective was to illustrate the
applicability of the approaches from this thesis and demonstrate its versatility in real
industrial environments. This section summarises the results achieved, highlighting
commonalities and differences among the test cases.
The seven companies had the objective of having an appropriate framework to support their
problem solving processes, in the scope of maintenance and design of new products. The
two manufacturing companies and the first assembling company focused on problems
occurring during their production processes, trying to minimise downtime of machines and
increasing efficiency of production. The second assembling and the software companies
focused on remote maintenance, i.e. in solving problems that occurred in products they had
installed at their customers‘ sites. The two engineering services and the second assembling
companies focused on supporting problem solving during the design process, i.e. while
creating new solutions or products.
The enterprise model proposed in chapter 2 Enterprise model was used in the seven test
cases, without modifying any construct. Some test cases required a slightly different
interpretation of some constructs, but their structure, attributes and relations were still valid.
For example, to support design, problems were interpreted as requirements, but the
construct was exactly the same used in problem solving. The main focus of the models
defined in the seven test cases is different. The two manufacturing companies, aiming at
solving in-house problems in their manufacturing plants, focused on production units and
process steps. The first assembling company, also seeking to solve in-house problems in
their production sites, focused on processes and product parts, while production units were
almost irrelevant due to the lower level of automation in the production. The two engineering
services companies, wanting to support problem solving in developing new engineering
solutions, focused on customers, requirements and product parts. The second assembling

133
and the software companies, aiming at solving customers‘ problems, focused on product
parts.
These seven industrial test cases focused on two different business applications:
maintenance and design. These two applications validate that the decision approach
presented in this thesis is valid for different situations. The proposed approach uses two
methods, CBR and AHP, and the combination of both, to support industrial decision-making
processes. The choice of the most appropriate method to support a decision process is
tightly connected to the type of decision. The two applications mentioned in the test cases,
maintenance and design, represent, quite often, very different situations. Maintenance
decisions are usually routine situations that involve one actor, or a very small team, and
demand an urgent answer. If a machine suddenly stops a manufacturing or assembly
process, it has to be re-started as soon as possible, to avoid prohibitive penalties in the
companies. A design process is generally a process that involves a larger and more diverse
team, combining several departments and expertise within an extended enterprise, and lasts
several days, weeks, months or even years, according to the complexity of the product.
However long the design process may be, companies prefer it to be thoughtful and strategic,
rather than urgent and rushed. Therefore, the two applications showcased in this chapter,
represent different teams and especially different time operations and urgency levels. These
considerations have to impact on the most appropriate approach to support the respective
decisions.
The CBR approach is used to support maintenance applications, where problems are often a
re-occurrence of past situations that demand an urgent answer. One actor or a small team
can rapidly access a similar previous situation and adapt the solution implemented before,
trying to solve and eliminate the problem as soon as possible. The AHP approach is used to
support decisions in the scope of design processes, because they involve multi-disciplinary
teams that have to combine their different perspectives taking the necessary time to do it.
Design processes are usually integrated in the company‘s strategy, which makes their
documentation highly important.
In the test cases presented in this chapter, CBR was used as support for maintenance
problem solving in five test cases and as support for design problem solving in two cases.
The two services engineering companies develop solutions in very specific areas of
expertise, which allows them to highly re-use partial and sometimes complete solutions.
Therefore, these two test cases were able to use CBR as support for problem solving in
design. However, the proposed approach grew to include AHP and its combination with
CBR, which provides a better support for design situations. The second assembling company
has used the combination of CBR and AHP to support design, overcoming the bottlenecks of
the two methods individually.

134
In all test cases, the companies selected the parts of their extended enterprises to model, in
order to showcase potential benefits that could be presented to the management or business
partners.
Most of these companies operate several information and communication technology
systems, with different purposes, such as resource planning, invoicing etc. The information
needed for the model existed in the companies, dispersed in these systems and in the form
of manuals (e.g. problem causes) and employees‘ expertise.
The seven companies appreciated the result of having a systematic approach to support
decision processes that enables a high level of accountability among the actors and enables
repeatability. This approach gives companies the tools to repeat successful situations and
analyse unsuccessful ones to learn how not to repeat them. Moreover, the seven companies
also highlighted the importance of centralising a model of their enterprises in one single
―place‖. The model describes all the main objects in the enterprises, and particularly their
connections. This model enables not only the tested approach for decision support, but also
the possibility of building any other applications on top of the same model.
135
6. CONCLUSIONS AND FUTURE WORK
The objective of this thesis is to contribute to support decision-making process in industrial
environments, particularly the ones that involve several actors, which are designated by
collaborative decision-making. Industrial companies need a systematic approach to support
decision-making, allowing them to replicate successful decisions and avoid unsuccessful
ones. In addition, industrial companies always impose requirements on accountability and
responsibility of any action within their extended enterprises. These requirements are the
reason for the emphasis of this thesis on human aspects. The decision support approach
proposed in this work is strongly human-centric and does not aim at replacing the decision-
maker. The methods proposed have the objective of supporting the human actor in
collecting, gathering, comparing and analysing information, to enable the actor to make the
best-informed decision.
One of the most problematic issues in industrial companies relates to how to represent and
store information and knowledge, which is needed for daily activities. It is quite often to find
references, in literature, to knowledge acquisition as the bottleneck for the full application of
knowledge management and expert systems in industrial and business environments.
Actually, the problem starts with the lack of a model that companies can use to represent
their business. This thesis includes a survey of existing modelling methodologies, which are
conceptual modelling techniques for describing the structure and business processes of an
enterprise. Additionally, it includes a review of existing modelling standards currently used to
try to unify approaches in enterprise engineering and integration. It proposes a new
enterprise model to represent extended or virtual enterprises and enable several
applications, particularly problem solving and decision support. The proposed model includes
a set of constructs that companies should model to achieve an appropriate representation of
their operations, resources and business. A modelling methodology to help industrial
companies in modelling their extended enterprises with limited support from knowledge
modelling experts can, as well, be found. The information represented in the enterprise
model relates to the companies, so their actors should be in charge of the modelling process,
instead of external persons. The proposed modelling methodology includes a set of steps to
help users in gathering the necessary information to model their enterprise and includes
supporting tools, such as a checklist or questionnaire for interviews.

136
Companies face decisions every day, with increasingly complex situations and increasingly
larger and more distributed teams involved. Research laboratories, consultants and software
companies use a wide range of designations for tools and/or methods that aim at supporting
decision-making. This work includes a study of existing methods to support decision-making,
trying to highlight research work developed. Additionally, it comprises a survey of systems to
support decision-making, clarifying the several terms used in literature, their commonalities
and differences. Additionally, there is a summary of industrial practices on decision-making
processes, trying to identify trends regarding methods and approaches used. This work used
questionnaires and interviews with industrial companies performed by the author. From these
contacts and additional experience, it was possible to elaborate a list of general criteria that
can be applied in a wide range of decision situations. These criteria were represented in a
hierarchical form to enable a better analysis and divided into costs and benefits.
Problem solving is a relevant application field of decision-making in industrial environments.
Companies need to register problems occurred internally in their processes and have a
structured way to solve them. This thesis proposes a case-based reasoning (CBR) approach,
which is based on the enterprise model previously presented. The CBR method uses the
constructs of the enterprise model to register the cases used in the reasoning process. CBR
compares two problems through the attributes of reporting actor, involved generics and
actual state items. The proposed CBR approach uses a weight-sum metric to calculate the
similarity between two cases, and a cosine similarity to calculate the similarity of involved
generics and actual state items, because these attributes are defined by vectors in a tree
hierarchy.
The Analytic Hierarchy Process (AHP) is a useful tool to support multi-attribute decision-
making. In the scope of this work, the AHP is proposed to support solving problems that
occur in the scope of innovation processes in industry. The main characteristic of this
proposed AHP approach is the inclusion of a pre-defined hierarchy that can be applied in
very diverse decision situations in industry. The hierarchy uses the criteria previously
proposed, arranged in several levels. The decision-makers only need to revise the criteria
suggested, adding or removing any necessary elements. Additionally, the team defines the
alternatives and follows the approach proposed to select the best alternative.
Although both CBR and AHP have been successfully used in several applications, they have
limitations. On one hand, when the repository of cases grows significantly, and contains
many similar cases, the results from CBR becoming increasingly difficult to analyse. The
human actor using the approach can receive a result of 20 similar problems that are very
similar, or the human actor cannot properly analyse to select which one to adapt to the
current situation. On the other hand, the AHP approach requires the definition of a hierarchy
that represents the decision situation. This means that actors need to identify all the criteria

137
to consider and the alternatives, from which the choice will be made. The current work
proposes a list of criteria to be adapted to any decision situation, but it can be very difficult to
identify all the alternatives to consider. When performing this analysis, it is possible to think
that actors are not sure what to do with the similar cases provided by CBR and also do not
know how to define the possible alternatives in AHP. Therefore, this thesis proposes a
combination of these two methods, CBR and AHP, where the aggregated similar cases given
by CBR are used as alternatives in the AHP. The main objective of this work is to overcome
the shortcomings of both these methods and support decision-making in innovation
situations in the most appropriate form. Using this approach, a human actor can document a
problem occurred in the course of an innovation process, use CBR to obtain previous similar
situations, and use AHP to select which of the similar cases is the best to follow on the
current situation.
In collaborative decision-making, the focus is on the human actors that compose the decision
team. It is possible that all actors have the same role in the company, or not. The role of the
actor in a team is defined by a weight, having the weight of all actors in the team summing 1.
How can companies establish such weights and, especially, how can they know they have
defined the most appropriate weight for each actor? This thesis proposes an algorithm to
adapt the weight of actors in a decision team, by using information from the implementation
of the decision. This means that actors systematically involved in successful situations
aligned with the company‘s strategy should probably have an increased role in the team.
The work presented in this document includes seven case studies that represent tests of
some of the methods presented throughout the thesis. The seven test cases represent two
manufacturing companies, two assembling companies, two services engineering companies
and one software company. The enterprise model proposed was adapted and applied in the
seven test cases, highlighting its adaptability and applicability. The model was used to
support different applications, such as problem solving, innovation, remote maintenance etc.,
but always involving different steps of collaboration within the extended enterprises. The
seven test cases also implemented and tested the CBR approach, in tight collaboration to
the enterprise model, enabling an evolution of the method proposed throughout the testing
period. One of the test cases also served to demonstrate a preliminary study of the
applicability of AHP.
This thesis summarises an approach to support collaborative decision making in industrial
environments. It is necessary to highlight that the proposed approaches are used to support
the human actor and not replace it. As stated before, industrial companies are very keen on
accountability and therefore they have problems accepting that a software system may be
responsible for a decision in a company. The work developed has a theoretical component,
of developing methods that may be applicable to industrial environments. However, it also

138
comprehends a strong practical and empirical component, supported by the experience in
several projects funded by the European Union, where the author had the change of
developing knowledge management and expert systems for industrial environments. In this
scope, it is necessary to emphasise that the introduction of any new system into a company
is a very disruptive process. Researcher cannot forget this. There is usually a huge gap
between research and its applicability in industrial environments. For example, while fields
such as artificial intelligence are now developing very innovative methods and technologies
(e.g. augmented reality), many companies still consider innovative to have one single
enterprise model used by all its ICT applications. There is a lot of work to do to enable the full
application of information systems in industry, especially in topics of knowledge acquisition
and representation, considered very challenging.
The author is continuing its work in the topic of industrial information systems and decision
support in industrial environments. Some of the topics in future work related to industrial
information systems include the collection of data in non-intrusive ways, and semantic-based
processing of collected data. Regarding decision support in industrial environments, the
author is developing a method to represent a decision team in a hierarchical form and have a
systematic approach to define the role of each actor in the team. Moreover, the approach
based on the analytic hierarchy process will be adapted to support decision-making in the
domain of energy efficiency.

139
BIBLIOGRAPHY
Aamodt, A, and E Plaza. ―Case-Based Reasoning: Foundational Issues, Methodological
Variations and System Approaches.‖ AI Communications 7, no. 1 (1996).
Altuzarra, A, JM Moreno-Jimenez, and M Salvador. ―A Bayesian priorization procedure for
AHP-group decision making.‖ European Journal of Operational Research 182 (2007): 367-
382.
Bhargava, H, and DJ Power. ―Decision Support Systems and Web Technologies: A Status
Report.‖ Americas Conference of the Association of Information Systems. Boston, 2001.
Boose, JH, JM Bradshaw, JL Koszarek, and DB Shema. ―Knowledge Acquisition
Technicques for Group Decision Support.‖ Knowledge Acquisition 5 (1993): 405-448.
Borges, MRS, JA Pino, and C Valle. ―Support for decision implementation and follow-up.‖
European Journal of Operational Research 160 (2005): 336-352.
Browne, J, and J Zhang. ―Extended and virtual enterprises - similarities and differences.‖
International Journal of Agile Management Systems 1, no. 1 (1999): 30-36.
Buchanan, B G, et al. ―Constructing an expert system.‖ In Building Expert Systems, by F
Hayes-Roth, D Waterman and D Lenat. Boston: Addison-Wesley Longman Publishing Co.,
Inc., 1983.
Buyukozkan, G, O Feyzioglu, and Ruan D. ―Fuzzy group decision-making to multiple
preference formats in quality function deployment.‖ Computers in Industry (Elsevier) 58
(2007): 392-402.
Camarinha-Matos, LM, and H Afsarmanesh. ―Virtual Enterprise Modeling and Support
Infrastructures: Applying Multi-agent System Approaches.‖ In Multi-Agent Systems and
Applications, by M Luck, V Marík, O Stepankova and R Trappl, 335-364. Springer Berlin /
Heidelberg, 2006.
Camarinha-Matos, LM, H Afsarmanesh, C Garita, and C Lima. ―Towards an architecture for
virtual enterprises.‖ Journal of Intelligent Manufacturing 9, no. 2 (1998): 189-199.
Campos, A, and R Neves-Silva. ―A Combination of Case-Based Reasoning and Analytic
Hierarchy Process to Support Innovation in Industry.‖ International Symposium on Intelligent
Decision Technologies. Baltimore: IOS, 2010.

140
Campos, AR, D Stokic, and R Neves-Silva. ―Integrated Approach for Innovation and Problem
Solving in Dynamic Virtual Enterprises.‖ International Conference on Industrial Informatics.
Berlin, 2004. 163-168.
Cao, J, F Ye, G Zhou, and H Huang. ―A New Method for VE Partner Selection and
Evaluation Based on AHP and Fuzzy Theory.‖ International Conference on Computer
Supported Cooperative Work in Design Proceedings. IEEE, 2003. 563-566.
CaseBank. SpotLight Overview. http://www.casebank.com/Spotlight.
Chen, SJ, and CL Hwang. Fuzzy Multiple Attribute Decision-Making Methods and
Applications. Springer, 1992.
CIMOSA: A Primer on key concepts, purpose and business value.
http://cimosa.cnt.pl/Docs/Primer/primer5.htm.
Cohen, PR, and HJ Lavesque. ―Intention is choice with commitment.‖ Artificial Intelligence
42, no. 3 (1990): 213-261.
Conklin, J. ―Designing Organizational Memory: Preserving Intellectual Assets in a Knowledge
Economy.‖ Touchstone. 1996. http://www.touchstone.com/tr/wp/DOM.html.
Core, MG, and JF Allen. ―Coding Dialogues with the DAMSL Annotation Scheme.‖ AAAI-97
Fall Symposium on Communicative Action in Humans and Machines. AAAI Press, 1997.
De Michelis, G, and MA Grasso. ―Situating conversations within the language/action
perspective: the Milan Conversation Model.‖ CSCW-94. ACM Press, 1994. 89-100.
Delgado, M, and JL, Vila, MA Verdegay. ―Linguistic decision making models.‖ International
Journal Intelligent Systems 7 (1992): 479-492.
DeSanctis, G, and B A Guadalupe. ―A foundation for the study of group decision support
systems.‖ Management Science 33, no. 5 (1987): 589-609.
Di Eugenio, B, PW Jordan, RH Thomason, and JD Moore. ―Reconstructed intentions in
Collaborative Problem Solving Dialogues.‖ AAAI-97 Fall Symposium on Communicative
Action in Humans and Machines. AAAI Press, 1997.
Doumeingts, G, B Vallespir, D Darracar, and M Roboam. ―Design Methodology for Advanced
Manufacturing Systems.‖ Computers in Industry 9, no. 4 (1987): 271-296.
Eddy, D, J Whitmore, K Neville, P Tessier, M Dalrymple, and N Takamoto. ―Command-and-
Control Decision Making: A Model for Information Operations.‖ 44th Annual Meeting of the
Human Factors and Ergonomics Society. San Diego, 2000. 3-104.

141
eGain. eGain Product Suite. http://www.egain.com/products/multichannel_service.asp.
Ekbia, HR. ―Taking Decisions into the Wild: An AI Perspective in the Design of i-DMSSS.‖ In
Intelligent Decision-Making Support Systems: Foundations, Applications and Challenges, by
J N D Gupta, G A Forgionne and M Mora, 79-96. London: Springer-Verlag, 2006.
Fan, X, M McNeese, B Sun, T Hanratty, L Allender, and J Yen. ―Human-Agent Collaboration
for Time-Stressed Multicontext Decision Making.‖ IEEE Transactions on Systems, Man, and
Cybernetics 40, no. 2 (2010): 306-320.
Fischer, G, R McCall, and A Morch. ―JANUS: Integrating Hypertext with a Knowledge-based
Design Environment.‖ Hypertext'89. ACM Press, 1989. 105-117.
Fischer, U, and D Stokic. ―Organisational Knowledge Management in Manufacturing
Enterprises - Solutions and Open Issues.‖ In Challenges and Achievements in E-business
and E-work, by B Stanford-Smith, E Chiozza and M Edin, 819-826. Amsterdam: IOS Press &
Ohmsha, 2002.
Fjermestad, J, and SR Hiltz. ―Group Support Systems: A Descriptive Evaluation of Case and
Field Studies.‖ Journal of Management Information Systems 17, no. 3 (2000): 115-159.
Forgionne, GA, M Mora, R Cervantes, and O Gelman. ―I-DMSS: a conceptual architecture for
next generation of DMSS in the internet age.‖ International Conference on Decision-Making
and Decision Support in the Internet Age. Cork, 2002. 154-165.
Forman, E, and K Peniwati. ―Aggregating individual judgments and priorities with the Analytic
Hierarchy Process.‖ European Journal of Operational Research (Elsevier) 108 (1998): 165-
169.
Friedman, VJ, J Rothman, W Withers, and A Dosik. ―The Power of Why: A Methodology.‖
International Conference on Action Learning and Participatory Action Research. 2003.
GAIA. jColibri CBR Framework. http://gaia.fdi.ucm.es/projects/jcolibri/#top.
Ganesan, P, H Garcia-Molina, and J Widom. ―Exploiting Hierarchical Domain Structure to
Compute Similarity.‖ ACM Transactions on Information Systems 21, no. 1 (2003): 64-93.
Gilboa, I, and D Schmeidler. ―Case-Based Knowledge and Induction.‖ IEEE Transactions on
Systems, Man and Cybernetics 30, no. 2 (2000): 85-95.
Grand, IJ. Collaboration and Creativity: An Interdisciplinary Study. PhD Thesis, Cincinnati:
The Union Institute, 1999.
142
Grosz, BJ, and CL Sidner. ―Shared plans in discourse.‖ In Intentions in Communication, by P
Cohen, J Morgan and M Pollack. MIT Press, 1990.
Grover, MD. ―A Pragmatic Knowledge Acquisition Methodology.‖ International Joint
Conference On Artificial Intelligence. Karlsruhe: Morgan Kaufmann Publishers Inc., 1983.
436-438.
Grüninger, M, K Atefi, and MS Fox. ―Ontologies to Support Process Integration in Enterprise
Engineering.‖ Computational and Mathematical Organization Theory 6 (2000): 381-394.
Hans, WG, and W Peter. ―Intelligent decision support systems.‖ Decision Support Systems 8,
no. 4 (1992): 317-332.
Herrera, F, and E Herrera-Viedma. ―Linguistic decision analysis: steps for solving decision
problems under linguistic information.‖ Fuzzy Sets Systems 115 (2000): 67-82.
Herrera, F, and JL Verdegay. ―Linguistic assessments in group decision.‖ 1st European
Congress on Fuzzy and Intelligent Technologies. 1993. 941-948.
Herrera, F, E Herrera-Viedma, and JL Verdegay. ―A model of consensus in group decision
making under linguistic assessments.‖ Fuzzy Set Systems 79 (1996): 73-87.
Herrera, F, E Herrera-Viedma, and JL Verdegay. ―A rational consensus model in group
decision making using linguistic assessments.‖ Fuzzy Sets Systems 88 (1997): 31-49.
Herrera, F, e JL Verdegay. ―A linguistic decision process in group decision making.‖ Group
Decision Negotiation 5 (1996): 165-176.
Huber, G. ―Issues in the Design of Group Decision Support Systems.‖ MIS Quaterly 8 (1984):
195-204.
Hunsaker, PL, and JS Hunsaker. ―Decision styles - in theory, in practice.‖ Organizational
Dynamics 10 (1981): 23-26.
Hurwitz, R, and JC Mallery. ―The Open Meeting: A Web-Based System for Conferencing and
Collaboration.‖ 4th International WWW Conference. 1995.
Huynh, VN, and Y Nakamori. ―Multi-Expert Decision-Making with Linguistic Information: A
Probabilistic-Based Model.‖ 38th Hawaii International Conference on System Sciences.
2005. 91-99.
IFIP-IFAC Task Force on Architectures for Enterprise Integration. ―GERAM: Generalised
Enterprise Reference Architecture and Methodology.‖ 1999.

143
Ignat-Coman, A, D Isoc, A Joldis, and I Gaziuc. ―A Case-Based Reasoning Approach for
Fault Detection State in Bridges Assessment.‖ International Conference on Automation,
Quality and Testing, Robotics. Cluj-Napoca: IEEE, 2008. 178-183.
Ishikawa, K. Guide to Quality Control. Asian Productivity Organization, 1982.
ISO. Enterprise integration - Constructs for enterprise modeling. Standard, ISO, 2007.
ISO. Enterprise Integration - Framework for enterprise modeling. Standard, ISO, 2006.
Jagdev, HS, and J Browne. ―The Extended Enterprise - A Context for Manufacturing.‖
Production Planning & COntrol 9, no. 3 (1998): 216-229.
Jardim-Gonçalves, R, A Grilo, and A Steiger-Garção. ―Challenging the interoperability
between computers in industry with MDA and SOA.‖ Computers in Industry (Elsevier) 57
(2006): 679-689.
Kacprzyk, J, and M Ferizzi. Multiperson Decision Making Models Using Fuzzy Sets and
Possible Theory. Kluwer Academic Publishers, 1990.
Karacapilidis, N. ―An Overview of Future Challenges of Decision Support Techniques.‖ In
Intelligent Decision-Making Support Systems: Foundations, Applications and Challenges, by
J N D Gupta, G A Forgionne and M Mora, 386-399. London: Springer-Verlag, 2006.
Karacapilidis, N. ―Computer Supported Argumenation and Collaborative Decision Making:
The HERMES System.‖ Information Systems 26 (2001): 259-277.
Karacapilidis, N, P Dimitris, and P Costas. ―Computer-Mediated Collaborative Decision
Making: Theoretical and Implementation Issues.‖ 32nd Hawaii International Conference on
System Sciences, HICCS. 1999. 1-10.
Keen, P G W, and M S Scott-Morton. Decision Support Systems: An Organizational
Perspective. Reading: Addison-Wesley, 1978.
Kim, S, A Godbole, R Huang, R Panchadhar, and WW Smari. ―Toward an Integrated Human-
Centered Knowledge-Based Collaborative Decision Making System.‖ IEEE International
Conference on Information Reuse and Integration. Las Vegas, 2004. 394-401.
Klein, G. Sources of Power: How People Make Decisions. Cambridge: MIT Press, 1999.
Korpela, J, and M Tuominen. ―Group Decision Support for Analysing Logistics Development
Projects.‖ Hawaii International Conference on System Sciences: Information Systems Track-
Collaboration Systems and Technology. IEEE, 1997. 493-502.

144
Kosanke, K. ―CIMOSA: enterprise engineering and integration.‖ Computers in Industry 40
(1999): 83-97.
—. ―Comparison of Enterprise Modelling Methodologies.‖ Design of Information Infrastructure
Systems for Manufacturing. Katsheuvel: Chapman & Hall, 1996.
Kreamer, KL, and JL King. ―Computer-based systems for cooperative work and group
decision making.‖ ACM Computer Surveys 20, no. 2 (1988): 115-146.
Kuczynski, A, D Stokic, and U Kirchhoff. ―Set-up and Maintenance of Ontologies for
Innovation Support in Extended Enterprises.‖ International Journal of Advanced
Manufacturing Technologies (Springer London) 29, no. 3-4 (June 2006): 398-407.
Leake, D. Case-Based Reasoning: Experiences, Lessons and Future Directions. Menlo Park:
AAAI Press/ MIT Press, 1996.
Lian, H, LP Wang, and H Cheng. ―A Case-Based Reasoning System for Enterprise
Informalization: Development and Management.‖ International Conference on Logistic
Systems and Intelligent Management. Harbin: IEEE, 2010. 1887-1891.
Lipshitz, R, and O Strauss. ―Coping with uncertainty: A naturalistic decision-making analysis.‖
Organizational Behavior and Human Decision Process 9, no. 2 (1997): 149-163.
Liu, D, D Zhou, and X Tao. ―A Method of Components and Parts Suppliers Selection for
SMMEs Based on Uncertainty Votinh AHP Group Decision Making.‖ International
Symposium on Pervasive Computing and Applications. 2006. 17-22.
Loucopoulos, P, and V Kavakli. ―Enterprise Knowledge Management and Conceptual
Modelling.‖ In Conceptual Modelling, by P P Chen, 123-143. Springer Berlin / Heidelberg,
1999.
Matsuda, S. ―A Neural Network Model for the Decision-Making Process Based on AHP.‖
International Joint Conference on Neural Networks. Montreal, 2005. 821-826.
—. ―A Neural Network Model for the Decision-Making Process Based on ANP.‖ International
Joint Conference on Neural Networks. Vancouver, 2006. 1421-1426.
Meade, LM, and A Presley. ―R&D Project Selection Using the Analytic Network Process.‖
IEEE Transactions on Engineering Management 49, no. 1 (2002): 59-66.
Merin, A. ―Communicative Action as Bargaining: Utility, relevance, Elementary Social Acts.‖
AAAI Full Symposium on Communicative Action in Humans and Machines. AAAI Press,
1997.

145
Mikhailov, L, and MG Singh. ―Fuzzy Analytic Network Process and its Application to the
Development of Decision Support Systems.‖ IEEE Transactions on Systems, Man, and
Cybernetics 33, no. 1 (2003): 33-41.
Mora, M, G Forgionne, J Gupta, F Cervantes, and O German. ―A framework to assess
intelligent decision-making support systems.‖ 7th International Conference on Knowledge-
Based Intelligent Information & Engineering Systems. Oxford: LCNS, 2003. 59-65.
Nagarajan, R, L Whitman, and S H Cheraghu. ―Entrprise Integration.‖ International
Conference on Industrial Engineering, Theory, Applications and Practice. San Antonio, 1999.
Ngwenyama, OK, N Bryson, and A Mobolurin. ―Supporting Facilitation in Group Support
Systems: Techniques for Analyzing Consensus Relevant Data.‖ Decision Support Systems
16, no. 2 (1996): 155-168.
Nonaka, I, and H Takeuchi. The Knowledge-Creating Company. Oxford University Press,
Inc, 1995.
O'Neill, H, and P Sackett. ―The Extended Manufacturing Enterprise Paradigm.‖ Management
Decision 32, no. 8 (1994): 42-49.
Pistolesi, G. ―MicroDEMON: A Decision-making Intelligent Assistant for Mobile Business.‖ In
Intelligent Decision-Making Support Systems: Foundations, Applications and Challenges, by
J N D Gupta, G A Forgionne and M Mora, 238-254. London: Springer-Verlag, 2006.
Qiu, YF, YP Chui, and MG Helander. ―Knowledge-based Decision Making in Virtual Team
Environment.‖ International Engineering Management Conference. 2004. 556-560.
Rook, F W, and J W Croghan. ―The Knowledge Acquisition Activity Matrix: A Systems
Engineering Conceptual Framework.‖ IEEE Transactions on Systems, Man and Cybernetics
19, no. 3 (1989): 586-597.
Rothman, J. Resolving Identity-Based Conflict in Nations. San Francisco: Jossey-Bass,
1997.
Russell, S, and P Norvig. Artificial Intelligence: A Modern Approach. Prentice Hall, 1995.
Saaty, T. The Analytic Hierarchy Process. New York: McGraw Hill, 1980.
Saaty, TL. The Analytic Hierarchy Process. New York: McGraw-Hill, 1991.
Sarkis, J, and RP Sundarraj. ―Evaluation of Enterprise Information Technologies: A Decision
Model for High-Level Consideration of Strategic and Operational Issues.‖ IEEE Transactions
on Systems, Man, and Cybernetics (IEEE) 36, no. 2 (2006): 260-273.

146
Schlegel, K, et al. Predicts 2009: Business Intelligence and Performance Management Will
Deliver Greater Business Value. Gartner, 2008.
Sensiper, S. American Management Systems: The Knowledge Centers. Case 9-697-068,
Harvard Business School, 1998.
Shadbolt, N, and AM Burton. ―The Empirical Study of Knowledge Elicitation Techniques.‖
ACM Sigart Bulletin 108 (April 1989): 15-18.
Shah, K, and PJ Shah. ―Types of Decision-Making.‖ Laynetworks.
http://www.laynetworks.com/TYPES-OF-DECISION-MAKING.html.
—. Types of Decision-Making. http://www.laynetworks.com/TYPES-OF-DECISION-
MAKING.html.
Shim, JP, M Warkentin, JF Courtney, DJ Power, R Sharda, and C Calsson. ―Past, present
and future of decision support technology.‖ Decision Support Systems 33, no. 2 (2002): 111-
126.
Sidner, CL. ―An Artificial Discourse Language for Collaborative Negotiation.‖ AAAI-94.
AAAI/MIT Press, 1994. 814-819.
Silverman, BG. ―Unifying expert systems and the decision sciences.‖ Operations Research
42, no. 3 (1994): 393-413.
Simon, H. Administrative Behaviour. New York: The Free Press, 1997.
Simon, H. ―Two heads are better than one: collaboration between AI and OR.‖ Interfaces 17,
no. 4 (1987): 8-15.
Smari, WW, K Weigand, G Petonito, Y Kantamani, R Madala, and S Domepudi. ―An
Integrated Approach to Collaborative Decision Making Using Computer-Supported Conflict
Management Methodology.‖ International Conference on Information Reuse and Integration.
Las Vegas: IEEE, 2005. 182-191.
Smith, IA, and PR Cohen. ―Toward a semantics for an agent communication language based
on speech acts.‖ AAAI-96. AAAI/MIT Press, 1996. 24-31.
Smolensky, P, B Fox, R King, and C Lewis. ―Computer-aided Reasoned Discourse, or How
to Argue with a Computer.‖ In Cognitive Science and its Applications for Human Computer
Interaction, by R Guidon, 109-162. Hillsdale: Erlbaum, 1987.

147
Sorli, M, D Stokic, A Gorostiza, and A Campos. ―Managing product/process knowledge in the
concurrent/simultaneous enterprise environment.‖ Robotics and Computer-Integrated
Manufacturing 22 (2006): 399-408.
Sprague, R H, and E D Carlson. Building Effective Decision Support Systems. Englewood
Cliffs: Prentice-Hall, 1982.
Sprague, RHJ. ―A framework for the development of decision support systems.‖ MIS
Quaterly 4, no. 4 (1980): 1-26.
Streitz, N, J Hannemann, and M Thuering. ―From ideas and arguments to hyperdocuments:
Travelling through activity spaces.‖ Hypertext'89. ACM Press, 1989. 343-364.
Szegheo, O, and B Andersen. ―Modeling the Extended Enterprise: A Comparison of Different
Modeling Approaches.‖ International Enterprise Modelling Conference. Verdal, 1999.
Tan, SW, and J Pearl. ―Qualitative Decision Theory.‖ AAAI Conference. AAAI Press, 1994.
928-933.
Tansley, DSW, and CC Hayball. KBS Analyst and Design, a KADS Developer's Handbook.
Prentice-Hall, 1993.
The Economist. ―Working in the digital age: a clouded future.‖ 13 March 2010.
Tong, M, and PP Bonissone. ―Linguistic solutions to fuzzy decision problems.‖ Studies on
Management Sciences 20 (1984): 323-334.
Triantaphyllou, E. Multi-Criteria Decision Making Methods: A Comparative Study. Kluwer
Academic Publishers, 2000.
Turban, E. Decision Support and Expert Systems. Englewood Cliffs: Prentice-Hall, 1992.
Turoff, M, SR Hiltz, HK Cho, Z Li, and Y Wang. ―Social Decision Support Systems.‖ 35th
Annual Hawaii International Conference on System Sciences. IEEE Computer Society, 2002.
11-21.
Valle, C, W Prinz, and M Jarke. ―Using Tasks and Semi-structured Messages to Support
Decision Follow Up.‖ International Conference on Collaborative Computing: Networking,
Applications and Worksharing. Atlanta, 2006. 37-46.
Vennix, JAM. Group Model Building: Facilitating Team Learning Using System Dynamics.
Chichester: Wiley, 1996.
Vernadat. ―Enterprise Modeling and Integration: Current Status and Research Perspectives.‖
Annual Reviews in Control 26 (2002): 15-25.

148
von Krogh, G, K Ichijo, and I Nonaka. Enabling Knowledge Creation. New York: Oxford
University Press, Inc., 2000.
Williams, TJ, and H Li. ―PERA and GERAM - Enterprise Reference Architectures in
Enterprise Integration.‖ IFIP TC5 WG5.3/5.7 Third International Working Conference on
Design of Information Structure Systems for Manufacturing II. 1998. 3-30.
Womack, JP, and DT Jones. Lean Solutions. Simon & Schuster, 2005.
—. Lean Thinking. Simon & Schuster, 1996.
Wu, JT, and MY Chen. ―A Case-Based Reasoning System for Product Development Based
on PDM.‖ International Conference on Machine Learning and Cybernetics. Hong Kong, 2007.
751-755.
Yager, RR. ―A new methodology for ordinal multi-objective decisions based on fuzzy sets.‖
Decision Sciences 12 (1981): 589-600.
Yu, CS, and CK Li. ―A Group Decision Making Fuzzy AHP Model and its Application to a
Plant Location Selection Problem.‖ IFSA World Congress. Vancouver: IEEE, 2001. 76-80.
Zha, XF, and RD Sririam. ―Knowledge-intensive Collaborative Decision Support for Design
Process.‖ In Intelligent Decision-Making Support Systems: Foundations, Applications and
Challenges, by JND Gupta, GA Forgionne and M Mora, 386-399. London: Springer-Verlag,
2006.
Zha, XF, RD Sriram, MG Fernandez, and F Mistree. ―Knowledge-intensive collaborative
decision support for design processes: a hybrid decision support model and agent.‖ Edited
by Elsevier. Computers in Industry 59 (2006): 905-922.
Zolghadri, M, T Lecompte, e JP Bourrieres. ―Design of decision support systems for
extended enterprise.‖ Journal of Studies in Informatics and Control with Emphasis on Useful
Applications of Advanced Technology 11, n.º 1.
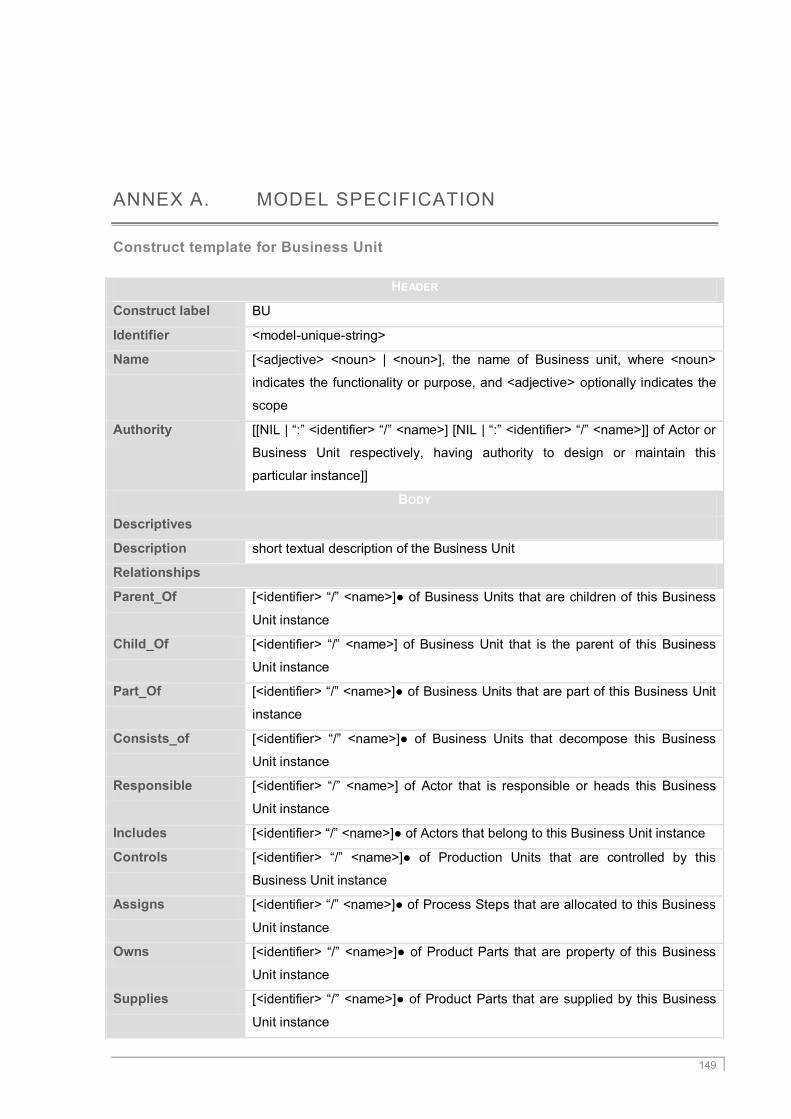
149
ANNEX A. MODEL SPECIFICATION
Construct template for Business Unit
HEADER
Construct label BU
Identifier <model-unique-string>
Name [<adjective> <noun> | <noun>], the name of Business unit, where <noun>
indicates the functionality or purpose, and <adjective> optionally indicates the
scope
Authority [[NIL | ―:‖ <identifier> ―/‖ <name>] [NIL | ―:‖ <identifier> ―/‖ <name>]] of Actor or
Business Unit respectively, having authority to design or maintain this
particular instance]]
BODY
Descriptives
Description short textual description of the Business Unit
Relationships
Parent_Of [<identifier> ―/‖ <name>]● of Business Units that are children of this Business
Unit instance
Child_Of [<identifier> ―/‖ <name>] of Business Unit that is the parent of this Business
Unit instance
Part_Of [<identifier> ―/‖ <name>]● of Business Units that are part of this Business Unit
instance
Consists_of [<identifier> ―/‖ <name>]● of Business Units that decompose this Business
Unit instance
Responsible [<identifier> ―/‖ <name>] of Actor that is responsible or heads this Business
Unit instance
Includes [<identifier> ―/‖ <name>]● of Actors that belong to this Business Unit instance
Controls [<identifier> ―/‖ <name>]● of Production Units that are controlled by this
Business Unit instance
Assigns [<identifier> ―/‖ <name>]● of Process Steps that are allocated to this Business
Unit instance
Owns [<identifier> ―/‖ <name>]● of Product Parts that are property of this Business
Unit instance
Supplies [<identifier> ―/‖ <name>]● of Product Parts that are supplied by this Business
Unit instance
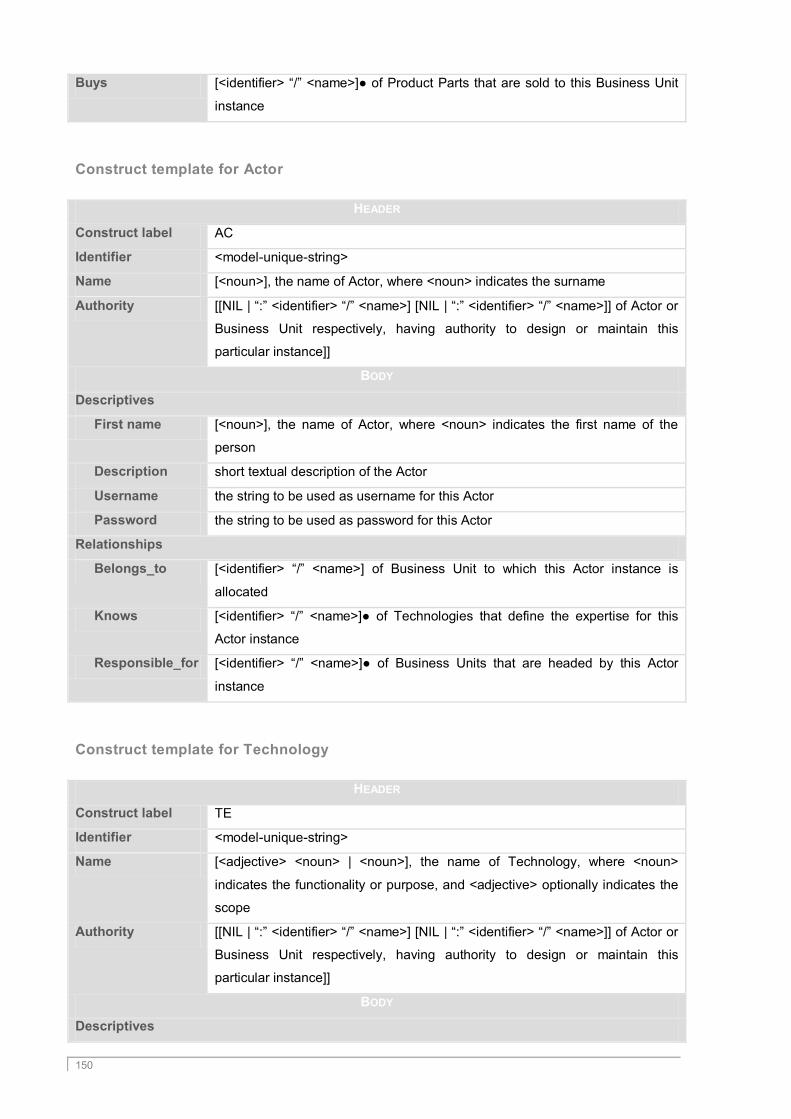
150
Buys [<identifier> ―/‖ <name>]● of Product Parts that are sold to this Business Unit
instance
Construct template for Actor
HEADER
Construct label AC
Identifier <model-unique-string>
Name [<noun>], the name of Actor, where <noun> indicates the surname
Authority [[NIL | ―:‖ <identifier> ―/‖ <name>] [NIL | ―:‖ <identifier> ―/‖ <name>]] of Actor or
Business Unit respectively, having authority to design or maintain this
particular instance]]
BODY
Descriptives
First name [<noun>], the name of Actor, where <noun> indicates the first name of the
person
Description short textual description of the Actor
Username the string to be used as username for this Actor
Password the string to be used as password for this Actor
Relationships
Belongs_to [<identifier> ―/‖ <name>] of Business Unit to which this Actor instance is
allocated
Knows [<identifier> ―/‖ <name>]● of Technologies that define the expertise for this
Actor instance
Responsible_for [<identifier> ―/‖ <name>]● of Business Units that are headed by this Actor
instance
Construct template for Technology
HEADER
Construct label TE
Identifier <model-unique-string>
Name [<adjective> <noun> | <noun>], the name of Technology, where <noun>
indicates the functionality or purpose, and <adjective> optionally indicates the
scope
Authority [[NIL | ―:‖ <identifier> ―/‖ <name>] [NIL | ―:‖ <identifier> ―/‖ <name>]] of Actor or
Business Unit respectively, having authority to design or maintain this
particular instance]]
BODY
Descriptives

151
Description short textual description of the Technology
Documents string with path for documents relevant to describe this Technology instance
Relationships
Parent_Of [<identifier> ―/‖ <name>]● of Technologies that are children of this Technology
instance
Child_Of [<identifier> ―/‖ <name>] of Technology that is the parent of this Technology
instance
Known_by [<identifier> ―/‖ <name>]● of Actors that have knowledge about this
Technology instance
Constrained_by [<identifier> ―/‖ <name>]● of State Items that restrain this Technology instance
Validated_by [<identifier> ―/‖ <name>]● of Nominal Values that are valid for this Technology
instance
Includes [<identifier> ―/‖ <name>]● of Parameter Sets that belong to this Technology
instance
Construct template for Production Unit
HEADER
Construct label PU
Identifier <model-unique-string>
Name [<adjective> <noun> | <noun>], the name of Production Unit, where <noun>
indicates the functionality or purpose, and <adjective> optionally indicates the
scope
Authority [[NIL | ―:‖ <identifier> ―/‖ <name>] [NIL | ―:‖ <identifier> ―/‖ <name>]] of Actor or
Business Unit respectively, having authority to design or maintain this
particular instance]]
BODY
Descriptives
Description short textual description of the Production Unit
Documents string with path for documents relevant to describe this Production Unit
instance
Serial number textual information about the serial number of this Production Unit instance
when it represents a specific machine
Relationships
Parent_Of [<identifier> ―/‖ <name>]● of Production Units that are children of this
Production Unit instance
Child_Of [<identifier> ―/‖ <name>] of Production Unit that is the parent of this Production
Unit instance
Controlled_by [<identifier> ―/‖ <name>] of Business Unit that holds the responsibility for this
Production Unit instance

152
Supplied_by [<identifier> ―/‖ <name>] of Business Unit that sold this Production Unit
instance
Part_of [<identifier> ―/‖ <name>]● of Production Units that include this Production Unit
instance, defining a decomposition
Consists_of [<identifier> ―/‖ <name>]● of Production Units that define the decomposition of
this Production Unit instance
Construct template for Resource
HEADER
Construct label RE
Identifier <model-unique-string>
Authority [[NIL | ―:‖ <identifier> ―/‖ <name>] [NIL | ―:‖ <identifier> ―/‖ <name>]] of Actor or
Business Unit respectively, having authority to design or maintain this
particular instance]]
BODY
Descriptives
Type PU | AC
Relationships
Is_PU [<identifier> ―/‖ <name>] of Production Unit that defines this Resource instance
Is_AC [<identifier> ―/‖ <name>] of Actor that defines this Resource instance
Construct template for Process Step
HEADER
Construct label PS
Identifier <model-unique-string>
Name [<adjective> <noun> | <noun>], the name of Process Step, where <noun>
indicates the functionality or purpose, and <adjective> optionally indicates the
scope
Authority [[NIL | ―:‖ <identifier> ―/‖ <name>] [NIL | ―:‖ <identifier> ―/‖ <name>]] of Actor or
Business Unit respectively, having authority to design or maintain this
particular instance]]
BODY
Descriptives
Description short textual description of the Process Step
Documents string with path for documents relevant to describe this Process Step instance
Criticality percentage of how critical this Process Step is for the whole production
Relationships
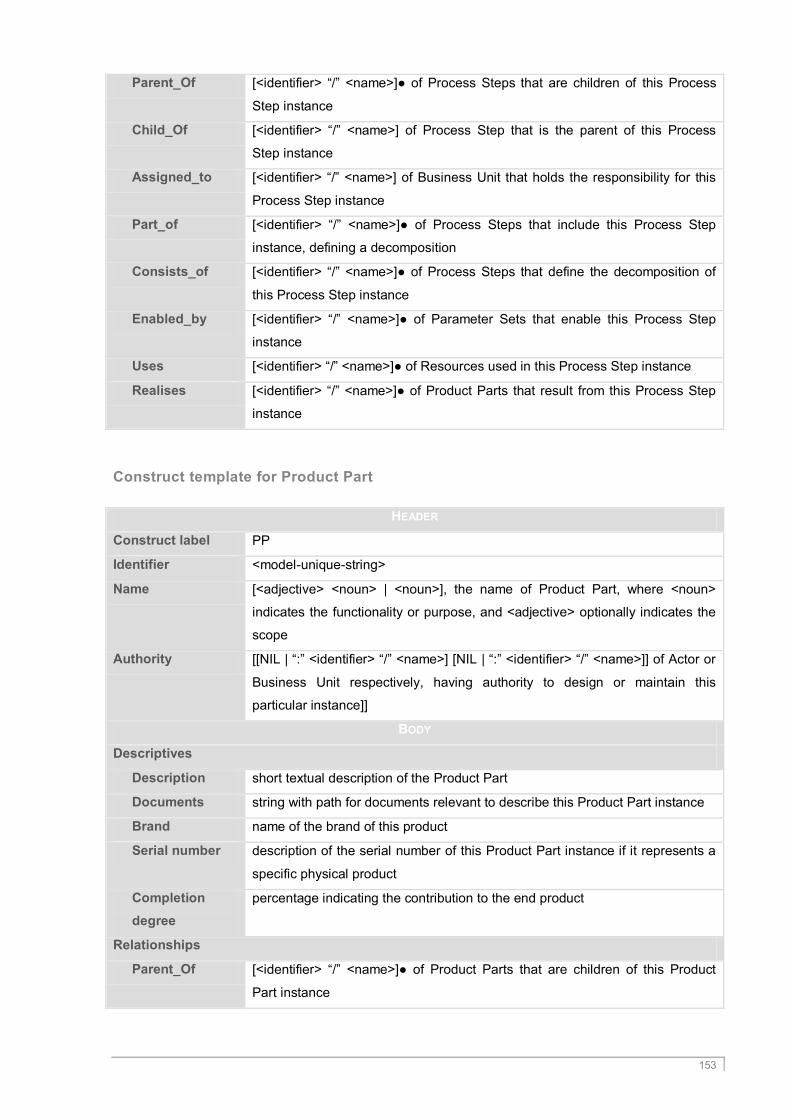
153
Parent_Of [<identifier> ―/‖ <name>]● of Process Steps that are children of this Process
Step instance
Child_Of [<identifier> ―/‖ <name>] of Process Step that is the parent of this Process
Step instance
Assigned_to [<identifier> ―/‖ <name>] of Business Unit that holds the responsibility for this
Process Step instance
Part_of [<identifier> ―/‖ <name>]● of Process Steps that include this Process Step
instance, defining a decomposition
Consists_of [<identifier> ―/‖ <name>]● of Process Steps that define the decomposition of
this Process Step instance
Enabled_by [<identifier> ―/‖ <name>]● of Parameter Sets that enable this Process Step
instance
Uses [<identifier> ―/‖ <name>]● of Resources used in this Process Step instance
Realises [<identifier> ―/‖ <name>]● of Product Parts that result from this Process Step
instance
Construct template for Product Part
HEADER
Construct label PP
Identifier <model-unique-string>
Name [<adjective> <noun> | <noun>], the name of Product Part, where <noun>
indicates the functionality or purpose, and <adjective> optionally indicates the
scope
Authority [[NIL | ―:‖ <identifier> ―/‖ <name>] [NIL | ―:‖ <identifier> ―/‖ <name>]] of Actor or
Business Unit respectively, having authority to design or maintain this
particular instance]]
BODY
Descriptives
Description short textual description of the Product Part
Documents string with path for documents relevant to describe this Product Part instance
Brand name of the brand of this product
Serial number description of the serial number of this Product Part instance if it represents a
specific physical product
Completion
degree
percentage indicating the contribution to the end product
Relationships
Parent_Of [<identifier> ―/‖ <name>]● of Product Parts that are children of this Product
Part instance

154
Child_Of [<identifier> ―/‖ <name>] of Product Part that is the parent of this Product Part
instance
Owned_by [<identifier> ―/‖ <name>] of Business Unit that holds the responsibility for this
Product Part instance
Supplied_by [<identifier> ―/‖ <name>] of Business Unit that supplied this Product Part
instance
Sold_to [<identifier> ―/‖ <name>] of Business Unit to which this Product Part instance is
sold
Part_of [<identifier> ―/‖ <name>]● of Product Parts that include this Product Part
instance, defining a decomposition
Consists_of [<identifier> ―/‖ <name>]● of Product Parts that define the decomposition of
this Product Part instance
Connected_to [<identifier> ―/‖ <name>]● of Product Parts to which this Product Part instance
is connected (backwards) to form an end product
Connected_with [<identifier> ―/‖ <name>]● of Product Parts to which this Product Part instance
is connected (forwards) to form an end product
Replaces [<identifier> ―/‖ <name>]● of Product Parts that this Product Part instance can
replace in case of stock rupture
Replaced_by [<identifier> ―/‖ <name>]● of Product Parts that can replace this Product Part
instance in case of stock rupture
Realised_by [<identifier> ―/‖ <name>]● of Process Steps from which this Product Part
instance results
Construct template for Generic
HEADER
Construct label GN
Identifier <model-unique-string>
Authority [[NIL | ―:‖ <identifier> ―/‖ <name>] [NIL | ―:‖ <identifier> ―/‖ <name>]] of Actor or
Business Unit respectively, having authority to design or maintain this
particular instance]]
BODY
Descriptives
Type PU | PS | PP
Relationships
Is_PU [<identifier> ―/‖ <name>] of Production Unit that defines this Generic instance
Is_PS [<identifier> ―/‖ <name>] of Process Step that defines this Generic instance
Is_PP [<identifier> ―/‖ <name>] of Product Part that defines this Generic instance
Affected_by [<identifier> ―/‖ <name>]● of Influences that affect this Generic instance

155
Causes [<identifier> ―/‖ <name>]● of Influences that are caused by this Generic
instance
Attached [<identifier> ―/‖ <name>]● of States that are attached to this Generic instance
Involved_in [<identifier> ―/‖ <name>]● of Problems in which this Generic instance is
involved
Construct template for Influence
HEADER
Construct label IF
Identifier <model-unique-string>
Name [<adjective> <noun> | <noun>], the name of Influence, where <noun>
indicates the functionality or purpose, and <adjective> optionally indicates the
scope
Authority [[NIL | ―:‖ <identifier> ―/‖ <name>] [NIL | ―:‖ <identifier> ―/‖ <name>]] of Actor or
Business Unit respectively, having authority to design or maintain this
particular instance]]
BODY
Descriptives
Description short textual description of the influence
Significance percentage indicating how much this influence can affect the generics
Relationships
Caused_by [<identifier> ―/‖ <name>] of Generic that causes this Influence instance
Affects [<identifier> ―/‖ <name>]● of Generics that are affected by this Influence
instance
Construct template for State
HEADER
Construct label ST
Identifier <model-unique-string>
Name [<adjective> <noun> | <noun>], the name of State, where <noun> indicates the
functionality or purpose, and <adjective> optionally indicates the scope
Authority [[NIL | ―:‖ <identifier> ―/‖ <name>] [NIL | ―:‖ <identifier> ―/‖ <name>]] of Actor or
Business Unit respectively, having authority to design or maintain this
particular instance]]
BODY
Descriptives
Description short textual description of the State

156
Documents string with path for documents relevant to describe this State instance
Relationships
Parent_Of [<identifier> ―/‖ <name>]● of States that are children of this State instance
Child_Of [<identifier> ―/‖ <name>] of State that is the parent of this State instance
Attached_to [<identifier> ―/‖ <name>]● of Generic for which this State instance is valid
Includes [<identifier> ―/‖ <name>]● of State Items that are defined for this State instance
Construct template for State Item
HEADER
Construct label SI
Identifier <model-unique-string>
Name [<adjective> <noun> | <noun>], the name of State Item, where <noun>
indicates the functionality or purpose, and <adjective> optionally indicates the
scope
Authority [[NIL | ―:‖ <identifier> ―/‖ <name>] [NIL | ―:‖ <identifier> ―/‖ <name>]] of Actor or
Business Unit respectively, having authority to design or maintain this
particular instance]]
BODY
Descriptives
Description short textual description of the State Item
Type BOI | NUI | DAI | SYI | CHI
PLC name identification of the controller that might provide this value
Mandatory indication if this value is mandatory for a specific generic
Accuracy percentage indicating the accuracy of the value, usually related to the
measuring method
Measurability percentage indicating the possibility of measuring this variable
Class NORMAL | ERROR
Length number of characters (only available for text state items)
Maximum maximum value allowed (only available for numeric state items)
Minimum minimum value allowed (only available for numeric state items)
Scale number of total digits (only available for numeric state items)
Precision number of decimal digits (only available for numeric state items)
Relationships
Parent_Of [<identifier> ―/‖ <name>]● of State Items that are children of this State Item
instance
Child_Of [<identifier> ―/‖ <name>] of State Item that is the parent of this State Item
instance
Belongs_to [<identifier> ―/‖ <name>] of State to which this State Item instance belongs to

157
Constraints [<identifier> ―/‖ <name>]● of Technologies that are limited by this State Item
instance
Defined_by [<identifier> ―/‖ <name>]● of Symbols that are valid for this State Item instance
(only available for symbolic state items)
Construct template for Symbol
HEADER
Construct label SY
Identifier <model-unique-string>
Name [<adjective> <noun> | <noun>], the name of Symbol, where <noun> indicates
the functionality or purpose, and <adjective> optionally indicates the scope
Authority [[NIL | ―:‖ <identifier> ―/‖ <name>] [NIL | ―:‖ <identifier> ―/‖ <name>]] of Actor or
Business Unit respectively, having authority to design or maintain this
particular instance]]
BODY
Relationships
Valid_for [<identifier> ―/‖ <name>] of State Item for which this Symbol instance is valid
for
Construct template for Nominal Value
HEADER
Construct label NV
Identifier <model-unique-string>
Name [<adjective> <noun> | <noun>], the name of Nominal Value, where <noun>
indicates the functionality or purpose, and <adjective> optionally indicates the
scope
Authority [[NIL | ―:‖ <identifier> ―/‖ <name>] [NIL | ―:‖ <identifier> ―/‖ <name>]] of Actor or
Business Unit respectively, having authority to design or maintain this
particular instance]]
BODY
Descriptives
Description short textual description of the Nominal Value
Relationships
Valid_for_PM [<identifier> ―/‖ <name>] of Parameter Set for which this Nominal Value
instance is valid
Valid_for_SI [<identifier> ―/‖ <name>] of State Item for which this Nominal Value instance is
valid
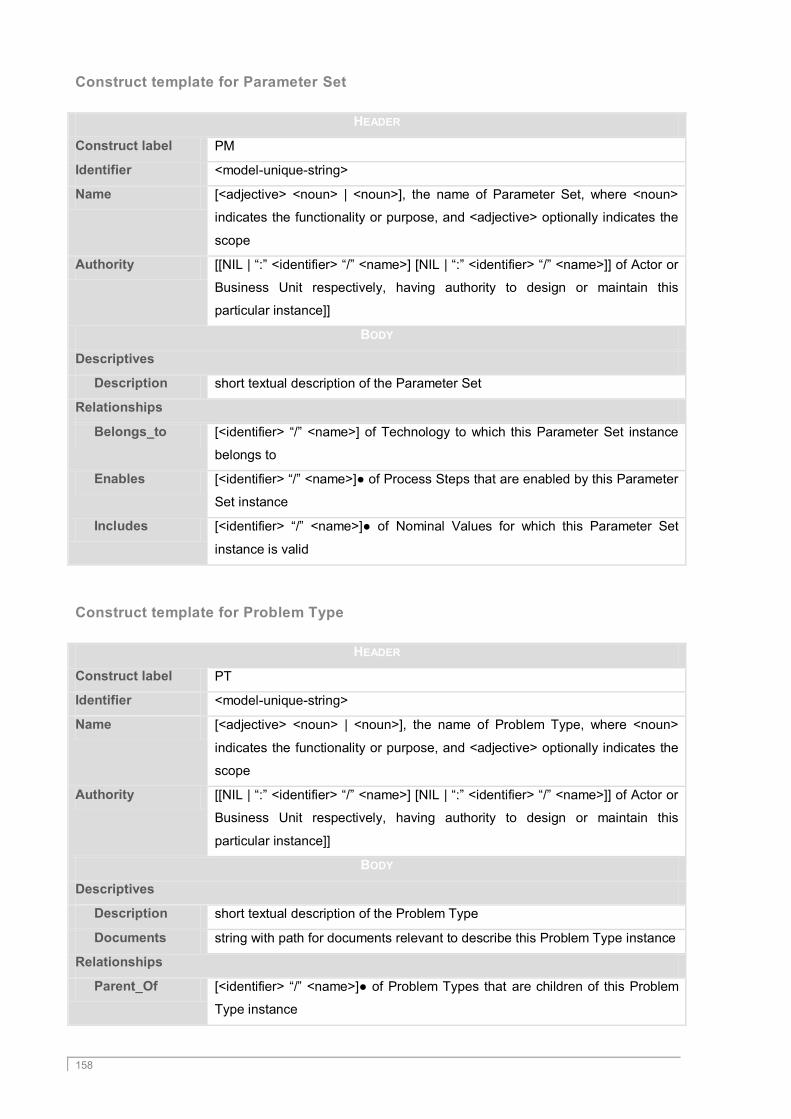
158
Construct template for Parameter Set
HEADER
Construct label PM
Identifier <model-unique-string>
Name [<adjective> <noun> | <noun>], the name of Parameter Set, where <noun>
indicates the functionality or purpose, and <adjective> optionally indicates the
scope
Authority [[NIL | ―:‖ <identifier> ―/‖ <name>] [NIL | ―:‖ <identifier> ―/‖ <name>]] of Actor or
Business Unit respectively, having authority to design or maintain this
particular instance]]
BODY
Descriptives
Description short textual description of the Parameter Set
Relationships
Belongs_to [<identifier> ―/‖ <name>] of Technology to which this Parameter Set instance
belongs to
Enables [<identifier> ―/‖ <name>]● of Process Steps that are enabled by this Parameter
Set instance
Includes [<identifier> ―/‖ <name>]● of Nominal Values for which this Parameter Set
instance is valid
Construct template for Problem Type
HEADER
Construct label PT
Identifier <model-unique-string>
Name [<adjective> <noun> | <noun>], the name of Problem Type, where <noun>
indicates the functionality or purpose, and <adjective> optionally indicates the
scope
Authority [[NIL | ―:‖ <identifier> ―/‖ <name>] [NIL | ―:‖ <identifier> ―/‖ <name>]] of Actor or
Business Unit respectively, having authority to design or maintain this
particular instance]]
BODY
Descriptives
Description short textual description of the Problem Type
Documents string with path for documents relevant to describe this Problem Type instance
Relationships
Parent_Of [<identifier> ―/‖ <name>]● of Problem Types that are children of this Problem
Type instance

159
Child_Of [<identifier> ―/‖ <name>] of Problem Type that is the parent of this State Item
instance
Defines [<identifier> ―/‖ <name>]● of Problems that are defined by this Problem Type
instance
Construct template for Cause
HEADER
Construct label CS
Identifier <model-unique-string>
Name [<adjective> <noun> | <noun>], the name of Cause, where <noun> indicates
the functionality or purpose, and <adjective> optionally indicates the scope
Authority [[NIL | ―:‖ <identifier> ―/‖ <name>] [NIL | ―:‖ <identifier> ―/‖ <name>]] of Actor or
Business Unit respectively, having authority to design or maintain this
particular instance]]
BODY
Descriptives
Description short textual description of the Cause
Documents string with path for documents relevant to describe this Cause instance
Relationships
Parent_Of [<identifier> ―/‖ <name>]● of Causes that are children of this Cause instance
Child_Of [<identifier> ―/‖ <name>] of Cause that is the parent of this Cause instance
Causes [<identifier> ―/‖ <name>]● of Problems that are caused by this Cause instance
Eliminated_by [<identifier> ―/‖ <name>]● of Actions that have to be realised to eliminate this
Cause instance
Construct template for Action
HEADER
Construct label AN
Identifier <model-unique-string>
Name [<adjective> <noun> | <noun>], the name of Action, where <noun> indicates
the functionality or purpose, and <adjective> optionally indicates the scope
Authority [[NIL | ―:‖ <identifier> ―/‖ <name>] [NIL | ―:‖ <identifier> ―/‖ <name>]] of Actor or
Business Unit respectively, having authority to design or maintain this
particular instance]]
BODY
Descriptives
Description short textual description of the Action

160
Documents string with path for documents relevant to describe this Action instance
Efforts description of human efforts necessary to implement this Action instance
Resources description of physical resources necessary to implement this Action instance
Sequence indication of the implementation sequence of the Action, when several actions
are needed
Relationships
Parent_Of [<identifier> ―/‖ <name>]● of Causes that are children of this Cause instance
Child_Of [<identifier> ―/‖ <name>] of Cause that is the parent of this Cause instance
Defines [<identifier> ―/‖ <name>]● of Probable Causes that are defined by this Cause
instance
Eliminated_by [<identifier> ―/‖ <name>]● of Actions that have to be realised to eliminate this
Cause instance
Construct template for Problem
HEADER
Construct label PR
Identifier <model-unique-string>
Name [<adjective> <noun> | <noun>], the name of Problem, where <noun> indicates
the functionality or purpose, and <adjective> optionally indicates the scope
Authority [[NIL | ―:‖ <identifier> ―/‖ <name>] [NIL | ―:‖ <identifier> ―/‖ <name>]] of Actor or
Business Unit respectively, having authority to design or maintain this
particular instance]]
BODY
Descriptives
Description short textual description of the Problem
Documents string with path for documents relevant to describe this Problem instance
Last process description of the last thing done before the problem occurred
PLC report XML file with a report from a PLC relevant for the problem
Downtime numeric indication of any downtime caused by this problem
Status CREATED | DESCRIBED | SOLVED | ELIMINATED
Date detected date when the problem report was created in the knowledge base
Date created date when the problem was detected in the installation
Date removed date when the problem‘s cause was identified
Date eliminated date when the actions to eliminate the problem were successfully implemented
Relationships
Defined_by [<identifier> ―/‖ <name>] of Problem Type that defines this Problem instance
Caused_by [<identifier> ―/‖ <name>]● of Probable Causes that caused the occurrence of
this Problem instance

161
Involves [<identifier> ―/‖ <name>]● of Generics that are involved in this Problem
instance
Occurred_ABI [<identifier> ―/‖ <name>]● of Actual Boolean Items that were measured and
registered during or shortly after the occurrence of the Problem instance in
Generics involved in the Problem instance
Occurred_ACI [<identifier> ―/‖ <name>]● of Actual Char Items that were measured and
registered during or shortly after the occurrence of the Problem instance in
Generics involved in the Problem instance
Occurred_ADI [<identifier> ―/‖ <name>]● of Actual Date Items that were measured and
registered during or shortly after the occurrence of the Problem instance in
Generics involved in the Problem instance
Occurred_ANI [<identifier> ―/‖ <name>]● of Actual Numeric Items that were measured and
registered during or shortly after the occurrence of the Problem instance in
Generics involved in the Problem instance
Occurred_ASI [<identifier> ―/‖ <name>]● of Actual Symbolic Items that were measured and
registered during or shortly after the occurrence of the Problem instance in
Generics involved in the Problem instance
Construct template for Actual Boolean Item
HEADER
Construct label ABI
Identifier <model-unique-string>
Authority [[NIL | ―:‖ <identifier> ―/‖ <name>] [NIL | ―:‖ <identifier> ―/‖ <name>]] of Actor or
Business Unit respectively, having authority to design or maintain this
particular instance]]
BODY
Descriptives
Value TRUE | FALSE
Significance significance of this value for the problem description
Timestamp timestamp when the value was measured or read
Relationships
Occurs_at [<identifier> ―/‖ <name>] of Problem when this Actual Boolean Item instance
has occurred
Defined_by [<identifier> ―/‖ <name>] of State Item that defines this Actual Boolean Item
instance (the State Item has to have type BOI)
Refers_to [<identifier> ―/‖ <name>] of State to which this Actual Boolean Item instance
refers
Valid_for [<identifier> ―/‖ <name>] of Generic involved in the problem for which this
Actual Boolean Item instance is valid
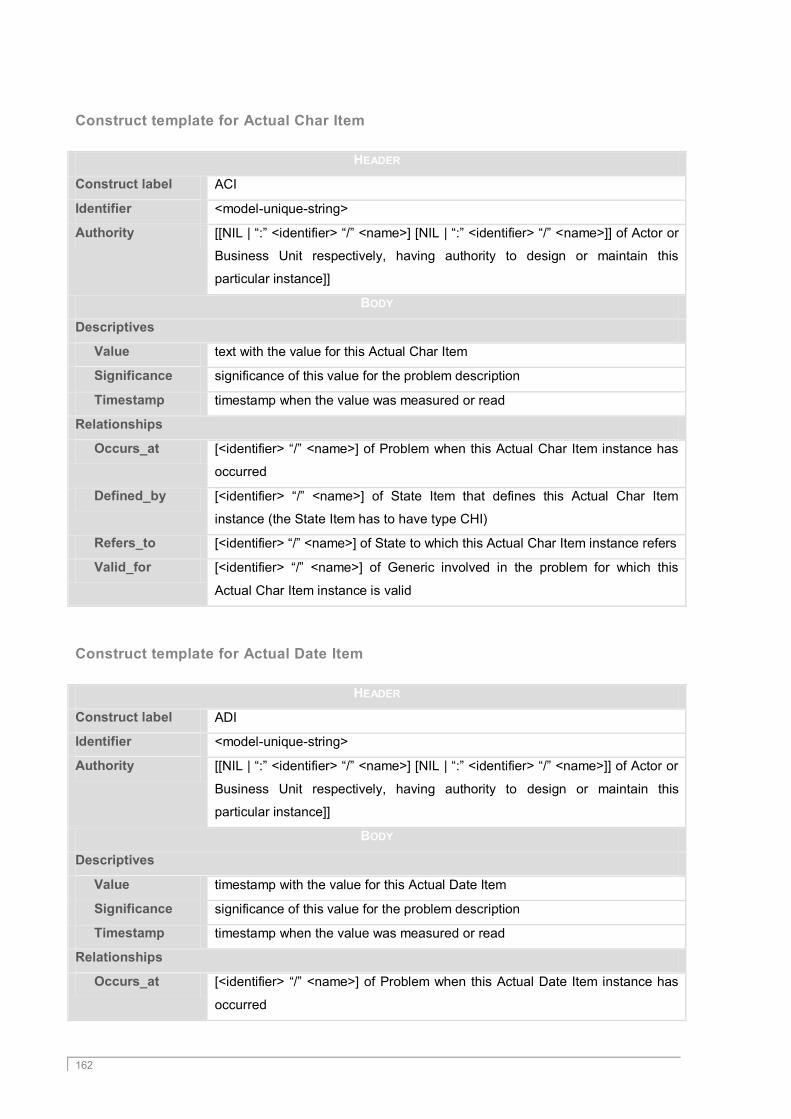
162
Construct template for Actual Char Item
HEADER
Construct label ACI
Identifier <model-unique-string>
Authority [[NIL | ―:‖ <identifier> ―/‖ <name>] [NIL | ―:‖ <identifier> ―/‖ <name>]] of Actor or
Business Unit respectively, having authority to design or maintain this
particular instance]]
BODY
Descriptives
Value text with the value for this Actual Char Item
Significance significance of this value for the problem description
Timestamp timestamp when the value was measured or read
Relationships
Occurs_at [<identifier> ―/‖ <name>] of Problem when this Actual Char Item instance has
occurred
Defined_by [<identifier> ―/‖ <name>] of State Item that defines this Actual Char Item
instance (the State Item has to have type CHI)
Refers_to [<identifier> ―/‖ <name>] of State to which this Actual Char Item instance refers
Valid_for [<identifier> ―/‖ <name>] of Generic involved in the problem for which this
Actual Char Item instance is valid
Construct template for Actual Date Item
HEADER
Construct label ADI
Identifier <model-unique-string>
Authority [[NIL | ―:‖ <identifier> ―/‖ <name>] [NIL | ―:‖ <identifier> ―/‖ <name>]] of Actor or
Business Unit respectively, having authority to design or maintain this
particular instance]]
BODY
Descriptives
Value timestamp with the value for this Actual Date Item
Significance significance of this value for the problem description
Timestamp timestamp when the value was measured or read
Relationships
Occurs_at [<identifier> ―/‖ <name>] of Problem when this Actual Date Item instance has
occurred
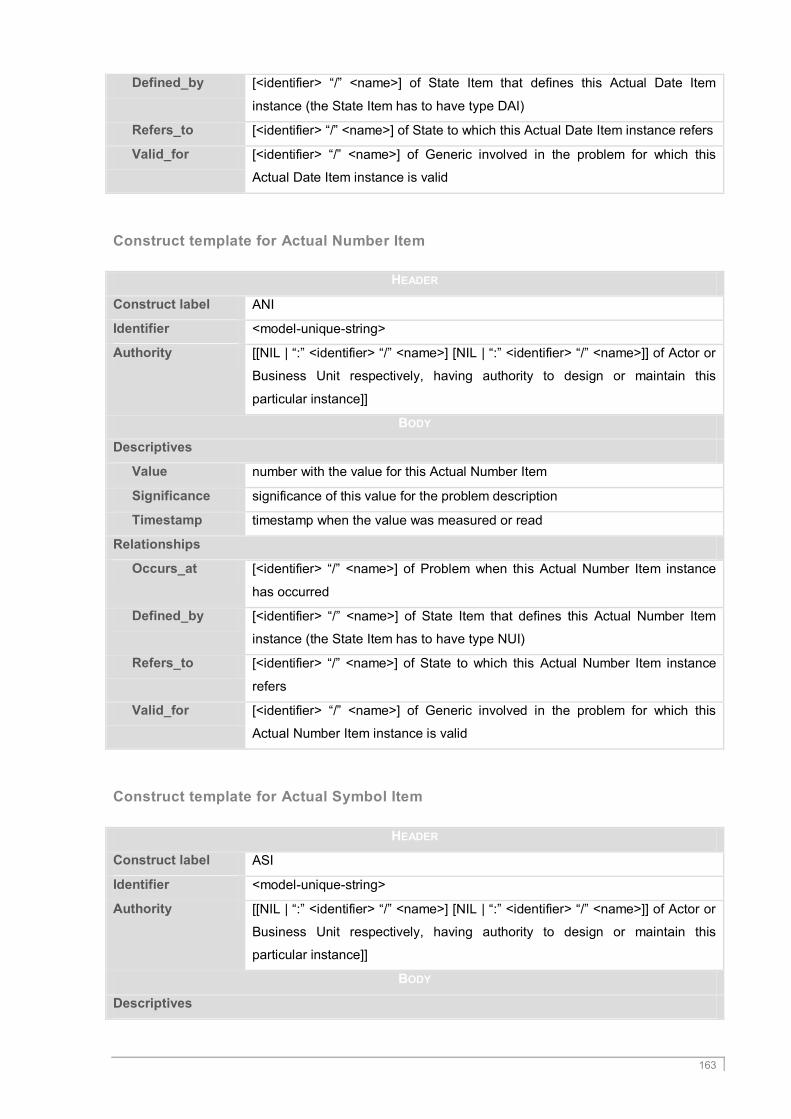
163
Defined_by [<identifier> ―/‖ <name>] of State Item that defines this Actual Date Item
instance (the State Item has to have type DAI)
Refers_to [<identifier> ―/‖ <name>] of State to which this Actual Date Item instance refers
Valid_for [<identifier> ―/‖ <name>] of Generic involved in the problem for which this
Actual Date Item instance is valid
Construct template for Actual Number Item
HEADER
Construct label ANI
Identifier <model-unique-string>
Authority [[NIL | ―:‖ <identifier> ―/‖ <name>] [NIL | ―:‖ <identifier> ―/‖ <name>]] of Actor or
Business Unit respectively, having authority to design or maintain this
particular instance]]
BODY
Descriptives
Value number with the value for this Actual Number Item
Significance significance of this value for the problem description
Timestamp timestamp when the value was measured or read
Relationships
Occurs_at [<identifier> ―/‖ <name>] of Problem when this Actual Number Item instance
has occurred
Defined_by [<identifier> ―/‖ <name>] of State Item that defines this Actual Number Item
instance (the State Item has to have type NUI)
Refers_to [<identifier> ―/‖ <name>] of State to which this Actual Number Item instance
refers
Valid_for [<identifier> ―/‖ <name>] of Generic involved in the problem for which this
Actual Number Item instance is valid
Construct template for Actual Symbol Item
HEADER
Construct label ASI
Identifier <model-unique-string>
Authority [[NIL | ―:‖ <identifier> ―/‖ <name>] [NIL | ―:‖ <identifier> ―/‖ <name>]] of Actor or
Business Unit respectively, having authority to design or maintain this
particular instance]]
BODY
Descriptives

164
Significance significance of this value for the problem description
Timestamp timestamp when the value was measured or read
Relationships
Defined_by [<identifier> ―/‖ <name>] of Symbol that defines the value for this Actual
Symbol Item instance
Occurs_at [<identifier> ―/‖ <name>] of Problem when this Actual Symbol Item instance
has occurred
Defined_by [<identifier> ―/‖ <name>] of State Item that defines this Actual Symbol Item
instance
Refers_to [<identifier> ―/‖ <name>] of State to which this Actual Symbol Item instance
refers
Valid_for [<identifier> ―/‖ <name>] of Generic involved in the problem for which this
Actual Symbol Item instance is valid

165
ANNEX B. MODELLING METHODOLOGY TOOLS
Checklist to collect static data
Business Units: companies and respective departments.
Technologies: scientific topics that reflect expertise spread in the extended
enterprise.
Actors: people in the several companies and/or departments and their respective
expertise.
Production Units: tools used in the extended enterprise to support activities.
Process Steps: activities of the extended enterprise, which transform an input to
realise a product.
Product Parts: products realised or used in the activities of the extended enterprise,
which can represent anything from raw material to an end product.
States: groups of characteristics valid for production units, process steps and/or
product parts.
State Items: individual variables that can be measured for a specific production unit,
process step and/or product part.
Influences: limitations that one physical element may have on others.
Problem Types: list of typical problems that occur in the extended enterprise and can
be used for classification of problems.
Causes: List of causes that are identified for typical problems.
Actions: List of actions to be implemented to remove a specific typical cause.
Questionnaire for semi-structured interview to employees
NOTE TO THE INTERVIEWER: The employees of industrial companies in extended
enterprises are usually sceptic towards explicitly providing their knowledge and are generally
busy people. During the interview, be cordial, direct and as succinct as possible. It is not
mandatory to obtain all information in one single interview. The information obtained will be
crossed with other sources and other exercises will follow to validate and complete the
extended enterprise model. The questions in this interview are targeted at employees that
have explicit and implicit knowledge about the processes of the extended enterprise. The

166
objective is to acquire knowledge about their ―environment‖ and not the whole extended
enterprise.
1. Identify yourself and your job position.
2. Identify your department within the company.
3. With which other departments do you contact in the scope of your job?
4. Identify the people with whom you work and name their respective departments.
5. Can you describe the expertise needed for your job?
6. List the tools/machines you use in your daily job, and explain how and for what you use
each of them.
7. Describe the measures that are possible to obtain for any machine or product in your
department. Describe any controlling and/or automation infrastructure available in your
department that can provide any of these measures.
8. List a list of typical problems that occur frequently in the processes where you work.
9. For each ―typical problem‖, describe the usual cause and what is done to fix it.
Questionnaire for semi-structured interview to managers
NOTE TO THE INTERVIEWER: Managers of industrial companies in extended enterprises are
usually very busy people but have the ultimate responsibility to ensure the successful
introduction of knowledge-based systems. Therefore, it is of their interest to collaborate to
achieve the best enterprise model available. During the interview, be cordial, direct and as
succinct as possible. It is not mandatory to obtain all information in one single interview. The
information obtained will be crossed with other sources and other exercises will follow to
validate and complete the extended enterprise model. This interview is targeted to managers
of the extended enterprise, who have access to the ―big picture‖. This means that the
questions are now directed to the whole enterprise and not to a specific department (in
opposition to the previous interview).
1. Identify yourself and your job position.
2. Identify all departments within your company.
3. Identify the main customers, suppliers and other business partners of your company.
4. Name the person responsible for each company and department.
5. Describe the overall technical expertise available in the company.
6. (Show the list of all actors already identified in other interviews) Identify the department
where each of these employees belongs.
7. Describe roughly the overall production/manufacturing/assembly processes in the
company. Try to identify the output of each step, but mainly the finished products.
8. Identify which products are sold to which customers.
9. Identify which machines/tools are bought to each supplier.

167
ANNEX C. DECISION-MAKING QUESTIONNAIRE
DECISION-MAKING QUESTIONNAIRE
Please fill in the following information
Job title: ___________________________________________________
Age: < 30 31 – 45 > 46
Gender: Female Male
Department: ___________________________________________________
Company Name: ___________________________________________________
Company Type: (please select from below)
Non Manufacturing Companies
Agriculture, hunting and forestry Fishing Mining and quarrying
Electricity, gas and water supply Construction
Wholesale and retail trade; repair of motor vehicles, motorcycles and personal and household goods
Hotels and restaurants Transport, storage and
communication Financial intermediation
Real estate, renting and business activities
Public administration and defence; compulsory social security
Education
Health and social work Other community, social and
personal service activities Activities of households
Extra-territorial organizations and bodies
Manufacturing Companies
Manufacture of food products, beverages and tobacco
Manufacture of textiles and textile products
Manufacture of leather and leather products
Manufacture of wood and wood products
Manufacture of pulp, paper and paper products, publishing and printing
Manufacture of coke, refined petroleum products and nuclear fuels
Manufacture of chemicals, chemical products and man-made fibres
Manufacture of rubber and plastic products
Manufacture of other non-metallic mineral products
Manufacture of basic metals and fabricated metal products
Manufacture of machinery and equipment n.e.c.
Manufacture of electrical and optical equipment
Manufacture of transport equipment
Manufacturing n.e.c.

168
1. Who makes decisions in your company? For each type of decision (indicated in
the columns) select the actors involved in the decision-making processes (check
all that apply for each type).
Routine1 Emergency
2 Strategic
3 Operational
4
Small senior group, including CEO or equivalent
Business unit leaders
CEO or equivalent
Frontline employees (e.g. shift leader)
Shop floor employees
Interdisciplinary teams
Other please specify: __________________________ ______________________________________ ______________________________________ ______________________________________
2. Is there a formal systematic approach in your company (e.g. a methodology) to
be followed by everyone when making any decision? (If yes please indicate name)
No Yes
Please specify: ___________________________________________
3. Each person has its own style of making decisions. Please rate the following
issues taking into account the most dominant style in your department, or, if
possible, company.
Always Often Rarely Never
Make conclusions based on hunches/hints
Analyse all individual issues to understand the global picture
Use imagination to create and foster new ideas
Use knowledge, ability and experience
Being driven by emotion or sensibility
Apply logic to reach conclusions
1 The same circumstances repeat and when they appear, it is necessary to choose a proved course of
action. 2 Situations without precedent, often requiring immediate decisions following course of events; very
time consuming. 3 The most demanding type; implies strategic choices such as deciding on purpose and objectives and
converting them into specific plans for the company or sub-decisions. 4 Decisions are related to the regular running of the company, including hiring and firing employees
(human resources); requires very sensitive handling.

169
4. Consider the culture, attitude, approach, and policy of your management’s
company towards employees. Classify as true or false the following sentences,
describing your company’s culture.
True False
New ideas are, quite often, refused or set aside.
All personnel is entitled to its autonomy and is able to show initiative.
The focus of the organisation is in facing and solving problems.
Stability and experience are the most valued attributes in the company.
The opinions and policies change frequently, according to the circumstances.
The command and control are the dominant process.
It is almost impossible to change the organisation‘s thinking process.
New and creative ideas are very welcome.
The organisation focus primarily on the clients needs.
The emphasis of the company resides in exploiting new opportunities.
Motivation and innovation are among the most important characteristics.
The objectives of the company and the individuals are tightly associated.
The organisation is not always driven by external needs.
The well-being of the company is above any individual success.
5. Indicate which of the following types of decision-making are used in your
company. Please write numbers from 1 to 4 in each space, where 1 is vital and 4 is
irrelevant.
Routine Emergency Strategic Operational
IRREVERSIBLE
After the decision is made, it cannot be annulled.
REVERSIBLE
The decision can be completely modified, either before, during or after it is made.
EXPERIMENTAL The decision is not final until the first test results are available and considered satisfactory.
TRIAL AND ERROR
Decisions are made, tried and adopted according to the course of actions.
MADE IN STAGES Decisions are made in steps until the whole action is completed.
CAUTIOUS
The decision takes into account contingencies or problems which may occur later.
CONDITIONAL The decisions can be modified if foreseen circumstances arise.
DELAYED
The decision is put on hold until the right moment; a
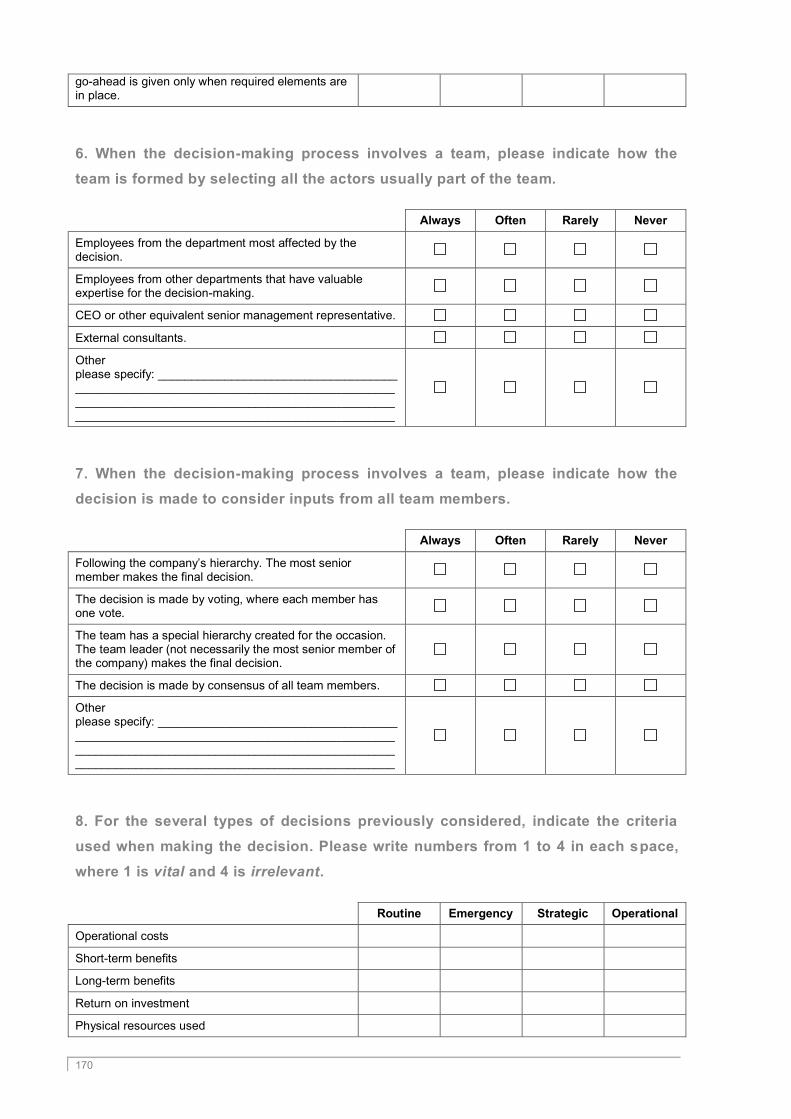
170
go-ahead is given only when required elements are in place.
6. When the decision-making process involves a team, please indicate how the
team is formed by selecting all the actors usually part of the team.
Always Often Rarely Never
Employees from the department most affected by the decision.
Employees from other departments that have valuable expertise for the decision-making.
CEO or other equivalent senior management representative.
External consultants.
Other please specify: ____________________________________ ________________________________________________ ________________________________________________ ________________________________________________
7. When the decision-making process involves a team, please indicate how the
decision is made to consider inputs from all team members.
Always Often Rarely Never
Following the company‘s hierarchy. The most senior member makes the final decision.
The decision is made by voting, where each member has one vote.
The team has a special hierarchy created for the occasion. The team leader (not necessarily the most senior member of the company) makes the final decision.
The decision is made by consensus of all team members.
Other please specify: ____________________________________ ________________________________________________ ________________________________________________ ________________________________________________
8. For the several types of decisions previously considered, indicate the criteria
used when making the decision. Please write numbers from 1 to 4 in each space,
where 1 is vital and 4 is irrelevant.
Routine Emergency Strategic Operational
Operational costs
Short-term benefits
Long-term benefits
Return on investment
Physical resources used

171
Routine Emergency Strategic Operational
Human resources used
Product/ service quality
Manufacturing/assembly process efficiency
Risk assessment
Suppliers constraints
Efforts to implement the decision
Time necessary to make the decision
Others (please fill in the rows)
9. To make the decision, it is necessary to collect information and knowledge.
Please rate the sources of information used by you and your company in decision-
making processes.
Always Often Rarely Never
Company‘s library
Internal statistics
Financial forecasts from the company
Co-workers
Researchers in the company
Friends
External contacts
Competitors
Newspapers and journals
Seminars and workshops
Internet
Management
Academic experts
Consultants
Economic/ market studies
Other please specify: ____________________________________ ________________________________________________ ________________________________________________ ________________________________________________
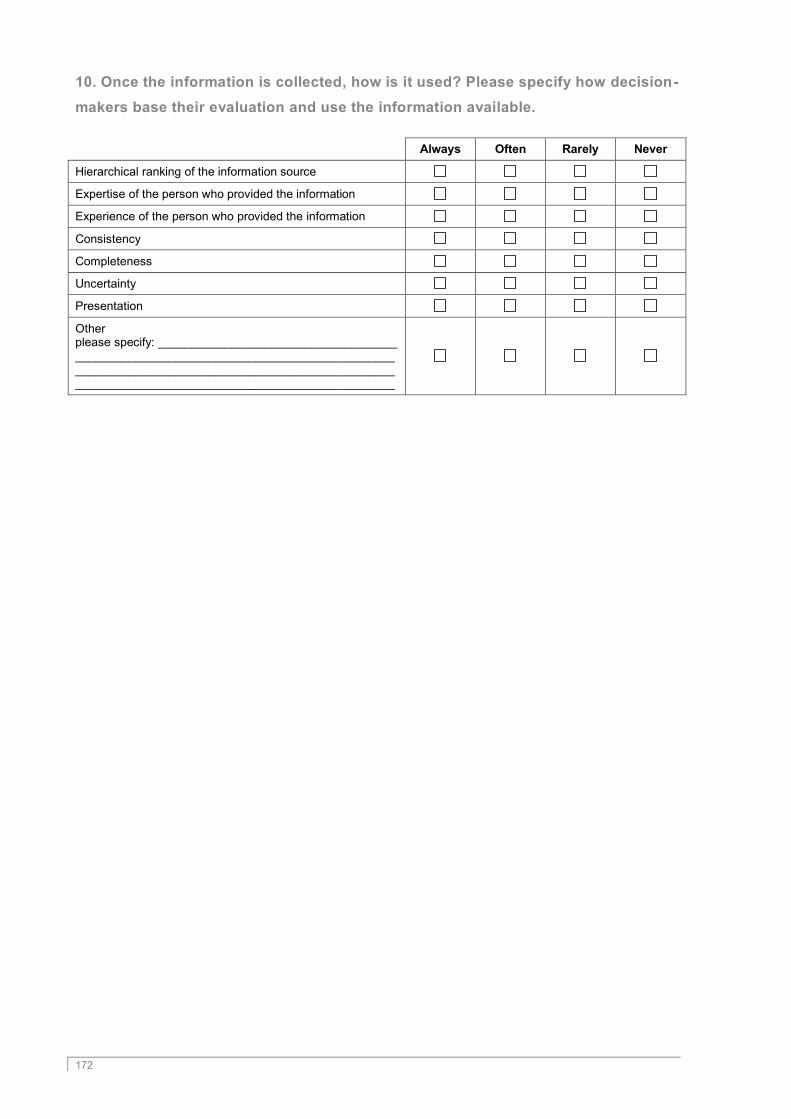
172
10. Once the information is collected, how is it used? Please specify how decision-
makers base their evaluation and use the information available.
Always Often Rarely Never
Hierarchical ranking of the information source
Expertise of the person who provided the information
Experience of the person who provided the information
Consistency
Completeness
Uncertainty
Presentation
Other please specify: ____________________________________ ________________________________________________ ________________________________________________ ________________________________________________