Embed Size (px)
Citation preview
Departamento de Ciências e Engenharia do Ambiente
MBR activated sludge filterability
characterization in cross flow filtration
Martim Félix Bento Franco
Dissertação apresentada na Faculdade de Ciências e Tecnologia da Universidade Nova de Lisboa
para a obtenção do grau de Mestre em Engenharia do Ambiente, perfil Sanitária
Orientador científico: Professora Doutora Leonor Amaral
Lisboa, 2009

i
Like our ancestors needed the Sea to reach great achievements, without fear of the unknown.
Our generation and the following also depend on the Sea for their development and well
being.
I dedicate my Master Thesis to my parents, my girlfriend and my family

iii
Acknowledgements
The research project that supports this thesis was carried out at the Sanitary Department of Civil
Engineering Faculty at TU Delft University, from February to July 2009.
Through this University it was possible to perform a practical work in a wastewater treatment plant
(WWTP) in Heenvliet and I would like to thank André Westerdijk the WWTP responsible, for all the
support in the plant.
I would like to express my gratitude to Leonor Amaral, my supervisor in Lisbon and to Adrien Moreau,
my supervisor in Delft, for all the support and their availability.
I also would like to express my appreciation to everyone in the Sanitary Department of TU Delft for
their friendship and daily support, especially to Maria Lousada, Tony Schuit, Patrick Andeweg and
Mike Hubert.
Special thanks to my parents to offer me this important opportunity in my student life, to my
girlfriend and all my family for the support.

v
RESUMO
Comparando com os métodos tradiconais de lamas activadas, é a fiabilidade de funcionamento dos
biorreactores de membrana (MBR) e a sua capacidade de obtenção de resultados bastante
satisfatórios relativamente às exigências de tratamento de águas residuais o que torna esta
tecnologia tão promissora.
No entanto, a separação fase sólida - fase líquida que integra o tratamento biológico, por se tratar de
um sistema físico e químico induz um fenómeno chamado fouling - fenómeno que se baseia no
entupimento da membrana, que obriga a incluir no processo de tratamento, custos adicionais
associados ao aumento do consumo de energia e a lavagens físicas e químicas periódicas.
Na presente tese é realizado um enquadramento da utilização da tecnologia MBR e apresentado o
estado actual dos conhecimentos referentes a esta tecnologia.
Os trabalhos de investigação desenvolvidos tiveram uma componente eminentemente experimental,
tendo sido utilizada uma instalação de caracterização de filtração (DFCi) de lamas activadas,
desenvolvida pela Delft University of Technology (Evenblij et al., 2005) na Holanda. Na ETAR de
Heenvliet, também na Holanda, cujo tratamento inclui um sistema convencional de lamas activadas
em arejamento prolongado e um sistema MBR, foram realizados ensaios de filterabilidade, com
controlo de sólidos suspensos, colóides e solutos constituintes das lamas activadas do sistema de
MBR através das seguintes análises laboratoriais: sólidos suspensos totais, sólidos suspensos voláteis,
carência química de oxigénio, contagem de partículas nos intervalos 0.4-5.0 µm e carbono orgânico
total.
Foi estudada a influência da velocidade de atravessamento das lamas activadas em membranas com
filtração de fluxo cruzado (onde a água residual percorre a membrana paralelamente à sua superfície)
e também foi realizada uma monitorização in situ da filterabilidade das lamas activadas do sistema
MBR da ETAR de Heenvliet.
vi
Os resultados obtidos nas análises relativas à monitorização da filterabilidade das lamas activadas do
sistema MBR da ETAR de Heenvliet mostraram correlações fortes do tratamento biológico e das
variações sazonais com as características e filterabilidade das lamas activadas. Em relação à
influência da velocidade de atravessamento das lamas activadas nas membranas com filtração de
fluxo cruzado, as velocidades de atravessamento acima de 1m/s (consideradas as mais elevadas,
nesta investigação) apresentaram as melhores correlações entre a filterabilidade das lamas activadas
e as respectivas características analisadas.
vii
ABSTRACT
The reliability of MBR operation and its capability to produce favorable results as regards water
treatment, in comparison with conventional activated sludge systems, makes this technology so
promising.
However as the MBR treatment process is a physical chemical process involving filtration and
biological treatment, it leads to the phenomena of fouling – resulting in membranes becoming
obstructed, requiring more energy and physical chemical cleaning, thus increasing the additional
associated costs.
In this thesis, a framework analysis of MBR technology uses is undertaken and the current state of
the art regarding this technology.
This research included an important experimental component, with the Delft Filtration
Characterization method (DFCm) developed by TU Delft (Evenblij et al., 2005) for activated sludge
filterability measurements, developed by Delft University of Technology in the Netherlands.
Activated sludge filterability was compared with subsequent laboratory analyses: chemical oxygen
demand, total organic carbon, total suspended solids, volatile suspended solids and particle counts in
0.4-5.0µm range. The aim of these analyses was a fractionation of sludge samples in suspended
solids, colloids and solute. The sludge samples were collected on MBR full-scale in Heenvliet
Wastewater treatment plant (WWTP), also in the Netherlands, where the treatment process also
includes a conventional activated sludge system (oxidation ditch activated sludge).
The influence of different cross flow velocities on sludge filterability in cross flow filtration was
performed, using in-situ monitoring of Heenvliet WWTP.
The results obtained in this study relating to monitoring of Heenvliet WWTP, showed a strong
correlation between the activated sludge characteristics and the filterability.
viii
Regarding the influence of different cross flow velocities on sludge filterability in cross flow filtration,
velocities above 1m/s (considered as high velocity in this research), showed the strongest
correlations between the filterability of activated sludge and its respective fractionation compounds
(suspended solids, colloids and solutes).
ix
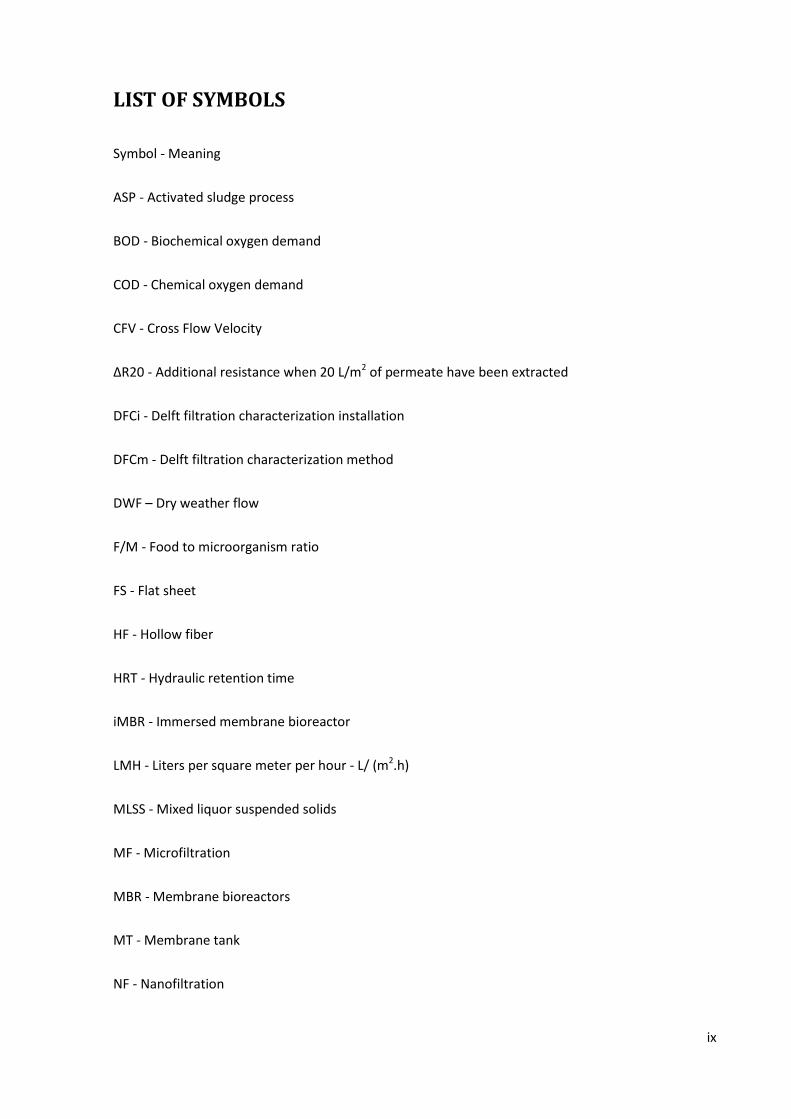
LIST OF SYMBOLS
Symbol - Meaning
ASP - Activated sludge process
BOD - Biochemical oxygen demand
COD - Chemical oxygen demand
CFV - Cross Flow Velocity
ΔR20 - Additional resistance when 20 L/m2 of permeate have been extracted
DFCi - Delft filtration characterization installation
DFCm - Delft filtration characterization method
DWF – Dry weather flow
F/M - Food to microorganism ratio
FS - Flat sheet
HF - Hollow fiber
HRT - Hydraulic retention time
iMBR - Immersed membrane bioreactor
LMH - Liters per square meter per hour - L/ (m2.h)
MLSS - Mixed liquor suspended solids
MF - Microfiltration
MBR - Membrane bioreactors
MT - Membrane tank
NF - Nanofiltration
x
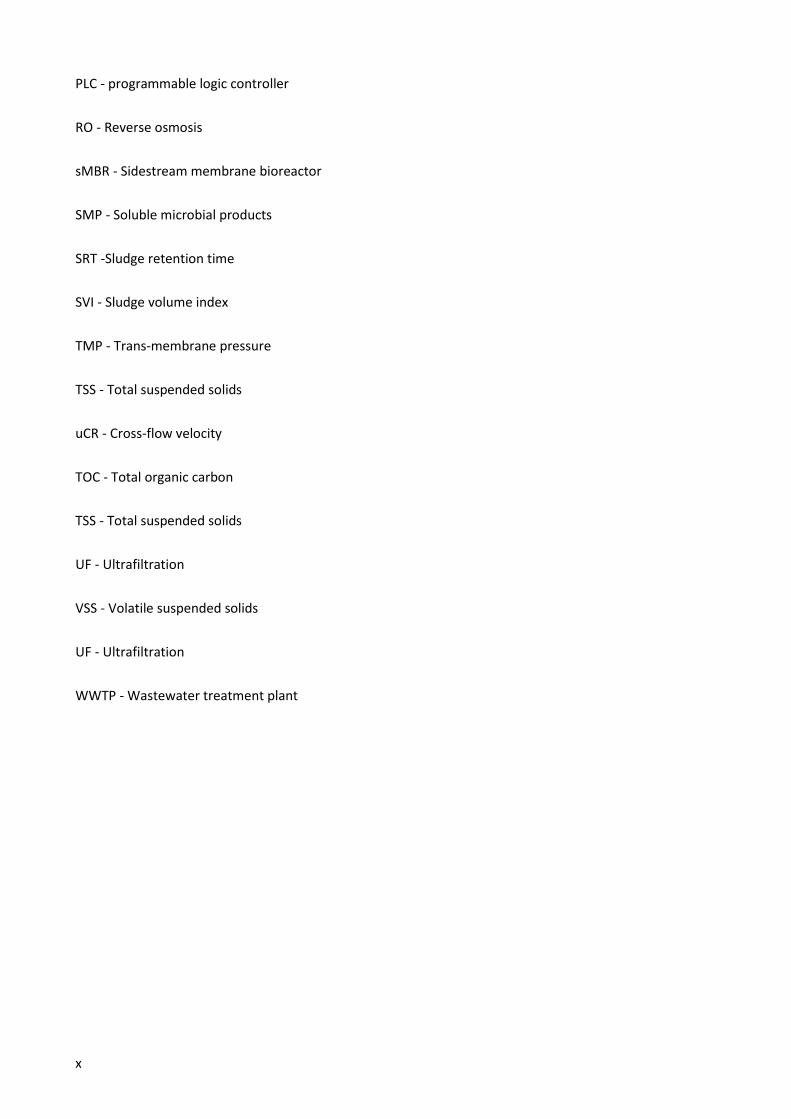
PLC - programmable logic controller
RO - Reverse osmosis
sMBR - Sidestream membrane bioreactor
SMP - Soluble microbial products
SRT -Sludge retention time
SVI - Sludge volume index
TMP - Trans-membrane pressure
TSS - Total suspended solids
uCR - Cross-flow velocity
TOC - Total organic carbon
TSS - Total suspended solids
UF - Ultrafiltration
VSS - Volatile suspended solids
UF - Ultrafiltration
WWTP - Wastewater treatment plant
xi
Contents
1 – INTRODUCTION ............................................................................................................................1
1.1 - General overview ...................................................................................................................1
1.2 - Objective ................................................................................................................................1
1.3 - Organization of the Thesis .....................................................................................................3
2 – LITERATURE REVIEW .....................................................................................................................5
2.1 - Activated sludge .....................................................................................................................5
2.2 - MBR State of the Art ..............................................................................................................7
2.2.1 - Membrane Bioreactor origins ........................................................................................7
2.2.2 - Membrane Bioreactor ....................................................................................................7
2.2.3 - Membrane Fouling ...................................................................................................... 11
2.2.3.1 - Fouling mechanisms ............................................................................................ 13
2.2.3.2 - Sustainable flux ................................................................................................... 14
2.2.4 - Difference with Conventional Activated sludge process (CAS) ................................... 16
2.2.5 Advantages/ Disadvantages .......................................................................................... 19
2.2.6 - Different technologies available ................................................................................. 20
3 – METHODOLOGY ......................................................................................................................... 23
3.1 - Delft Filtration Characterization method ............................................................................ 23
3.1.1 - Additional resistance (∆R20) ....................................................................................... 26
3.2 - Heenvliet wastewater treatment plant .............................................................................. 27
3.3 - Parameters used for research ............................................................................................. 32
4 – RESULTS AND DISCUSSION ........................................................................................................ 35
xii
4.1 - Experimental protocol ......................................................................................................... 35
4.2 - Heenvliet WWTP site Monitoring ........................................................................................ 36
4.3 - The influence of different cross-flow velocities on the filterability of different types of
activated sludge ................................................................................................................................ 41
4.3.1 - Particles counting in the diameter range of 0.4 – 5 µm .............................................. 41
4.3.2 - Chemical Oxygen Demand (COD) ................................................................................ 43
4.3.3 - Total Organic Carbon (TOC) ......................................................................................... 44
4.4 - The influence of different cross-flow velocities on the filterability of activated sludge. .... 45
4.4.1 - Particles counting in the diameter range of 0.4 – 5 µm VS ΔR20 ............................... 46
4.4.2 - Chemical Oxygen Demand (COD) VS ΔR20 .................................................................. 47
4.4.3 - Total Organic Carbone (TOC) VS ΔR20 ........................................................................ 48
4.4.4 – Physical interpretation of the results ......................................................................... 49
5 – CONCLUSIONS ............................................................................................................................ 51
6 – RECOMMENDATION FOR FURTHER RESEARCH ......................................................................... 53
7 – BIBLIOGRAPHY ........................................................................................................................... 55
APPENDIX I- Delft Filtration Characterization Method ......................................................................... 59
Appendix II – Standard Methods for MLSS ............................................................................................ 61
Appendix III – COD protocol .................................................................................................................. 65
Appendix IV – TOC protocol .................................................................................................................. 67
Appendix V – Particle counter in range 0.4 -5.0 µm.............................................................................. 71
xiii
LIST OF FIGURES
Figure 2.1 - Schematic showing the feed flowing perpendicular and tangential in (a) dead-end and (b)
cross-flow filtration, respectively. ......................................................................................................... 10
Figure 2.2 - Schematic of the immersed membrane (a) and external membrane (b). ......................... 11
Figure 2.3 - Different fouling mechanisms in membrane cross-flow filtration. .................................... 13
Figure 2.4 - Schematic view of a conventional activated sludge process and of a membrane bioreactor
process .................................................................................................................................................. 16
Figure 2.5 - Membrane configurations- a) flat sheet membrane, b) Hollow fiber membrane module, c)
Hollow fiber membrane, d) (multi) tubular membrane ........................................................................ 20
Figure 3.1 - Sludge peristaltic pump ...................................................................................................... 23
Figure 3.2 - Permeate peristaltic pump and permeate mass balance .................................................. 23
Figure 3.3 - Delft Filtration Characterization installation (Dfci) scheme ............................................... 24
Figure 3.4 - Picture of Dfci ..................................................................................................................... 25
Figure 3.5 - PLC, programmable logic controller ................................................................................... 25
Figure 3.6 - Flow sheet of Heenvliet WWTP ......................................................................................... 29
Figure 3.7 - Panoramic picture of Heenvliet ......................................................................................... 29
Figure 3.8 - Flow sheet of the MBR ....................................................................................................... 30
Figure 3.9 - Activated sludge pumps ..................................................................................................... 30
Figure 3.10 - Permeate extraction pumps ............................................................................................ 31
Figure 3.11 - Possible configurations of the hybrid system during dry weather flow and storm
weather flow. ........................................................................................................................................ 32
Figure 4.1 - Membrane tank sludge collection process ........................................................................ 35
xiv
Figure 4.2 - Development of the additional resistance and the chemical oxygen demand .................. 37
Figure 4.3 - Evolution of the additional resistance and the temperature ............................................. 38
Figure 4.4 - Number of particles counting (diameter range 0.4– 5µm) distribution and respectively
additional resistance ............................................................................................................................. 39
Figure 4.5 - Relation between TSS and VSS values for each additional resistance sludge sample ....... 40
Figure 4.6 - Relation between TSS and VSS values for each additional resistance sludge sample ....... 40
Figure 4.7 - Particles counting (diameter range 0.4 – 5µm) distribution and respectively additional
resistance, for each type of sludge and specific cross-flow velocity. .................................................... 42
Figure 4.8 - Chemical organic demand and respectively additional resistance, for each type of sludge
and specific cross-flow velocity. ............................................................................................................ 43
Figure 4.9 - Syringe and a filter with a pore size 0.45µm ...................................................................... 44
Figure 4.10 - Total organic carbon and respectively additional resistance, for each type of sludge and
specific cross-flow velocity .................................................................................................................... 45
Figure 4.11 - Particles counting (diameter range 0.4 – 5µm) distribution and respectively additional
resistance, for each cross-flow velocity ................................................................................................ 46
Figure 4.12 - Chemical oxygen demand and respectively additional resistance, for each specific cross-
flow velocity. ......................................................................................................................................... 47
Figure 4.13 - Total organic carbon and respectively additional resistance, for each specific cross-flow
velocity. ................................................................................................................................................. 48
xv
LIST OF TABLES
Table 2.1 - Nutrients removal and process conditions in MBRs and conventional activated sludge
process (CASP) for Municipal Wastewater Treatment. ........................................................................ 18
Table 2.2 - Membrane configurations and respectively cost and application ...................................... 21
Table 3.1 - Effluent requirements and targets ...................................................................................... 27
Table 3.2 - Specifications of the plant ................................................................................................... 28

MBR Activated sludge filterability characterization in cross flow filtration 1
1 – INTRODUCTION
1.1 - General overview
Nowadays a sustainable water use becomes more important than ever. As the climate changes are
accelerating and considering the water shortage in southern European countries in a near future the
situation will get worse. So an efficient water reuse is undoubtedly one of the answers to this
problem.
Considering this situation, the most efficient and effective technologies for wastewater treatment
and reuse are of increased interest in this context.
One of these technologies is the Membrane Bioreactor (MBR) which allows the separation of treated
wastewater from the active biomass, with a solid-liquid separation by membrane filtration.
1.2 - Objective
The MBR process is considered an advanced wastewater treatment technology, which permits
treatments of both municipal and industrial wastewater. However as the activated sludge contains
mostly suspended particles, during filtration occurs a phenomena called fouling, blocking the
membrane pores.
The membrane fouling phenomena have been investigated by many research groups around Europe
(and the rest of the world). This thesis describes the work done by the author in a research group of
water management in the Civil Engineering and Geosciences building, on TU Delft in the department
of water management, section of Sanitary Engineering in the Netherlands. It was supervised by the
engineer Adrien Moreau and included in his PhD research, which deals with the optimization full-
scale MBR, under the supervision of Professor ir. Jaap van der Graaf.
2 MBR Activated sludge filterability characterization in cross flow filtration
This research is included in the framework of a Master Thesis of the Environmental Engineering
course at the Faculty of Sciences and Technology from the New University of Lisbon. In Portugal this
work was supervised by Professor Leonor Miranda Monteiro do Amaral.
The practical work consisted in two important phases. A regular monitoring of activated sludge
filterability collected on the membrane tank of MBR system on Heenvliet Wastewater treatment
plant in Netherlands and the influence of different cross flow velocity (CFV) on tubular membrane
fouling, both analyses were performed with Dfci (Delft filtration characterization installation). It was
possible to expand this research with specific laboratory analyses of the activated sludge
characteristics. These laboratory experiments focused on activated sludge samples fractionation in
colloids, suspended solids and solutes (parameters that influence fouling phenomena). So it was
possible to specify the influence of different cross flow velocities with the comparison of the
activated sludge fractions and the activate sludge filterability.
The final goal is to provide practical and useful advices for MBR full-scale operation.
MBR Activated sludge filterability characterization in cross flow filtration 3
1.3 - Organization of the Thesis
In Chapter 2 a literature review with the MBR state of the art is given, where the general terms and
concepts involving wastewater treatment concepts and membrane filtration technology
characteristics are described.
Chapter 3 gives general information about Heenvliet WWTP, an explanation of Dfcm (Delft filtration
characterization method) and the practical methodology followed on this thesis.
The methodology followed on the research of this thesis and the results discussion are presented
more specifically in Chapter 4, where the general measuring protocol is described considering the
materials and methods for each laboratory analyses applied and the results obtained with the
respectively interpretations for each result.
The general conclusions are in chapter 5 and recommendations for further research are given in
chapter 6.

MBR Activated sludge filterability characterization in cross flow filtration 5
2 – LITERATURE REVIEW
2.1 - Activated sludge
The follow activated sludge process description was based in Metcalf &Eddy (2003) description
mentioned by Brandão (2009).
The activated sludge process is a suspended growth process of wastewater treatment where the
microorganisms (mainly bacteria) responsible for the organic matter degradation are maintained in
liquid suspension by appropriate aerobic mixing methods.
Thanks to experiences developed by Arden and Locket around 1912-1914, was discovered the
activated sludge process (ASP). They found that with aeration process applied to retained
wastewater, they could create an activated mass of microorganisms with aerobic stabilization of
organic matter present in the wastewater.
The ASP is a suspended enlargement process of wastewater treatment where the microorganisms
responsible for treatment are maintained in liquid suspension by appropriate mixing methods; this
mixture is usually mentioned as mixed liquor suspended solids (MLSS) and mixed liquor volatile
suspended solids (MLVSS).
Basically it is composed by a bioreactor with aeration system, where the biomass stays in suspension,
a liquid-solids separation, which is generally in sedimentation tanks, and a recirculation process that
allow the solids removed from the liquid-solids separation, return to the reactor to maintain
stabilized the ratio microorganisms and organic matter (F/M). In sedimentation tanks, the process
occurs by gravity due to the formation of flocculent settleable solids sized between the ranges of 50
to 200µm.
On wastewater treatment plants before the ASP the wastewater must suffer a preliminary treatment
which removes the coarse solids, grit and grease and a primary treatment (frequently omitted for
6 MBR Activated sludge filterability characterization in cross flow filtration
applications from smaller-sized communities, and in areas of the world that have hot climates) to
remove part of the suspended solids and organic matter from the wastewater. Pretreatment stage
(preliminary treatment) is a very important stage in the wastewater treatment because with the
proper functioning is possible increase the effectiveness of a later, more specific treatment and to
prevent damages in equipment.
The active biological material produced by activated sludge is responsible for removing
biodegradable organics, pathogens and nutrients like nitrogen and phosphorous. The biodegradable
organics are mainly composed by proteins, carbohydrates and fats, most commonly measured in
terms of biochemical oxygen demand (BOD) and chemical oxygen demand (COD). The nitrogen
remove method is executed by different bacteria and is based on the oxidization of ammonia
nitrogen (nitrification), converted into nitrite and nitrate follow by a reduction (denitrification) to
gaseous nitrogen dispersed into the atmosphere. For phosphorous removal it is induced bacteria
growth (with specific biological process) capable of phosphorous accumulating followed by a
sedimentation process.
For the ASP design the most critical parameter is the solids retention time (SRT) because it affects the
treatment process performance, aeration tank volume, sludge production and oxygen requirements.
Another important parameter in the ASP design is the food to microorganism ratio (F/M) which
represents the substrate available for the biomass, usual values for the BOD. F/M ratio reported in
the literature vary from 0.04 (g substrate/g biomass. day) for extended aeration processes to 1.0 (g
substrate/g biomass. day) for high rate processes.
The final stage in the ASP is the separation of the effluent from the biomass using traditionally
clarifier tank by gravity. The parameter used to design the clarifier tank involves the measurement of
the settling characteristics of the mixed liquors which is the sludge volume index (SVI in mL/g), which
corresponds to the volume of 1 g of sludge after 30 min of settling in 1 liter cylinder.
MBR Activated sludge filterability characterization in cross flow filtration 7
The removed sludge in waste water treatment plants are the largest constituent removed by
treatment. The principal methods used for solids processing are thickening (concentration), digestion,
and conditioning, followed by the removal moisture from solids and finally dewatering and drying.
2.2 - MBR State of the Art
2.2.1 - Membrane Bioreactor origins
In 1922 Zsigmondy patented the microporous membrane. And the first microfiltration membrane
being commercialized was in 1929 by the Sartorius Werke GmbH in Gottingen, Germany (Zsigmondy,
(1922), patented rights, cited by Belfort et al. (1994)). During the World War II, Germany used
microfiltration membranes, to rapidly guarantee water supplies in bombed-out German cities
(Belfort et al., 1994).
Then in the United States and Japan this technology saw an important commercial and process
development. During 1980’s Zenon Environmental became one of the most important companies in
United States and in Japan the agricultural machinery company Kubota was one of the most
important, both developing MBR technology (Judd, 2006). Nowadays there are a lot of new
membranes companies spread around the world, and the membrane market offers many
technologies for each specific use in water and wastewater treatment.
2.2.2 - Membrane Bioreactor
A membrane bioreactor is a technology which combines the activated sludge process (bioreactor)
with a membrane separation step. So it replaces and in some cases complements the solids
separation function of secondary clarification and effluent filtration (Metcalf & Eddy, 2003). Basically
a membrane is a material that allows some physical or chemical components to pass through more
readily than others. It is perm-selective, which means that it is more permeable to those constituents
passing trough it (which then became permeate) than those which are rejected by it (which form the
concentrate), (Judd, 2006).
8 MBR Activated sludge filterability characterization in cross flow filtration
The membrane support facility require equipment, such as pumps, for activated sludge circulation
and permeate extraction for constant flux filtrations, chemical storage tanks, chemical feed pumps,
air-scour systems and a back-pulse water flushing system. The constituents in the feed-water tend to
accumulate on the membranes increasing the inside pressure. Thus, the membrane flux starts to
decrease and the trans-membrane pressure increases. At a certain level of decreasing performance,
the membranes must be backwashed and/or chemically cleaned (Metcalf & Eddy, 2003).
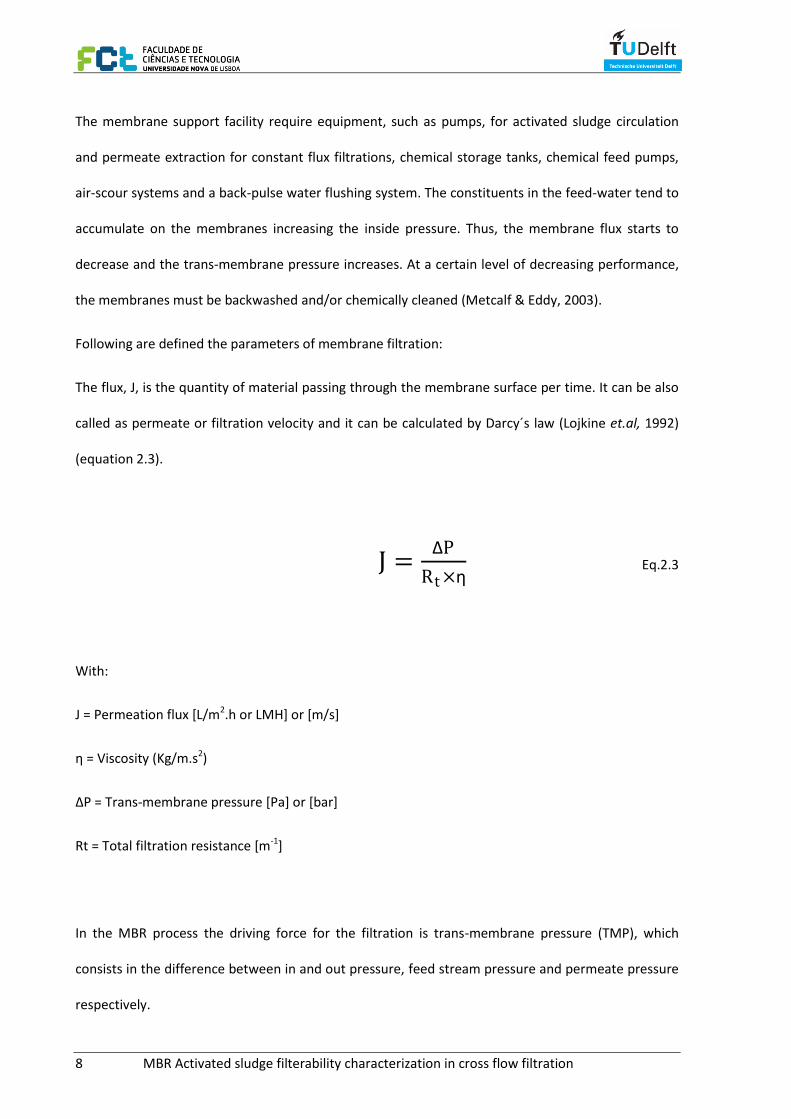
Following are defined the parameters of membrane filtration:
The flux, J, is the quantity of material passing through the membrane surface per time. It can be also
called as permeate or filtration velocity and it can be calculated by Darcy´s law (Lojkine et.al, 1992)
(equation 2.3).
J =ΔP
Rt ×η Eq.2.3
With:
J = Permeation flux [L/m2.h or LMH] or [m/s]
η = Viscosity (Kg/m.s2)
ΔP = Trans-membrane pressure [Pa] or [bar]
Rt = Total filtration resistance [m-1]
In the MBR process the driving force for the filtration is trans-membrane pressure (TMP), which
consists in the difference between in and out pressure, feed stream pressure and permeate pressure
respectively.
MBR Activated sludge filterability characterization in cross flow filtration 9
As the trans-membrane pressure increases during the filtration process, the membrane applies a
physical resistance which the total resistance is the sum of the resistance of the fouling layer and the
resistance offered by the membrane when it is clean (equation 2.4)
Rt = Rm + Rf Eq.2.4
With:
Rt = Total filtration resistance
Rm = Clean membrane resistance
Rf = Fouling resistance
The permeability, which is inversely proportional to total filtration resistance, is a common
parameter to characterize the membrane performance. It can be calculated through equation 2.5.
P =𝐽
𝑇𝑀𝑃 Eq.2.5
Where:
P = Permeability [Lm-2h-1bar-1]
J =Permeation flux [Lm-2h-1]
TMP = Trans-membrane pressure [Pa], or [bar]
10 MBR Activated sludge filterability characterization in cross flow filtration
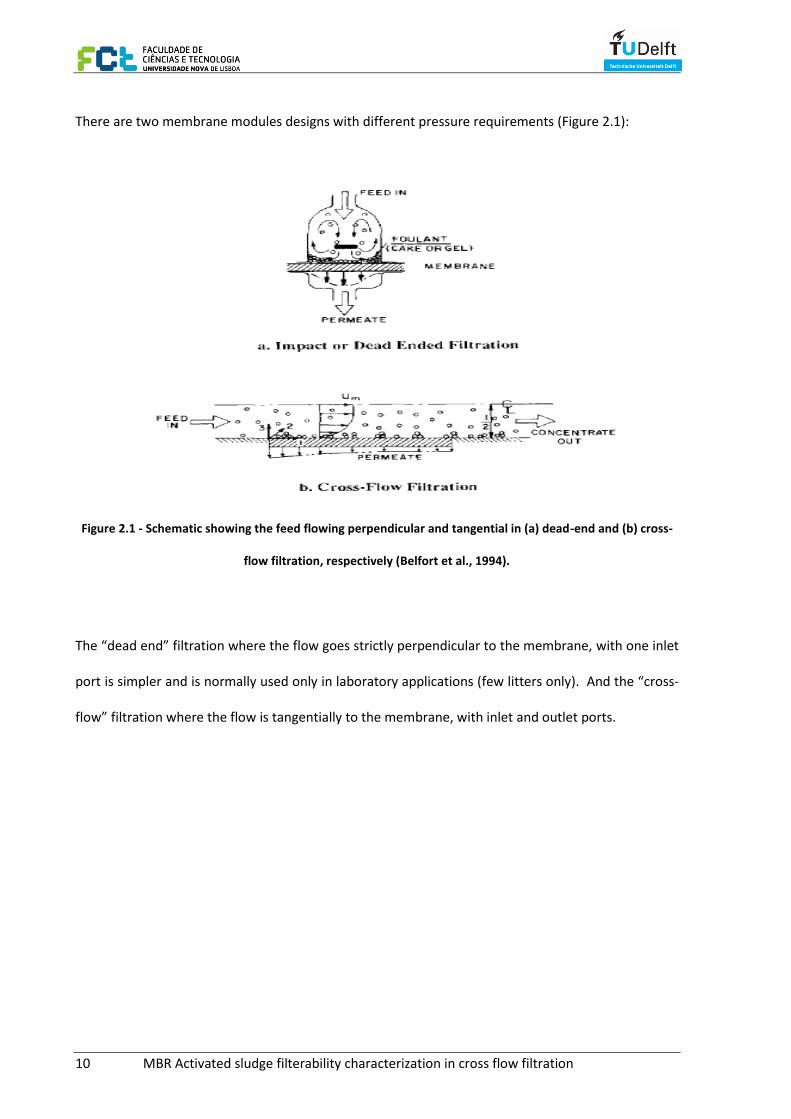
There are two membrane modules designs with different pressure requirements (Figure 2.1):
Figure 2.1 - Schematic showing the feed flowing perpendicular and tangential in (a) dead-end and (b) cross-
flow filtration, respectively (Belfort et al., 1994).
The “dead end” filtration where the flow goes strictly perpendicular to the membrane, with one inlet
port is simpler and is normally used only in laboratory applications (few litters only). And the “cross-
flow” filtration where the flow is tangentially to the membrane, with inlet and outlet ports.
MBR Activated sludge filterability characterization in cross flow filtration 11
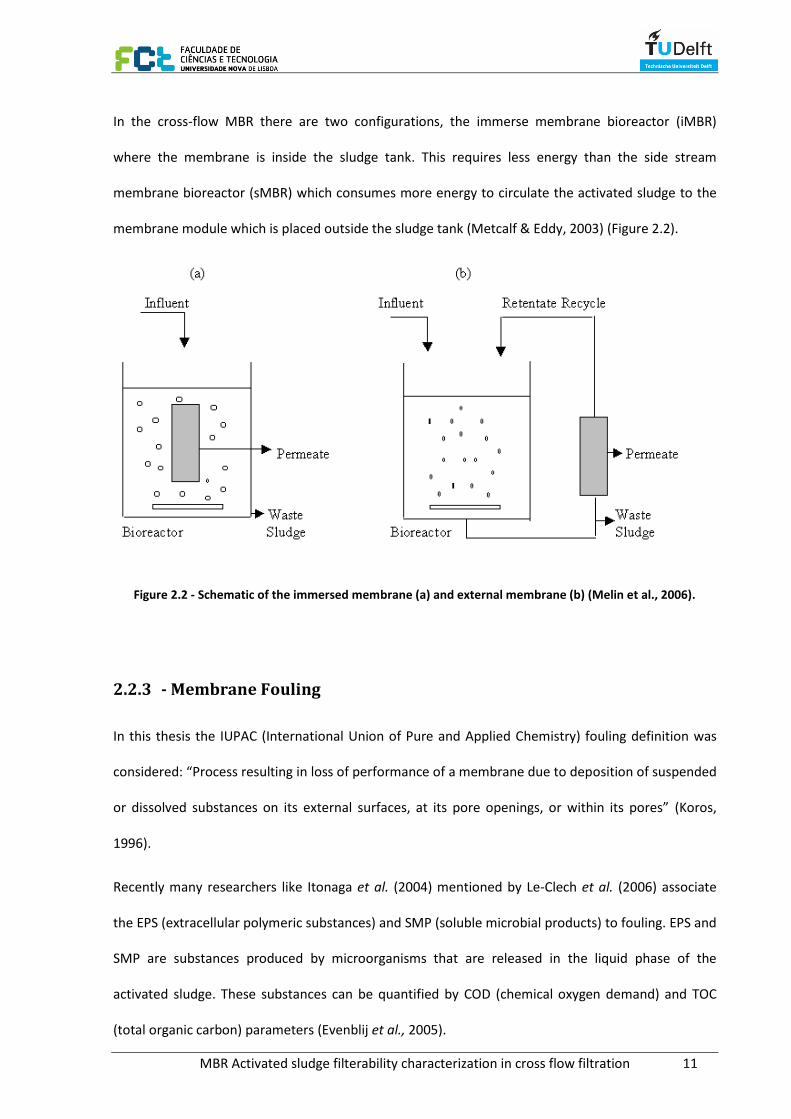
In the cross-flow MBR there are two configurations, the immerse membrane bioreactor (iMBR)
where the membrane is inside the sludge tank. This requires less energy than the side stream
membrane bioreactor (sMBR) which consumes more energy to circulate the activated sludge to the
membrane module which is placed outside the sludge tank (Metcalf & Eddy, 2003) (Figure 2.2).
Figure 2.2 - Schematic of the immersed membrane (a) and external membrane (b) (Melin et al., 2006).
2.2.3 - Membrane Fouling
In this thesis the IUPAC (International Union of Pure and Applied Chemistry) fouling definition was
considered: “Process resulting in loss of performance of a membrane due to deposition of suspended
or dissolved substances on its external surfaces, at its pore openings, or within its pores” (Koros,
1996).
Recently many researchers like Itonaga et al. (2004) mentioned by Le-Clech et al. (2006) associate
the EPS (extracellular polymeric substances) and SMP (soluble microbial products) to fouling. EPS and
SMP are substances produced by microorganisms that are released in the liquid phase of the
activated sludge. These substances can be quantified by COD (chemical oxygen demand) and TOC
(total organic carbon) parameters (Evenblij et al., 2005).
12 MBR Activated sludge filterability characterization in cross flow filtration
The particles concentration, expressed as MLSS (mixed liquor suspended solids), which influences the
sludge viscosity (Rosenberger et al., 2006), is considered to have an impact on fouling depending on
the MLSS concentration (Rosenberger et al., 2005). The viscosity of a fluid is a measure of its
resistance to tangential or shear stress (Metcalf & Eddy, 2003).
The MBR technology uses a solid-liquid separation process in which the activated sludge
characteristics are not always the same. During the cross-flow filtration process a gradual deposition
of small particles (salts, small organic molecules, colloids, etc) occurs in the membrane, forming a
layer in the membrane filtration area which originates fouling (Belfort et al., 1994).
Fouling can be characterized according to the nature of the constituent, the mechanism by which it
operates, or by the strategy adopted to control it.
The fouling constituents could be:
Particulates (inorganic or organic) can proceed as foulants according to their ability to blind
or block the surface
Organic dissolved components and colloids which can fix on the membrane surface by
adsorption.
Inorganic dissolved components and coagulant residuals which tend to precipitate on the
membrane surface.
Micro-biological organisms, which category covers vegetative matter such as algae and
organisms like bacteria which can form colonies, causing bio-fouling.
Therefore the fouling occurs due to a combination of chemical and physical interactions.
MBR Activated sludge filterability characterization in cross flow filtration 13
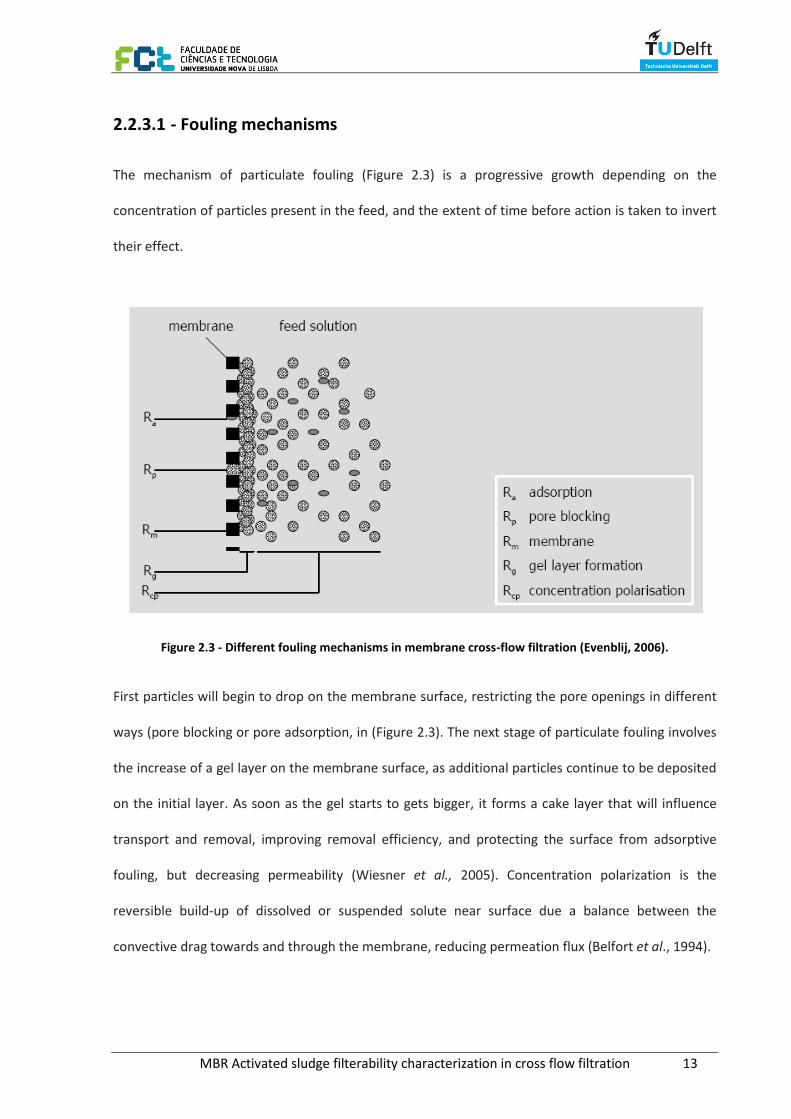
2.2.3.1 - Fouling mechanisms
The mechanism of particulate fouling (Figure 2.3) is a progressive growth depending on the
concentration of particles present in the feed, and the extent of time before action is taken to invert
their effect.
Figure 2.3 - Different fouling mechanisms in membrane cross-flow filtration (Evenblij, 2006).
First particles will begin to drop on the membrane surface, restricting the pore openings in different
ways (pore blocking or pore adsorption, in (Figure 2.3). The next stage of particulate fouling involves
the increase of a gel layer on the membrane surface, as additional particles continue to be deposited
on the initial layer. As soon as the gel starts to gets bigger, it forms a cake layer that will influence
transport and removal, improving removal efficiency, and protecting the surface from adsorptive
fouling, but decreasing permeability (Wiesner et al., 2005). Concentration polarization is the
reversible build-up of dissolved or suspended solute near surface due a balance between the
convective drag towards and through the membrane, reducing permeation flux (Belfort et al., 1994).
14 MBR Activated sludge filterability characterization in cross flow filtration
During the MBR wastewater treatment three main actions can be taken to avoid or reduce fouling
phenomena:
Prevention: backwash to remove the cake layer stuck on the membrane; air scour systems
for improvement of mass transfer and transport, by increasing shear of the wastewater
constituents. In addition forward flush to improve shear and remove build up particles
concentration.
Maintenance: Chemical wash used several times per day to once per week. Usually it is NaOH
to combat organic fouling, acid citric to combat inorganic fouling and H2O2 to combat bio-
fouling.
Recovery: cleaning-in-place (CIP) used once per week up to several months. It is applied in
extreme conditions of fouling, normally with chemicals addition. It consists of recirculation
with heated water and chemicals (Graeme, 2007).
2.2.3.2 - Sustainable flux
Critical flux has been used to describe the relationship between flux and fouling rate in controlled
steady state environments (Bacchin et al., 2006). The critical flux means that below this value no
fouling occurs and above this level, fouling occurs, the degree of which is a function of flux.
Therefore, it is necessary to develop different tools to understand, predict and control membrane
fouling. A practical tool for providing design guidelines for commercial plants is the concept of
sustainable flux (Pearce et al., 2007). Sustainable flux is the flow at which a modest degree of fouling
occurs, providing an acceptable compromise between high fluxes and restricting the fouling rate
(Pearce, 2007). This value depends on the feed characteristics, membrane characteristics, process
design and operational designs like the chemical cleaning.
The value depends on feed characteristics, membrane characteristics, process design, and
operational requirements (e.g. the cleaning frequency). Pilot trials can be used to establish the
MBR Activated sludge filterability characterization in cross flow filtration 15
relationship between flux and fouling rate for a particular set of circumstances, and evaluate a
sustainable flux for a commercially competitive design and operation. Fouling rates increase
exponentially with flux (Pearce et al. (2007) and Berubier (2007)), so the optimum flux is quite
sharply defined for a given membrane and process design.
Considering fouling behavior and the acceptable cleaning frequency, membrane permeability
guidelines can be produced for the designer and operator for any system to provide reliable control
instructions for stable long term performance.
16 MBR Activated sludge filterability characterization in cross flow filtration
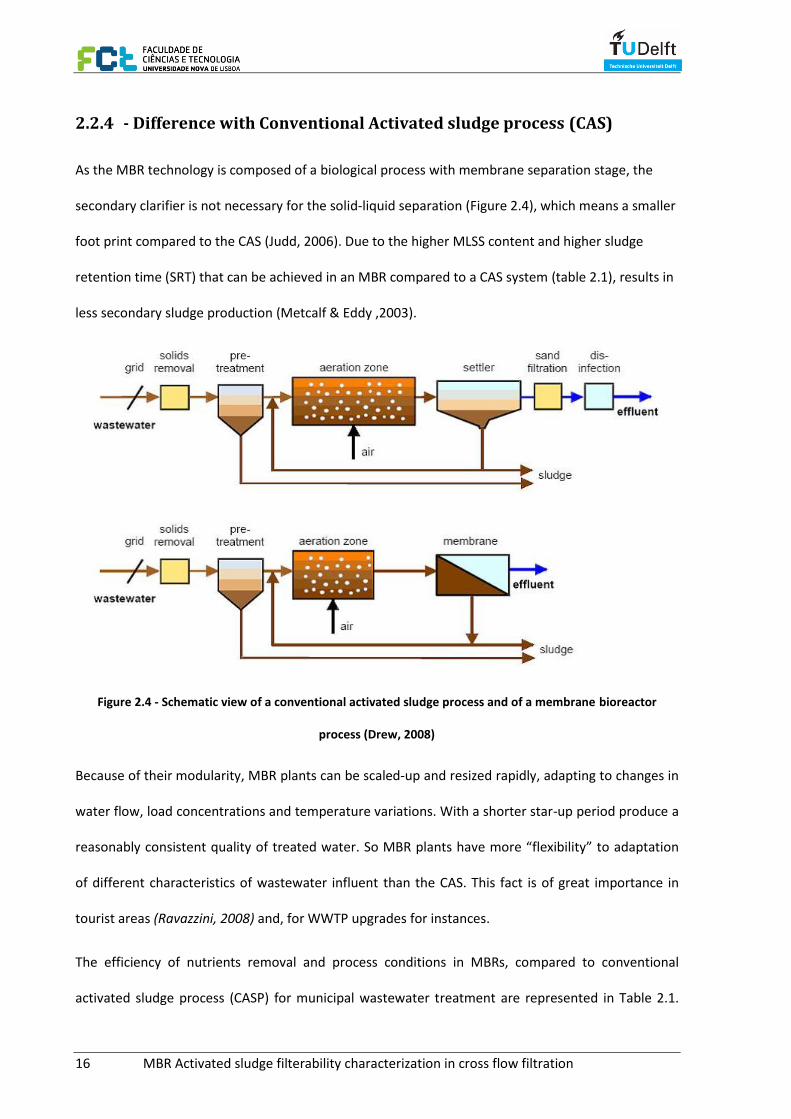
2.2.4 - Difference with Conventional Activated sludge process (CAS)
As the MBR technology is composed of a biological process with membrane separation stage, the
secondary clarifier is not necessary for the solid-liquid separation (Figure 2.4), which means a smaller
foot print compared to the CAS (Judd, 2006). Due to the higher MLSS content and higher sludge
retention time (SRT) that can be achieved in an MBR compared to a CAS system (table 2.1), results in
less secondary sludge production (Metcalf & Eddy ,2003).
Figure 2.4 - Schematic view of a conventional activated sludge process and of a membrane bioreactor
process (Drew, 2008)
Because of their modularity, MBR plants can be scaled-up and resized rapidly, adapting to changes in
water flow, load concentrations and temperature variations. With a shorter star-up period produce a
reasonably consistent quality of treated water. So MBR plants have more “flexibility” to adaptation
of different characteristics of wastewater influent than the CAS. This fact is of great importance in
tourist areas (Ravazzini, 2008) and, for WWTP upgrades for instances.
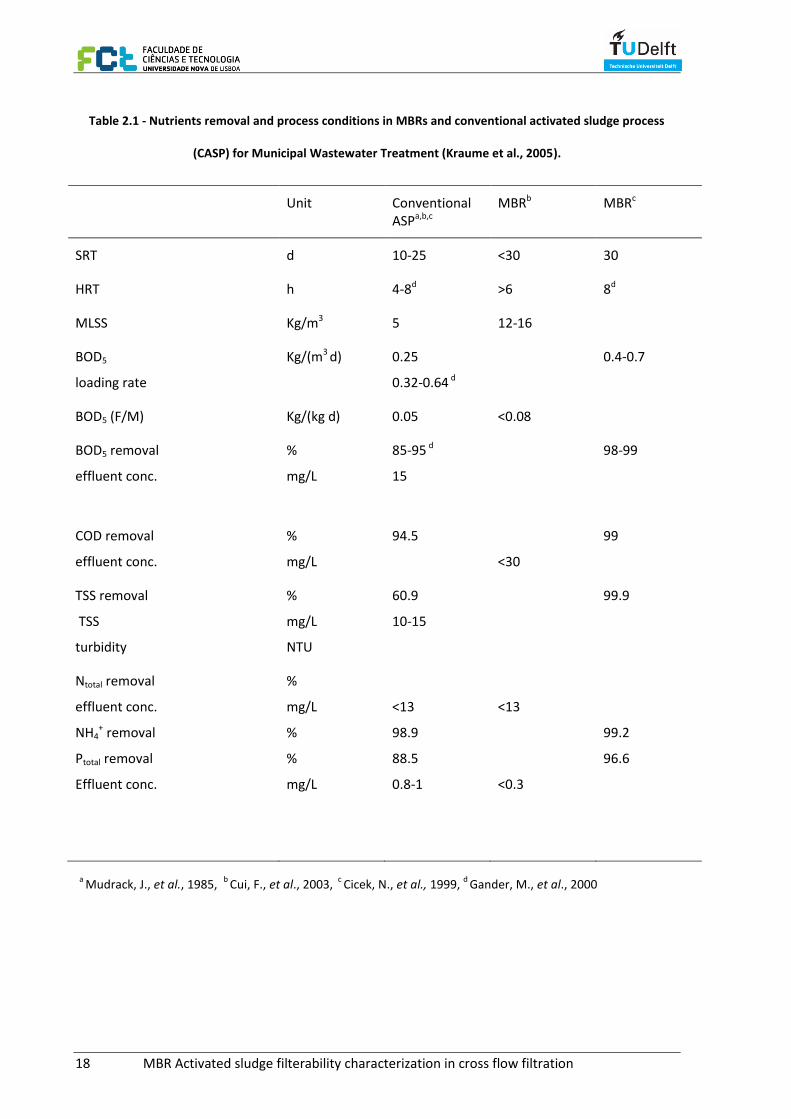
The efficiency of nutrients removal and process conditions in MBRs, compared to conventional
activated sludge process (CASP) for municipal wastewater treatment are represented in Table 2.1.
MBR Activated sludge filterability characterization in cross flow filtration 17
However in terms of cost, MBR needs more costs for the membranes, for operation and maintenance
than the CAS.
18 MBR Activated sludge filterability characterization in cross flow filtration
Table 2.1 - Nutrients removal and process conditions in MBRs and conventional activated sludge process
(CASP) for Municipal Wastewater Treatment (Kraume et al., 2005).
Unit Conventional ASPa,b,c
MBRb MBRc
SRT d 10-25 <30 30
HRT h 4-8d >6 8d
MLSS Kg/m3 5 12-16
BOD5
loading rate
Kg/(m3 d) 0.25
0.32-0.64 d
0.4-0.7
BOD5 (F/M) Kg/(kg d) 0.05 <0.08
BOD5 removal
effluent conc.
%
mg/L
85-95 d
15
98-99
COD removal
effluent conc.
%
mg/L
94.5
<30
99
TSS removal
TSS
turbidity
%
mg/L
NTU
60.9
10-15
99.9
Ntotal removal
effluent conc.
NH4+ removal
Ptotal removal
Effluent conc.
%
mg/L
%
%
mg/L
<13
98.9
88.5
0.8-1
<13
<0.3
99.2
96.6
a Mudrack, J., et al., 1985,
b Cui, F., et al., 2003,
c Cicek, N., et al., 1999,
d Gander, M., et al., 2000
MBR Activated sludge filterability characterization in cross flow filtration 19
2.2.5 Advantages/ Disadvantages
Membrane bioreactors (MBR) are composed of a biological process and a membrane separation step.
The process has many advantages:
excellent and stable effluent quality, including disinfection
high volumetric load resulting in compact designs and low excess sludge production
high potential for water reuse
However, due to the membrane separation stage some drawbacks arise:
o high investment and operational costs compared to conventional activated sludge process
due to the membrane costs and the need of qualified operators
o membrane fouling resulting in:
o more extensive pre-treatment required
o high energy input required to maintain turbulent conditions near the immersed
membranes (aeration)
o regular chemical cleanings
In the MBR process the membrane acts as a physical barrier. Therefore few chemicals are required
except for membrane maintenance cleaning. So it completely removes particles, without chemical
addition, therefore avoiding chemical contamination of the rejected sludge or treated water
(Ravazzini, M., 2008).
20 MBR Activated sludge filterability characterization in cross flow filtration
2.2.6 - Different technologies available
As was already mentioned in section 2.2.2, the membranes can be incorporated in the process in two
different configurations (Figure 2.2):
Immersed membranes in the bioreactor – the membranes are located inside the bioreactor with
direct feed inlet (activated sludge) and connections for the outlet (recirculation and permeate).
Permeate is extracted by ways of under-pressure and supply of compressed air bubbles from the
bottom serves to avoid solids deposition and for oxygenation of the biomass (Metcalf & Eddy, 2003).
External (side-stream) - membranes are located outside the bioreactor and the sludge is recirculated
through the tubular membranes elements. In the bioreactor a system of air diffusers fed by
compressors serves for oxygen supply and sludge homogenization. The permeation takes place
inside-out (Metcalf & Eddy, 2003).
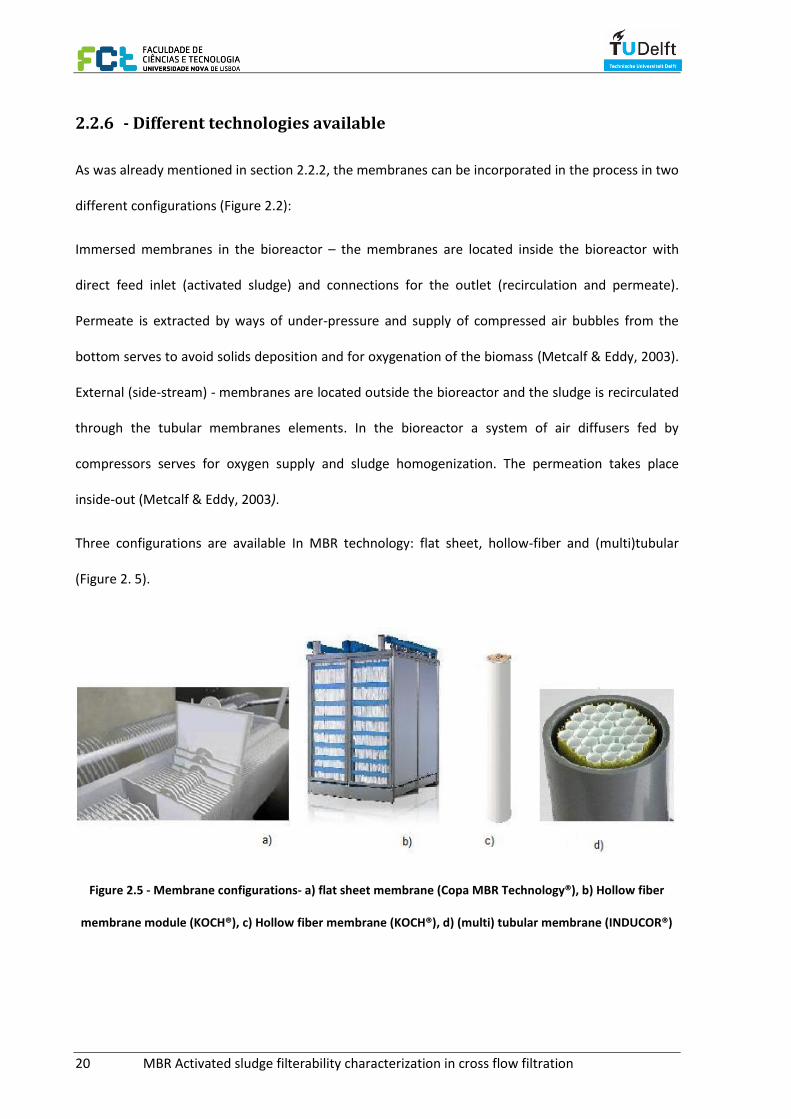
Three configurations are available In MBR technology: flat sheet, hollow-fiber and (multi)tubular
(Figure 2. 5).
Figure 2.5 - Membrane configurations- a) flat sheet membrane (Copa MBR Technology®), b) Hollow fiber
membrane module (KOCH®), c) Hollow fiber membrane (KOCH®), d) (multi) tubular membrane (INDUCOR®)
MBR Activated sludge filterability characterization in cross flow filtration 21
Each one is utilized depending on the application as it is possible to see in Table 2.2. The feed
operation performance for each configuration is: outside-to-in for flat sheet, inside- to-outside for
multi-tubular and for hollow-fiber both modes of operation are possible.
Table 2.2 - Membrane configurations and respectively cost and application (Judd, 2006)
Configuration Cost Application
Flat sheet High UF, RO
Multi-tubular Very high MF, UF, NF
Hollow-fiber Very low MF, UF, NF, RO (inside out)
Membranes offer the possibility to choose different types of filtration selectivity depending on the
membrane pore size. The coarsest membrane is microfiltration (MF), with a pore size around 0.1-1
µm, it is capable to remove particulate matter. Next is ultrafiltration (UF) which its pore size range is
around 0.01-0.1 µm and it removes mostly viruses and colloids. Than is the nanofiltration (NF) with a
pore size range around 0.001-0.01 µm, it removes small molecules and viruses. The most selective
membrane, associated with reverse osmosis (RO) with a pore size range around 0.0001 – 0.001 µm, it
removes all the dissolved substances (Judd, 2006). So it is possible to choose the most adequate
membrane, depending on which type of constituents on wastewater it is necessary to remove.

MBR Activated sludge filterability characterization in cross flow filtration 23
3 – METHODOLOGY
3.1 - Delft Filtration Characterization method
The Delft filtration characterization method (Dfcm) was used to analyze the filterability of the
activated sludge samples and the influence of different cross-flow velocities on sludge filterability.
This method was a key tool for the development of this research. The Delft Filtration Characterization
installation (DFCi) was developed by Delft University of Technology (TU Delft). It has a singular
tubular Polyvinylidene difluoride (PVDF) membrane module, provided by X-flow, approximately with
1m length, operated in cross-flow mode, with diameter of 8mm and nominal pore size 0.03µm,
therefore considered UF (Dfcm protocol is referred in Appendix I). Samples of 20l of activated sludge
are circulated with a peristaltic pump (Figure 3.1) and permeate is also extracted with a peristaltic
pump and permeate mass balance (Figure 3.2).
Figure 3.1 - Sludge peristaltic pump
Figure 3.2 - Permeate peristaltic pump and permeate mass balance
24 MBR Activated sludge filterability characterization in cross flow filtration
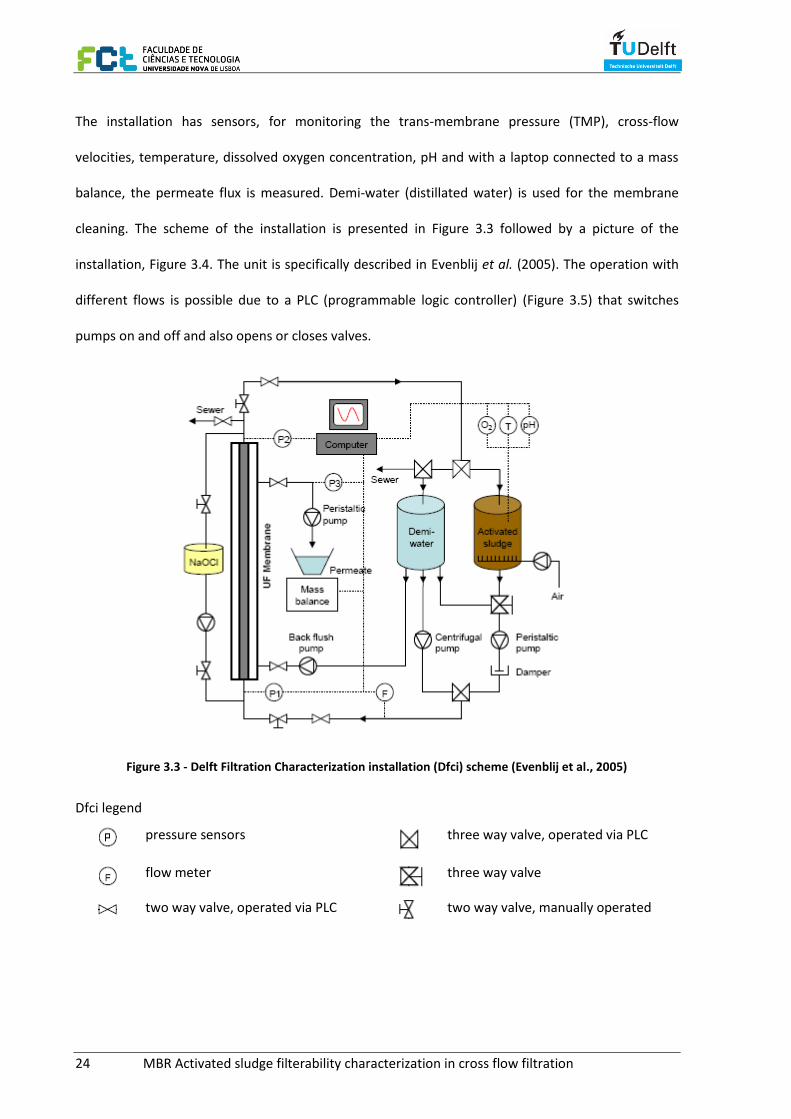
The installation has sensors, for monitoring the trans-membrane pressure (TMP), cross-flow
velocities, temperature, dissolved oxygen concentration, pH and with a laptop connected to a mass
balance, the permeate flux is measured. Demi-water (distillated water) is used for the membrane
cleaning. The scheme of the installation is presented in Figure 3.3 followed by a picture of the
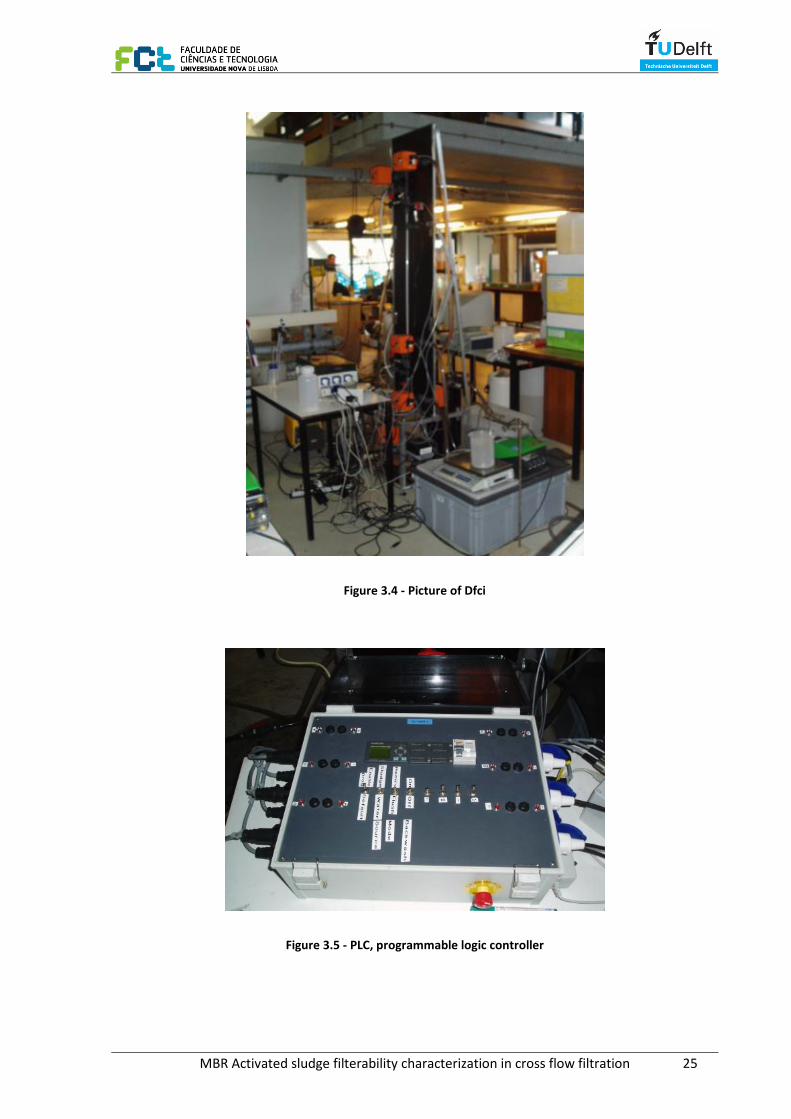
installation, Figure 3.4. The unit is specifically described in Evenblij et al. (2005). The operation with
different flows is possible due to a PLC (programmable logic controller) (Figure 3.5) that switches
pumps on and off and also opens or closes valves.
Figure 3.3 - Delft Filtration Characterization installation (Dfci) scheme (Evenblij et al., 2005)
Dfci legend
pressure sensors
three way valve, operated via PLC
flow meter
three way valve
two way valve, operated via PLC
two way valve, manually operated
MBR Activated sludge filterability characterization in cross flow filtration 25
Figure 3.4 - Picture of Dfci
Figure 3.5 - PLC, programmable logic controller
26 MBR Activated sludge filterability characterization in cross flow filtration
One filtration cycle is completed after achieving 20 L/m2 of permeate extraction, a TMP value of 0.5
Bar or permeate mass extracted of 500 g. This usually takes fifteen minutes. After filtration of 20
L/m2 of permeate, using a flux of 80 L/(m2h) and a cross-flow velocity of 1 m/s (standard conditions)
an additional resistance (∆R20) is registered, than the information will be gathered in a single data
file for consequent treatment on Microsoft Office Excel. This permits that all sludge samples are
filtered and compared under identical hydraulic circumstances. The standard conditions are utilized
to make possible the comparison of different research projects with Dfci, on TU Delft.
3.1.1 - Additional resistance (∆R20)
The ΔR20 (*1012/m) is the parameter used to characterize the filterability of the sludge sample; it is
the activated sludge sample tendency to originate fouling. It is defined as the increase in resistance
after a specific permeate production of 20 L m-2. The additional resistance of an activated sludge
sample is the difference between the activated sludge sample membrane resistance and the clean
membrane resistance.
The sludge samples were collected by the recirculation pipe at the end of the filtration cycle. After a
cycle, when ∆R20 values are lower than 0.2 the sludge is considered to have a good filterability,
higher than 1 indicate bad filterability and between 0.2 and 1 is considered average filterability. In
this thesis for the cross-flow velocities below 0.7 m/s are considered low, between 0.7m/s and 1m/s
it is average velocity and above 1m/s is high velocity.
The sludge samples, filtrated straight after gathering from WWTP, are representative for the sludge
filtration performance in the full scale MBR.
MBR Activated sludge filterability characterization in cross flow filtration 27
3.2 - Heenvliet wastewater treatment plant
In response to water management problems due to the lack of adequate laws, the European Union
responds with a policy development related to water management. It was implemented the
European Water Framework Directive which became effective in 2006. This created new laws in
urban wastewater like defining new nutrients limits in water discharges, for example the Maximum
tolerable risk (MTR) (Uijterlinde et al., 2005).
To achieve part of the targets established by the European Union, the Netherlands chose the
relatively new MBR technology for its compactness. They started developing research programs and
studies to test MBR pilots for Wastewater Treatment Plant upgrade (Uijterlinde et al., 2005).
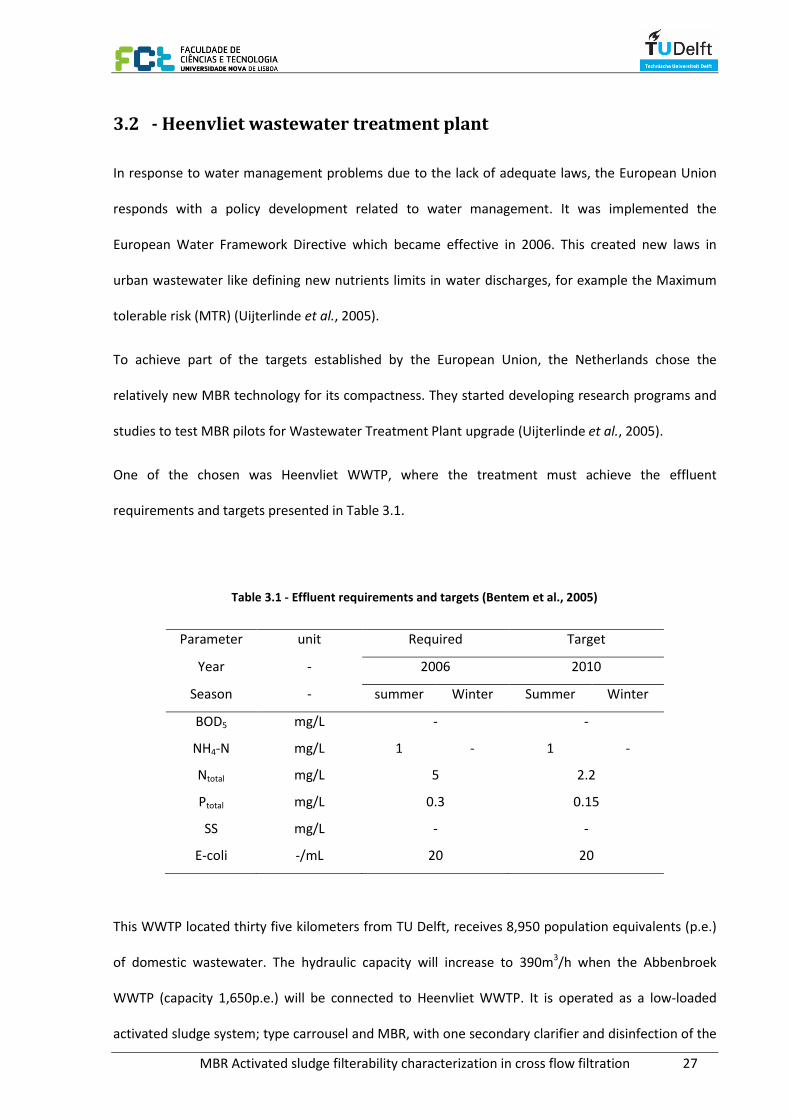
One of the chosen was Heenvliet WWTP, where the treatment must achieve the effluent
requirements and targets presented in Table 3.1.
Table 3.1 - Effluent requirements and targets (Bentem et al., 2005)
Parameter unit Required Target
Year - 2006 2010
Season - summer Winter Summer Winter
BOD5 mg/L - -
NH4-N mg/L 1 - 1 -
Ntotal mg/L 5 2.2
Ptotal mg/L 0.3 0.15
SS mg/L - -
E-coli -/mL 20 20
This WWTP located thirty five kilometers from TU Delft, receives 8,950 population equivalents (p.e.)
of domestic wastewater. The hydraulic capacity will increase to 390m3/h when the Abbenbroek
WWTP (capacity 1,650p.e.) will be connected to Heenvliet WWTP. It is operated as a low-loaded
activated sludge system; type carrousel and MBR, with one secondary clarifier and disinfection of the
28 MBR Activated sludge filterability characterization in cross flow filtration
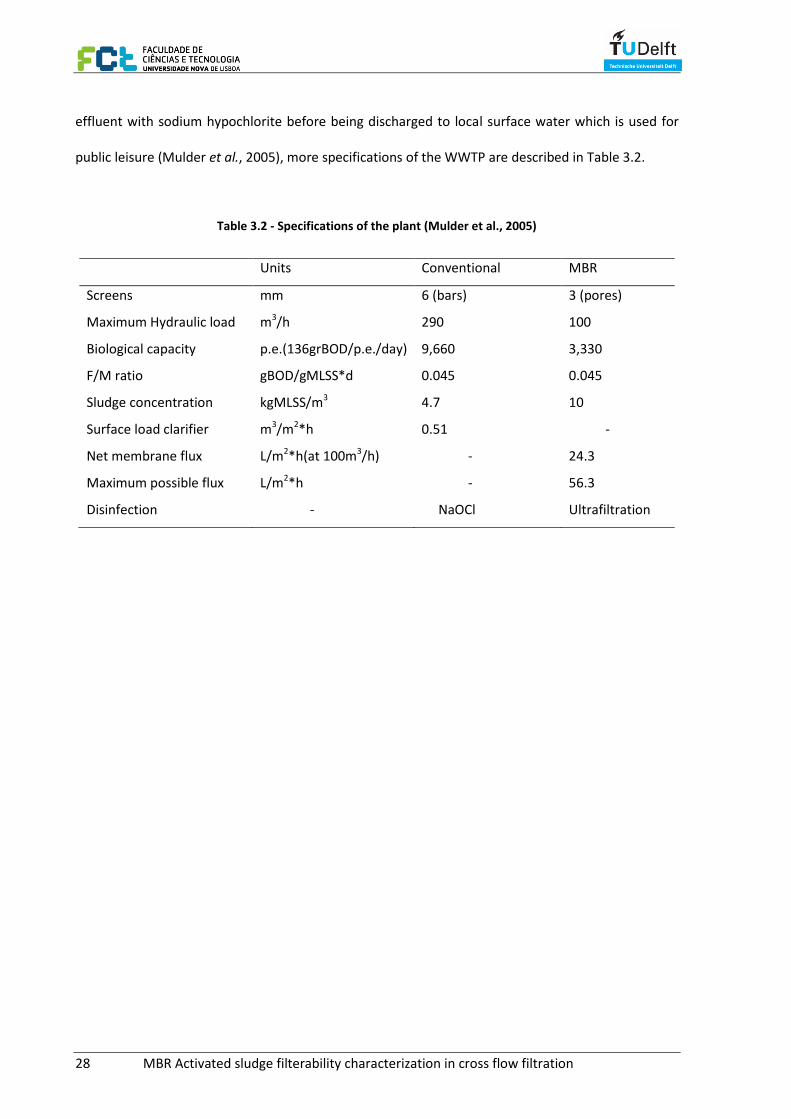
effluent with sodium hypochlorite before being discharged to local surface water which is used for
public leisure (Mulder et al., 2005), more specifications of the WWTP are described in Table 3.2.
Table 3.2 - Specifications of the plant (Mulder et al., 2005)
Units Conventional MBR
Screens mm 6 (bars) 3 (pores)
Maximum Hydraulic load m3/h 290 100
Biological capacity p.e.(136grBOD/p.e./day) 9,660 3,330
F/M ratio gBOD/gMLSS*d 0.045 0.045
Sludge concentration kgMLSS/m3 4.7 10
Surface load clarifier m3/m2*h 0.51 -
Net membrane flux L/m2*h(at 100m3/h) - 24.3
Maximum possible flux L/m2*h - 56.3
Disinfection - NaOCl Ultrafiltration
MBR Activated sludge filterability characterization in cross flow filtration 29
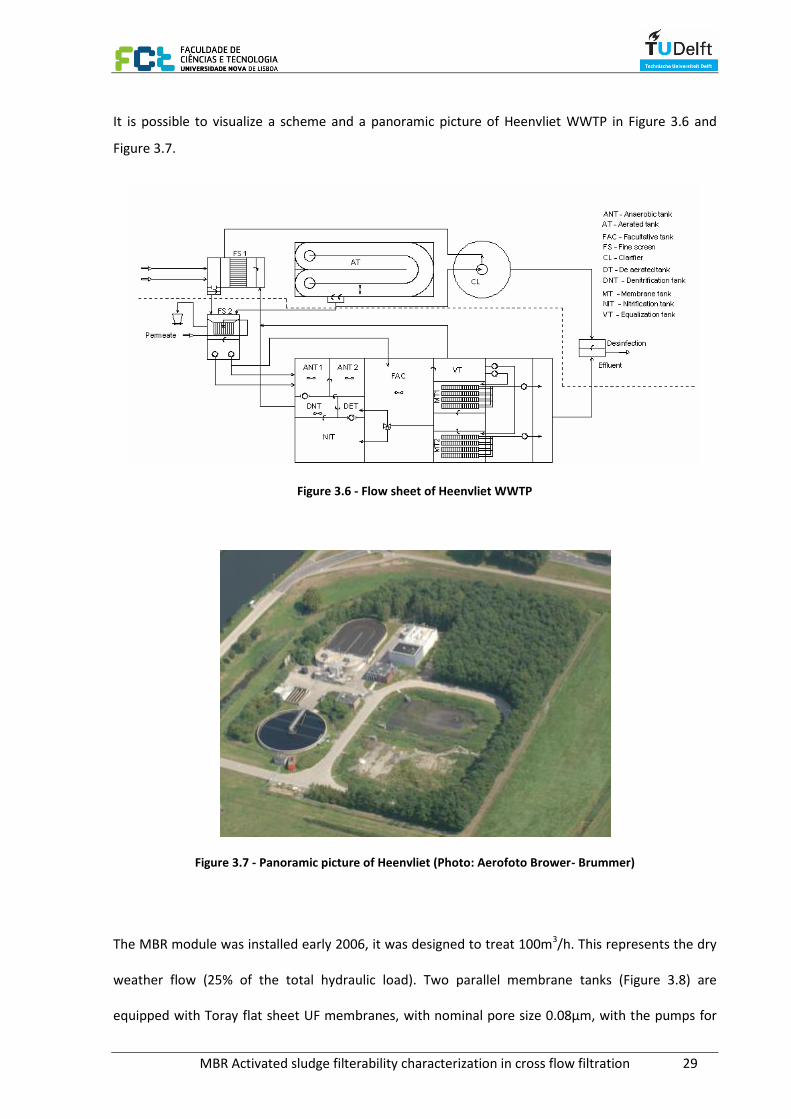
It is possible to visualize a scheme and a panoramic picture of Heenvliet WWTP in Figure 3.6 and
Figure 3.7.
Figure 3.6 - Flow sheet of Heenvliet WWTP
Figure 3.7 - Panoramic picture of Heenvliet (Photo: Aerofoto Brower- Brummer)
The MBR module was installed early 2006, it was designed to treat 100m3/h. This represents the dry
weather flow (25% of the total hydraulic load). Two parallel membrane tanks (Figure 3.8) are
equipped with Toray flat sheet UF membranes, with nominal pore size 0.08µm, with the pumps for
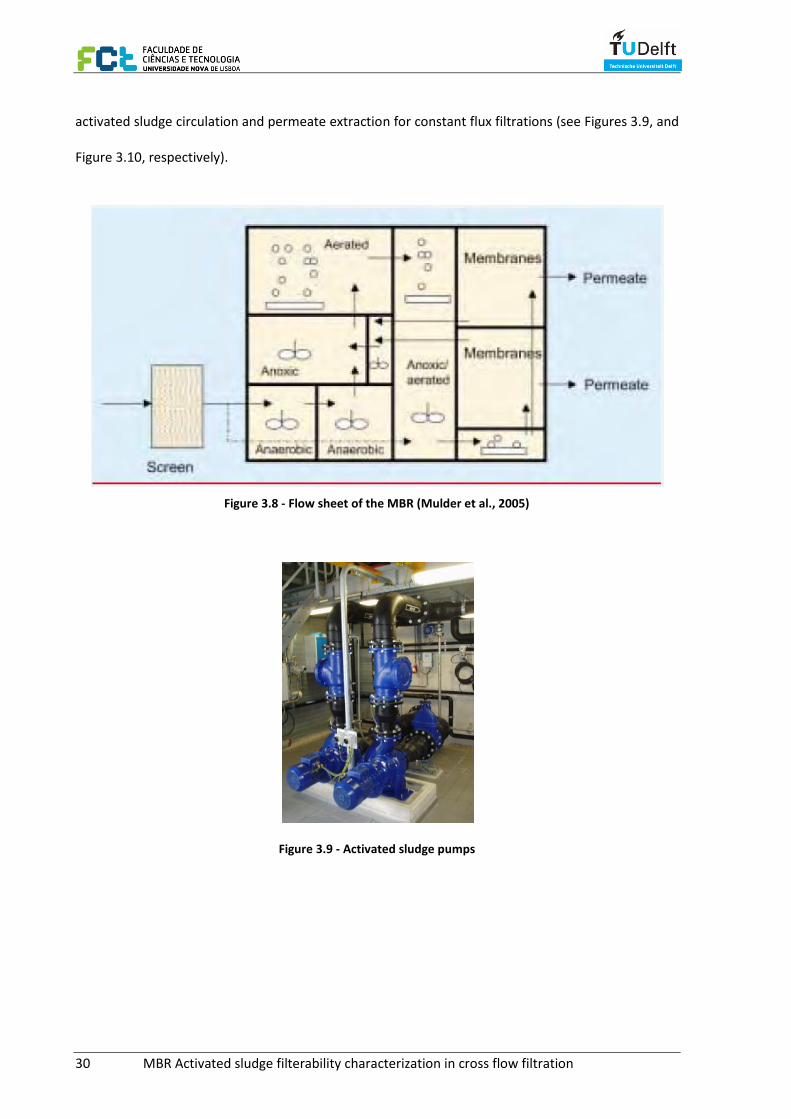
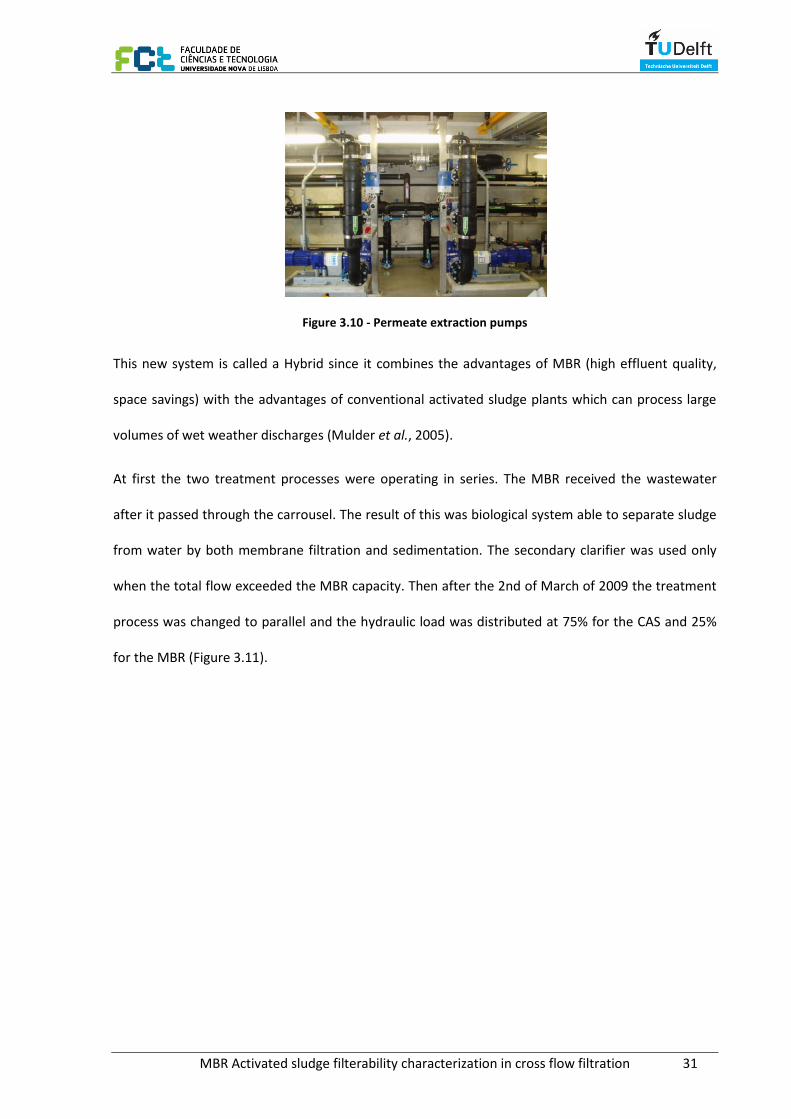
30 MBR Activated sludge filterability characterization in cross flow filtration
activated sludge circulation and permeate extraction for constant flux filtrations (see Figures 3.9, and
Figure 3.10, respectively).
Figure 3.8 - Flow sheet of the MBR (Mulder et al., 2005)
Figure 3.9 - Activated sludge pumps
MBR Activated sludge filterability characterization in cross flow filtration 31
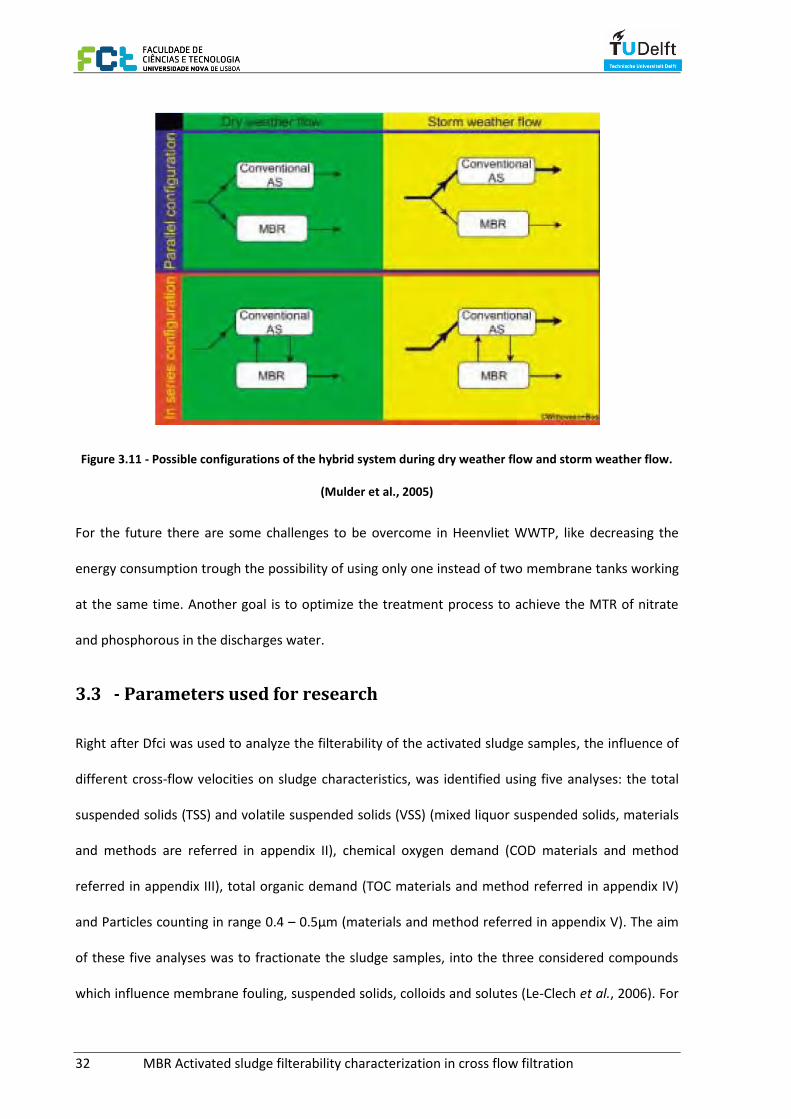
Figure 3.10 - Permeate extraction pumps
This new system is called a Hybrid since it combines the advantages of MBR (high effluent quality,
space savings) with the advantages of conventional activated sludge plants which can process large
volumes of wet weather discharges (Mulder et al., 2005).
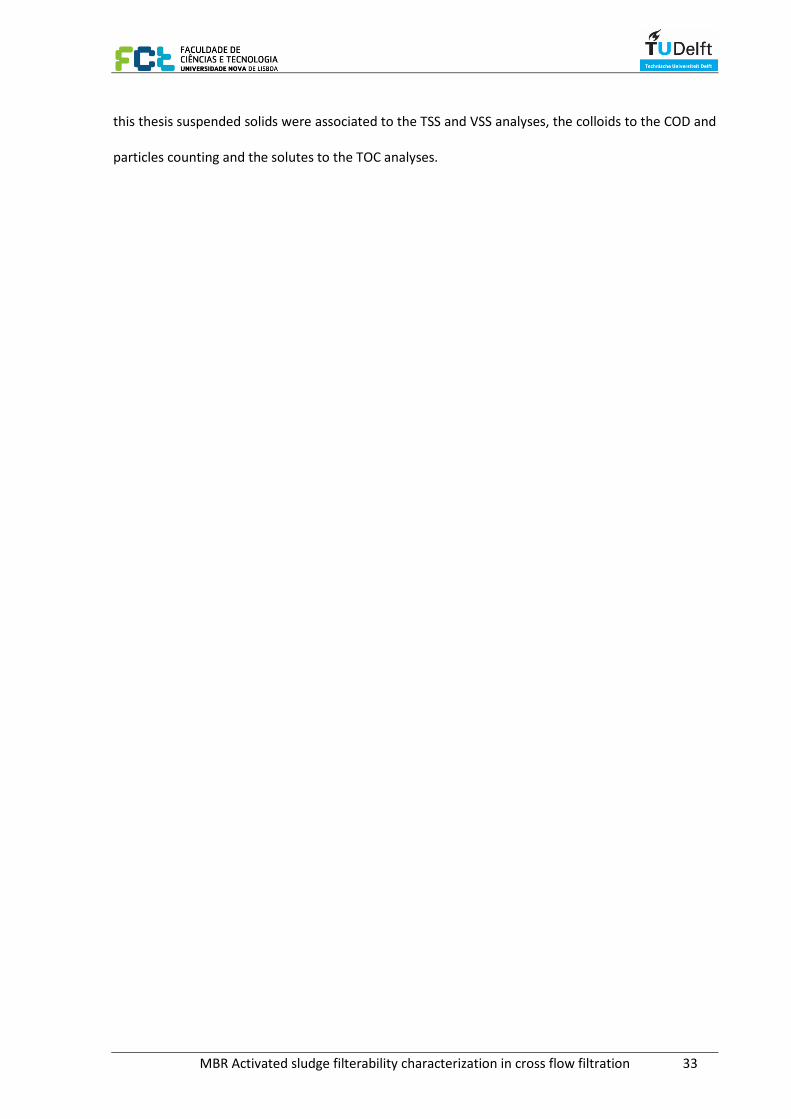
At first the two treatment processes were operating in series. The MBR received the wastewater
after it passed through the carrousel. The result of this was biological system able to separate sludge
from water by both membrane filtration and sedimentation. The secondary clarifier was used only
when the total flow exceeded the MBR capacity. Then after the 2nd of March of 2009 the treatment
process was changed to parallel and the hydraulic load was distributed at 75% for the CAS and 25%
for the MBR (Figure 3.11).
32 MBR Activated sludge filterability characterization in cross flow filtration
Figure 3.11 - Possible configurations of the hybrid system during dry weather flow and storm weather flow.
(Mulder et al., 2005)
For the future there are some challenges to be overcome in Heenvliet WWTP, like decreasing the
energy consumption trough the possibility of using only one instead of two membrane tanks working
at the same time. Another goal is to optimize the treatment process to achieve the MTR of nitrate
and phosphorous in the discharges water.
3.3 - Parameters used for research
Right after Dfci was used to analyze the filterability of the activated sludge samples, the influence of
different cross-flow velocities on sludge characteristics, was identified using five analyses: the total
suspended solids (TSS) and volatile suspended solids (VSS) (mixed liquor suspended solids, materials
and methods are referred in appendix II), chemical oxygen demand (COD materials and method
referred in appendix III), total organic demand (TOC materials and method referred in appendix IV)
and Particles counting in range 0.4 – 0.5µm (materials and method referred in appendix V). The aim
of these five analyses was to fractionate the sludge samples, into the three considered compounds
which influence membrane fouling, suspended solids, colloids and solutes (Le-Clech et al., 2006). For
MBR Activated sludge filterability characterization in cross flow filtration 33
this thesis suspended solids were associated to the TSS and VSS analyses, the colloids to the COD and
particles counting and the solutes to the TOC analyses.


MBR Activated sludge filterability characterization in cross flow filtration 35
4 – RESULTS AND DISCUSSION
4.1 - Experimental protocol
The experimental protocol in this thesis consists of several sets of experiments. The analyses were
performed almost weekly from 24th of February to 15th of June, with a break in proceedings during
May. The first three days of a week were used for the laboratory analysis and the other two days
were used for data processing using MS Excel.
On the first day 30 liters of sludge samples for analyses were collected from the MBR tank at
Heenvliet WWTP (Figure 4.1).
Figure 4.1 - Membrane tank sludge collection process
Back to TU Delft water lab, the sludge samples were placed in the sludge source device of the Dfci
equipped with an oxygen aeration system for the supply of atmospheric oxygen with air bubbles.
After 30 minutes (for adaptation of the sludge biomass to the new conditions), two standard
filtrations (CFV 1.0 m/s) were performed. Right after the last filtration half a liter of sludge was
extracted from the recirculation pipe of the Dfci to carry out the TSS, VSS, COD, TOC and particles
counting analyses. On the next two days of analyses the same procedure was executed (using the
same sludge samples), but with different cross-flow velocities, below or above 1 m/s, for each day.
36 MBR Activated sludge filterability characterization in cross flow filtration
4.2 - Heenvliet WWTP site Monitoring
While the different cross-flow filtrations analyses were made, an on-line monitoring of Heenvliet full
scale plant was carried out, with the standard filtration analyses (Cross-flow velocity 1m/s, flux of
80L/m2h).
The additional resistance values acquired with the Dfci were related to the sludge temperature, the
COD values, number of particles counting in the diameter range of 0.4 – 5 µm, TSS and VSS,
measured in Heenvliet WWTP.
At Heenvliet WWTP, the treatment process was in series until the 2nd of March, the MBR received
wastewater after it passed through the carrousel. After that date the treatment process was changed
to parallel and the hydraulic load was distributed on 75% for the CAS and 25% for the MBR.
In the first configuration with the process in series a biological system was created capable of
separating sludge from water by both membrane filtration and sedimentation. When the process
changed to parallel, the MBR was receiving sludge with higher organic load. This caused a decrease in
efficiency until the balance in the food to microorganism (F/M) ratio, was achieved, with increasing
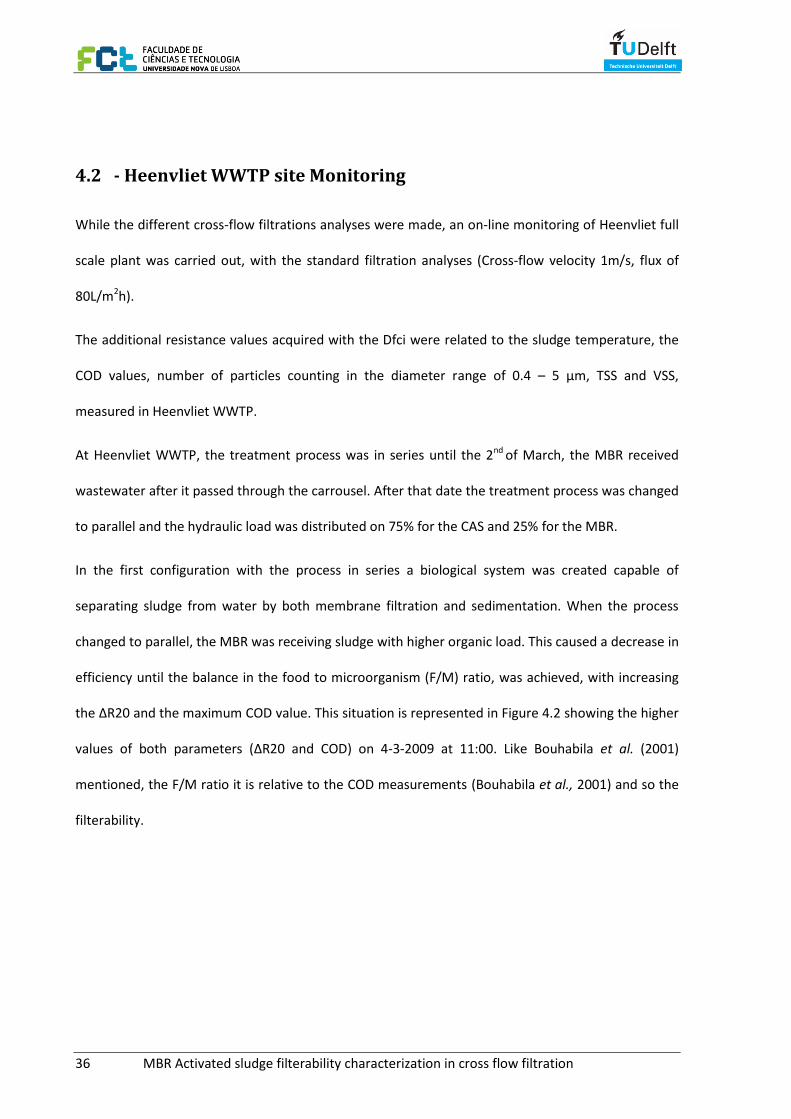
the ∆R20 and the maximum COD value. This situation is represented in Figure 4.2 showing the higher
values of both parameters (∆R20 and COD) on 4-3-2009 at 11:00. Like Bouhabila et al. (2001)
mentioned, the F/M ratio it is relative to the COD measurements (Bouhabila et al., 2001) and so the
filterability.
MBR Activated sludge filterability characterization in cross flow filtration 37
The deviations in COD values could be associated with significant variations in the raw inflow
wastewater concentrations (Figure 4.2).
Figure 4.2 - Development of the additional resistance and the chemical oxygen demand
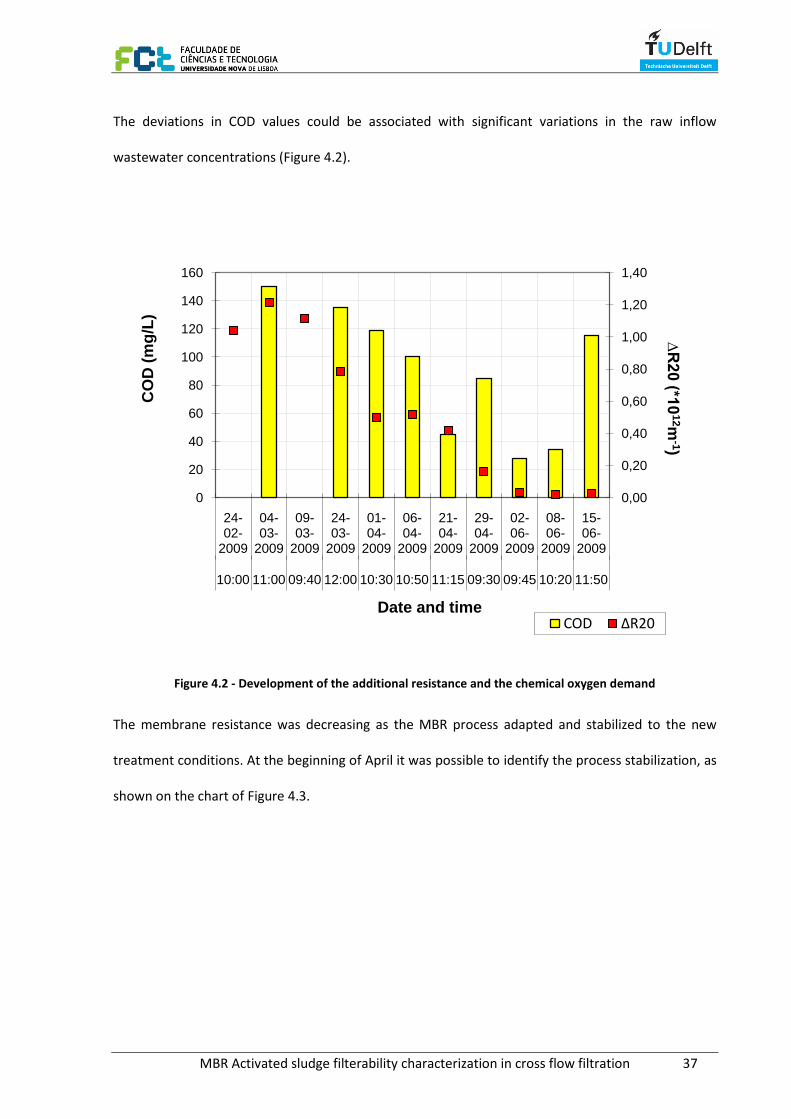
The membrane resistance was decreasing as the MBR process adapted and stabilized to the new
treatment conditions. At the beginning of April it was possible to identify the process stabilization, as
shown on the chart of Figure 4.3.
0,00
0,20
0,40
0,60
0,80
1,00
1,20
1,40
0
20
40
60
80
100
120
140
160
24-02-
2009
04-03-
2009
09-03-
2009
24-03-
2009
01-04-
2009
06-04-
2009
21-04-
2009
29-04-
2009
02-06-
2009
08-06-
2009
15-06-
2009
10:00 11:00 09:40 12:00 10:30 10:50 11:15 09:30 09:45 10:20 11:50
∆R
20
(*10
12m
-1)
CO
D (
mg
/L)
Date and timeCOD ∆R20
38 MBR Activated sludge filterability characterization in cross flow filtration
Afterwards the process became more efficient as the filterability improved. One of the associated
reasons is the increasing temperature, as a consequence of the seasonal variations (Figure 4.3).
Figure 4.3 - Evolution of the additional resistance and the temperature
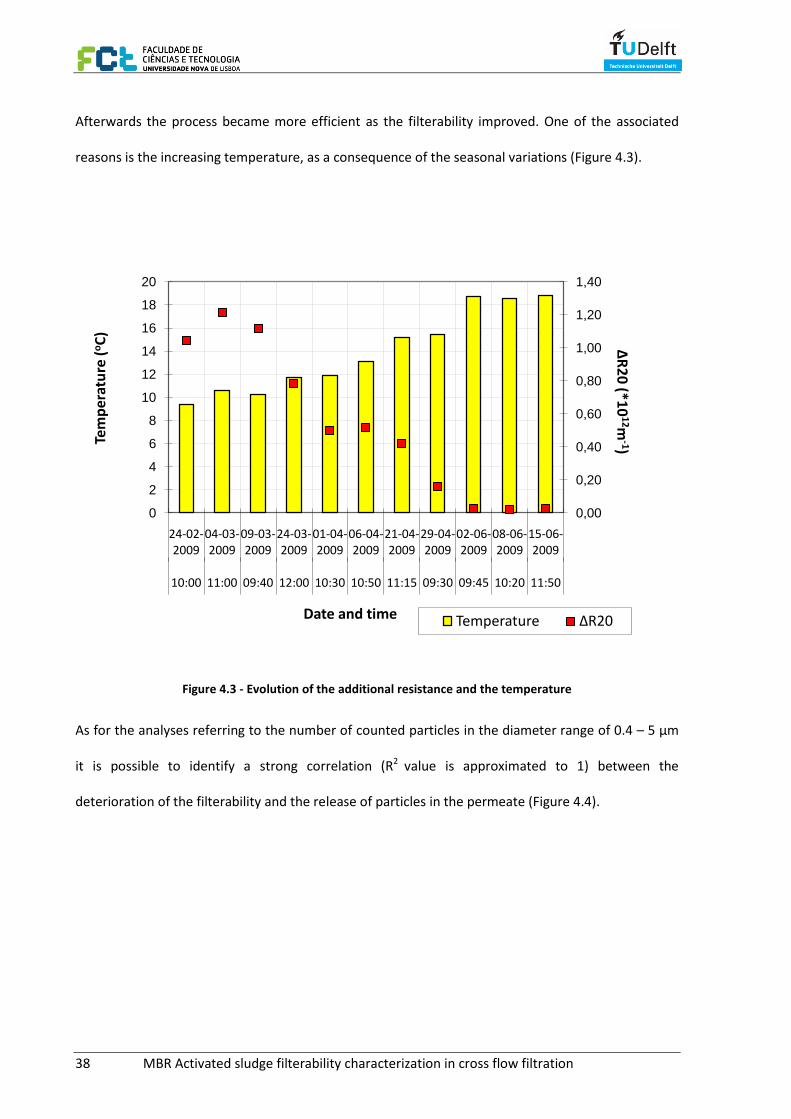
As for the analyses referring to the number of counted particles in the diameter range of 0.4 – 5 µm
it is possible to identify a strong correlation (R2 value is approximated to 1) between the
deterioration of the filterability and the release of particles in the permeate (Figure 4.4).
0,00
0,20
0,40
0,60
0,80
1,00
1,20
1,40
0
2
4
6
8
10
12
14
16
18
20
24-02-2009
04-03-2009
09-03-2009
24-03-2009
01-04-2009
06-04-2009
21-04-2009
29-04-2009
02-06-2009
08-06-2009
15-06-2009
10:00 11:00 09:40 12:00 10:30 10:50 11:15 09:30 09:45 10:20 11:50
∆R
20
(*10
12m
-1)Tem
per
atu
re (
oC
)
Date and time Temperature ∆R20
MBR Activated sludge filterability characterization in cross flow filtration 39
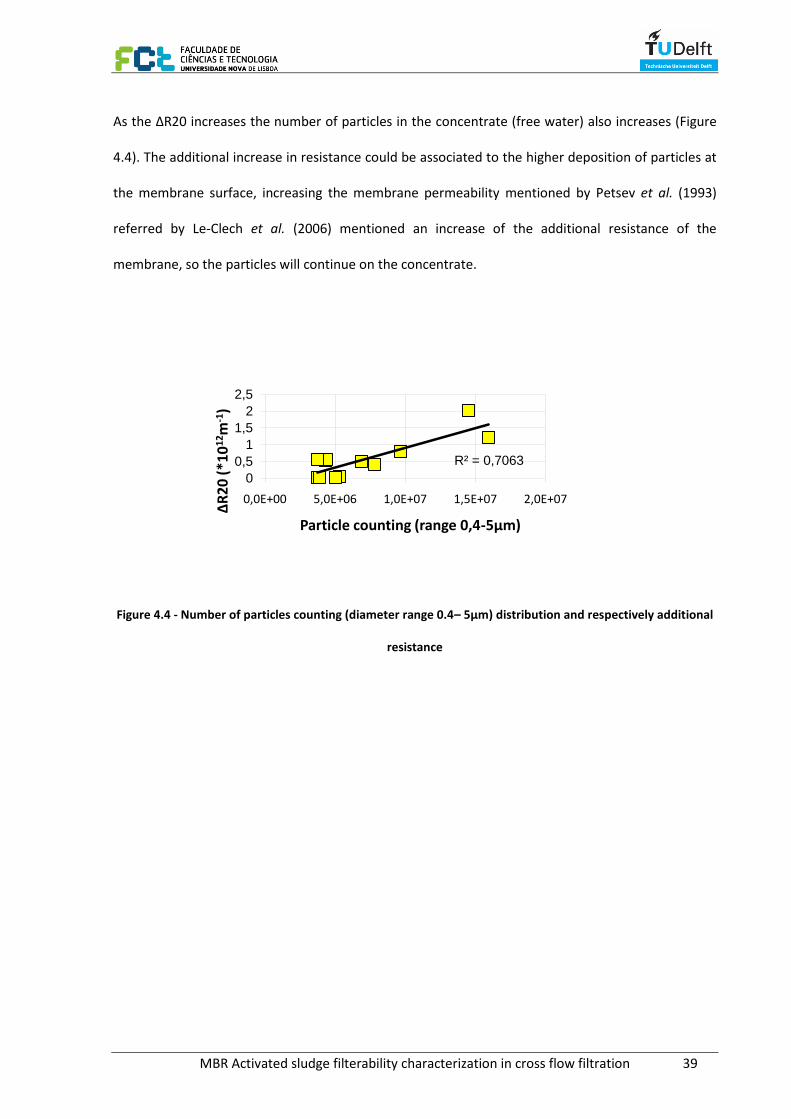
As the ΔR20 increases the number of particles in the concentrate (free water) also increases (Figure
4.4). The additional increase in resistance could be associated to the higher deposition of particles at
the membrane surface, increasing the membrane permeability mentioned by Petsev et al. (1993)
referred by Le-Clech et al. (2006) mentioned an increase of the additional resistance of the
membrane, so the particles will continue on the concentrate.
Figure 4.4 - Number of particles counting (diameter range 0.4– 5µm) distribution and respectively additional
resistance
R² = 0,7063
0
0,5
1
1,5
2
2,5
0,0E+00 5,0E+06 1,0E+07 1,5E+07 2,0E+07
∆R
20
(*1
01
2m
-1)
Particle counting (range 0,4-5µm)
40 MBR Activated sludge filterability characterization in cross flow filtration
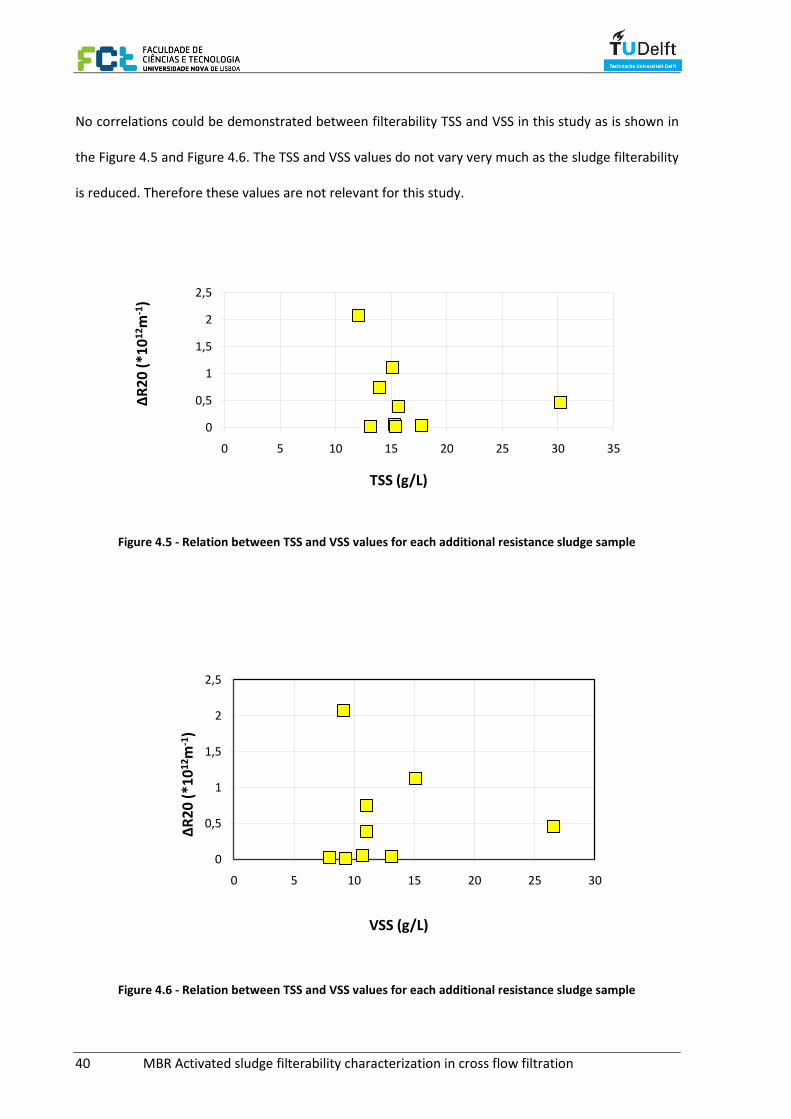
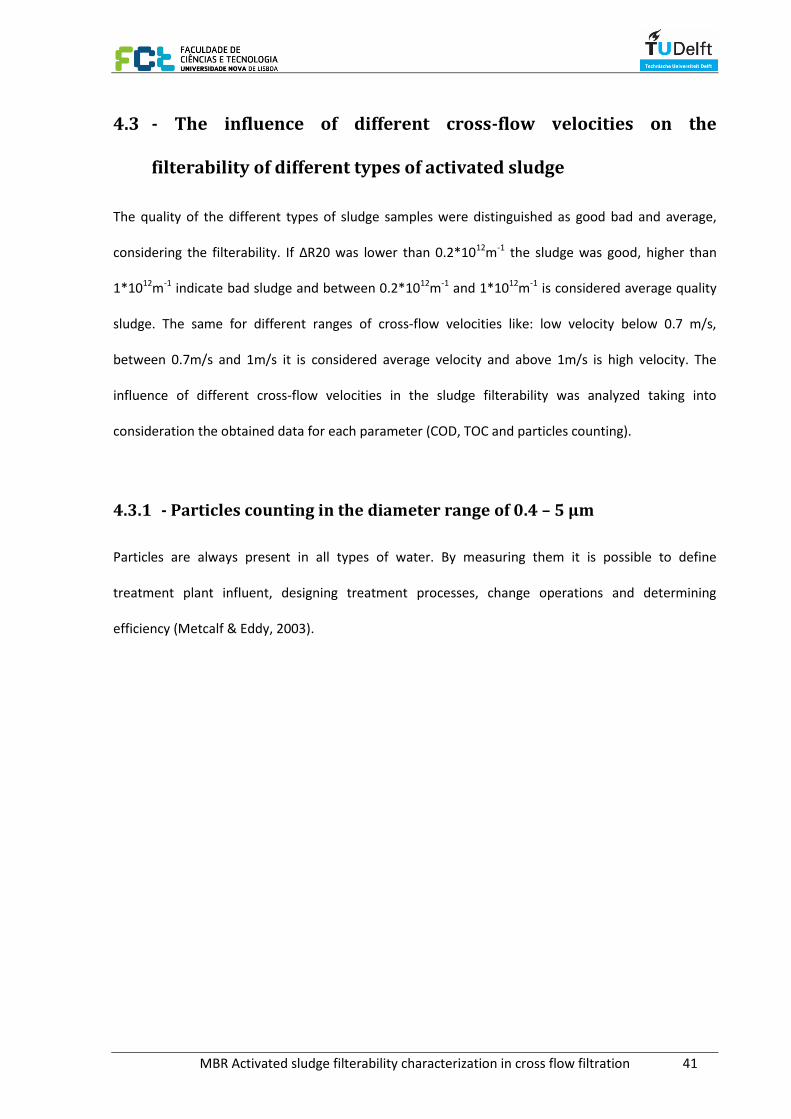
No correlations could be demonstrated between filterability TSS and VSS in this study as is shown in
the Figure 4.5 and Figure 4.6. The TSS and VSS values do not vary very much as the sludge filterability
is reduced. Therefore these values are not relevant for this study.
Figure 4.5 - Relation between TSS and VSS values for each additional resistance sludge sample
Figure 4.6 - Relation between TSS and VSS values for each additional resistance sludge sample
0
0,5
1
1,5
2
2,5
0 5 10 15 20 25 30 35
∆R
20
(*1
01
2m
-1)
TSS (g/L)
0
0,5
1
1,5
2
2,5
0 5 10 15 20 25 30
∆R
20
(*1
01
2m
-1)
VSS (g/L)
MBR Activated sludge filterability characterization in cross flow filtration 41
4.3 - The influence of different cross-flow velocities on the
filterability of different types of activated sludge
The quality of the different types of sludge samples were distinguished as good bad and average,
considering the filterability. If ∆R20 was lower than 0.2*1012m-1 the sludge was good, higher than
1*1012m-1 indicate bad sludge and between 0.2*1012m-1 and 1*1012m-1 is considered average quality
sludge. The same for different ranges of cross-flow velocities like: low velocity below 0.7 m/s,
between 0.7m/s and 1m/s it is considered average velocity and above 1m/s is high velocity. The
influence of different cross-flow velocities in the sludge filterability was analyzed taking into
consideration the obtained data for each parameter (COD, TOC and particles counting).
4.3.1 - Particles counting in the diameter range of 0.4 – 5 µm
Particles are always present in all types of water. By measuring them it is possible to define
treatment plant influent, designing treatment processes, change operations and determining
efficiency (Metcalf & Eddy, 2003).
42 MBR Activated sludge filterability characterization in cross flow filtration
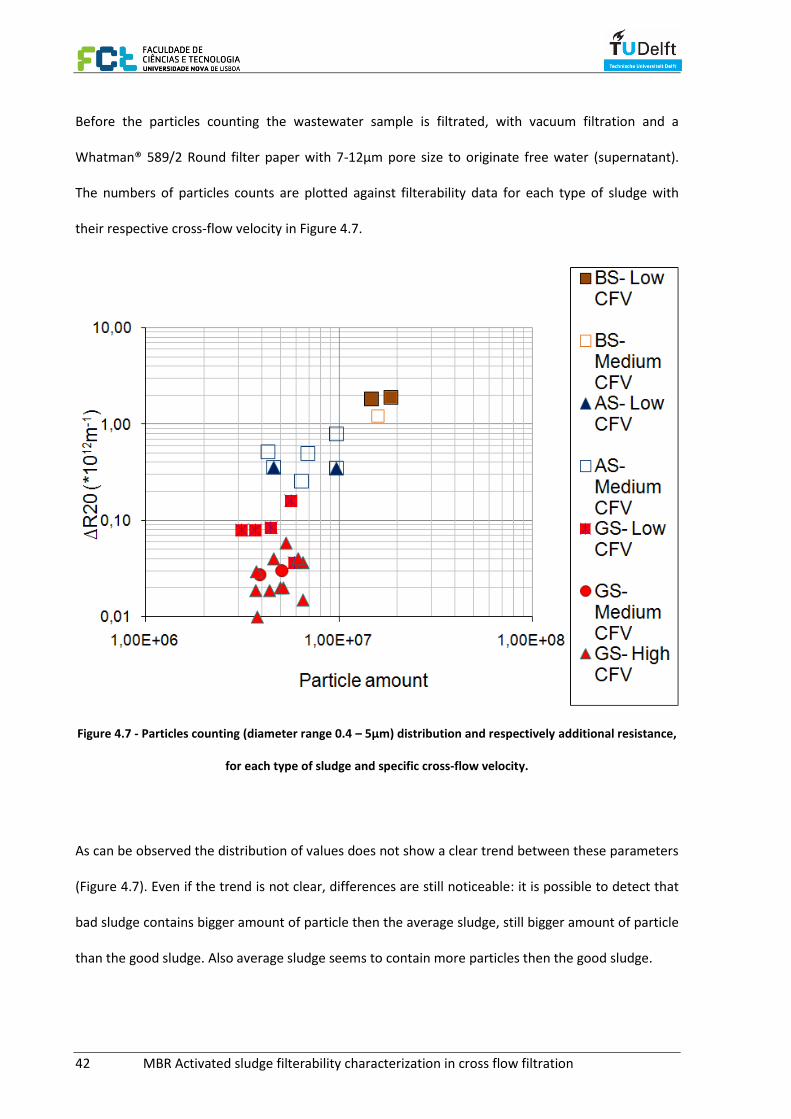
Before the particles counting the wastewater sample is filtrated, with vacuum filtration and a
Whatman® 589/2 Round filter paper with 7-12µm pore size to originate free water (supernatant).
The numbers of particles counts are plotted against filterability data for each type of sludge with
their respective cross-flow velocity in Figure 4.7.
Figure 4.7 - Particles counting (diameter range 0.4 – 5µm) distribution and respectively additional resistance,
for each type of sludge and specific cross-flow velocity.
As can be observed the distribution of values does not show a clear trend between these parameters
(Figure 4.7). Even if the trend is not clear, differences are still noticeable: it is possible to detect that
bad sludge contains bigger amount of particle then the average sludge, still bigger amount of particle
than the good sludge. Also average sludge seems to contain more particles then the good sludge.
MBR Activated sludge filterability characterization in cross flow filtration 43
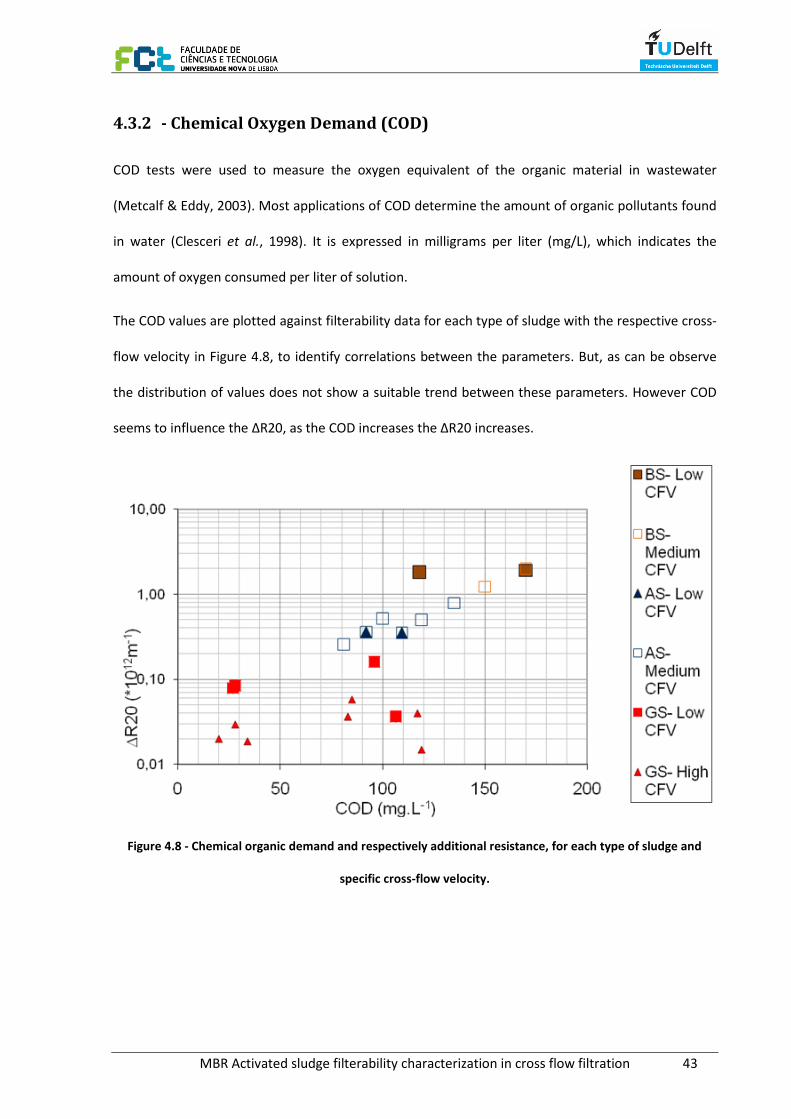
4.3.2 - Chemical Oxygen Demand (COD)
COD tests were used to measure the oxygen equivalent of the organic material in wastewater
(Metcalf & Eddy, 2003). Most applications of COD determine the amount of organic pollutants found
in water (Clesceri et al., 1998). It is expressed in milligrams per liter (mg/L), which indicates the
amount of oxygen consumed per liter of solution.
The COD values are plotted against filterability data for each type of sludge with the respective cross-
flow velocity in Figure 4.8, to identify correlations between the parameters. But, as can be observe
the distribution of values does not show a suitable trend between these parameters. However COD
seems to influence the ΔR20, as the COD increases the ΔR20 increases.
Figure 4.8 - Chemical organic demand and respectively additional resistance, for each type of sludge and
specific cross-flow velocity.
44 MBR Activated sludge filterability characterization in cross flow filtration
4.3.3 - Total Organic Carbon (TOC)
TOC tests were used to measure the total organic carbon in an aqueous sample (Clesceri et al., 1998).
The TOC in wastewater can be used as a measure of its pollution characteristics. The TOC can be
fractionated in order to get information about the different fractions present in the sample (colloids
and soluble) (Metcalf & Eddy, 2003). Before measuring TOC the wastewater sample is filtrated, with
vacuum filtration and a Whatman® 589/2 Round filter paper with 7-12µm pore size to obtain free
water. For the soluble material that passes through both filter steps to classified as dissolved, the
free water sample must be fractionated using a VWR 25 mm syringe and a filter with pore size
0.45µm (Tao, S. (1996)) (Figure 4.9).
Figure 4.9 - Syringe and a filter with a pore size 0.45µm
MBR Activated sludge filterability characterization in cross flow filtration 45
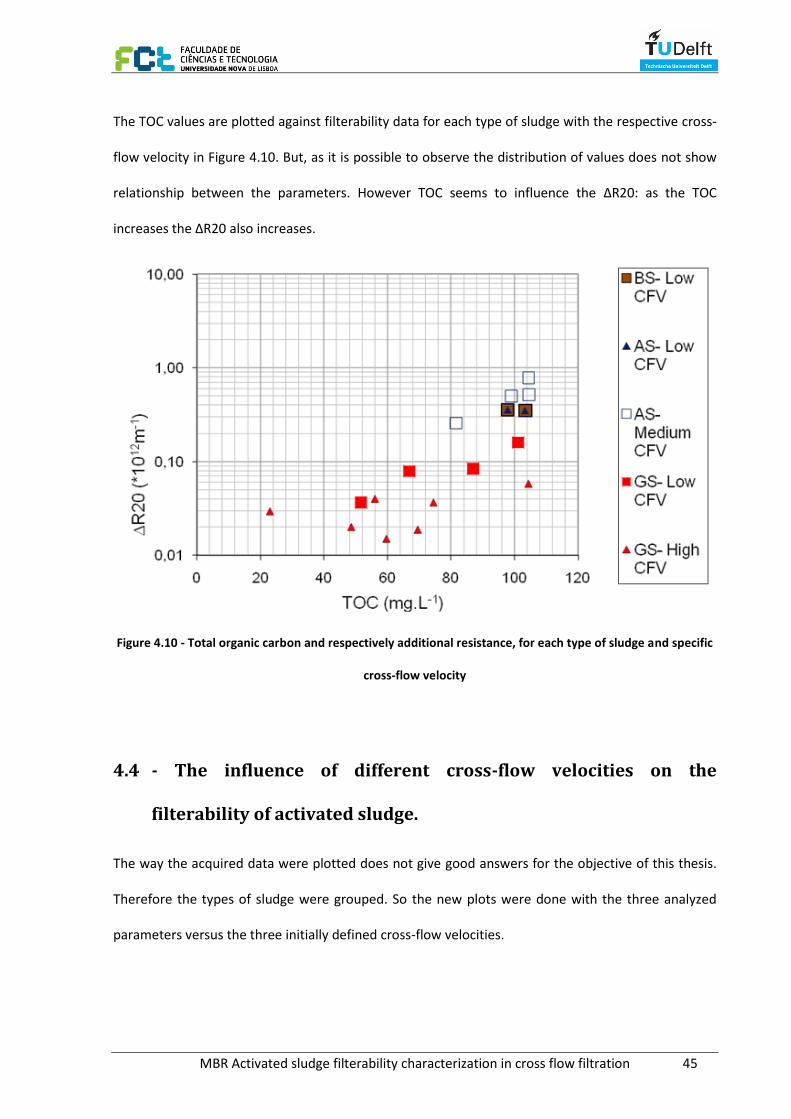
The TOC values are plotted against filterability data for each type of sludge with the respective cross-
flow velocity in Figure 4.10. But, as it is possible to observe the distribution of values does not show
relationship between the parameters. However TOC seems to influence the ΔR20: as the TOC
increases the ΔR20 also increases.
Figure 4.10 - Total organic carbon and respectively additional resistance, for each type of sludge and specific
cross-flow velocity
4.4 - The influence of different cross-flow velocities on the
filterability of activated sludge.
The way the acquired data were plotted does not give good answers for the objective of this thesis.
Therefore the types of sludge were grouped. So the new plots were done with the three analyzed
parameters versus the three initially defined cross-flow velocities.
46 MBR Activated sludge filterability characterization in cross flow filtration
4.4.1 - Particles counting in the diameter range of 0.4 – 5 µm VS ΔR20
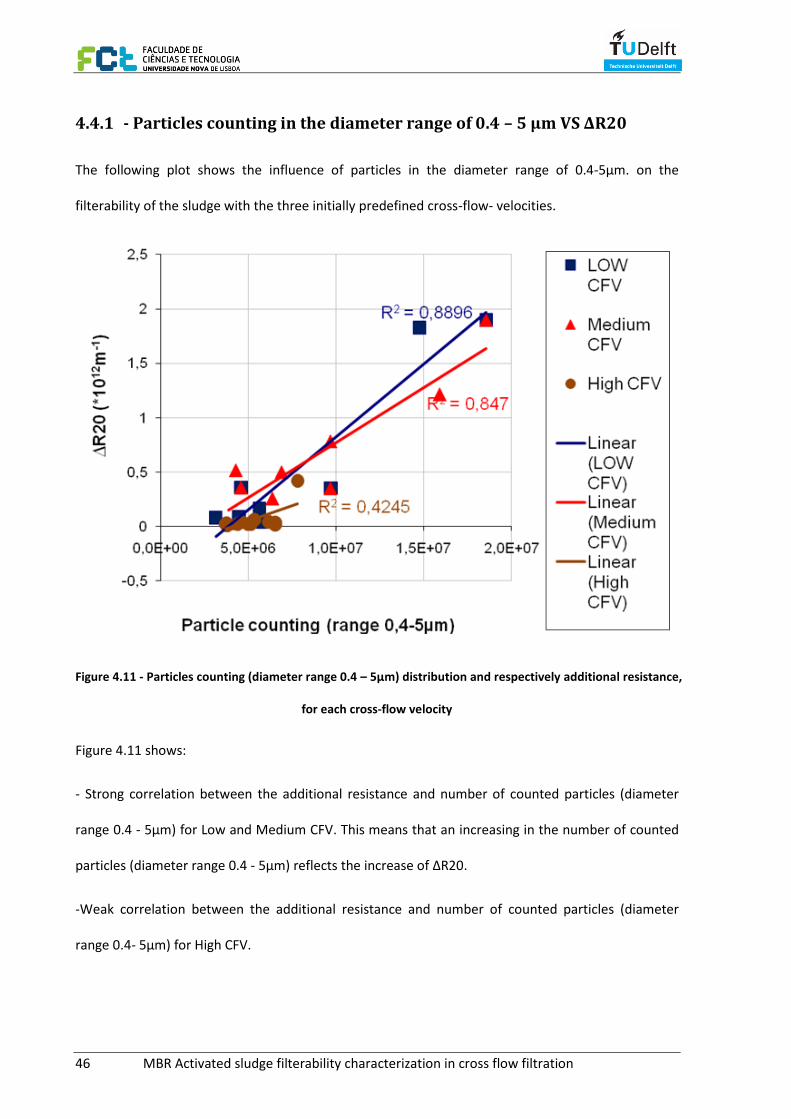
The following plot shows the influence of particles in the diameter range of 0.4-5µm. on the
filterability of the sludge with the three initially predefined cross-flow- velocities.
Figure 4.11 - Particles counting (diameter range 0.4 – 5µm) distribution and respectively additional resistance,
for each cross-flow velocity
Figure 4.11 shows:
- Strong correlation between the additional resistance and number of counted particles (diameter
range 0.4 - 5µm) for Low and Medium CFV. This means that an increasing in the number of counted
particles (diameter range 0.4 - 5µm) reflects the increase of ΔR20.
-Weak correlation between the additional resistance and number of counted particles (diameter
range 0.4- 5µm) for High CFV.
MBR Activated sludge filterability characterization in cross flow filtration 47
4.4.2 - Chemical Oxygen Demand (COD) VS ΔR20
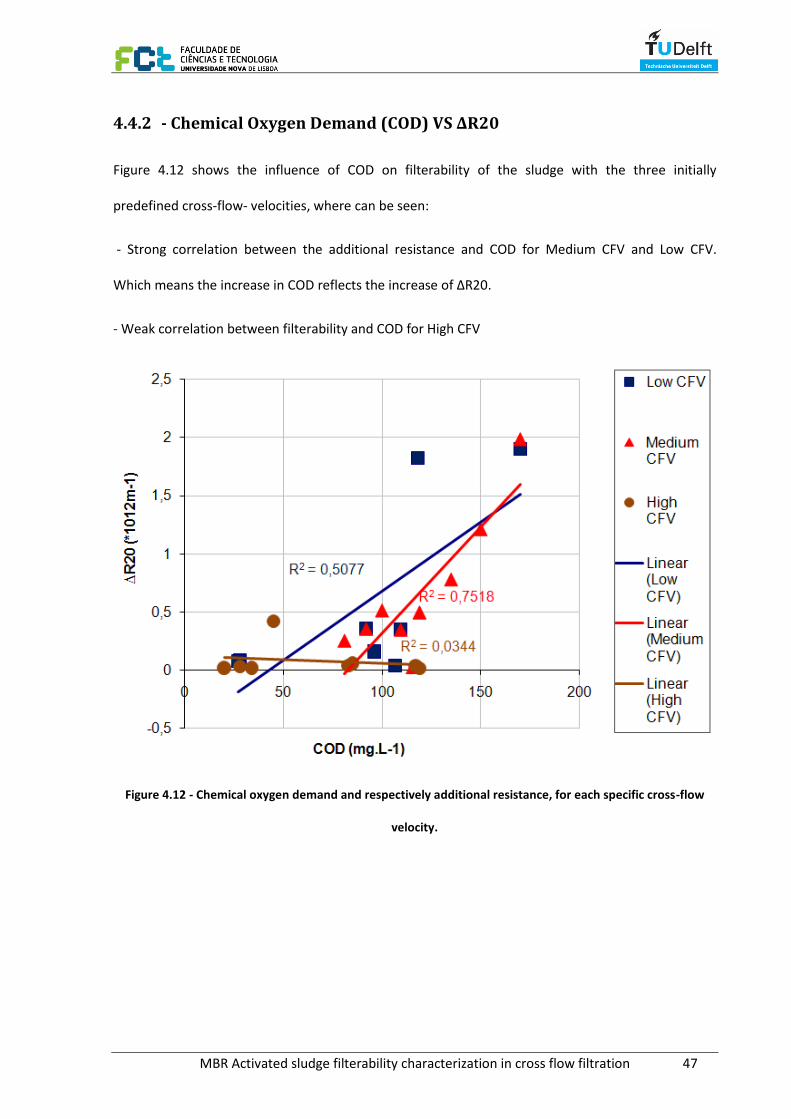
Figure 4.12 shows the influence of COD on filterability of the sludge with the three initially
predefined cross-flow- velocities, where can be seen:
- Strong correlation between the additional resistance and COD for Medium CFV and Low CFV.
Which means the increase in COD reflects the increase of ΔR20.
- Weak correlation between filterability and COD for High CFV
Figure 4.12 - Chemical oxygen demand and respectively additional resistance, for each specific cross-flow
velocity.
48 MBR Activated sludge filterability characterization in cross flow filtration
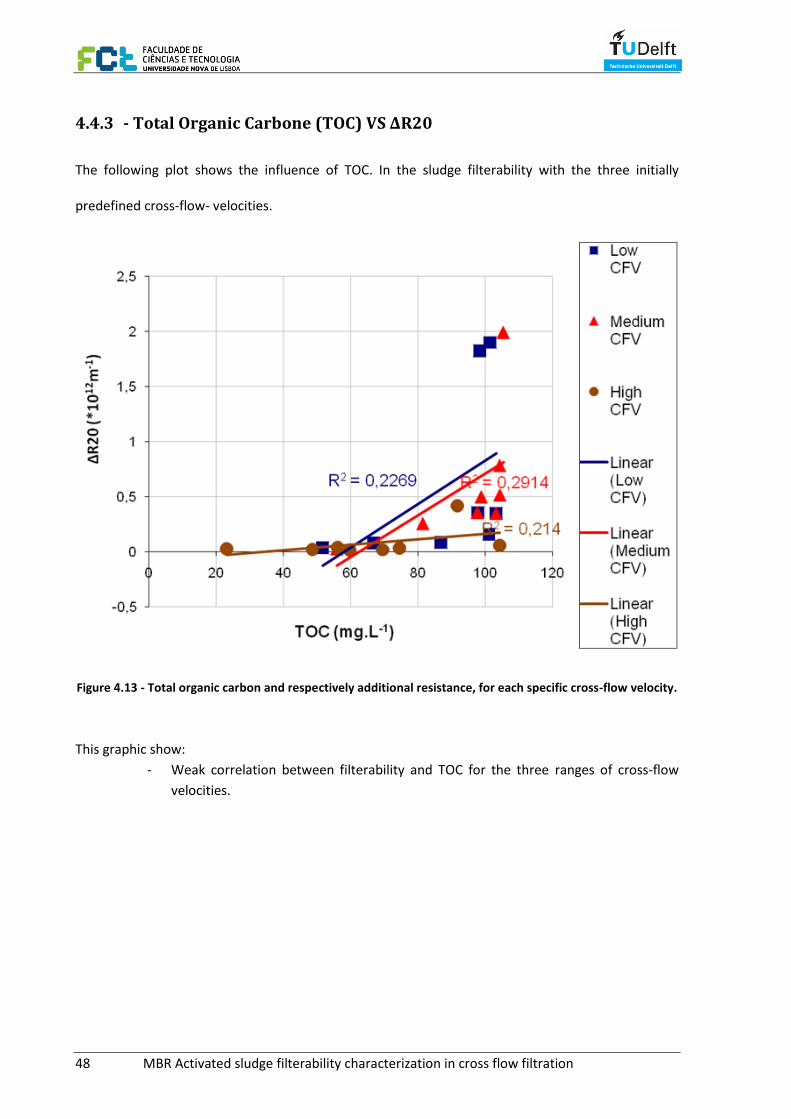
4.4.3 - Total Organic Carbone (TOC) VS ΔR20
The following plot shows the influence of TOC. In the sludge filterability with the three initially
predefined cross-flow- velocities.
Figure 4.13 - Total organic carbon and respectively additional resistance, for each specific cross-flow velocity.
This graphic show:
- Weak correlation between filterability and TOC for the three ranges of cross-flow
velocities.

MBR Activated sludge filterability characterization in cross flow filtration 49
4.4.4 – Physical interpretation of the results
From the overall analysis of the results and their physical interpretation, the following practical
relations can be obtained:
- The particles deposition on the membrane for the high CFV in Figure 4.11 could be associated with
the fact that high shear forces break the structure of the activated sludge flocs. Therefore free water
is release, as Rosenberger et al. (2006) mentioned. As colloids and particles are disrupted, they will
be dissolved into the soluble fraction, increasing the TOC values and improving filterability for High
CFV, as can be seen in Figure 4.13.
- Considering the low CFV and medium CFV, the colloid fractions have strong influences on activated
sludge filterability. The shear does not have the same influence as it has for high CFV. For this reason
the colloidal fraction influences filterability as can be identify in Figure 4.11 and Figure 4.12.
- The CFV did not show associations between TOC and filterability, as the correlations are very weak
(Figure 4.13). The soluble fraction does not influence filterability, contrary to the findings of
Rosenberger et al. (2002), mentioned by Evenblij et al. (2005).
The main reason could be related to the fact that, as the soluble fraction passes through the
membrane, the organic compounds might be retained by absorption in the membrane pores. With a
biological development this could generate serious problems on the membrane, originating pore
blocking. But as the Dfci filtrations only take fifteen minutes then it suffers a cleaning process and
after a day of filtrations a chemical cleaning is performed, these types of problems are not possible
to analyze.
-In relation to the cross flow velocity influences on tubular membrane fouling, the best values of
filterability were the high CFV, which caused less particle and colloids deposition (Figure 4.11 and
Figure 4.12). From low and medium CFV data, it is not possible to draw conclusions.

MBR Activated sludge filterability characterization in cross flow filtration 51
5 – CONCLUSIONS
The two phases in this thesis were monitoring the Heenvliet WWTP, and perform a set of
experiments focused on the influence of the cross-flow velocity on tubular membrane fouling.
The number of measurements for this thesis is quite small; therefore conclusions can only be drawn
with some reservations. Still it was possible to detect an influence of the CFV on membrane fouling
and good correlations on biological treatment stabilization and temperature changes, in Heenvliet
WWTP monitoring.
In relation to the first phase, the obtained data showed a good relation between process progress
with temperature and COD analyses in the WWTP. The ΔR20 decreases when temperature increases.
And the maximum value of COD corresponds to the worst process situation of the Membrane reactor
(when the process changed from series to parallel).
The second phase which is related to the experimental analyses focused on the influence of the
cross-flow velocity on tubular membrane fouling. The main conclusion is that for high cross-flow
velocity (above 1m/s) the membrane is more efficient in the filtration process. Maybe because of the
precision in relation to chemical compounds and physical processes, only four months of analyses are
not sufficient, to obtain strong results. This could be a reason to the fact that only for high cross-flow
velocities the obtain data allow to draw conclusions.
52 MBR Activated sludge filterability characterization in cross flow filtration
MBR Activated sludge filterability characterization in cross flow filtration 53
6 – RECOMMENDATION FOR FURTHER RESEARCH
Further research is suggested on the practical procedure. Performing the TOC, COD and particles
counting analyses on the supernatant and permeate in order to identify the amount of colloids and
soluble fraction retained by the membrane. In other words, to identify the amount of colloids and
soluble fraction that is theoretically available for cake layer formation, since it is larger than the
membrane pore size.
The lack of time for the research and the limited range of velocities on Dfci activated sludge
peristaltic pump, did not permit the identification of the most favourable value of CFV for the best
balance between energy consumption and efficiency of the membrane. For a following research
identify the maximum value of cross-flow velocity, that membrane efficiency stabilizes. And discover
the best value for energy efficiency and effluent quality.

54 MBR Activated sludge filterability characterization in cross flow filtration

MBR Activated sludge filterability characterization in cross flow filtration 55
7 – BIBLIOGRAPHY
Bacchin, P., Aimar ,P., Field, R., W. (2006).Critical and Sustainable fluxes: Theory, Experiments and
Applications. Journal of Membrane Science, vol. 281.
Belfort, G., Davis, R., Zydney, A. (1994). The behavior of suspen-sions and macromolecular solutions
in cross-flow microfiltration. Journal of Membrane Science, vol. 96.
Bentem, A., Petri C., Mulder, J., Evenblij H., Vente, D., Geraats, B. (2005) . Dutch MBR grows to
maturity. H2O magazine, MBR special III, ISSN: 0166-8439.
Berubier, P. (2007). Shear Forces in an Air Sparged Submerged Hollow Fibre Membrane System, IWA
Membranes Conference Proceedings, UK, paper 10b.
Bouhabila, E. H., Aim, R. B., Buisson, H. (2001). Fouling characterization in membrane bioreactors
separation and purification technology.
Brandão, D. (2008). Particle size distribution in the range of 2-100 µm and filterability on MBR
Systems. Master Thesis, New University of Lisbon, Porttugal.
Cicek, N., Franco, J.P., Suidan, M. T., Urbain, V. and Manem, J. (1999) Characterization and
comparison of a membrane bioreactor and a conventional activated-sludge system in the treatment
of wastewater containing high-molecular-weight compounds. Water Environmental Research.
Clesceri, L., Greenberga, A., Eaton, A. (1998). Standard Methods for the Examination of Water and
Wastewater – 20th Edition, American Public Health Association.
Cui,F., Chang, S., Fane ,G. (2003).The use of gas bubbling to enhance membrane process, J. Memb. Sci.
2211.
Drews, A. (2008). Available in web site http://en.wikipedia.org/wiki/File:
MBRvsASP_Schematic.jpg#file. Consulted on July 25, 2009.
Evenblij, H. (2006), Filtration Characteristics in Membrane Bioreactors. PhD thesis, Delft University of
Technology, The Netherlands.
Evenblij, H., Geilvoet, S.P., Van der Graaf, J.H.J.M., Van der Roest, H.F. (2005). Filtration
Characterisation for assessing MBR performance: three cases compared. Desalination, vol 178, Issues
1-3.
56 MBR Activated sludge filterability characterization in cross flow filtration
Geilvoet S. P. (2009) The Delft Filtration Characterization method, Assessing membrane bioreactors
Geilvoet S. P. (2009) The Delft Filtration Characterization method, Assessing membrane bioreactors
activated sludge filtration. PhD thesis (in press), Delft University of Technology, The Netherlands.
Gander, M., Jeffernson, B. and Judd, S. (2000). Aerobic MBRs for domestic wastewater treatment: a
review with cost considerations. Separation and Purification Technology.
Graeme, P. (2007). Introduction to membranes: Fouling control July/August. Filtration+Separation.
Itonaga, T., Kimura K., Watanabe, Y.(2004). Influence of suspension viscosity and colloidal particles
on permeability of membrane used in membrane bioreactor (MBR). Water Science Technology 50
Judd, S. (2006) The MBR book: Principles and Applications of Membrane Bioreactors in Water and
Wastewater Treatment (1st Edition). Elsevier, Oxford.
Koros, J., Ma, H. and T. Shimidzu T. (1996). Terminology for membranes and membrane processes;
IUPAC recommendations. Journal of Membrane Science, vol. 120.
Kraume, M., Bracklow, U., Vocks, M., Drews, A., (2005) Nutrients Removal in MBRs for Municipal
Wastewater Treatment. Water Science Technology 51.
Lojkine, H., Field, R., Howell, J. (1992) Cross-flow microfiltration of cell suspensions: a review of
models with emphasis on particle size effects, Trans. Inst. Chem. Eng, vol. 70.
Le-Clech, P., Chen, V., Fane, T. (2006). Fouling in membrane bioreactors used in wastewater
treatment. Journal of Science 284.
Melin,T., Jefferson, B., Bixio, D., Thoeye, C., De Wilde, W., De Koning, J., van der Graff , J. and
Wintgens, T. (2006). Membrane technology for wastewater treatment and reuse. Desalination 187.
Metcalf & Eddy (2003). Wastewater Engineering: treatment and reuse (4th international edition).
McGraw Hill, New York.
Mudrack, J. & D. Kunst (1985). Biology of Sewage Treatment and Control. Ellis Horwood Ltd.
Mulder, J., Kramer, F., van Sonsbeek, E. (2005). Hybrid MBR – the perfect upgrade for Heenvliet. H2O
magazine, MBR special III, ISSN: 0166-8439.
Pearce, G. K. (2007). Membrane Fouling Guidelines for UF/MF. IWA Membranes Conference
Proceedings, UK, paper 16c.
MBR Activated sludge filterability characterization in cross flow filtration 57
Pearce, G. K., Field, R., W. (2007). Development of the Sustainable Flux Concept to Provide Guidelines
for Fouling Control in UF/MF System Design., AWWA Memb Tech Conference Proceedings.
Petsev, D. N., Starov, I.B., Ivanov, I. B. (1993). Concentrated dispersons of charged colloidal particles:
sedimentation, ultrafiltration and diffusion, Colloid Surf. A: Physiochem. Eng. Asp. 81.
Piedade, F. (2009). The influence of sludge characteristics from full-scale MBR in membrane
filterability. Master thesis, New University of Lisbon, Portugal
Ravazzini, M.(2008). Cross-flow Ultrafiltration of Raw Municipal Wastewater, Gildeprint Drukkereijn
b. v., Enschede, Netherlands.
Rosenberger, S., Evenblij, H., Poele, S., Wintgens, T., Laabs, C. (2005). The importance of liquid phase
analyses to understand fouling in membrane assisted activated sludge processes- six cases studies of
different European research groups. Journal of Membrane Science 263.
Rosenberguer, S., Kubin, K., Kraume M. (2006). Rheology of activated sludge in membrane
bioreactors. ©INIST.
Rosenberger, S., Kraume, M. (2002) . Filterability of activated sludge in membrane bioreactors.
Desalination, 146.
Tao, S. (1996). Fractionation and chlorination of organic carbon in water from Yinluan River, Tianjin,
China. Geo Journal.
Uijterlinde C., Hofstra M., Kraaij E., Leenen J.(2005). The MBR in broad Dutch perspective H2O
magazine, MBR special III, ISSN: 0166-8439.
Wiesner, M. R. , Tarabara, J., Cortalezzi, M.. (2005). Processes of particle deposition in membrane
operation and fabrication. Water Science and Technology, 51.
Zsigmondy, R. (July 22, 1922). US Patent, 1, 421,342.

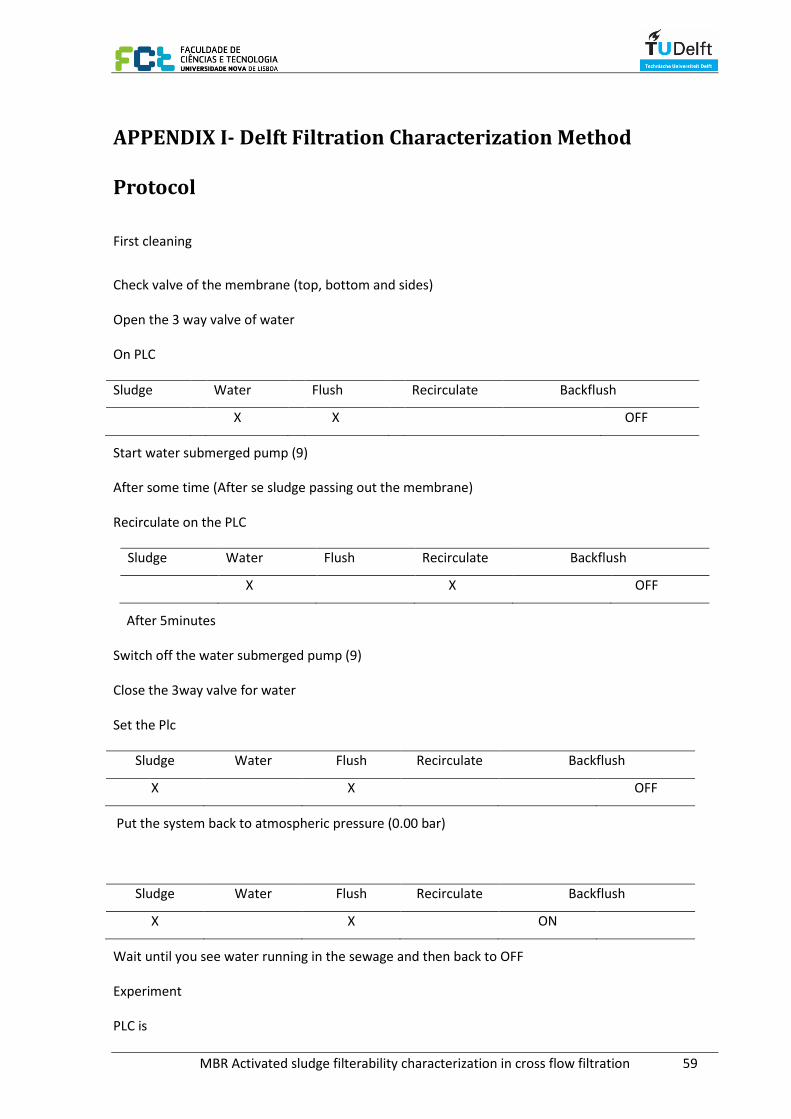
MBR Activated sludge filterability characterization in cross flow filtration 59
APPENDIX I- Delft Filtration Characterization Method
Protocol
First cleaning
Check valve of the membrane (top, bottom and sides)
Open the 3 way valve of water
On PLC
Sludge Water Flush Recirculate Backflush
X X OFF
Start water submerged pump (9)
After some time (After se sludge passing out the membrane)
Recirculate on the PLC
Sludge Water Flush Recirculate Backflush
X X OFF
After 5minutes
Switch off the water submerged pump (9)
Close the 3way valve for water
Set the Plc
Sludge Water Flush Recirculate Backflush
X X OFF
Put the system back to atmospheric pressure (0.00 bar)
Sludge Water Flush Recirculate Backflush
X X ON
Wait until you see water running in the sewage and then back to OFF
Experiment
PLC is
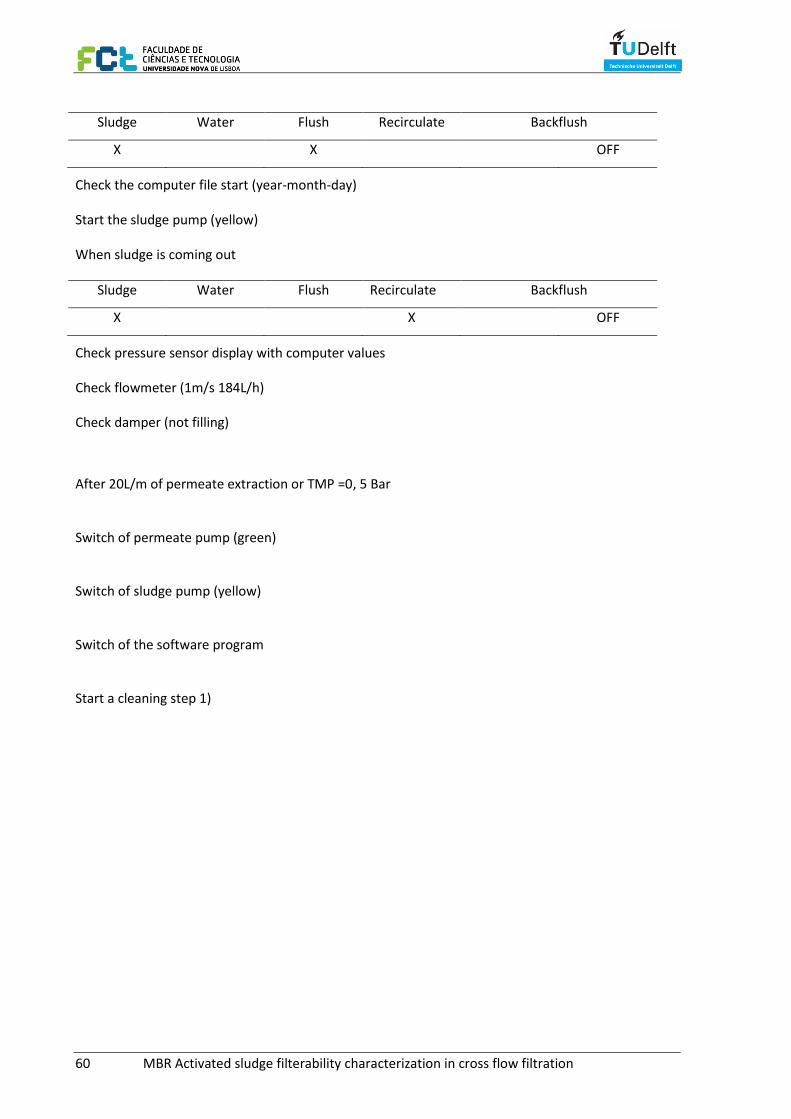
60 MBR Activated sludge filterability characterization in cross flow filtration
Sludge Water Flush Recirculate Backflush
X X OFF
Check the computer file start (year-month-day)
Start the sludge pump (yellow)
When sludge is coming out
Sludge Water Flush Recirculate Backflush
X X OFF
Check pressure sensor display with computer values
Check flowmeter (1m/s 184L/h)
Check damper (not filling)
After 20L/m of permeate extraction or TMP =0, 5 Bar
Switch of permeate pump (green)
Switch of sludge pump (yellow)
Switch of the software program
Start a cleaning step 1)
MBR Activated sludge filterability characterization in cross flow filtration 61
Appendix II – Standard Methods for MLSS
In this research the Standard Methods for the examination of water and wastewater (20th Edition)
were used for the TSS and VSS analyses (Clesceri et al., 1998).
The MLSS protocol written by Clesceri et al. (1998), in Standard Methods for the Examination of
Water and Wastewater – 20th Edition and it was mentioned on Piedade (2009).
2540 D. Total Suspended Solids Dried at 103–105°C
1. General Discussion
a. Principle: A well-mixed sample is filtered through a weighed standard glass-fiber filter and the
residue retained on the filter is dried to a constant weight at 103 to 105°C. The increase in weight of
the filter represents the total suspended solids. If the suspended material clogs the filter and
prolongs filtration, it may be necessary to increase the diameter of the filter or decrease the sample
volume. To obtain an estimate of total suspended solids, calculate the difference between total
dissolved solids and total solids.
b. Interferences: See Section 2540A.2 and Section 2540B.1. Exclude large floating particles or
submerged agglomerates of non homogeneous materials from the sample if it is determined that
their inclusion is not representative. Because excessive residue on the filter may form a water-
entrapping crust, limit the sample size to that yielding no more than 200 mg residue. For samples
high in dissolved solids thoroughly wash the filter to ensure removal of dissolved material. Prolonged
filtration times resulting from filter clogging may produce high results owing to increased colloidal
materials captured on the clogged filter.
2. Apparatus
Apparatus listed in Section 2540B.2 and Section 2540C.2 is required, except for evaporating dishes,
steam bath, and 180°C drying oven. In addition:
62 MBR Activated sludge filterability characterization in cross flow filtration
Aluminum weighing dishes.
3. Procedure
a. Preparation of glass-fiber filter disk: If pre-prepared glass fiber filter disks are used, eliminate this
step. Insert disk with wrinkled side up in filtration apparatus. Apply vacuum and wash disk with three
successive 20-mL portions of reagent-grade water. Continue suction to remove all traces of water,
turn vacuum off, and discard washings. Remove filter from filtration apparatus and transfer to an
inert aluminium weighing dish. If a Gooch crucible is used, remove crucible and filter combination.
Dry in an oven at 103 to 105°C for 1 h. If volatile solids are to be measured, ignite at 550°C for 15 min
in a muffle furnace. Cool in desiccators to balance temperature and weigh. Repeat cycle of drying or
igniting, cooling, desiccating, and weighing until a constant weight is obtained or until weight change
is less than 4% of the previous weighing or 0.5 mg, whichever is less. Store in desiccators until
needed.
b. Selection of filter and sample sizes: Choose sample volume to yield between 2.5 and 200 mg dried
residue. If volume filtered fails to meet minimum yield, increase sample volume up to 1 L. If complete
filtration takes more than 10 min, increase filter diameter or decrease sample volume.
c. Sample analysis: Assemble filtering apparatus and filter and begin suction. Wet filter with a small
volume of reagent-grade water to seat it. Stir sample with a magnetic stirrer at a speed to shear
larger particles, if practical, to obtain a more uniform (preferably homogeneous) particle size.
Centrifugal force may separate particles by size and density, resulting in poor precision when point of
sample withdrawal is varied. While stirring, pipet a measured volume onto the seated glass-fiber
filter. For homogeneous samples, pipet from the approximate midpoint of container but not in
vortex. Choose a point both middepth and midway between wall and vortex. Wash filter with three
successive 10-mL volumes of reagent-grade water, allowing complete drainage between washings,
and continue suction for about 3 min after filtration is complete. Samples with high dissolved solids
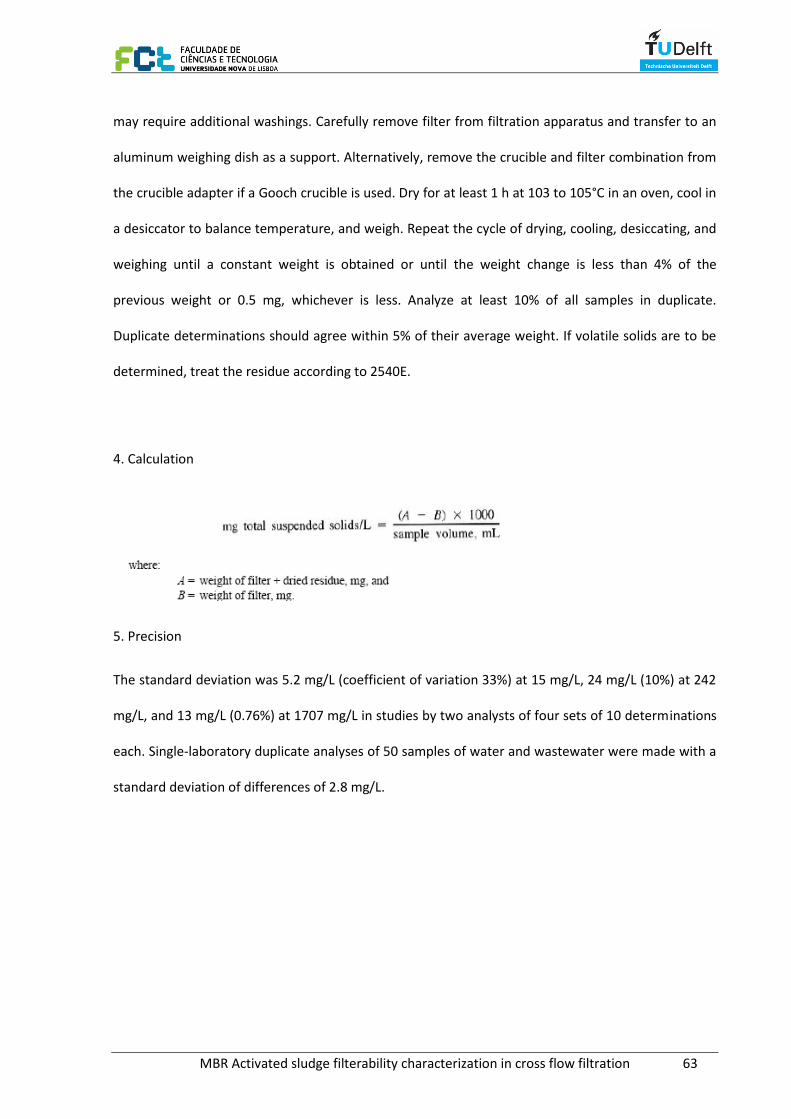
MBR Activated sludge filterability characterization in cross flow filtration 63
may require additional washings. Carefully remove filter from filtration apparatus and transfer to an
aluminum weighing dish as a support. Alternatively, remove the crucible and filter combination from
the crucible adapter if a Gooch crucible is used. Dry for at least 1 h at 103 to 105°C in an oven, cool in
a desiccator to balance temperature, and weigh. Repeat the cycle of drying, cooling, desiccating, and
weighing until a constant weight is obtained or until the weight change is less than 4% of the
previous weight or 0.5 mg, whichever is less. Analyze at least 10% of all samples in duplicate.
Duplicate determinations should agree within 5% of their average weight. If volatile solids are to be
determined, treat the residue according to 2540E.
4. Calculation
5. Precision
The standard deviation was 5.2 mg/L (coefficient of variation 33%) at 15 mg/L, 24 mg/L (10%) at 242
mg/L, and 13 mg/L (0.76%) at 1707 mg/L in studies by two analysts of four sets of 10 determinations
each. Single-laboratory duplicate analyses of 50 samples of water and wastewater were made with a
standard deviation of differences of 2.8 mg/L.

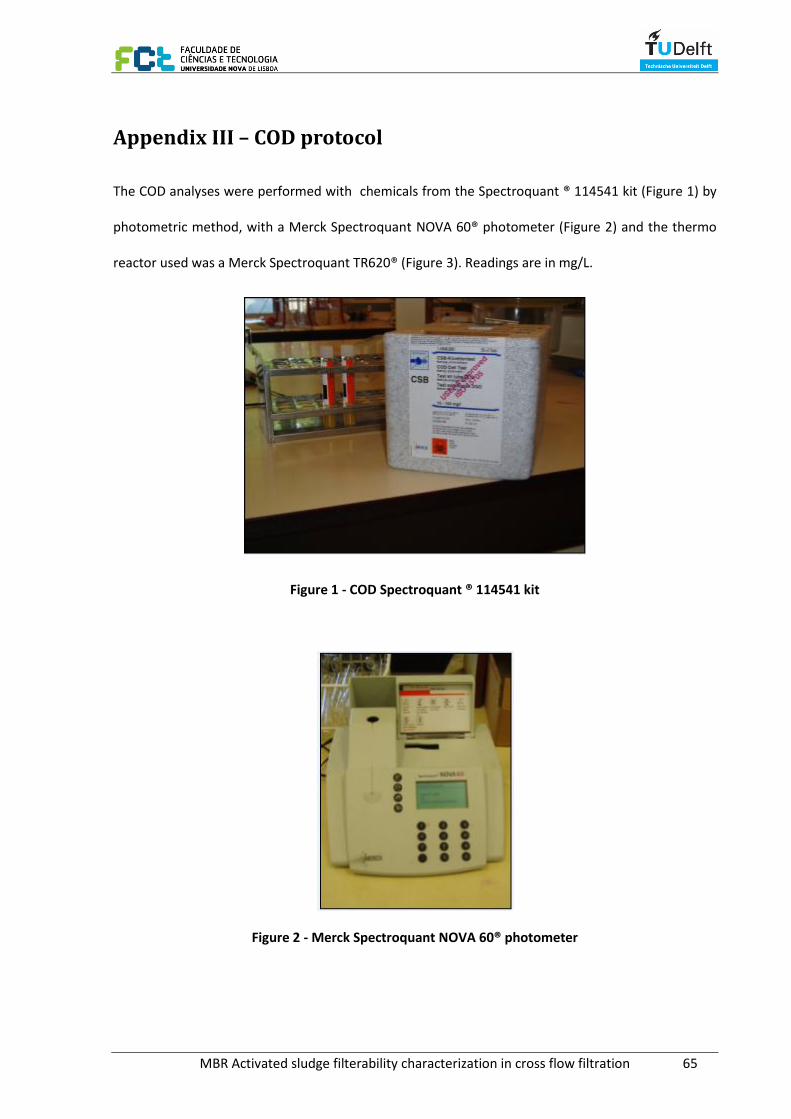
MBR Activated sludge filterability characterization in cross flow filtration 65
Appendix III – COD protocol
The COD analyses were performed with chemicals from the Spectroquant ® 114541 kit (Figure 1) by
photometric method, with a Merck Spectroquant NOVA 60® photometer (Figure 2) and the thermo
reactor used was a Merck Spectroquant TR620® (Figure 3). Readings are in mg/L.
Figure 1 - COD Spectroquant ® 114541 kit
Figure 2 - Merck Spectroquant NOVA 60® photometer
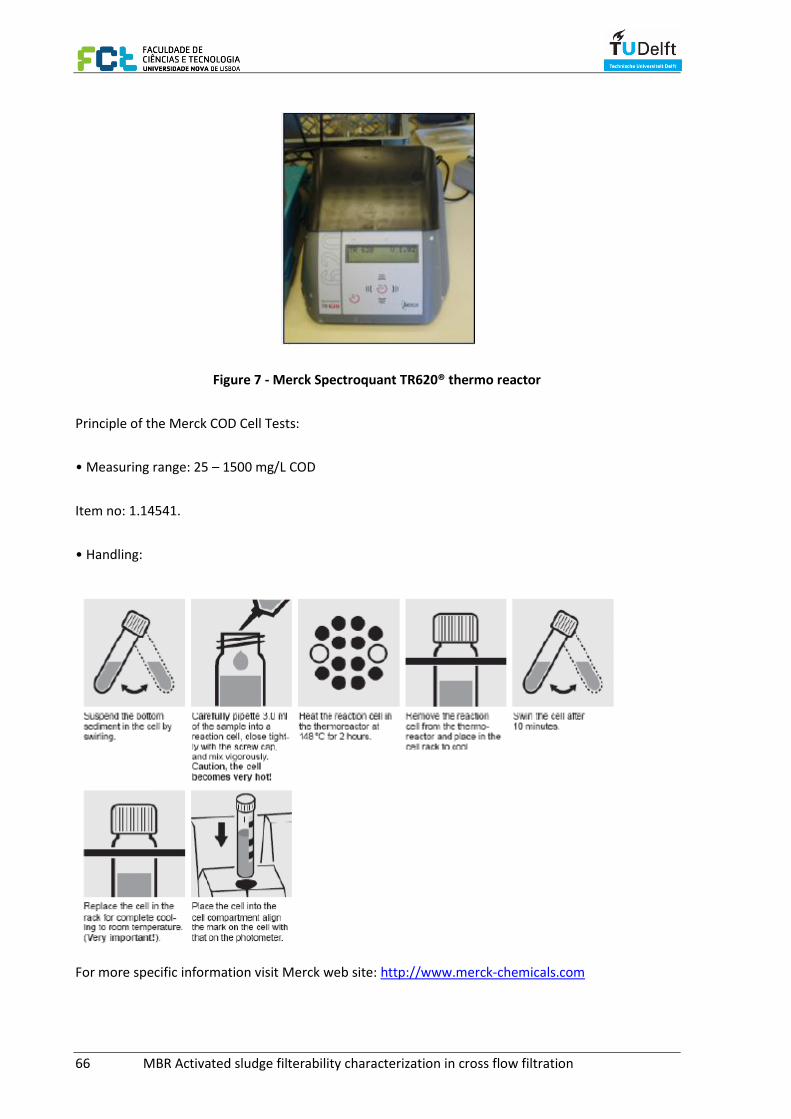
66 MBR Activated sludge filterability characterization in cross flow filtration
Figure 7 - Merck Spectroquant TR620® thermo reactor
Principle of the Merck COD Cell Tests:
• Measuring range: 25 – 1500 mg/L COD
Item no: 1.14541.
• Handling:
For more specific information visit Merck web site: http://www.merck-chemicals.com
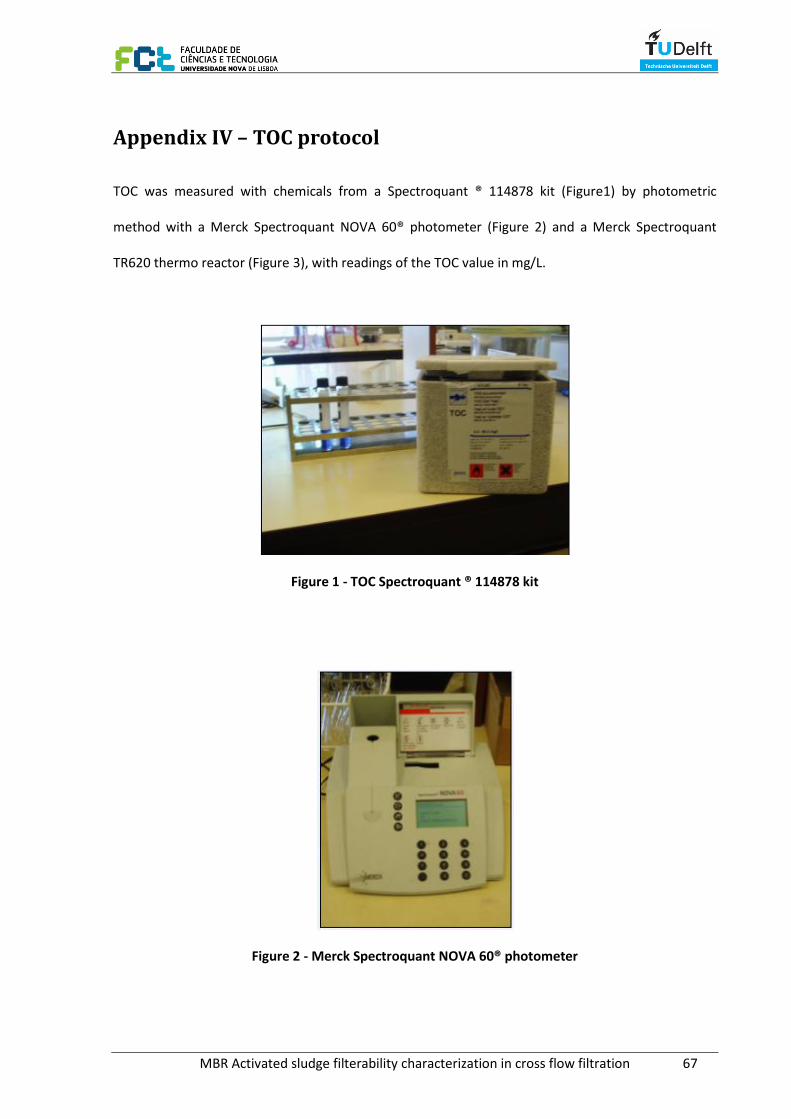
MBR Activated sludge filterability characterization in cross flow filtration 67
Appendix IV – TOC protocol
TOC was measured with chemicals from a Spectroquant ® 114878 kit (Figure1) by photometric
method with a Merck Spectroquant NOVA 60® photometer (Figure 2) and a Merck Spectroquant
TR620 thermo reactor (Figure 3), with readings of the TOC value in mg/L.
Figure 1 - TOC Spectroquant ® 114878 kit
Figure 2 - Merck Spectroquant NOVA 60® photometer
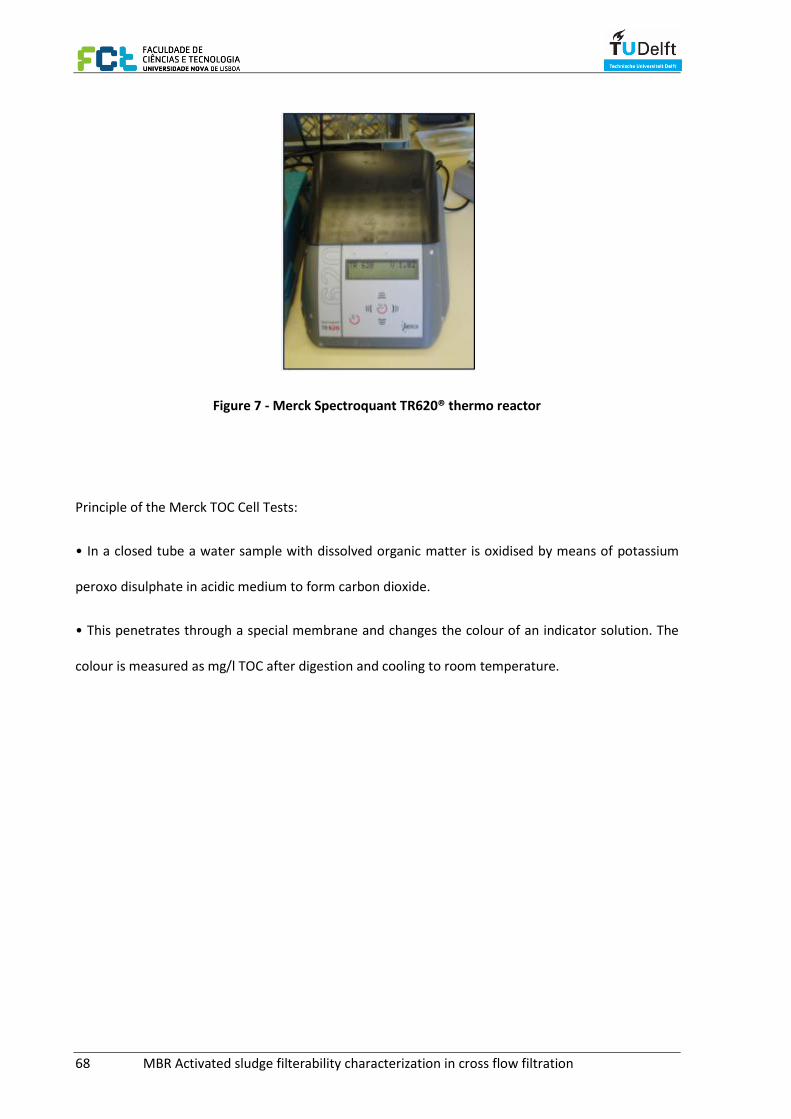
68 MBR Activated sludge filterability characterization in cross flow filtration
Figure 7 - Merck Spectroquant TR620® thermo reactor
Principle of the Merck TOC Cell Tests:
• In a closed tube a water sample with dissolved organic matter is oxidised by means of potassium
peroxo disulphate in acidic medium to form carbon dioxide.
• This penetrates through a special membrane and changes the colour of an indicator solution. The
colour is measured as mg/l TOC after digestion and cooling to room temperature.
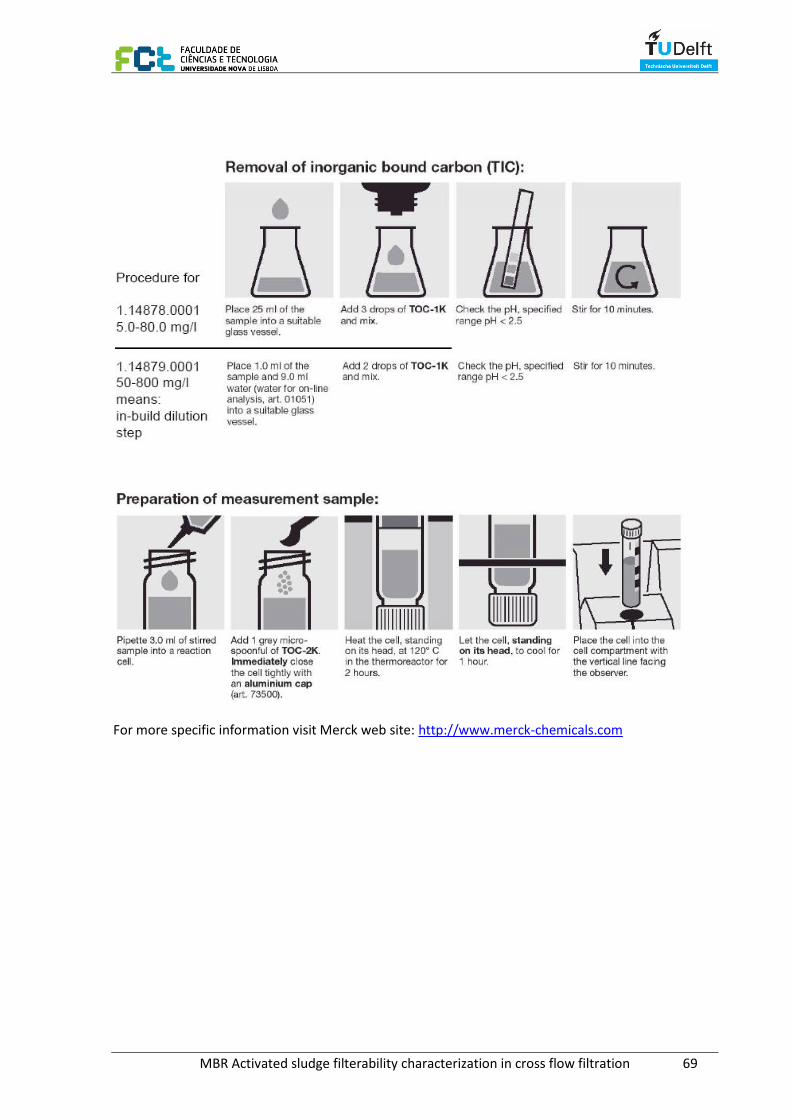
MBR Activated sludge filterability characterization in cross flow filtration 69
For more specific information visit Merck web site: http://www.merck-chemicals.com

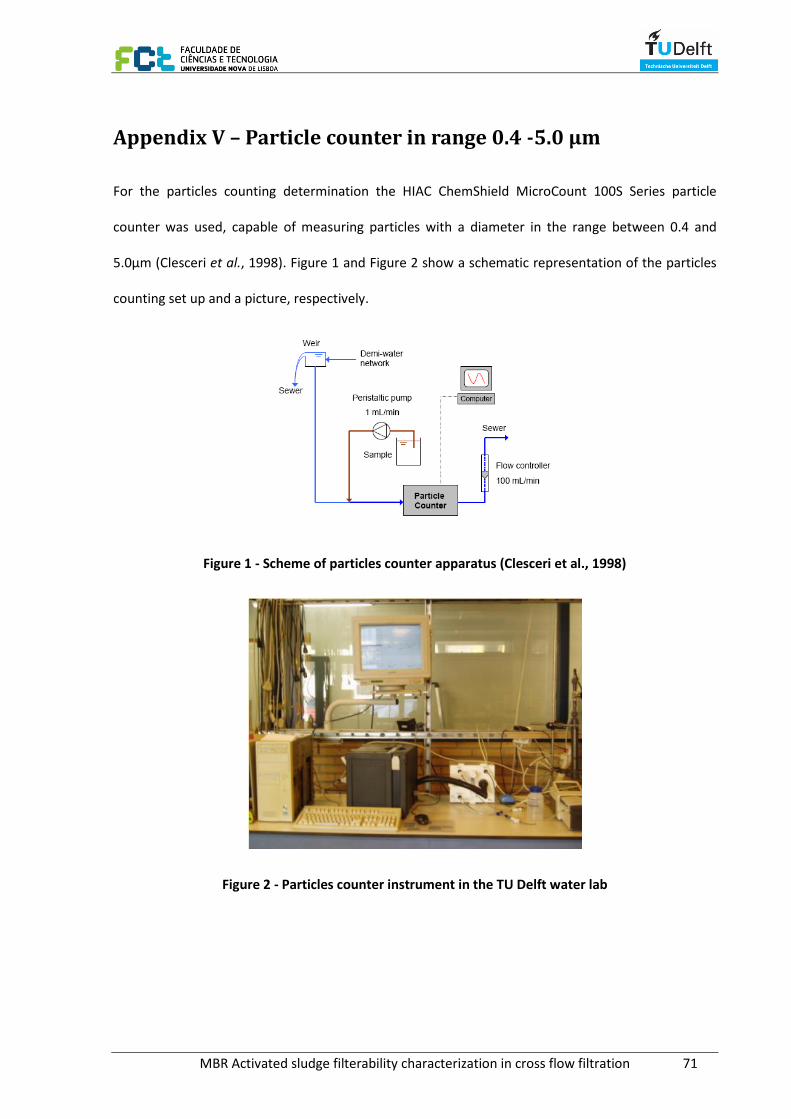
MBR Activated sludge filterability characterization in cross flow filtration 71
Appendix V – Particle counter in range 0.4 -5.0 µm
For the particles counting determination the HIAC ChemShield MicroCount 100S Series particle
counter was used, capable of measuring particles with a diameter in the range between 0.4 and
5.0μm (Clesceri et al., 1998). Figure 1 and Figure 2 show a schematic representation of the particles
counting set up and a picture, respectively.
Figure 1 - Scheme of particles counter apparatus (Clesceri et al., 1998)
Figure 2 - Particles counter instrument in the TU Delft water lab
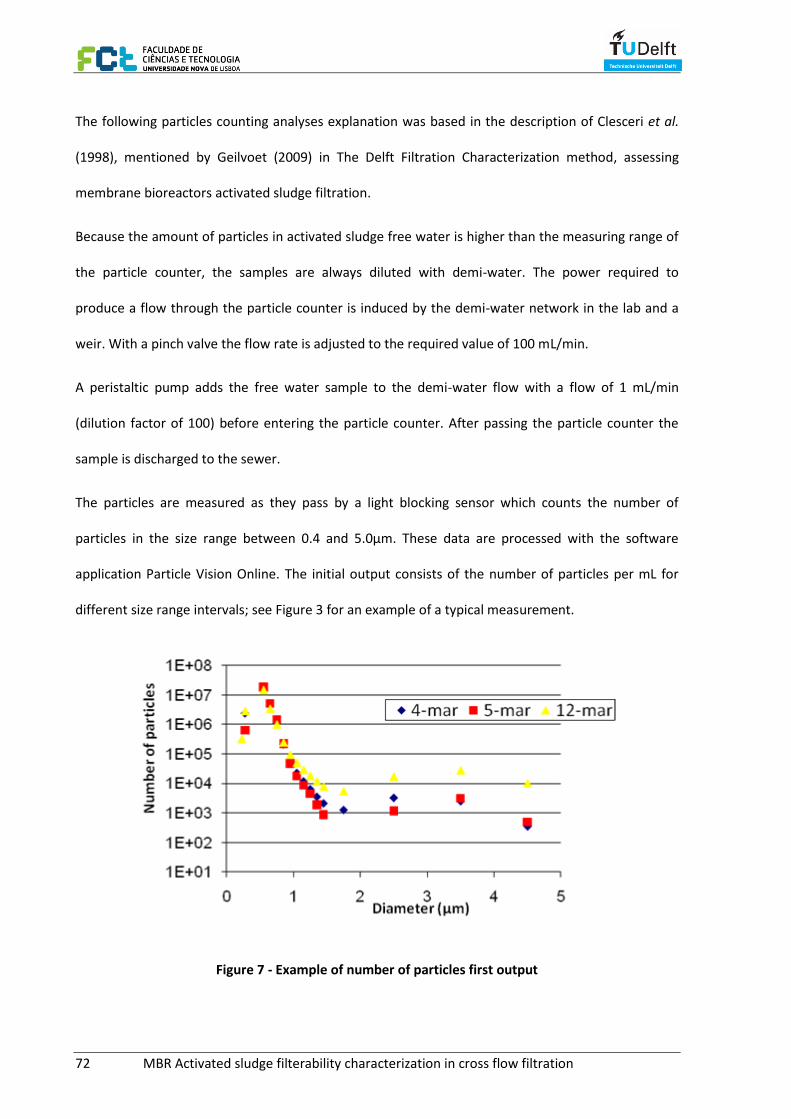
72 MBR Activated sludge filterability characterization in cross flow filtration
The following particles counting analyses explanation was based in the description of Clesceri et al.
(1998), mentioned by Geilvoet (2009) in The Delft Filtration Characterization method, assessing
membrane bioreactors activated sludge filtration.
Because the amount of particles in activated sludge free water is higher than the measuring range of
the particle counter, the samples are always diluted with demi-water. The power required to
produce a flow through the particle counter is induced by the demi-water network in the lab and a
weir. With a pinch valve the flow rate is adjusted to the required value of 100 mL/min.
A peristaltic pump adds the free water sample to the demi-water flow with a flow of 1 mL/min
(dilution factor of 100) before entering the particle counter. After passing the particle counter the
sample is discharged to the sewer.
The particles are measured as they pass by a light blocking sensor which counts the number of
particles in the size range between 0.4 and 5.0μm. These data are processed with the software
application Particle Vision Online. The initial output consists of the number of particles per mL for
different size range intervals; see Figure 3 for an example of a typical measurement.
Figure 7 - Example of number of particles first output
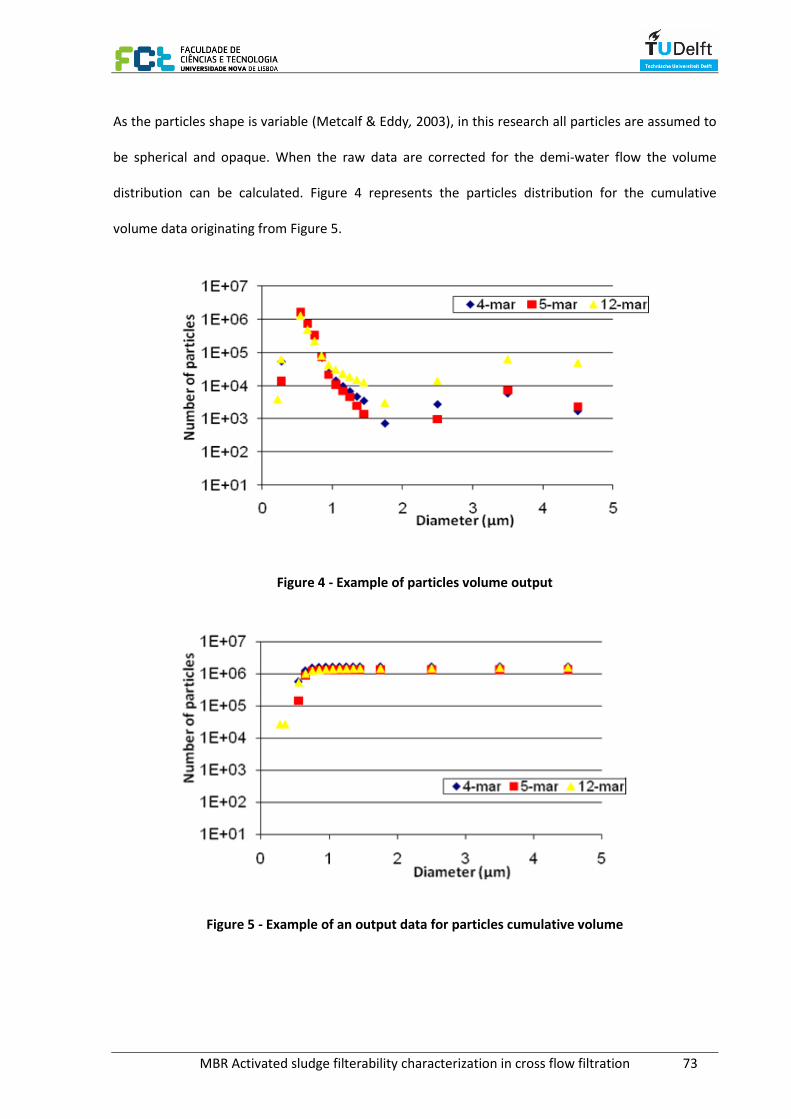
MBR Activated sludge filterability characterization in cross flow filtration 73
As the particles shape is variable (Metcalf & Eddy, 2003), in this research all particles are assumed to
be spherical and opaque. When the raw data are corrected for the demi-water flow the volume
distribution can be calculated. Figure 4 represents the particles distribution for the cumulative
volume data originating from Figure 5.
Figure 4 - Example of particles volume output
Figure 5 - Example of an output data for particles cumulative volume
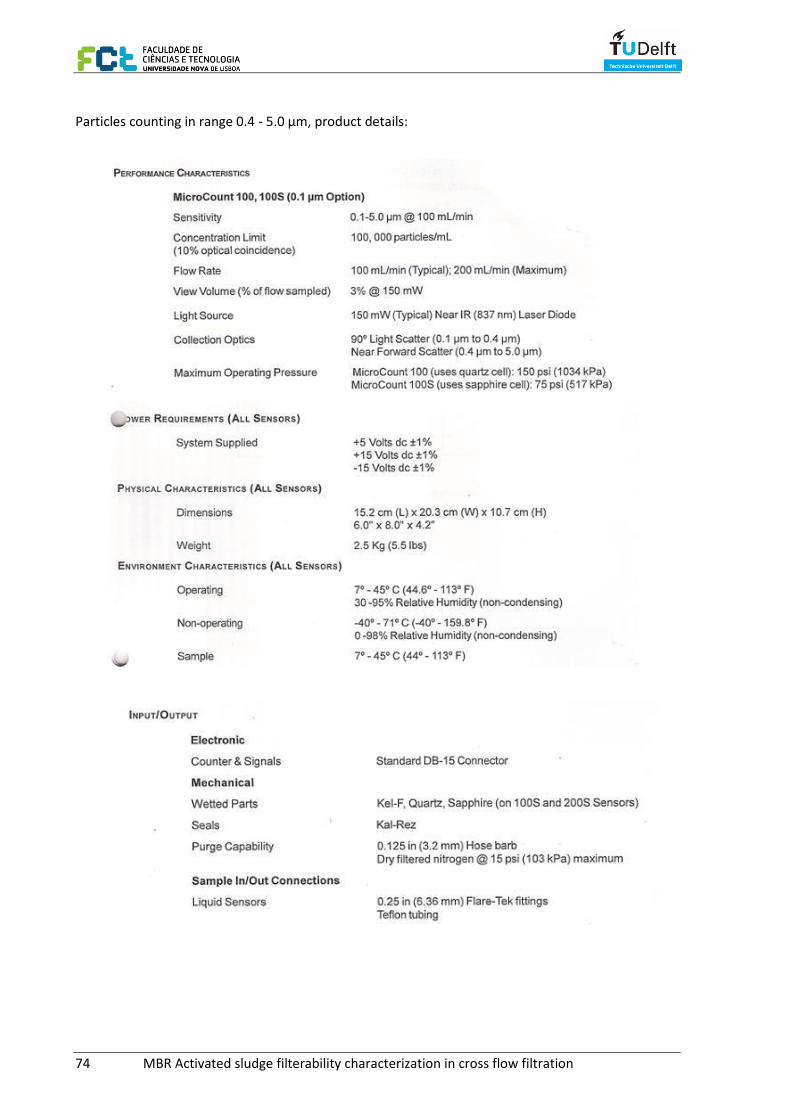
74 MBR Activated sludge filterability characterization in cross flow filtration
Particles counting in range 0.4 - 5.0 µm, product details:

MBR Activated sludge filterability characterization in cross flow filtration 75

76 MBR Activated sludge filterability characterization in cross flow filtration
MBR Activated sludge filterability characterization in cross flow filtration 77