Embed Size (px)
Citation preview

ON THE EVALUATION OF CODE SMELLS AND
DETECTION TOOLS.


THANIS FERNANDES PAIVA
ON THE EVALUATION OF CODE SMELLS AND
DETECTION TOOLS.
Dissertação apresentada ao Programa dePós-Graduação em Ciência da Computaçãodo Instituto de Ciências Exatas daUniversidade Federal de Minas Gerais comorequisito parcial para a obtenção do grau deMestre em Ciência da Computação.
Orientador: Eduardo Magno Lages Figueiredo
Belo Horizonte
Agosto de 2017


THANIS FERNANDES PAIVA
ON THE EVALUATION OF CODE SMELLS AND
DETECTION TOOLS.
Dissertation presented to the GraduateProgram in Departamento de Ciência daComputação of the Universidade Federal deMinas Gerais — Departamento de Ciênciada Computação in partial fulfillment of therequirements for the degree of Master inDepartamento de Ciência da Computação.
Advisor: Eduardo Magno Lages Figueiredo
Belo Horizonte
August 2017

c© 2017, Thanis Fernandes Paiva.Todos os direitos reservados.
Paiva, Thanis Fernandes
P149o On the evaluation of code smells and detection tools. /Thanis Fernandes Paiva. — Belo Horizonte, 2017
xviii, 93 f. : il. ; 29cm
Dissertação (mestrado) — Universidade Federal deMinas Gerais — Departamento de Ciência da Computação
Orientador: Eduardo Magno Lages Figueiredo
1. Computação – Teses. 2. Code smells. 3. Qualidade –software. 4. Ferramentas – Computação. I. Orientador.II. Título.
CDU 519.6*32 (043)


Acknowledgments
It’s been a long journey, to complete this dissertation. However, regardless of themany challenges and obstacles, this has been a very fulfilling and enriching experience.Therefore, I would like to thank everyone that participated and contributed to thecompletion of this dissertation.
I cannot thank my family enough for the endless support during all this process.I would also like to give special thanks to my sister Hannah for all the encouragementand patience. This dissertation would not have been possible without her.
I would also like to thank my colleagues at LabSoft for the advices and all othervaluable contributions that helped me complete this dissertation. Amanda deserves aspecial mention for her collaboration, for which I will always be thankful.
I have also been very fortunate that my advisor Eduardo Figueiredo has alwaysencouraged me and this project from the start. I would like to thank for all the support,availability, and guidance during this entire process. I am also grateful to the otherprofessors of UFMG for the challenging and enriching ideas.
Lastly, I am thankful for the contributions of everyone that supported andencouraged me and this work.
ix


Abstract
Code smells are code fragments that can hinder the evolution and maintenance ofsoftware systems. Their often informal definitions lead to the implementation ofmultiple detection techniques and tools. Therefore, this dissertation performs oneexploratory study and two experimental evaluations to evaluate four code smelldetection tools, namely inFusion, JDeodorant, JSpIRIT, and PMD, considering thedetection of God Class, God Method, and Feature Envy. In the first study, weinvestigated the evolution of code smells by manually identifying instances in allversions of two software systems, namely MobileMedia and Health Watcher. In thesecond study, we applied the detection tools to all versions of both systems to analyzetheir recall and precision in detecting the code smells previously identified. We alsocompared the agreement between tools with multiple measures of agreement. Withthe third study, we aimed at increasing the confidence of our results to generalizeour findings by replicating the evaluation using five open source projects, namelyANTLR, ArgoUML, JFreeChart, JSPWiki, and JUnit. The main differences regardingthe previous study were that we analyze only one version of each project and weproposed a semi-automated approach to identify instances of code smells. Our mainfindings include that, in general, code smells are introduced with the creation of classesor methods in 74.4% of the cases in MobileMedia and 87.5% in Health Watcher. Wealso found that the tools have different recall and precision values. However, for GodClass and Feature Envy, inFusion has the lowest recall and highest precision, whileJDeodorant has the lowest precision for God Class and God Method in all targetsystems. Considering the agreement, we found high averages over 90% for percentage,AC1, and non-occurrence agreement, confirming that there is high agreement on classesand methods without code smells, regardless of differences in the detection techniques.On the contrary, we found lower values for occurrence agreement between pairs of tools,ranging from 0% to 71.43%, confirming that regardless of similarities in the detectiontechniques, each tool reports very different sets of classes and methods as code smells.
Keywords: code smells, software quality, tools
xi


List of Figures
2.1 Distribution map containing the God Class BaseController from thesecond version of MobileMedia . . . . . . . . . . . . . . . . . . . . . . . . . 9
2.2 Polymetric view containing the God MethodBaseController.handleCommand from the second version of MobileMedia 9
2.3 Class diagram containing the Feature EnvyImageAccessor.updateImageInfo from the second version of MobileMedia 10
3.1 Total number of code smells per system version of MobileMedia . . . . . . 283.2 Total number of code smells per system version of Health Watcher . . . . . 293.3 Evolution of God Class in MobileMedia . . . . . . . . . . . . . . . . . . . . 313.4 Evolution of God Method in MobileMedia . . . . . . . . . . . . . . . . . . 323.5 Evolution of Feature Envy in MobileMedia . . . . . . . . . . . . . . . . . . 333.6 Evolution of God Class in Health Watcher . . . . . . . . . . . . . . . . . . 343.7 Evolution of God Method in Health Watcher . . . . . . . . . . . . . . . . . 34
4.1 Summary of the classification of AC1 for MobileMedia and Health Watcherin Altman’s benchmark scale . . . . . . . . . . . . . . . . . . . . . . . . . . 47
xiii


List of Tables
2.1 Selected code smell detection tools. . . . . . . . . . . . . . . . . . . . . . . 13
2.2 Code smells detected by detection tools. . . . . . . . . . . . . . . . . . . . 14
2.3 Metrics thresholds for God Class detection strategy by tool. . . . . . . . . 16
2.4 Metrics thresholds for God Method detection strategy by tool. . . . . . . . 17
2.5 Metrics thresholds for Feature Envy detection strategy by tool. . . . . . . 19
2.6 Summary of detection techniques implemented by tools. . . . . . . . . . . 21
3.1 Size metrics for MobileMedia (MM) and Health Watcher (HW). . . . . . . 24
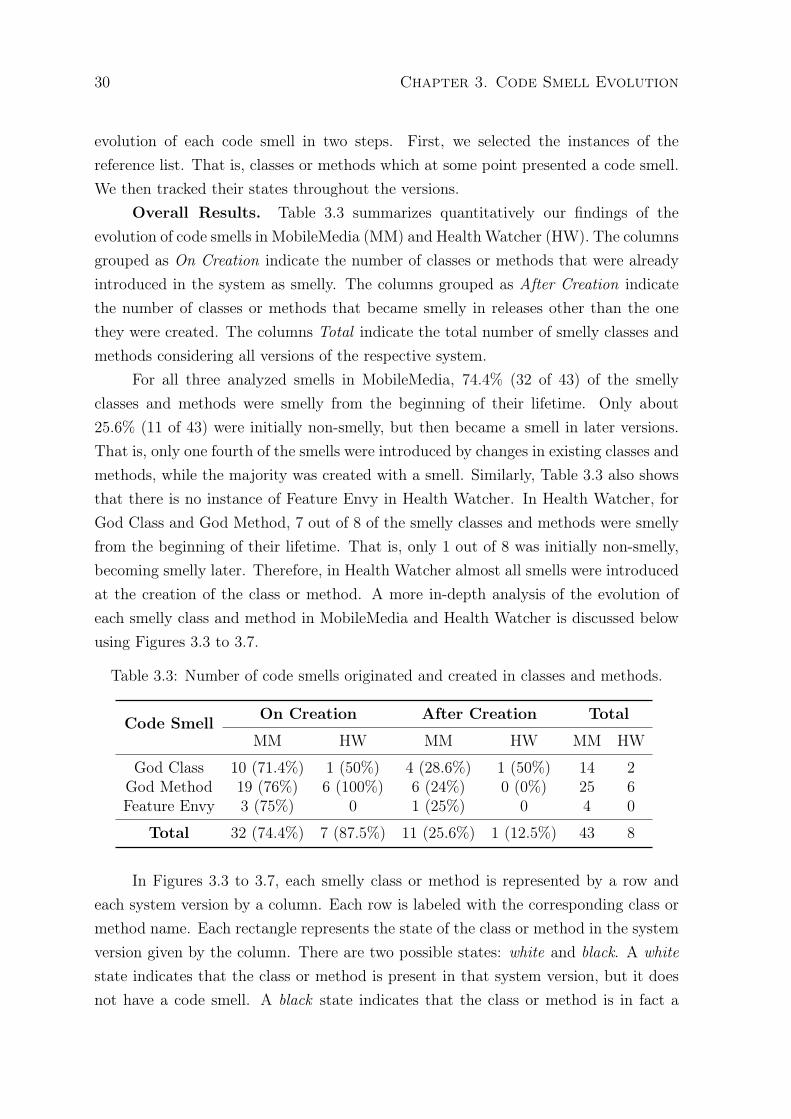
3.2 Code smell reference list of MobileMedia (MM) and Health Watcher (HW). 27
3.3 Number of code smells originated and created in classes and methods. . . . 30
4.1 Total number of code smells detected by each tool. . . . . . . . . . . . . . 39
4.2 Average recall and precision for MobileMedia. . . . . . . . . . . . . . . . . 41
4.3 Average recall and precision for Health Watcher. . . . . . . . . . . . . . . . 42
4.4 Percentage agreement for MobileMedia (MM) and Health Watcher (HW). . 43
4.5 Percentage agreement for God Class between pairs of tools for MobileMedia(MM) and Health Watcher (HW). . . . . . . . . . . . . . . . . . . . . . . . 44
4.6 Percentage agreement for God Method between pairs of tools forMobileMedia (MM) and Health Watcher (HW). . . . . . . . . . . . . . . . 45
4.7 Percentage agreement for Feature Envy between pairs of tools forMobileMedia (MM) and Health Watcher (HW). . . . . . . . . . . . . . . . 45
4.8 AC1 Statistics of the analyzed tools for MobileMedia. . . . . . . . . . . . . 47
4.9 AC1 Statistics of the analyzed tools for Health Watcher. . . . . . . . . . . 47
4.10 Non-occurrence agreement (NOA) for God Class between pairs of tools forMobileMedia (MM) and Health Watcher (HW). . . . . . . . . . . . . . . . 49
4.11 Non-occurrence agreement (NOA) for God Method between pairs of toolsfor MobileMedia (MM) and Health Watcher (HW). . . . . . . . . . . . . . 49
xv

4.12 Non-occurrence agreement (NOA) for Feature Envy between pairs of toolsfor MobileMedia (MM) and Health Watcher (HW). . . . . . . . . . . . . . 49
4.13 Occurrence agreement (OA) for God Class between pairs of tools forMobileMedia (MM) and Health Watcher (HW). . . . . . . . . . . . . . . . 50
4.14 Occurrence agreement (OA) for God Method between pairs of tools forMobileMedia (MM) and Health Watcher (HW). . . . . . . . . . . . . . . . 51
4.15 Occurrence agreement (OA) for Feature Envy between pairs of tools forMobileMedia (MM) and Health Watcher (HW). . . . . . . . . . . . . . . . 51
5.1 Number of projects per domain in Qualitas Corpus 2013. . . . . . . . . . . 565.2 Summary of the selected target systems. . . . . . . . . . . . . . . . . . . . 575.3 Sample of votes for God Classes in ANTLR. . . . . . . . . . . . . . . . . . 595.4 Size of the code smell reference list of all five target systems. . . . . . . . . 605.5 Total number of God Class detected by each tool. . . . . . . . . . . . . . . 615.6 Total number of God Method detected by each tool. . . . . . . . . . . . . 625.7 Total number of Feature Envy detected by each tool. . . . . . . . . . . . . 625.8 Recall and precision of God Class for each target system. . . . . . . . . . . 645.9 Recall and precision of God Method for each target system. . . . . . . . . 645.10 Recall and precision of Feature Envy for each target systems. . . . . . . . . 655.11 Percentage agreement considering inFusion, JDeodorant, JSpIRIT, and PMD. 665.12 Percentage agreement for God Class between pairs of tools. . . . . . . . . . 675.13 Percentage agreement for God Method between pairs of tools. . . . . . . . 675.14 Percentage agreement for Feature Envy between pairs of tools. . . . . . . . 685.15 AC1 statistic considering inFusion, JDeodorant, JSpIRIT, and PMD. . . . 685.16 AC1 statistic for God Class between pairs of tools. . . . . . . . . . . . . . 695.17 AC1 statistic for God Method between pairs of tools. . . . . . . . . . . . . 695.18 AC1 statistic for Feature Envy between pairs of tools. . . . . . . . . . . . . 705.19 Non-occurrence agreement (NOA) for God Class between pairs of tools. . . 715.20 Non-occurrence agreement (NOA) for God Method between pairs of tools. 715.21 Non-occurrence agreement (NOA) for Feature Envy between pairs of tools. 715.22 Occurrence agreement (OA) for God Class between pairs of tools. . . . . . 725.23 Occurrence agreement (OA) for God Method between pairs of tools. . . . . 735.24 Occurrence agreement (OA) for Feature Envy between pairs of tools. . . . 73
6.1 Summary of detection techniques and number of smells detected. . . . . . 806.2 Summary of the average recall and precision. . . . . . . . . . . . . . . . . . 806.3 Summary of the average occurrence agreement between pairs of tools. . . . 80
xvi

Contents
Acknowledgments ix
Abstract xi
List of Figures xiii
List of Tables xv
1 Introduction 11.1 Problem Statement . . . . . . . . . . . . . . . . . . . . . . . . . . . . . 11.2 Goal and Research Questions . . . . . . . . . . . . . . . . . . . . . . . 21.3 Empirical Approach . . . . . . . . . . . . . . . . . . . . . . . . . . . . . 31.4 Results . . . . . . . . . . . . . . . . . . . . . . . . . . . . . . . . . . . . 41.5 Outline . . . . . . . . . . . . . . . . . . . . . . . . . . . . . . . . . . . . 6
2 Background 72.1 Code Smells . . . . . . . . . . . . . . . . . . . . . . . . . . . . . . . . . 72.2 Detection Techniques . . . . . . . . . . . . . . . . . . . . . . . . . . . . 112.3 Detection Tools . . . . . . . . . . . . . . . . . . . . . . . . . . . . . . . 122.4 Detection Techniques Implemented by Tools . . . . . . . . . . . . . . . 152.5 Related Work . . . . . . . . . . . . . . . . . . . . . . . . . . . . . . . . 192.6 Final Remarks . . . . . . . . . . . . . . . . . . . . . . . . . . . . . . . . 20
3 Code Smell Evolution 233.1 Target Systems . . . . . . . . . . . . . . . . . . . . . . . . . . . . . . . 233.2 Study Settings . . . . . . . . . . . . . . . . . . . . . . . . . . . . . . . . 253.3 Analysis of the Number of Code Smells . . . . . . . . . . . . . . . . . . 273.4 Tracking Code Smells . . . . . . . . . . . . . . . . . . . . . . . . . . . . 293.5 Threats to Validity . . . . . . . . . . . . . . . . . . . . . . . . . . . . . 35
xvii

3.6 Final Remarks . . . . . . . . . . . . . . . . . . . . . . . . . . . . . . . . 35
4 Comparative Study of Code Smell Detection Tools 374.1 Study Settings . . . . . . . . . . . . . . . . . . . . . . . . . . . . . . . . 384.2 Summary of Detected Code Smells . . . . . . . . . . . . . . . . . . . . 384.3 Analysis of Recall and Precision . . . . . . . . . . . . . . . . . . . . . . 404.4 Analysis of Percentage Agreement . . . . . . . . . . . . . . . . . . . . . 424.5 Analysis of AC1 Agreement . . . . . . . . . . . . . . . . . . . . . . . . 464.6 Analysis of Non-Occurrence and Occurrence Agreements . . . . . . . . 48
4.6.1 Non-Occurrence Agreement . . . . . . . . . . . . . . . . . . . . 484.6.2 Occurrence Agreement . . . . . . . . . . . . . . . . . . . . . . . 50
4.7 Threats to Validity . . . . . . . . . . . . . . . . . . . . . . . . . . . . . 514.8 Final Remarks . . . . . . . . . . . . . . . . . . . . . . . . . . . . . . . . 53
5 Applying Code Smell Detection Tools in Open Source Projects 555.1 Target Systems . . . . . . . . . . . . . . . . . . . . . . . . . . . . . . . 555.2 Study Settings . . . . . . . . . . . . . . . . . . . . . . . . . . . . . . . . 585.3 Summary of Detected Code Smells . . . . . . . . . . . . . . . . . . . . 615.4 Analysis of Recall and Precision . . . . . . . . . . . . . . . . . . . . . . 635.5 Analysis of Percentage Agreement . . . . . . . . . . . . . . . . . . . . . 655.6 Analysis of AC1 Agreement . . . . . . . . . . . . . . . . . . . . . . . . 685.7 Analysis of Non-Occurrence and Occurrence Agreements . . . . . . . . 70
5.7.1 Non-Occurrence Agreement . . . . . . . . . . . . . . . . . . . . 705.7.2 Occurrence Agreement . . . . . . . . . . . . . . . . . . . . . . . 72
5.8 Threats to Validity . . . . . . . . . . . . . . . . . . . . . . . . . . . . . 745.9 Final Remarks . . . . . . . . . . . . . . . . . . . . . . . . . . . . . . . . 75
6 Final Considerations 776.1 Lessons Learned . . . . . . . . . . . . . . . . . . . . . . . . . . . . . . . 796.2 Future Work . . . . . . . . . . . . . . . . . . . . . . . . . . . . . . . . . 82
References 85
xviii

Chapter 1
Introduction
Software systems are increasingly important to society, making software quality controlessential. Software quality is largely dependent on the structural quality of code; thatis, structural issues can negatively impact the overall quality of software systems.Structural issues can manifest in a system as code smells. Code smells are symptomsof poor design and implementation choices [Fowler, 1999]. The presence of codesmells indicates that there are issues with code quality, such as understandabilityand changeability, which can lead to a variety of maintenance problems, includingthe introduction of faults [Fowler, 1999]. For instance, a God Class is a class thatconcentrates the responsibilities of a system [Riel, 1996]. In other words, more andmore responsibilities were added to a single class until it became too complex andharder to understand. Misunderstandings during changes of this class can increase evenmore code complexity or even introduce faults in the system. Therefore, God Classesand other code smells can negatively impact the development and maintenance processof software systems.
1.1 Problem Statement
In the last decade, code smells have become an established concept for patterns oraspects of software design that may cause problems for further development andmaintenance of software systems [Lanza and Marinescu, 2006]. The presence of codesmells can increase change-proneness [Khomh et al., 2009a; Olbrich et al., 2010] orfault-proneness of classes [Khomh et al., 2012; Li and Shatnawi, 2007; D’Ambroset al., 2010]. Code smells can also decrease software understandability [Abbes et al.,2011], impact development effort [Abbes et al., 2011; Sjøberg et al., 2013], and othermaintainability aspects [Yamashita and Moonen, 2012, 2013b; Banker et al., 1993].
1

2 Chapter 1. Introduction
Considering the negative impact of code smells, their longevity was also investigated[Tufano et al., 2015; Chatzigeorgiou and Manakos, 2010]. Ideally, code smells shouldbe detected and removed from software systems. However, detecting code smells is achallenging task.
Fowler [1999] initially defined code smells by providing high level descriptionsfollowed by lists of refactoring operations, instead of giving instructions on how todetect code smells in source code. Without a formal definition, different interpretationsof code smells have led to different detection techniques. The proposed detectiontechniques include code inspection [Travassos et al., 1999], metrics-based strategies[Lanza and Marinescu, 2006] where code smells are identified by sets of rulescomposed by software metrics and thresholds, static analysis of code [Tsantalisand Chatzigeorgiou, 2011], or even search-based approaches, such as evolutionaryalgorithms [Kessentini et al., 2010]. These techniques are an alternative to manualdetection of code smells, which is a subjective, time-consuming, and error-prone task.
Some of these detection techniques have been implemented in tools available tothe public [Marinescu et al., 2005; Moha et al., 2010; Tsantalis and Chatzigeorgiou,2009a; Murphy-Hill and Black, 2010]. However, evaluating the effectiveness of thesetools to assess the most indicated in a given situation can be difficult. This difficultyis mostly associated with the subjectivity in the definition of code smells, which leadsto different detection techniques for the same code smell, and with variations in theset of metrics and/or thresholds implemented. Due to these factors, tools generatedifferent results that can be hard to interpret and compare. Another difficulty is alsofinding open source systems with validated lists of code smells to serve as a basisfor evaluating the techniques and tools, since the manual identification of code smellsrequires a lot of effort. Therefore, most studies focus on evaluating only one tool ortechnique using a small number of systems and code smells [Mäntylä, 2005; Moha et al.,2010; Murphy-Hill and Black, 2010]. Comparing multiple detection tools can provideinsights into the main similarities and differences between detection tools, assistingdevelopers and researchers in selecting tools that are more adequate to their specificneeds.
1.2 Goal and Research Questions
The main goal of this study is to analyze code smell detection tools with the purpose ofevaluating (a) their ability to detect actual code smells instances, and (b) their level ofagreement, from the point of view of developers and researchers in the context of Java

1.3. Empirical Approach 3
software systems. According to the aforementioned goal, we have derived the followingfour research questions:
RQ1. Does the number of code smells increase over time?
RQ2. How do the code smells evolve with the system evolution?
RQ3. What is the recall and precision of tools in identifying actual instances ofcode smells?
RQ4. What is the level of agreement between different tools?
1.3 Empirical Approach
In order to evaluate different code smell detection tools, we conducted three differentstudies: an exploratory study to investigate the presence and evolution of code smells;an experimental evaluation of tools in the context of systems with multiple versions;and a replication of the experimental evaluation in a different context, with systemsfrom different sizes and domains. Each study is detailed in the following.
The first study was an exploratory study to investigate the evolution of codesmells in software systems by identifying instances of code smells in multiple versionsof two different software systems, namely MobileMedia and Health Watcher. We answertwo research questions, one investigating if the number of code smells increases as thesystem evolves (RQ1), and another that investigates how instances of code smells evolvewith the evolution of the system (RQ2). In order to answer both RQs we manuallyanalyzed the source code of all versions of the target systems to identify instances ofGod Class, God Method, and Feature Envy [Fowler, 1999]. The recovered and validatedinstances were registered in code smell reference lists. These lists were used to trackthe presence of code smells, revealing variations in the number of instances and whenthey were introduced and removed from the systems. The code smell reference listsare also used to evaluate the detection tools in the second study.
In the second study, we made an experimental evaluation of four code smelldetection tools, namely inFusion, JDeodorant, JSpIRIT, and PMD. These tools wereselected for many reasons, such as we are aware of their detection techniques, they areavailable for download, they detect at least two of the code smells analyzed, and theyreport lists of code smells instead of just providing visualizations. With these tools, weanswer two research questions. The first question investigates the recall and precisionof tools in detecting actual instances of code smells (RQ3), while the other measures
4 Chapter 1. Introduction
the level of agreement between detection tools applied to the same system (RQ4). Inorder to answer both RQs, we applied the detection tools to multiple versions of twodifferent target systems (the same of the first study) and analyzed their reports. ForRQ3, we used the code smell reference lists created in the first study to measure andcompare the tools recall and precision. Recall is a measure of coverage, while precisionis a measure of relevance. For RQ4, we measured the agreement between the toolsusing multiple measures of agreement. By measuring the agreement, we can comparehow similar or different are the reports of different detection tools.
The third study aims to increase the confidence of our results and to favorgeneralization of our findings. Therefore, in the third study, we replicate theexperimental evaluation in a different context by applying the detection tools to fivedifferent open source projects, namely ANTLR, ArgoUML, JFreeChart, JSPWiki, andJUnit, to answer the same research questions (RQ3 and RQ4). The main differencesfrom the second to the third study were that (i) we proposed a semi-automatedapproach for creating the code smell reference lists as an alternative to the manuallygenerated lists and (ii) we analyzed only one version of the projects that have differentsizes and domains.
1.4 Results
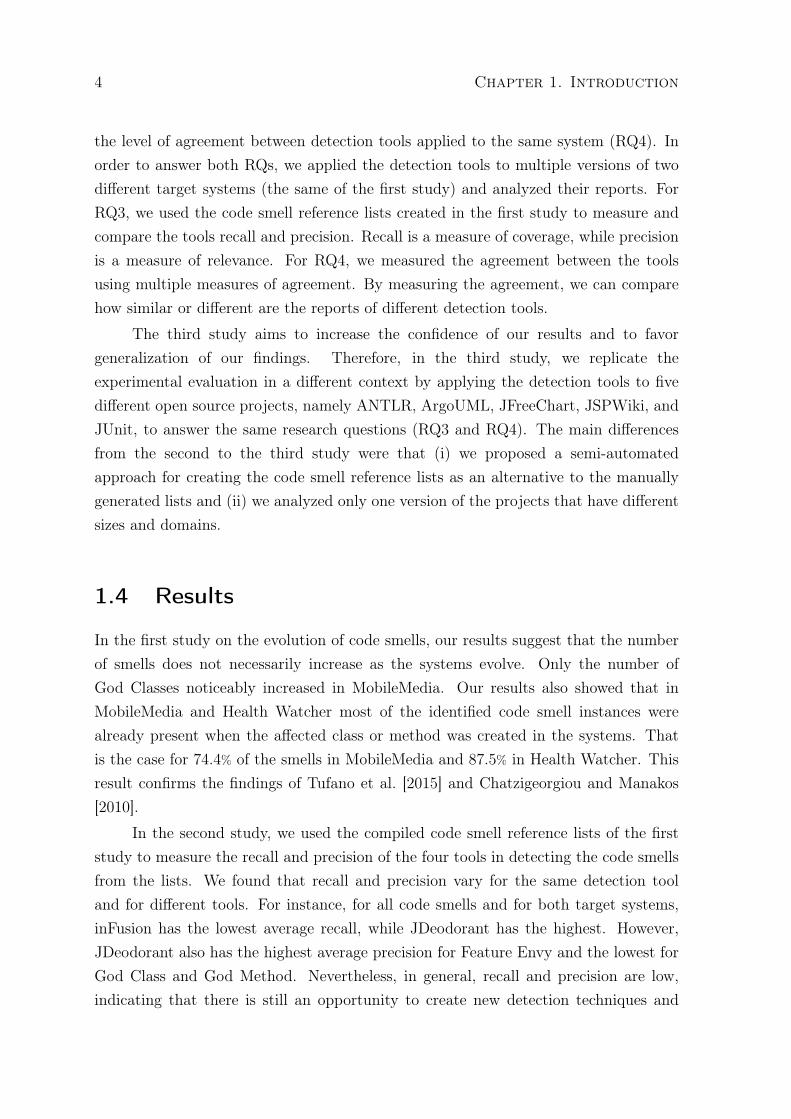
In the first study on the evolution of code smells, our results suggest that the numberof smells does not necessarily increase as the systems evolve. Only the number ofGod Classes noticeably increased in MobileMedia. Our results also showed that inMobileMedia and Health Watcher most of the identified code smell instances werealready present when the affected class or method was created in the systems. Thatis the case for 74.4% of the smells in MobileMedia and 87.5% in Health Watcher. Thisresult confirms the findings of Tufano et al. [2015] and Chatzigeorgiou and Manakos[2010].
In the second study, we used the compiled code smell reference lists of the firststudy to measure the recall and precision of the four tools in detecting the code smellsfrom the lists. We found that recall and precision vary for the same detection tooland for different tools. For instance, for all code smells and for both target systems,inFusion has the lowest average recall, while JDeodorant has the highest. However,JDeodorant also has the highest average precision for Feature Envy and the lowest forGod Class and God Method. Nevertheless, in general, recall and precision are low,indicating that there is still an opportunity to create new detection techniques and

1.4. Results 5
tools, or improving the current ones. Considering the agreement, we found a highagreement between all tools and pairs of tools on non-smelly classes and methods, eventhough different tools do not follow the same detection technique. On the other hand,the agreement on smelly classes and methods presents more variations and is lower,even for tools based on the same detection technique.
In the third study, we evaluated the detection tools using five systems withdifferent sizes and domains. We also found variations in recall and precision for thesame detection tool and for different tools, like in the second study. The main differencewas in the average recall. In the second study, inFusion had the lowest average recalland JDeodorant had the highest average recall. However, in the third study, thehighest average recall were of PMD for God Class, and JSpIRIT for God Method andFeature Envy. While JDeodorant presented lower average recall for all smells and hadthe lowest average recall for God Method. Therefore, in the third study, PMD andJSpIRIT detect the highest number of instances from the code smell reference list, whilein the second study JDeodorant reported the highest number of instances. Regardingthe agreement, the observations made for the second study are valid in the third.
The findings in this dissertation can be used by developers and researchers in thedecision of when to apply detection tools in a system and which tool or tools could beselected. For instance, if a developer or researcher believes that higher coverage (recall)is more important, than she could select a tool with a tendency of presenting highercoverage.
The results presented in this dissertation are part of the following papers:
• Paiva, T., Damasceno, A., Padilha, J., Figueiredo, E. and Sant’Anna, C. (2015).Experimental Evaluation of Code Smell Detection Tools. In Proceedings of the IIIWorkshop on Software Visualization, Evolution and Maintenance (VEM), pages17-24.
• Fernandes, E., Oliveira, J., Vale, G., Paiva, T., and Figueiredo, E. (2016). Areview-based comparative study of bad smell detection tools. In Proceedings ofthe 20th International Conference on Evaluation and Assessment in SoftwareEngineering (EASE), Article 8, pages 1-12.
• Paiva, T., Damasceno, A., Figueiredo, E. and Sant’Anna, C. (2017). On theEvaluation of Code Smells and Detection Tools. Journal of Software EngineeringResearch and Development (JSERD).
6 Chapter 1. Introduction
1.5 Outline
In this chapter, we introduced the problem, the proposed research work, and main goalof this dissertation. The rest of the document is organized as follows:
Chapter 2 details the main concepts necessary for understanding this work:code smells and code smell detection techniques. This chapter also discusses relatedwork and provides additional information regarding the selected detection tools.
Chapter 3 presents the exploratory study that was conducted to investigate thepresence and evolution of code smells in two software systems. This chapter answersthe first and second research questions by investigating if the number of code smellincreases with the evolution of the system and the presence of code smells as thesystem evolves.
Chapter 4 presents an experimental evaluation of code smell detection tools inthe two target systems of Chapter 3. This chapter details the settings of this evaluationand discusses the results achieved to answer the third and fourth research questions.
The research questions are answered by investigating the precision and recallof tools in detecting the code smells found in Chapter 3 and the level of agreementbetween tools for these same systems.
Chapter 5 presents a replication of the experimental evaluation on code smelldetection tools in five open source projects. This chapter replicates the study inChapter 4 in a different context, by analyzing the reports of active open source projectsfrom different sizes and domains.
Chapter 6 concludes this dissertation by presenting the final remarks, asummary of the main findings, and suggestions for future work.

Chapter 2
Background
Code smells are symptoms of poor design and implementation choices [Fowler, 1999],that may cause problems for further development and maintenance tasks of systems[Lanza and Marinescu, 2006; Kruchten et al., 2012; Yamashita and Counsell, 2013].Once code smells are located in a system they can be removed by refactoring thesource code [Fowler, 1999]. However, detecting code smells in large software systemsis a very time and resource-consuming, error-prone activity [Travassos et al., 1999],and manual inspection is slow and inaccurate [Langelier et al., 2005]. Tools can assistdevelopers in the identification of affected entities, facilitating the code smell detectiontask. However, different detection methods generate different results and may be moreor less adequate to the detection needs of a developer for a given software system.
This chapter presents background information related to this dissertation. Section2.1 introduces the concept of code smells. Section 2.2 presents the detection techniquesavailable to detect code smells. Section 2.3 introduces four detection tools. Section 2.4discusses the detection techniques implemented by the tools of Section 2.3. Section 2.5presents related work. Lastly, final remarks are discussed in Section 2.6.
2.1 Code Smells
Code smells, also called bad smells or code anomalies [Fowler, 1999], anti-patterns[Brown et al., 1998] or design flaws [Marinescu, 2004], are code fragments that suggestthe possibility of refactoring, i.e., symptoms of poor design and implementation choices[Fowler, 1999]. Originally, 22 code smells and corresponding refactoring operations weredescribed by Fowler [1999]. Refactoring is the process of changing a software systemin such a way that it does not alter the external behavior of the code yet improves its
7

8 Chapter 2. Background
internal structure [Fowler, 1999; Opdyke, 1992], and its necessity is indicated by thepresence of code smells.
Over the last years, several studies have investigated different aspects of codesmells, including (i) their relevance according to developers [Palomba et al., 2014;Yamashita and Moonen, 2013a], (ii) their lifespan in software systems [Arcoverdeet al., 2011; Chatzigeorgiou and Manakos, 2010; Peters and Zaidman, 2012], (iii) theirside effects in non-functional properties, such as their impact on the maintainability[Sjøberg et al., 2013; Yamashita and Moonen, 2012] and increase of change- andfault-proneness [Khomh et al., 2009a, 2012] or decrease of the comprehensibility ofsoftware [Abbes et al., 2011]. The potentially negative impact of code smells inthe software development prompted the development of several methods and toolsfor detecting and/or refactoring code smells [Boussaa et al., 2013; Moha et al., 2010;Tsantalis et al., 2008; Marinescu et al., 2005; Murphy-Hill and Black, 2010].
In addition to the 22 code smells in Fowler’s catalog [Fowler, 1999], other smellshave been proposed in the literature, such as Functional Decomposition, Spaghetti Code[Brown et al., 1998], and Swiss Army Knife [Moha et al., 2010]. In this dissertation,we focus on three of Fowler’s code smells: God Class, God Method, and Feature Envy.We selected these code smells because (i) they are among the most frequent smellsdetected by code smell detection tools [Fernandes et al., 2016], allowing us to comparethe tools recall, precision, and agreement, (ii) they can also be detected without theassistance of tools, which is necessary to compile the code smell reference list of thefirst study, and (iii) they are the most frequent code smells in the target systems. Thefollowing examples were retrieved from the second version of MobileMedia, a softwareproduct line (SPL) for applications that manipulate photo, music, and video on mobiledevices [Figueiredo et al., 2008].
God Class. This code smell defines a class that centralizes the functionalityof the system. That is, "a class that knows or does too much" [Riel, 1996]. Inother words, a God Class violates the single responsibility principle [DeMarco, 1978]of object-oriented programming that states that a class should have only a singleresponsibility. For instance, Figure 2.1 shows a distribution map of a subset offour classes and five concerns from the second version of MobileMedia [Figueiredoet al., 2008]. In this distribution map notation [Ducasse et al., 2006], each rectanglerepresents one class and each small square represents one method. Colors indicatethe main concern of each method. Ideally, in an object-oriented program, allclasses follow the single responsibility principle [DeMarco, 1978]. That is, eachclass should encapsulate only one concern. This principle is followed by the classesNewLabelScreen, NullAlbumDataReference, and InvalidImageDataException.

2.1. Code Smells 9
Figure 2.1: Distribution map containing the God Class BaseController from thesecond version of MobileMedia
However, BaseController contains more methods and implements multiple concerns:Base, Sorting, Photo Management, and Album Management. In other words,BaseController can be considered a God Class in the second version of MobileMedia.
God Method. This code smell happens when more and more functionality isadded to a method until it becomes out of control and difficult to maintain and extend[Fowler, 1999]. Therefore, God Method tends to centralize functionalities of a class inthe same way that a God Class tends to centralize the functionality of a subsystem,or even an entire system. Figure 2.2 presents a polymetric view to illustrate this codesmell. A polymetric view is a lightweight technique that allows rendering numbers ina simple, yet effective and highly condensed way which is directly interpretable by theviewer [Lanza and Marinescu, 2006]. In this polymetric view, nodes represent entitiessuch as classes or methods. The related metrics and relationships can be representedby the nodes size, color and position, and the edges width and color. In Figure 2.2,the polymetric view represents methods of the class BaseController from the secondversion of MobileMedia. Each node represents a method, the height of the node isthe McCabe’s Ciclomatic Complexity (CYCLO) [McCabe, 1976] and the width is themethod lines of code (MLOC). Clearly, one method stands out when compared tothe others. The method BaseController.handleCommand has a CY CLO = 34 andMLOC = 163, values that are very high when compared to the second highest values ofCY CLO = 7 and MLOC = 23 from the method BaseController.showImageList.Therefore, BaseController.handleCommand can be considered a God Method inthe second version of MobileMedia.
Feature Envy. This code smell indicates a method "more interested in aclass other than the one it actually is in" [Fowler, 1999]. These code fragmentsaccess directly or indirectly several data from other classes. It can indicate thatthe method is bad located and should be transferred to another class [Fowler, 1999].

10 Chapter 2. Background
Figure 2.2: Polymetric view containing the God MethodBaseController.handleCommand from the second version of MobileMedia
For instance, Figure 2.3 presents a class diagram for two classes, ImageAccessor
and ImageData, from the second version of MobileMedia. ImageAccessor hasa method updateImageInfo(ImageData, ImageData) that updates the albumid, the album name and the label of an image file. In order to update thesefields, updateImageInfo(ImageData, ImageData) accesses directly the methodsgetImageLabel(), getParentAlbumName() and getRecordId() from the classImageData. Therefore, the method updateImageInfo(ImageData, ImageData)
located in the class ImageAccessor is more interested in the functionalities of theclass ImageData than of the ImageAcessor class. In other words, the methodImageAccessor.updateImageInfo(ImageData, ImageData) is a Feature Envy inthe second version of MobileMedia.
Figure 2.3: Class diagram containing the Feature EnvyImageAccessor.updateImageInfo from the second version of MobileMedia

2.2. Detection Techniques 11
2.2 Detection Techniques
From the perspective of refactoring, code smells are code fragments that suggest thepossibility of refactoring. According to Fowler [1999], the refactoring process consistsof two distinct steps: (1) detecting where a program should be refactored and (2)identify which refactoring should be applied [Fowler, 1999]. Therefore, detectingcode smells is the first step in the refactoring process. In the literature, manystudies addressed the problem of detecting code smells and refactoring [Moha et al.,2010; Marinescu, 2004; Tsantalis and Chatzigeorgiou, 2009b; Palomba et al., 2013;Boussaa et al., 2013; Khomh et al., 2009b]. The detection techniques can be classifiedmainly into [Tufano et al., 2015; Palomba, 2016; Kessentini et al., 2014]: manualapproaches, metric-based approaches, static code analysis, analysis of software changes,and search-based approaches.
Manual Approaches. The most reliable way to manually detect smellsaccording to Fowler [1999] is by code reviews, where the code is inspected to identifycode fragments with smells. This approach presents many disadvantages, e.g., it istime-consuming, non-repeatable, error-prone, and non-scalable [Mäntylä et al., 2004;Mäntylä and Lassenius, 2006; Marinescu, 2001; Travassos et al., 1999]. Overall, manualapproaches require a great human effort to interpret and analyze the source code and,consequently, they are restricted to small systems. Another issue is that the manualdetection is highly subjective, relying in the experience of the developer and theirknowledge of the system and its domain.
Metric-Based Approaches. Most of the proposed approaches consist inidentifying a code smell by combining software metrics in detection rules. The rulesare composed by: (i) identifying all the symptoms from the definition of the smell,(ii) mapping the symptoms to the corresponding software metrics and their thresholds(e.g., lines of code > k), (iii) combining the symptoms in the final rule. The variationsof these techniques are mostly in the set of selected metrics, their thresholds and howthey are combined for a given code smell. For instance, Marinescu defines a mechanismcalled detection strategy, that combines metrics using the logical operators AND/OR[Marinescu, 2004]. Another approach by Moha et al. [2010] introduced DECOR, amethod for specifying and detecting smells using a Domain-Specific Language (DSL).
Static Code Analysis. The approaches consist in analyzing the source code of asystem in order to suggest where refactorings should be applied. For example, Tsantalisand Chatzigeorgiou [2011] approach suggests possible Extract Method refactoringsusing an extension of block-based slicing techniques [Maruyama, 2001]. Slices are codefragments containing the complete computation of a given variable or the statements

12 Chapter 2. Background
affecting the state of a given object. The idea is to suggest refactorings based on sliceswhose extraction preserves the program behavior and dependencies, while maintainingcohesion and minimizing code duplication. Another approach by Fokaefs et al. [2012],finds Extract Class opportunities using an agglomerative clustering algorithm. Themain idea is that clusters can determine cohesive groups of methods and attributes,i.e., that have a distinctive functionality.
Analysis of Software Changes. For this approach, code smells arecharacterized by how the source code changes over time, instead of source code metricsor other information extracted from a source code snapshot [Palomba et al., 2013].For example, Palomba et al. [2013] propose HIST (Historical Information for SmelldeTection) to detect code smells. This approach extracts the change history of a systemfrom versioning systems and analyzes co-changes between source code artifacts.
Search-Based Approaches. Search-Based Software Engineering usessearch-based approaches to solve optimization problems [Harman, 2007]. Once softwareengineering problems are modeled as optimization problems, search algorithms canbe applied to solve it. Kessentini et al. [2010] formulate code smell detection as anoptimization problem, where genetic algorithms detect smells following the assumptionthat what significantly diverges from good design practices is likely to represent adesign problem. Other studies propose machine-learning based approaches [Fontanaet al., 2016; Ren et al., 2011] that are able to find code smells by reporting classessimilar to the smelly classes from the training data. However, the main challenge forthese approaches is the high level of false positives, since they depend on the qualityof code smell instances in the training set.
2.3 Detection Tools
The detection of code smells is a non-trivial task. The most reliable strategy, i.e., codereviews [Fowler, 1999], requires far too much human effort and it is error-prone andhighly non-scalable. In such context, many software analysis tools were developed toassist developers in detecting code smells. Even though these tools still require a humanto analyze and validate their results, they are a more feasible alternative to manualdetection. In the past years, many tools have been developed for detecting code smells.A recent systematic literature review by Fernandes et al. [2016] reported 84 detectiontools from which 29 are available for download. From that list, four tools were selectedfor the comparative study of this dissertation, namely, inFusion, JDeodorant, PMDand JSpIRIT.

2.3. Detection Tools 13
The tools were selected based on the following reasons. Java is the most commonlanguage in detection tools and, therefore, we adopted the analysis of Java programsas the first criteria. Similarly, we selected tools able to detect at least two of thecode smells God Class, God Method, and Feature Envy. Then, we selected only toolsthat were available for download and free to use, at least in a trial version. Theaforementioned criteria resulted in a set of eight tools from the original 29 reported byFernandes et al. [2016]: Checkstyle, inFusion, iPlasma, JDeodorant, PMD, JSpIRIT,Stench Blossom, and TrueRefactor. However, Checkstyle, iPlasma, TrueRefactor, andStench Blossom have been discarded. Checkstyle was discarded because it was notable to detect any instance of the code smells in the selected target systems. iPlasmawas discarded because it is the open source version of the inFusion tool and, therefore,implements the same detection technique. TrueRefactor was discarded because thedownloaded package did not contain an executable file. Finally, Stench Blossom wasdiscarded for not providing a code smell list, but only a visualization feature, whichmakes it hard to validate their results and to calculate, for instance, recall and precision.
Table 2.1 summarizes the basic information about the selected tools. The columnTool contains the names of the analyzed tools as reported in their correspondingwebsites. The column Version is the version of the tools that were used in thisdissertation. The column Type indicates if the tool is available as a plugin for theEclipse IDE or as a standalone tool. The column Languages contains the programminglanguages that can be analyzed by the tools, with Java being the most common one.The column Refactoring indicates whether the tool provides refactoring operations,which is available only in JDeodorant. The column Export indicates if the tool allowsexporting the results to a file. This feature is present only in inFusion and JDeodorant,that export the results to an HTML file and to an XML file, respectively. Finally, thecolumn Detection Techniques contains a general description of the techniques used byeach tool, as discussed in Section 2.2, with metrics-based techniques being the mostcommon.
Table 2.1: Selected code smell detection tools.
Tool Version Type Languages Refactoring Export Detection Technique
inFusion 1.8.62015 Standalone Java, C, C++ No Yes Software MetricsJDeodorant 5.0.02016 Eclipse Plugin Java Yes Yes Static Code AnalysisJSpIRIT 1.0.02014 Eclipse Plugin Java No No Software MetricsPMD 5.5.4(4.0.112017) Eclipse Plugin Java, C, C++ and others No No Software Metrics
Table 2.2 summarizes the code smells detected by the selected detection tools.God Class and God Method are detected by all tools. Feature Envy is detected only byinFusion, JDeodorant and JSpIRIT. Unlike PMD, these tools were specifically designed

14 Chapter 2. Background
to detect code smells. PMD provides code smell detection as one of its multiplefunctionalities.
Table 2.2: Code smells detected by detection tools.
Code Smell inFusion JDeodorant PMD JSpIRIT
God Class X X X XGod Method X X X XFeature Envy X X - X
inFusion is a commercial standalone tool for Java, C, and C++ that detects 22code smells, including the three smells of our interest: God Class, God Method, andFeature Envy. As a commercial product, inFusion is no longer available for downloadat this moment. However, the open source version of the tool, called iPlasma1, is stillavailable. The detection techniques for all smells were initially based on the detectionstrategies defined by Lanza and Marinescu [2006], and then successively refined usingsource code from multiple open source and commercial systems.
JDeodorant2 [Tsantalis et al., 2008] is an open source Eclipse plugin forJava that detects four code smells: God Class, God Method, Feature Envy, andSwitch Statement [Tsantalis et al., 2008]. The detection techniques are based onthe identification of refactoring opportunities of Extract Class for God Class, ExtractMethod for God Method and Move Method for Feature Envy.
PMD3 is an open source tool for Java and an Eclipse plugin that detects manyproblems in Java code, including two of the code smells of our interest: God Classand God Method. The detection techniques are based on metrics. For God Class, itrelies on the detection strategies defined by Lanza and Marinescu [2006] and for GodMethod, a single metric is used: LOC (number of lines of code).
JSpIRIT4 is an Eclipse plugin for Java that identifies and prioritizes ten codesmells, including the three smells of our interest: God Class, God Method, and FeatureEnvy [Vidal et al., 2015]. The detection techniques consist in the implementation ofdetection strategies inspired by the work from Lanza and Marinescu [2006].
1 Available at http://loose.upt.ro/iplasma/2 Available at https://github.com/tsantalis/JDeodorant3 Available at https://pmd.github.io/4 Available at https://sites.google.com/site/santiagoavidal/projects/jspirit

2.4. Detection Techniques Implemented by Tools 15
2.4 Detection Techniques Implemented by Tools
This section discusses the detection techniques implemented in the selected codesmell detection tools, namely inFusion, JDeodorant, PMD, and JSpIRIT. JDeodorantadopts a static code analysis approach to detect code smells by identifying refactoringopportunities. inFusion, PMD and JSpIRIT adopt metric-based approaches to detectcode smells using Marinescu’s detection strategies [Marinescu, 2004] or other softwaremetrics. In this section, we detail the detection techniques implemented by each toolas reported in the documentation or as identified in the tool’s source code.
God Class. The detection strategy proposed by Marinescu [2004], is based onthree symptoms: (i) the class uses directly more than a few attributes of other classes,heavily accessing data of other simpler classes directly or through accessor methods,(ii) the functional complexity of the class is very high, since the individual complexitiesassociated with each of the many implemented functionalities are added up and, (iii)the cohesion is low, since the class implements several functionalities that may not berelated, their methods access disjoint sets of attributes.
Based on the aforementioned symptoms, Marinescu defined a detection strategyindicated in Equation 2.1 using three software metrics: Access to Foreign Data,Weighted Method per Class, and Tight Class Cohesion. Access to Foreign Data(ATFD) [Marinescu, 2001] measures the number of attributes from other classes thatare accessed directly or through accessor methods, therefore, high values increasethe possibility of a God Class. Weighted Method per Class (WMC) [Chidamberand Kemerer, 1994] measures the complexity of the class as the sum of the weightsassociated with each method. The weights are the complexity of the method, indicatedin this case by McCabe’s Cyclomatic Complexity (CYCLO) [McCabe, 1976]. Classwith high values are more complex. Finally, Tight Class Cohesion (TCC) [Bieman andKang, 1995] defines the relative number of pairs of methods that access at least oneattribute in common from the measured class. Low values indicate that the classesmethods have low cohesion, i.e., they access less attributes in common.
(ATFD > FEW ) ∧ (WMC ≥ V ERY HIGH) ∧ (TCC < 1/3) (2.1)
inFusion, JSpIRIT, and PMD adopt detection strategies inspired by Equation2.1. Table 2.3 contains in column Metric the metrics used in the strategy, while theother columns indicate the corresponding thresholds for each tool. The thresholds forinFusion are the values reported by Marinescu [Marinescu, 2002; Lanza and Marinescu,2006]. Contacting the developers of inFusion, we verified that, in fact, the thresholds

16 Chapter 2. Background
used in the tool are defined by the aforementioned values and then refined using sourcecode from multiple open source and commercial systems. Therefore, the reportedvalues for inFusion in Table 2.3 are only an approximation of the actual implementedthresholds.
For ATFD, inFusion indicates a range of values [2, 5], while PMD uses theminimum ATFD = 5 and JSpIRIT the minimum ATFD = 2. inFusion and PMD useWMC = 47, and JSpIRIT uses a lower value of WMC = 43.875. Lastly, the threetools use TCC = 1/3. However, there might be a difference in the results due to thenumber of decimal places used by each tool, inFusion has TCC = 0.33, JSpIRIT usesone more decimal place with TCC = 0.333 and PMD uses the result provided by thedivision, so has more decimal places than the previous tools.
Table 2.3: Metrics thresholds for God Class detection strategy by tool.
Metric inFusion PMD JSpIRIT
Access to Foreign Data (ATFD) 2-5 5 2Weighted Method per Class (WMC) 47 47 43.875Tight Class Cohesion (TCC) 0.33 1/3 0.333
The other detection technique is used only by JDeodorant and consists inidentifying classes in which the refactoring operation Extract Class can be performed.This approach [Fokaefs et al., 2012] finds the refactoring opportunities using anagglomerative clustering algorithm that can form cohesive groups of methods andattributes that are similar, i.e, have the same or similar functionality.
God Method. The detection strategy proposed by Marinescu [2004] is basedon four symptoms: (i) the method is excessively large and, therefore, it is harderto understand and consequently, to maintain, (ii) the method has many conditionalbranches, a sign of non-object design in which the polymorphism is ignored [Lanza andMarinescu, 2006] (iii) the method has deep nesting level, which is a consequence of theimplementation of multiple functionalities in the same method and, (iv) the method hasmany variables, i.e., more variables that a human can store in the short-term memory,increasing the risk of introducing errors in the system [Lanza and Marinescu, 2006].
Based on the aforementioned symptoms, Marinescu defined a detection strategyindicated in Equation 2.2 using four software metrics: Lines of Code, McCabe’sCyclomatic Complexity, Maximum Nesting Level, and Number of Accessed Variables.Lines of Code (LOC) [Fenton and Pfleeger, 1996] measures the total number of linesof code from the method, excluding empty lines and comments. A high LOC canhinder the comprehension of a method. McCabe’s Cyclomatic Complexity (CYCLO)

2.4. Detection Techniques Implemented by Tools 17
[McCabe, 1976] measures a methods complexity by determining the number of linearlyindependent paths in the control flow. The higher the complexity of a method, thehigher the possibility of a God Method. Maximum Nesting Level (MAXNESTING)[Lanza and Marinescu, 2006] measures the maximum depth of control structures in amethod. Higher values indicate that a method handles many responsibilities. Numberof Accessed Variables (NOAV) computes the total number of variables accessed bythe method, including local and global variables, parameters and attributes. A highernumber also indicates an excess of functionalities in the same method.
(LOC > HIGH) ∧ (CY CLO ≥ HIGH) ∧ (MAXNESTING ≥ SEV ERAL) ∧ (NOAV > MANY ) (2.2)
inFusion and JSpIRIT adopt detection strategies inspired by Equation 2.2. Table2.4 contains in column Metric the metrics used in the strategy, while the other columnsindicate the corresponding thresholds for each tool. The values reported for inFusion,as discussed previously, are an approximation of the actual implemented thresholds.
The metric LOC is the only one adopted by the three tools (with differentthresholds) and the only one used by PMD. inFusion has a LOC = 130, a closervalue to PMD, with LOC = 100. JSpIRIT has the lowest threshold, with LOC =
58.5. CYCLO is used only by inFusion, with CY CLO = 4. inFusion defines forMAXNESTING a range of values, [2, 5]. The threshold of JSpIRIT is inside thisrange, with MAXNESTING = 3. JSpIRIT is the only one that adopts WMC, withWMC = 4. Finally, inFusion and JSpIRIT have similar thresholds for NOAV. inFusiondefines a range of [7, 8] and JSpIRIT has NOAV = 7.
Table 2.4: Metrics thresholds for God Method detection strategy by tool.
Metric inFusion PMD JSpIRIT
Lines of Code (LOC) 130 100 58.5McCabe’s Cyclomatic Complexity (CY CLO) 4 - -Maximum Nesting Level (MAXNESTING) 2-5 - 3Weighted Method per Class (WMC) - - 4Number of Accessed Variables (NOAV ) 7-8 - 7
The other detection technique is used only by JDeodorant and consists inidentifying methods in which the refactoring operation Extract Method can beperformed. Tsantalis and Chatzigeorgiou [2011] approach, suggests refactorings usingan extension of block-based slicing techniques [Maruyama, 2001]. The main idea is todetermine slices, or code fragments, that contain the complete computation of a given

18 Chapter 2. Background
variable (complete computation slice) or the statements affecting the state of a givenobject (object state slice) [Tsantalis and Chatzigeorgiou, 2011], which can be expandedinto new methods. The quality of the slices is defined by their ability to preserveprogram behavior and dependencies, while maintaining cohesion of the decomposedand the new methods and minimizing code duplication.
Feature Envy. The detection strategy proposed by Marinescu [2004] is basedon three symptoms: (i) the method uses directly more than a few attributes of otherclasses, i.e., the method accesses data and methods of other classes more frequentlythan expected, (ii) the method uses far more attributes from other classes than its own,this is an indicator that the method is poorly located, (iii) the method uses "foreign"attributes that belong to very few other classes, i.e., the method depends directly ofdata or methods from one or two other classes.
Based on the aforementioned symptoms, Marinescu defined a detection strategyindicated in Equation 2.3 using three software metrics: Access to Foreign Data, Localityof Attribute Accesses and Foreign Data Providers. Access to Foreign Data (ATFD)[Lanza and Marinescu, 2006] measures the number of non-local attributes outside theclass accessed by the method. Higher values indicate that the method is interestedin other classes. Locality of Attribute Accesses (LAA) [Lanza and Marinescu, 2006]computes the number of attributes accessed that belong to the same class as themethod. Since the method accesses many attributes outside the class where it wasdefined, for Feature Envy, the values are lower. Foreign Data Providers (FDP) [Lanzaand Marinescu, 2006] measures the total number of classes from which the methodaccesses data or methods. Lower values indicate a higher frequency of access to dataand methods outside the class, increasing the possibility of Feature Envy.
(ATFD > FEW ) ∧ (FDP ≤ FEW ) ∧ (LAA < 1/3) (2.3)
inFusion and JSpIRIT adopt detection strategies inspired by Equation 2.3. Table2.5 contains in column Metric the metrics used in the strategy, while the other columnsindicate the corresponding thresholds for each tool. The values reported for inFusion,as discussed previously, are an approximation of the implemented thresholds.
All the metrics from the detection strategy are adopted by both inFusion andJSpIRIT. For ATFD, inFusion has the range of values [2, 5], while JSpIRIT has a lowervalue of ATFD = 2. For FDP, inFusion has the range of values [1, 2], while JSpIRIThas the value FDP = 2. For LAA, both tools have the same value. However, JSpIRIThas one additional decimal, with LAA = 0.333, while inFusion has LAA = 0.33.

2.5. Related Work 19
Table 2.5: Metrics thresholds for Feature Envy detection strategy by tool.
Metric inFusion JSpIRIT
Access to Foreign Data (ATFD) 2-5 2Foreign Data Providers (FDP ) 1-2 2Locality of Attribute Accesses (LAA) 0.33 0.333
The other detection technique is used only by JDeodorant and consists inidentifying methods in which the refactoring operationMove Method can be performed.The identification of Feature Envy bad smells is based on the notion of distancebetween methods and system classes [Fokaefs et al., 2007]. The distance measuresthe dissimilarity between the set of entities accessed by a method m and the set thatbelongs to a class C. For each method, the distances to its own class an other systemclasses are measured. Move Method opportunities are identified if the distance of amethod from a system class is less than the distance of this method from the class thatit belongs to [Fokaefs et al., 2007]. These opportunities are ranked based on the EntityPlacement metric [Tsantalis and Chatzigeorgiou, 2009b], that measures the impact ofmoving the method to the given class, considering that cohesion should be maximizedand coupling minimized.
2.5 Related Work
In the literature, there are many papers proposing new code smell detection tools[Marinescu et al., 2005; Moha et al., 2010; Murphy-Hill and Black, 2010; Zazworka andAckermann, 2010; Wettel and Marinescu, 2005]. A list of available detection tools wasreported in a systematic literature review by Fernandes et al. [2016]. In general, thesetools are presented and evaluated in an isolated way and considering only a few smells.To our knowledge, Fontana et al. [2012] were the first to present a wider evaluationand discussion of several detection tools and code smells simultaneously. They usedsix versions of a system to evaluate four tools, Checkstyle, inFusion, JDeodorant, andPMD. We also evaluate the tools inFusion, JDeodorant, and PMD, calculating theagreement among tools, similarly to Fontana et al. [2012]. However, we used the AC1
statistic, a more robust measure than the Kappa Coefficient. Unlike Fontana et al.[2012] we also analyzed precision and recall of each tool.
Chatzigeorgiou and Manakos [2010] and Tufano et al. [2015] also analyzedmultiple versions of systems to investigate the evolution of code smells. Chatzigeorgiouand Manakos [2010] investigated if code smells are removed naturally or by human

20 Chapter 2. Background
intervention as the system evolves and if they are introduced with the creation ofentities. Tufano et al. [2015] focused in identifying when and why smells are introducedin the system in a large empirical study of 200 open source projects. In our work, wealso analyze the evolution of code smells, but at a higher level. Furthermore, we donot focus on maintenance activities and refactoring, like Chatzigeorgiou and Manakos[2010], or in the reasons why the smells were introduced, like Tufano et al. [2015].
Some studies focus on investigating the impact of code smells on softwaremaintenance. Sjøberg et al. [2013] investigated the relationship between code smellsand maintenance effort in an experiment with six hired developers and found that themaintenance effort did not increased significantly in the presence of smells. Yamashitaand Moonen [2012] investigated how the definitions of code smells reflected aspectsof maintainability considered important by programmers in an empirical study withdevelopers. Another related study [Yamashita and Moonen, 2013b] investigated howthe interactions between code smells affect maintenance.
Other studies proposed different approaches to detect code smells in software.Oizumi et al. [2016] proposed that code smells are related, appearing together in thesource code to compose different design problems. In this approach, code smells aredetected as agglomerations, unlike our work, where we focus on strategies that identifycode smells individually. Another study by Fontana et al. [2016] applied 16 differentmachine-learning algorithms in 74 software systems to detect four code smells in anattempt to avoid some common problems of code smell detectors.
2.6 Final Remarks
In this chapter, we introduced the concept of code smells and how they can be detected.Code smells are symptoms of poor design and implementation choices [Fowler, 1999]that can impact software maintenance. We presented a detailed description of thestudied code smells, God Class, God Method and Feature Envy. In addition, we gavean overview of the available detection techniques. Finally, we introduced four detectiontools (inFusion, JDeodorant, PMD, and JSpIRIT) and discussed their implementationof metrics-based approaches and static code analysis to detect code smells.
Table 2.6 summarizes the detection techniques implemented by the toolsevaluated in this dissertation. Tools follow Marinescu’s detection strategy [Lanza andMarinescu, 2006], identification of refactoring operations, or the metric LOC to detectcode smells. Although the same technique can be implemented, each tool relies on its

2.6. Final Remarks 21
own variation by using different sets of metrics or different thresholds. Further detailsregarding the detection techniques can be found in Section 2.4.
In Table 2.6, Eq. 2.1, Eq. 2.2, and Eq. 2.3 indicate that the tool is based onMarinescu’s detection strategy for God Class, God Method, and Feature Envy [Lanzaand Marinescu, 2006], respectively. The other detection technique is Refactoring,indicating the search for refactoring opportunities to detect God Class, God Method,and Feature Envy. The metric LOC indicates lines of code and is used by PMD forGod Method detection. Finally, "n/a" indicates that the smell is not detected.
Table 2.6: Summary of detection techniques implemented by tools.
Tool God Class God Method Feature Envy
inFusion Eq. 2.1 Eq. 2.2 Eq. 2.3JDeodorant Refactoring Refactoring RefactoringJSpIRIT Eq. 2.1 Eq. 2.2 Eq. 2.3PMD Eq. 2.1 LOC n/a
In the next chapter, we present our study on the evolution of code smells. Weintroduce the target systems, namely MobileMedia and Health Watcher, detail theprotocol for the manual identification of code smells and discuss their evolution.


Chapter 3
Code Smell Evolution
Software systems are continuously changing, growing and increasing in complexity[Lehman, 1984; Lehman et al., 1997]. In other words, during the lifetime of a softwaresystem, changes must be made in order to keep the software useful. In this context,the presence of code smells can degrade quality aspects of the software system, suchas maintainability and comprehensibility, hindering the software development processby making the code difficult to understand, and, consequently, to maintain [Fowler,1999; Lanza and Marinescu, 2006]. However, since software is constantly changing,code smells can be introduced or removed at any time during the lifetime of a system.
In this chapter, we investigate the evolution of code smells in two target systems,namely MobileMedia and Health Watcher. Section 3.1 introduces the target systemsand a summary of their size metrics. Section 3.2 presents the research questions andintroduces the concept of code smell reference list. Section 3.3 presents an analysis ofthe variations in the number of code smells in both target systems. Section 3.4 presentsvisual representations of the evolution of code smells. Section 3.5 discusses the mainthreats to the validity of this study. Lastly, Section 3.6 presents this chapters finalremarks.
3.1 Target Systems
We selected two Java systems for this study, namely MobileMedia and Health Watcher,with nine and ten object-oriented versions, respectively. They were selected as targetsystems mainly because the code smell experts responsible for manually analyzing thecode to identify code smells were already familiar with these systems. The manualidentification of code smells is a difficult task. Therefore, intimate knowledge of thesystem and its domain facilitates the comprehension of the source code. This allowed
23

24 Chapter 3. Code Smell Evolution
the experts to focus on identifying code smell instances instead of trying to understandthe system, its dependencies, and other domain-related specificities. We also had otherreasons for choosing the two systems: (i) we have access to their source code, allowingus to manually retrieve code smells, (ii) their code is readable, facilitating for instance,the task of identifying the functionalities implemented by classes and methods, and (iii)these systems were previously used in other maintainability-related studies [Figueiredoet al., 2008; Macia et al., 2012; Soares et al., 2006; Kulesza et al., 2006; Greenwoodet al., 2007]. Further details regarding the purpose and size of each system are discussedin the following.
MobileMedia (MM). This system is a software product line (SPL) forapplications that manipulate photo, music, and video on mobile devices [Figueiredoet al., 2008]. Our study involved nine object-oriented versions (1 to 9) of MobileMedia,ranging from 1 to over 3 KLOC. Table 3.1 shows for each version of MobileMediathe number of classes, methods, and lines of code. For instance, in the first version ofMobileMedia there are 24 classes, 124 methods and a total of 1159 lines of code. We use"n/a" in Table 3.1 to indicate that the 10th version of MobileMedia is not available.We can observe that there was an increase of 2057 lines of code from versions 1 toversion 9, with the addition of 31 classes and 166 methods.
Table 3.1: Size metrics for MobileMedia (MM) and Health Watcher (HW).
Version Number of Classes Number of Methods Lines of Code
MM HW MM HW MM HW
1 24 77 124 401 1159 59962 25 80 143 424 1316 63693 25 80 143 424 1364 63694 30 92 161 566 1559 70465 37 93 202 581 2056 72316 46 97 238 406 2511 72937 50 99 269 606 3015 73168 50 103 273 611 3167 73559 55 115 290 659 3216 880010 n/a 118 n/a 671 n/a 8702
Health Watcher (HW). This application is a typical Web-based informationsystem that allows citizens to register complaints regarding health issues [Soares et al.,2006]. It is a real and non-trivial system that uses technologies common in day-to-daysoftware development, such as GUI, persistence, concurrency, RMI, Servlets, and JDBC[Greenwood et al., 2007]. Our study involved ten object-oriented versions (1 to 10) ofHealth Watcher, ranging from 5 KLOC to almost 9 KLOC. Table 3.1 shows for each

3.2. Study Settings 25
version of Health Watcher the number of classes, methods, and lines of code. We canobserve that there was an increase of 2706 lines of code from version 1 to version 10,with the addition of 41 classes and 270 methods.
3.2 Study Settings
The purpose of this study is to explore the presence of code smells in the target systems,namely MobileMedia and Health Watcher. We not only identify code smells andcalculate the number of times that a code smell was found in the source code, butalso track their occurrences as the systems evolved. In order to accomplish these tasks,we manually analyzed the source code of the target systems in search of instances ofGod Class, God Method, and Feature Envy. All nine versions of MobileMedia and tenversions of Health Watcher were analyzed to answer the following research questions:
• RQ1. Does the number of code smells increase over time?
We aim to investigate if there is a variation on the amount of code smells found indifferent versions of the same software system. In other words, we want to investigateif extending and adding classes and methods to the systems lead to an increase in thenumber of code smells.
• RQ2. How do the code smells evolve with the system evolution?
A class or method may become a code smell in any given moment duringthe software lifetime [Tufano et al., 2015; Ribeiro et al., 2016]. This code smellmanifestation can be possible because between systems versions, changes can be madeto classes and methods that add code smells to them. For instance, a class without acode smell in the first version of the system may grow too much due to the addition ofmultiple functionalities, becoming a God Class in the second version. There is also apossibility that a class or a method is already created with a code smell. We identifythe versions where any given class or method presents a code smell to investigate howthe code smells evolved with the evolution of the systems.
In order to answer both RQs, we compiled a code smell reference list containingthe names of smelly classes and methods from MobileMedia and Health Watcher. Theselists are used to quantify variations in the number of code smells and to track theirpresence throughout the evolution of the target systems. The steps to compile the codesmell reference lists are detailed in the following.

26 Chapter 3. Code Smell Evolution
Code Smell Reference Lists. The code smell reference list is a documentcontaining the fully qualified names of classes and methods affected by at least one ofthe code smells we investigate: God Class, God Method, or Feature Envy. We selectedthese code smells because (i) they can be detected manually without the assistanceof tools, and (ii) they are the most frequent code smells in MobileMedia and HealthWatcher, allowing us to identify and track their instances in both target systems.Individual lists were created for each system. One contains code smells from the nineversions of MobileMedia (MM) and another contains code smells from the ten versionsof Health Watcher (HW). The code smell reference lists were created in three phases:(i) individual identification of code smells, (ii) resolution of divergences, and (iii) expertvalidation, described below.
In the first phase, two researchers independently analyzed the source code ofeach version of the target systems to find code smells. This analysis consisted ofmanually inspecting the source code to classify each class and method into: non-smelly,God Class, God Method, or Feature Envy. The classification of classes and methodswas solely based in Fowler’s description of code smells [Fowler, 1999]. However, eachresearcher was instructed to base their classifications on their own interpretation ofthe descriptions. In the second phase, the two experts discussed every potential codesmell identified to resolve divergences. The entities classified by both experts as a codesmell were registered in the final reference list for each system. In the third phase,the entities for which the experts still disagreed were analyzed by a more experiencedcode smell expert that did not participate in the previous two phases. The code smellsapproved by this expert were registered in the final reference list for each system, alongwith the entities classified as code smells in the first and second phases.
Table 3.2 contains the number of the system version in the column Version. Thecolumns God Class, God Method, and Feature Envy show the total number of classesand methods identified in each category for MobileMedia (MM) and Health Watcher(HW). For instance, the number of God Class in the first version of MobileMedia is 3.On the other hand, Health Watcher has only one God Class in its first version. We use"n/a" in Table 3.2 to indicate that the 10th version of MobileMedia is not available.The total of code smells varies more between each system version for MobileMedia thanfor Health Watcher. The latter has, overall, a more constant number of smells. Thefully qualified names of the smelly classes and methods are available at our researchgroup website1.
1 http://labsoft.dcc.ufmg.br/doku.php?id=people:students:thanis_paiva

3.3. Analysis of the Number of Code Smells 27
Table 3.2: Code smell reference list of MobileMedia (MM) and Health Watcher (HW).
Version God Class God Method Feature Envy Total
MM HW MM HW MM HW MM HW
1 3 1 9 6 2 0 14 72 3 1 7 6 2 0 12 73 3 1 6 6 2 0 11 74 4 1 8 6 2 0 14 75 5 1 8 6 2 0 15 76 6 1 9 6 2 0 17 77 7 1 7 6 2 0 16 78 9 1 7 6 2 0 18 79 7 2 6 6 3 0 16 810 n/a 2 n/a 6 n/a 0 n/a 8
Total 47 12 67 60 19 0 133 72
3.3 Analysis of the Number of Code Smells
This section aims to answer the first research question (RQ1) by quantifying the codesmells present in each version of the target systems, namely MobileMedia and HealthWatcher. The goal is to investigate if the number of code smells increase over time. Inorder to answer RQ1, we analyzed the total number of code smell instances in the codesmell reference lists of MobileMedia and Health Watcher. Figures 3.1 and 3.2 presentthe number of code smell instances in the reference list per release of MobileMedia andHealth Watcher, respectively. In the light of these figures, we present further detailsreferring to each target system.
MobileMedia. According to Figure 3.1, only the number of God Class increaseswith the system evolution. This result was expected, since the evolution of the systemincludes new functionalities and God Classes tends to centralize them. In version1, three classes, namely BaseController, ImageAccessor, and ImageUtil, werecreated smelly and remain God Classes in all versions. In addition, from versions 4to 7, one God Class is introduced per version and two are added in version 8. Theseadded God Classes are either new classes already created with the smell, or classes thatwere created in previous versions but only became smelly in subsequent versions. Forinstance, the PhotoController class was created in version 2 without any smell, butit became God Class in version 4 due to the addition of several new functionalities, suchas displaying an image on screen and providing the image information. On the otherhand, also in version 4, the new AlbumController class has already been created asGod Class. Throughout the versions, some God Classes are eliminated by refactoring

28 Chapter 3. Code Smell Evolution
or by the removal of the class itself. However, there are more smelly classes createdthan removed, leading to an increase in God Classes as the system evolves.
For God Method, the number of instances varies across versions, with intervalsin which the total of smells increases or decreases. The first version contains themaximum number of God Methods, 9, when compared to any other version of thesystem, since there were only a few methods that concentrated the functionalities ofthe system. However, as the system evolved, some of those methods were refactored,contributing to the decrease of God Methods, while others were either created asGod Methods or became one with the addition of new functionality. For instance,the method BaseController.handleCommand was a God Method in versions 1 to3. However, in version 4, the method was broken into other non-smelly methods,contributing to the decrease of smells. On the other hand, the initially non-smellymethod PhotoListController.handleCommand in version 2 to 3 becomes smelly inversion 4 due to the addition of functionalities, such as editing a photo label and sortingphotos. Therefore, it contributed to the increase in the number of God Methods in thisversion. Throughout the versions, the methods are frequently modified. The changesinclude: breaking a single method into multiple methods, adding functionalities,removing functionalities, and merging methods. All these changes lead to the variationsin the number of God Methods in the system, either increasing or decreasing the numberof smells without a fixed pattern.
Figure 3.1: Total number of code smells per system version of MobileMedia
Finally, for Feature Envy, the number of instances remained constant fromversion 1 up to 8. Only the final version has one additional smell instance. TheImageAccessor.updateImageInfo, MediaController.showImagemethods were
3.4. Tracking Code Smells 29
already created with the smell, and only MediaAccessor.updateMediaInfo becamesmelly after creation. That is, this method became Feature Envy in version 9. Allthese methods manipulate images and access directly data and methods from one ormore classes that also manipulate images, such as the ImageData class. The similarrole of image manipulation might have made it difficult for the developers to identifythe correct class where the methods should have been placed and, consequently, theyintroduced Feature Envy instances in the system.
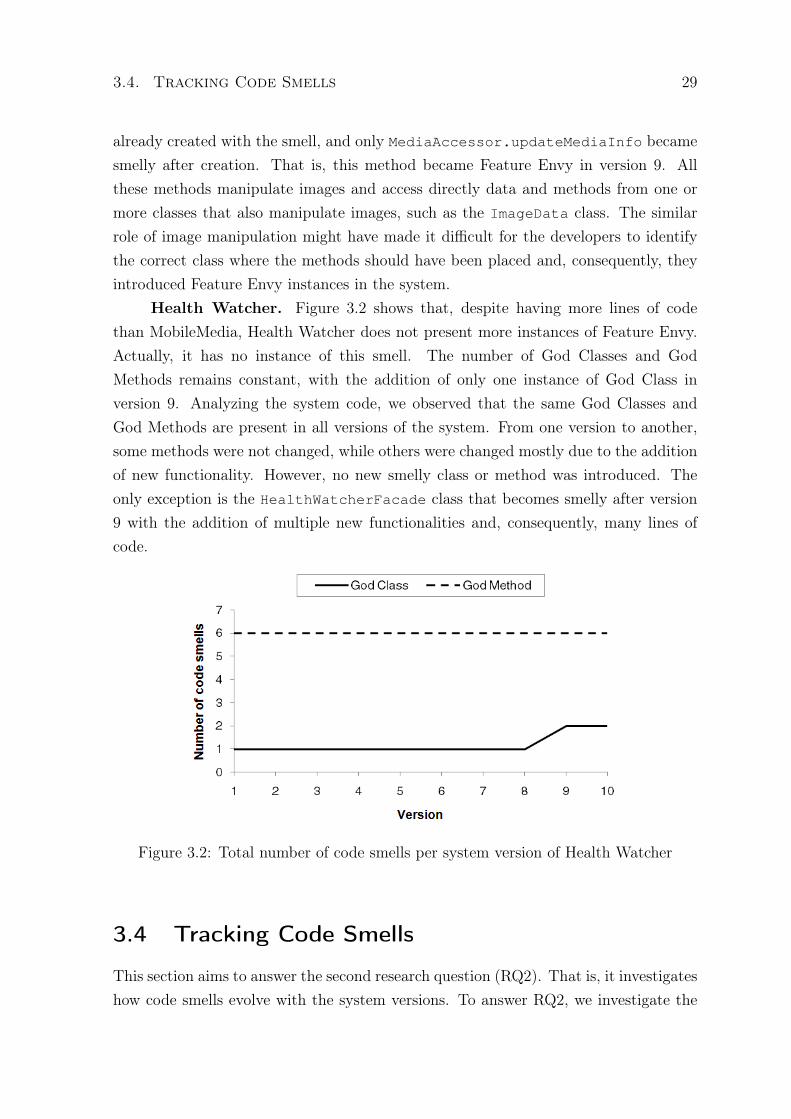
Health Watcher. Figure 3.2 shows that, despite having more lines of codethan MobileMedia, Health Watcher does not present more instances of Feature Envy.Actually, it has no instance of this smell. The number of God Classes and GodMethods remains constant, with the addition of only one instance of God Class inversion 9. Analyzing the system code, we observed that the same God Classes andGod Methods are present in all versions of the system. From one version to another,some methods were not changed, while others were changed mostly due to the additionof new functionality. However, no new smelly class or method was introduced. Theonly exception is the HealthWatcherFacade class that becomes smelly after version9 with the addition of multiple new functionalities and, consequently, many lines ofcode.
Figure 3.2: Total number of code smells per system version of Health Watcher
3.4 Tracking Code Smells
This section aims to answer the second research question (RQ2). That is, it investigateshow code smells evolve with the system versions. To answer RQ2, we investigate the
30 Chapter 3. Code Smell Evolution
evolution of each code smell in two steps. First, we selected the instances of thereference list. That is, classes or methods which at some point presented a code smell.We then tracked their states throughout the versions.
Overall Results. Table 3.3 summarizes quantitatively our findings of theevolution of code smells in MobileMedia (MM) and Health Watcher (HW). The columnsgrouped as On Creation indicate the number of classes or methods that were alreadyintroduced in the system as smelly. The columns grouped as After Creation indicatethe number of classes or methods that became smelly in releases other than the onethey were created. The columns Total indicate the total number of smelly classes andmethods considering all versions of the respective system.
For all three analyzed smells in MobileMedia, 74.4% (32 of 43) of the smellyclasses and methods were smelly from the beginning of their lifetime. Only about25.6% (11 of 43) were initially non-smelly, but then became a smell in later versions.That is, only one fourth of the smells were introduced by changes in existing classes andmethods, while the majority was created with a smell. Similarly, Table 3.3 also showsthat there is no instance of Feature Envy in Health Watcher. In Health Watcher, forGod Class and God Method, 7 out of 8 of the smelly classes and methods were smellyfrom the beginning of their lifetime. That is, only 1 out of 8 was initially non-smelly,becoming smelly later. Therefore, in Health Watcher almost all smells were introducedat the creation of the class or method. A more in-depth analysis of the evolution ofeach smelly class and method in MobileMedia and Health Watcher is discussed belowusing Figures 3.3 to 3.7.
Table 3.3: Number of code smells originated and created in classes and methods.
Code Smell On Creation After Creation Total
MM HW MM HW MM HW
God Class 10 (71.4%) 1 (50%) 4 (28.6%) 1 (50%) 14 2God Method 19 (76%) 6 (100%) 6 (24%) 0 (0%) 25 6Feature Envy 3 (75%) 0 1 (25%) 0 4 0
Total 32 (74.4%) 7 (87.5%) 11 (25.6%) 1 (12.5%) 43 8
In Figures 3.3 to 3.7, each smelly class or method is represented by a row andeach system version by a column. Each row is labeled with the corresponding class ormethod name. Each rectangle represents the state of the class or method in the systemversion given by the column. There are two possible states: white and black. A whitestate indicates that the class or method is present in that system version, but it doesnot have a code smell. A black state indicates that the class or method is in fact a

3.4. Tracking Code Smells 31
code smell in that system version. The absence of a rectangle in a version means thatthe given class or method is not present in the respective version.
MobileMedia. Figure 3.3 shows that for 10 out of 14 God Class instances, thecode smells originate with the class. That is, the class is already created as a classthat centralizes functionalities of the system. This result is aligned with recent findings[Tufano et al., 2015]. For instance, the ImageAccessor and AlbumController classeswere created in versions 1 and 4, respectively, as God Classes and they remained assuch for as long as they are present in the system. On the other hand, 4 out of 14classes were created non-smelly and became a God Class at some point of their lifetime.For instance, the PhotoController class is added in the second version of the systemand it only became smelly in version 4, because of the incorporation of new features,such as showing saved images and updating the image information.
Figure 3.3: Evolution of God Class in MobileMedia
Figure 3.4 shows that some methods are created as God Method (19 of 25) andothers become God Method with the evolution of the system (6 of 25). In the firstcase, the methods are already introduced in the system with many functionalities.In the second case, methods are created with a single purpose, and as the systemevolves, more functionality is added until the method becomes smelly. For instance,the method BaseController.handleCommand is introduced in the first version asa smelly method, centralizing multiple functionalities, such as adding, saving anddeleting photos and albums. By version 4, the method was refactored, and some

32 Chapter 3. Code Smell Evolution
of the previously mentioned functionalities were removed from the method, removingthe smell. On the other hand, the PhotoController.handleCommand method iscreated in version 2 with a single functionality, saving photo labels. By version 4,multiple features were added to this class, such as editing photo labels, sorting photos,and adding photos as favorite, introducing a smell. One interesting observation isthat when a smell is introduced in a method and then removed in a later version, themethod remains non-smelly in the subsequent versions. For instance, that is the caseof the methods BaseController.handleCommand, MediaController.showImage,and ImageAccessor.updateImageInfo.
Figure 3.4: Evolution of God Method in MobileMedia

3.4. Tracking Code Smells 33
In Figure 3.5, we observe that for Feature Envy, in 3 out of 4 instances, thesmell originated with the method and persisted during its entire existence. Only onemethod was created without Feature Envy and it evolved to later present that codesmell. The MediaController.showImage, ImageAccessor.updateImageInfo,and MediaAccessor.updateMediaInfo methods are smelly. They manipulateimages and directly access data and methods from other classes that also manipulateimages. Therefore, we believe that the similarity in the methods functionality mayhave led to a confusion as to the correct class that each method should have beenplaced.
Figure 3.5: Evolution of Feature Envy in MobileMedia
Health Watcher. There are no instances of Feature Envy in Health Watcherand, therefore, only the evolution of God Classes and God Methods is presented.Figure 3.6 shows the evolution of the only two God Classes in Health Watcher:ComplaintRepositoryRDB and HealthWatcherFacade. The former was createdin the first version of the system, already as a God Class, and it remained as suchthroughout the entire evolution of the system. The latter is smelly only in versions 9and 10, although the class was created in the first version. ComplaintRepositoryRDB
is not modified from versions 1 to 6, suffering minor changes only in version 7,where a fragment of code that recovers information of a complaint in the databaseis reorganized, changing the order in which each field is displayed, while other fieldsbecame optional. Other minor changes are made in version 10, mainly in the order ofstatements and the inclusion of further information recovery means from the database.Nevertheless, the class remains smelly in all versions of the system. The classHealthWatcherFacade is created in version 1 and is modified in the versions 4 to10. However, only the modifications in version 9 introduced a smell in the class. Thisclass is an implementation of the Facade design pattern [Gamma et al., 1994], that hasthe purpose of simplifying the access of underlying objects of the system. Therefore,it is expected to access data and methods from multiple classes. However, among the
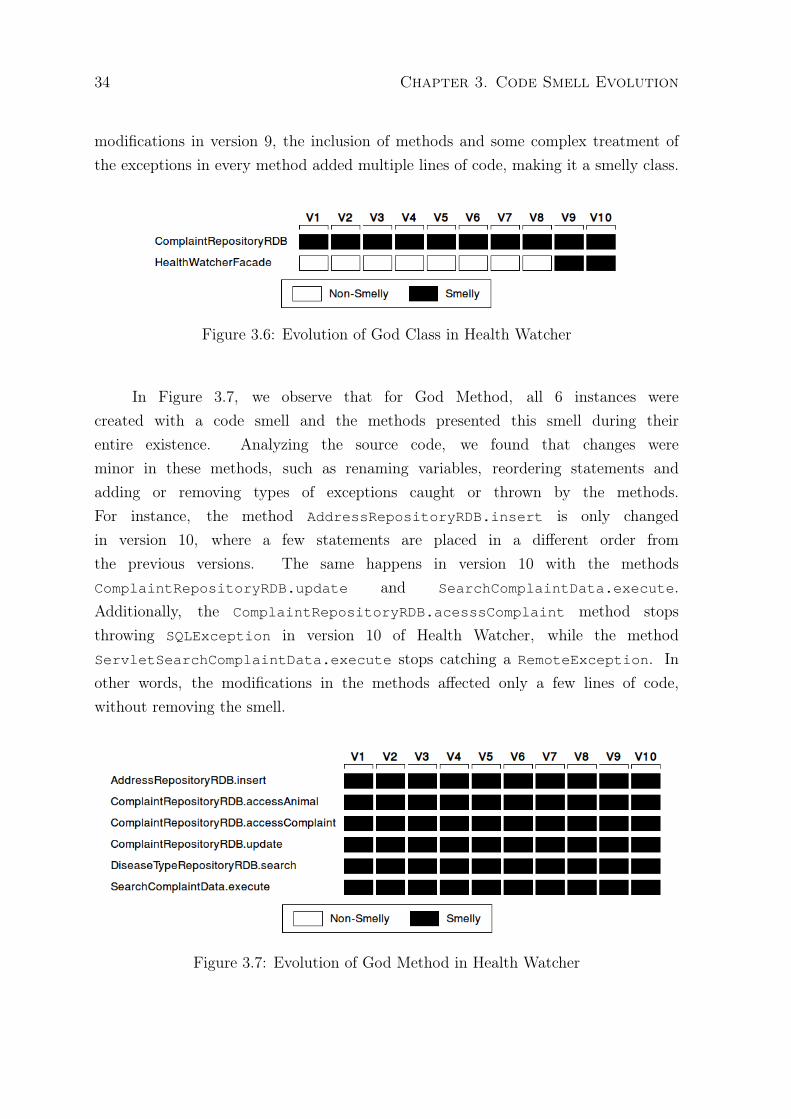
34 Chapter 3. Code Smell Evolution
modifications in version 9, the inclusion of methods and some complex treatment ofthe exceptions in every method added multiple lines of code, making it a smelly class.
Figure 3.6: Evolution of God Class in Health Watcher
In Figure 3.7, we observe that for God Method, all 6 instances werecreated with a code smell and the methods presented this smell during theirentire existence. Analyzing the source code, we found that changes wereminor in these methods, such as renaming variables, reordering statements andadding or removing types of exceptions caught or thrown by the methods.For instance, the method AddressRepositoryRDB.insert is only changedin version 10, where a few statements are placed in a different order fromthe previous versions. The same happens in version 10 with the methodsComplaintRepositoryRDB.update and SearchComplaintData.execute.Additionally, the ComplaintRepositoryRDB.acesssComplaint method stopsthrowing SQLException in version 10 of Health Watcher, while the methodServletSearchComplaintData.execute stops catching a RemoteException. Inother words, the modifications in the methods affected only a few lines of code,without removing the smell.
Figure 3.7: Evolution of God Method in Health Watcher

3.5. Threats to Validity 35
3.5 Threats to Validity
This study was performed using two small size systems that were manually analyzed insearch of code smells. The subjects of our analysis were nine versions of MobileMediaand ten versions of Health Watcher. These systems are small and might not berepresentative of the industrial practice and our findings might not be directly extendedto real large scale projects. Although these systems are small, they were developedto incorporate nowadays technologies and recurrent maintenance scenarios of realsoftware systems. They also have been the subject of other maintainability-relatedstudies [Figueiredo et al., 2008; Macia et al., 2012; Soares et al., 2006; Kulesza et al.,2006; Greenwood et al., 2007]. However, we are aware that additional investigationis necessary to determine if our findings can be generalized to other systems. Inaddition, we concluded that the size of the systems is not a restriction, since wehad more interesting results with MobileMedia than with Health Watcher, a largersystem by comparison. We only selected two systems because our analysis of codesmells evolution required a code smell reference list, created by manually analyzing thesource code. Therefore, we selected two familiar systems with clear, simple purposes,and with comprehensible source code to focus the analysis on code smell identificationinstead of code comprehension.
In order to create the code smell reference list, we manually inspected the sourcecode of the target systems. However, since the concept of code smells is not formalized,the interpretation and detection of code smells is highly subjective and, therefore,variable from one researcher to another. Even though this subjectivity can not becompletely eliminated, we tried to reduce it by creating the code smell reference listin well-defined stages. Divergences in the individual reports of different researcherswere discussed to reach a consensus. For the cases in which a consensus could not bereached, we consulted a code smell expert familiar with the target systems, and weincluded in the reference list only the code smells validated by him. In addition, allfour researchers that participated in the creation of the reference lists had an advancedknowledge of code smells and, all of them are familiar with the target systems.
3.6 Final Remarks
In this chapter, we introduced the concept of code smell reference lists, which containthe fully qualified names of classes and methods affected by at least one of the codesmells: God Class, God Method, and Feature Envy. Using the code smells referencelists, we analyzed the variations in the number of code smells from one version to

36 Chapter 3. Code Smell Evolution
another in order to investigate if there is an increase in the number of code smells asthe systems evolve (RQ1). In addition, we investigated the evolution of the classes andmethods that in at least one version of the system were smelly (RQ2), by tracking theirstatus throughout the evolution of the system (not present, non-smelly, or smelly).
In the next chapter, we present our comparative study of code smell detectiontools. We compare four detection tools, namely inFusion, JDeodorant, JSpIRIT, andPMD, regarding their recall, precision, and agreement in the detection of code smellsin the target systems, namely MobileMedia and Health Watcher.

Chapter 4
Comparative Study of Code SmellDetection Tools
One of the main challenges in detecting code smells is their high-level definitions. Thatis, their characteristics are often described informally, without any formalization thatcan assist the detection [Fowler, 1999]. Since we lack formalization for some codesmells, the detection techniques proposed in the literature rely mainly in differentresearchers interpretations of each code smell. In that context, many software analysistools and techniques have been proposed in the literature for detecting code smells[Fernandes et al., 2016; Murphy-Hill and Black, 2010; Tsantalis et al., 2008; Zazworkaand Ackermann, 2010]. However, since different tools may report different classesand methods as code smells, some tools may be more or less compatible with themaintenance needs of a software developer.
In this chapter, we compare the results of four code smell detection tools, namelyinFusion, JDeodorant, JSpIRIT, and PMD. Section 4.1 presents the research questions.Section 4.2 presents a summary of classes and methods reported by the tools as codesmells. Section 4.3 analyzes the tools recall and precision in detecting code smells fromthe code smell reference lists. Section 4.4 analyzes the percentage agreement amongtools and between pairs of tools. Section 4.5 analyzes the AC1 agreement among toolsand between pairs of tools. Section 4.6 analyzes the non-occurrence and occurrenceagreement between pairs of tools. Section 4.7 discusses the main threats to the validityof this study. Lastly, final remarks are discussed in Section 4.8.
37
38 Chapter 4. Comparative Study of Code Smell Detection Tools
4.1 Study Settings
The purpose of this study is to compare four code smell detection tools, namelyinFusion, JDeodorant, JSpIRIT, and PMD. We compare the tools recall, precision,and agreement in the detection of the following code smells: God Class, God Method,and Feature Envy. For that purpose, we executed every tool to analyze the sourcecode of two applications, namely MobileMedia and Health Watcher (Section 3.1). Thereports of the detection tools for MobileMedia and for Health Watcher were used toanswer the following research questions:
• RQ3. What is the recall and precision of tools in identifying actual instances ofcode smells?
With RQ3, we aim to assess the recall and precision of each tool in detecting code smellsthat were previously identified by experts and registered in the code smell referencelist of each system. The classes and methods reported by the tools were compared tothe classes and methods in the reference list to determine the recall and precision ofeach tool in the detection of God Class, God Method, and Feature Envy.
• RQ4. What is the level of agreement between different detection tools?
Different tools implement different detection techniques and sometimes the sametechnique can be implemented with variations specific to a particular tool, such asdifferent threshold values. Therefore, it is expected that different tools identify differentclasses and methods as code smells. RQ4 aims to assess how much the tools agree whenclassifying a class or method as a code smell.
In order to answer RQ3 and RQ4, we used the tools to analyze the source code ofall nine versions of MobileMedia and ten versions of Health Watcher. The tools wereexecuted with default settings to detect God Class, God Method, and Feature Envy.The reported classes and methods and the code smell reference lists (Section 3.2) areused to calculate the tools recall, precision, and agreement. A summary of the classesand methods reported by the tools is presented in the following section.
4.2 Summary of Detected Code Smells
This section summarizes the code smells detected in the two target systems using thetools inFusion, JDeodorant, JSpIRIT, and PMD. The complete reports of each code

4.2. Summary of Detected Code Smells 39
smell detection tool for MobileMedia and Health Watcher are available at our researchgroup website1.
MobileMedia (MM). Table 4.1 shows the total number of code smells identifiedby each tool in the nine versions of MobileMedia. For instance, inFusion reports 3classes as God Classes, while JDeodorant reports 85 classes for the same code smell.On the other hand, JSpIRIT reports 9 classes, PMD reports 8 classes, and there are 47classes in the God Class reference list. In Table 4.1, we can observe that inFusion andPMD report similar totals of smells. However, inFusion is the most conservative tool,with a total of 28 code smell instances for God Class, God Method, and Feature Envy.PMD does not detect Feature Envy and is less conservative than inFusion, detecting atotal of 24 instances for God Class and God Method, in contrast with the 20 instancesdetected by inFusion. JSpIRIT and JDeodorant report more smells than the previoustools. JDeodorant is by far the most aggressive in its detection strategies by reporting254 instances. That is, JDeodorant detects more than nine times the amount of smellsof the most conservative tools, namely inFusion and PMD. However, JSpIRIT is thetool that reports a total amount of code smells that is closer to the actual amount of133 instances in the reference list for the nine versions of the MobileMedia system.
Table 4.1: Total number of code smells detected by each tool.
Code Smell inFusion JDeodorant JSpIRIT PMD Reference List
MM HW MM HW MM HW MM HW MM HW
God Class 3 0 85 98 9 20 8 33 47 12God Method 17 0 100 599 27 30 16 13 67 60Feature Envy 8 48 69 90 74 111 - - 19 0
Total 28 48 254 787 110 161 24 46 133 72
Health Watcher (HW). Table 4.1 also shows the total number of code smellinstances identified by each tool in the ten versions of Health Watcher. inFusion is onceagain the most conservative tool, reporting only 48 instances of Feature Envy and noneof God Class or God Method. PMD is the second more conservative, detecting a totalof 46 instances of God Class and God Method. JSpIRIT and JDeodorant also detectmore instances in Health Watcher than the other tools. JDeodorant is again the moreaggressive in its detection strategy by reporting 787 instances of code smells in total.That is, it detects about 16 times the amount of smells of the most conservative tools,inFusion and PMD. JSpIRIT detects a little over twice the amount of actual instancesof smells according to the reference list for Health Watcher.
1 http://labsoft.dcc.ufmg.br/doku.php?id=people:students:thanis_paiva

40 Chapter 4. Comparative Study of Code Smell Detection Tools
4.3 Analysis of Recall and Precision
This section aims to answer the research question RQ3 by measuring the recall andprecision of inFusion, JDeodorant, JSpIRIT, and PMD. Recall is a measure of coverage,while precision is a measure of relevance. Tools with higher recall can find morecode smell instances that exist in a system than tools with lower recall that can missinstances. Smells should be detected as soon as possible, since as systems evolve andbecome more complex, undetected smells may become increasingly harder to refactor[Fowler, 1999; Fontana et al., 2011]. Therefore, tools with higher recall are preferable,since missing smelly entities can hinder future refactorings. On the other hand, ahigh precision indicates that more actual instances of code smells (true positives) wereidentified by the tool than non-smelly instances wrongly identified (false positives).Since the results have to be validated by a programmer, with less false positivesthe programmer spends less time inspecting non-smelly entities. Therefore, it is alsodesirable to have a tool with high precision to reduce validation efforts. We calculatedthe tools recall and precision in detecting code smells from the reference list. Tables4.2 and 4.3 show the average recall and precision considering all versions for each tooland code smell analyzed in MobileMedia and Health Watcher.
MobileMedia. Table 4.2 shows the tools average recall (R) and average precision(P) for all nine versions of MobileMedia. For instance, inFusion has an average recallof 9% and an average precision of 33% for God Class, while JDeodorant has an averagerecall of 61% and an average precision of 29% for the same smell. Considering allaverage recall and average precision values, the minimum value for both is 0%, whilethe maximum averages are 61% and 100%, respectively. Analyzing the averages for GodClass, JSpIRIT and PMD have similar values, i.e., lower average recalls of 17%, buthigher average precisions of 67% and 78% when compared to JDeodorant and inFusion.This result was expected, since JSpIRIT and PMD follow Marinescu’s detectionstrategy [Lanza and Marinescu, 2006] for God Class. The most noticeable resultsare for JDeodorant, the only tool that detects God Class by identifying refactoringopportunities. This tool presents the highest average recall of 61% and lowest averageprecision of 29%. Although JDeodorant presents a high average recall, many falsepositives were also reported. Even though inFusion, JSpIRIT, and PMD are based onthe same detection strategy, inFusion has the lowest average recall of only 9%. However,inFusion has an average precision of 33%; that is, 5% higher than JDeodorant (29%),that has the lowest average precision.
For God Method, PMD and inFusion have the same averages for MobileMedia,with an average recall of 26% and an average precision of 100%, despite following
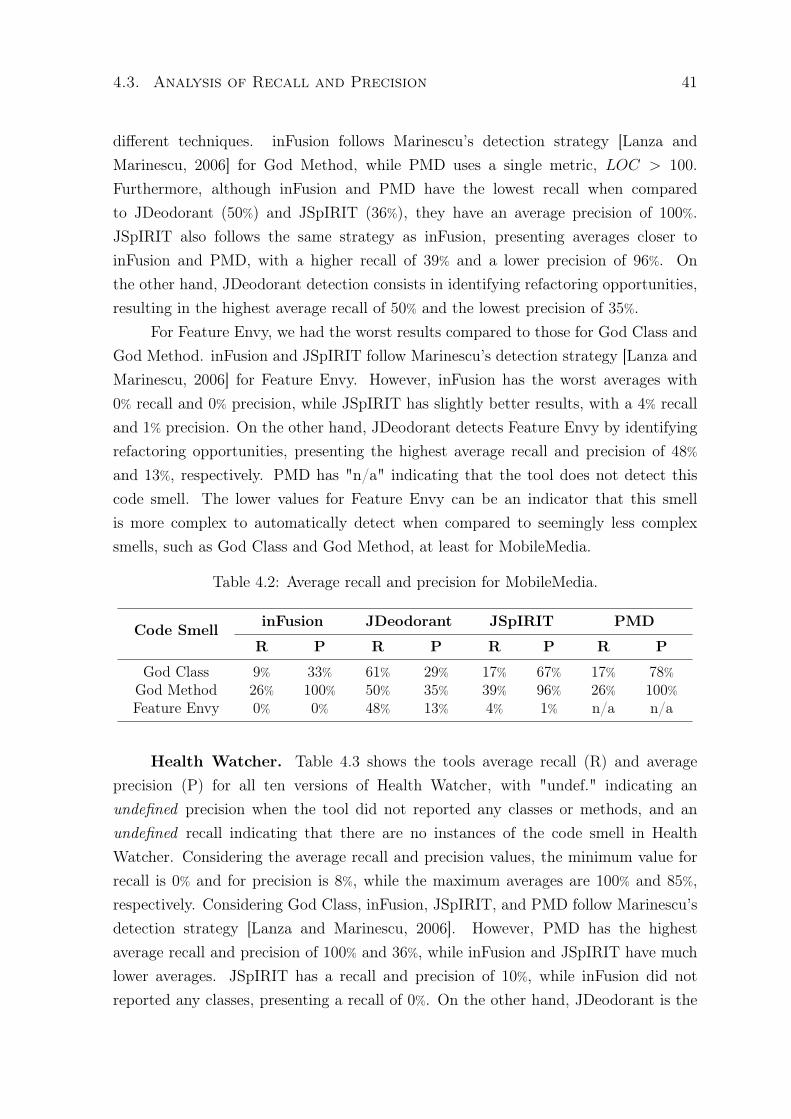
4.3. Analysis of Recall and Precision 41
different techniques. inFusion follows Marinescu’s detection strategy [Lanza andMarinescu, 2006] for God Method, while PMD uses a single metric, LOC > 100.Furthermore, although inFusion and PMD have the lowest recall when comparedto JDeodorant (50%) and JSpIRIT (36%), they have an average precision of 100%.JSpIRIT also follows the same strategy as inFusion, presenting averages closer toinFusion and PMD, with a higher recall of 39% and a lower precision of 96%. Onthe other hand, JDeodorant detection consists in identifying refactoring opportunities,resulting in the highest average recall of 50% and the lowest precision of 35%.
For Feature Envy, we had the worst results compared to those for God Class andGod Method. inFusion and JSpIRIT follow Marinescu’s detection strategy [Lanza andMarinescu, 2006] for Feature Envy. However, inFusion has the worst averages with0% recall and 0% precision, while JSpIRIT has slightly better results, with a 4% recalland 1% precision. On the other hand, JDeodorant detects Feature Envy by identifyingrefactoring opportunities, presenting the highest average recall and precision of 48%and 13%, respectively. PMD has "n/a" indicating that the tool does not detect thiscode smell. The lower values for Feature Envy can be an indicator that this smellis more complex to automatically detect when compared to seemingly less complexsmells, such as God Class and God Method, at least for MobileMedia.
Table 4.2: Average recall and precision for MobileMedia.
Code Smell inFusion JDeodorant JSpIRIT PMD
R P R P R P R P
God Class 9% 33% 61% 29% 17% 67% 17% 78%God Method 26% 100% 50% 35% 39% 96% 26% 100%Feature Envy 0% 0% 48% 13% 4% 1% n/a n/a
Health Watcher. Table 4.3 shows the tools average recall (R) and averageprecision (P) for all ten versions of Health Watcher, with "undef." indicating anundefined precision when the tool did not reported any classes or methods, and anundefined recall indicating that there are no instances of the code smell in HealthWatcher. Considering the average recall and precision values, the minimum value forrecall is 0% and for precision is 8%, while the maximum averages are 100% and 85%,respectively. Considering God Class, inFusion, JSpIRIT, and PMD follow Marinescu’sdetection strategy [Lanza and Marinescu, 2006]. However, PMD has the highestaverage recall and precision of 100% and 36%, while inFusion and JSpIRIT have muchlower averages. JSpIRIT has a recall and precision of 10%, while inFusion did notreported any classes, presenting a recall of 0%. On the other hand, JDeodorant is the
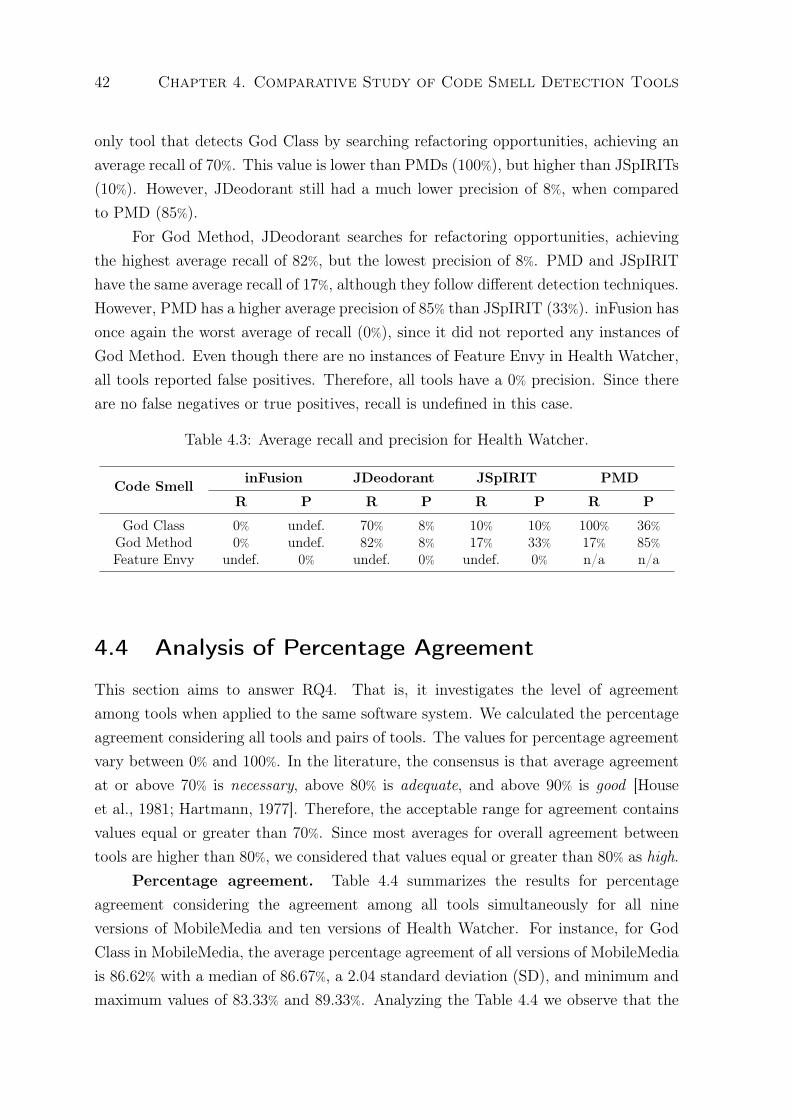
42 Chapter 4. Comparative Study of Code Smell Detection Tools
only tool that detects God Class by searching refactoring opportunities, achieving anaverage recall of 70%. This value is lower than PMDs (100%), but higher than JSpIRITs(10%). However, JDeodorant still had a much lower precision of 8%, when comparedto PMD (85%).
For God Method, JDeodorant searches for refactoring opportunities, achievingthe highest average recall of 82%, but the lowest precision of 8%. PMD and JSpIRIThave the same average recall of 17%, although they follow different detection techniques.However, PMD has a higher average precision of 85% than JSpIRIT (33%). inFusion hasonce again the worst average of recall (0%), since it did not reported any instances ofGod Method. Even though there are no instances of Feature Envy in Health Watcher,all tools reported false positives. Therefore, all tools have a 0% precision. Since thereare no false negatives or true positives, recall is undefined in this case.
Table 4.3: Average recall and precision for Health Watcher.
Code Smell inFusion JDeodorant JSpIRIT PMD
R P R P R P R P
God Class 0% undef. 70% 8% 10% 10% 100% 36%God Method 0% undef. 82% 8% 17% 33% 17% 85%Feature Envy undef. 0% undef. 0% undef. 0% n/a n/a
4.4 Analysis of Percentage Agreement
This section aims to answer RQ4. That is, it investigates the level of agreementamong tools when applied to the same software system. We calculated the percentageagreement considering all tools and pairs of tools. The values for percentage agreementvary between 0% and 100%. In the literature, the consensus is that average agreementat or above 70% is necessary, above 80% is adequate, and above 90% is good [Houseet al., 1981; Hartmann, 1977]. Therefore, the acceptable range for agreement containsvalues equal or greater than 70%. Since most averages for overall agreement betweentools are higher than 80%, we considered that values equal or greater than 80% as high.
Percentage agreement. Table 4.4 summarizes the results for percentageagreement considering the agreement among all tools simultaneously for all nineversions of MobileMedia and ten versions of Health Watcher. For instance, for GodClass in MobileMedia, the average percentage agreement of all versions of MobileMediais 86.62% with a median of 86.67%, a 2.04 standard deviation (SD), and minimum andmaximum values of 83.33% and 89.33%. Analyzing the Table 4.4 we observe that the

4.4. Analysis of Percentage Agreement 43
percentage agreement among tools is high. For MobileMedia, the percentage agreementranges from 83.33% (adequate) to 98.03% (good), and it is even higher for HealthWatcher, ranging from 91.34% to 98.13% (good). Observing the standard deviation(SD) in Table 4.4, we can see that the results of the percentage agreement found foreach code smell in both systems do not present much variation, with standard deviationranging from 0.61 to 2.04.
Table 4.4: Percentage agreement for MobileMedia (MM) and Health Watcher (HW).
Code Smell Average Median SD Min Max
MM HW MM HW MM HW MM HW MM HW
God Class 86.62% 92.82% 86.67% 93.03% 2.04 0.79 83.33% 91.34% 89.33% 93.79%God Method 96.68% 94.89% 96.35% 94.97% 0.63 0.61 95.97% 93.58% 97.63% 95.98%Feature Envy 95.14% 97.39% 95.06% 97.66% 1.33 0.85 93.55% 95.74% 98.03% 98.13%
Percentage agreement between pairs of tools. The percentage agreementwas also calculated considering the agreement between pairs of tools for all nine versionsof MobileMedia and ten versions of Health Watcher. In general, in both systems, therewas a higher average of agreement between tools that implemented the same detectiontechnique. However, the agreement remained high even between tools with distincttechniques, indicating that the results obtained from different techniques are distinct,but still similar enough to yield high agreement values. Tables 4.5 to 4.7 summarize thepercentage agreement calculated between each pair of tools for MobileMedia and HealthWatcher, including the average agreement, median, standard deviation (SD), minimum,and maximum agreement. For instance, in Table 4.5, for God Class in MobileMedia, theaverage agreement between the pair inFusion-JDeodorant is 75.12%, while between thethe same pair for Health Watcher, the average agreement is 89.75%. Pairs with PMDare not shown in Table 4.7 because PMD does not detect Feature Envy. In the followingdiscussion, we analyze the agreement for each code smell individually, considering bothtarget systems, namely MobileMedia (MM) and Health Watcher (HW).
God Class. In Table 4.5 for MobileMedia, the percentage agreement ofpairs ranges from 67.57% to 100%. The pair PMD-JSpIRIT has the highestaverage agreement (99.15%), followed by the pairs inFusion-PMD (98.79%) andinFusion-JSpIRIT (97.94%). In Health Watcher, the agreement ranges from 84.42% and98.31%, and the same pairs have the highest averages, nevertheless, the ordering differs,with the pair inFusion-JSpIRIT (97.90%) first, followed by the pairs PMD-JSpIRIT(96.76%), and inFusion-PMD (96.59%). These three pairs of tools also present a lowstandard deviation, ranging from 1.27 to 1.68 in MobileMedia and from 0.29 to 0.43 inHealthWatcher. A low standard deviation means that there is not much variation in the

44 Chapter 4. Comparative Study of Code Smell Detection Tools
level of agreement between tools from one version of the system to another. Therefore,inFusion, JSpIRIT, and PMD follow Marinescu’s detection [Lanza and Marinescu, 2006]and present good average agreements.
The lowest average agreements occur in pairs with JDeodorant, the only tool thatdetects God Class by identifying refactoring opportunities. The standard deviationbetween JDeodorant and the other tools is also higher, ranging from 3.51 to 3.73 inMobileMedia, and from 0.91 to 1.88 in Health Watcher. Therefore, there is a greatervariation in the agreement of pairs with JDeodorant from one version to another. InHealth Watcher, the agreement between pairs with JDeodorant is adequate or good,ranging from 84.42% to 91.30%. While in MobileMedia, the agreement is necessary,ranging from 74.36% to 75.12%. Therefore, in both systems, the agreement betweenJDeodorant and the other tools is inside the acceptable range. However, it is clearthat in MobileMedia, JDeodorants detection technique for God Class results in moredivergences with Marinescu’s detection strategy [Lanza and Marinescu, 2006].
Table 4.5: Percentage agreement for God Class between pairs of tools for MobileMedia(MM) and Health Watcher (HW).
Pairs of Tools Average Median SD Min Max
MM HW MM HW MM HW MM HW MM HW
inFusion-JDeodorant 75.12% 89.75% 73.33% 89.80% 3.68 0.91 70.27% 88.31% 82.00% 91.30%inFusion-JSpIRIT 97.94% 97.90% 97.83% 97.90% 1.68 0.29 96.00% 97.40% 100% 98.31%inFusion-PMD 98.79% 96.59% 100% 96.74% 1.27 0.43 96.00% 95.76% 100% 97.09%JDeodorant-JSpIRIT 74.36% 87.82% 73.33% 87.76% 3.73 1.48 67.57% 85.71% 82.00% 90.68%JDeodorant-PMD 74.36% 88.10% 73.33% 88.78% 3.51 1.88 67.57% 84.42% 80.00% 89.83%PMD-JSpIRIT 99.15% 96.76% 100% 96.76% 1.57 0.40 96.15% 96.10% 100% 97.46%
God Method. In Table 4.6 for MobileMedia, the agreement ranges from 91.94%
to 100%. The pair inFusion-PMD has the highest average agreement (99.66%), followedby the pairs inFusion-JSpIRIT (99.25%), and PMD-JSpIRIT (99.24%). In HealthWatcher, the agreement ranges from 87.39% and 99.86%, and the same pairs havethe highest averages. Nevertheless, the ordering differs, with the pair inFusion-PMD(99.77%) first, followed by the pairs PMD-JSpIRIT (99.60%) and inFusion-JSpIRIT(99.49%). Interestingly, inFusion and JSpIRIT are based on Marinescu’s detectionstrategy [Lanza and Marinescu, 2006], while PMD uses a single metric LOC to detectGod Method. Although the techniques are distinct, they have a good average agreementin both systems. The standard deviation is also low, ranging from 0.33 to 0.62 inMobileMedia, and from 0.10 to 0.13 in Health Watcher, indicating that the agreementremains high across versions in both systems.
The lower average agreements are once again in pairs with JDeodorant, the onlytool that detects God Method by identifying refactoring opportunities. The use of a

4.4. Analysis of Percentage Agreement 45
different detection technique by PMD did not affected the agreement with inFusion andJSpIRIT, with averages over 99% in both systems, while for JDeodorant, the impactwas more perceptible with averages close to 94% in MobileMedia and 90% in HealthWatcher. However, despite variations in the agreement, all pairs still have averageagreements inside the acceptable range for MobileMedia and Health Watcher.
Table 4.6: Percentage agreement for God Method between pairs of tools forMobileMedia (MM) and Health Watcher (HW).
Pairs of Tools Average Median SD Min Max
MM HW MM HW MM HW MM HW MM HW
inFusion-JDeodorant 94.29% 89.92% 94.09% 90.06% 1.86 1.19 91.94% 87.39% 97.07% 92.06%inFusion-JSpIRIT 99.25% 99.49% 99.01% 99.52% 0.62 0.10 98.33% 99.29% 100% 99.58%inFusion-PMD 99.66% 99.77% 99.64% 99.84% 0.33 0.11 99.01% 99.56% 100% 99.86%JDeodorant-JSpIRIT 93.70% 90.44% 93.10% 90.66% 1.49 1.14 91.94% 88.05% 95.93% 92.48%JDeodorant-PMD 93.94% 90.15% 93.43% 90.26% 1.71 1.11 91.94% 87.83% 96.65% 92.20%PMD-JSpIRIT 99.24% 99.60% 99.01% 99.68% 0.62 0.13 98.52% 99.34% 100% 99.72%
Feature Envy. In Table 4.7 for MobileMedia, the agreement ranges from 91.13%
to 99.51%. The pair inFusion-JSpIRIT has the highest average agreement (96.79%),followed by the pairs inFusion-JDeodorant (95.52%) and JDeodorant-JSpIRIT(93.12%). They also presented a low standard deviation, ranging from 1.37 to 3.13.Both inFusion and JSpIRIT are based on Marinescu’s detection strategy [Lanza andMarinescu, 2006]. Therefore, the high agreement between these tools was expected.On the other hand, JDeodorant detects Feature Envy by identifying refactoringopportunities. This different detection technique lowered the agreement betweenJDeodorant and the other two tools in MobileMedia. However, the average agreementis still good.
In Health Watcher, the average agreement between the pairs of tools is verysimilar. The pair inFusion-JDeodorant has the highest agreement (97.78%), followedby inFusion-JSpIRIT (97.27%) and JDeodorant-JSpIRIT (97.12%). The standarddeviation is low, ranging from 0.68 to 0.98, indicating that there is not much variationin the agreement between different versions of the system. Although inFusion andJSpIRIT use the same detection technique and JDeodorant does not, they yieldedsimilar results for Health Watcher.
Table 4.7: Percentage agreement for Feature Envy between pairs of tools forMobileMedia (MM) and Health Watcher (HW).
Pairs of Tools Average Median SD Min Max
MM HW MM HW MM HW MM HW MM HW
inFusion-JDeodorant 95.52% 97.78% 97.04% 98.17% 3.13 0.92 91.13% 95.98% 99.51% 98.44%inFusion-JSpIRIT 96.79% 97.27% 97.53% 97.51% 1.37 0.68 94.88% 95.98% 98.58% 97.98%JDeodorant-JSpIRIT 93.12% 97.12% 92.59% 97.45% 1.64 0.98 91.67% 95.27% 97.04% 98.16%

46 Chapter 4. Comparative Study of Code Smell Detection Tools
4.5 Analysis of AC1 Agreement
This section aims to answer RQ4, like in Section 4.4. That is, it investigates the levelof agreement among tools when applied to the same software system using the AC1
statistic [Gwet, 2014], which adjusts the percentage agreement probability for chanceagreement, considering all tools and pairs of tools. The AC1 statistic, or first-orderagreement coefficient, is the "conditional probability that two randomly selected ratersagree given that there is no agreement by chance" [Gwet, 2014]. This is a robustalternative agreement coefficient to Cohen’s Kappa [Gwet, 2014] that is more sensitiveto minor disagreements among the tools. The AC1 takes a value between 0 and 1and communicates levels of agreement using the Altman’s benchmark scale for Kappa[McCray, 2013], that classifies agreement levels into Poor (< 0.20), Fair (0.21 to 0.40),Moderate (0.41 to 0.60), Good (0.61 to 0.80), and Very Good (0.81 to 1) [Altman,1991]. Tables 4.8 and 4.9 contain the AC1 statistic [Gwet, 2014] measured with a 95%
confidence interval (CI). The AC1 statistic is "Very Good" for all smells and versionsin both systems. This result is compatible with the high agreement found for thepercentage agreement, considering all tools and between pairs of tools.
AC1 statistic between pairs of tools. The AC1 was also calculated consideringpairs of tools with a 95%confidence interval. Figure 4.1 summarizes the classifications ineach level of the Altman’s benchmark scale for God Class (GC), God Method (GM),and Feature Envy (FE), for all nine versions of MobileMedia (V1 to V9) and tenversions of Health Watcher (V1 to V10). For instance, in MobileMedia, the pairinFusion-JDeodorant for God Class has a "Moderate" AC1 for all versions, while forthe same smell and pair, Health Watcher has a "Very Good" AC1 for all versions. InHealth Watcher, there is a high agreement between all pairs of tools for all smells,since for all versions of the system, the AC1 is "Very Good". For MobileMedia, thesame happens for God Method and Feature Envy. However, for God Class, none ofthe pairs with JDeodorant have versions with an AC1 "Very Good". For God Class inMobileMedia, the pairs with JDeodorant have AC1 either "Good" or "Moderate". Thisfact seems to support our analysis that for God Class in MobileMedia, JDeodorantreports the most distinct set of classes, when compared to the sets reported by theother tools.
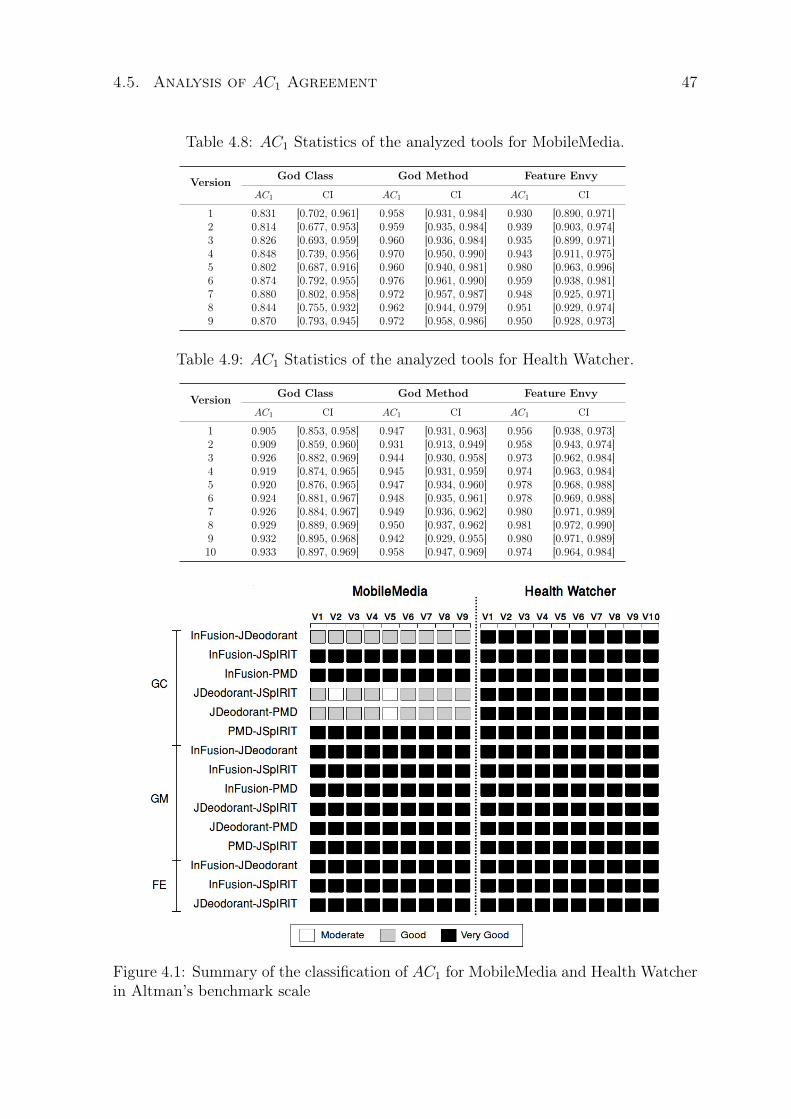
4.5. Analysis of AC1 Agreement 47
Table 4.8: AC1 Statistics of the analyzed tools for MobileMedia.
Version God Class God Method Feature Envy
AC1 CI AC1 CI AC1 CI
1 0.831 [0.702, 0.961] 0.958 [0.931, 0.984] 0.930 [0.890, 0.971]2 0.814 [0.677, 0.953] 0.959 [0.935, 0.984] 0.939 [0.903, 0.974]3 0.826 [0.693, 0.959] 0.960 [0.936, 0.984] 0.935 [0.899, 0.971]4 0.848 [0.739, 0.956] 0.970 [0.950, 0.990] 0.943 [0.911, 0.975]5 0.802 [0.687, 0.916] 0.960 [0.940, 0.981] 0.980 [0.963, 0.996]6 0.874 [0.792, 0.955] 0.976 [0.961, 0.990] 0.959 [0.938, 0.981]7 0.880 [0.802, 0.958] 0.972 [0.957, 0.987] 0.948 [0.925, 0.971]8 0.844 [0.755, 0.932] 0.962 [0.944, 0.979] 0.951 [0.929, 0.974]9 0.870 [0.793, 0.945] 0.972 [0.958, 0.986] 0.950 [0.928, 0.973]
Table 4.9: AC1 Statistics of the analyzed tools for Health Watcher.
Version God Class God Method Feature Envy
AC1 CI AC1 CI AC1 CI
1 0.905 [0.853, 0.958] 0.947 [0.931, 0.963] 0.956 [0.938, 0.973]2 0.909 [0.859, 0.960] 0.931 [0.913, 0.949] 0.958 [0.943, 0.974]3 0.926 [0.882, 0.969] 0.944 [0.930, 0.958] 0.973 [0.962, 0.984]4 0.919 [0.874, 0.965] 0.945 [0.931, 0.959] 0.974 [0.963, 0.984]5 0.920 [0.876, 0.965] 0.947 [0.934, 0.960] 0.978 [0.968, 0.988]6 0.924 [0.881, 0.967] 0.948 [0.935, 0.961] 0.978 [0.969, 0.988]7 0.926 [0.884, 0.967] 0.949 [0.936, 0.962] 0.980 [0.971, 0.989]8 0.929 [0.889, 0.969] 0.950 [0.937, 0.962] 0.981 [0.972, 0.990]9 0.932 [0.895, 0.968] 0.942 [0.929, 0.955] 0.980 [0.971, 0.989]10 0.933 [0.897, 0.969] 0.958 [0.947, 0.969] 0.974 [0.964, 0.984]
Figure 4.1: Summary of the classification of AC1 for MobileMedia and Health Watcherin Altman’s benchmark scale
48 Chapter 4. Comparative Study of Code Smell Detection Tools
4.6 Analysis of Non-Occurrence and Occurrence
Agreements
This section aims to answer RQ4, by differentiating the agreement between pairs oftools. In the previous sections, we investigated the agreement between tools consideringthe percentage agreement (Section 4.4) and the AC1 agreement (Section 4.5). However,we believe that the high agreement is due to a high agreement between tool when aclass or method is non-smelly. Therefore, in this section, we divide the agreementbetween pairs of tools into two separate measurements: occurrence agreement andnon-occurrence agreement [House et al., 1981]. The occurrence agreement, also knownas effective percentage agreement [Hartmann, 1977], focuses in the occurrence of acertain behavior. In our case, this behavior is the classification of a class or methodas a code smell by a tool. Analogously, the non-occurrence agreement, focuses in thenon-occurrence of said behavior. In our case, the non-occurrence is the classification ofa class or method as non-smelly by a tool. We discuss the non-occurrence agreement(NOA) and the occurrence agreement (OA) between all pairs of tools for MobileMediaand Health Watcher in the following Sections.
4.6.1 Non-Occurrence Agreement
Tables 4.10 to 4.12 summarize the non-occurrence agreement (NOA) for each codesmell, presenting the average, median, standard deviation (SD), minimum, andmaximum values between pair of tools for MobileMedia (MM) and Health Watcher(HW). For instance, in Table 4.10, the pair inFusion-JDeodorant has an average NOAof 74.83% for MobileMedia and of 89.75% for Health Watcher. Pairs with PMD arenot shown in Table 4.12 because PMD does not detect Feature Envy. We discuss theNOA for each code smell in the following, considering the same ranges for percentageagreement (Section 4.4).
God Class. In Table 4.10, for MobileMedia and Health Watcher, the pairsinFusion-JSpIRIT, inFusion-PMD, and PMD-JSpIRIT follow variations of the sametechnique, presenting good average NOAs varying from 96.72% to 99.14%. On the otherhand, JDeodorant follows a different technique and has pairs with lower average NOAs,that are necessary (MobileMedia) or adequate (Health Watcher), varying from 74.01%
to 89.75%. Therefore, although all pairs have average NOAs inside the acceptablerange, pairs that implement variations of the same detection strategy have a higheragreement on non-smelly classes than pairs that follow different detection techniques.

4.6. Analysis of Non-Occurrence and Occurrence Agreements 49
Table 4.10: Non-occurrence agreement (NOA) for God Class between pairs of tools forMobileMedia (MM) and Health Watcher (HW).
Pairs of Tools Average Median SD Min Max
MM HW MM HW MM HW MM HW MM HW
inFusion-JDeodorant 74.83% 89.75% 73.33% 89.80% 4.41 0.91 70.27% 88.31% 82.00% 91.30%inFusion-JSpIRIT 97.94% 97.90% 97.83% 97.90% 1.73 0.29 96.00% 97.40% 100% 98.31%inFusion-PMD 98.79% 96.59% 100% 96.74% 1.54 0.42 96.00% 95.76% 100% 97.09%JDeodorant-JSpIRIT 74.05% 87.81% 73.33% 87.76% 4.88 1.47 67.57% 85.71% 81.63% 90.60%JDeodorant-PMD 74.01% 88.01% 73.33% 88.66% 4.13 1.83 67.57% 84.42% 80.00% 89.66%PMD-JSpIRIT 99.14% 96.72% 100% 96.72% 1.40 0.40 96.15% 96.05% 100% 97.41%
God Method. In Table 4.11, all pairs have good average NOAs, exceptinFusion-JDeodorant in Health Watcher with an adequate NOA of 89.75%. However,pairs with JDeodorant have slightly lower averages when compared to others.Interestingly, PMD also follows a different detection technique than inFusion andJSpIRIT, but their pairs still have average NOAs above 99%. Therefore, the agreementon non-smelly methods is high between all pairs, despite differences in detectiontechniques.
Table 4.11: Non-occurrence agreement (NOA) for God Method between pairs of toolsfor MobileMedia (MM) and Health Watcher (HW).
Pairs of Tools Average Median SD Min Max
MM HW MM HW MM HW MM HW MM HW
inFusion-JDeodorant 94.27% 89.92% 94.03% 90.06% 1.86 1.19 91.94% 87.39% 97.06% 92.06%inFusion-JSpIRIT 99.24% 99.49% 99.00% 99.52% 0.62 0.10 98.32% 99.29% 100% 99.58%inFusion-PMD 99.65% 99.77% 99.63% 99.84% 0.33 0.11 99.01% 99.56% 100% 99.86%JDeodorant-JSpIRIT 93.68% 90.38% 93.07% 90.60% 1.48 1.15 91.94% 87.97% 95.86% 92.45%JDeodorant-PMD 93.93% 90.12% 93.38% 90.24% 1.70 1.12 91.94% 87.78% 96.65% 92.19%PMD-JSpIRIT 99.24% 99.60% 99.01% 99.68% 0.62 0.13 98.51% 99.33% 100% 99.72%
Feature Envy. In Table 4.12, all pairs have good average NOAs. Only inMobileMedia the pair inFusion-JSpIRIT has a higher average NOA than pairs withJDeodorant. This difference is not present in Health Watcher, where all pairs haveNOAs close to 97%, even though tools follow different techniques. Therefore, we canconsider that the agreement on non-smelly methods is high between all pairs, despitedifferences in detection techniques.
Table 4.12: Non-occurrence agreement (NOA) for Feature Envy between pairs of toolsfor MobileMedia (MM) and Health Watcher (HW).
Pairs of Tools Average Median SD Min Max
MM HW MM HW MM HW MM HW MM HW
inFusion-JDeodorant 95.50% 97.78% 97.04% 98.18% 3.14 0.92 91.13% 95.97% 99.51% 98.44%inFusion-JSpIRIT 96.78% 97.28% 97.52% 97.51% 1.37 0.68 94.86% 95.98% 98.57% 97.98%JDeodorant-JSpIRIT 93.06% 97.11% 92.59% 97.45% 1.67 0.98 91.55% 95.26% 97.04% 98.15%

50 Chapter 4. Comparative Study of Code Smell Detection Tools
4.6.2 Occurrence Agreement
In this discussion, we disregard the concept of acceptable range [Hartmann, 1977; Houseet al., 1981] used in the previous section, since most values are lower than the minimumrequired. Therefore, we limit the discussion to a comparison between pairs of tools.Tables 4.13 to 4.15 summarize the occurrence agreement (OA) and are analogous toTables 4.10 to 4.12.
God Class. In Table 4.13, for MobileMedia, the pair PMD-JSpIRIThas the highest average OA (71.43%), followed by inFusion-PMD (42.86%), andinFusion-JSpIRIT (21.43%). However, they also have high standard deviations (39.34and 53.45) indicating that there are variations between the reports of different versions.In fact, these pairs have OAs of 100%. On the other hand, pairs with JDeodorant havelower averages, ranging from 3.63% to 5.06%, and lower standard deviations. However,all pairs, except PMD-JSpIRIT, have a median of 0%. Therefore, in MobileMedia, thepair PMD-JSpIRIT reports the highest number of classes in common, while the otherpairs report no classes in common in more than half of the versions. In Health Watcher,inFusion did not reported instances of God Class. Therefore, pairs with inFusion haveno classes in common. The pair PMD-JSpIRIT also has the highest number of instancesin common. Considering both systems, except for the pair PMD-JSpIRIT, the OA islow between pairs of tools, meaning that they report different sets of classes as smelly.Interestingly, this is also true for inFusion-PMD and inFusion-JSpIRIT, even thoughinFusion, PMD, and JSpIRIT are based in the same detection strategy.
Table 4.13: Occurrence agreement (OA) for God Class between pairs of tools forMobileMedia (MM) and Health Watcher (HW).
Pairs of Tools Average Median SD Min Max
MM HW MM HW MM HW MM HW MM HW
inFusion-JDeodorant 3.63% 0% 0% 0% 5.62 0 0% 0% 12.50% 0%inFusion-JSpIRIT 21.43% 0% 0% 0% 39.34 0 0% 0% 100% 0%inFusion-PMD 42.86% 0% 0% 0% 53.45 0 0% 0% 100% 0%JDeodorant-JSpIRIT 5.06% 0.83% 0% 0% 6.34 2.63 0% 0% 15.38% 8.33%JDeodorant-PMD 4.49% 7.27% 0% 8.33% 5.59 4.27 0% 0% 12.50% 14.29%PMD-JSpIRIT 71.43% 26.00% 100% 25.00% 39.34 5.16 0% 20.00% 100% 40.00%
God Method. In Table 4.14, for MobileMedia, the pair inFusion-PMDhas the highest average OA (71.30%), followed by inFusion-JSpIRIT (60.37%), andPMD-JSpIRIT (58.33%). They also have high standard deviations, ranging from24.69 to 32.28, and consequently, there are variations between the reports of differentversions. However, they report more than half methods in common in half the versionsof MobileMedia, even though PMD follows a different detection technique. On theother hand, pairs with JDeodorant have the lowest OAs and standard deviations,

4.7. Threats to Validity 51
lower than 7.98% and 8.79, respectively. In Health Watcher, inFusion did not reportedinstances of God Method, presenting no methods in common with the other tools.Therefore, inFusion-JSpIRIT is the only pair based in the same detection strategyand has an average OA of 0%. The other pairs follow different techniques and thepair PMD-JSpIRIT has the highest average OA (30.83%), while JDeodorant-JSpIRIT(5.11%) and JDeodorant-PMD (2.21%) have lower averages.
Table 4.14: Occurrence agreement (OA) for God Method between pairs of tools forMobileMedia (MM) and Health Watcher (HW).
Pairs of Tools Average Median SD Min Max
MM HW MM HW MM HW MM HW MM HW
inFusion-JDeodorant 7.98% 0% 10.53% 0% 6.31 0 0% 0% 14.29% 0%inFusion-JSpIRIT 60.37% 0% 50.00% 0% 31.64 0 20.00% 0% 100% 0%inFusion-PMD 71.30% 0% 66.67% 0% 24.69 0 33.33% 0% 100% 0%JDeodorant-JSpIRIT 5.46% 5.11% 0% 4.92% 8.79 0.81 0% 3.90% 26.67% 7.14%JDeodorant-PMD 3.39% 2.21% 0% 1.70% 5.31 0.84 0% 1.30% 13.33% 3.51%PMD-JSpIRIT 58.33% 30.83% 50.00% 33.33% 32.28 4.02 25.00% 25.00% 100% 33.33%
Feature Envy. In Table 4.15, for MobileMedia, the pair inFusion-JSpIRITfollows the same technique and has the highest OA of 14.08%. On the other hand,JDeodorant is the only tool based on a different technique, presenting lower averageswith inFusion (4.71%) and JSpIRIT (7.29%). However, in Health Watcher, we have theopposite situation. The pair inFusion-JSpIRIT has the lowest average OA of 0%, whileJDeodorant has higher average OAs with inFusion (1.11%) and JSpIRIT (7.87%). Ingeneral, the OAs for Feature Envy are lower when compared to the the OAs for GodClass and God Method. Therefore, the sets of methods reported as Feature Envy haveless methods in common than the sets reported as God Class or God Method.
Table 4.15: Occurrence agreement (OA) for Feature Envy between pairs of tools forMobileMedia (MM) and Health Watcher (HW).
Pairs of Tools Average Median SD Min Max
MM HW MM HW MM HW MM HW MM HW
inFusion-JDeodorant 4.71% 1.11% 0% 0% 6.12 2.34 0% 0% 16.67% 5.56%inFusion-JSpIRIT 14.08% 0% 11.11% 0% 10.58 0 0% 0% 33.33% 0%JDeodorant-JSpIRIT 7.29% 7.87% 5.00% 6.25% 7.66 4.62 0% 4.76% 16.67% 18.75%
4.7 Threats to Validity
This study compared four code smell detection tools, namely inFusion, JDeodorant,JSpIRIT, and PMD, selected from a list of 29 tools available for download reportedin a recent systematic literature review [Fernandes et al., 2016]. These tools were

52 Chapter 4. Comparative Study of Code Smell Detection Tools
selected mainly because they are available to download, their detection techniques areknown, they analyze Java systems, their results are easily recovered, and they detectat least two of the target code smells: God Class, God Method, or Feature Envy.Even though we analyzed a small set of tools, we believe that they are representativeof the tools available in the literature, since at least one of them uses metric-baseddetection techniques or static code analysis, the most common techniques implementedby detection tools. The other techniques analysis of software changes and search-basedapproaches have been studied in the literature [Palomba et al., 2013; Kessentini et al.,2010; Fontana et al., 2016; Ren et al., 2011], but to our knowledge, they have not beenimplemented in tools that are publicly available.
The selected detection tools were used to analyze two target systems, namelyMobileMedia and Health Watcher. MobileMedia is a small open source systemdeveloped by a small team with an academic focus. Similarly, Health Watcher isa real-life system, but we only had access to a small portion of the source code.Therefore, these systems might not be representative of the industrial practice and ourfindings might not be directly extended to real large scale projects. However, to reducethis risk we selected systems from different domains, Mobile (MobileMedia) and Web(Health Watcher), which were developed to incorporate nowadays technologies, suchas GUIs, persistence, distribution, concurrency, and recurrent maintenance scenariosof real software systems. Furthermore, these systems have been used and evaluated inprevious research work [Figueiredo et al., 2008; Macia et al., 2012; Soares et al., 2006;Kulesza et al., 2006; Greenwood et al., 2007].
We also selected these two systems because they have a comprehensible andfamiliar source code, allowing the experts to focus the analysis on code smellidentification instead of code comprehension. These characteristics were important toallow the compilation of the code smell reference list, an artifact required to analyze therecall and precision of detection tools. Larger systems are often more complex, whichwould make the manual analysis of the source code more difficult, and consequently,the code smell reference list more error-prone and less reliable. However, additionalinvestigation is necessary to determine if our findings can be generalized to othersystems and domains. Regarding the code smell reference lists, the manual detection ofcode smells is highly subjective and, therefore, it may vary from one expert to another.Even though this subjectivity can not be completely eliminated, we tried to reduceit by creating the code smell reference lists in well-defined stages and by discussingdivergences between experts to reach a consensus.

4.8. Final Remarks 53
4.8 Final Remarks
In this chapter, we compared the results of four code smell detection tools, namelyinFusion, JDeodorant, JSpIRIT, and PMD, to analyze MobileMedia and HealthWatcher in search of the following code smells: God Class, God Method, and FeatureEnvy. We analyzed the tools recall and precision in detecting the previous codesmells (RQ3) using the code smell reference lists (Section 3.2) in terms of recall andprecision. In addition, we calculated and compared the agreement of the tools results(RQ4), investigating variations in the percentage agreement and in the AC1 agreement,considering all tools simultaneously and in pairs. We also investigated variations inthe non-occurrence and occurrence agreement between pairs of tools.
In the next chapter, we present a replication of this comparative study in adifferent context by including industry-strength software systems from different sizesand domains, namely ANTLR, ArgoUML, JFreeChart, JSPWiki, and JUnit. Wecompare the four detection tools, namely inFusion, JDeodorant, JSpIRIT, and PMD,regarding their recall, precision, and agreement. For recall and precision, we use adifferent technique to create the code smells reference lists.

Chapter 5
Applying Code Smell DetectionTools in Open Source Projects
In the previous chapter, we compared different tools for detecting code smells usingtwo target systems, namely MobileMedia and Health Watcher. In order to generalizeour findings, we replicate the study of Chapter 4 using other open source systems. Inthis chapter, we compare the same four code smell detection tools, namely inFusion,JDeodorant, JSpIRIT, and PMD, concerning their analysis of five industry-strengthsoftware systems from different domains, namely ANTLR, ArgoUML, JFreeChart,JSPWiki, and JUnit. Section 5.1 introduces the target systems and a summary oftheir size metrics. Section 5.2 presents the research questions and introduces thesemi-automated code smell reference list. Section 5.3 summarizes the number of classesand methods reported by the tools as code smells. Section 5.4 analyzes the tools recalland precision in detecting code smells from the code smell reference lists. Section 5.5analyzes the percentage agreement among tools and between pairs of tools. Section5.6 analyzes the AC1 agreement among tools and between pairs of tools. Section 5.7analyzes the occurrence and non-occurrence agreement between pairs of tools. Section5.8 discusses the main threats to the validity of this study. Lastly, final remarks arediscussed in Section 5.9.
5.1 Target Systems
We selected five Java systems for this study, namely ANTLR, ArgoUML, JFreeChart,JSPWiki, and JUnit. We selected these target systems using the list of systemsprovided by the 2013 Qualitas Corpus [Tempero et al., 2010], since it contains wellknown open source projects used in other Software Engineering studies. Table 5.1
55

56Chapter 5. Applying Code Smell Detection Tools in Open Source
Projects
summarizes the number of Active and Inactive projects per Domain in Qualitas Corpus2013. For instance, the domain Tool has a total of 30 projects, of which 21 are activeand 9 are inactive. The Corpus contains a total of 112 systems from 11 domains, with 85active projects and 27 inactive. We sorted the domains by the number of active projectsand selected one system for each of the top five domains: Tools (21), Middleware (14),Testing (9), Diagram Generator/Data Visualization (8), Parser/Generators/Make (7).
We sorted the projects in each domain by ascending order of the number ofreleases and total lines of code. Finally, we selected one system from the top 5 domainswith: (i) the highest number of releases, (ii) available for download, and (iii) that couldbe imported as a project into the Eclipse IDE. For the first criteria, we selected projectswith more releases because the higher number of versions indicates that the systemsare actively maintained by developers, and used by the open source community. In thesecond criteria, we selected open source systems, i.e., systems for which the completesource code was available, because all tools analyze the source code to detect codesmells. Lastly, the tools JDeodorant and JSpIRIT are available only as Eclipse pluginsthat require compiled projects, not only the source code. Therefore, we needed projectsthat could be converted into an Eclipse project and built with all its dependencies.Due to this constraint, we selected only projects containing either a "build.xml" or a"pom.xml" file for building the project with the tool Ant or Maven.
Table 5.1: Number of projects per domain in Qualitas Corpus 2013.
Domain Active Inactive Total
Tool 21 9 30Middleware 14 5 19Testing 9 3 12Diagram Generator/Data Visualization 8 2 10Parsers/Generators/Make 7 2 9Database 7 1 8SDK 5 1 6IDE 5 0 5Programming Language 3 0 3Games 3 0 33D/Graphics/Media 3 4 7
Total 85 27 112
According to aforementioned criteria, we selected the following systems: ANTLR(Parsers/Generators/Make), ArgoUML (Diagram Generator/Data Visualization),JFreeChart (Tool), JSPWiki (Middleware), and JUnit (Testing). The first system,
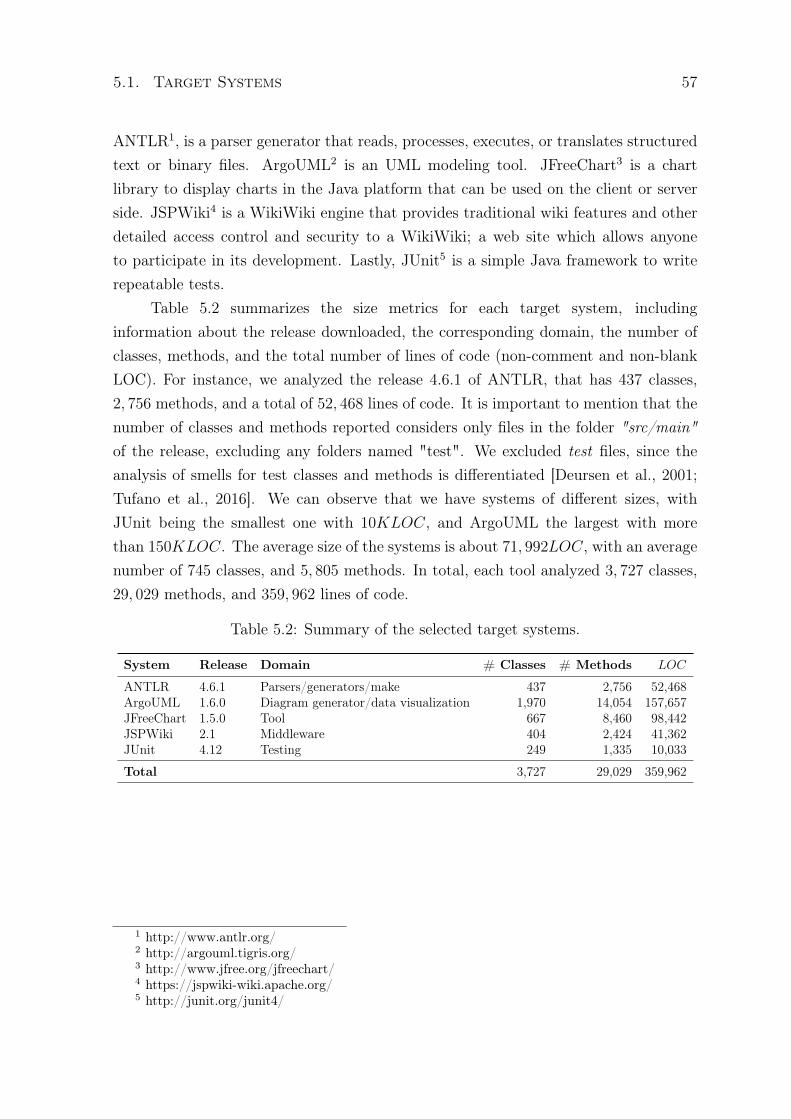
5.1. Target Systems 57
ANTLR1, is a parser generator that reads, processes, executes, or translates structuredtext or binary files. ArgoUML2 is an UML modeling tool. JFreeChart3 is a chartlibrary to display charts in the Java platform that can be used on the client or serverside. JSPWiki4 is a WikiWiki engine that provides traditional wiki features and otherdetailed access control and security to a WikiWiki; a web site which allows anyoneto participate in its development. Lastly, JUnit5 is a simple Java framework to writerepeatable tests.
Table 5.2 summarizes the size metrics for each target system, includinginformation about the release downloaded, the corresponding domain, the number ofclasses, methods, and the total number of lines of code (non-comment and non-blankLOC). For instance, we analyzed the release 4.6.1 of ANTLR, that has 437 classes,2, 756 methods, and a total of 52, 468 lines of code. It is important to mention that thenumber of classes and methods reported considers only files in the folder "src/main"of the release, excluding any folders named "test". We excluded test files, since theanalysis of smells for test classes and methods is differentiated [Deursen et al., 2001;Tufano et al., 2016]. We can observe that we have systems of different sizes, withJUnit being the smallest one with 10KLOC, and ArgoUML the largest with morethan 150KLOC. The average size of the systems is about 71, 992LOC, with an averagenumber of 745 classes, and 5, 805 methods. In total, each tool analyzed 3, 727 classes,29, 029 methods, and 359, 962 lines of code.
Table 5.2: Summary of the selected target systems.
System Release Domain # Classes # Methods LOC
ANTLR 4.6.1 Parsers/generators/make 437 2,756 52,468ArgoUML 1.6.0 Diagram generator/data visualization 1,970 14,054 157,657JFreeChart 1.5.0 Tool 667 8,460 98,442JSPWiki 2.1 Middleware 404 2,424 41,362JUnit 4.12 Testing 249 1,335 10,033
Total 3,727 29,029 359,962
1 http://www.antlr.org/2 http://argouml.tigris.org/3 http://www.jfree.org/jfreechart/4 https://jspwiki-wiki.apache.org/5 http://junit.org/junit4/

58Chapter 5. Applying Code Smell Detection Tools in Open Source
Projects
5.2 Study Settings
In this study, we replicate the comparison of the tools inFusion, JDeodorant, JSpIRIT,and PMD from Chapter 4. The purpose of this replication is to increase the confidenceof our results to generalize our findings. Therefore, we revisit RQ3 and RQ4 (Section4.1) using five target systems from different sizes and domains, namely ANTLR,ArgoUML, JFreeChart, JSPWiki, and JUnit.
• RQ3. What is the recall and precision of tools in identifying actual instances ofcode smells?
For RQ3, we measure the recall and precision of the tools in detecting the codesmells God Class, God Method, and Feature Envy. For this purpose, we compare thetools results with the code smell reference list, which contains the actual code smells ofa given target system. The main difference from the previous chapter is that the codesmell reference list is not created manually, but automatically using the tools reports.The complete protocol for creating the reference list is explained below.
• RQ4. What is the level of agreement between different tools?
Since different tools can report different classes and methods as code smells, wemeasure the level of agreement between detection tools when classifying a class ormethod as smelly or non-smelly. We calculate the percentage agreement and the AC1
agreement between all tools and pairs of tools. We also calculate the non-occurrenceagreement and the occurrence agreement between pairs of tools.
In order to answer RQ3 and RQ4, we used the tools to analyze the source codeof all five target systems. The tools were executed with default settings to detect GodClass, God Method, and Feature Envy. The reported classes and methods were usedto create the code smell reference lists and to calculate the tools recall, precision, andagreement. The process of creating the code smell reference list is detailed below.
Code Smell Reference List. This list is a document containing the fullyqualified names of classes and methods affected by at least one of the code smells weinvestigate: God Class, God Method, or Feature Envy. Each system has its own list,indicating the classes and methods affected by each code smell. In Chapter 4, the codesmell reference lists of MobileMedia and Health Watcher were created by manuallyanalyzing the source code of all versions of both systems (Section 4.1). However, inthis study, the manual analysis of the source code was unfeasible.

5.2. Study Settings 59
The systems analyzed in this chapter are larger and more complex thanMobileMedia and Health Watcher. Furthermore, we had no familiarity with theirsource code. Attempting to manually analyze the source code without sufficientknowledge of the systems could be disastrous, i.e., we could wrongly classify everysingle entry in the reference list. Considering these factors, we realized we could notmanually create a reliable code smell reference list. Therefore, we proposed a differentapproach. Since the reports of all tools were already available, we decided to use avoting system in the creation of the code smell reference list.
The voting system allows the tools to cast a single vote for every class or methodof a system. The votes are mapped from the tools reports. That is, if a class or methodis not present in the report, than the vote is that it is non-smelly. On the other hand,if the class or method is present in the report, the vote is that it is smelly = {god class,god method, feature envy}. This voting process is performed individually for each codesmell, considering only one smell at a time. Therefore, it is repeated for God Class,God Method, and Feature Envy. In Table 5.3, we have a sample of the voting systemfor God Class containing five classes of the system ANTLR. For instance, for the classLeftRecursionDetector, inFusion, JSpIRIT, and PMD vote that it is non-smelly,while JDeodorant votes that it is god class. Therefore, for this class we have a totalof 3 votes for non-smelly and 1 vote for god class. We decided to include a class ormethod in the reference list of a given code smell, when the total number of smellyvotes is n ≥ 2. As a result, the God Class code smell reference list of ANTLR containsthe following three classes from Table 5.3: PredictionMode, AttributeChecks, andCodeGenerator.
Table 5.3: Sample of votes for God Classes in ANTLR.
Classes inFusion JDeodorant JSpIRIT PMD Total Votes
Non-Smelly God Class
ParseTreeVisitor non-smelly non-smelly non-smelly non-smelly 4 0LeftRecursionDetector non-smelly god class non-smelly non-smelly 3 1PredictionMode god class non-smelly non-smelly god class 2 2AttributeChecks god class non-smelly god class god class 1 3CodeGenerator god class god class god class god class 0 4
In short, the code smell reference list of a system contains code smells that wereclassified as such by at least two different tools. We selected the minimum value ofvotes as n = 2 to obtain a balanced reference list. Selecting n = 0 would bloat the list,that would contain every class or method absent in every tool report. Therefore, alltools would have zero recall and precision. Selecting n = 1 would completely includeall the results of every tool, favoring the recall and precision of tools that report higher
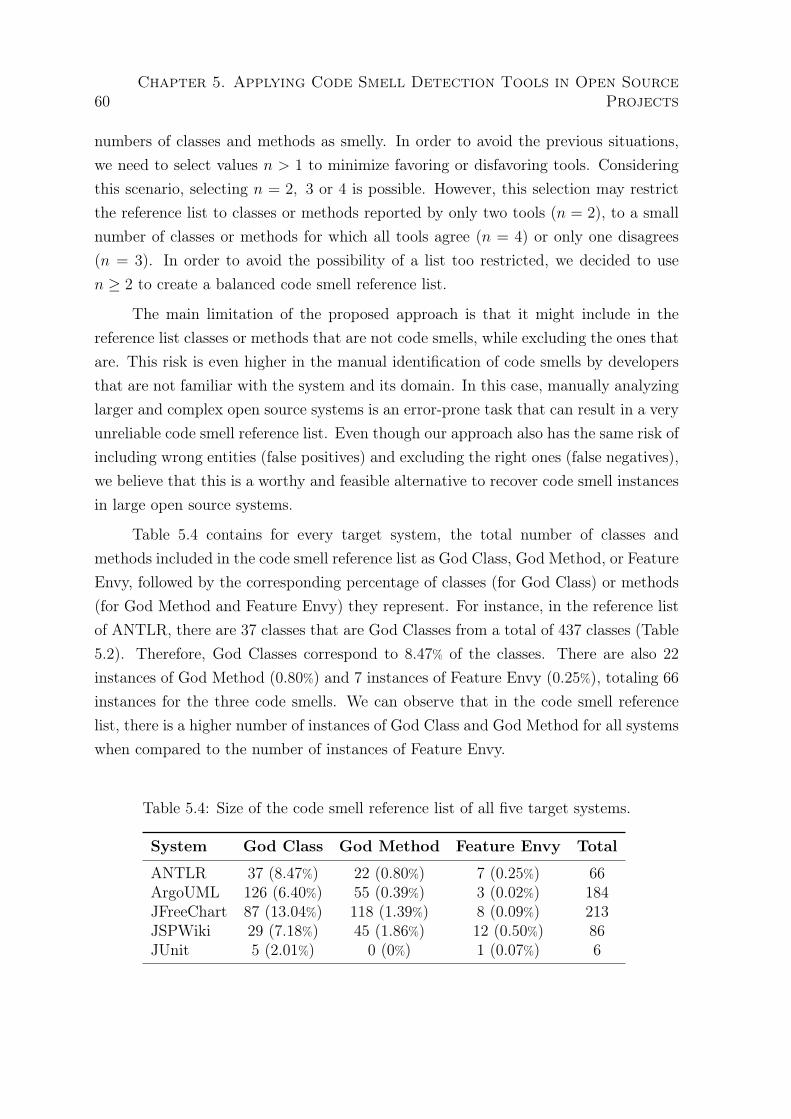
60Chapter 5. Applying Code Smell Detection Tools in Open Source
Projects
numbers of classes and methods as smelly. In order to avoid the previous situations,we need to select values n > 1 to minimize favoring or disfavoring tools. Consideringthis scenario, selecting n = 2, 3 or 4 is possible. However, this selection may restrictthe reference list to classes or methods reported by only two tools (n = 2), to a smallnumber of classes or methods for which all tools agree (n = 4) or only one disagrees(n = 3). In order to avoid the possibility of a list too restricted, we decided to usen ≥ 2 to create a balanced code smell reference list.
The main limitation of the proposed approach is that it might include in thereference list classes or methods that are not code smells, while excluding the ones thatare. This risk is even higher in the manual identification of code smells by developersthat are not familiar with the system and its domain. In this case, manually analyzinglarger and complex open source systems is an error-prone task that can result in a veryunreliable code smell reference list. Even though our approach also has the same risk ofincluding wrong entities (false positives) and excluding the right ones (false negatives),we believe that this is a worthy and feasible alternative to recover code smell instancesin large open source systems.
Table 5.4 contains for every target system, the total number of classes andmethods included in the code smell reference list as God Class, God Method, or FeatureEnvy, followed by the corresponding percentage of classes (for God Class) or methods(for God Method and Feature Envy) they represent. For instance, in the reference listof ANTLR, there are 37 classes that are God Classes from a total of 437 classes (Table5.2). Therefore, God Classes correspond to 8.47% of the classes. There are also 22
instances of God Method (0.80%) and 7 instances of Feature Envy (0.25%), totaling 66
instances for the three code smells. We can observe that in the code smell referencelist, there is a higher number of instances of God Class and God Method for all systemswhen compared to the number of instances of Feature Envy.
Table 5.4: Size of the code smell reference list of all five target systems.
System God Class God Method Feature Envy Total
ANTLR 37 (8.47%) 22 (0.80%) 7 (0.25%) 66ArgoUML 126 (6.40%) 55 (0.39%) 3 (0.02%) 184JFreeChart 87 (13.04%) 118 (1.39%) 8 (0.09%) 213JSPWiki 29 (7.18%) 45 (1.86%) 12 (0.50%) 86JUnit 5 (2.01%) 0 (0%) 1 (0.07%) 6
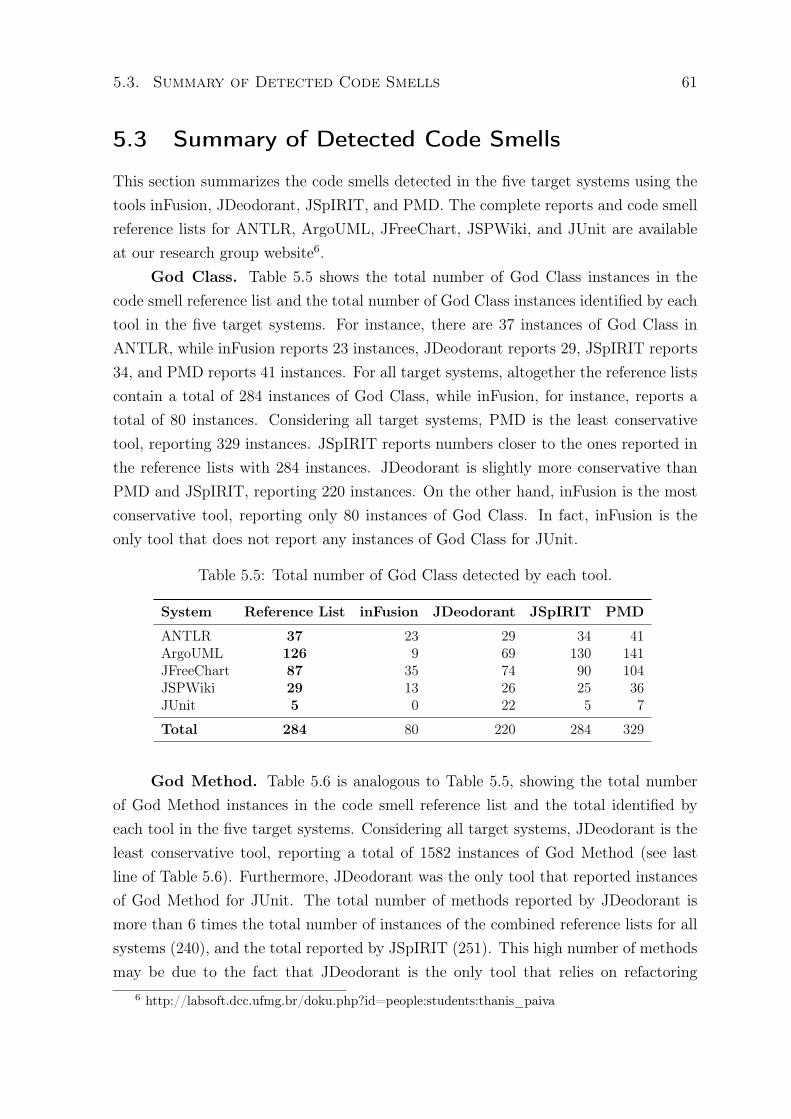
5.3. Summary of Detected Code Smells 61
5.3 Summary of Detected Code Smells
This section summarizes the code smells detected in the five target systems using thetools inFusion, JDeodorant, JSpIRIT, and PMD. The complete reports and code smellreference lists for ANTLR, ArgoUML, JFreeChart, JSPWiki, and JUnit are availableat our research group website6.
God Class. Table 5.5 shows the total number of God Class instances in thecode smell reference list and the total number of God Class instances identified by eachtool in the five target systems. For instance, there are 37 instances of God Class inANTLR, while inFusion reports 23 instances, JDeodorant reports 29, JSpIRIT reports34, and PMD reports 41 instances. For all target systems, altogether the reference listscontain a total of 284 instances of God Class, while inFusion, for instance, reports atotal of 80 instances. Considering all target systems, PMD is the least conservativetool, reporting 329 instances. JSpIRIT reports numbers closer to the ones reported inthe reference lists with 284 instances. JDeodorant is slightly more conservative thanPMD and JSpIRIT, reporting 220 instances. On the other hand, inFusion is the mostconservative tool, reporting only 80 instances of God Class. In fact, inFusion is theonly tool that does not report any instances of God Class for JUnit.
Table 5.5: Total number of God Class detected by each tool.
System Reference List inFusion JDeodorant JSpIRIT PMD
ANTLR 37 23 29 34 41ArgoUML 126 9 69 130 141JFreeChart 87 35 74 90 104JSPWiki 29 13 26 25 36JUnit 5 0 22 5 7
Total 284 80 220 284 329
God Method. Table 5.6 is analogous to Table 5.5, showing the total numberof God Method instances in the code smell reference list and the total identified byeach tool in the five target systems. Considering all target systems, JDeodorant is theleast conservative tool, reporting a total of 1582 instances of God Method (see lastline of Table 5.6). Furthermore, JDeodorant was the only tool that reported instancesof God Method for JUnit. The total number of methods reported by JDeodorant ismore than 6 times the total number of instances of the combined reference lists for allsystems (240), and the total reported by JSpIRIT (251). This high number of methodsmay be due to the fact that JDeodorant is the only tool that relies on refactoring
6 http://labsoft.dcc.ufmg.br/doku.php?id=people:students:thanis_paiva

62Chapter 5. Applying Code Smell Detection Tools in Open Source
Projects
opportunities to detect God Method. JSpIRIT is the second less conservative tool,reporting 11 instances more than the combined reference lists (240). inFusion is slightlymore conservative than JSpIRIT, reporting 207 instances, while PMD is the mostconservative, reporting 190 instances.
Table 5.6: Total number of God Method detected by each tool.
System Reference List inFusion JDeodorant JSpIRIT PMD
ANTLR 22 15 271 21 13ArgoUML 55 52 211 89 52JFreeChart 118 98 737 109 87JSPWiki 45 42 302 32 38JUnit 0 0 61 0 0
Total 240 207 1582 251 190
Feature Envy. Table 5.7 is similar to Tables 5.5 and 5.6, showing the totalnumber of Feature Envy instances in the code smell reference list and the total identifiedby each tool in the five target systems. PMD is not shown in Table 5.7 because itdoes not detect Feature Envy. Considering all target systems, JSpIRIT is the leastconservative tool, reporting a total of 1506 instances of Feature Envy. This value ismore than 48 times the total number of instances of the reference lists for all systems(31), and it is more than 11 times the total reported by JDeodorant (131). JSpIRITis actually the second less conservative tool, reporting 131 instances, while inFusionreports 21, the lowest number. However, inFusion is the closest to the combined totalof the reference lists (31), reporting 21 instances. That is, it only reports 10 instancesless than the reference lists. Therefore, inFusion is the most conservative tool.
Table 5.7: Total number of Feature Envy detected by each tool.
System Reference List inFusion JDeodorant JSpIRIT
ANTLR 7 6 34 146ArgoUML 3 2 19 925JFreeChart 8 9 32 236JSPWiki 12 4 28 169JUnit 1 0 18 30
Total 31 21 131 1506

5.4. Analysis of Recall and Precision 63
5.4 Analysis of Recall and Precision
This section aims to answer the research question RQ3 that investigates the recall andprecision of tools in detecting instances from the code smell reference lists (see Section4.3). We calculated recall and precision using the semi-automated code smell referencelists of the five target systems.
Tables 5.8, 5.9, and 5.10 summarize the recall (R) and precision (P) achievedby inFusion, JDeodorant, JSpIRIT, and PMD for each target system. The last lineof the tables contain the average recall and precision of each tool. For instance, inTable 5.8, inFusion has a recall of 62.16% and a precision of 100% in ANTLR. However,inFusion has an average recall and precision of 30.87% and 100% (see last line of Table5.8), respectively. Furthermore, "undef." means undefined, indicating that the recallor precision could not be calculated for that particular target system, while PMD isnot shown in Table 5.10 because it does not detect Feature Envy. The tools recall andprecision in detecting the code smells God Class, God Method, and Feature Envy arediscussed in the following.
God Class. In Table 5.8, we observed that JSpIRIT and PMD have high averagerecall and high average precision. The average recall and precision for PMD is 98.37%and 81.68%, while for JSpIRIT is 86.14% and 88.75%. The main difference betweenthese tools is that the recall of PMD is always higher than the recall of JSpIRIT for allsystems, while the precision of JSpIRIT is always higher than the precision of PMD.This similarity was expected, since JSpIRIT and PMD follow variations of the samedetection strategy. On the other hand, PMD and JSpIRIT have an overall betterrecall and precision than inFusion and JDeodorant. inFusion has the lowest averagerecall, meaning that many smelly classes are not reported. Nevertheless, inFusion isthe only tool that has a 100% precision for all systems, except for JUnit (precisionis undefined because no instances of God Class were found). Although inFusion hasthe highest precision of all tools, it also has the lowest average recall. Therefore, thedifferences between the recall and precision values are greater for inFusion than forPMD and JSpIRIT, that have a smaller difference between the values of recall andprecision, even though inFusion also follows a variation of the same detection strategy.On the contrary, JDeodorant is the only tool that uses a completely different detectiontechnique and has the lowest average precision of 50.3%, reporting many false positives,while the average recall of 45.89% is the second lowest.
God Method. In Table 5.9, we observed that JSpIRIT and inFusion have highaverage recall and high average precision. The average recall and precision for JSpIRITis 82.25% and 82.95%, while for inFusion is 77.36% and 90.14%. The main difference

64Chapter 5. Applying Code Smell Detection Tools in Open Source
Projects
Table 5.8: Recall and precision of God Class for each target system.
System inFusion JDeodorant JSpIRIT PMD
R P R P R P R P
ANTLR 62.16% 100% 45.95% 58.62% 86.49% 94.12% 100% 90.24%ArgoUML 7.14% 100% 28.57% 52.17% 95.24% 92.31% 97.62% 87.23%JFreeChart 40.23% 100% 56.32% 66.22% 96.55% 93.33% 97.7% 81.73%JSPWiki 44.83% 100% 58.62% 65.38% 72.41% 84.00% 96.55% 77.78%JUnit 0% undef. 40.00% 9.09% 80.00% 80.00% 100% 71.43%
Average 30.87% 100% 45.89% 50.30% 86.14% 88.75% 98.37% 81.68%
between them is that considering all tools, JSpIRIT has the highest average recall,while inFusion has the highest average precision. This similarity was expected, sinceJSpIRIT and inFusion follow variations of the same detection strategy. On the otherhand, PMD has a high average precision of 87.25%, but a lower average recall of 67.19%.Therefore, the average recall and precision of PMD similar to the averages of inFusion.This indicates that even though PMD uses a different detection technique, it stillcreates results more similar to the detection technique of inFusion than of JDeodorant.JDeodorant also uses a different detection technique that results in the same averagerecall of PMD. However, also has the lowest average precision. Actually, JDeodoranthas very low precision values for all systems, ranging from 0% to 15.06%. Therefore,JDeodorant reports many false positives, like it did for God Class. In fact, JDeodorantis the only tool that reports instances of God Method in JUnit, while the other toolsreported none.
Table 5.9: Recall and precision of God Method for each target system.
System inFusion JDeodorant JSpIRIT PMD
R P R P R P R P
ANTLR 63.64% 87.5% 81.82% 6.64% 86.36% 90.48% 54.55% 92.31%ArgoUML 80% 84.62% 14.55% 3.79% 90.91% 56.18% 67.27% 71.15%JFreeChart 81.36% 97.96% 94.07% 15.06% 87.29% 94.5% 66.95% 90.8%JSPWiki 84.44% 90.48% 77.78% 11.59% 64.44% 90.63% 80% 94.74%JUnit undef. undef. undef. 0% undef. undef. undef. undef.
Average 77.36% 90.14% 67.06% 7.42% 82.25% 82.95% 67.19% 87.25%
Feature Envy. In Table 5.10, we observe that JDeodorant has high averagerecall and precision, of 95.48% and 20.66%, respectively. In fact, JDeodorant is theonly tool that uses a different detection technique and it has the highest averageprecision of the three tools. On the other hand, despite following variations of the samedetection strategy, JSpIRIT and inFusion have more different results. JSpIRIT has

5.5. Analysis of Percentage Agreement 65
the highest average recall of 97.14% and the highest recall values for all target systems.However, JSpIRIT also has the lowest average precision of 3.65%, indicating that manynon-smelly instances are wrongly reported. On the contrary, inFusion has a precisionsimilar to JDeodorant of 18.75%, but is also has the worst average recall of 10.24%.Therefore, there is a higher number of smelly instances that are not reported. In fact,inFusion has the lowest recall values for all systems. Interestingly, even though JSpIRITand inFusion are based on the same detection strategy, they have either an averagerecall or an average precision closer to the corresponding averages of JDeodorant thanto each other. That is the case for the average recall for JSpIRIT and the averageprecision for inFusion. Overall, the average recall and average precision for FeatureEnvy are actually lower in comparison to the averages for God Class (Table 5.8) andGod Method (Table 5.9). The lower values for Feature Envy can be interpreted asan indication that the detection techniques for Feature Envy produce more conflictingreports than the detection techniques for the other two code smells.
Table 5.10: Recall and precision of Feature Envy for each target systems.
System inFusion JDeodorant JSpIRIT
R P R P R P
ANTLR 42.86% 50.00% 85.71% 17.65% 85.71% 4.11%ArgoUML 0% 0% 100% 15.79% 100% 0.32%JFreeChart 0% 0% 100% 25.00% 100% 3.39%JSPWiki 8.33% 25.00% 91.67% 39.29% 100% 7.10%JUnit 0% undef. 100% 5.56% 100% 3.33%
Average 10.24% 18.75% 95.48% 20.66% 97.14% 3.65%
5.5 Analysis of Percentage Agreement
This section aims to answer RQ4. That is, it investigates the agreement between toolswhen applied to the same software systems. We calculate the percentage agreement(see Section 4.4) between all tools simultaneously and in pairs considering the fivetarget systems.
Percentage agreement. Table 5.11 summarizes the results for percentageagreement considering the agreement among all tools simultaneously for each of the fivetarget systems. The only exception is PMD, excluded in the calculation for FeatureEnvy since it does not detect this code smell. The average percentage agreementfor each code smell is reported in the last line. For instance, in ANTLR, inFusionhas a percentage agreement of 94.24% for God Class and 94.99% for God Method.

66Chapter 5. Applying Code Smell Detection Tools in Open Source
Projects
We can observe that the percentage agreement is good for all systems, with valuesgreater than 90% for the three code smells, God Class, God Method, and FeatureEnvy. Considering the average percentage agreement, God Class has the lowest averageof 93.43%, while for God Method and Feature Envy the averages are practically thesame and higher of 96.20% and 97.20%. The lower average percentage agreement forGod Class indicates that there is more disagreement between tools and, therefore, thereports of the detection techniques are more different than the reports produced forGod Method and Feature Envy by the same tools.
Table 5.11: Percentage agreement considering inFusion, JDeodorant, JSpIRIT, andPMD.
System God Class God Method *Feature Envy
ANTLR 94.24% 94.99% 96.73%ArgoUML 94.51% 98.83% 96.65%JFreeChart 90.48% 95.83% 98.39%JSPWiki 93.81% 93.61% 96.02%JUnit 94.11% 97.72% 98.23%
Average 93.43% 96.20% 97.20%
*PMD is excluded since it does not detect Feature Envy.
Percentage agreement between pairs of tools. The percentage agreementwas also calculated considering the agreement between pairs of tools for all five targetsystems. In general, for all systems, the percentage agreement between pairs of toolswas either adequate, with values above 80% or good with values above 90%. In fact,the lowest percentage agreement is for God Class, with the value of 87.41% for the pairJDeodorant-PMD. Tables 5.12, 5.13, and 5.14 summarize the percentage agreementcalculated between each pair of tools for each target system. The average percentageagreement is also presented in the last line. For instance, in Table 5.12, the averageagreement for God Class between the pair inFusion-JDeodorant is 92.46%, while for thepair inFusion-JSpIRIT is 94.82%. In the following discussion, we analyze the agreementfor each code smell individually, considering all target systems simultaneously.
God Class. In Table 5.12, we can observe that all pairs have a goodaverage percentage agreement. The pairs PMD-JSpIRIT, inFusion-PMD, andinFusion-JSpIRIT have the highest averages, as expected, since they are based onthe same detection strategy. On the other hand, the lowest average agreements occurin pairs with JDeodorant, the only tool that follows a completely different detectiontechnique. However, the differences are small, since all averages are good (> 90%).

5.5. Analysis of Percentage Agreement 67
Table 5.12: Percentage agreement for God Class between pairs of tools.
System inFusion inFusion inFusion JDeodorant JDeodorant PMDJDeodorant JSpIRIT PMD JSpIRIT PMD JSpIRIT
ANTLR 92.22% 95.65% 95.88% 92.45% 91.76% 97.48%ArgoUML 96.24% 93.76% 93.10% 93.05% 92.79% 98.12%JFreeChart 89.36% 91.15% 89.66% 89.81% 87.41% 95.50%JSPWiki 93.32% 95.54% 94.31% 92.33% 92.57% 94.80%JUnit 91.16% 97.99% 97.19% 89.96% 89.96% 98.39%
Average 92.46% 94.82% 94.03% 91.52% 90.90% 96.86%
God Method. In Table 5.12, we can observe that all pairs have a goodaverage percentage agreement. Just like in God Class, the pairs PMD-JSpIRIT,inFusion-PMD, and inFusion-JSpIRIT have the highest averages. However, PMD hasa different detection technique, while inFusion and JSpIRIT follow variations of thesame technique. Despite the use of different techniques, the average agreement is stillhigh. Once more, the lowest average agreements occur in pairs with JDeodorant, theonly tool that follows a completely different detection technique. However, we alsobelieve these differences are small for God Method, like they were for God Class forthe same reason: all average percentage agreements are good.
Table 5.13: Percentage agreement for God Method between pairs of tools.
System inFusion inFusion inFusion JDeodorant JDeodorant PMDJDeodorant JSpIRIT PMD JSpIRIT PMD JSpIRIT
ANTLR 90.31% 99.53% 99.67% 90.57% 90.35% 99.49%ArgoUML 98.20% 99.55% 99.67% 97.96% 98.13% 99.47%JFreeChart 92.26% 99.47% 99.61% 92.34% 91.99% 99.29%JSPWiki 88.20% 98.76% 99.34% 88.12% 88.12% 99.09%JUnit 95.43% 100% 100% 95.43% 95.43% 100%
Average 92.88% 99.46% 99.66% 92.88% 92.80% 99.47%
Feature Envy. In Table 5.14, PMD is not shown because it does not detectFeature Envy. We can observe that the pair inFusion-JDeodorant has the highestaverage agreement (99.08%), followed by the pairs inFusion-JSpIRIT (95.17%), andJDeodorant-JSpIRIT (94.70%). Interestingly, unlike for God Class and God Method,for Feature Envy the pair with JDeodorant has the highest average agreement,even though inFusion and JDeodorant follow different detection techniques. Thepairs inFusion-JSpIRIT and JDeodorant-JSpIRIT have practically the same averagepercentage agreement. The first follow the same detection technique, while the latterdoes not. However, like for God Class and God Method, the differences are small andall averages are also good.

68Chapter 5. Applying Code Smell Detection Tools in Open Source
Projects
Table 5.14: Percentage agreement for Feature Envy between pairs of tools.
System inFusion inFusion JDeodorantJDeodorant JSpIRIT JSpIRIT
ANTLR 98.69% 94.63% 93.83%ArgoUML 99.85% 93.41% 93.33%JFreeChart 99.52% 97.10% 97.02%JSPWiki 98.68% 92.95% 92.78%JUnit 98.65% 97.75% 96.55%
Average 99.08% 95.17% 94.70%
5.6 Analysis of AC1 Agreement
Similar to the analysis in Section 5.5, this section aims to answer RQ4, using a differentmeasurement. That is, it investigates the level of agreement between tools when appliedto the same software system using the AC1 statistic [Gwet, 2014] (Section 4.5), whichadjusts the percentage agreement probability for chance agreement. We calculated theAC1 agreement considering all four tools simultaneously and between pairs of tools.Table 5.15 shows the AC1 agreement measured with a 95% confidence interval (CI)for each code smell considering the agreement among all tools. For instance, all toolshave an AC1 agreement of 0.933 for ANTLR for God Class, while they have an AC1 of0.947 for God Method. For all smells and target systems, the AC1 agreement is "VeryGood", according to Altman’s benchmark scale for Kappa [McCray, 2013; Altman,1991]. This result is compatible with the high agreement found for the percentageagreement considering the fours tools.
Table 5.15: AC1 statistic considering inFusion, JDeodorant, JSpIRIT, and PMD.
System God Class God Method Feature Envy
AC1 CI AC1 CI AC1 CI
ANTLR 0.933 [0.913, 0.954] 0.947 [0.941, 0.953] 0.966 [0.961, 0.971]ArgoUML 0.940 [0.931, 0.949] 0.988 [0.987, 0.989] 0.965 [0.963, 0.968]JFreeChart 0.881 [0.858, 0.904] 0.956 [0.952, 0.959] 0.984 [0.982, 0.986]JSPWiki 0.930 [0.909, 0.951] 0.930 [0.923, 0.938] 0.959 [0.953, 0.964]JUnit 0.937 [0.913, 0.961] 0.977 [0.971, 0.982] 0.982 [0.977, 0.987]
AC1 statistic between pairs of tools. The AC1 was also calculated consideringpairs of tools with a 95% confidence interval. Tables 5.16, 5.17, and 5.18 summarizethe AC1 agreement between pairs of tools for all five target systems and the smellsGod Class, God Method, and Feature Envy. For instance, for ANTLR, the pairinFusion-JDeodorant for God Class (Table 5.16) has an AC1 of 0.912 that equals

5.6. Analysis of AC1 Agreement 69
"Very Good" with a confidence interval of [0.882, 0.943]. Pairs with PMD are notshown in Table 5.18 because PMD does not detect Feature Envy. We observed thatfor all three code smells, all pairs of tools, and for all five target systems we havean AC1 that is "Very Good" (> 0.81). Furthermore, the confidence intervals arenarrow, which increases the reliability of AC1. This fact supports our analysis ofthe percentage agreement between pairs of tools, confirming that there is in fact ahigh agreement between the pairs of tools for all code smells, even after consideringthe chance agreement. Therefore, the observations made for the percentage agreementbetween pairs of tools (Section 5.5) are also valid for the average AC1 agreement of thissection. In order to avoid repetition, we summarize a few of the main observations. ForGod Class, pairs with the same detection strategy have a higher agreement than pairswith JDeodorant, the only tool that follows a different detection technique. For GodMethod, the tools inFusion, JSpIRIT, and PMD form pairs with higher agreement whencompared to JDeodorant, even though PMD also uses a different detection technique.Finally, for Feature Envy, the pair with the highest agreement is inFusion-JDeodorant,despite using different detection techniques. However, the variations in AC1 are smalland the values are always Very Good.
Table 5.16: AC1 statistic for God Class between pairs of tools.
SysteminFusion inFusion inFusion JDeodorant JDeodorant PMD
JDeodorant JSpIRIT PMD JSpIRIT PMD JSpIRIT
AC1 CI AC1 CI AC1 CI AC1 CI AC1 CI AC1 CI
ANTLR 0.912 [0.882, 0.943] 0.950 [0.928, 0.973] 0.952 [0.930, 0.975] 0.913 [0.882, 0.944] 0.903 [0.871, 0.936] 0.970 [0.952, 0.988]ArgoUML 0.961 [0.952, 0.970] 0.933 [0.921, 0.945] 0.926 [0.913, 0.938] 0.923 [0.910, 0.936] 0.920 [0.906, 0.933] 0.978 [0.971, 0.985]JFreeChart 0.875 [0.844, 0.905] 0.893 [0.865, 0.922] 0.873 [0.842, 0.904] 0.870 [0.838, 0.902] 0.836 [0.800, 0.873] 0.940 [0.918, 0.962]JSPWiki 0.926 [0.898, 0.955] 0.951 [0.928, 0.974] 0.936 [0.909, 0.963] 0.913 [0.881, 0.945] 0.913 [0.881, 0.946] 0.940 [0.913, 0.966]JUnit 0.903 [0.861, 0.946] 0.980 [0.961, 0.998] 0.971 [0.949, 0.993] 0.888 [0.842, 0.934] 0.887 [0.841, 0.934] 0.983 [0.966, 1.000]
Average 0.915 0.941 0.932 0.901 0.892 0.962
Table 5.17: AC1 statistic for God Method between pairs of tools.
SysteminFusion inFusion inFusion JDeodorant JDeodorant PMD
JDeodorant JSpIRIT PMD JSpIRIT PMD JSpIRIT
AC1 CI AC1 CI AC1 CI AC1 CI AC1 CI AC1 CI
ANTLR 0.893 [0.879, 0.906] 0.995 [0.993, 0.998] 0.997 [0.995, 0.999] 0.895 [0.882, 0.908] 0.893 [0.880, 0.906] 0.995 [0.992, 0.998]ArgoUML 0.982 [0.979, 0.984] 0.995 [0.994, 0.997] 0.997 [0.996, 0.998] 0.979 [0.977, 0.982] 0.981 [0.979, 0.983] 0.995 [0.993, 0.996]JFreeChart 0.915 [0.908, 0.921] 0.995 [0.993, 0.996] 0.996 [0.995, 0.997] 0.915 [0.909, 0.922] 0.912 [0.905, 0.919] 0.993 [0.991, 0.995]JSPWiki 0.864 [0.848, 0.881] 0.987 [0.983, 0.992] 0.993 [0.990, 0.997] 0.864 [0.847, 0.880] 0.863 [0.847, 0.880] 0.991 [0.987, 0.995]JUnit 0.952 [0.940, 0.964] 1.000 [1.000, 1.000] 1.000 [1.000, 1.000] 0.952 [0.940, 0.964] 0.952 [0.940, 0.964] 1.000 [1.000, 1.000]
Average 0.921 0.994 0.997 0.921 0.920 0.995

70Chapter 5. Applying Code Smell Detection Tools in Open Source
Projects
Table 5.18: AC1 statistic for Feature Envy between pairs of tools.
SysteminFusion inFusion JDeodorant
JDeodorant JSpIRIT JSpIRIT
AC1 CI AC1 CI AC1 CI
ANTLR 0.987 [0.982, 0.991] 0.943 [0.934, 0.953] 0.934 [0.924, 0.944]ArgoUML 0.999 [0.998, 0.999] 0.930 [0.925, 0.934] 0.929 [0.924, 0.933]JFreeChart 0.995 [0.994, 0.997] 0.970 [0.966, 0.974] 0.969 [0.965, 0.973]JSPWiki 0.987 [0.982, 0.991] 0.924 [0.913, 0.936] 0.922 [0.910, 0.934]JUnit 0.986 [0.980, 0.993] 0.977 [0.969, 0.985] 0.964 [0.954, 0.975]
Average 0.991 0.949 0.944
5.7 Analysis of Non-Occurrence and Occurrence
Agreements
This section aims to answer RQ4, by differentiating the agreement between pairs oftools. In the previous sections, we investigated the agreement between tools consideringthe percentage agreement (Section 5.5) and the AC1 agreement (Section 5.6). However,similarly to the study in Chapter 4, we believe that the high agreement is due toa high agreement between tool when a class or method is non-smelly (Section 4.6).Therefore, in the following sections, we discuss the non-occurrence agreement (NOA)and occurrence agreement (OA) (Section 4.6) between pairs of tools for all five targetsystems.
5.7.1 Non-Occurrence Agreement
Tables 5.19 to 5.24 summarize the non-occurrence agreement (NOA) for each codesmell and their average values for each pair of tools For instance, in Table 5.19, forANTLR, the pair inFusion-JDeodorant has a NOA of 92.06% and an average NOA of92.34%, considering all five target systems. Pairs with PMD are not shown in Table5.21 because PMD does not detect Feature Envy. We discuss the NOA for each codesmell in the following, considering the same ranges for percentage agreement (Section4.4).
God Class. In Table 5.19, the pairs PMD-JSpIRIT, inFusion-JSpIRIT, andinFusion-PMD are based on the same detection strategy and have the highest and goodaverage NOAs, varying from 93.89% to 96.65%. JDeodorant is the only tool that followsa different detection technique, presenting lower average NOAs with the other tools,varying from 90.60% to 92.34%. Nevertheless, despite these small differences, all pairshave good average NOAs.
God Method. In Table 5.20, the pairs inFusion-PMD, PMD-JSpIRIT, andinFusion-JSpIRIT have the highest average NOAs, all over 99%, even though PMD

5.7. Analysis of Non-Occurrence and Occurrence Agreements 71
Table 5.19: Non-occurrence agreement (NOA) for God Class between pairs of tools.
System inFusion inFusion inFusion JDeodorant JDeodorant PMDJDeodorant JSpIRIT PMD JSpIRIT PMD JSpIRIT
ANTLR 92.06% 95.45% 95.65% 92.18% 91.43% 97.28%ArgoUML 96.24% 93.73% 93.07% 92.93% 92.67% 98.00%JFreeChart 89.04% 90.85% 89.40% 89.18% 86.77% 95.05%JSPWiki 93.22% 95.43% 94.12% 92.13% 92.27% 94.53%JUnit 91.16% 97.99% 97.19% 89.92% 89.88% 98.37%
Average 92.34% 94.69% 93.89% 91.27% 90.60% 96.65%
is the only of the three that follows a different detection technique. JDeodorant alsofollows a different technique. However, JDeodorant has lower average NOAs with theother tools, like it had for God Class. For God Method, pairs with JDeodorant haveNOAs around 92%. Nevertheless, the average NOA between all pairs of tools is good(>90%), despite differences in the detection techniques.
Table 5.20: Non-occurrence agreement (NOA) for God Method between pairs of tools.
System inFusion inFusion inFusion JDeodorant JDeodorant PMDJDeodorant JSpIRIT PMD JSpIRIT PMD JSpIRIT
ANTLR 90.28% 99.53% 99.67% 90.51% 90.32% 99.49%ArgoUML 98.20% 99.55% 99.67% 97.96% 98.13% 99.47%JFreeChart 92.17% 99.46% 99.61% 92.25% 91.92% 99.29%JSPWiki 88.05% 98.75% 99.33% 88.00% 87.98% 99.08%JUnit 95.43% 100% 100% 95.43% 95.43% 100%
Average 92.83% 99.46% 99.66% 92.83% 92.76% 99.47%
Feature Envy. In Table 5.21, the pair inFusion-JDeodorant has thehighest average NOA (99.08%), followed by inFusion-JSpIRIT (95.17%), andJDeodorant-JSpIRIT (94.69). Like in God Method, inFusion and JDeodorant followdifferent detection techniques and classify more methods as non-smelly than the pairinFusion-JSpIRIT, that follows similar techniques. However, overall, the average NOAbetween all pairs is good, like it was for God Class and God Method.
Table 5.21: Non-occurrence agreement (NOA) for Feature Envy between pairs of tools.
System inFusion inFusion JDeodorantJDeodorant JSpIRIT JSpIRIT
ANTLR 98.69% 94.63% 93.82%ArgoUML 99.85% 93.41% 93.33%JFreeChart 99.52% 97.10% 97.02%JSPWiki 98.68% 92.94% 92.74%JUnit 98.65% 97.75% 96.55%
Average 99.08% 95.17% 94.69%

72Chapter 5. Applying Code Smell Detection Tools in Open Source
Projects
5.7.2 Occurrence Agreement
In this discussion, similarly to Section 4.6.2, we also disregard the concept of acceptablerange and limit the discussion to a comparison between pairs of tools. Tables 5.22to 5.24 summarize the occurrence agreement (OA) and are analogous to Tables 5.19to 5.21. However, "undef." means undefined, indicating that the OA could not becalculated because no instance of the code smell was found by neither tool of the pair.
God Class. In Table 5.22, the pair PMD-JSpIRIT has the highest average OA of64.56%, while all other pairs have average OAs lower than 26.28%. PMD and JSpIRITare based on variations of the same detection strategy, reporting the higher number ofclasses in common. inFusion also follows the same detection strategy, but presentedlower average OAs with PMD (26.28%) and with JSpIRIT (25.62%). JDeodorant, theonly tool that follows a different technique, has the lowest average OA with inFusion ofonly 12.57%. Therefore, JDeodorant and inFusion report the lowest number of classesin common of all pairs of tools, confirming that their detection techniques are themost different of all pairs, since they have the highest disagreement. Furthermore,JDeodorant has average OAs with PMD (26.00%) and JSpIRIT (23.94%) that areclose to the average OAs between inFusion-PMD (26.28%) and inFusion-JSpIRIT(25.62%), even though inFusion follows the same technique as PMD and JSpIRIT,while JDeodorant does not. However, the low values for the average OAs indicate thateach detection technique and its corresponding variations for God Class produce verydifferent reports, even when the techniques are similar.
Table 5.22: Occurrence agreement (OA) for God Class between pairs of tools.
System inFusion inFusion inFusion JDeodorant JDeodorant PMDJDeodorant JSpIRIT PMD JSpIRIT PMD JSpIRIT
ANTLR 20.93% 50.00% 56.1% 31.25% 32.08% 74.42%ArgoUML 2.63% 6.11% 4.90% 18.45% 19.32% 75.97%JFreeChart 21.11% 36.26% 34.31% 41.74% 36.43% 73.64%JSPWiki 18.18% 35.71% 36.11% 24.39% 34.78% 48.78%JUnit 0% 0% 0% 3.85% 7.41% 50.00%
Average 12.57% 25.62% 26.28% 23.94% 26% 64.56%
God Method. In Table 5.23, the pairs inFusion-PMD (56.92%),inFusion-JSpIRIT (48.21%), and PMD-JSpIRIT (44.38%) have the the highest averageOAs. Interestingly, the pair inFusion-PMD has the highest OA of all pairs, reportingon average more than half of the reported methods in common, even though they followdifferent detection techniques. On the other hand, inFusion and JSpIRIT follow thesame detection strategy, but have a lower average OA of 48.21%. On the contrary,JDeodorant has the lowest OAs with inFusion (5.37%), JSpIRIT (5.77%), and PMD

5.7. Analysis of Non-Occurrence and Occurrence Agreements 73
(4.25%). Therefore, JDeodorant reports many methods that are not reported by theother tools, specially PMD. However, in JUnit JDeodorant is the only tool that reportsGod Methods, while the others report none. Therefore, pairs with JDeodorant have a0% OA, while the other pairs have an undefined OA. Overall, the lower values for theaverage OAs indicate that each detection technique produces different reports, evenwhen they have similar techniques. However, the pairs containing only two of the toolsinFusion, JSpIRIT, and PMD have higher average OAs than the pairs of these toolswith JDeodorant.
Table 5.23: Occurrence agreement (OA) for God Method between pairs of tools.
System inFusion inFusion inFusion JDeodorant JDeodorant PMDJDeodorant JSpIRIT PMD JSpIRIT PMD JSpIRIT
ANTLR 3.61% 48.00% 52.63% 5.80% 3.27% 41.67%ArgoUML 1.94% 38.24% 38.67% 2.39% 0% 30.56%JFreeChart 12.08% 64.29% 69.72% 13.25% 9.72% 53.12%JSPWiki 9.21% 42.31% 66.67% 7.40% 8.28% 52.17%JUnit 0% undef. undef. 0% 0% undef.
Average 5.37% 48.21% 56.92% 5.77% 4.25% 44.38%
Feature Envy. In Table 5.24, we can observe that there is a veryhigh disagreement between the pairs of tools, that have the lowest average OAsof all code smells. However, there are still variations in the average OAs.The pair JDeodorant-JSpIRIT has the highest OA of 2.86%, followed by thepairs inFusion-JDeodorant (0.38%) and inFusion-JSpIRIT (1.05%). Interestingly,JDeodorant and JSpIRIT follow different detection techniques, but still report a fewmethods in common. On the other hand, inFusion and JSpIRIT are based on thesame detection strategy and have the worst OA of all pairs and code smells of only0.38%. The pair inFusion-JDeodorant also follow different detection techniques andhave a slightly higher average OA of 1.05%. Nevertheless, all values are extremelylow, indicating that the detection techniques report very different sets of methods asFeature Envy, with almost no methods in common.
Table 5.24: Occurrence agreement (OA) for Feature Envy between pairs of tools.
System inFusion inFusion JDeodorantJDeodorant JSpIRIT JSpIRIT
ANTLR 5.26% 1.33% 2.86%ArgoUML 0% 0% 0.32%JFreeChart 0% 0% 3.08%JSPWiki 0% 0.58% 5.91%JUnit 0% 0% 2.13%
Average 1.05% 0.38% 2.86%
74Chapter 5. Applying Code Smell Detection Tools in Open Source
Projects
5.8 Threats to Validity
This chapter compared four code smell detection tools, namely inFusion, JDeodorant,JSpIRIT, and PMD, that were used to analyze five target systems, namely ANTLR,ArgoUML, JFreeChart, JSPWiki, and JUnit. These systems were selected due to thefact that they are open source Java systems actively maintained by developers, withdifferent sizes and from different domains. They also have been the target of othermaintainability studies [Tempero et al., 2010; Soares et al., 2011; Nguyen et al., 2011;Oyetoyan et al., 2015; Tahmid et al., 2016; Tufano et al., 2016]. The detection toolsonly have the Java programming language in common. Therefore, Java systems wererequired for the comparison of the tools results. In addition, the systems had to beopen source, since all detection tools analyze the source code to detect code smells.Furthermore, we selected a small number of systems mainly due to the fact that thetools reported the results in different levels of granularity and we had to manually edittheir results so that the classes and methods were uniquely identified with the exactsame name in all reports. This task was very time consuming and error-prone, limitingthe number and size of the target systems. In order to avoid transcription errors, theresults were checked multiple times. Regarding the small number of target systems,we tried to minimize this limitation by selecting representative systems from differentsizes and domains that are actively maintained.
In this study, we also proposed a semi-automated code smell reference list wherecode smells reported by at least two detection tools are considered actual instancesof code smells and included in the code smell reference list. The main limitation ofthis strategy is that it might include in the reference list classes or methods that arenot code smells, while excluding the ones that are. However, manually detecting codesmells in the target systems could create even less reliable lists due to human errors inthe analysis of a huge amount of data. We are not familiar with the source code of thesystems or the specificities of their implementation or domain. Therefore, searchingfor code smells in these larger, more complex, and unfamiliar systems is an error-pronetask, that includes the risk of selecting/dismissing the wrong classes and methods.Although this risk also exists in the manual and in the semi-automated approach, webelieve that the semi-automated code smell reference list is a more feasible approachto create the code smell reference lists.
We are aware that the correctness of the semi-automated code smell referencelist approach can highly influence the recall and precision of the tools. Therefore,in our final considerations, our conclusions take into consideration the similaritiesand differences regarding the recall and precision of tools using the manual and the

5.9. Final Remarks 75
semi-automated code smell reference lists. Recall and precision are also influenced bythe total of code smells detected by each tool, since the reports are unbalanced for allcode smells. That is, tools that report a low number of code smells can have low recall,while tools that report a high number of code smells can have low precision. We areaware of these differences and, therefore, we also included in our final considerationsa discussion of the differences between tools considering the number of code smellsreported. Considering these limitations, our results are not intended to be generalizedto all systems. Further replications of our study on a larger number of systems andconsidering different approaches to create code smell reference lists are highly desirable.
5.9 Final Remarks
In this chapter, we compared the results of four code smell detection tools, namelyinFusion, JDeodorant, JSpIRIT, and PMD, to analyze five open source systems, namelyANTLR, ArgoUML, JFreeChart, JSPWiki, and JUnit. We focus on detecting thefollowing code smells: God Class, God Method, and Feature Envy. We analyzedthe tools recall and precision in detecting the previous code smells (RQ3) usingsemi-automated code smell reference lists (Section 5.2). In addition, we calculatedand compared the agreement of the tools results (RQ4), investigating the variations inthe percentage agreement, the AC1 agreement, the non-occurrence agreement, and theoccurrence agreement, considering all tools simultaneously and in pairs.
In the next chapter, we present our final considerations, including our conclusions,lessons learned, and directions for future work.


Chapter 6
Final Considerations
In this dissertation, we evaluated four code smell detection tools by analyzing theirreports for the code smells God Class, God Method and Feature Envy [Fowler, 1999].The main steps within this work involved: an exploratory study to investigate theevolution of code smells in two target systems; an initial evaluation of the code smelldetection tools applied to the previous target systems; and a replication of the previousevaluation including five active open source projects from different sizes and domains.
Before starting the evaluation of the detection tools, we studied the presence andevolution of code smells in all versions of two target systems, namely MobileMediaand Health Watcher (Chapter 3). We manually analyzed their source code to identifyinstances of God Class, God Method, and Feature Envy to compile code smell referencelists (Section 4.1), that we used to answer RQ1 and RQ2. In RQ1, we investigate ifthe number of code smell increases as the system evolves by calculating the number ofcode smells in different versions of the same target system (Section 3.3). We found thatthe number of code smells does not necessarily increase. In MobileMedia and HealthWatcher there was an increase only in the number of God Class instances, while thenumber of God Method instances varied, presenting increases and decreases, and thenumber of Feature Envy instances remained practically constant (only one addition inthe last version of MobileMedia). In RQ2, we investigate how code smells evolve as thesystem evolves by tracking the presence of code smells in different versions of the samesystem (Section 3.4). We found that most code smells are introduced on the creationof classes and methods. That is the case for 74.4% of code smells in MobileMedia and87.5% in Health Watcher. This result confirms the findings of Tufano et al. [2015] andChatzigeorgiou and Manakos [2010].
In the second study, we evaluated four code smell detection tools by measuringtheir recall, precision, and agreement (Chapter 4). We answer RQ3 and RQ4 using the
77

78 Chapter 6. Final Considerations
tools reports for MobileMedia and Health Watcher. In RQ3, we investigate the toolsrecall and precision (Section 4.3) by comparing the instances reported by the tool withthe instances in the code smell reference list (Section 4.1). We found that the recalland precision vary for the same tool and for different tools. Nevertheless, in general,recall and precision are low, indicating that there is still an opportunity to create newdetection techniques and tools, or improving the current ones. In RQ4, we investigatethe agreement of different detection tools applied to different versions of the sametarget systems by using different measures of agreement in the tools reports (Section4.4, 4.5, 4.6). We found a high agreement on non-smelly classes and methods, despitedifferences in the detection techniques. However, we found more variations and a loweragreement on smelly classes and methods, even for tools based in the same detectiontechnique. This high disagreement between tools when reporting smelly classes andmethods indicate that regardless of the similarities between the detection techniques,every tool reports distinct sets of classes and methods as smelly.
In the third study, we replicated the second study in a different context. Insteadof detecting code smells in multiple versions of the same software systems, we analyzedthe most recent version of five open source projects from different sizes and domains(Chapter 5). We answer RQ3 and RQ4 using the tools reports for ANTLR, ArgoUML,JFreeChart, JSPWiki, and JUnit. In RQ3, in order to measure recall and precision, weproposed a semi-automated approach to generate the code smell reference lists (Section5.2). We also found variations in the recall and precision. However, PMD and JSpIRIThad the highest average recall for God Class and God Method, respectively, insteadof JDeodorant. Considering the average precision, the main difference was for FeatureEnvy, with JSpIRIT presenting the lowest average instead of inFusion. Consideringthe agreement, the observations made for the second study are also valid.
The findings in this dissertation can be used by developers and researchersinterested in selecting detection tools to detect the code smells God Class, God Method,and Feature Envy [Fowler, 1999]. We provide different measures and comparisons thatcan be used to determine the most adequate tool or set of tools. For instance, if adeveloper requires a tool with high coverage, she could select tools with a tendencyof presenting a higher average recall. The same logic can be applied to select a toolthat reports more relevant results. Considering the agreement, tools with a higheragreement on smelly instances could be used together to prioritize instances. Forinstance, to prioritize instances that need validation, instances reported by both toolscan have a higher priority, while instances reported by only one tool can have a lowerpriority. In this case, the information of recall and precision can also add anotherlevel of priority, such as validating first instances of the tool with the highest precision,

6.1. Lessons Learned 79
for instance. However, its important to emphasize that although our findings indicatetendencies of the evaluated detection tools, different tools and pairs of tools can stillpresent different values of recall, precision, and agreement for other systems. Therefore,further investigation is necessary to determine if our findings can be generalized to othersystems and domains.
6.1 Lessons Learned
This section summarizes the main findings and observations of this dissertationconsidering the study of the evolution of code smells and both evaluations of codesmell detection tools.
Evolution of Code Smells. The information that most code smells areintroduced with the creation of classes and methods, can be used to determine whendetection tools should be use. Therefore, developers should apply code smell detectiontools in classes and methods before commits, instead of running the detection toolsin the entire system from time to time. Including the detection of code smells by theevaluated tools should be easy, since all tools are available as plugins for the Eclipse IDE(JDeodorant, JSpIRIT, PMD) or can analyze Java files directly (inFusion). However,in case running the tools during commit tasks is not possible, detection tools could beused before new releases to avoid or at least reduce the number of code smell instancesintroduced in the system.
Evaluation of Code Smell Detection Tools. Tables 6.1, 6.2, and 6.3summarize the main findings considering all the evaluated tools and target systems.In Table 6.1, the column Detection Technique informs the detection technique followedby the tool, which can be a variation of Marinescu’s detection strategy [Lanza andMarinescu, 2006], identification of refactoring opportunities [Tsantalis et al., 2008] orthe software metric LOC (lines of code). Tools that follow Marinescu’s strategy usetheir own set of metrics and/or thresholds (Section 2.4). The column Total # of CodeSmells indicates the total number of code smells reported. In Table 6.2, the columnsRecall and Precision indicate if the tool had the lowest or the highest average recall orprecision in any evaluation. The fields with "-" indicate that the averages are not thelowest or highest in any evaluation, while "GC", "GM", and "FE" indicate for whichsmell the average was the lowest or highest for God Class, God Method, or FeatureEnvy, respectively, and the corresponding study (1 = first evaluation, 2 = secondevaluation, 3 = both evaluations). Finally, Table 6.3 shows the lowest and highestaverage occurrence agreement between pairs of tools. For instance, inFusion has the

80 Chapter 6. Final Considerations
lowest average percentage of God Classes reported in common with JDeodorant (jde)of only 9.5% and the highest with PMD (pmd) of 24.9%. The following keys are usedin Table 6.3: GC (God Class), GM (God Method), FE (Feature Envy), inf (inFusion),jde (JDeodorant), jsp (JSpIRIT), and PMD (pmd).
Tables 6.1, 6.2, and 6.3, can be used by developers and researchers to comparedifferent detection tools. Details regarding the evaluation of tools in the contextof multiple versions of the same system can be found in Chapter 4, while theevaluation of tools using the most recent version of different open source projects canbe found in Chapter 5. The findings are based in the analysis of the following targetsystems: MobileMedia (9 versions), Health Watcher (10 versions), ANTLR, ArgoUML,JFreeChart, JSPWiki, and JUnit.
Table 6.1: Summary of detection techniques and number of smells detected.
Tool Detection Technique Total # of Code SmellsinFusion Detection Strategy 384JDeodorant Refactoring Operations 2974JSpIRIT Detection Strategy 2312PMD Detection Strategy (GC), LOC (GM) 589
Table 6.2: Summary of the average recall and precision.
Tool Recall PrecisionLowest Highest Lowest Highest
inFusion GC3, GM3, FE3 - FE1 GC3, GM3
JDeodorant GM2 GC1, GM1, FE1 GC3, GM3 FE3
JSpIRIT - GM2, FE2 FE2 -PMD - GC2 - -1 manual code smell reference list2 semi-automated code smell reference list3 highest or lowest for both evaluations
Table 6.3: Summary of the average occurrence agreement between pairs of tools.
Tool God Class God Method Feature EnvyLowest Highest Lowest Highest Lowest Highest
inFusion jde(9.5%) pmd(24.9%) jde(5%) pmd(49.8%) jde(1.6%) jsp(2.3%)
JDeodorant inf(9.5%) pmd(20.3%) pmd(3.8%) jsp(5.6%) inf(1.6%) jsp(4.2%)
JSpIRIT jde(17.9%) pmd(60%) jde(5.6%) pmd(44.4%) inf(2.3%) jde(4.2%)
PMD jde(20.3%) jsp(60%) jde(3.8%) inf(49.8%) n/a n/a
Considering all tools and pairs of tools we found high values for agreement onnon-smelly classes and methods. That is, all detection tools seem to agree when a class

6.1. Lessons Learned 81
or method does not present a code smell, even though there are differences between thedetection techniques. On the other hand, there was a low agreement on smelly classesand methods. That is, all detection tools seem to agree that only a small number ofthe reported classes and methods are smelly. Therefore, although there are similaritiesbetween the detection tools, each tool reports a different set of classes and methods ascode smells. We highlight some of the most interesting findings for each detection toolin the following.
inFusion. This tool follows a variation of Marinescu’s detection strategy [Lanzaand Marinescu, 2006] and is the the most conservative tool, reporting the lowest numberof instances (Table 6.1). inFusion fails to report many instances of known code smells,presenting the lowest average recall of all tools for all smells in both evaluations (Table6.2). On the other hand, it reports more known code smells than false positivesfor God Class and God Method, presenting the highest average precision in bothevaluations. Considering the occurrence agreement (Table 6.3), inFusion reported thehighest average of instances in common for God Method with PMD (49.8%), eventhough they are based on different techniques. inFusion also had the the highestagreement for God Class with PMD (24.9%), and for Feature Envy with JSpIRIT(2.3%). Interestingly, they are based on variations of the same detection strategy, butstill presented a low agreement.
JDeodorant. This tool identifies refactoring opportunities to detect code smellsand is the least conservative tool, reporting the highest number of instances (Table6.1). JDeodorant reports most of the known God Class, God Method, and FeatureEnvy instances, presenting the highest average recall of all tools in the first evaluation(Table 6.2). However, reports many false positives for God Method and God Class,presenting the lowest average precision in both evaluations. The only exception isfor Feature Envy, when JDeodorant has the highest average precision. Consideringoccurrence agreement (Table 6.3), JDeodorant reports more God Classes in commonwith PMD (20.3%), and reports more God Method and Feature Envy instances incommon with JSpIRIT (5.6% and 4.2%). JDeodorant is the only tool based on acompletely different detection technique, reporting the most different sets of classesand methods of all detection tools.
JSpIRIT. This tool follows a variation of Marinescu’s detection strategy [Lanzaand Marinescu, 2006] and reports the second highest number of code smells (Table6.1). JSpIRIT does not present the lowest average recall or highest average precisionin any evaluation (Table 6.2). However, in the third study, JSpIRIT has the highestaverage recall for God Method and Feature Envy, while presenting the lowest precisionfor Feature Envy. Interestingly, JSpIRIT is the tool that has the closer values of recall

82 Chapter 6. Final Considerations
and precision for the same system. Considering the occurrence agreement (Table 6.3),JSpIRIT is based on the same detection strategy than PMD, reporting the highestnumber of God Classes in common (60%). JSpIRIT also reports more God Methodsin common with PMD (44.4%), even though they are based on different detectiontechniques. However, despite differences in detection techniques for Feature Envy,JSpIRIT reports more instances in common with JDeodorant (4.2%).
PMD. This tool detects God Class with a variation of Marinescu’s detectionstrategy [Lanza and Marinescu, 2006] and God Method using LOC (lines of code).PMD detects only a few smells more than inFusion, but much less than JDeodorantor JSpIRIT, even though PMD is the only tool that does not detect Feature Envy(Table 6.1). PMD has the highest average precision of all tools for God Class in thesecond evaluation (Table 6.2). For God Method, PMD does not present the highestor lowest average recall or precision. In fact, after JSpIRIT, PMD is the tool with theclosest averages for recall an precision for the same system. Considering the occurrenceagreement (Table 6.3), PMD reports more God Classes in common with JSpIRIT (60%),since they are based on the same detection strategy. PMD also reports more GodMethods in common with inFusion (49.8%), even though inFusion follows a differentdetection technique.
6.2 Future Work
This dissertation can be complemented or extended with the following future work:
• Replicate the study using a larger number of systems. Using a larger number ofsystems can provide results with a higher statistical significance. Furthermore,it could also be investigated if the domain of the systems influences the resultsof the detection tools. For instance, if a certain detection tool or technique findsmore or less code smells in systems from a specific domain.
• Replicate the study using systems implemented in different programminglanguages. It could be investigated if there are differences in the detection toolsand techniques when considering other programming languages, such as, C andC++.
• Compare the tools ability to detect code smells as early as possible as a systemevolves. Since systems evolve and tend to become more complex, code smellsshould be detected as soon as they are introduced to avoid becoming increasinglyharder to refactor. Therefore, it could be investigated and compared how early

6.2. Future Work 83
different detection tools can find code smells in different releases of the samesoftware systems.
• Expand the evaluation of detection tools to include other detection techniques.It could be investigated differences and similarities between traditional detectiontechniques (based on software metrics and static code analysis), machine learningtechniques, and evolutionary algorithms, for instance.
• Implement a code smell detection tool. To our knowledge, machine learningtechniques and evolutionary algorithms are not yet available as tools to the public.Therefore, a new detection tool could be created by implementing one of theseapproaches or even a combination of different code smell detection techniques.


References
Abbes, M., Khomh, F., Guéhéneuc, Y. G., and Antoniol, G. (2011). An empiricalstudy of the impact of two antipatterns, blob and spaghetti code, on programcomprehension. In Proceedings of the 15th European Conference on SoftwareMaintenance and Reengineering, pages 181–190.
Altman, D. G. (1991). Practical Statistics for Medical Research. Chapman & Hall,London.
Arcoverde, R., Garcia, A., and Figueiredo, E. (2011). Understanding the longevity ofcode smells: Preliminary results of an explanatory survey. In Proceedings of the 4thWorkshop on Refactoring Tools (WRT), pages 33–36.
Banker, R. D., Datar, S. M., Kemerer, C. F., and Zweig, D. (1993). Software complexityand maintenance costs. Commun. ACM, 36(11):81–94.
Bieman, J. M. and Kang, B.-K. (1995). Cohesion and reuse in an object-orientedsystem. In Proceedings of the 1995 Symposium on Software Reusability (SSR), pages259–262.
Boussaa, M., Kessentini, W., Kessentini, M., Bechikh, S., and Ben Chikha, S.(2013). Competitive coevolutionary code-smells detection. In Proceedings of the5th International Symposium on Search Based Software Engineering (SSBSE), pages50–65.
Brown, W. J., Malveau, R. C., Mowbray, T. J., and Wiley, J. (1998). AntiPatterns:Refactoring Software , Architectures, and Projects in Crisis. John Wiley & Sons,Inc.
Chatzigeorgiou, A. and Manakos, A. (2010). Investigating the evolution of bad smellsin object-oriented code. In Proceedings of the 7th International Conference on theQuality of Information and Communications Technology, pages 106–115.
85
86 References
Chidamber, S. R. and Kemerer, C. F. (1994). A metrics suite for object oriented design.IEEE Transactions on Software Engineering, 20(6):476–493.
D’Ambros, M., Bacchelli, A., and Lanza, M. (2010). On the impact of design flawson software defects. In Proceedings of the 10th International Conference on QualitySoftware, pages 23–31.
DeMarco, T. (1978). Structured Analysis and System Specification. Yourdon Presscomputing series.
Deursen, A. V., Moonen, L., Bergh, A., and Kok, G. (2001). Refactoring test code.In Proceedings of the 2nd International Conference on Extreme Programming andFlexible Processes in Software Engineering, pages 92–95.
Ducasse, S., Girba, T., and Kuhn, A. (2006). Distribution map. In Proceedings ofthe 22nd IEEE International Conference on Software Maintenance (ICSM), pages203–212.
Fenton, N. E. and Pfleeger, S. L. (1996). Software Metrics: A Rigorous and PracticalApproach. International Thomson Computer Press.
Fernandes, E., Oliveira, J., Vale, G., Paiva, T., and Figueiredo, E. (2016). Areview-based comparative study of bad smell detection tools. In Proceedingsof the 20th International Conference on Evaluation and Assessment in SoftwareEngineering (EASE), pages 18:1–18:12.
Figueiredo, E., Cacho, N., Sant’Anna, C., Monteiro, M., Kulesza, U., Garcia, A.,Soares, S., Ferrari, F., Khan, S., Castor, F., and Dantas, F. (2008). Evolving softwareproduct lines with aspects: an empirical study on design stability. In Proceedings ofthe 30th International Conference on Software Engineering (ICSE), pages 261–270.
Fokaefs, M., Tsantalis, N., and Chatzigeorgiou, A. (2007). Jdeodorant: Identificationand removal of feature envy bad smells. In Proceedings of the 2007 IEEEInternational Conference on Software Maintenance (ICSM), pages 519–520.
Fokaefs, M., Tsantalis, N., Stroulia, E., and Chatzigeorgiou, A. (2012). Identificationand application of extract class refactorings in object-oriented systems. Journal ofSystems and Software, 85(10):2241–2260.
Fontana, F., Mäntylä, M., Zanoni, M., and Marino, A. (2016). Comparing andexperimenting machine learning techniques for code smell detection. EmpiricalSoftware Engineering, 21(3):1143–1191.

References 87
Fontana, F. A., Braione, P., and Zanoni, M. (2012). Automatic detection of bad smellsin code: An experimental assessment. Journal of Object Technology, 11(2):1–38.
Fontana, F. A., Mariani, E., Mornioli, A., Sormani, R., and Tonello, A. (2011).An experience report on using code smells detection tools. In Proceedings ofthe 4th International Conference on Software Testing, Verification and ValidationWorkshops (ICSTW), pages 450–457.
Fowler, M. (1999). Refactoring: Improving the Design of Existing Code.Addison-Wesley.
Gamma, E., Johnson, R., Vlissides, J., and Helm, R. (1994). Design Patterns: Elementsof Reusable Object-Oriented Software. Addison-Wesley.
Greenwood, P., Bartolomei, T., Figueiredo, E., Dosea, M., Garcia, A., Cacho, N.,Sant’Anna, C., Soares, S., Borba, P., Kulesza, U., and Rashid, A. (2007). Onthe impact of aspectual decompositions on design stability: An empirical study.In Proceedingd of the 2007 European Conference on Object-Oriented Programming,pages 176–200.
Gwet, K. L. (2014). Handbook of Inter-Rater Reliability: The Definite guide toMeasuring the Extent of Agreement Among Raters. Advanced Analytics, LLC.
Harman, M. (2007). The current state and future of search based software engineering.In Proceedings of the 2007 Future of Software Engineering (FOSE), pages 342–357.
Hartmann, D. P. (1977). Considerations in the choice of inter-observer reliabilitymeasures. Journal of Applied Behavior Analysis, 10:103–116.
House, A. E., House, B. J., and Campbell, M. B. (1981). Measures of interobserveragreement: Calculation formulas and distribution effects. Journal of behavioralassessment, 3(1):37–57.
Kessentini, M., Vaucher, S., and Sahraoui, H. (2010). Deviance from perfection is abetter criterion than closeness to evil when identifying risky code. In Proceedings ofthe 2010 IEEE/ACM International Conference on Automated Software Engineering(ASE), pages 113–122.
Kessentini, W., Kessentini, M., Sahraoui, H., Bechikh, S., and Ouni, A. (2014). ACooperative Parallel Search-Based Software Engineering Approach for Code-SmellsDetection. IEEE Transactions on Software Engineering, 40(9):841–861.

88 References
Khomh, F., Di Penta, M., and Guéhéneuc, Y. G. (2009a). An exploratory study ofthe impact of code smells on software change-proneness. In Proceedings of the 16thWorking Conference on Reverse Engineering (WCRE), pages 75–84.
Khomh, F., Penta, M. D., Guéhéneuc, Y. G., and Antoniol, G. (2012). An exploratorystudy of the impact of antipatterns on class change- and fault-proneness. EmpiricalSoftware Engineering, 17(3):243–275.
Khomh, F., Vaucher, S., Guéhéneuc, Y. G., and Sahraoui, H. (2009b). A bayesianapproach for the detection of code and design smells. In Proceedings of the 9thInternational Conference on Quality Software, pages 305–314.
Kruchten, P., Nord, R. L., and Ozkaya, I. (2012). Technical debt: From metaphor totheory and practice. IEEE Software, 29(6):18–21.
Kulesza, U., Sant’Anna, C., Garcia, A., Coelho, R., Staa, A., and Lucena, C. (2006).Quantifying the effects of aop: A maitenance study. In Proceedings of the 22ndInternational Conference on Software Maintenance (ICSM), pages 223–233.
Langelier, G., Sahraoui, H. A., and Poulin, P. (2005). Visualization-based analysisof quality for large-scale software systems. In Proceedings of the 20th InternationalConference on Automated Software Engineering, pages 214–223.
Lanza, M. and Marinescu, R. (2006). Object-Oriented Metrics in Practice. SpringerScience & Business Media.
Lehman, M. M. (1984). On understanding laws, evolution, and conservation in thelarge-program life cycle. Journal of Systems and Software, 1:213–221.
Lehman, M. M., Ramil, J. F., Wernick, P. D., Perry, D. E., and Turski, W. M.(1997). Metrics and laws of software evolution-the nineties view. In Proceedings4th International Software Metrics Symposium, pages 20–32.
Li, W. and Shatnawi, R. (2007). An empirical study of the bad smells and class errorprobability in the post-release object-oriented system evolution. Journal of Systemsand Software, 80(7):1120–1128.
Macia, I., Garcia, J., Popescu, D., Garcia, A., Medvidovic, N., and von Staa, A. (2012).Are automatically-detected code anomalies relevant to architectural modularity? InProceedings of the 11th Annual International Conference on Aspect-oriented SoftwareDevelopment (AOSD), pages 167–178.

References 89
Mäntylä, M. (2005). An experiment on subjective evolvability evaluation ofobject-oriented software: Explaining factors and inter-rater agreement. InProceedings of the 2005 International Symposium on Empirical Software Engineering,pages 287–296.
Mäntylä, M. V. and Lassenius, C. (2006). Subjective evaluation of softwareevolvability using code smells: An empirical study. Empirical Software Engineering,11(3):395–431.
Mäntylä, M. V., Vanhanen, J., and Lassenius, C. (2004). Bad smells - humans ascode critics. In Proceedings of the 20th IEEE International Conference on SoftwareMaintenance (ICSM), pages 399–408.
Marinescu, C., Marinescu, R., Mihancea, P., Ratiu, D., and Wettel, R. (2005).iplasma: An integrated platform for quality assessment of object-oriented design.In Proceedings of the 21st IEEE International Conference on Software Maintenance(ICSM), pages 25–30.
Marinescu, R. (2001). Detecting design flaws via metrics in object-oriented systems.In Proceedings of the 39th International Conference and Exhibition on Technology ofObject-Oriented Languages and Systems (TOOLS), pages 173–182.
Marinescu, R. (2002). Measurement and Quality in Object-Oriented Design. PhDthesis, Politehnica University of Timisoara.
Marinescu, R. (2004). Detection strategies: Metrics-based rules for detecting designflaws. In Proceedings of the 20th IEEE International Conference on SoftwareMaintenance (ICSM), pages 350–359.
Maruyama, K. (2001). Automated method-extraction refactoring by using block-basedslicing. In Proceedings of the 2001 Symposium on Software Reusability: PuttingSoftware Reuse in Context (SSR), pages 31–40.
McCabe, T. (1976). A complexity measure. In Proceedings of the 2nd InternationalConference on Software Engineering (ICSE), page 407.
McCray, G. (2013). Assessing inter-rater agreement for nominal judgement variables.In Language Testing Forum, pages 15–17.
Moha, N., Guéhéneuc, Y., Duchien, L., and Meur, A. L. (2010). Decor: A method forthe specification and detection of code and design smells. Transactions on SoftwareEngineering (TSE), pages 20–36.

90 References
Murphy-Hill, E. and Black, A. (2010). An interactive ambient visualization for codesmells. In Proceedings of the 5th international symposium on Software visualization(SoftVis), pages 5–14.
Nguyen, T. T., Nguyen, H. V., Nguyen, H. A., and Nguyen, T. N. (2011). Aspectrecommendation for evolving software. In Proceedings of the 33rd InternationalConference on Software Engineering (ICSE), pages 361–370.
Oizumi, W., Garcia, A., da Silva Sousa, L., Cafeo, B., and Zhao, Y. (2016).Code anomalies flock together: exploring code anomaly agglomerations for locatingdesign problems. In Proceedings of the 38th International Conference on SoftwareEngineering (ICSE), pages 440–451.
Olbrich, S. M., Cruzes, D. S., and Sjøberg, D. I. K. (2010). Are all code smellsharmful? a study of god classes and brain classes in the evolution of three opensource systems. In Proceedings of the IEEE International Conference on SoftwareMaintenance (ICSM), pages 1–10.
Opdyke, W. (1992). Refactoring: A Program Restructuring Aid in DesigningObject-Oriented Application Frameworks. PhD thesis, University of Illinois atUrbana-Champaign.
Oyetoyan, T. D., Falleri, J. R., Dietrich, J., and Jezek, K. (2015). Circulardependencies and change-proneness: An empirical study. In Proceedings of the IEEE22nd International Conference on Software Analysis, Evolution, and Reengineering(SANER), pages 241–250.
Palomba, F. (2016). Alternative sources of information for code smell detection:Postcards from far away. In Proceedings of the 2016 IEEE International Conferenceon Software Maintenance and Evolution (ICSME), pages 636–640.
Palomba, F., Bavota, G., Penta, M. D., Oliveto, R., and Lucia, A. D. (2014). Dothey really smell bad? a study on developers’ perception of bad code smells. InProceedings of the 2014 IEEE International Conference on Software Maintenanceand Evolution (ICSME), pages 101–110.
Palomba, F., Bavota, G., Penta, M. D., Oliveto, R., Lucia, A. D., and Poshyvanyk, D.(2013). Detecting bad smells in source code using change history information. InProceedings of the 28th IEEE/ACM International Conference on Automated SoftwareEngineering (ASE), pages 268–278.

References 91
Peters, R. and Zaidman, A. (2012). Evaluating the lifespan of code smells using softwarerepository mining. In Proceedings of the 16th European Conference on SoftwareMaintenance and Reengineering (CSMR), pages 411–416.
Ren, J., Harman, M., and Penta, M. D. (2011). Cooperative co-evolutionaryoptimization of software project staff assignments and job scheduling. In Proceedingsof the 3rd International Conference on Search Based Software Engineering (SSBSE),pages 127–141.
Ribeiro, W., Braganholo, V., and Murta, L. (2016). A study about the life cycleof code anomalies. In Proceedings of the X Brazilian Symposium on Components,Architectures and Reuse Software (SBCARS), pages 71–80.
Riel, A. J. (1996). Object-oriented Design Heuristics. Addison-Wesley PublishingCompany.
Sjøberg, D., Yamashita, A., Anda, B., Mockus, A., and Dyba, T. (2013). Quantifyingthe effect of code smells on maintenance effort. IEEE Transactions on SoftwareEngineering, 39(8):1144–1156.
Soares, G., Catao, B., Varjao, C., Aguiar, S., Gheyi, R., and Massoni, T. (2011).Analyzing refactorings on software repositories. In Proceedings of the 25th BrazilianSymposium on Software Engineering, pages 164–173.
Soares, S., Borba, P., and Laureano, E. (2006). Distribution and persistence as aspects.Journal of Software: Practice and Experience, 36(7):711–759.
Tahmid, A., Nahar, N., and Sakib, K. (2016). Understanding the evolution of codesmells by observing code smell clusters. In Proceedings of the IEEE 23rd InternationalConference on Software Analysis, Evolution, and Reengineering (SANER), pages8–11.
Tempero, E., Anslow, C., Dietrich, J., Han, T., Li, J., Lumpe, M., Melton, H., andNoble, J. (2010). The qualitas corpus: A curated collection of java code for empiricalstudies. In Proceedings of the 2010 Asia Pacific Software Engineering Conference(APSEC), pages 336–345.
Travassos, G., Shull, F., Fredericks, M., and Basili, V. R. (1999). Detecting defectsin object-oriented designs: using reading techniques to increase software quality.In Proceedings of the 14th Conference on Object-Oriented Programming, Systems,Languages, and Applications, pages 47–56.

92 References
Tsantalis, N., Chaikalis, T., and Chatzigeorgiou, A. (2008). Jdeodorant: Identificationand removal of type-checking bad smells. In Proceedings of the 2008 EuropeanConference on Software Maintenance and Reengineering (CSMR), pages 329–331.
Tsantalis, N. and Chatzigeorgiou, A. (2009a). Identification of extract methodrefactoring opportunities. In Proceedings of the 2009 European Conference onSoftware Maintenance and Reengineering (CSMR), pages 119–128.
Tsantalis, N. and Chatzigeorgiou, A. (2009b). Identification of move method refactoringopportunities. IEEE Transactions on Software Engineering, 35(3):347–367.
Tsantalis, N. and Chatzigeorgiou, A. (2011). Identification of extract methodrefactoring opportunities for the decomposition of methods. Journal of Systemsand Software, 84(10):1757–1782.
Tufano, M., Palomba, F., Bavota, G., Oliveto, R., Penta, M. D., Lucia, A. D.,and Poshyvanyk, D. (2015). When and why your code starts to smell bad. InProceedings of the 34th International Conference on Software Engineering (ICSE),pages 403–414.
Tufano, M., Palomba, F., Bavota, G., Penta, M. D., Oliveto, R., Lucia, A. D., andPoshyvanyk, D. (2016). An Empirical Investigation into the Nature of Test Smells.Ase, pages 4–15.
Vidal, S., Vázquez, H., Díaz-Pace, A., Marcos, C., Garcia, A., and Oizumi, W. (2015).Jspirit: a flexible tool for the analysis of code smells. In Proceedings of the 34thInternational Conference of the Chilean Computer Science Society (SCCC), pages35–40.
Wettel, R. and Marinescu, R. (2005). Archeology of code duplication: recoveringduplication chains from small duplication fragments. In Proceedings of the7th International Symposium on Symbolic and Numeric Algorithms for ScientificComputing (SYNASC).
Yamashita, A. and Counsell, S. (2013). Code smells as system-level indicatorsof maintainability: an empirical study. Journal of Systems and Software,86(10):2639–2653.
Yamashita, A. and Moonen, L. (2012). Do code smells reflect important maintainabilityaspects? In Proceedings of the 28th IEEE International Conference on SoftwareMaintenance (ICSM), pages 306–315.

References 93
Yamashita, A. and Moonen, L. (2013a). Do developers care about code smells? anexploratory survey. In Proceedings of the 20th Working Conference on ReverseEngineering (WCRE), pages 242–251.
Yamashita, A. and Moonen, L. (2013b). Exploring the impact of inter-smell relations onsoftware maintainability: an empirical study. In Proceedings of the 29th InternationalConference on Software Maintenance (ICSM), pages 682–691.
Zazworka, N. and Ackermann, C. (2010). Codevizard: A tool to aid the analysis ofsoftware evolution. In Proceedings of the 4th International Symposium on EmpiricalSoftware Engineering and Measurement (ESEM), pages 63:1–63:1.
![“Software Based Fingerprint Liveness Detection” …repositorio.unicamp.br/bitstream/REPOSIP/259824/1/...Different fingerprint liveness detection algorithms have been proposed [2]](https://img.document.onl/doc/110x75/5fcf7364f5d5663f1f3f60e7/aoesoftware-based-fingerprint-liveness-detectiona-different-fingerprint-liveness.jpg)


![[Agile brazil2014] Bad Smells em Bancos de Dados](https://img.document.onl/doc/110x75/55957e981a28ab11038b4748/agile-brazil2014-bad-smells-em-bancos-de-dados.jpg)