Embed Size (px)
Citation preview

Universidade de AveiroDepartamento deElectronica, Telecomunicacoes e Informatica
2013
Paulo Lopes Simoes Plataforma para Aquisicao de Sinais de Stress eRegisto de OcorrenciasPlatform to Acquire Stress Signals and RegisterOccurrences


Universidade de AveiroDepartamento deElectronica, Telecomunicacoes e Informatica
2013
Paulo Lopes Simoes Plataforma para Aquisicao de Sinais de Stress eRegisto de OcorrenciasPlatform to Acquire Stress Signals and RegisterOccurrences
Dissertacao apresentada a Universidade de Aveiro para cumprimento dosrequesitos necessarios a obtencao do grau de Mestre em EngenhariaEletronica e Telecomunicacoes, realizada sob a orientacao cientıfica doDoutor Jose Alberto Gouveia Fonseca, Professor Associado do Departa-mento de Eletronica, Telecomunicacoes e Informatica da Universidade deAveiro e da Mestre Maria Margarida Urbano, Professora da Escola Superiorde Tecnologia e Gestao de Agueda.

o juri / the jury
presidente / president Prof. Doutor Rui Manuel Escadas Ramos MartinsProfessor Auxiliar do Departamento de Eletronica, Telecomunicacoes e Informatica
da Universidade de Aveiro
vogais / examiners committee Prof. Doutor Jose Alberto Gouveia FonsecaProfessor Associado do Departamento de Eletronica, Telecomunicacoes e In-
formatica da Universidade de Aveiro (orientador)
Mestre Maria Margarida Carreira Pires UrbanoProfessora Adjunta da Escola Superior de Tecnologia e Gestao de Agueda (co-
orientadora)
Prof. Doutor Viriato Antonio Pereira Marinho MarquesProfessor Coordenador, ISEC Instituto Superior de Engenharia de Coimbra


agradecimentos /acknowledgements
E com muito gosto que aproveito esta oportunidade para agradecer a todosos que me ajudaram durante todo o meu percurso academico.
Um agradecimento especial para os meus orientadores Jose Alberto Fonsecae Margarida Urbano pelo empenho, disponibilidade e excelente caracterhumano mostrado ao longo de todo este trabalho realizado.
Um agradecimento muito especial para a minha famılia, nomeadamente osmeus pais e o meu irmao, pelo esforco e motivacao que depositaram emmim para que pudesse seguir este percurso academico.
Agradeco tambem a Alexandra Sırbu por todo o seu apoio e acompan-hamento. Um agradecimento tambem a todos os meus grandes amigos.
Quero tambem agradecer aos meus colegas do laboratorio 319 do DETIpelo bom ambiente criado, importante para a elaboracao deste trabalho.Um agradecimento aos meus colegas pela entreajuda ao longo do curso.
Um agradecimento especial ao meu amigo Helder Lopes Francisco que tevea gentileza de elaborar a imagem de fundo e ıcone da applicacao Androiddesenvolvida neste projecto, dando assim um aspecto mais profissional.
Para finalizar, quero agradecer ao ISR (Institute of Systems and Robotics)da Universidade de Coimbra [1] por ter disponibilizado os sensores usadosneste projecto assim como referir que a compra do tablet Android foi feitaatraves de fundos provenientes da European Union’s Seventh FrameworkProgramme (FP7) de acordo com a subvencao n. 3176711.


Palavras-chave Comunicacoes sem fios, sensores, plataformas moveis, stress, navegacaoveicular, reabilitacao.
Resumo Hoje em dia, as pessoas vivem num mundo repleto de situacoes de stress.Estas podem ter origem em diversos contextos tais como a entrega trabalhoa curto prazo, morte de um familiar ou ate mesmo com relacionamentospessoais. E um facto que o comportamento humano e influenciado pelo nıvelde stress duma pessoa em termos de racionalidade. A tıtulo de exemplo, ostress pode ter impacto no contexto da conducao de veıculos, i. e., podecolocar em risco a seguranca dos condutores e das pessoas envolventes.
Neste domınio, o desenvolvimento de um sistema capaz de detectar stresspode, no futuro, apoiar na conducao de modo a providenciar uma maiorseguranca para todos os intervenientes. Um sistema complexo como estepode tambem ser util para fazer um levantamento estatıstico sobre pontosnegros nas estradas, i. e. locais onde os condutores apresentam sistemati-camente valores altos de stress, consubstanciando zonas onde tipicamenteocorrem acidentes.
O objectivo deste trabalho consiste em dar os primeiros passos para o de-senvolvimento dum sistema capaz de detectar stress em seres humanos demodo a ser aplicado em contextos veiculares tais como na conducao au-tomovel e em sistemas de navegacao de cadeiras de rodas eletricas. Nesteultimo, sera direcionado para pessoas com elevado grau de limitacoes demovimento dos seus membros, por exemplo tetraplegicos. Constituindo oprimeiro passo para a criacao dum sistema complexo, este trabalho ap-resenta uma plataforma para aquisicao de sinais de stress e registos deocorrencias os quais podem ser observados de forma sıncrona. Toda estainformacao sera guardada para permitir a sua analise posteriormente deforma a desenvolver e validar algoritmos de stress robustos e eficazes.


Keywords Wireless communications, sensors, mobile platforms, stress, vehicular navi-gation, rehabilitation.
Abstract Nowadays, people live in a world with a lot of stressful situations. Thesecan come from different contexts as deadline jobs tasks, death of a familymember or even problems with personal relationships. It is also known thatthe human behaviour is influenced by the stress level of a person in termsof rationality. As an example, this can have impact on vehicular navigation,i. e., it can jeopardize the safety of drivers and all other persons around.
In this domain, the development of a stress detection system for vehicularapplications can, in future, assist the driving in order to provide a highersafety. A complex system like this can also be used to report relevant andstatistical information about black spots on the roads, i. e. locations wherethe drivers present systematic high levels of stress, e. g. accidents.
The aim of this work is to serve as the base of a stress detection system tobe used in vehicular applications such as driving cars or electric wheelchairs.In this last context, it will be given focus on severely impaired persons.Being the first step of such system implementation, this work presents aplatform that acquires stress signals and register occurrences. This datacan then be accessed off-line to do an extensive analysis in order to developand validate stress algorithms.


Contents
Contents i
List of Figures iii
List of Tables v
Symbols and Abbreviations vii
1 Introduction 1
1.1 Motivation, context and objectives . . . . . . . . . . . . . . . . . . . . . . . . 1
1.2 Document structure . . . . . . . . . . . . . . . . . . . . . . . . . . . . . . . . 2
2 State of the art 5
2.1 Summary . . . . . . . . . . . . . . . . . . . . . . . . . . . . . . . . . . . . . . 5
2.2 Stress concepts . . . . . . . . . . . . . . . . . . . . . . . . . . . . . . . . . . . 5
2.3 Stress measurement . . . . . . . . . . . . . . . . . . . . . . . . . . . . . . . . 6
2.4 Stress sensors . . . . . . . . . . . . . . . . . . . . . . . . . . . . . . . . . . . . 7
3 Requirements and development of the data acquisition platform 13
3.1 Summary . . . . . . . . . . . . . . . . . . . . . . . . . . . . . . . . . . . . . . 13
3.2 Requirements . . . . . . . . . . . . . . . . . . . . . . . . . . . . . . . . . . . . 13
3.3 Hardware elements . . . . . . . . . . . . . . . . . . . . . . . . . . . . . . . . . 17
3.3.1 Sensors . . . . . . . . . . . . . . . . . . . . . . . . . . . . . . . . . . . 17
3.3.2 Processing unit . . . . . . . . . . . . . . . . . . . . . . . . . . . . . . . 20
3.4 Application organization and development . . . . . . . . . . . . . . . . . . . . 21
3.4.1 Data saved in the external storage directory . . . . . . . . . . . . . . . 29
3.4.2 Register occurrences . . . . . . . . . . . . . . . . . . . . . . . . . . . . 31
3.4.3 Upload data to Dropbox . . . . . . . . . . . . . . . . . . . . . . . . . . 33
3.4.4 Real-time visualization of biosignals changes . . . . . . . . . . . . . . 34
3.4.5 Real-time heart rate algorithm . . . . . . . . . . . . . . . . . . . . . . 34
3.5 Off-line processing with Matlab R© . . . . . . . . . . . . . . . . . . . . . . . . . 36
4 Experimental results 41
4.1 Summary . . . . . . . . . . . . . . . . . . . . . . . . . . . . . . . . . . . . . . 41
4.2 Platform validation . . . . . . . . . . . . . . . . . . . . . . . . . . . . . . . . . 41
4.3 Comparison of heart rate algorithms . . . . . . . . . . . . . . . . . . . . . . . 44
4.4 Vehicular navigation context . . . . . . . . . . . . . . . . . . . . . . . . . . . 47
i

4.5 Video game context . . . . . . . . . . . . . . . . . . . . . . . . . . . . . . . . 524.6 Tilt table context . . . . . . . . . . . . . . . . . . . . . . . . . . . . . . . . . . 544.7 Remarks about the measured biosignals and registered occurrences . . . . . . 57
5 Conclusions and future work 595.1 Summary . . . . . . . . . . . . . . . . . . . . . . . . . . . . . . . . . . . . . . 595.2 Conclusions . . . . . . . . . . . . . . . . . . . . . . . . . . . . . . . . . . . . . 595.3 Future work . . . . . . . . . . . . . . . . . . . . . . . . . . . . . . . . . . . . . 60
Bibliography 61
ii

List of Figures
1.1 Simplified neuro-psychoanalytic model ARS developed in Vienna University ofTechnology . . . . . . . . . . . . . . . . . . . . . . . . . . . . . . . . . . . . . 2
2.1 Example of a GSR signal. . . . . . . . . . . . . . . . . . . . . . . . . . . . . 8
2.2 Working principle of an ECG sensor. . . . . . . . . . . . . . . . . . . . . . . . 9
3.1 Initial block diagram of the platform. . . . . . . . . . . . . . . . . . . . . . . . 14
3.2 Platform overview - system to be developed. . . . . . . . . . . . . . . . . . . 15
3.3 Hypothetical visualization of biosignals data and occurrences. . . . . . . . . 16
3.4 Local database organization. . . . . . . . . . . . . . . . . . . . . . . . . . . . 16
3.5 Wireless communication protocol between Android device and one Shimmersensor already connected. . . . . . . . . . . . . . . . . . . . . . . . . . . . . . 18
3.6 GSR sensor application. . . . . . . . . . . . . . . . . . . . . . . . . . . . . . 19
3.7 Overview of the ECG sensor. . . . . . . . . . . . . . . . . . . . . . . . . . . . 20
3.8 Processing unit . . . . . . . . . . . . . . . . . . . . . . . . . . . . . . . . . . . 21
3.9 Initial views of the Android application. . . . . . . . . . . . . . . . . . . . . 22
3.10 Normal flow of the Android application. . . . . . . . . . . . . . . . . . . . . 23
3.11 Bluetooth connection between the Android and the sensors. . . . . . . . . . 24
3.12 Registering a new patient. . . . . . . . . . . . . . . . . . . . . . . . . . . . . 24
3.13 Application layout in its modus operandi. . . . . . . . . . . . . . . . . . . . . 25
3.14 Deleting all files from Database. . . . . . . . . . . . . . . . . . . . . . . . . . 26
3.15 Flowchart of normal application’s operation. . . . . . . . . . . . . . . . . . . 27
3.16 Activity life-cycle . . . . . . . . . . . . . . . . . . . . . . . . . . . . . . . . . . 28
3.17 Data storage for each patient. . . . . . . . . . . . . . . . . . . . . . . . . . . . 30
3.18 Examples of each file saved in a patient directory. . . . . . . . . . . . . . . . 31
3.19 Registering an occurrence with speech recognition. . . . . . . . . . . . . . . . 32
3.20 Flowchart of the occurrences registering. . . . . . . . . . . . . . . . . . . . . 32
3.21 First part - authentication . . . . . . . . . . . . . . . . . . . . . . . . . . . . 33
3.22 Second part - write files . . . . . . . . . . . . . . . . . . . . . . . . . . . . . . 34
3.23 HR algorithm applied in the ECG signal. . . . . . . . . . . . . . . . . . . . . 35
3.24 Flowchart of heart rate algorithm. . . . . . . . . . . . . . . . . . . . . . . . . 36
3.25 Matlab interface developed. . . . . . . . . . . . . . . . . . . . . . . . . . . . 37
3.26 Importing data block. . . . . . . . . . . . . . . . . . . . . . . . . . . . . . . . 37
3.27 List of occurrences block. . . . . . . . . . . . . . . . . . . . . . . . . . . . . . 38
3.28 Temporal and threshold parameters block. Note: the ’end’ word just appearsby default in the initialization of the program. . . . . . . . . . . . . . . . . . . 39
iii

4.1 First experiment procedure to validate the platform. . . . . . . . . . . . . . 424.2 Error made in determining the initial instant - phase error. . . . . . . . . . . 444.3 Real-time heart rate algorithm - no fails. . . . . . . . . . . . . . . . . . . . . 454.4 Real-time heart rate algorithm - imperfection 1. . . . . . . . . . . . . . . . . 464.5 Real-time heart rate algorithm - imperfection 2. . . . . . . . . . . . . . . . . 464.6 HRV of a 25 years old man - driving context. . . . . . . . . . . . . . . . . . . 484.7 HRV of a 50 years old woman - driving context. . . . . . . . . . . . . . . . . 494.8 HRV of a 23 years old man - driving context. . . . . . . . . . . . . . . . . . . 504.9 HRV of a 37 years old man - driving context. . . . . . . . . . . . . . . . . . . 514.10 Association occurrences-biosignal (1). . . . . . . . . . . . . . . . . . . . . . . 524.11 Association occurrences-biosignal (2). . . . . . . . . . . . . . . . . . . . . . . 524.12 SC and HR of subject 1 - during playing phase. . . . . . . . . . . . . . . . . 534.13 Tilt table context: results from a healthy female subject. Note: in this case no
rest between hand and abdominal exercise was done. . . . . . . . . . . . . . 564.14 Tilt table context: results from a healthy masculine subject. . . . . . . . . . 564.15 Tilt table context: results from a healthy masculine subject. . . . . . . . . . 564.16 Respiration derived from the ECG. . . . . . . . . . . . . . . . . . . . . . . . 57
iv

List of Tables
2.1 Biosignals that can be used for stress detection. . . . . . . . . . . . . . . . . 62.2 Some stress detection algorithms. . . . . . . . . . . . . . . . . . . . . . . . . 62.3 Biosignals used in some algorithms. . . . . . . . . . . . . . . . . . . . . . . . 7
4.1 First experiment procedure to validate the platform. . . . . . . . . . . . . . 424.2 Driving results of subject 1 - 25 years old man. . . . . . . . . . . . . . . . . 474.3 Driving results of subject 2 - 50 years old woman. . . . . . . . . . . . . . . . 484.4 Driving results of subject 3 - 23 years old man. . . . . . . . . . . . . . . . . 494.5 Driving results of subject 4 - 37 years old man. . . . . . . . . . . . . . . . . 504.6 Mean values of detected GSR peaks for all road circuit. . . . . . . . . . . . . 514.7 Results of subject 1 - video game context. . . . . . . . . . . . . . . . . . . . 534.8 Occurrences and their elapsed time during the play phase. . . . . . . . . . . . 534.9 Experimental phases with expected results. . . . . . . . . . . . . . . . . . . . 55
v

vi
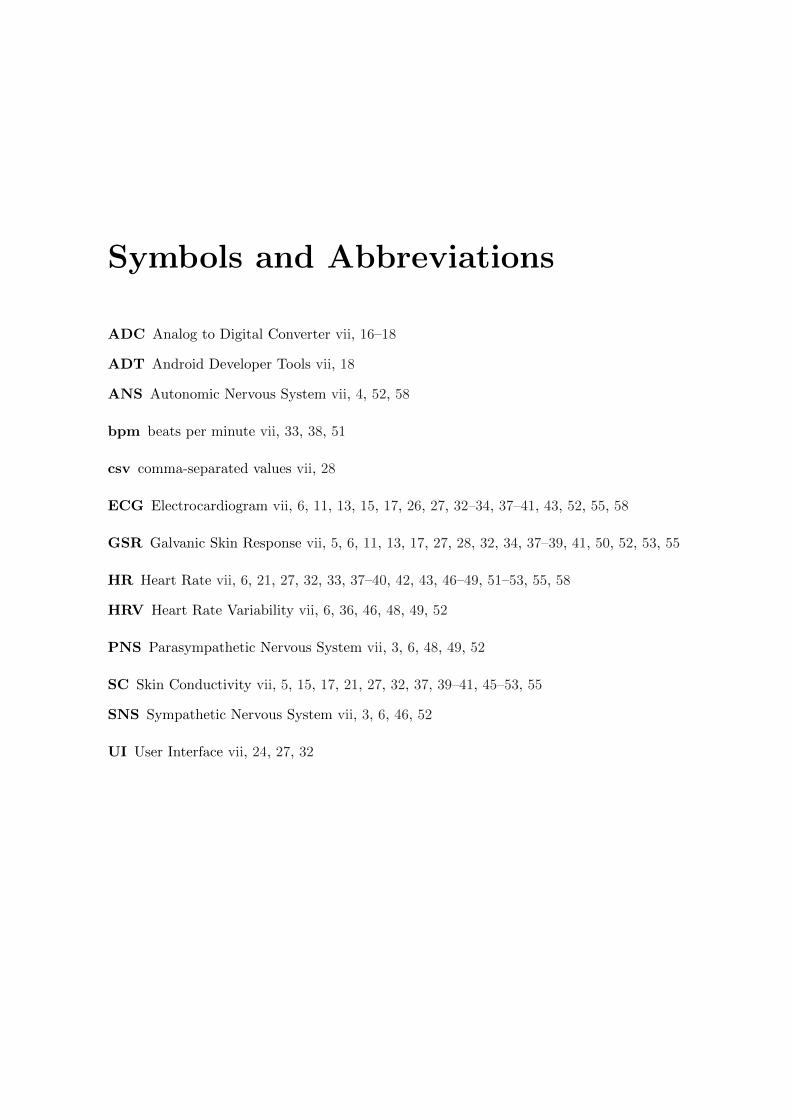
Symbols and Abbreviations
ADC Analog to Digital Converter vii, 16–18
ADT Android Developer Tools vii, 18
ANS Autonomic Nervous System vii, 4, 52, 58
bpm beats per minute vii, 33, 38, 51
csv comma-separated values vii, 28
ECG Electrocardiogram vii, 6, 11, 13, 15, 17, 26, 27, 32–34, 37–41, 43, 52, 55, 58
GSR Galvanic Skin Response vii, 5, 6, 11, 13, 17, 27, 28, 32, 34, 37–39, 41, 50, 52, 53, 55
HR Heart Rate vii, 6, 21, 27, 32, 33, 37–40, 42, 43, 46–49, 51–53, 55, 58
HRV Heart Rate Variability vii, 6, 36, 46, 48, 49, 52
PNS Parasympathetic Nervous System vii, 3, 6, 48, 49, 52
SC Skin Conductivity vii, 5, 15, 17, 21, 27, 32, 37, 39–41, 45–53, 55
SNS Sympathetic Nervous System vii, 3, 6, 46, 52
UI User Interface vii, 24, 27, 32

viii

Chapter 1
Introduction
1.1 Motivation, context and objectives
The sensation of well-being is a special characteristic that any human tries to reach ormaintain at any time. However, in some situations, the human being exceeds its homeostasislimits due to several reasons such as less pleasant situations that can happen in job or rela-tionships with other persons. These kind of situations can lead a person to a state of stress,and due that, they are called as stressors.
Therefore, the development of a stress detection system would be useful to be applied inall contexts that can put in risk the emotional and physical integrity of persons. Consideringa car driving as an example, it would be of value that the system detects the level of stressof the driver and, in case it is high, it alerts the driver and advises him/her to reduce the carvelocity or suggests a relaxing song for example. Otherwise, this level can increase and thedriver can compromise the safety of all persons involved, since it is known that the larger arethese levels, the worst will be the rationality of his/her behaviours or actions. Yet on thistopic, the usage of such system could help the detection of dangerous points on roads andmotorways, i. e., black spots - road locations prone to accidents.
This know-how can be also applied in other contexts as in rehabilitation, specifically to aidin the wheelchairs navigation. The tetraplegic persons which are severely impaired presenta lot of difficulties when trying to achieve tasks as crossing a door. As long as they do notsucceed it, they will get more stressed and there will be a time in which they will give up.Thus, to improve the person’s welfare, the stress detection system could be included in thepowered wheelchair system in order to provide a semi-automatic navigation that aids theperson achieving the intended task. In this case, and besides the stress detection component,the powered wheelchair will also include sensors which acquire environmental data to performthe correct movements.
Relating with the contexts above, it has been developed in the Technical University ofWien a neuro-psychoanalytic model ARS (Artificial Recognition System) which is based onthe structural Freud model and can be simplified by the figure 1.1.

2 Chapter 1. Introduction
Figure 1.1: Simplified neuro-psychoanalytic model ARS developed in Vienna University ofTechnology - based in [2].
The final purpose of this project is to develop a stress detection system to include in theARS model in order to aid severely impaired persons in driving electric wheelchairs and also tobe used in vehicular applications, in particular to detect black spots on roads before accidentshappen. However, the development of a full-blown system with this complexity has to besplit in several parts: understand how the human stress can be measured, collect an increasedamount of real experimental data, develop and validate stress detection algorithms and thenassemble all the relevant components. This dissertation is related with the first two parts, i.e., it consists in the development of a platform that acquires human stress signals and allowsthe registering of occurrences. By doing a temporal association between the stress signalsand occurrences, it will be possible to identify which occurrences can cause more stress. Theplatform is intended to also store all experimental data into a database which can be accessedin a posterior phase of this work to be analysed off-line. In this off-line processing, it willbe possible to study and classify the level of stress according to the circumstances that thesubject was dealing and therefore verify the adequacy of the stress detection system.
1.2 Document structure
This dissertation is split in five chapters:
• In the first chapter is given an introduction about this project as well as the motivationto do it and also in which context it is inserted. The main objectives of this work arealso referred.
• The second chapter exposes general concepts of stress, how it can be measured inhumans, which sensors can perform this measurement and also how they work (some ofthem). To conclude is given an overview of sensors available in the market.
• The third chapter explains in detail all the work done and is split in four main topics.It starts by exposing the requirements of the intended platform and then the necessaryelements to build the final solution are chosen. After that, those elements are described.The next topic presents the application organization and details about its development.The last topic exposes a preliminary stress analysing unit which works off-line.

1.2. Document structure 3
• In the fourth chapter is done the validation of the platform by showing relevant results.Furthermore, experimental results done in vehicular navigation, video game and tilttable contexts are presented. To conclude, some remarks are given about the measuredstress signals.
• The last chapter closes this dissertation with the conclusions of all the work and alsogives indications for future work for the ongoing of this project.

4 Chapter 1. Introduction
Chapter 2
State of the art
2.1 Summary
This chapter presents global human stress concepts and also how it can be detected. Thenit is given an overview of some sensors able to measure stress and, to conclude, some sensorsavailable in the market to perform it are presented.
2.2 Stress concepts
The concept of stress can be interpreted by different points of view. For example from aphysicist perspective, it can be seen as the force applied in a certain body [3]. Although thisis a simple definition, this project is more related with physio-psychological and emotionalhuman issues that affects the mental state. Generally, stress is associated to a negativefeeling as discomfort, anxiety, depression, headaches, tiredness or even panic attacks that canbe prejudicial to human’s health if it is daily present on them. It can be originated fromdifferent causes as troubles in work, illness or death of a family member, school examinations,tasks deadlines and so on.
A possible more complex definition of stress consists in a process which involves a stimuli,usually denominated by stressor, that triggers a psycho-physical response - [3]. This conse-quent body response, sometimes referred as fight or flight response [4], also makes part of theprocess and basically it is translated by the way how the organism’s homeostasis tries to adaptagainst an unpredictable event with certain characteristics. The aim of this response is tohelp the body achieving (or maintaining) an internal equilibrate state leading to a well-beingsensation. However, as Lazarus and Folkman (1984) said, this is a state that human may beunable to meet [3]. For example in vehicular circumstances, if the driver is not able to solvethe situation provoked by a stressor, the level of stress will continuously increase. Hans Selye(1976) called this body’s reaction against the stress as General Adaptation Syndrome [5].
According to [6], the body’s response is strongly interrelated with the Sympathetic Ner-vous System (SNS) activity as it ”is due to a disruption of the autonomic balance because of thebody’s physical and mental activity (body accelerator); a mobilization of metabolic resourcesand increased energy expenditure are given during times of stress, arousal or other externalchallenges, supported by elevated blood pressure and redirected blood from the intestinal reser-voir toward skeletal muscles”. Furthermore, the heart rate and the contractile force of heartmuscles increase. In the other hand, the Parasympathetic Nervous System (PNS) is related

6 Chapter 2. State of the art
with the ”body brake”, i. e., rest (relaxed) or digestion times when the energy of body isrestored and conserved, leading to a heart rate and blood pressure decrease. The sympatheticand parasympathetic branches constitute the Autonomic Nervous System (ANS).
2.3 Stress measurement
The measurement of stress can be done by one of these three ways: self-reports, be-havioural and cognitive functions measures, and medical/biological measures [5]. This projectfocus on the third one. According to [7], determining the stress by measuring physiologicalsignals is reliable and challenging due to the reasonable evidence from physiological signal.From now on, these signals will be called sometimes as biosignals for simplicity because ac-cording to [6] ”a biosignal can be defined as a description of a physiological phenomenon,irrespective of the nature of this description”.
In order to detect and evaluate human emotions related to stress, it was used in the pastthe electroencephalography, image processing to recognize facial expression changes as wellas the tone of speech [8]. However, the advances in electronic sensors and medicine areashave respectively enabled the access and interpretation of some physiological signals data ina easier way.
According to literature, the physiological signals mentioned in table 2.1 carry relevantinformation about the human stress level [3] [7] [9]. Furthermore, and based in [9], the table2.2 presents a review of some algorithms used for stress detection.
Galvanic Skin Response (GSR )
Electrocardiogram - Heart Rate (HR), Heart Rate Variability
Blood Pressure (BP), Blood Volume Pulse (BVP)
Electromyogram (EMG)- muscle tension
Pupil Dilation (PD)
Skin Temperature (ST)
Respiration Rate (RR)
Electroencephalogram (EEG)- electrical brain activity
Hormonal changes
Table 2.1: Biosignals that can be used for stress detection.
Support Vector Machines (SVM)
K-nearest neighbor (K-NN)
Fisher Linear Discriminant
Gaussian Mixture Model (GMM)
Analysis of Variance (ANOVA)
Bayes Classifier
Fuzzy logic
Table 2.2: Some stress detection algorithms.

2.4. Stress sensors 7
The reading at the same time of all or many biosignals has the advantage of the datacomplementarity which can lead to more accurate results in the stress detection. But, onthe other side, the use of many sensors will restrict the subject’s movement and even stresshim/her due to the amount of sensors used and the sensation of being observed. As this typeof stress is an undesired measure for the purpose of this project, just some of them will bechosen with the expectation that the stress level measure will be reliable. A good solutionis to find sensors that can give information of more than one physiological parameter at thesame time as the photoplethysmogram sensor [6].
Table 2.3 indicates which biosignals were already used in several algorithms to detectand classify stress levels. In this table, the Bayes classifier is not present because it wasproved that SVM is more efficient than Bayes - [10]. The GMM classifier was used in [11]for detecting stress levels in a speech signal. It should be noticed that, in some works, thereferred algorithms can be cascaded to improve the results [12].
- SVM K-NN Fisher ANOVA Fuzzy Logic
GSR X X X X X
BVP X
PD X
ST X
RR X X X
ECG X X X
HR X
EMG X X X
Reference [10] [12] [13], [12] [13], [12] [9]
Table 2.3: Biosignals used in some algorithms.
It is important to remark that the GSR signal is almost always used in stress detectionalgorithms. According to [9], the GSR and the HR signals used with a fuzzy logic algorithmcan detect stress properly with 99.5% of rate.
2.4 Stress sensors
In order to measure the previously mentioned biosignals, specialized sensors are required.In a general view, sensors for human body usage can be classified as invasive or non-invasive.Since the first ones can cause body damage or pain and then put the subject in a stress state,the focus in non-invasive sensors will be given due to the purpose of this project. A briefdescription of several sensors that measure the relevant biosignals is presented bellow.
Galvanic Skin Response (GSR)
As mentioned before, this is the most used sensor for stress detection applications. Apopular instrument which uses this sensor is the lie detector. Also known as electro-dermalresponse [4] or psycho-galvanic reflex [14], the GSR signalizes the Skin Conductivity (SC)during a stress event. Its working principle consists in the usage of two electrodes placed indifferent skin regions - usually on fingers - that measure the skin’s resistance variation which

8 Chapter 2. State of the art
can distinguish stress levels. This is due to the fact that, when SNS is activated - mentaland physical activity -, the skin starts sweating and, as a consequence, turns it as a good(electrical) conductor resulting in a lower resistance value. The inverse situation is valid whenPNS is activated, but it must be taken in mind the recovering time of the biological bodyresources after a stress event.
Figure 2.1 presents an example of a GSR signal and it is clear that the induced stressstimulus provoked a rise in amplitude. In this case, the stressor was related with intensivephysical exercise.
Figure 2.1: Example of a GSR signal.
Electrocardiogram (ECG)
According to [6], this biosignal can be classified in three forms: in terms of existence itis considered a permanent signal since it can be accessed at any time without inducing anexternal excitation; it is also considered a dynamic biosignal due its considerable changes overthe time; and finally, concerning its origin, it is an electric biosignal.
This sensor consists in the installation of electrodes in specific skin places in the body. Itis able to measure the electrical excitation of the heart muscles (depolarization) according tothe potential difference between the electrodes. In fact, this is the so called cardiac telemetry.
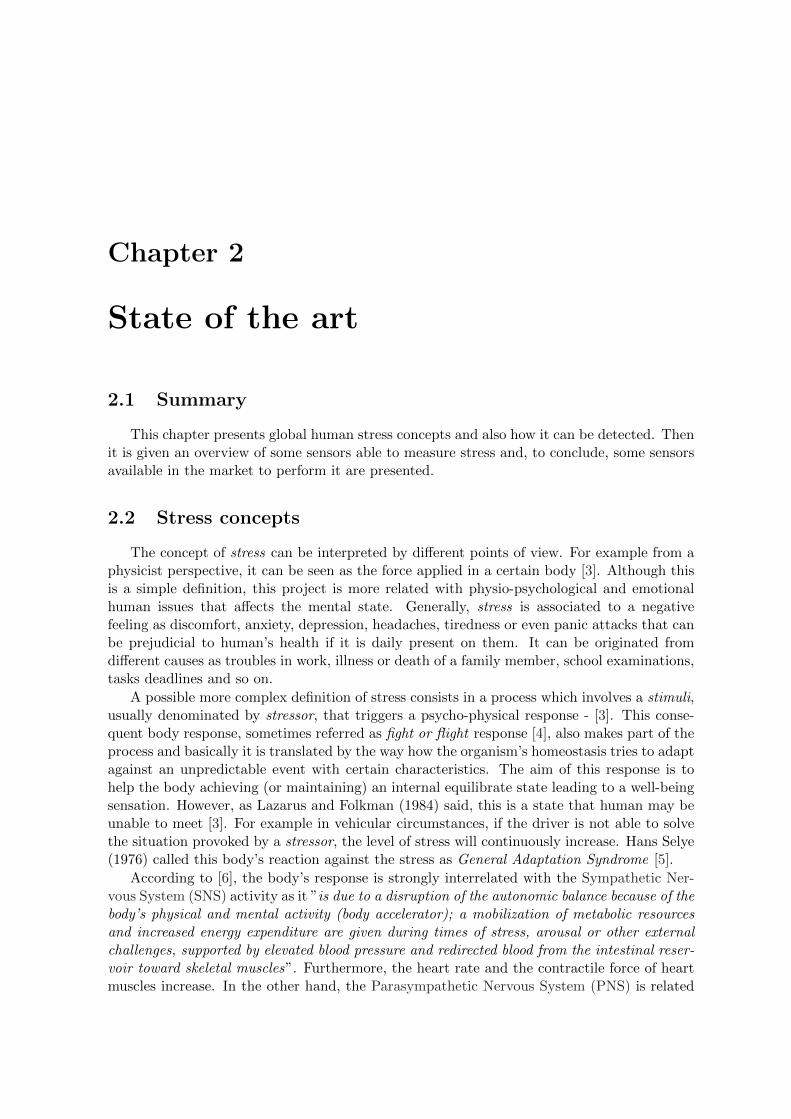
There exists some methods to acquire the ECG signal as the Einthoven-Derivation (frontal-plane) or the Wilson-Derivation (horizontal-plane). Since the last one uses more electrodes,it will be given preference to the Einthoven-Derivation method which is illustrated in figure2.2a in combination with the typical measured signal in 2.2b. Parameters as Heart Rate (HR)and Heart Rate Variability (HRV) can be easily derived from this biosignal by software. Eventhe respiration rate can be estimated from this biosignal because the envelope of the ECG ismodulated with respiration [6].
The HR is the inverse of the heart period which is given by the time interval betweenone R and the next R peak. Concerning the HRV, it describes the fluctuation of the heartperiod and it is strongly related with the regulatory mechanisms of the SNS and the PNS.In resume, the SNS branch is interrelated with the low frequency (LF) band (0.04− 0.15Hz)and the PNS is interrelated with the high frequency (HF) band (0.15−0.4Hz) of the spectralfunction of the heart periods [6].
2.4. Stress sensors 9
(a) Source: Eugenijus Kaniusas - TU Wienlecture notes
(b) Theoretical ECG signal.
Figure 2.2: Working principle of an ECG sensor.
Overview of other sensors
For the compliance of other biosignals as the pupil dilation, muscle tension, brain electricalactivity and blood pressure for example, it is necessary to resort to other methods. To observethe pupil dilation, it is needed to record video and then apply image processing algorithms.To observe the EEG, a cap with several electrodes must be applied in the head. This lasttype of sensor is discarded because it would have a bad influence on the subjects of thisproject. The EMG is a good signal to be used in navigation control scenarios as wheelchairsbecause it reflects the force applied for example in a joystick. This sensor consists too in theappliance of electrodes and then measuring the across voltage which represents the electricalactivity of the muscles that cause voluntary body movements. For the blood pressure, it isusually used the photoplethysmogram (PPG) sensor which is installed in the patient’s finger.This sensor has the advantage that it can relate several parameters at the same time as heartbeat - and by consequence HRV too -, respiration rate, blood pressure and blood oxygenation(saturation).
Available sensors in the market
The following table presents a list of sensors that were found in the market together withtheir respective price, when available.

10 Chapter 2. State of the art
GSRCompanie - Product Price in e[15] Shimmer - Wireless GSR Sensor 147
[15] Shimmer - Wireless GSR Sensor + Bluetooth 346
[16] Affectiva - Q Sensor (GSR, ST, Bluetooth, Movement Measure) Unknown
[17] Bio-Medical Instruments - SA9309M 227
[17] Bio-Medical Instruments - Remote Finger Sensor for GSR 28
[18] IndiaMart - Sc/gsr Sensor Unknown
[19] BioPac - TSD203 & GSR100C Unknown
ECGCompanie - Product Price in e[15] Shimmer - Wireless ECG Sensor 147
[15] Shimmer - Wireless ECG Sensor + Bluetooth 346
[20] Zephyr - BioHarnessTM3 + Bluetooth 363
[20] Zephyr - HxMTMSmart + Bluetooth 62
[21] Polar - Polar WearLink R©+ Bluetooth (Heart Rate) 69.90
[22] Quirumed - 127-109605 + Bluetooth 2420
[22] Quirumed - 604-3100BT + Bluetooth 1895
[17] Bio-Medical Instruments - T9306M 227
[18] IndiaMart - Channel Cables For ECG Unknown
[19] BioPac - TSD155C Unknown
BVP (Photoplethysmogram - PPG)Companie - Product Price in e[22] Quirumed - 550-SABPM50P 82.50
[17] Bio-Medical Instruments - SA9308M 227
[18] IndiaMart - Blood Volume Pulse Sensor Unknown
[23] EC21 - Heart Rate Monitor, finger/wrist + Bluetooth Unknown
[19] BioPac - TSD200 & PPG100C Unknown
EMGCompanie - Product Price in e[15] Shimmer - Wireless EMG Sensor 147
[15] Shimmer - Wireless EMG Sensor + Bluetooth 346
Skin TemperatureCompanie - Product Price in e[16] Affectiva - Q Sensor (GSR, ST, Movement Measure, Bluetooth) Unknown
[17] Bio-Medical Instruments - SA9310M 161
[18] IndiaMart - High Resolution Skin Temperature Unknown
[19] BioPac - BioNomadix Skin Temperature Unknown

2.4. Stress sensors 11
Respiration - Oxygen SaturationCompanie - Product Price in e[20] Zephyr - BioHarnessTM3 + Bluetooth 363
[17] Bio-Medical Instruments - SA9311M 227
[18] IndiaMart - Oximetry Sensor Unknown
[18] IndiaMart - Respiration Sensor Unknown
[19] BioPac - BioNomadix Respiration Transducer Unknown

12 Chapter 2. State of the art

Chapter 3
Requirements and development ofthe data acquisition platform
3.1 Summary
In the previous chapter, the conceptualization of the human stress was done as well as theway that it can be measured. In the following of this line, this chapter aims to describe allthe work done in this dissertation in order to accomplish a final platform that acquires stresssignals and register occurrences. It starts by explaining the requirements of such a platform,then a description of which components were used and finally how it was built in order to beused by any person. Additionally, it is given an overview of an user-interface that was mainlydone to validate the platform and analyse experimental results.
3.2 Requirements
As mentioned previously in chapter 1, the development of a system capable of measuringand classify the stress level of a person can be helpful to improve the safety and well-beingof the subject in several contexts.
This work aims to develop a platform able to collect and store stress related signals, as wellas register stress-inducer events, on vehicular applications (e. g. electric powered wheelchairsand cars). The captured data will be stored into a local database, which can then be accessedin order to carry out an off-line analysis. This work is intended to serve as the basis for afull-blown stress detection system. So, an increased amount of data has to be collected inreal driving situations to perform a complete analysis and therefore validate stress detectionalgorithms.
As explained in 2, the level of stress can be evaluated through the analysis of severalphysiological signals, such as ECG, GSR and blood pressure. For the acquisition of thesesignals, specific medical sensors are required. However, the vehicular environment imposesconstraints in the choice of these sensors. These constraints are described bellow:
• Portable
• Non-invasive
• Low price

14 Chapter 3. Requirements and development of the data acquisition platform
Whilst driving, the drivers need a high level of freedom in their arms movements in orderto control de car. If this freedom is compromised due the amount of cable used by sensors, thedriver’s security is in risk. Hence, for each sensor, there is a need of portability characteristicssuch as easy wearable, small size and weight, lowest possible amount of wires used and also alarge enough battery lifetime which is important for long time experiments. Therefore, thereis a natural inclination for the use of miniaturized wireless sensors. On the other hand, thesensors must be non-invasive to not interfere in the stress measurements since it can causebody pain and then raise stress level of the person by means of physiological signals changes.The price of sensors has also to be took in mind due the budget available for this project atthe moment.
Regarding these requirements together with the available sensors in the market (enun-ciated in section 2.4), only those with wireless characteristics can be evaluated. Althoughsome of them are capable to collect and store data, there is lack of a processing unit to makethe temporal association between the physiological signals and the stress-inducer events. Thepurpose of register occurrences is to understand what kind of events can provoke higher stresslevels and then threaten the driver’s safety. This is not possible to analyse if there exists nosynchronization between biosignals and stress occurrences.
The addition of a processing unit implies a wireless communication interface between thesensors and the processing unit itself. Hence, the initial requirements for the processing unitare described bellow:
• Able to receive data from several sensors via a wireless communication protocol.
• Allow the registering of occurrences in a friendly way
• Capability of data storage
Up to now, the platform overview can be illustrated by figure 3.1.
Figure 3.1: Initial block diagram of the platform.
Coming back to the sensors found in the market, some of them had to be chosen in orderto acquire reliable stress signals. From those elements it is clear that many sensors are offeredwith a very high price which is not within the project budget. Some of them, simply don’tsupport a wireless communication interface. Other suppliers don’t show the prices on theinternet. The request for a quote would jeopardize the timeliness of this project.

3.2. Requirements 15
Regarding the others, and since the comfort of the wearable sensors is crucial for thisproject, it was decided to work with the ECG and GSR sensors from the Shimmer-Researchcompany1 which were specifically developed for research purposes. This is a good startingpoint not only because they already exist in our laboratory but also because they can givesome of the most relevant information about the human stress level according to the previouschapter study. In the future work, a more accurate analysis will be done in order to selectthe sensors for a more definitive platform.
The chosen sensors use Bluetooth technology as the communication interface. Therefore,it is mandatory that the processing unit also supports this technology in order to receivedata from sensors in a wireless way. Combining this last requirement with those previouslymentioned for the processing unit, it was decided to use an Android device. With this com-ponent, it is possible to create an user-interface application that satisfies all the requirementsfor the processing unit. Beyond that, all the software tools necessary to develop an Androidapplication are open source which implies a lower cost and enables a quick start development.
Considering all the elements chosen, an overview of the platform to be developed is illus-trated in 3.2. Hence, the specifications of the user-interface application can be clearly defined.This application is intended to be used by any user, so it is recommended that it presentscharacteristics such as user-friendliness and robustness (e. g. eventual bad user input).
Figure 3.2: Platform overview - system to be developed.
Apart from establish a wireless communication with sensors, the registering of occurrenceshas some requirements. It has to be possible to register the timings of two types of occurrences:normal activities and spontaneous events. The idea of the normal activities arose duethe fact that it would be interesting to analyse the subject stress signals in specific road maplocations and then try to evaluate which zones can be considered as black spots. For example,these locations can be cities, counties or motorways. Hence, it was decided that each normalactivity has to be registered with a begin and an end moment without overlapping with otheractivities. Concerning the spontaneous events, they can be registered at any time and they areintended to mark situations such as traffic lights changes, pedestrians crossing road suddenly,
1Shimmer-Research is a division of Realtime Technologies Ltd [15].
16 Chapter 3. Requirements and development of the data acquisition platform
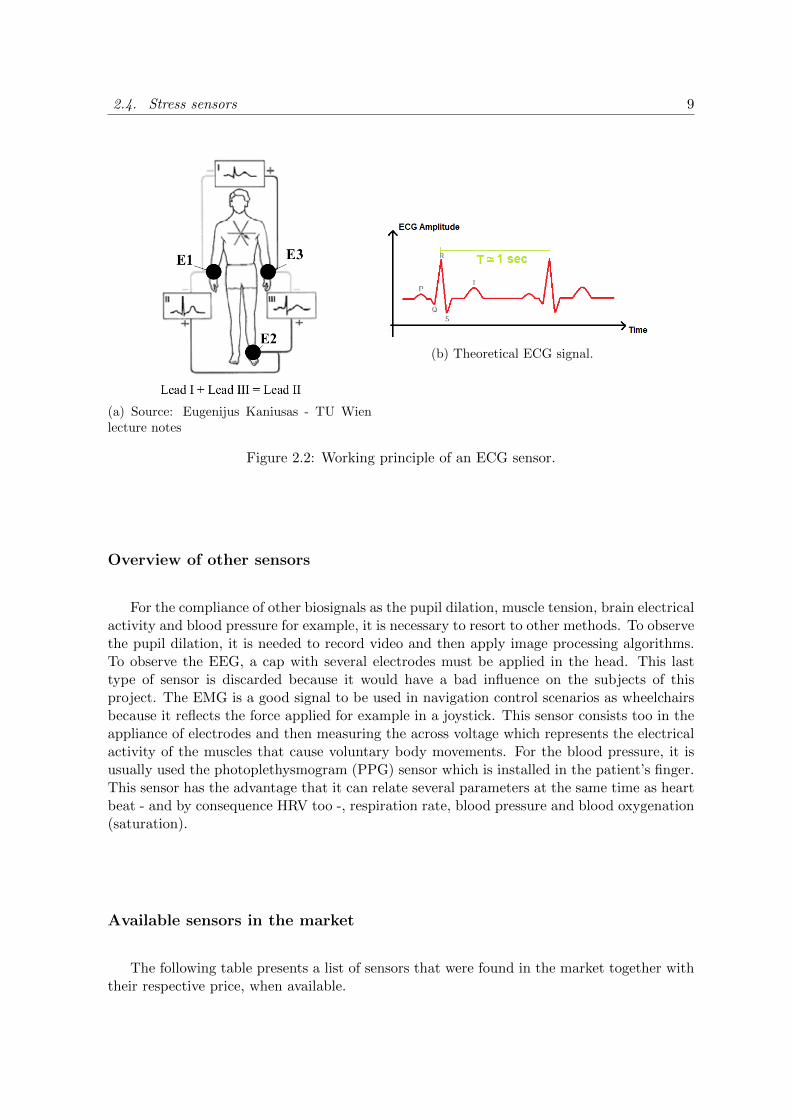
passings or other unexpected events. Figure 3.3 illustrates a hypothetical experiment in whichthese occurrences are marked and consequently being associated with the stress signals thatcan vary or not. The occurrences registering has to guarantee a temporal resolution of atleast one tenth of a second. This is, a priori, a satisfied requirement since the Android devicepermits to access temporal instances in the order of milliseconds.
Figure 3.3: Hypothetical visualization of biosignals data and occurrences.
Concerning the experimental data storage, it was decided to organize the local databaseas is illustrated in figure 3.4. The application has to give the possibility to register eachexperiment with the patient name. Each folder will contain files that carry all acquired dataof the respective experiment.
Figure 3.4: Local database organization.
Additionally, it was decided to display values captured by the sensors in real-time. Thus,the user receives a visual feedback of the biosignals that varies among the experiment.
Regarding already the future offline analysis, it was created a Matlab [24] interface thatexposes the measurements taken and also gives statistical results. The aim of this interfacewas to help the validation of the required platform and also to be the first prototype ofan analysing unit. A full-fledged version of this unit will perform an off-line processing toverify the adequacy of the stress detection system. However, this would require a constantly

3.3. Hardware elements 17
and manual file transfer between the Android device and a remote computer that holds theMatlab software. To eliminate this inconvenient, it was decided to add a new functionalityin the Android application which allows the uploading of data to Dropbox [25]. Althoughthis feature requires a internet connection on the Android device, it easily carries out the filetransfer enabling a quick access of the measurements on the analysing unit.
In resume, the requirements for the Android application are described bellow:
• Button to connect and disconnect with the wireless sensors and signalize the currentstate (connected or not).
• Button to register a new patient.
• Button to initiate and stop an experiment.
• Buttons to register occurrences with a resolution of one tenth of a second:
1 to Normal activities.
1 to Spontaneous events.
• Button to upload all data to Dropbox.
• Button to empty the local database.
• Display the captured biosignals in real-time.
• Display general informations in a panel.
• Button to clear the panel of informations.
3.3 Hardware elements
In this section is given an overview of the commercial sensors and also the processing unitused in this project. In the first ones, it will be described their configuration, what valuesthey transmit, the communication protocol and also how they are applied in the human body.About the last one, it will be described its characteristics and also the tools to develop theapplication.
3.3.1 Sensors
In order to acquire ECG and SC signals individually, it was used the commercial sensorsdeveloped by Shimmer-Research - model Shimmer 2R. Favourable to mobility situations, eachsensor includes a 3-axis accelerometer2, a Bluetooth module RN-42 from Roving Networksand a 450mAh rechargeable Li-ion battery.
They can be configured with different sampling rates, depending on the signal propertiesand the desired signal quality. This was done by using the Schimmer Connect v0.2 desktopsoftware which permits to select sampling rates from 10Hz to 1000Hz. Depending on this rate,each sensor associates a time stamp for each acquired sample and it can assume values from0 to 65535 (two bytes) which represents the number of ticks coming from the internal sensorclock [26]. This last component ticks 32768 times per second which allows the calculation of
2For now, it was decided to not use the 3-axis accelerometer.

18 Chapter 3. Requirements and development of the data acquisition platform
the elapsed time between samples. A special attention must be paid to the fact that the timestamp value can overflow.
Other parameters can be configured depending on the sensor. According to [27] and[28], these sensors have a 12-bit Analog to Digital Converter (ADC) which means that themeasured biosignals can assume values from 0 to 4095 which can be converted next into itsreal units.
Concerning now the sensors protocol to communicate with another remote device (re-ceiver) after guarantee a previous connection3, it can be simply represented by the figure 3.5.It is a simple protocol which consists in a handshaking that has to be done before and afterthe data transmission. Due that, it is allowed to perform multiple data transmissions withoutdisconnect and connect again with the sensors. More specifically, the handshaking has threecommand bytes: start (0x07 ), stop (0x20 ) and acknowledge (0xFF ).
Basic tests such as data frame verification were done on the RealTerm terminal [29] toaid the code development for the processing unit. The sensors have an indicator led that ison when sensors are connected and blinks when they are transmitting data.
Figure 3.5: Wireless communication protocol between Android device and one Shimmer sensoralready connected.
3This mandatory connection will be performed by the Android device as explained later.

3.3. Hardware elements 19
GSR sensor
As suggested in its manual, the application of the GSR sensor was always done as thefigure 3.6 presents. The sensor has two inputs for the electrodes applied in the fingers andit measures the SC between these two points. This measure is the main output and it canvary from 0.2µS to 100µS. In fact, this range is split in four sub-ranges to perform bettermeasurements and the sensor was configured to be in the Auto-Range mode which enablesan improved calculation of the current SC level of the subject. Regarding the calculation ofthe SC, it is done as it follows:
SC = a ∗ x+ b(Siemens) (3.1)
in which x is the value coming from the ADC and the parameters a and b are differentconstants for each sub-range.
Figure 3.6: GSR sensor application.
Concerning the sampling rate, this sensor was configured for all experiments done with10Hz since the SC does not need to be measured at frequencies exceeding 5Hz [4]. Therefore,the time stamp increment from one sample to other should be around 3276 ticks. Howeverit was observed that this difference (in ticks) between consecutive samples was 3200 whichmeans that the sensor samples at 10.24Hz in reality.
ECG sensor
As the figure 3.7b illustrates, the application of the ECG sensor in the human body revealsa high level of portability.

20 Chapter 3. Requirements and development of the data acquisition platform
(a) ECG sensor - figure obtained from [30](b) ECG sensor application.
Figure 3.7: Overview of the ECG sensor.
This sensor has three inputs to apply the respective electrodes: left-arm, right-arm, andleft-leg. Its main outputs are the values of lead II (right-arm, left-leg) and lead III (left-arm,left-leg). The value of lead I (right-arm, left-arm) can be calculated by software by subtractinglead III to lead II. The calculation in mV of the each lead is done as it follows:
Lead(mV ) =ADCvalue −ADCoffset
Gain∗ADCsensitivity (3.2)
By default, the offset is 2060 and the gain is 175. For more accurate results, these valueshave to be measured experimentally - [28]. About the sensitivity, it is given by:
ADCsensitivity =Vref
max ADC value=
3000(mV )
4095(3.3)
Regarding the sampling rate, it was observed, by doing several experiments, that 250Hzwas enough to give a good signal quality in order to detect the typical PQRST wave - figure2.2b. Selecting this rate, it means that the time stamp increment from one sample to othershould be approximately 131 ticks. However it was verified that the difference (in ticks)between consecutive samples was 128 which means that the sensor samples at 256Hz inreality.
3.3.2 Processing unit
The processing unit used was the tablet Asus Nexus 7 [31] which comes with the Androidoperating system 4.2.2 (Jelly Bean - second higher platform version distributed after Ginger-bread according to [32]). It is suitable for this project since it has the required characteristicspreviously mentioned in section 3.2 and also has the advantage of being supported by Googlei. e., the software updates are done more quickly. Besides that, there exists a large commu-nity of software developers that augment the development support due the fact it is an opensource project, free and multi-platform. As it was recommended in [33], the development ofthe Android application was done using the Android Developer Tools (ADT) Bundle whichcomes with an Eclipse IDE4 [34]. The programming language used is Java.
The tablet comes with a Bluetooth interface (version 2.1) that enables the establishment ofa communication with the two wireless sensors and also 32GB of storage to save experimentaldata. Additionally, this processing unit includes the Wi-Fi 802.11 b/g/n technology.
4Integrated Development Environment.

3.4. Application organization and development 21
Figure 3.8: Processing unit - figure source [35].
3.4 Application organization and development
The development of the Android application, called Stress measurement, was an importantpart of this project since it has to handle all the previously mentioned requirements, it hasto be user-friendly and also it has to take care of possible bad user’s inputs or internal deviceerrors. Initially, this section presents a quick overview of how the user can interact with theapplication and then it will be given more detail about its inherent functionalities.
When the application is launched, the first thing that is attempted (without the acknowl-edge of the user) is the creation of a directory on the device memory, called Database5, thatwill store all experimental acquired data. Due that, it is done an initial check to determinateif it is possible to write and read the media at the moment. It also verifies the existence of aBluetooth module and a speech recognizer. The last one was considered a promising featureregarding the vehicular applications. Since it is available on the tablet, it was decided toadapt it for the registering of occurrences. Regarding again the initial check, if any of thoseconditions fails, an error message is presented to the user and the application is closed.
In case of a successful check, then, the layouts of figure 3.9 are shown up sequentially.First, it is asked permission to enable Bluetooth and after the user allows it, he/she canstart interacting with the layout 3.9b. There, it is visible a panel in the bottom-right zonethat gives general informations such as the initial check, and it can be erased by pressing thebutton Clear panel.
5If this directory already exists, nothing is done.

22 Chapter 3. Requirements and development of the data acquisition platform
(a) Requiring Bluetooth enabling.
(b) Initial view
Figure 3.9: Initial views of the Android application.

3.4. Application organization and development 23
Figure 3.10 represents the normal flow of the Android application. As is required in allBluetooth aplications, the first intent in this case is to establish a connection between theAndroid device and the two sensors. Hence, after pressing the Connect Sensors button, thelayout 3.11 will not disappear till the connection is not guaranteed. After that, it is necessaryto register a new subject by pressing the button Register New Patient and then typing his/hername as illustrated in figure 3.12. This register menu will be re-prompted in case that thename inserted already exists in Database.
Therefore, the user can initiate a new experiment, by pressing the button Start Reading,and register an unlimited number of occurrences by pressing the Begin Activity or Spontaneousbutton. At this moment, it can be said that the application is in modus operandi which isillustrated in figure 3.13. There can be visualized the biosignals changes in real-time, morespecifically the SC (blue line of the graphic) and the instantaneous HR value. As will beexplained in subsection 3.4.2, the registering of occurrences can be done by voice or typing.
When the experiment is finished, the user just has to press the Stop Reading buttonand then, all acquired data is saved in the subject directory - see subsection 3.4.1 for moredetails. Afterwards, he/she can disconnect the device from sensors and then terminate theapplication, or instead of that, the user can always start a new experiment by registering anew patient and therefore perform multiple attempts.
Figure 3.10: Normal flow of the Android application.

24 Chapter 3. Requirements and development of the data acquisition platform
Figure 3.11: Bluetooth connection between the Android and the sensors.
Figure 3.12: Registering a new patient.

3.4. Application organization and development 25
Figure 3.13: Application layout in its modus operandi.
Concerning the remaining features, the data uploading to Dropbox is an isolated operationthat is explained in section 3.4.3 and the emptying of the Database is done after the userconfirms it - see figure 3.14.
In the following situations, nothing is performed besides giving an adequate warningmessage to the user:
• Trying to register a patient without a Bluetooth connection guaranteed.
• Trying to start a new experiment without registering a patient first.
• Trying to register occurrences out of an experiment.
• Trying to end an experiment without ending a current Normal Activity first.
• Trying to upload data to Dropbox during an experiment or when Database is empty.
• Trying to empty Database since after the patient has been registered and the end of theexperiment.
• Trying to disconnect sensors during an experiment.

26 Chapter 3. Requirements and development of the data acquisition platform
Figure 3.14: Deleting all files from Database.
Hereupon, the development of the application will be described in more detail, but beforethat, it has to be referred that a Bluetooth pairing between tablet and both sensors is requiredbefore attempting any connection. This was done manually instead of dynamically6 becausethe sensors were known a priori, so the directly usage of their Bluetooth addresses was enoughto establish the intended wireless communication.
Concerning the User Interface (UI) elements, this application is essentially composed bywidgets (buttons) that allow the user to perform specific operations. Analysing the figure3.13, the buttons with a line centered in its bottom region are the so called toggle buttons,which are suitable to control two complementary actions. This line represents the currentstate according to the button action. For example, the two top buttons present a cyan linewhich, in this case, means that the sensors are connected and a patient has already beenregistered. Another example is that if the user wants to register a new activity, the line turnsinto a cyan color after he/she presses the ”Begin Activity” button. The next time that theuser presses this button, this line will return to the black color signalizing the end of thenormal activity. In this way, it is guaranteed that an overlapping of this type of occurrenceswill never happen. The usage of the eight buttons allowed to control the application flow asit is represented in figure 3.15.
6Dynamic pairing means searching from Bluetooth devices and choose specific ones to pair.

3.4. Application organization and development 27
Figure 3.15: Flowchart of normal application’s operation.

28 Chapter 3. Requirements and development of the data acquisition platform
About the internal structure of the Android application, some concepts have to be in-troduced first. Normally, an Android application can be seen as a chain of activities7 thatcan switch between them, however, only one was used in this application - Main Activity.According to [36], an activity is a component that produces a single screen layout enablingusers to interact with what is presented on it such as buttons, images, etc. As illustratedin 3.16, each activity has a life-cycle with several states associated to callback methods asonCreate(), onStart(), onResume()8, onPause(), onStop() and onDestroy(), in order to turnthe application more flexible according to specific paths for state transitions. The developedactivity only uses the first three methods.
Figure 3.16: Activity life-cycle - figure source [37].
In the onCreate method is done the creation of view objects and also there was donethe majority of the control component regarding the normal operation of the application- see flowchart 3.15. A welcome message is given to the user when the activity reachesthe Started state which normally comes after the Created and is followed by the Resumedstate. In the onResume() method, Wi-Fi is directly turned on (in case it was not) and forBluetooth it is asked to the user to enable it or not by launching a new activity using thestartActivityForResult(Intent, int) method. When it happens, the Main Activity switches tothe Paused state turning its screen layout partially visible as can be noticed in figure 3.9aand, after a positive or negative user input, the Main Activity returns to the Resumed stateagain, so it will stay on that loop while the user doesn’t allow to enable Bluetooth. Whenthe user grants the permission, the Main Activity remains on the Resumed state, and then,the user can start interacting with the screen presented at 3.9b as was previously explained.
Concerning the Bluetooth communication, the developed code was based in the Android’sBluetooth APIs and some given examples as the Bluetooth Chat [38]. A particular note for theBluetooth adapter from the tablet, in which was turned off its discovering resource of remotedevices because it is an intensive procedure that is unnecessary in this case. For the connectionpart, the tablet has to connect (as a client) individually with the two Bluetooth socketsthat are created according to the Bluetooth addresses 00:06:66:42:1E:5A (ECG sensor) and
7Do not confuse with Normal Activity from the occurrences.8”Called just before the activity starts interacting with the user.” - [36]

3.4. Application organization and development 29
00:06:66:42:1E:7D (GSR sensor). It has to be remarked that these connections are done in anAsyncTask [39] that is executed in background and publishes the results on the UI thread9 ascan be seen in figure 3.11. After this, the tablet can handle two independent communicationchannels which will be managed by Threads [41] - one for each.
It was decided to manage each channel using one Thread instead of an AsyncTask sincethis last one should be used ideally for brief operations [39]. Both threads, which are executedconcurrently with the UI thread, are started when the Start Reading button is pressed andthen, it is sent the Start Streaming Command to sensors. First it is sent for the GSR sensorand then for the ECG sensor. At this stage, a file to save all the occurrences is created anda global variable containing the starting time of the experiment (using the Date class) isinitialized. Each thread creates a file (ecg and gsr files) to constantly write on it the relevantdata derived from the received Bluetooth frames during the experiment - see subsection 3.4.1.Also during it, the SC and HR are sent to the UI thread in order to visualize their values inreal-time - see section 3.4.4 for more details. When the user intends to stop the experimentby pressing the respective button, the Stop Streaming Command is sent to each remote deviceand the files are saved in the subject directory.
Next, will be described the storage data organization, the register of occurrences, theupload of data to Dropbox, the visualization of biosignals in real-time and finally the HRalgorithm implemented. But before that, a remark has to be done. Due the huge arrivaldelay of the tablet, the application had to be tested first in a smartphone with the Androidversion 2.3.3 and only afterwards it was done the code adaptation for the tablet due to the factthat the screen sizes and the operating systems versions are different. Besides the layout, theimportant change from one version to other was to put the network operation part (upload toDropbox) out of the UI thread because on newer versions of Android, starting with Android3.0, it throws the NetworkOnMainThreadException [42]. That’s the reason why an AsyncTaskwas used.
3.4.1 Data saved in the external storage directory
The data measured in real experiments has to be saved for posterior off-line analysis andin this case it is kept in the Android external storage directory which, according to [43], ”itis a filesystem that can hold a relatively large amount of data and that is shared across allapplications”. To cluster there all data coming from this application, the Database directoryis created and is in this exactly location that the Empty Database button also acts. Aswas said previously, an unrepeated directory is created for each patient before reading fromsensors, so, when the user decides to terminate the experiment, all acquired data is stored inthe respective folder as the figure 3.17 illustrates.
9”When an application is launched, the system creates a thread of execution for the application, called”main.” This thread is very important because it is in charge of dispatching events to the appropriate userinterface widgets, including drawing events. It is also the thread in which your application interacts withcomponents from the Android UI toolkit (components from the android.widget and android.view packages). Assuch, the main thread is also sometimes called the UI thread.” - [40].

30 Chapter 3. Requirements and development of the data acquisition platform
Figure 3.17: Data storage for each patient.
Each patient directory contains three different files: ecg, gsr and occurrences. The nameof each file contains the starting date of the experiment: day, month, hour, minutes andseconds - making them unrepeated without taking in mind the year. Each file is saved inthe comma-separated values (csv) format which is quite simple and is supported by a lot ofsoftware platforms as Matlab10. The figure 3.18 indicates, for each file, the headers11 (firstline) which indicates the parameters with their units, and exemplifies some values acquiredexperimentally. Since the GSR sensor was configured to be in Auto-Range mode, in case ofthe Range Change parameter, the value 0 means no change and the value 1 means that achange happened.
10To read csv files, Matlab has the function csvread(′filename′).11In case of the occurrences file, the ’Time (ms)’ field represents the same meaning of elapsed time.

3.4. Application organization and development 31
(a) GSR file (b) Occurrences file
(c) ECG file
Figure 3.18: Examples of each file saved in a patient directory.
3.4.2 Register occurrences
As it was said before, the registering of occurrences either for normal activities or sponta-neous events can be done by voice or typing. The voice feature brings a powerful advantagefor vehicular applications, i. e., in case that is the driver who is doing the registering (and nota person besides him/her), he/she just has to press a button and therefore speak naturallyto the tablet which handles the rest. Comparing with the typing mode, the voice mode isway more convenient during a driving context. However, the voice mode requires Internetconnection since it is used the startActivityForResult(Intent, int) method combined with theRecognizer Intent and its ACTION RECOGNIZE SPEECH option [44], which starts an ac-tivity that prompts the menu illustrated in figure 3.19. When this menu appears, the user hasto speak some (any) words and, after it detects the end of speech automatically, the capturedaudio signal is sent to Google’s servers, translated to text and returned to the onActivityRe-sult() method which is called when the above mentioned activity ends. There, the results canbe accessed and processed by the application. Similarly to the Bluetooth enabling activity,also in this case the Main Activity does the same state changes in its life-cycle: Resumed,Paused and Resumed again. Respecting to the typing mode, it essentially consists in an inputtext field similar to the figure 3.12.
Contextualizing with the normal operation of the Android application, the registering ofoccurrences is done as is described in the flowchart of figure 3.20. When the user pressesthe button, the first thing done is the calculation of the elapsed time, i. e., the differencebetween the actual moment and the starting time12 using the Date class. After that, itis checked the Wi-Fi connection and, if it is available, it is given a try with the speechrecognition. If everything worked well, the result is coupled with the elapsed time and savedin the occurrences file as a new entry. If there is no Internet connection or the speechrecognition failed for some reason, the occurrence name is registered by typing in order notto lose any event. A short example of the log file is illustrated in figure 3.18b.
12Is the moment when the user presses the Start Reading button.

32 Chapter 3. Requirements and development of the data acquisition platform
Figure 3.19: Registering an occurrence with speech recognition.
Figure 3.20: Flowchart of the occurrences registering.

3.4. Application organization and development 33
3.4.3 Upload data to Dropbox
Dropbox is a service which basically hosts files as a cloud storage and also synchronizesthem with a remote computer. In order to transfer all data from the Android device to theDropbox, it was used their Core API [45], which provides methods to do it in a low levelcontrol. The first step was to create a folder to be associated with the Android applicationspecifying its name and the Access Type permission. In this case, it was chosen the AppFolder type - which gives access only to the created one - and not the Full Dropbox typebecause it was not necessary to get full access of all user’s13 files and folders. Therefore anApp Key and an App Secret are received to be used in the developer code. In case Databaseis not empty, the next two steps are executed: invoke the startAuthentication() method andthen write all the files to the specific Dropbox folder. In normal conditions, attending thelife-cycle of the Main Activity in this segment, it changes its state by this order: Resumed,Paused, Stopped14, Started and finally Resumed again - see figure 3.16.
Since the tablet already had the Dropbox application installed, the user has to allow theaccess to the folder as the figure 3.21 illustrates15, in this case named Biosignals. Either theauthentication has succeeded or not, the application returns to the previous activity by callingthe onRestart() method after the user input, and when the onResume() method is called, anew AsyncTask is executed in background to upload data. As it can be seen in figure 3.22,all folders (and contained files) from Database directory are written to Dropbox in case of apositive authentication. The Progress Dialog window indicates how many files are left to besent in number and percentage. Besides that, it doesn’t disappear till all files are uploadedensuring that the user does not initiate a new experiment.
Figure 3.21: First part - authentication
13Dropbox user.14The Main Activity is hidden (fig. 3.21) and no code from this activity is executed in this state - [37].15In case that Dropbox application is not installed on the Android device, it will browse to the website.

34 Chapter 3. Requirements and development of the data acquisition platform
Figure 3.22: Second part - write files
3.4.4 Real-time visualization of biosignals changes
As in all mobile applications, the observation in real-time of any parameters changes givesa better feedback to the user. In this case, it was decided to ”follow” the signals coming fromthe GSR and ECG sensors, more specifically, the skin conductivity and the instantaneous HR.This last parameter is the one calculated by the real-time algorithm - see next subsection.
In order to visualize the SC signal in real time as the graphic plot of figure 3.13 illustrates,it was used the AChartEngine software library [46]. Suitable for Android applications, thislibrary is very useful and versatile at the same time because it permits to adjust a lot ofparameters as appearance (e. g. colors, axis), chart types (bar, line, pie, dial, etc.) andzoom tools for example. In this case, it was used a line chart type with a time window of 30seconds. Also from figure 3.13, it can be seen that the HR parameter is shown as an integervalue bellow the SC graphic.
The SC and HR values are constantly updated in the UI thread due the action of anHandler created for each parameter since they belong to different threads. According to[47], an Handler ”is part of the Android system’s framework for managing threads”, whichbasically allows a communication between a background thread and the UI thread by messagesprocessing. The Handler usage is necessary because the access to UI objects is not allowedfor background threads - in this case for the GSR and ECG threads.
3.4.5 Real-time heart rate algorithm
Currently the ECG sensor sends, via the Bluetooth frames, always the value 0 for theinstantaneous heart rate because this solution has not been released till this moment. So itwould be interesting to develop a real time algorithm able to calculate it. Remembering the

3.4. Application organization and development 35
HR definition16, the algorithm goal is to detect the R peaks and then apply the followingformula:
Heart rate =60 ∗ fsNsamples
(beatsperminute(bpm)) (3.4)
in which fs is the sampling rate (250Hz) of the ECG sensor and the Nsamples is the numberof samples between two consecutive R peaks.
Based in a threshold, the implemented algorithm is essentially divided in two parts and,as all algorithms, it has some advantages and disadvantages which are explained later in 4.3.Illustrated in 3.24a, the first part consists in reading approximately 3 seconds of data anddetermine the maximum value which will, normally, correspond to a R peak. After that,the important feature (threshold) is calculated as being 60%17 bellow the maximum valueand then, the second part can be started. Till the end of the first part, the heart rate isconsidered as 0. Concerning the second part and looking to figure 3.23, it basically consistsin counting the number of samples from Out to Out points, i. e., the ECG blue line. Whenit detects that the signal is above the threshold (In region), it continues to count the numberof samples till it recognizes that the signal is lower than the threshold (Out region). Only atthis last moment, the algorithm executes the formula 3.4 and therefore resets the number ofsamples to zero - see 3.24b. Till the next calculation, the HR value is maintained since theseoperations are done sample-by-sample. In normal conditions, the ending of the second partonly terminates when the user presses the Stop Reading button.
Figure 3.23: HR algorithm applied in the ECG signal.
16The heart rate is given by the inverse of the heart period, which is given by the time interval between twoconsecutive R peaks - [6].
17This percentage was found suitable due the observation of some experimental results done in laboratory.

36 Chapter 3. Requirements and development of the data acquisition platform
(a) First part
(b) Second part
Figure 3.24: Flowchart of heart rate algorithm.
3.5 Off-line processing with Matlab R©
The developed Matlab [24] interface was created to aid the validation of the platform andalso to perform a basic off-line processing in order to present experimental results (section 4),serving as the basis for future work. It was developed based in the GUIDE tool, which allowsto create programs with graphical interface. The figure 3.25 illustrates the global perspectiveof the interface which consists in five major blocks: importing data, list of occurrences, choosea time interval & amplitude threshold, graphical data and measurements.
This interface is based in algorithms developed by two open source projects: the Biosigproject [48] and Ledalab [49]. Both are open source software libraries under the GNU GeneralPublic License. The first one is used to extract features from the ECG signal and the secondone to extract features from the GSR signal. The following subsections describe in detail howthe interface works and which biosignal features are calculated over a specific time region.

3.5. Off-line processing with Matlab R© 37
Figure 3.25: Matlab interface developed.
Importing data
The first step in this interface is to load data previously acquired by the Android device.For that, pressing the ”Browse Biosignals Data” button, it will appear three consecutive win-dows to load, from any directory, the necessary three different files by this order: ecg date.csv,gsr date.csv, occurrences date.csv. To ensure that all data is load correctly, it will be requestedto load a new file if the name of the selected one is not coincident with the expected, i. e.,”ecg ... .csv”, ”gsr ... .csv” or ”occurrences ... .csv”. After that, the name of the threeselected files is displayed as the figure 3.26 illustrates enabling the possibility to verify if thecontents to be loaded are in accordance by looking to the dates of all files. If yes, then theuser just has to press the ”Load Data” button and a successful note is displayed if no othererror occurred.
Figure 3.26: Importing data block.

38 Chapter 3. Requirements and development of the data acquisition platform
Graphical data
When data is loaded, the graphical data area - four plots - is filled with all temporaldata obtained from ecg and gsr files, i. e., since the start of reading from sensors till theend of it. The bottom graph represents the HRV and it never actualizes its data accordingto the parameters of the block described after the next one. This 3D graph illustrates thespectral density of HRV over the frequency range and time - one in one minute. For that, thefunctions bellow are used and therefore three parameters are extracted from the X struct:X.ASpectrum, X.TotalPower and X.f .
f s = 250 ; % sampling f requency o f ECG sensorHDR = q r s d e t e c t ( Lead , f s , 2 ) ;X = h e a r t r a t e v a r i a b i l i t y (HDR) ;
The other three graphic axes can plot different signals depending of the user’s wish ac-cording to the several options described in the measurements block.
List of occurrences
After loading data, also the list-box shown in 3.27 is actualized with the informationcontained in the ”occurrences date.csv” file. Each line of the list-box has the following format:
Elapsed time (from the beginning) in milliseconds : Occurrence name
Another important feature of this list-box is that, if the user clicks on one of those events,it will be displayed on the top graph a blue vertical line - see examples in chapter 4 - markingthe respective event in order to easily associate the occurrence with the biosignals. Thisvertical line will just appear if the chosen occurrence is within the temporal range defined inthe block described next. To clear all previously selected occurrences it is necessary to clickin the first line of the list-box.
Figure 3.27: List of occurrences block.
3.5. Off-line processing with Matlab R© 39
Choose a time interval & amplitude threshold
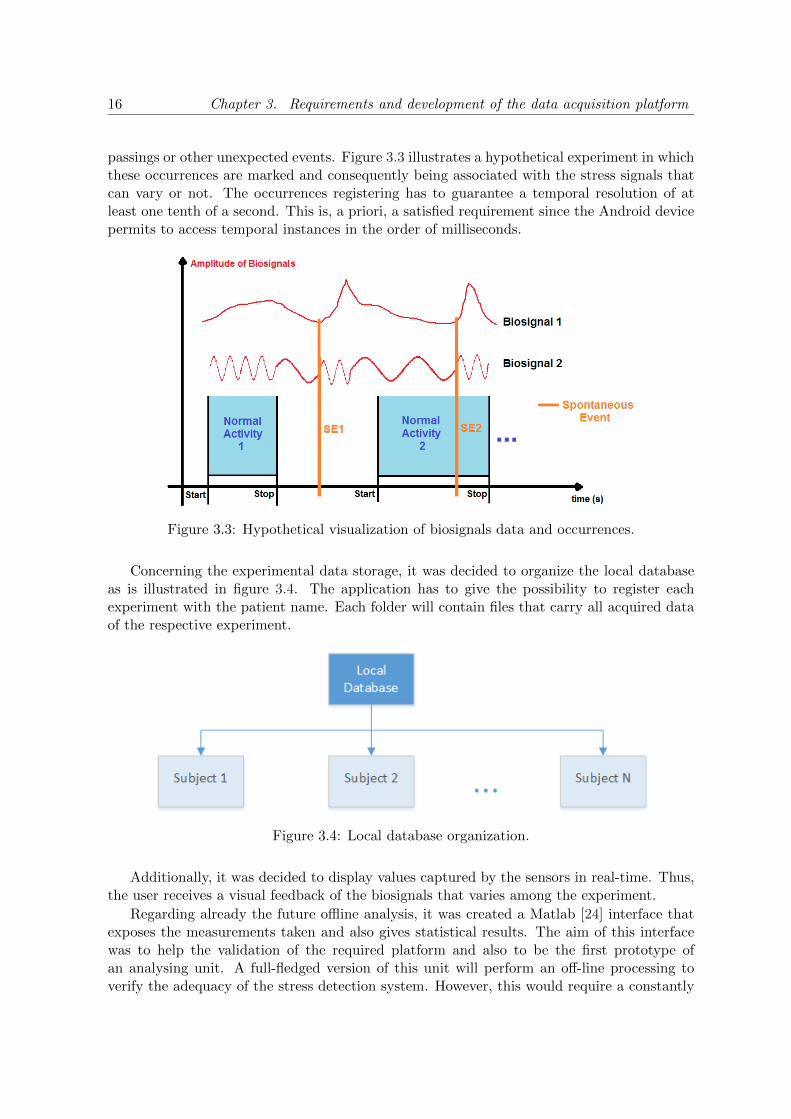
As the figure 3.28 illustrates, this block is intended to choose a time interval and theamplitude threshold. The first one is to restrict acquired data to a specific temporal rangeand basically it has two parameters: a starting time and an ending time, which can be chosenby looking to the list of occurrences. The second one is to select only GSR peaks with anamplitude difference above this threshold, i. e. the difference between the peak and theonset amplitudes, turning this versatile option useful to detect only huge peaks. After theparameters have been chosen, if the OK button is pressed and no error occurs as numeric typeor starting time being greater than ending time, the graphical data area will be actualizedas well as the GSR and ECG features - see next block. This block is useful to better analyseand observe the biosignals evolution during specific normal activities as driving in a city.
Figure 3.28: Temporal and threshold parameters block. Note: the ’end’ word just appearsby default in the initialization of the program.
Measurements
The measurement block consists in a list-box and fields with GSR and ECG features. Inthese fields, according to the time interval and amplitude threshold previously chosen, themean, maximum and minimum values of SC and HR are showed. Also for GSR, it is shownthe number of peaks detected as well as the mean of their rising times and relative peakamplitude.
Concerning the list-box, the user can selected what kind of data wants to visualize. Sothere are five options and each of them has three fields which represent, by order, the cor-respondent plot. These options are enunciated bellow and the first one is the default, i. e.,after load data, the plots illustrated are those from the first option.
• GSR, Lead I, Heart rate
• GSR, Lead II, Heart rate
• GSR, Lead III, Heart rate
• GSR, Change range (GSR sensor), Heart rate
• Compare HR Android and HR BioSig
The fourth option is basically to check the moments of when the GSR sensor changed therange in order to calculate the skin conductivity. The last option was created to characterize

40 Chapter 3. Requirements and development of the data acquisition platform
the quality of real-time HR algorithm developed. As the ECG sensor does not send it,neither the Android device calculates it, the Lead I vector is calculated here by software asthe difference between Lead II and Lead III. The HR vector from the first four options iscalculated always based in Lead II and in nqrsdetect function from BioSig. The Matlab codebellow shows how the heart rate vector is calculated in bpm.
f s = 250 ; % sampling f requency o f ECG sensorq r s i n d e x s = nqr sde t e c t ( Lead , f s ) ;q r s i n d e x s d i f f = d i f f ( q r s i n d e x s ) ;HR features . HR vector = 60∗ f s . / q r s i n d e x s d i f f ;
Concerning the GSR features, specifically for the number of peaks and their onset andrising times, it is used the smooth adapt and trough2peak analysis. The last one, whichcalls the get peaks function, was slightly adapted according to the interface needs.

Chapter 4
Experimental results
4.1 Summary
This chapter aims to validate the platform, make a comparison between the developedHR algorithm and the one from the Biosig project and also exhibits results from real exper-iments: vehicular navigation, video game and tilt table. To conclude, some remarks aboutthe measured biosignals and registered occurrences are mentioned.
4.2 Platform validation
In order to validate the platform, four main experiments were done: the first was to checkif it acquires data and registers occurrences properly; the second one to verify its reliability(no loss of data) for long time experiments which was done after confirming the adequateoperation of the first test; the third one to check lifetime of sensors battery; and finally thelast one to estimate the phase error committed when it is marked the starting time of anexperiment.
First test - verify the normal operation
So the first test consisted in simulating some occurrences from both types (normal activ-ities and spontaneous events) at specific timings. The ECG sensor was normally placed inthe body but not the GSR sensor because since it is easy to create pulse responses by pull-inand pull-out fingers of the electrodes due to SC properties, one pulse with a small durationwas triggered this way for each occurrence in order to check the synchronism between thebiosignal and the occurrences. In this test, it was followed the procedure described by thetable 4.1 1. The Wi-Fi was turned off before start reading from sensors in order to registerthe occurrences ’a’, ’b’ and ’c’ by typing. After ending the activity ’b’, the Wi-Fi was turnedon to enable the voice registering mode in order to say the portuguese word ’experiencia’which means experiment. The experiment was stopped fifteen seconds after registering thislast occurrence.
Results of the first test are illustrated in figure 4.1 in which the ECG signal is not presentdue to the high amount of samples acquired for fifteen minutes, but, has it will be shownin following results, the signal sent by Schimmer sensor is well processed by the platform
1N/A means stop reading from wireless sensors which is not registered as an occurrence.
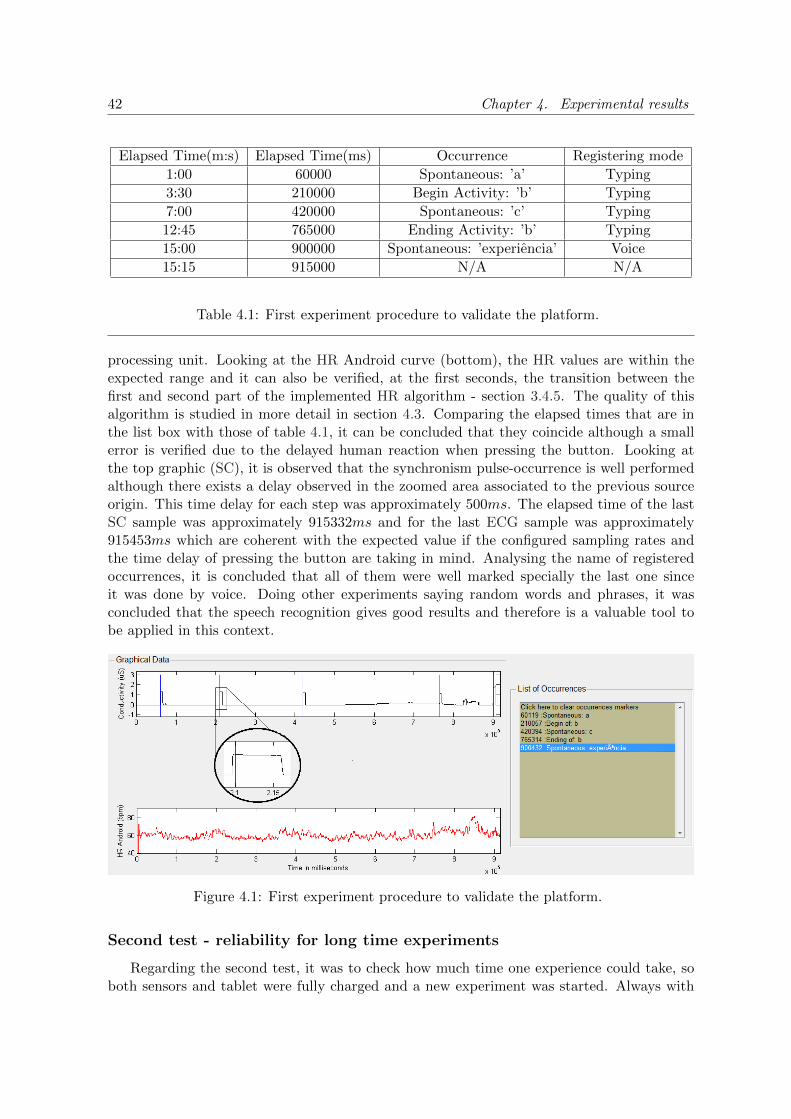
42 Chapter 4. Experimental results
Elapsed Time(m:s) Elapsed Time(ms) Occurrence Registering mode
1:00 60000 Spontaneous: ’a’ Typing
3:30 210000 Begin Activity: ’b’ Typing
7:00 420000 Spontaneous: ’c’ Typing
12:45 765000 Ending Activity: ’b’ Typing
15:00 900000 Spontaneous: ’experiencia’ Voice
15:15 915000 N/A N/A
Table 4.1: First experiment procedure to validate the platform.
processing unit. Looking at the HR Android curve (bottom), the HR values are within theexpected range and it can also be verified, at the first seconds, the transition between thefirst and second part of the implemented HR algorithm - section 3.4.5. The quality of thisalgorithm is studied in more detail in section 4.3. Comparing the elapsed times that are inthe list box with those of table 4.1, it can be concluded that they coincide although a smallerror is verified due to the delayed human reaction when pressing the button. Looking atthe top graphic (SC), it is observed that the synchronism pulse-occurrence is well performedalthough there exists a delay observed in the zoomed area associated to the previous sourceorigin. This time delay for each step was approximately 500ms. The elapsed time of the lastSC sample was approximately 915332ms and for the last ECG sample was approximately915453ms which are coherent with the expected value if the configured sampling rates andthe time delay of pressing the button are taking in mind. Analysing the name of registeredoccurrences, it is concluded that all of them were well marked specially the last one sinceit was done by voice. Doing other experiments saying random words and phrases, it wasconcluded that the speech recognition gives good results and therefore is a valuable tool tobe applied in this context.
Figure 4.1: First experiment procedure to validate the platform.
Second test - reliability for long time experiments
Regarding the second test, it was to check how much time one experience could take, soboth sensors and tablet were fully charged and a new experiment was started. Always with

4.2. Platform validation 43
Wi-Fi off and no other applications running in parallel, some occurrences were marked tocheck again the same issues done in the first test and it was obtained the intended synchronismas before. The test started at 15:27 and it has to be terminated at 23:38 of the same daysince it was the moment when the tablet only had only 10% of battery left. The elapsed timeof the last sample coming from GSR sensor was 29459765.625ms and from the ECG sensorwas 29460046.875ms which are coherent with the 8 hours and 11 minutes. The results ofequations 4.1 and 4.2 prove that no data frame was lost during the experience for GSR andECG sensors respectively2 since they are equal to the amount of received samples.
Nsamples =Last time(s) ∗ 32768
3200+ 1 = 301669 (4.1)
Nsamples =Last time(s) ∗ 32768
128+ 1 = 7541773 (4.2)
So it can be said that for ’outdoor’ experiments the system can properly acquire data onlyduring a bit more than 8 hours approximately. However, the total size of the three createdfiles was 287MB and some problems occurred in the Matlab interface related with memory3.
Third test - sensors battery lifetime
About the third test, a new experiment was started with both sensors fully charged,tablet plugged to the power source and the other same conditions of the second test. Asexpected, due to the higher sampling rate, the ECG sensor was the first stop transmittingdata. Its last sample had a elapsed time of 47493609.375ms, which means that the systemworked approximately during 13 hours. Once again, no data frames were lost during this test,however, by observing the SC graphic, it was noticed some stuttering - issue not verified inthe second test - right before ending the application, i. e. after ECG sensor turned off byitself, maybe due to some problems related with memory used for the graphic visualizationor even with the threads managing.
Fourth test - estimate the initial phase error
Since the Android device has to request data from two different sensors by sending theStart Streaming Command, it automatically implies an error when determining the initialinstant of the experiment. As this phase error affects the elapsed times of the registeredoccurrences, an estimative was made to calculate it - figure 4.2. Hence, it was verified thatthis error was always less or equal than 1 millisecond which is not critical for the ambit ofthis project.
2The meaning of values 32768, 3200 and 128 are explained in section 3.3.1.3It was used a 32-bit Matlab version (R2012b).

44 Chapter 4. Experimental results
Figure 4.2: Error made in determining the initial instant - phase error.
Other verifications
It was also confirmed in other experiments that the Android application gives the possi-bility to register occurrences by typing in case that there is no internet connection or if thetranslate fails, so there is no loss of occurrences. Moreover, the uploading to Dropbox of allpatients directories from the Database directory was always successfully done - as is logic, thetime to upload them depends on their size.
It was verified along several experiments that sometimes it takes too much time to connectwith both sensors. The AsyncTask used for this purpose was to implement a loop code toguarantee that after pressing the Connect Sensors button, the user only can interact againwith the Android application after the connection is really established4.
Just to conclude this validation, also the action of the Android application button ”EmptyDatabase” works well.
4.3 Comparison of heart rate algorithms
In this section, the quality of the heart rate algorithm implemented in the processing unitis analysed. Starting with figure 4.3, three different graphics are illustrated: ECG(Lead II),HR calculated in real-time by the Android device and the HR calculated off-line in the Matlabinterface. The calculation of the two HR vectors are always based in the Lead II vector. Justto remember in the Android case, the HR value is calculated beat-to-beat, i. e., while thenext R peak is not found, the previous HR value is maintained. Comparing HR vectors, itcan be concluded that the real-time algorithm is working well - in fact, this is verified in themajority of all acquired data.
4The is due the fact that the connect() method blocks till the connection succeeds or fails.

4.3. Comparison of heart rate algorithms 45
However, it has imperfections that occur rarely and some of them were detected whichare described next. Remembering that the algorithm is based in a threshold defined as 60%bellow the R peak, two imperfection types can be seen in figures 4.4 and 4.5. In the firstone, from 865 to 880 seconds, the baseline5 oscillates and this is due to subject movementsthat affect the potential difference measured by electrodes. Therefore, since the threshold isbellow that noise value visible in the zoomed area, the algorithm considered it as a R peakand then calculated a high HR value because the number of samples counted within the RRinterval decreased significantly - see formula 3.4. In the second one, it is seen that the Tpeaks have the same amplitude than the R peaks, so the failure reason is the same of theprevious imperfection but from a different origin6 - compare with figure 3.23. So the worstcase for the real-time algorithm is this last one because it constantly gives wrong values sincethe ECG wave maintain that pattern and the first one only gives wrong values sporadically.
Nevertheless, the bottom curve of figures 4.4 and 4.5 indicates that BioSig functions applyalgorithms more robust to handle several artefacts. Since one of the aims of this project wasto acquire data to posteriorly analyse it off-line, it is concluded that the usage of the Biosigproject is very reliable and useful.
Figure 4.3: Real-time heart rate algorithm - no fails.
5In this case, the baseline is the 0mV line.6The reason that explains this (non-expected) high value of T peak is related with the ventricular repolar-
ization (relaxation) [6]

46 Chapter 4. Experimental results
Figure 4.4: Real-time heart rate algorithm - imperfection 1.
Figure 4.5: Real-time heart rate algorithm - imperfection 2.

4.4. Vehicular navigation context 47
4.4 Vehicular navigation context
In this context, real car driving experiments were done in the city of Aveiro with foursubjects, all of them in different days, with the same routine, starting approximately at11h00 am with a duration of nearly 45 minutes. The experimental procedure was very simple:at the beginning the driver stayed five minutes in the car relaxing and trying to get used tothe car; then he/she started to drive in the city for some minutes; the next step was to drivein a highway in direction to the beach named Barra, return back and finally do the inverseroute, i. e. driving in the city and then park the car. The experiment was only finished afterfive minutes of relaxing seated in the car. The second city driving phase was shorter (about2 minutes) when compared with the first. During all these phases, spontaneous events astraffic lights changes, pedestrian crossing road suddenly, passing roundabouts were markedby a co-pilot. At the time of these experiments, it was used an Android smartphone in whichit was not possible to get an Internet connection. Due that, the register of events had to bedone always by typing, thus, not to put in risk the driver’s safety, the aid of the co-pilot wasnecessary.
The first subject was a 25 years man, the second was a 50 years woman, the third wasa 23 years man and the last one was a 37 years man. The results of this mental-physicalactivity are presented next with a brief analysis for each subject. The error presented in sometable cells means that the maximum HR value was affected by ’noise’ or body movements(artefacts). Theoretically, it is expected that the stress level of persons is higher when drivingin the city, lower in resting phases and intermediate in the highway. A small note for the peaksdetected in the SC signal, which were chosen to be above a threshold of 0.1uS. Concerningyet these peaks, the peak amplitude and rising times are measured since the onset and themaximum value of the peak.
Results from subject 1
The results of this masculine subject are presented in table 4.2 and figure 4.6.
—– Rest 1 City 1 Highway City 2 Rest 2
Mean HR (bpm) 59.8 74.6 67.8 72.3 61.4
Maximum HR (bpm) 76.1 96.2 88.2 89.8 84.8
Minimum HR (bpm) 43.1 48.5 37.8 53.6 46.3
Mean Conductivity (µS) 2.1 4.4 4.2 4.8 2.4
Maximum Conductivity (µS) 2.9 7.5 8.9 9.4 4.8
Minimum Conductivity (µS) 1.8 3.2 2.8 3.5 1.8
Number Peaks Detected 1 97 77 34 3
Mean Peaks Amplitude (µS) 0.12 0.74 0.79 0.85 0.14
Mean Peaks Rising Time (s) 3.2 2.1 1.9 1.6 2.2
Table 4.2: Driving results of subject 1 - 25 years old man.
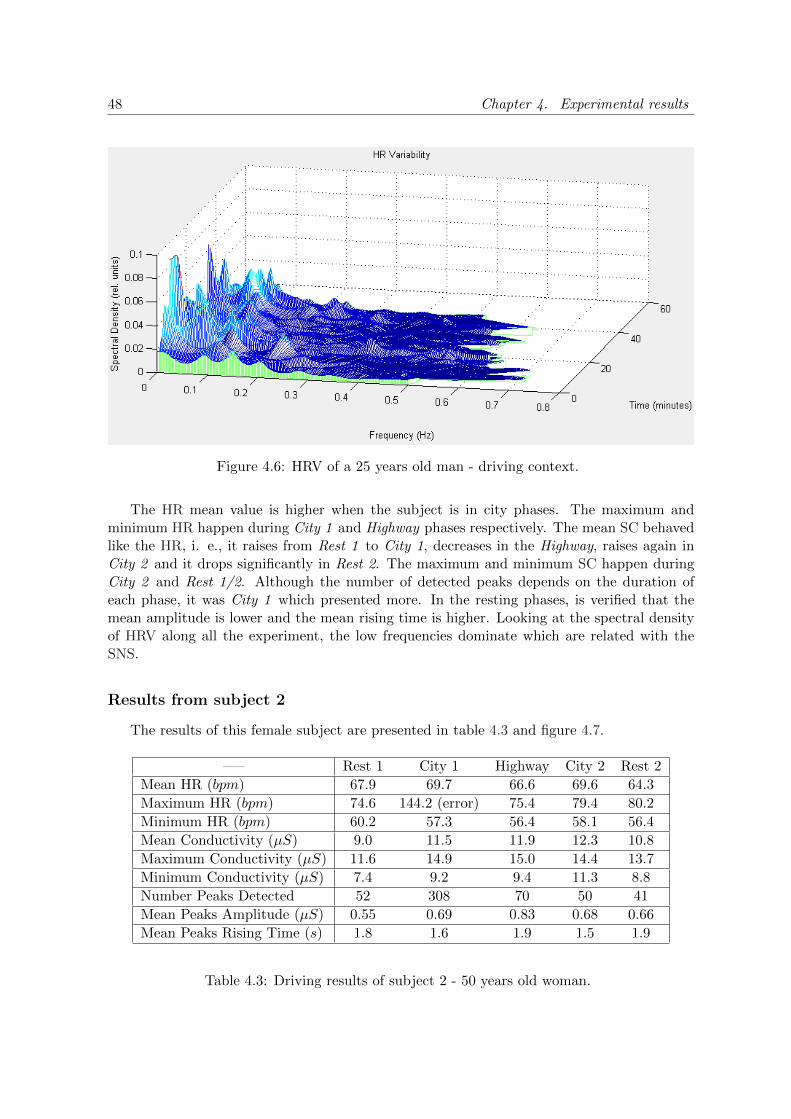
48 Chapter 4. Experimental results
Figure 4.6: HRV of a 25 years old man - driving context.
The HR mean value is higher when the subject is in city phases. The maximum andminimum HR happen during City 1 and Highway phases respectively. The mean SC behavedlike the HR, i. e., it raises from Rest 1 to City 1, decreases in the Highway, raises again inCity 2 and it drops significantly in Rest 2. The maximum and minimum SC happen duringCity 2 and Rest 1/2. Although the number of detected peaks depends on the duration ofeach phase, it was City 1 which presented more. In the resting phases, is verified that themean amplitude is lower and the mean rising time is higher. Looking at the spectral densityof HRV along all the experiment, the low frequencies dominate which are related with theSNS.
Results from subject 2
The results of this female subject are presented in table 4.3 and figure 4.7.
—– Rest 1 City 1 Highway City 2 Rest 2
Mean HR (bpm) 67.9 69.7 66.6 69.6 64.3
Maximum HR (bpm) 74.6 144.2 (error) 75.4 79.4 80.2
Minimum HR (bpm) 60.2 57.3 56.4 58.1 56.4
Mean Conductivity (µS) 9.0 11.5 11.9 12.3 10.8
Maximum Conductivity (µS) 11.6 14.9 15.0 14.4 13.7
Minimum Conductivity (µS) 7.4 9.2 9.4 11.3 8.8
Number Peaks Detected 52 308 70 50 41
Mean Peaks Amplitude (µS) 0.55 0.69 0.83 0.68 0.66
Mean Peaks Rising Time (s) 1.8 1.6 1.9 1.5 1.9
Table 4.3: Driving results of subject 2 - 50 years old woman.

4.4. Vehicular navigation context 49
Figure 4.7: HRV of a 50 years old woman - driving context.
Once again, the HR mean is higher for the both City phases. The minimum HR occurred inthe Highway and Rest 2 phases. Here, the mean conductivity didn’t follow the HR behavioursince it was constantly increasing till the City 2 phase and then decreased in the restingphase. The maximum and minimum SC values happened during Highway and Rest 1 phasesrespectively. It has to be highlighted the number of detected peaks during City 1 comparingwith others phases. The mean of amplitudes was higher in the Highway phase as well as themean rising times.
Results from subject 3
The results of this masculine subject are presented in table 4.4 and figure 4.8.
—– Rest 1 City 1 Highway City 2 Rest 2
Mean HR (bpm) 58.6 63.3 60.1 62.5 59.0
Maximum HR (bpm) 72.8 172.4 (error) 142.9(error) 75.0 75.0
Minimum HR (bpm) 52.3 54.5 51.7 54.4 49.2
Mean Conductivity (µS) 1.0 2.0 2.7 3.4 3.4
Maximum Conductivity (µS) 1.3 2.9 4.4 4.2 5.5
Minimum Conductivity (µS) 0.7 1.2 2.0 2.8 2.5
Number Peaks Detected 4 32 29 7 44
Mean Peaks Amplitude (µS) 0.21 0.24 0.47 0.50 0.55
Mean Peaks Rising Time (s) 4.2 3.2 3.6 2.5 2.4
Table 4.4: Driving results of subject 3 - 23 years old man.
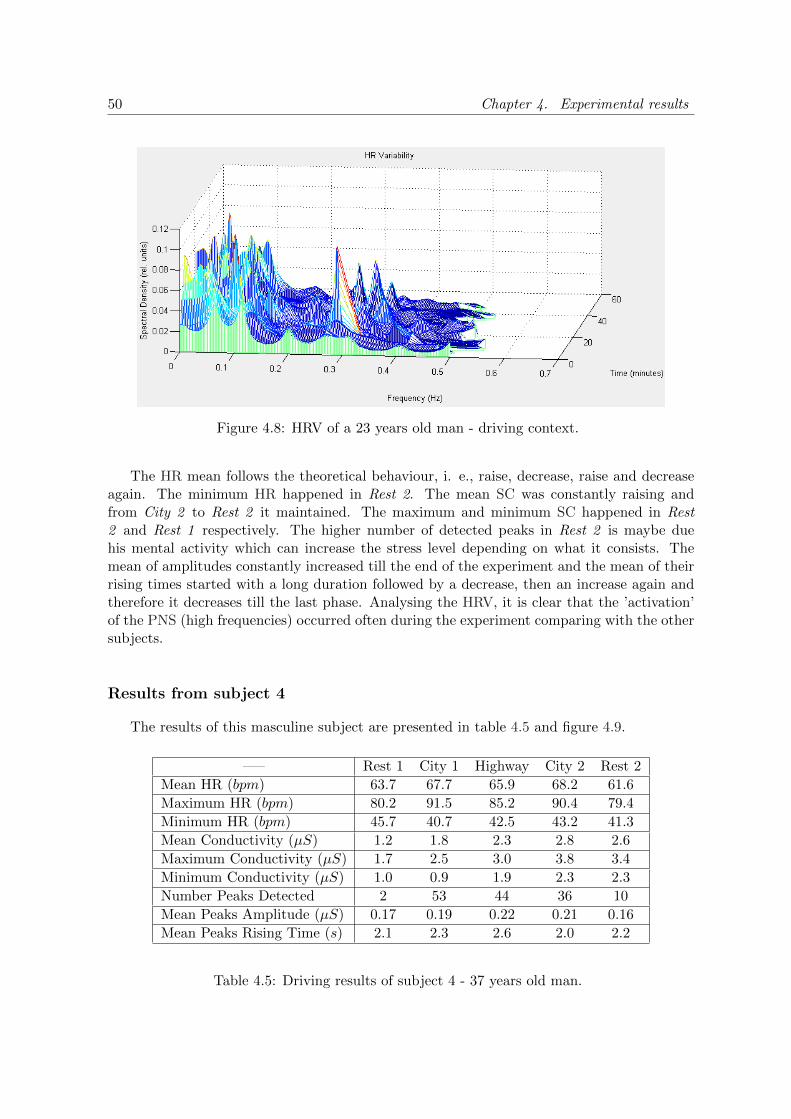
50 Chapter 4. Experimental results
Figure 4.8: HRV of a 23 years old man - driving context.
The HR mean follows the theoretical behaviour, i. e., raise, decrease, raise and decreaseagain. The minimum HR happened in Rest 2. The mean SC was constantly raising andfrom City 2 to Rest 2 it maintained. The maximum and minimum SC happened in Rest2 and Rest 1 respectively. The higher number of detected peaks in Rest 2 is maybe duehis mental activity which can increase the stress level depending on what it consists. Themean of amplitudes constantly increased till the end of the experiment and the mean of theirrising times started with a long duration followed by a decrease, then an increase again andtherefore it decreases till the last phase. Analysing the HRV, it is clear that the ’activation’of the PNS (high frequencies) occurred often during the experiment comparing with the othersubjects.
Results from subject 4
The results of this masculine subject are presented in table 4.5 and figure 4.9.
—– Rest 1 City 1 Highway City 2 Rest 2
Mean HR (bpm) 63.7 67.7 65.9 68.2 61.6
Maximum HR (bpm) 80.2 91.5 85.2 90.4 79.4
Minimum HR (bpm) 45.7 40.7 42.5 43.2 41.3
Mean Conductivity (µS) 1.2 1.8 2.3 2.8 2.6
Maximum Conductivity (µS) 1.7 2.5 3.0 3.8 3.4
Minimum Conductivity (µS) 1.0 0.9 1.9 2.3 2.3
Number Peaks Detected 2 53 44 36 10
Mean Peaks Amplitude (µS) 0.17 0.19 0.22 0.21 0.16
Mean Peaks Rising Time (s) 2.1 2.3 2.6 2.0 2.2
Table 4.5: Driving results of subject 4 - 37 years old man.

4.4. Vehicular navigation context 51
Figure 4.9: HRV of a 37 years old man - driving context.
Once again, the HR mean value followed the theoretical behaviour. The maximum andminimum HR occurred both during the City 1 phase. The SC raised till City 2 and thendecreased in the last phase. The maximum and minimum SC occurred in City 2 and City 1respectively. The number of detected peaks is lower in the resting phases and it was higherduring City 1. Concerning the mean amplitude of peaks, it was higher during the Highwayas well as their mean rising time. Analysing the HRV, it can be noticed an activation of thePNS at the end of the experiment - resting phase.
Comparison among all subjects
In order to make a comparison among all subjects, the table 4.6 presents, for each driver,the values of the entire experience: mean of HR, total number of detected peaks, meanamplitude and rising times of all peaks.
—– Driver 1 Driver 2 Driver 3 Driver 4
Mean HR (bpm) 67.2 67.6 60.7 65.4
Total Number of Peaks 212 521 116 145
Mean All Peaks Amplitude (µS) 0.528 0.682 0.394 0.190
Mean All Peaks Rising Time (s) 2.20 1.74 3.18 2.24
Table 4.6: Mean values of detected GSR peaks for all road circuit.
It is concluded that drivers 1 and 2 present higher heart-rate mean values, total numberof peaks as well as mean amplitude of peaks. On the other hand, drivers 3 and 4 present thehigher rising times, which means that the adaptation to stress responses differs from personto person.
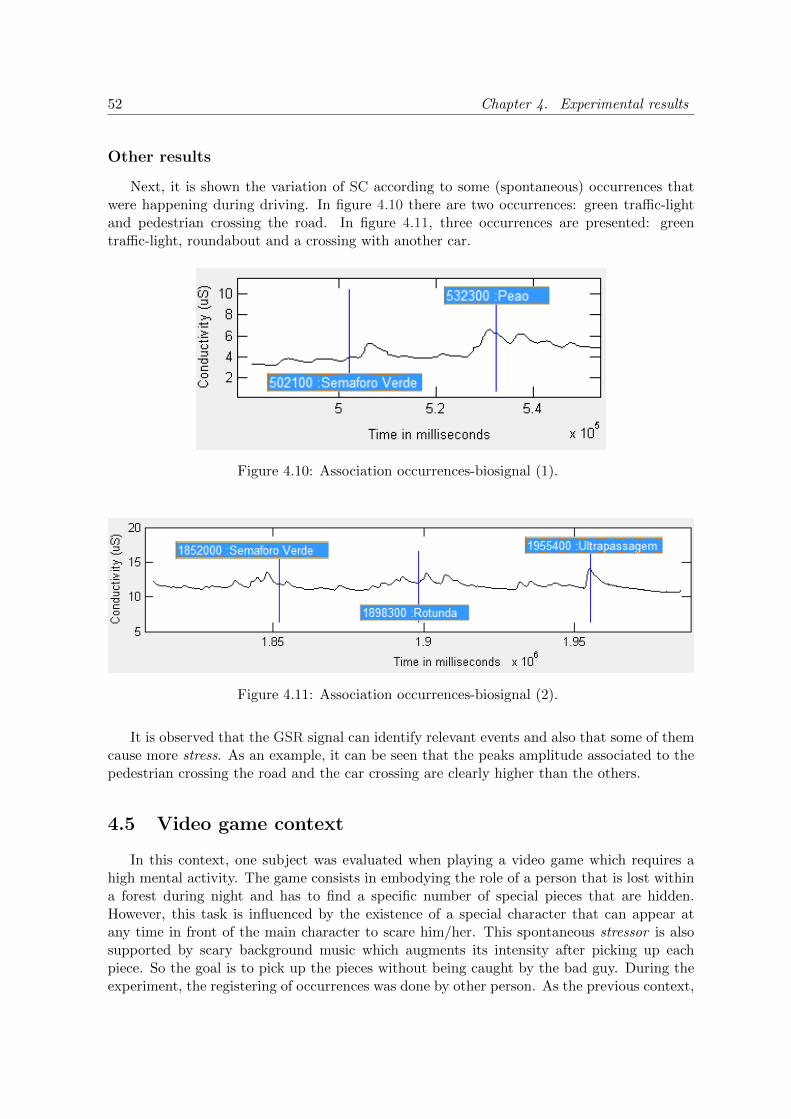
52 Chapter 4. Experimental results
Other results
Next, it is shown the variation of SC according to some (spontaneous) occurrences thatwere happening during driving. In figure 4.10 there are two occurrences: green traffic-lightand pedestrian crossing the road. In figure 4.11, three occurrences are presented: greentraffic-light, roundabout and a crossing with another car.
Figure 4.10: Association occurrences-biosignal (1).
Figure 4.11: Association occurrences-biosignal (2).
It is observed that the GSR signal can identify relevant events and also that some of themcause more stress. As an example, it can be seen that the peaks amplitude associated to thepedestrian crossing the road and the car crossing are clearly higher than the others.
4.5 Video game context
In this context, one subject was evaluated when playing a video game which requires ahigh mental activity. The game consists in embodying the role of a person that is lost withina forest during night and has to find a specific number of special pieces that are hidden.However, this task is influenced by the existence of a special character that can appear atany time in front of the main character to scare him/her. This spontaneous stressor is alsosupported by scary background music which augments its intensity after picking up eachpiece. So the goal is to pick up the pieces without being caught by the bad guy. During theexperiment, the registering of occurrences was done by other person. As the previous context,

4.5. Video game context 53
it was given five minutes to rest before and after the real playing. A small note for the peaksdetected in the SC signal, which were chosen to be above a threshold of 0.1uS.
Table 4.7 presents a resume of all the experiment, the figure 4.12 illustrates the behaviourof SC and HR signals during playing phase, and table 4.8 enunciates the registered occur-rences.
—– Rest 1 Playing Rest 2
Mean HR (bpm) 58.6 62.3 57.8
Mean Conductivity (µS) 1.8 2.2 2.1
Number Peaks Detected 7 31 3
Mean Peaks Amplitude (µS) 0.27 0.33 0.19
Mean Peaks Rising Time (s) 5.0 4.2 3.4
Table 4.7: Results of subject 1 - video game context.
Figure 4.12: SC and HR of subject 1 - during playing phase.
Elapsed time (ms) 528976 576658 644187 766360 818500 844014
Occurrence piece fright fright piece fright fright
Elapsed time (ms) 978320 1101244 1140412 1347646 1362860 1369881
Occurrence relax fright piece fright fright end
Table 4.8: Occurrences and their elapsed time during the play phase.
It is verified that, during the play, the mean HR, SC, number of detected peaks andpeaks amplitude was higher than in resting phases. Every time that the bad guy appeared,it originated a peak in the SC. But not only this was the reason to originate peaks, i. e., thepeak detected before the 1000 seconds is related with a deep respiration that the subject did

54 Chapter 4. Experimental results
in order to relax himself. This peak had an amplitude of 1.45uS and a rising time of 10.9seconds. There it is also observed the significant increase of the HR to almost 100bpm.
4.6 Tilt table context
In an occasional conversation with cardiologists of the nearest hospital of our laboratory,it was discussed a few thoughts about the purpose of this project and how it could be perhapsextended to new diagnostic methods in the cardiology branch. It was pointed that our plat-form acquires two biosignals (ECG and SC) that carry reliable information about the humanstress and how this information is related with the SNS and PNS. In doctors perspective, itcaught their attention due the fact that some diagnosis of cardiac diseases are supported bymeasured parameters which reveals the activation or not of these two systems. For example,a well-known characteristic of high-risk patients after myocardial infarction is the increase ofthe sympathetic activity and, in parallel, the reduction of the parasympathetic activity [50].Some of those parameters are derived from the ECG signal as the HR and HRV. However,till now, the GSR signal is not approved among the medical community has being a markerof the SNS (de)activation, so it would be interesting to research in deep the characteristics ofthis biosignal and observe if it can be properly included in future diagnosis.
Here comes the tilt table which is no more than a table that can be tilted. This instru-ment is used by the cardiologists in some diagnosis, e. g., syncope, which is getting morecommon nowadays. According to [50], syncope is defined ”as a transient, self-limiting lossof consciousness caused by global cerebral hypoperfusion, accompanied by a loss of voluntarymuscle tone as well as spontaneous recovery when lying supine”.
Thereupon, combining a tilt table test with impedance cardiography, non-invasive bloodpressure and continuous ECG measurements - which is what cardiologists do in their labs- enables physicians to give a detailed diagnostic about the ANS which includes the SNSand PNS. Independently of diagnosis type that is intended to do, typical tilt table testingprotocols consist in several phases such as applying sensors, resting phases in supine position,tilt the table with specific angles and also administrate drugs - [50].
So the goal of this spin-off project, which is still under development, is to understandif the skin conductivity is able to clearly distinguish the SNS activity from PNS activityas the other signals measured by their devices can do. To verify it, a comparison underspecific experimental conditions and procedures between GSR signal and the tilt table testingmeasures - already approved among the medical community - will be done and thereforereport conclusions. For now, only a preliminary test can be presented which compares theskin conductivity measured by our sensor with the heart rate measured by their device. Beingessentially a physical test, it consisted in seven stages which are described in the table 4.9with the respective expected results. The experimental results of the three evaluated subjectsare presented in 4.13, 4.14 and 4.15 and for each of them, the upper curve corresponds to theHR and the bottom curve is the SC. A remark for the picture 4.14 in which the upper curveis the RR interval (period) instead of HR, so it is the inverse curve.

4.6. Tilt table context 55
Initial rest HR (≈ constant), SC (≈ constant)Exercise a hand HR (↑), SC (↑)
Rest HR (↓), SC (↓)Abdominal exercise HR (↑), SC (↑)
Rest HR (↓), SC (↓)Abdominal exercise HR (↑), SC (↑)
Final rest HR (↓), SC (↓)
Table 4.9: Experimental phases with expected results.
In these experiments, it is visible that, somehow, the SC accompanies the HR. Besidesthat, 4.14 and 4.15 clearly shows a match between the expected and experimental results- in 4.13 this is not so clear. Another interesting fact mostly observed in 4.14, is that theSC has a certain temporal delay, i. e., the time between the beginning of physical activityand the sweat glands activation, because the GSR sensor detects perspiration only on thislast moment. The illustrated latency7 is approximately 1 second and it can be an importantparameter because, as already discussed with cardiologists, it would make sense to verify if itis a standard value. It is also noticed that the recovery time is shorter than the rising time,which allows to easily detect physical start-ups. Additionally, comparing the SC of figures4.14 and 4.15 corresponding to a 23 years old men and a 40-50 years old men respectively, itcan be observed that the fight or flight body response differs from person to person because,when they started the first abdominal exercise, the signal raised about 2µS for the youngersubject and only about 1µS for the other. Besides this, it is also observed for the samemoment that the skin conductivity rise time is longer for the older person.
Just to conclude this section, this experiment was only a starting point but the resultsare already promising because they indicate good indices of similarity between SC and HRsignals which means that future examinations can be done. However, it must be referredtwo things: the first is concerned about the experimental protocol which still has to beclearly defined before any measurement and the second is that the synchronism between both(independent) measurement devices should be carefully done in further experiments not toloose the temporal reference of occurrences, because in this experiment, event registering wasonly done in the Android device. This negative issue is visible in the graphical results sincethere exists a temporal mismatch between the two biosignals. Nonetheless this does not affectthe credibility of the conclusions made above.
7In this case, since it was used the Android application, this latency could be affected by other factors - seesection 4.7
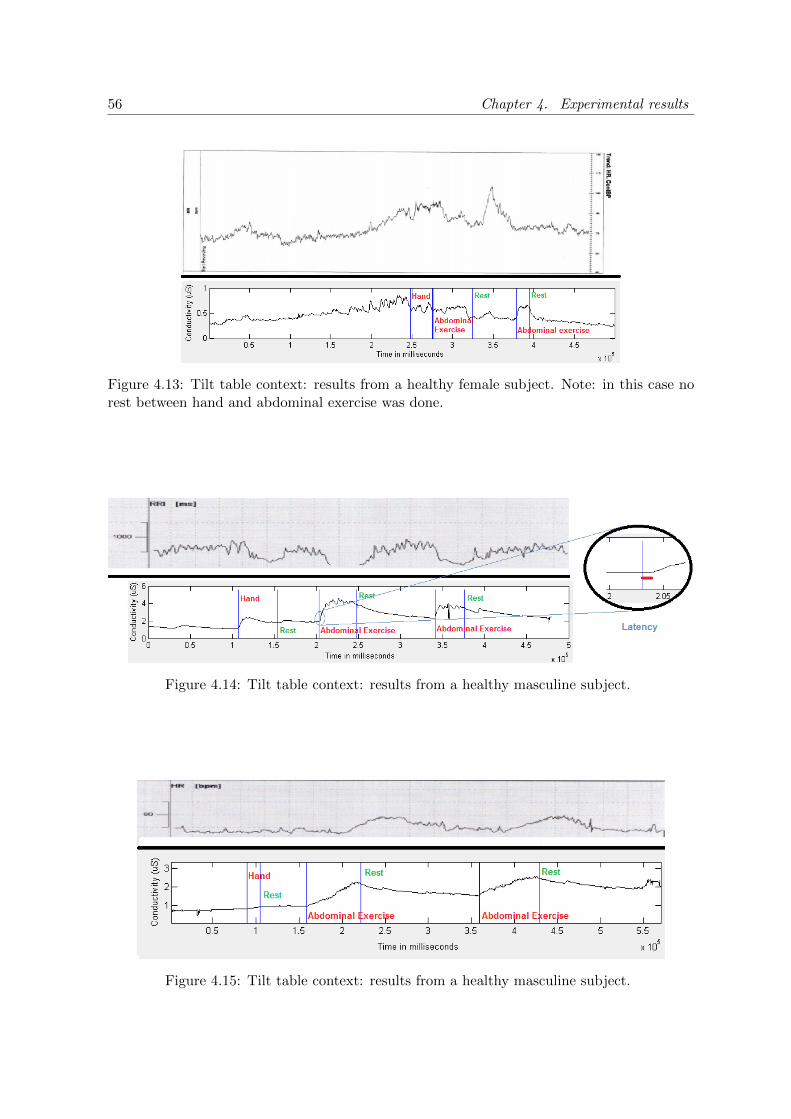
56 Chapter 4. Experimental results
Figure 4.13: Tilt table context: results from a healthy female subject. Note: in this case norest between hand and abdominal exercise was done.
Figure 4.14: Tilt table context: results from a healthy masculine subject.
Figure 4.15: Tilt table context: results from a healthy masculine subject.

4.7. Remarks about the measured biosignals and registered occurrences 57
4.7 Remarks about the measured biosignals and registered oc-currences
Throughout the experiments carried out, there were found some interesting details aboutthe measured biosignals: SC and ECG. Some of these are described bellow:
• In general, it was observed that, somehow, the SC accompanies the HR.
• Not all the SC peaks are associated to an occurrence maybe due to the mental activityor the human delay when pressing a button.
• It was verified on a person with calloused hands, that the SC signal was very constanteven exercising the hand where the electrodes were applied, which means that there waslittle release of perspiration.
• It was verified during the resting phase of a video game context that a peak with anamplitude of approximately 2.32µS and a rising time of 8.4s came up when the subjecthad itching in the back and scratched that body zone with the hand without the GSRsensor. In this situation, any changes in the HR was verified.
• The derivation of the respiration from the ECG signal maybe be done by several ways,and one of them is by tracking the amplitude of the R peaks [6]. Figure 4.16 wasobtained from an experimental result. During inspiration the R amplitude decreases,and during the expiration it increases.
Figure 4.16: Respiration derived from the ECG.
The use of the GSR sensor in physical exercise tests has to be carefully managed sinceits working principle is related with perspiration. To conclude, it has to be referred that thisplatform was not built to measure the peak latency of the SC observed in the previous section,due to the way of registering occurrences, i. e. due the delay when pressing the button.

58 Chapter 4. Experimental results

Chapter 5
Conclusions and future work
5.1 Summary
In this chapter is done a review of all the developed work and its conclusions. It is alsopointed out some possible future work concerning the detection of human stress.
5.2 Conclusions
The human stress exists in all persons and it may come from several reasons such astasks deadlines or anxiety. It is known that this stress can affect the human actions andtherefore leading to undesired events such as accidents while driving a car. Another exampleof inherent stress consists in those persons who are severely impaired and have difficulties inaccomplishing tasks as crossing a door by driving an electric wheelchair. So, the existenceof a real-time stress detection system that could be adapted in these vehicular applications,will be very useful in the future in order to support the driving, for example to alert thedriver about his/her stress state and to ask him/her to reduce the velocity, or in case oftetraplegic persons to implement a semi-automatic control of wheelchair when he/she is notable to accomplish some task.
However to build a complex system like this one, it is necessary to split it in several steps:discover how the stress can be measured, collect an increased amount of those measures, testand validate stress detection algorithms (and classifiers) and finally merge all the know-howinto a full-fledged system. This dissertation was intended to serve as the basis for that systemand it covered the two first steps.
In this work, it was presented a portable platform that acquires stress related signalsas well as allows the registering of induced-stress occurrences with their respective timings.This platform uses two non-invasive wireless commercial sensors connected by Bluetooth toan Android based tablet. The comfortable and wearable sensors acquires the electrocardio-gram and the skin conductivity signals, which carry reliable information about human stressaccording to the case study done in section 2.3. To receive data from sensors and registeroccurrences, it was developed an Android application that allows a person to interact withit in a friendly way. The registering of these occurrences can be done by voice or typing,and they will permit to identify, in an off-line analysing unit, which occurrences causes morestress. Furthermore, the application stores all acquired data and exhibits in real-time the SCand HR values. In section 4.2, some tests were performed in order to validate the adequate

60 Chapter 5. Conclusions and future work
operation of the platform and it is concluded that all the requirements mentioned in section3.2 are satisfied. Experimental results were obtained in different contexts such as vehicu-lar navigation, video game and also in medical area, and therefore analysed off-line using adeveloped Matlab interface. This shows the multiple application of this platform.
Although, in general, the platform works well, it has some undesired problems such asthe time to connect with both sensors. Sometimes, this time takes 1-3 seconds and othertimes it takes around 5 minutes, then, it would be desirable to reduce this waiting time.Concerning the memory problem related with the Matlab interface observed when the storedfiles contained 287MB of experimental data, a first step to try to fix it would be test it in a64-bit version and in case that it works, it should be developed a single solution that requiresthat Matlab version.
5.3 Future work
The first steps to build the above mentioned stress detection system were mostly accom-plished. To improve the ongoing of this project, some future work can be pointed out as isdescribed bellow:
• Collect an increased amount of data, under the same experimental conditions, in orderto analyse it via off-line. Therefore, stress algorithms can be validated and then adaptedto the referred real-time operation.
• Improve the real-time HR algorithm since the final system has to work in real-timeconditions. Also from the ECG, implement a real-time algorithm able to derive therespiration, which is another parameter related with the stress - data fusion.
• In the future, replace the commercial sensors by specifically developed ones which in-cludes a low-power wireless connection, more adequate for the user and using a protocolthat permits real-time operation.
• Concerning the actual Android application, include a feature that recognizes if theAndroid device lost the connection with the sensors due several reasons such as beingdistant from each other or battery died. In that case, warn the user and then do anadequate procedure.
• Include the Global Positioning System (GPS) feature in the Android application toprovide the car location, which can be useful to detect dangerous points on the road.
To conclude, it is known that age plays an important role in the normal behaviour of theANS, so it would be interesting to study the age influence in car driving situations since itrequires quick reflexes from driver and normally they decrease with age.
Without forgetting the tilt table context (medical area), it has to be referred that thisplatform can be adapted to detect changes of the ANS in pathologies such as diabetic witha dysfunctional response. Another example is the analysing of the ANS in the absence ofthe nocturnal arterial tension (sleep) which can lead to an increased cardiovascular risk. Notproved yet, it is believed that this is due the ANS dysfunction.

Bibliography
[1] ISR (Institute of Systems and Robotics). Last access: March 2013. [Online]. Available:http://www.isr.uc.pt/
[2] Artificial Recognition System (ARS) model - Vienna University of Technology. Lastaccess: March 2013. [Online]. Available: http://ars.ict.tuwien.ac.at/wiki/index.php/ARSModell
[3] A. Abdullah and U. Hassan, “Design and development of an emotional stress indicator(esi) kit,” in Sustainable Utilization and Development in Engineering and Technology(STUDENT), 2012 IEEE Conference on, 2012, pp. 253–257.
[4] M. Strauss, C. Reynolds, S. Hughes, K. Park, G. Mcdarby, and R. W. Picard, “Thehandwave bluetooth skin conductance sensor,” in In ACII. Springer, 2005, pp. 699–706.
[5] E. Vavrinsky, V. Stopjakova, and L. Majer, “Electrical biomonitoring towards mobilediagnostics of human stress influence,” in Applied Sciences in Biomedical and Commu-nication Technologies, 2009. ISABEL 2009. 2nd International Symposium on, 2009, pp.1–6.
[6] E. Kaniusas, Biomedical Signals and Sensors I: Linking Physiological Phenomena andBiosignals, ser. Biological and Medical Physics, Biomedical Engineering. Springer, 2012.
[7] P. Karthikeyan, M. Murugappan, and S. Yaacob, “A review on stress inducement stim-uli for assessing human stress using physiological signals,” in Signal Processing and itsApplications (CSPA), 2011 IEEE 7th International Colloquium on, 2011, pp. 420–425.
[8] M. T. Quazi and S. Mukhopadhyay, “Continuous monitoring of physiological parametersusing smart sensors,” in Sensing Technology (ICST), 2011 Fifth International Conferenceon, 2011, pp. 464–469.
[9] A. de Santos Sierra, C. Avila, G. Bailador del Pozo, and J. Guerra Casanova, “Stressdetection by means of stress physiological template,” in Nature and Biologically InspiredComputing (NaBIC), 2011 Third World Congress on, 2011, pp. 131–136.
[10] J. Zhai and A. Barreto, “Stress detection in computer users based on digital signal pro-cessing of noninvasive physiological variables,” in Engineering in Medicine and BiologySociety, 2006. EMBS ’06. 28th Annual International Conference of the IEEE, 2006, pp.1355–1358.

62 Bibliography
[11] H. Patro, G. Raja, and S. Dandapat, “Classification of stressed speech using gaussianmixture model,” in INDICON, 2005 Annual IEEE, 2005, pp. 342–346.
[12] J. Wagner, J. Kim, and E. Andre, “From physiological signals to emotions: Implementingand comparing selected methods for feature extraction and classification,” in Multimediaand Expo, 2005. ICME 2005. IEEE International Conference on, 2005, pp. 940–943.
[13] J. Healey and R. Picard, “Detecting stress during real-world driving tasks using physio-logical sensors,” Intelligent Transportation Systems, IEEE Transactions on, vol. 6, no. 2,pp. 156–166, 2005.
[14] J. Mihalov, V. Stopjakova, R. Zalusky, and L. Majer, “Wireless measurement system forcontinuous biomonitoring towards stress diagnostics,” in Applied Electronics (AE), 2012International Conference on, 2012, pp. 183–186.
[15] Shimmer-Research. Last access: March 2013. [Online]. Available: http://www.shimmer-research.com/
[16] MIT Media Lab - affectiva. Last access: March 2013. [Online]. Available:http://www.affectiva.com/q-sensor/features/
[17] Bio-Medical Instruments, Inc. Last access: March 2013. [Online]. Available:http://bio-medical.com/
[18] India Mart. Last access: March 2013. [Online]. Available: http://www.indiamart.com/
[19] BioPac Systems. Last access: March 2013. [Online]. Available: http://www.biopac.com/
[20] Zephyr. Last access: March 2013. [Online]. Available: http://www.zephyr-technology.com/products/
[21] Polar. Last access: March 2013. [Online]. Available: http://www.polar.com/en/products/accessories?product=mobile
[22] Quirumed. Last access: March 2013. [Online]. Available: http://www.quirumed.com/pt/
[23] Ec21. Last access: March 2013. [Online]. Available: http://www.ec21.com/product-details/Heart-Rate-Monitor--7357073.html
[24] Matlab. Last access: May 2013. [Online]. Available: http://www.mathworks.com/products/matlab/
[25] Dropbox. Last access: April 2013. [Online]. Available: https://www.dropbox.com
[26] Shimmer Packet Format - Bluetooth Boilerplate.
[27] GSR Shimmer sensor - User Guide rev 1.5.
[28] ECG Shimmer sensor - User Guide rev 1.4.
[29] Realterm - serial capture program. Last access: March 2013. [Online]. Available:http://realterm.sourceforge.net/

Bibliography 63
[30] ECG sensor from Schimmer-Research. Last access: March 2013. [Online]. Avail-able: http://www.shimmer-research.com/wp-content/uploads/wpsc/product images/Shimmer-ECG-Module-Full-Enc.jpg
[31] Asus Nexus 7 - tablet. Last access: March 2013. [Online]. Available: http://www.google.com/nexus/7/specs/
[32] Platform versions distribution. Last access: April 2013. [Online]. Available:http://developer.android.com/about/dashboards/index.html#Platform
[33] Android Developer Tools. Last access: March 2013. [Online]. Available: http://developer.android.com/sdk/index.html
[34] Eclipse Platform - Software tool. Last access: March 2013. [Online]. Available:http://www.eclipse.org/
[35] Android Tablet Asus Nexus 7. Last access: March 2013. [Online]. Available:http://www.google.com/nexus/7/
[36] Android for developers - Activities. Last access: April 2013. [Online]. Available:http://developer.android.com/guide/components/activities.html
[37] Android for developers - Activity life-cycle. Last access: April 2013. [Online]. Avail-able: http://developer.android.com/training/basics/activity-lifecycle/starting.html#launching-activity
[38] Android for developers - Bluetooth. Last access: April 2013. [Online]. Available:http://developer.android.com/guide/topics/connectivity/bluetooth.html
[39] Android for developers - Asynctask. Last access: April 2013. [Online]. Available:http://developer.android.com/reference/android/os/AsyncTask.html
[40] Android for developers - process and threads. Last access: April 2013. [Online]. Available:http://developer.android.com/guide/components/processes-and-threads.html#Threads
[41] Android for developers - thread. Last access: April 2013. [Online]. Available:http://developer.android.com/reference/java/lang/Thread.html
[42] Networkonmainthreadexception. Last access: April 2013. [Online]. Available: http://developer.android.com/reference/android/os/NetworkOnMainThreadException.html
[43] Android for developers - external storage directory. Last access: April 2013.[Online]. Available: http://developer.android.com/reference/android/os/Environment.html#getExternalStorageDirectory()
[44] Android for developers - Recognizer Intent. Last access: April 2013. [Online]. Available:http://developer.android.com/reference/android/speech/RecognizerIntent.html
[45] Dropbox for developers - Dropbox Core Api. Last access: April 2013. [Online].Available: https://www.dropbox.com/developers/core
[46] AChartEngine - charting software library for Android applications. Last access: April2013. [Online]. Available: http://www.achartengine.org/

64 Bibliography
[47] Android for developers - handler. Last access: April 2013. [Online]. Available:https://developer.android.com/training/multiple-threads/communicate-ui.html
[48] The BioSig Project - biomedical signal processing. Last access: April 2013. [Online].Available: http://biosig.sourceforge.net/
[49] Ledalab - skin conductance signal processing. Last access: April 2013. [Online].Available: http://www.ledalab.de/
[50] T. Schwalm, Modern Tilt Table Testing and Non-Invasive Monitoring. AbwWissenschaftsverlag, 2006, last access: May 2013. [Online]. Available: http://books.google.pt/books?id=pirfAAAACAAJ
[51] Android for developers. Last access: April 2013. [Online]. Available: http://developer.android.com/
[52] M. Murphy, Beginning Android 2, ser. Apresspod Series. Apress, 2010, last access:May 2013. [Online]. Available: http://books.google.pt/books?id=2XeNswkT 2YC