Embed Size (px)
Citation preview

PHOSPHO-CALCIUM METABOLISM
PRETERM
Luís Pereira-da-Silva
Hospital de Dona Estefânia, CHLC EPE
Faculdade de Ciências Médicas, UNL
Escola Superior de Tecnologias da Saúde de Lisboa, IPL
Course: Neonatal Nutrition
Braga, May12th 2012

PRETERM
METABOLIC BONE DISEASE
Neonatal Childhood

Metabolic Bone Disease
Vachharajani. NeoRev 2009
Osteopenia
Decrease in organic bone matrix (osteoid): thickness or number of
trabeculae or thickness of bone cortex
bone mineral content (BMC) (mass of mineral per unit length)
Osteomalacia
Decrease in mineralization of organic bone matrix accumulation of
nonmineralized bone matrix and softening of bones.
BMC plus bone mineral density (BMD) (ratio of BMC to bone area)

Osteopenia of Prematurity
Bozzetti. Ital J Pediatr 2009
Occurs at 10th–16th postnatal weeks, but it may remain silent until
severe demineralization
Affects 23% of VLBW and 55% of ELBW infants

PRENATAL
POSTNATAL - NICU
POSTNATAL - POSTDISCHARGE
PRENATAL
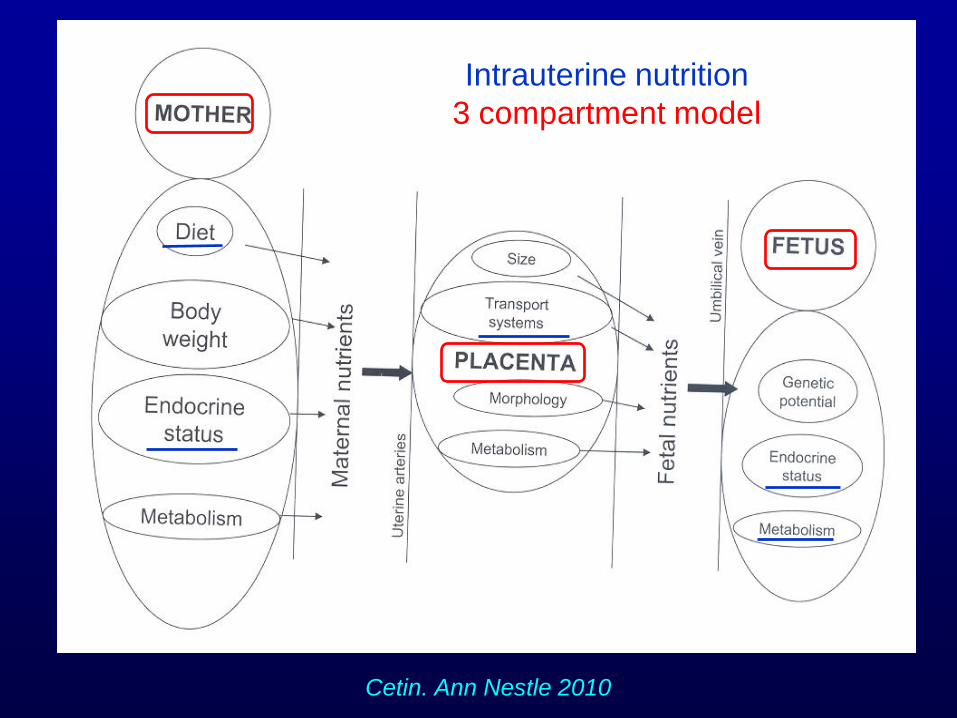
Cetin. Ann Nestle 2010
Nutrição óssea Intrauterine nutrition
3 compartment model

Bone nutrition last trimester
>24 weeks: mineral transference with peak of:
Ca (active transport) 120-150 mg/Kg/d (~ 13-16 ml/Kg/d of Ca
gluconate 10%)
P 60-75 mg/Kg/d
Mg 2.5-3.4 mg/Kg/d
Mineral transference - dependent on maternal Ca and vitamin D status
Vachharajani. NeoRev 2009, Velaphi. S Afr J Clin Nutr 2011

Bone nutrition last trimester
Maternal Ca intake
Low intakes (<600 mg/d) risk for lower bone mass in neonates
Koo. Obstet Gynecol 1999
Maternal Ca supplementation does not affect newborn bone
mineral mass in populations with adequate baseline intakes Prentice. J
Nutr 2003

Bone nutrition last trimester
Maternal vitamin D status
Prospective study on 424
pregnant women:
Maternal vitamin D insufficiency
can influence fetal femoral
development (high resolution
3D ultrasound) as early as 19
weeks’ gestation
Mahon. J Bone Miner Res 2010

Bone nutrition last trimester
Maternal vitamin D status
Cohort on 198 children born in UK, evaluated at age of 9 years:
Maternal use of vitamin D supplements associated with greater
childhood bone mineral mass
Very low maternal concentrations of serum 25-hydroxyvitamin D
associated with lower bone mineral mass in the offspring
Javaid . Lancet 2006

Bone nutrition last trimester
Cooper. Nestlé Nutr Workshop Ser 2008, Vachharajani. NeoRev 2009
Endocrine
environment
PTH / PTHrP
GH/IGF axis
T3
vit D3
Calcitonin
Estrogen
Endocrine environment
The fetus is maintained hypercalcemic in a high calcitonin and
estrogen environment promoting the modeling/ remodeling ratio
in favor of modeling increasing the endocortical bone
Rigo. J Pediatr 2006
Bone nutrition last trimester

Bone nutrition last trimester
Other factors
Mechanical stimulation – regular fetal kicks against the uterine wall
Rauch. Arch Dis Child F&N Ed 2002
Parental height Harvey. J Clin Endocrinol Metab 2008
Chorioamnionitis, preeclampsia Vachharajani. NeoRev 2009

Bone nutrition last trimester
Ossification
Intramembranous (skull,
face)
Endochondral (remaining
skeleton)
Cooper. Nestlé Nutr Workshop Ser 2008,
Velaphi. S Afr J Clin Nutr 2011
Bone nutrition last trimester
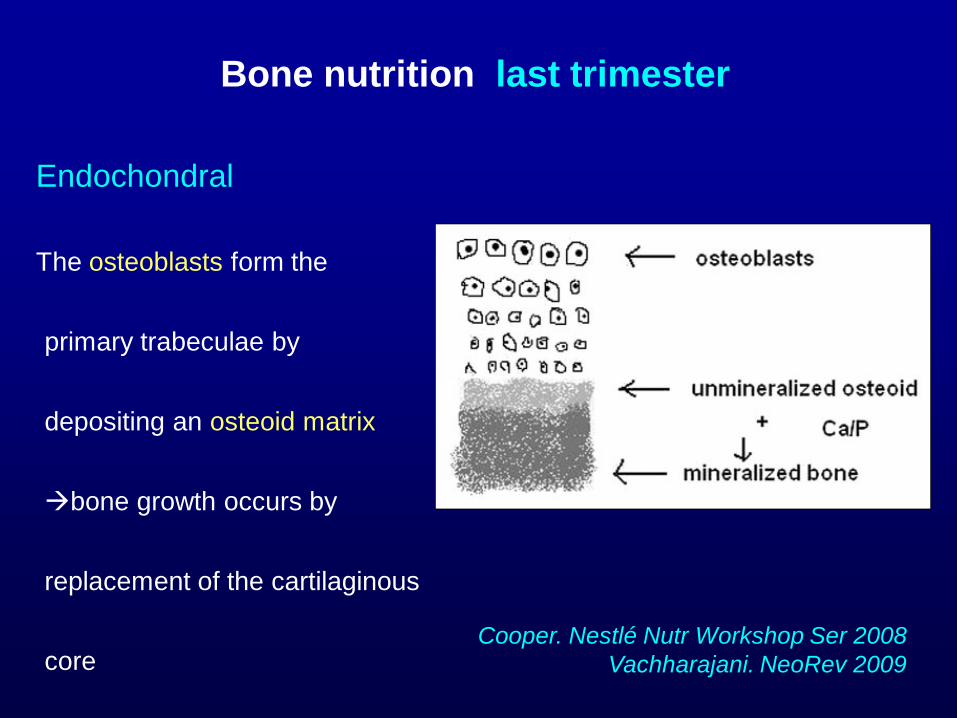
Cooper. Nestlé Nutr Workshop Ser 2008
Vachharajani. NeoRev 2009
Endochondral
The osteoblasts form the
primary trabeculae by
depositing an osteoid matrix
bone growth occurs by
replacement of the cartilaginous
core

POSTNATAL
NICU
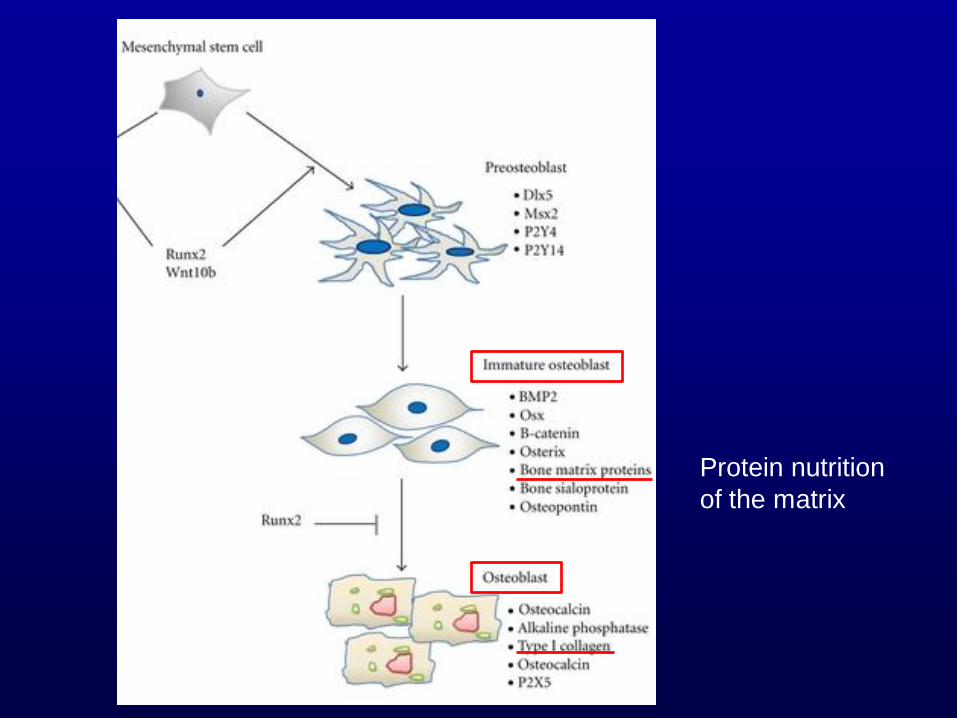
Protein nutrition
of the matrix

Bone nutrition preterm infant
Rauch. Arch Dis Child F&N Ed 2002; Rigo. J Pediatr 2006
NUTRIENTS
Energy e protein: collagen of the matrix
Minerals: Ca, P, Mg
Vitamin D
Protein and Energy

I. At birth loss of transference
of nutrients in 3rd trimester
II. In NICU difficulty in providing
all the nutrients – by parenteral
and enteral routes
IUGR and EUGR
VLBW infants (<1500g)
II. Discharge
I. At birth

IUGR and EUGR
VLBW infants (<1500g)
At birth: ±18% with IUGR
At the end of neonatal period
and at discharge: ±75% with
EUGR Precoce
? Recuperação
Pós-alta
Ehrenkranz. Pediatrics 1999
Martin. Pediatrics 2009

Short term: AA + energy weight gain
RCT 125 neonates <1250g
Parenteral nutrition:
Group A: AA + lipids up
to 3.5g/Kg/d
Group B: AA up to
2.5g/Kg/d + lipids up to
2g/Kg/d
More aggressive PN
(early high doses)
weight gain
Wilson. Arch Dis Child F&N Ed 1997
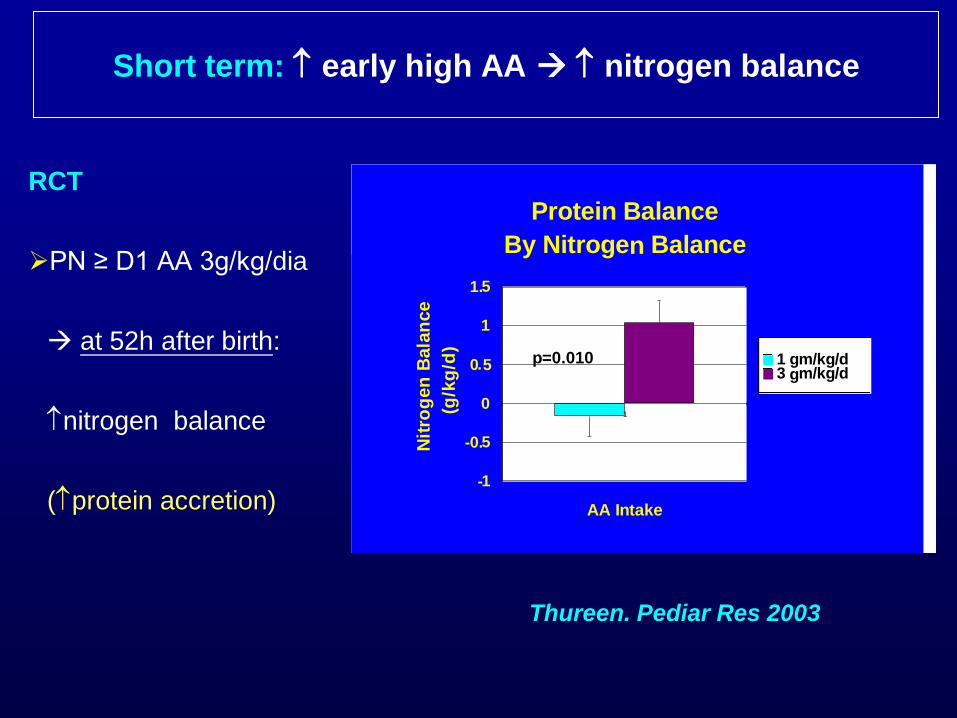
RCT
PN ≥ D1 AA 3g/kg/dia
at 52h after birth:
nitrogen balance
(protein accretion)
Protein Balance
By Nitrogen Balance
-1
-0.5
0
0.5
1
1.5
1
AA Intake
Nit
rog
en
Bala
nce
(g/k
g/d
)
1 gm/kg/d3 gm/kg/d
p=0.010
Thureen. Pediar Res 2003
Short term: early high AA nitrogen balance

3 RCT Population N Intervention (I)
Control (C)
Outcome
Thureen.
Pediar Res
2003
BW
<1300g
28 I: PN (g/Kg/d) start AA = 3
C: PN (g/Kg/d) start AA = 1
I: protein accretion
(nitrogen balance) + better
aminoacidogram
Ibrahim. J
Perinatol
2004
BW
<1250g
32 I: PN (g/Kg/d) ≥ 1h after birth
AA = 3 + lipids = 3
C: PN (g/Kg/d) 0-48h after
birth AA+lipids = 0; ≥D3: AA 2
3.5 + lipids 0.5 3
I: early intake - better
nitrogen balance
te Braake. J
Pediatr 2005
BW
<1500g
135 I: PN (g/Kg/d) ≥D1 AA = 2.4
C: PN (g/Kg/d) D1 =0 D2
=1.2 ≥D3 =2.4
I: at D4: nitrogen balance
+ better aminoacidogram
Short term: early high AA + energy protein
accretion

Ca & P
In premature infants Ca absorption depends on the Ca
intake, whereas Ca retention is related to the P supply
Rigo. J Pediatr 2006
Bone nutrition neonatal period

Preterm after birth sudden interruption of placental transference of Ca
& P
D1-D2: factors promoting precipitation of calcium phosphate limits the
intake by PN:
Relatively concentrations of Ca & P due to fluid restriction
Concentrations of glucose and AA (?)
Environment temperature
Early: PN just after birth Ca & P
Allwod. Nutrition 1998
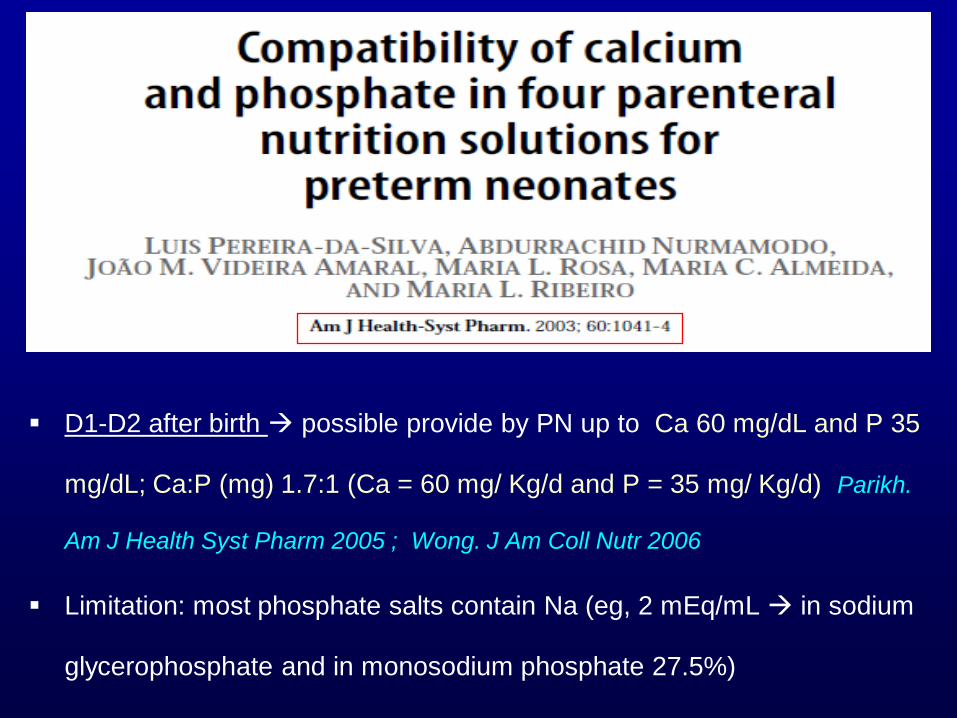
D1-D2 after birth possible provide by PN up to Ca 60 mg/dL and P 35
mg/dL; Ca:P (mg) 1.7:1 (Ca = 60 mg/ Kg/d and P = 35 mg/ Kg/d) Parikh.
Am J Health Syst Pharm 2005 ; Wong. J Am Coll Nutr 2006
Limitation: most phosphate salts contain Na (eg, 2 mEq/mL in sodium
glycerophosphate and in monosodium phosphate 27.5%)

Short term: PN Ca & P bone mineral content
RCT 24 neonates <1200g
Exclusive PN during >3 weeks (mg/100ml): Ca 68 + P 62 versus Ca 50 +
P 46.5
Higher dose bone mineral content (single-photon absortiometry),
up to 26 weeks after interrupting PN (programming?)
Prestidge. J Pediatr 1993

Quantitative Ultrasound
RCT - from D1 of PN:
High dose (HD) Ca 75; P 44 mg/Kg/d
Low dose(LD) Ca 45; P 26 mg/Kg/d
Ca:P ratio (mg:mg 1.7:1)

mg/Kg/d
LD
Ca 45; P 26
HD
Ca 75; P 44
Greater difference observed
at ±5 postnatal weeks, after
interruption of PN (at ±2 weeks)

Mineral nutrition preterm infants
Klein. J Nutr 2002, ESPGHAN. JPGN 2006, Abrams. AJCN 2007
Ca & P concentrations in human milk and formulas (mg/100ml)
Human milk (HM): Ca 26; P 14
Preterm Formula: Ca ±100; P ±50
Post-discharge Formula (PDF): ±76; P ±38
Infant Formula (term): Ca ±46; P ±23

Mineral deficiency may occur in VLBW infants:
Fed unfortified HM or term formulas versus preterm formulas Koo.
Bone Miner Res 1988, Hawthorne. Minerva Pediatr 2004
Fed unfortified fortified HM Lucas. Am J Clin Nutr 1996
Short term: enteral Ca & P Mineralization

Experimental FPT at discharge: bone mineral content (DEXA)
RCT 37 neonates 28-32
wks
PTF mineral (mg/100Kcal):
experimental PTF (Ca
123 + P 74) versus
regular PTF (Ca 99 + P
52) up to 3 M
Lapillonne. AJCN 2004
Short term: enteral Ca & P Mineralization

Vitamin D

Osteopenia of Prematurity is primarily a disease of
inadequate mineral intake, not vitamin D deficiency Abrams. Am
J Clin Nutr 2007
However…
Bone nutrition neonatal period
Vitamin D
Recommended: 800-1000 UI/d ESPGHAN. JPGN 2010

Physical stimulus

Preterm infants
Passive range-of-motion exercise
Bone mineral mass (DEXA) Moyer-Mileur. Pediatrics 2000
Bone strength (QUS) Litmanovitz. Calcif Tissue Int 2007
Metanalysis 6 RCT: “weak evidence of physical activity programs
promoting short-term bone mineralization in preterm infants; however:
trials with small samples, poor methodological and reporting quality”
Schulzke. Cochrane 2007
Physical activity Mineralization

POSTNATAL
Postdischarge

RCT: 89 neonates (±1250g, ± 29 wks)
After discharge: “PDF” (+40% Ca, +11% P e +21% protein) versus Infant
Formula during 1 year
At 12 M: without significant difference in bone mineralization (DEXA)
Medium term: enteral Ca & P no advantage
Koo. Am J Clin Nutr 2006

Picaud. J Pediatr 2008
RCT: 49 neonates <33 wks
After discharge: PTF (+96% Ca, +89% P e +35% protein) versus Infant
Formula during 2M >2M all receiving Infant Formula
At 4M CA: same bone area, however bone mineral content (DEXA)
Medium term: NE Ca & P Mineralização
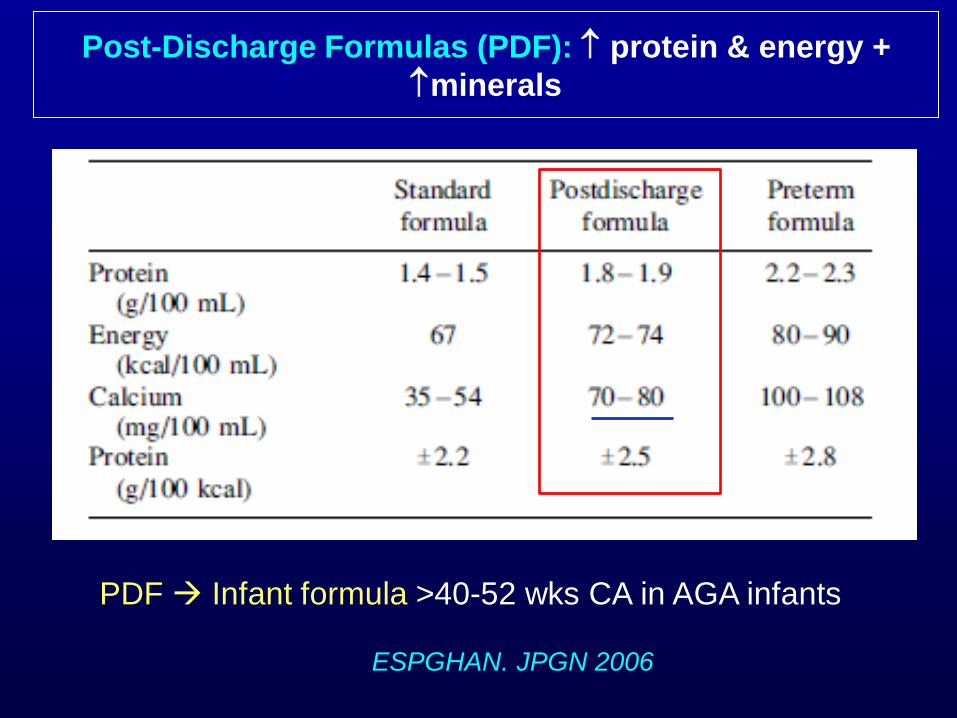
ESPGHAN. JPGN 2006
Post-Discharge Formulas (PDF): protein & energy +
minerals
PDF Infant formula >40-52 wks CA in AGA infants

Fewtrell. Bone 2009
RCT cohort
202 preterm infants – first months: HM versus PTF
At 20 years: DEXA identical peak bone mass and bone turnover–
independent of type of feeding
Group HN - total bone mass and bone mineral content
Ca & P concentration in LM << FPT influence of non-nutritive factors in
HM?
Long term: enteral Ca & P no advantage
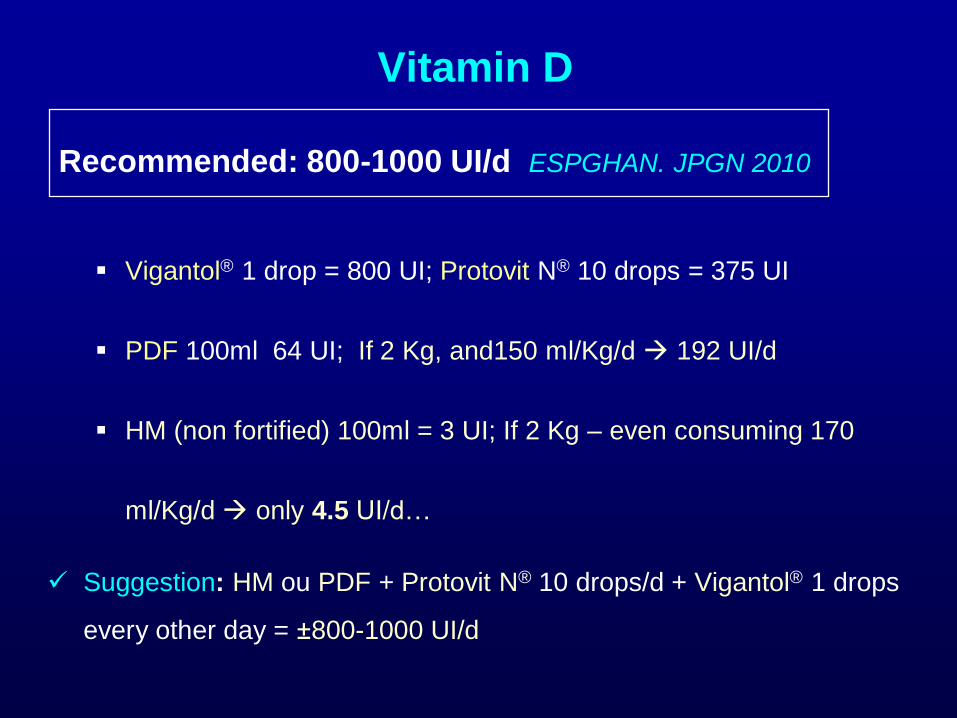
Vitamin D
Vigantol® 1 drop = 800 UI; Protovit N® 10 drops = 375 UI
PDF 100ml 64 UI; If 2 Kg, and150 ml/Kg/d 192 UI/d
HM (non fortified) 100ml = 3 UI; If 2 Kg – even consuming 170
ml/Kg/d only 4.5 UI/d…
Suggestion: HM ou PDF + Protovit N® 10 drops/d + Vigantol® 1 drops
every other day = ±800-1000 UI/d
Recommended: 800-1000 UI/d ESPGHAN. JPGN 2010

I. Dual energy X-ray
absorptiometry (DEXA)
Measures bone size and
mineral content: total body
bone mineral content (BMC) +
bone density
Bone assessment
DEXA: high accuracy and precision in assessing BMC in neonates
gold-standard in preterms Bonkovitz. Pediatr Radiol 2007

II. Quantitative ultrasound (QUS)
Speed of sound measures Bone
Strength: density + cortical
thickness + elasticity +
microarchitecture
Convenient: portable, non-invasive,
non-ionising McDevitt. Neonatology
2009
Bone assessment
QUS cannot be used as a surrogate for DEXA; however, both methods
may complement each other in the assessment of bone health Giani.
Arch Dis Child F&N Ed 2008
NICU, Hospital D. Estefânia, 2006
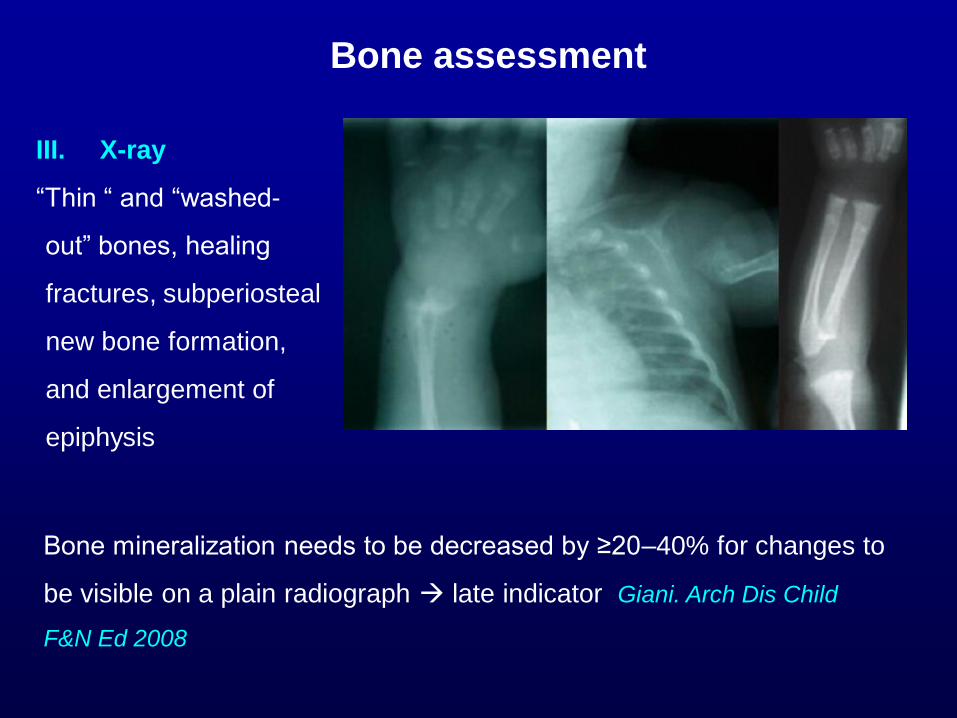
III. X-ray
“Thin “ and “washed-
out” bones, healing
fractures, subperiosteal
new bone formation,
and enlargement of
epiphysis
Bone assessment
Bone mineralization needs to be decreased by ≥20–40% for changes to
be visible on a plain radiograph late indicator Giani. Arch Dis Child
F&N Ed 2008
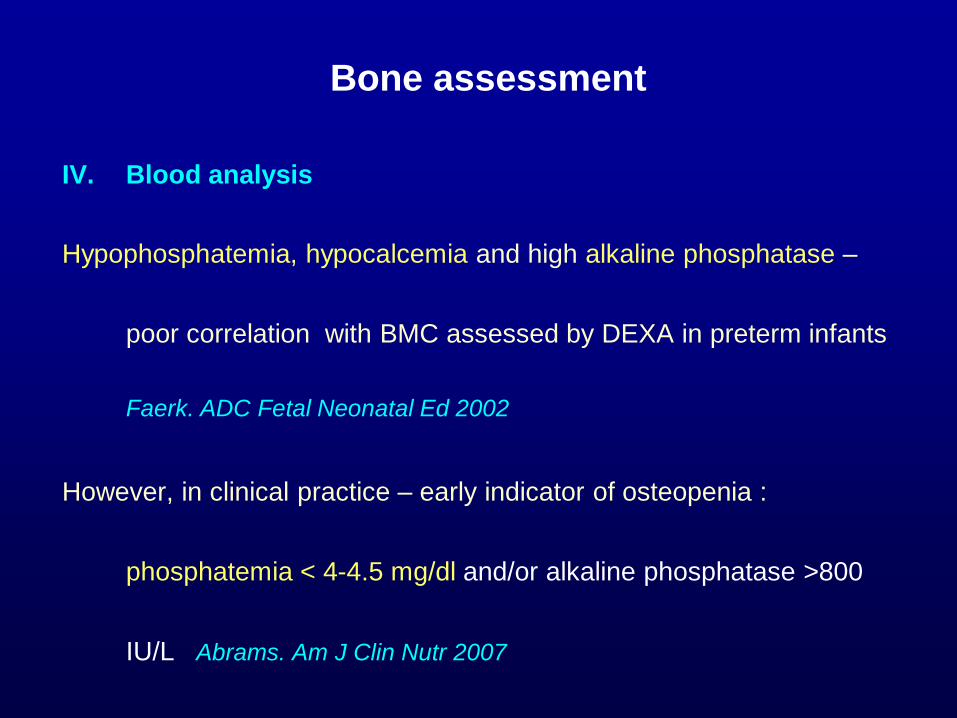
IV. Blood analysis
Hypophosphatemia, hypocalcemia and high alkaline phosphatase –
poor correlation with BMC assessed by DEXA in preterm infants
Faerk. ADC Fetal Neonatal Ed 2002
However, in clinical practice – early indicator of osteopenia :
phosphatemia < 4-4.5 mg/dl and/or alkaline phosphatase >800
IU/L Abrams. Am J Clin Nutr 2007
Bone assessment

V. Urine analysis
Urinary excretion of Ca and P
Tubular rebsorption of phosphate (TRP) - good guide for phosphate
supplementation; if >95% inadequate supplementation
%TRP = 1 − (PU/CrU) x (CrU/Pp) x 100
P = phosphorus; Cr = creatinine; U = urine; p = plasma
Harrison. Acta Paediatr 2008
Bone assessment
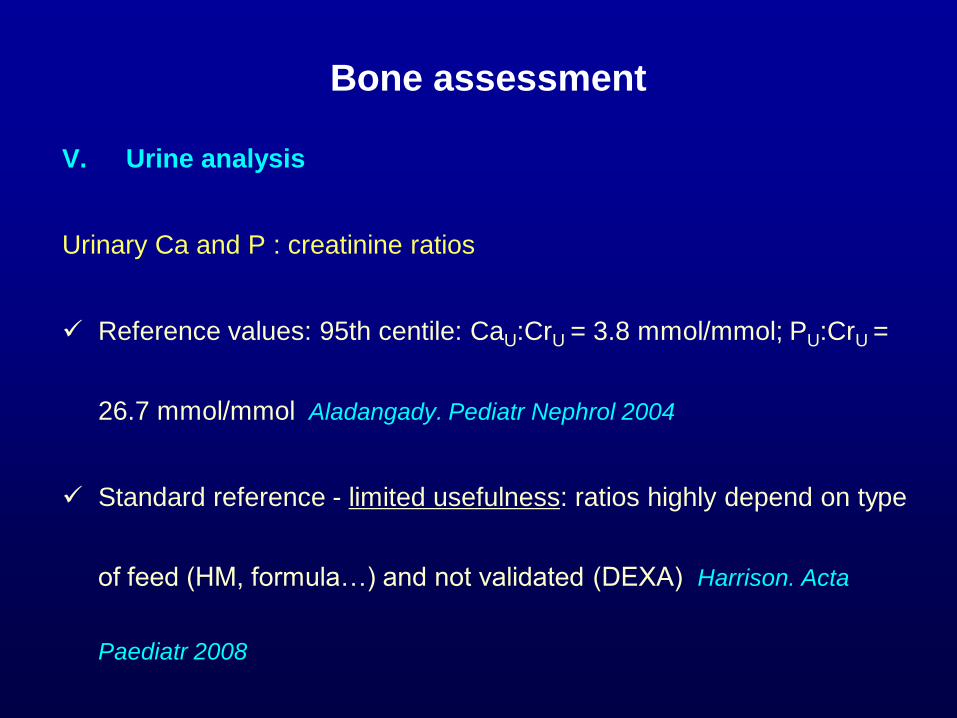
V. Urine analysis
Urinary Ca and P : creatinine ratios
Reference values: 95th centile: CaU:CrU = 3.8 mmol/mmol; PU:CrU =
26.7 mmol/mmol Aladangady. Pediatr Nephrol 2004
Standard reference - limited usefulness: ratios highly depend on type
of feed (HM, formula…) and not validated (DEXA) Harrison. Acta
Paediatr 2008
Bone assessment

SUMMARY
PRENATAL
Maternal diet: enough protein and energy + enough Ca
and vitamin D
Endocrine environment: promotes the modeling/
remodeling ratio in favor of modeling, increasing the
endocortical bone
SUMMARY
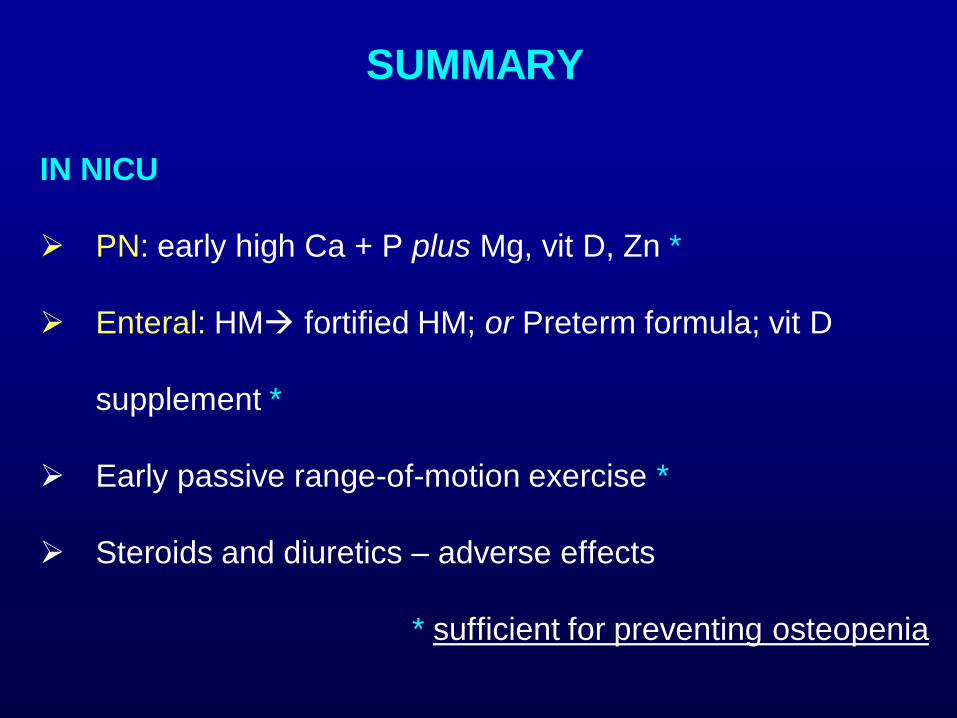
IN NICU
PN: early high Ca + P plus Mg, vit D, Zn *
Enteral: HM fortified HM; or Preterm formula; vit D
supplement *
Early passive range-of-motion exercise *
Steroids and diuretics – adverse effects
* sufficient for preventing osteopenia
SUMMARY
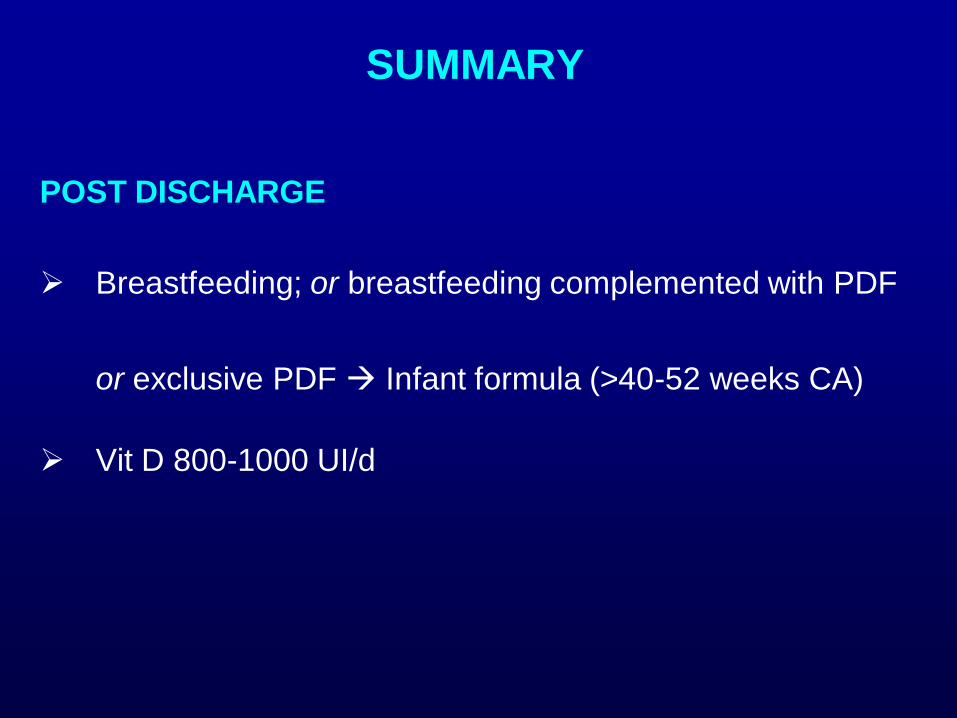
POST DISCHARGE
Breastfeeding; or breastfeeding complemented with PDF
or exclusive PDF Infant formula (>40-52 weeks CA)
Vit D 800-1000 UI/d

Thank you