Embed Size (px)
Citation preview
REVISTA ARGENTINA 2020, Vol. XXIX, N°4, 219-232 DE CLÍNICA PSICOLÓGICA
Prediction of Mortalityinthe Hemodialysis Patient with Diabetes using Support Vector Machine
Cheng-Hong Yanga, Dony Novaliendrya,b*, Jin-Bor Chenc, Fegie Y Wattimenad, Axelon S
Renyaand, Yaslinda Lizare, Asriwan Gucif, Muhammad Ariyong, Dochi Ramadhanih, Unung Verawardinah, Irwani, Yenny Desnelitai, Wilda Susantii, Gustientiedinai, Hastuti Marlinaj,
Arden Simeruk, Torkis Nasutionl
Abstract: Hemodialysis is one of modality to treat end stage kidney disease. This study is aimed to predict the mortality risk of hemodialysis patients. A total of 665 prevalent hemodialysis patients were enrolled in one hemodialysis center in Taiwan. The prediction is based on Support Vector Machine (SVM) which developed under MATLAB. Based on the obtained results, SVM performs better accuracy compared to K-Nearest Neighbor, logistic regression, a lineardiscriminant,Treeand ensemble. In addition, the F1-score of SVM is higher than that from other methods. The highest mortality risk factor is diabetes; the second is cardiovascular diseaseand small influence of related medical variables such as parathyroid surgery, urea reduction ratio,etc. Keyword: Diabetes, Hemodialysis, Support Vector Machine
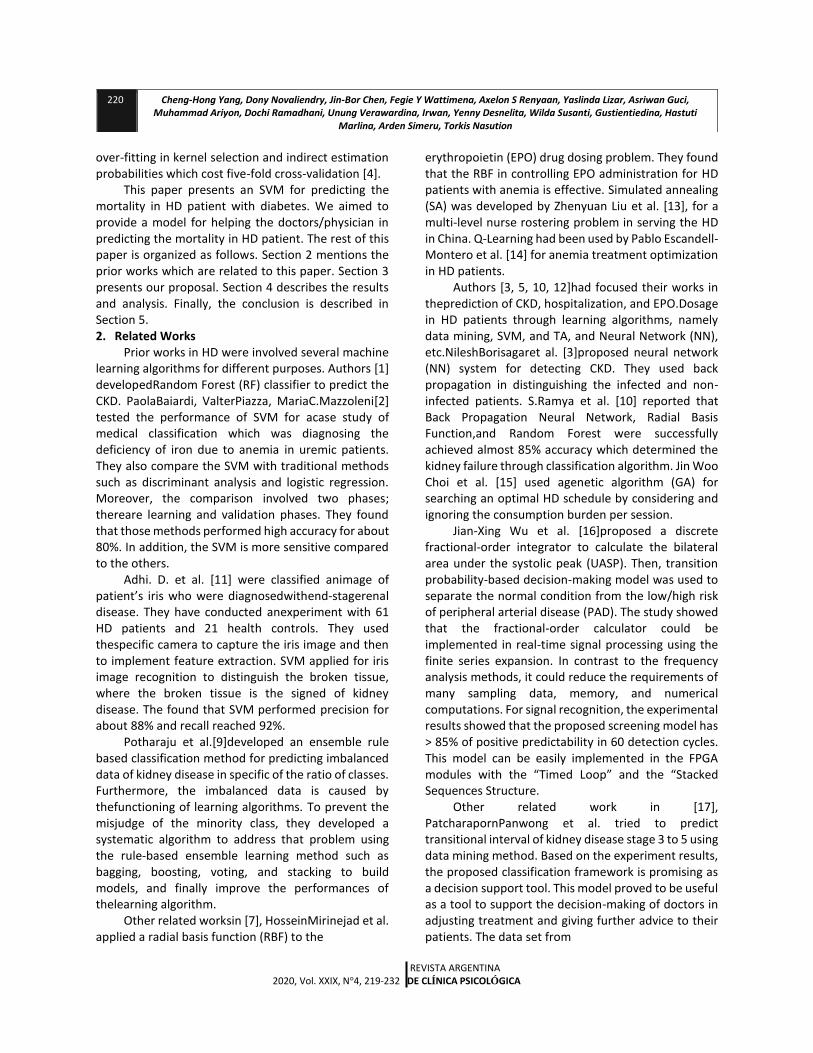
1. Introduction Chronic kidney disease (CKD) is a critical disease
that reducesexcretion of waste from the kidney.Consequently, the high-level wastes are accumulated in theblood which may impact to high blood pressure, weak bones, anemia, nerve damage and poor nutritional health. In addition, the risk of cardiovascular diseases isincreased. aDepartment of Electronic Engineering, National Kaohsiung University of Sciences and Technology, Kaohsiung Taiwan. bDepartment of Electronic Engineering, Faculty of Engineering, UniversitasNegeri Padang, Padang, Indonesia. cDivision of Nephrology, Department of Internal Medicine, Kaohsiung Chang Gung Memorial Hospital and Chang Gung University College of Medicine, Kaohsiung, Taiwan; dFakultas Sains&Teknologi, UniversitasOttowGeissler Papua, Papua, Indonesia eUIN Imam Bonjol Padang, Padang, Indonesia fSTIKesMercubaktijaya, Padang, Indonesia gTeknik Perminyakan, Universitas Islam Riau, Pekanbaru, Indonesia hPendidikan TIK, IKIP PGRI Pontianak, Pontianak, Indonesia iDepartement Computer Science, Institut Bisnis dan Teknologi Pelita Indonesia, Pekanbaru, Indonesia jPublic Health, STIKes Hang Tuah, Pekanbaru, Indonesia kSistem Informasi, Sekolah Tinggi Teknologi Pekanbaru, Pekanbaru, Indonesia lComputer Science, STMIK Amik Riau, Pekanbaru, Indonesia *Corresponding Author, email:[email protected]
A variety of etiologies are involved in CKD such as diabetes, hypertension, glomerulonephritis, etc. Hemodialysis (HD) is one of the treatment modalities to remove the waste from the body[1].
Recently, machine learning becomes popular in biomedical and bio information, including prediction of CKD [1-12]. Many kinds of machine learning algorithms, namely Support Vector Machine (SVM), Genetic Algorithm (GA), and Neural Networks were proposed in the literature. In specific, SVM is a kind of classification method for thelinear and non-linear system. SVM quality and complexity solution are depended indirectly on input space dimension. SVM has several advantages: it is capable in high dimension, efficient in memory usages, effective even the number of samples is smaller than dimensional spaces, various kernels for making a decision, allowing us to use a custom kernel (tricky). SVM have reported success in diagnosis prediction of numerous critical diseases including CKD. SVM can take over the human weakness in finding ahidden pattern from data. However, SVM has several drawbacks, namely:
219 Revista Argentina de Clínica Psicológica 2020, Vol. XXIX, N°4, 219-232 DOI: 10.24205/03276716.2020.823
REVISTA ARGENTINA 2020, Vol. XXIX, N°4, 219-232 DE CLÍNICA PSICOLÓGICA
over-fitting in kernel selection and indirect estimation probabilities which cost five-fold cross-validation [4].
This paper presents an SVM for predicting the mortality in HD patient with diabetes. We aimed to provide a model for helping the doctors/physician in predicting the mortality in HD patient. The rest of this paper is organized as follows. Section 2 mentions the prior works which are related to this paper. Section 3 presents our proposal. Section 4 describes the results and analysis. Finally, the conclusion is described in Section 5. 2. Related Works
Prior works in HD were involved several machine learning algorithms for different purposes. Authors [1] developedRandom Forest (RF) classifier to predict the CKD. PaolaBaiardi, ValterPiazza, MariaC.Mazzoleni[2] tested the performance of SVM for acase study of medical classification which was diagnosing the deficiency of iron due to anemia in uremic patients. They also compare the SVM with traditional methods such as discriminant analysis and logistic regression. Moreover, the comparison involved two phases; thereare learning and validation phases. They found that those methods performed high accuracy for about 80%. In addition, the SVM is more sensitive compared to the others.
Adhi. D. et al. [11] were classified animage of patient’s iris who were diagnosedwithend-stagerenal disease. They have conducted anexperiment with 61 HD patients and 21 health controls. They used thespecific camera to capture the iris image and then to implement feature extraction. SVM applied for iris image recognition to distinguish the broken tissue, where the broken tissue is the signed of kidney disease. The found that SVM performed precision for about 88% and recall reached 92%.
Potharaju et al.[9]developed an ensemble rule based classification method for predicting imbalanced data of kidney disease in specific of the ratio of classes. Furthermore, the imbalanced data is caused by thefunctioning of learning algorithms. To prevent the misjudge of the minority class, they developed a systematic algorithm to address that problem using the rule-based ensemble learning method such as bagging, boosting, voting, and stacking to build models, and finally improve the performances of thelearning algorithm.
Other related worksin [7], HosseinMirinejad et al. applied a radial basis function (RBF) to the
erythropoietin (EPO) drug dosing problem. They found that the RBF in controlling EPO administration for HD patients with anemia is effective. Simulated annealing (SA) was developed by Zhenyuan Liu et al. [13], for a multi-level nurse rostering problem in serving the HD in China. Q-Learning had been used by Pablo Escandell-Montero et al. [14] for anemia treatment optimization in HD patients.
Authors [3, 5, 10, 12]had focused their works in theprediction of CKD, hospitalization, and EPO.Dosage in HD patients through learning algorithms, namely data mining, SVM, and TA, and Neural Network (NN), etc.NileshBorisagaret al. [3]proposed neural network (NN) system for detecting CKD. They used back propagation in distinguishing the infected and non-infected patients. S.Ramya et al. [10] reported that Back Propagation Neural Network, Radial Basis Function,and Random Forest were successfully achieved almost 85% accuracy which determined the kidney failure through classification algorithm. Jin Woo Choi et al. [15] used agenetic algorithm (GA) for searching an optimal HD schedule by considering and ignoring the consumption burden per session.
Jian-Xing Wu et al. [16]proposed a discrete fractional-order integrator to calculate the bilateral area under the systolic peak (UASP). Then, transition probability-based decision-making model was used to separate the normal condition from the low/high risk of peripheral arterial disease (PAD). The study showed that the fractional-order calculator could be implemented in real-time signal processing using the finite series expansion. In contrast to the frequency analysis methods, it could reduce the requirements of many sampling data, memory, and numerical computations. For signal recognition, the experimental results showed that the proposed screening model has > 85% of positive predictability in 60 detection cycles. This model can be easily implemented in the FPGA modules with the “Timed Loop” and the “Stacked Sequences Structure.
Other related work in [17], PatcharapornPanwong et al. tried to predict transitional interval of kidney disease stage 3 to 5 using data mining method. Based on the experiment results, the proposed classification framework is promising as a decision support tool. This model proved to be useful as a tool to support the decision-making of doctors in adjusting treatment and giving further advice to their patients. The data set from
220 Cheng-Hong Yang, Dony Novaliendry, Jin-Bor Chen, Fegie Y Wattimena, Axelon S Renyaan, Yaslinda Lizar, Asriwan Guci, Muhammad Ariyon, Dochi Ramadhani, Unung Verawardina, Irwan, Yenny Desnelita, Wilda Susanti, Gustientiedina, Hastuti
Marlina, Arden Simeru, Torkis Nasution
REVISTA ARGENTINA 2020, Vol. XXIX, N°4, 219-232 DE CLÍNICA PSICOLÓGICA
Phan hospital, Chiang Rai specified with 19 medical attributes, then the predictive model is generated using four types of classifiers: decision tree, K-nearest neighbor, Bayesian and Neural Networks. The experiments with these models reveal the need to handle imbalanced data using SMOTE. The accuracy around 85% can be achieved by several models used in this experiment.
Further related work [7]used RBF (radial basis function) for optimal control of drug administration on the anemia of HD patients. The second order model is introduced which is consistent with observed clinical data from the University of Louisville Kidney Center. Then the RBF method is applied to solve the optimal control drug dosing problem. For this problem, 40 Gaussian RBFs (N = 40) with Legendre-Gauss-Lobatto nodes were used. Based on the results of experiments, the RBF method shows promising results for both keeping the HB levels close to the desired value and optimizing the EPO doses in the treatment of renal anemia.
Other related work [18-20] used a rule-based decision-making diagnosis system for evaluating arteriovenous shunt stenosis for HD treatment of patients using Fuzzy Petri Nets. Since the power spectra changes in frequency and amplitude with the degree of AVS (Arteriovenous shunt) stenosis, it is difficult to make a human-made decision to judge the degree using a combination of those variances. The Burg autoregressive (AR) method is used to estimate the frequency spectra of a phono angiographic signal and identify the characteristic frequencies. Based on the experiment results with 42 long-term follow-up patients, the examination results show that the proposed diagnosis system has greater efficiency in evaluating AVS stenosis.
Further related work [21] proposedpredictive modeling of cardiovascular complications in incidentHD patients applying a random forest predictive model for the prediction of cardiovascular events in the first-year of HD treatment. Many variables related to the patient health status, to the treatment, and to dialyzer can be recorded and stored at each treatment session. In this work, a dataset of 42 variables and 1526 patients extracted from the Fresenius Medical Care database EuDHD was
used to develop and apply a random forest predictive model.To obtain insights into the model, the most important variables were selected. Logistic regression applied to these variables enabled to interpret the results from a clinical and physiological point of view. Finally, the application of machine learning models to larger HD dataset will permit to understand the mechanisms underlying cardiovascular events and to predict more accurately these events.The accuracy rates of classification techniques used for CKD are summarized as presented in Appendix 1.
In summaries, the prior works have been concerned with many learning algorithms implementation in HDcases including SVM. However, they were not concerned with the mortality prediction. Only Lacson R[6] used Mean Systolic Blood Pressure (SBP) to predict mortality in HDpatients. They constructed models using SVM and tested to 4,500 patients. Moreover, a baseline model used as acomparative method to evaluate the performances which involved parameters, namely: age, gender, race, diabetes, vintage, and BMI.The found that SBP trends improved the mortality prediction in HD patients significantly. Unlike the previous works in [6], we used SVM to predict the mortality in HDpatients with diabetes. Support Vector Machine (SVM) Principle
In such application as pattern recognition, text classification, image recognition, and bioinformatics, SVM have been successfully working to solve problems since its introduction by Vapnik[22]. The basic idea of SVM is mapping data into higher dimension input space so that it becomes linearly separable into different classes. Then, SVM makes the optimal hyperplane in that space.
The process of SVM requires a quadratic programming problem solver through functions known by Kernel Functions, where it is the heart of SVM. Recently, there are many kinds of successful kernel functions including Radial Basis Function (RBF), Polynomial, Splines, and Multilayer Perceptrons. Moreover, the core of SVM is structural risk minimization. Thus it provides better ability in generalization compared to traditional classification methods which apply empirical risk minimization approaches. SVM quality and complexity solution are dependent indirectly on input space dimension.
221 Cheng-Hong Yang, Dony Novaliendry, Jin-Bor Chen, Fegie Y Wattimena, Axelon S Renyaan, Yaslinda Lizar, Asriwan Guci, Muhammad Ariyon, Dochi Ramadhani, Unung Verawardina, Irwan, Yenny Desnelita, Wilda Susanti, Gustientiedina, Hastuti
Marlina, Arden Simeru, Torkis Nasution
REVISTA ARGENTINA 2020, Vol. XXIX, N°4, 219-232 DE CLÍNICA PSICOLÓGICA
SVM has several advantages; there are capable in
high dimension, efficient in memory usages, effective even the number of samples is smaller than dimensional spaces, various kernels for deciding, allowing us to use a custom kernel (tricky). However, SVM has several drawbacks, namely: over-fitting in kernel selection and indirect estimation probabilities which cost five-fold cross-validation [4].
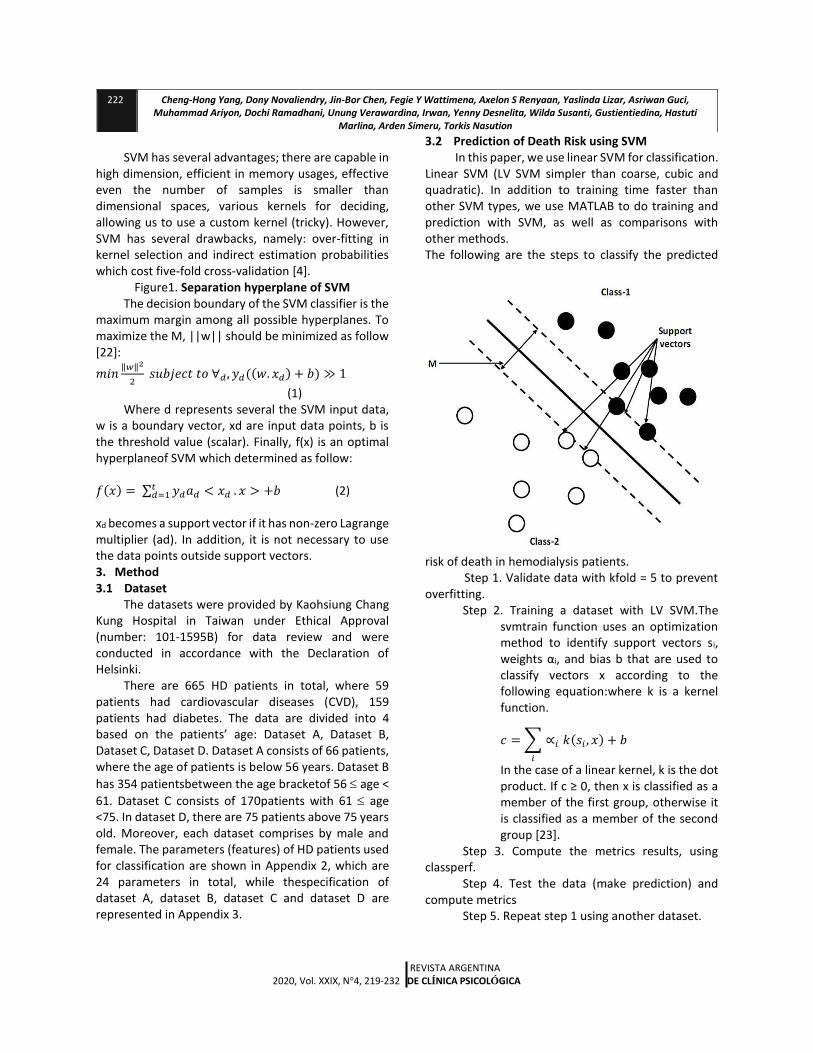
Figure1. Separation hyperplane of SVM The decision boundary of the SVM classifier is the
maximum margin among all possible hyperplanes. To maximize the M, ||w|| should be minimized as follow [22]:
𝑚𝑖𝑛‖𝑤‖2
2 𝑠𝑢𝑏𝑗𝑒𝑐𝑡 𝑡𝑜 ∀𝑑, 𝑦𝑑((𝑤. 𝑥𝑑) + 𝑏) ≫ 1
(1) Where d represents several the SVM input data,
w is a boundary vector, xd are input data points, b is the threshold value (scalar). Finally, f(x) is an optimal hyperplaneof SVM which determined as follow:
𝑓(𝑥) = ∑ 𝑦𝑑𝑎𝑑 < 𝑥𝑑
𝑡𝑑=1 . 𝑥 > +𝑏 (2)
xd becomes a support vector if it has non-zero Lagrange multiplier (ad). In addition, it is not necessary to use the data points outside support vectors. 3. Method 3.1 Dataset
The datasets were provided by Kaohsiung Chang Kung Hospital in Taiwan under Ethical Approval (number: 101-1595B) for data review and were conducted in accordance with the Declaration of Helsinki.
There are 665 HD patients in total, where 59 patients had cardiovascular diseases (CVD), 159 patients had diabetes. The data are divided into 4 based on the patients’ age: Dataset A, Dataset B, Dataset C, Dataset D. Dataset A consists of 66 patients, where the age of patients is below 56 years. Dataset B
has 354 patientsbetween the age bracketof 56 age <
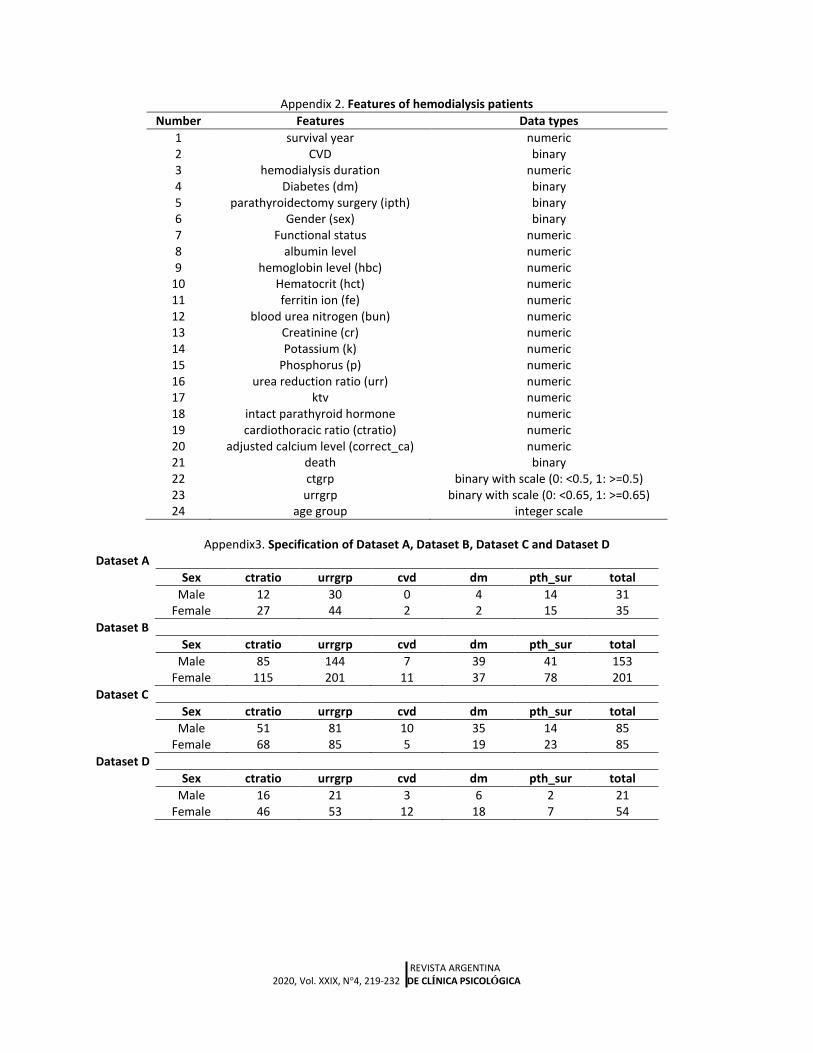
61. Dataset C consists of 170patients with 61 age <75. In dataset D, there are 75 patients above 75 years old. Moreover, each dataset comprises by male and female. The parameters (features) of HD patients used for classification are shown in Appendix 2, which are 24 parameters in total, while thespecification of dataset A, dataset B, dataset C and dataset D are represented in Appendix 3.
3.2 Prediction of Death Risk using SVM In this paper, we use linear SVM for classification.
Linear SVM (LV SVM simpler than coarse, cubic and quadratic). In addition to training time faster than other SVM types, we use MATLAB to do training and prediction with SVM, as well as comparisons with other methods. The following are the steps to classify the predicted
risk of death in hemodialysis patients. Step 1. Validate data with kfold = 5 to prevent overfitting.
Step 2. Training a dataset with LV SVM.The svmtrain function uses an optimization method to identify support vectors si, weights αi, and bias b that are used to classify vectors x according to the following equation:where k is a kernel function.
𝑐 = ∑ ∝𝑖 𝑘(𝑠𝑖 , 𝑥) + 𝑏
𝑖
In the case of a linear kernel, k is the dot product. If c ≥ 0, then x is classified as a member of the first group, otherwise it is classified as a member of the second group [23].
Step 3. Compute the metrics results, using classperf.
Step 4. Test the data (make prediction) and compute metrics
Step 5. Repeat step 1 using another dataset.
222 Cheng-Hong Yang, Dony Novaliendry, Jin-Bor Chen, Fegie Y Wattimena, Axelon S Renyaan, Yaslinda Lizar, Asriwan Guci, Muhammad Ariyon, Dochi Ramadhani, Unung Verawardina, Irwan, Yenny Desnelita, Wilda Susanti, Gustientiedina, Hastuti
Marlina, Arden Simeru, Torkis Nasution
REVISTA ARGENTINA 2020, Vol. XXIX, N°4, 219-232 DE CLÍNICA PSICOLÓGICA
4. Results and Analysis 4.1 Performances Metrics Metrics used to test classifier performance in this paper are as follows:
Correct rate or accuracy (ACC). ACC is a measure of the accuracy of a classifier in the prediction, in this case, is the predicted risk of death hemodialysis patient.
Error rate determines the incorrect classification.
Sensitivity (Se). Se is also known as a recall that is used as a measure of the positive proportions that the classifier correctly predicts.
Specificity (Sp). Sp is used to measure the negative proportions correctly predicted by the classifier.
Precision or also known as Positive predictive value (PPV). PPV is the level of variability of predicted results.
Negative predictive value (NPV). NPV is the proportion of negative predictions against the actual negative value.
Prevalence (Pre). Pre is the proportion of the population affected by certain medical cones, in which case it may be diabetes, anemia, or CVD. This paper focused on the influence of diabetes (dm).
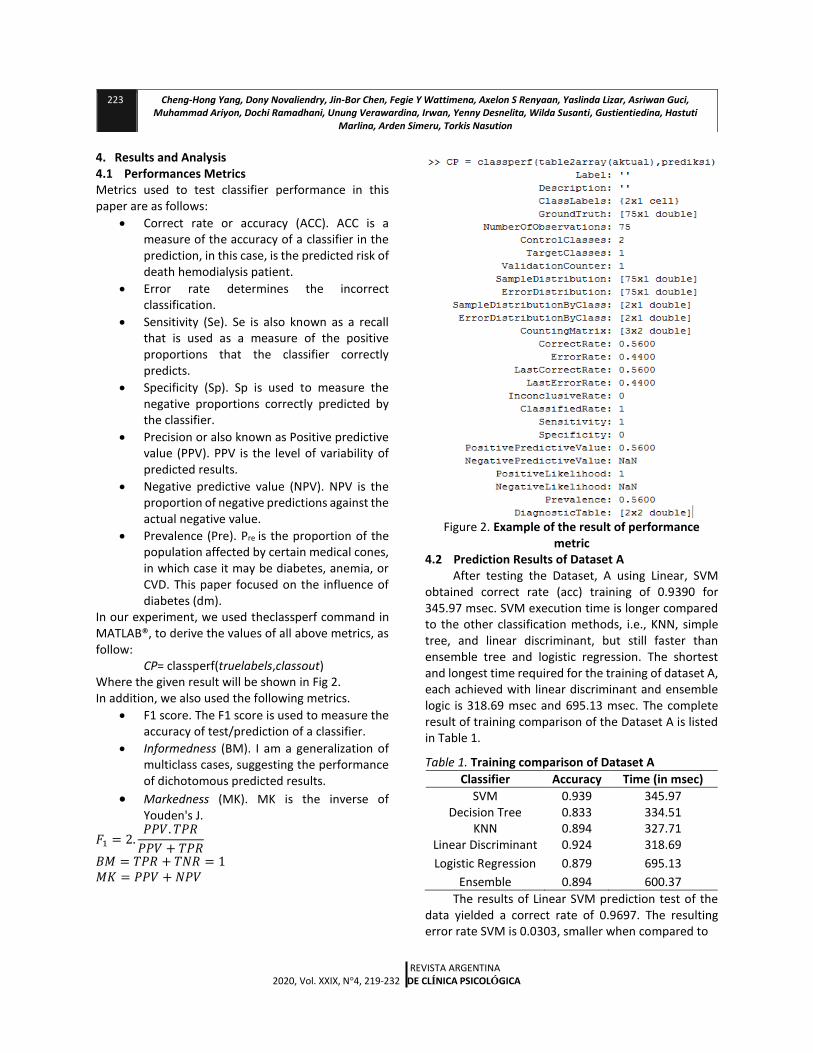
In our experiment, we used theclassperf command in MATLAB®, to derive the values of all above metrics, as follow: CP= classperf(truelabels,classout) Where the given result will be shown in Fig 2. In addition, we also used the following metrics.
F1 score. The F1 score is used to measure the accuracy of test/prediction of a classifier.
Informedness (BM). I am a generalization of multiclass cases, suggesting the performance of dichotomous predicted results.
Markedness (MK). MK is the inverse of Youden's J.
𝐹1 = 2.𝑃𝑃𝑉. 𝑇𝑃𝑅
𝑃𝑃𝑉 + 𝑇𝑃𝑅
𝐵𝑀 = 𝑇𝑃𝑅 + 𝑇𝑁𝑅 = 1 𝑀𝐾 = 𝑃𝑃𝑉 + 𝑁𝑃𝑉
Figure 2. Example of the result of performance metric
4.2 Prediction Results of Dataset A After testing the Dataset, A using Linear, SVM
obtained correct rate (acc) training of 0.9390 for 345.97 msec. SVM execution time is longer compared to the other classification methods, i.e., KNN, simple tree, and linear discriminant, but still faster than ensemble tree and logistic regression. The shortest and longest time required for the training of dataset A, each achieved with linear discriminant and ensemble logic is 318.69 msec and 695.13 msec. The complete result of training comparison of the Dataset A is listed in Table 1.
Table 1. Training comparison of Dataset A
Classifier Accuracy Time (in msec)
SVM 0.939 345.97 Decision Tree 0.833 334.51
KNN 0.894 327.71 Linear Discriminant 0.924 318.69
Logistic Regression 0.879 695.13
Ensemble 0.894 600.37
The results of Linear SVM prediction test of the data yielded a correct rate of 0.9697. The resulting error rate SVM is 0.0303, smaller when compared to
223 Cheng-Hong Yang, Dony Novaliendry, Jin-Bor Chen, Fegie Y Wattimena, Axelon S Renyaan, Yaslinda Lizar, Asriwan Guci, Muhammad Ariyon, Dochi Ramadhani, Unung Verawardina, Irwan, Yenny Desnelita, Wilda Susanti, Gustientiedina, Hastuti
Marlina, Arden Simeru, Torkis Nasution
REVISTA ARGENTINA 2020, Vol. XXIX, N°4, 219-232 DE CLÍNICA PSICOLÓGICA
Simple Tree, Linear Discriminant, Logistic regression, Ensemble Tree, and KNN. The largest error rate is generated by Ensemble Tree of 0.1061. The detail results of prediction using dataset A is shown in Table 2.
In terms of Dataset A, the SVM classifier shows the most accurate prediction of mortality, i.e., 0.939, followed by Linear Discriminant of 0.924, Ensemble and KKN of 0.894, Logistic Regression of 0.879, and the
last one is Decision Tree of 0.833. Note for NaN:
Concerning the correct rate of prediction using Dataset A, Table 8 shows that the SVM classifier has the highest correct rate of prediction, i.e., 0.9697, followed by Logistic Regression of 0.960, Linear Discrimination of 0.955, Decision Tree of 0.924, Ensemble of 0.894, and the last one is KKN of 0.893.
Table 2. Prediction Result Comparison of Dataset A
Metrics
SVM
De
cisi
on
Tre
e
KN
N
Lin
ear
Dis
crim
inan
t
Logi
stic
Re
gre
ssio
n
Ense
mb
le
Correct rate 0.970 0.924 0.893 0.955 0.960 0.894
Error rate 0.030 0.076 0.107 0.045 0.040 0.106
Last Correct Rate 0.970 0.924 0.893 0.955 0.960 0.894
Last Error Rate 0.030 0.076 0.107 0.0455 0.040 0.106
Inconclusive Rate 0 0 0 0 0 0
Classified Rate 1 1 1 1 1 1
Sensitivity (TPR) 0.714 0.429 0.514 0.571 0.569 0
Specificity (TNR) 1 0.983 0.974 1 1 1
Positive Predictive Value 1 0.750 1 1 1 NaN
Negative Predictive Value 0.967 0.936 1 0.952 0.952 0.894
Positive Likelihood NaN1 25.286 NaN NaN NaN NaN
Negative Likelihood 0.286 0.581 0 0.429 0 1
Prevalence 0.106 0.106 0.106 0.106 0.106 0.106
F1 0.833 0.546 0.679 0.727 0.725 NaN
Bookmaker Informedness (BM) 0.714 0.412 0.488 0.571 0.569 0
Markedness (MK) 0.967 0.686 1 0.952 0.952 NaN
1In computing, NaN, standing for not a number, is a numeric data type value representing an undefined or
unrepresentable value, especially in floating-point calculations.
4.3 Prediction Results of Dataset B
224 Cheng-Hong Yang, Dony Novaliendry, Jin-Bor Chen, Fegie Y Wattimena, Axelon S Renyaan, Yaslinda Lizar, Asriwan Guci, Muhammad Ariyon, Dochi Ramadhani, Unung Verawardina, Irwan, Yenny Desnelita, Wilda Susanti, Gustientiedina, Hastuti
Marlina, Arden Simeru, Torkis Nasution
225 Cheng-Hong Yang, Dony Novaliendry, Jin-Bor Chen, Fegie Y Wattimena, Axelon S Renyaan, Yaslinda Lizar, Asriwan Guci, Muhammad Ariyon, Dochi Ramadhani, Unung Verawardina, Irwan, Yenny Desnelita, Wilda Susanti, Gustientiedina, Hastuti
Marlina, Arden Simeru, Torkis Nasution
REVISTA ARGENTINA 2020, Vol. XXIX, N°4, 219-232 DE CLÍNICA PSICOLÓGICA
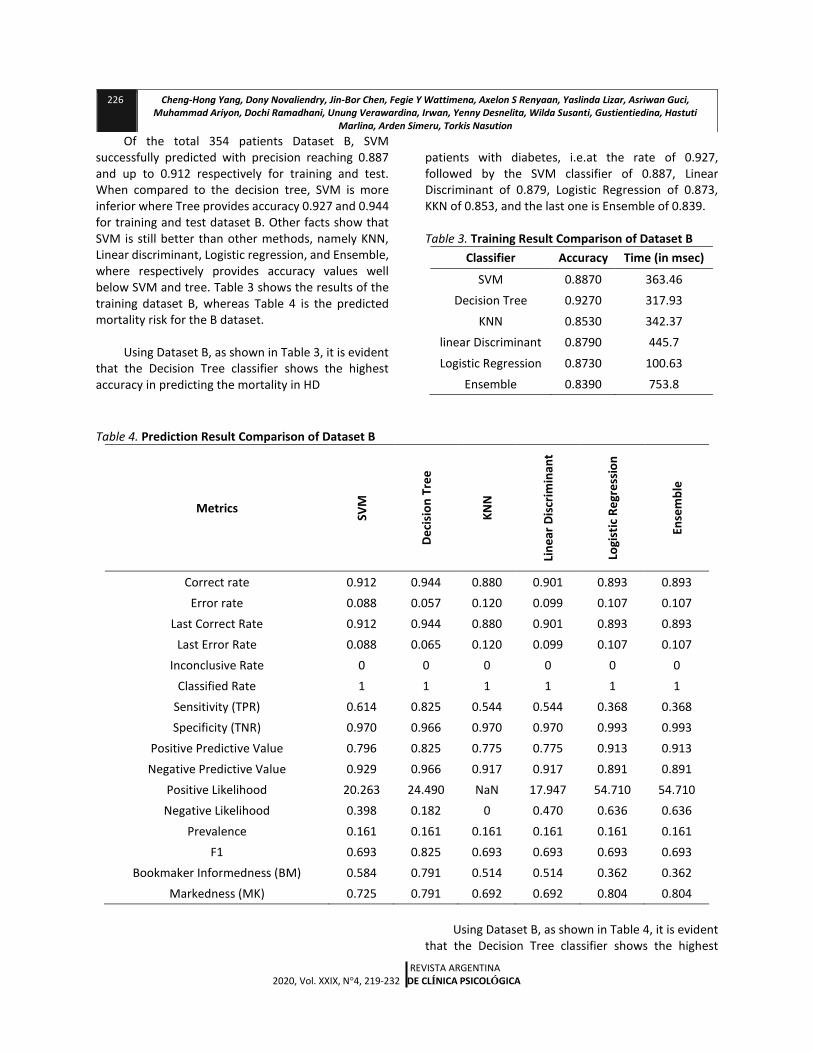
Of the total 354 patients Dataset B, SVM successfully predicted with precision reaching 0.887 and up to 0.912 respectively for training and test. When compared to the decision tree, SVM is more inferior where Tree provides accuracy 0.927 and 0.944 for training and test dataset B. Other facts show that SVM is still better than other methods, namely KNN, Linear discriminant, Logistic regression, and Ensemble, where respectively provides accuracy values well below SVM and tree. Table 3 shows the results of the training dataset B, whereas Table 4 is the predicted mortality risk for the B dataset.
Using Dataset B, as shown in Table 3, it is evident
that the Decision Tree classifier shows the highest accuracy in predicting the mortality in HD
patients with diabetes, i.e.at the rate of 0.927, followed by the SVM classifier of 0.887, Linear Discriminant of 0.879, Logistic Regression of 0.873, KKN of 0.853, and the last one is Ensemble of 0.839.
Table 3. Training Result Comparison of Dataset B
Classifier Accuracy Time (in msec)
SVM 0.8870 363.46
Decision Tree 0.9270 317.93
KNN 0.8530 342.37
linear Discriminant 0.8790 445.7
Logistic Regression 0.8730 100.63
Ensemble 0.8390 753.8
Table 4. Prediction Result Comparison of Dataset B
Metrics
SVM
De
cisi
on
Tre
e
KN
N
Lin
ear
Dis
crim
inan
t
Logi
stic
Re
gre
ssio
n
Ense
mb
le
Correct rate 0.912 0.944 0.880 0.901 0.893 0.893
Error rate 0.088 0.057 0.120 0.099 0.107 0.107
Last Correct Rate 0.912 0.944 0.880 0.901 0.893 0.893
Last Error Rate 0.088 0.065 0.120 0.099 0.107 0.107
Inconclusive Rate 0 0 0 0 0 0
Classified Rate 1 1 1 1 1 1
Sensitivity (TPR) 0.614 0.825 0.544 0.544 0.368 0.368
Specificity (TNR) 0.970 0.966 0.970 0.970 0.993 0.993
Positive Predictive Value 0.796 0.825 0.775 0.775 0.913 0.913
Negative Predictive Value 0.929 0.966 0.917 0.917 0.891 0.891
Positive Likelihood 20.263 24.490 NaN 17.947 54.710 54.710
Negative Likelihood 0.398 0.182 0 0.470 0.636 0.636
Prevalence 0.161 0.161 0.161 0.161 0.161 0.161
F1 0.693 0.825 0.693 0.693 0.693 0.693
Bookmaker Informedness (BM) 0.584 0.791 0.514 0.514 0.362 0.362
Markedness (MK) 0.725 0.791 0.692 0.692 0.804 0.804
Using Dataset B, as shown in Table 4, it is evident
that the Decision Tree classifier shows the highest
226 Cheng-Hong Yang, Dony Novaliendry, Jin-Bor Chen, Fegie Y Wattimena, Axelon S Renyaan, Yaslinda Lizar, Asriwan Guci, Muhammad Ariyon, Dochi Ramadhani, Unung Verawardina, Irwan, Yenny Desnelita, Wilda Susanti, Gustientiedina, Hastuti
Marlina, Arden Simeru, Torkis Nasution
REVISTA ARGENTINA 2020, Vol. XXIX, N°4, 219-232 DE CLÍNICA PSICOLÓGICA
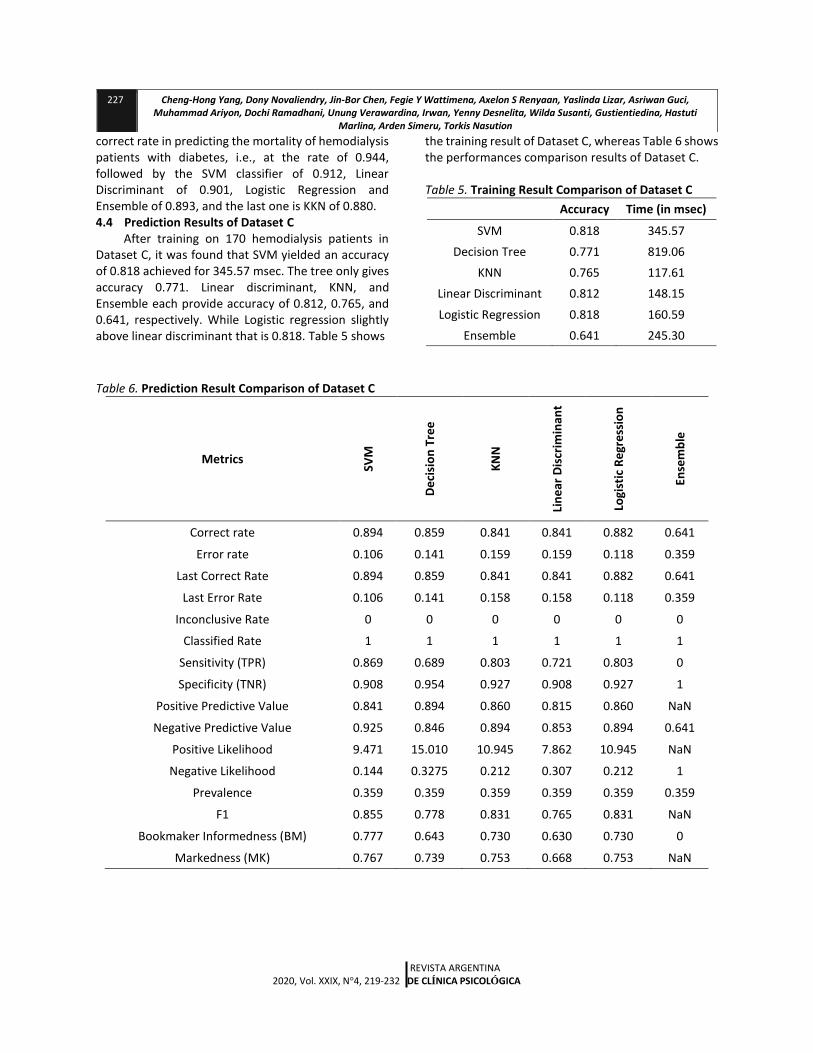
correct rate in predicting the mortality of hemodialysis patients with diabetes, i.e., at the rate of 0.944, followed by the SVM classifier of 0.912, Linear Discriminant of 0.901, Logistic Regression and Ensemble of 0.893, and the last one is KKN of 0.880. 4.4 Prediction Results of Dataset C
After training on 170 hemodialysis patients in Dataset C, it was found that SVM yielded an accuracy of 0.818 achieved for 345.57 msec. The tree only gives accuracy 0.771. Linear discriminant, KNN, and Ensemble each provide accuracy of 0.812, 0.765, and 0.641, respectively. While Logistic regression slightly above linear discriminant that is 0.818. Table 5 shows
the training result of Dataset C, whereas Table 6 shows the performances comparison results of Dataset C.
Table 5. Training Result Comparison of Dataset C
Accuracy Time (in msec)
SVM 0.818 345.57
Decision Tree 0.771 819.06
KNN 0.765 117.61
Linear Discriminant 0.812 148.15
Logistic Regression 0.818 160.59
Ensemble 0.641 245.30
Table 6. Prediction Result Comparison of Dataset C
Metrics
SVM
De
cisi
on
Tre
e
KN
N
Lin
ear
Dis
crim
inan
t
Logi
stic
Re
gre
ssio
n
Ense
mb
le
Correct rate 0.894 0.859 0.841 0.841 0.882 0.641
Error rate 0.106 0.141 0.159 0.159 0.118 0.359
Last Correct Rate 0.894 0.859 0.841 0.841 0.882 0.641
Last Error Rate 0.106 0.141 0.158 0.158 0.118 0.359
Inconclusive Rate 0 0 0 0 0 0
Classified Rate 1 1 1 1 1 1
Sensitivity (TPR) 0.869 0.689 0.803 0.721 0.803 0
Specificity (TNR) 0.908 0.954 0.927 0.908 0.927 1
Positive Predictive Value 0.841 0.894 0.860 0.815 0.860 NaN
Negative Predictive Value 0.925 0.846 0.894 0.853 0.894 0.641
Positive Likelihood 9.471 15.010 10.945 7.862 10.945 NaN
Negative Likelihood 0.144 0.3275 0.212 0.307 0.212 1
Prevalence 0.359 0.359 0.359 0.359 0.359 0.359
F1 0.855 0.778 0.831 0.765 0.831 NaN
Bookmaker Informedness (BM) 0.777 0.643 0.730 0.630 0.730 0
Markedness (MK) 0.767 0.739 0.753 0.668 0.753 NaN
227 Cheng-Hong Yang, Dony Novaliendry, Jin-Bor Chen, Fegie Y Wattimena, Axelon S Renyaan, Yaslinda Lizar, Asriwan Guci, Muhammad Ariyon, Dochi Ramadhani, Unung Verawardina, Irwan, Yenny Desnelita, Wilda Susanti, Gustientiedina, Hastuti
Marlina, Arden Simeru, Torkis Nasution
REVISTA ARGENTINA 2020, Vol. XXIX, N°4, 219-232 DE CLÍNICA PSICOLÓGICA
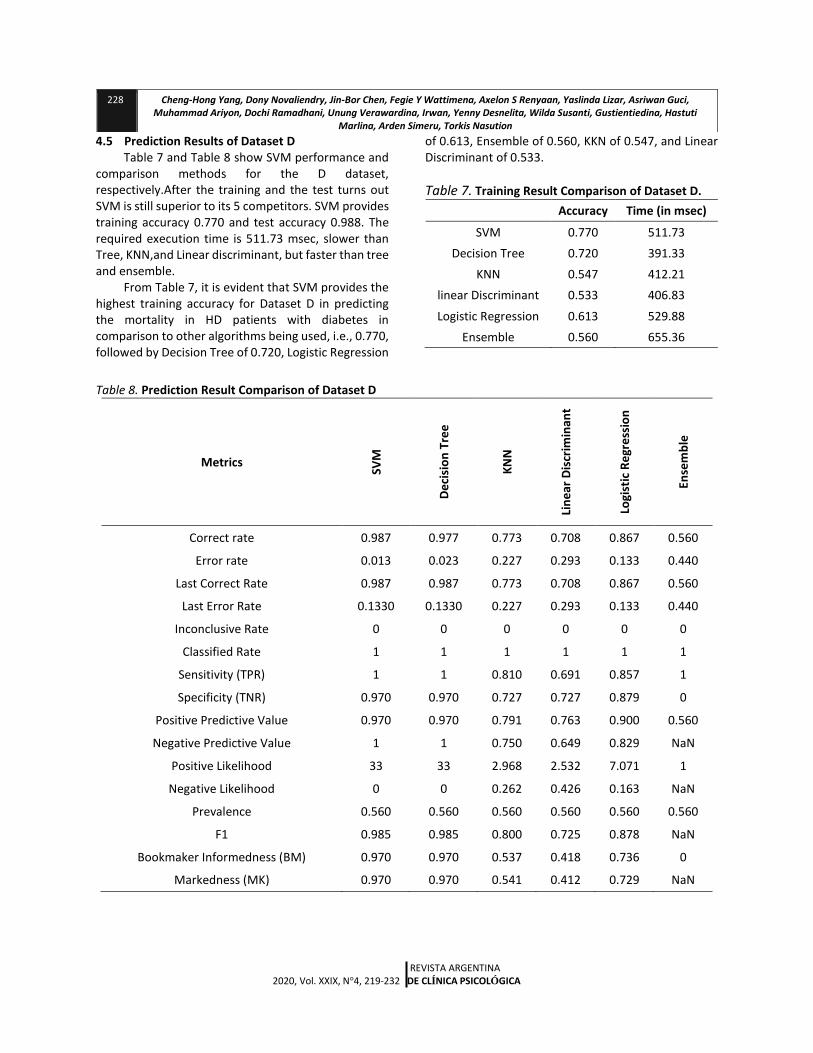
4.5 Prediction Results of Dataset D Table 7 and Table 8 show SVM performance and
comparison methods for the D dataset, respectively.After the training and the test turns out SVM is still superior to its 5 competitors. SVM provides training accuracy 0.770 and test accuracy 0.988. The required execution time is 511.73 msec, slower than Tree, KNN,and Linear discriminant, but faster than tree and ensemble.
From Table 7, it is evident that SVM provides the highest training accuracy for Dataset D in predicting the mortality in HD patients with diabetes in comparison to other algorithms being used, i.e., 0.770, followed by Decision Tree of 0.720, Logistic Regression
of 0.613, Ensemble of 0.560, KKN of 0.547, and Linear Discriminant of 0.533.
Table 7. Training Result Comparison of Dataset D. Accuracy Time (in msec)
SVM 0.770 511.73
Decision Tree 0.720 391.33
KNN 0.547 412.21
linear Discriminant 0.533 406.83
Logistic Regression 0.613 529.88
Ensemble 0.560 655.36
Table 8. Prediction Result Comparison of Dataset D
Metrics
SVM
De
cisi
on
Tre
e
KN
N
Lin
ear
Dis
crim
inan
t
Logi
stic
Re
gre
ssio
n
Ense
mb
le
Correct rate 0.987 0.977 0.773 0.708 0.867 0.560
Error rate 0.013 0.023 0.227 0.293 0.133 0.440
Last Correct Rate 0.987 0.987 0.773 0.708 0.867 0.560
Last Error Rate 0.1330 0.1330 0.227 0.293 0.133 0.440
Inconclusive Rate 0 0 0 0 0 0
Classified Rate 1 1 1 1 1 1
Sensitivity (TPR) 1 1 0.810 0.691 0.857 1
Specificity (TNR) 0.970 0.970 0.727 0.727 0.879 0
Positive Predictive Value 0.970 0.970 0.791 0.763 0.900 0.560
Negative Predictive Value 1 1 0.750 0.649 0.829 NaN
Positive Likelihood 33 33 2.968 2.532 7.071 1
Negative Likelihood 0 0 0.262 0.426 0.163 NaN
Prevalence 0.560 0.560 0.560 0.560 0.560 0.560
F1 0.985 0.985 0.800 0.725 0.878 NaN
Bookmaker Informedness (BM) 0.970 0.970 0.537 0.418 0.736 0
Markedness (MK) 0.970 0.970 0.541 0.412 0.729 NaN
228 Cheng-Hong Yang, Dony Novaliendry, Jin-Bor Chen, Fegie Y Wattimena, Axelon S Renyaan, Yaslinda Lizar, Asriwan Guci, Muhammad Ariyon, Dochi Ramadhani, Unung Verawardina, Irwan, Yenny Desnelita, Wilda Susanti, Gustientiedina, Hastuti
Marlina, Arden Simeru, Torkis Nasution
REVISTA ARGENTINA 2020, Vol. XXIX, N°4, 219-232 DE CLÍNICA PSICOLÓGICA
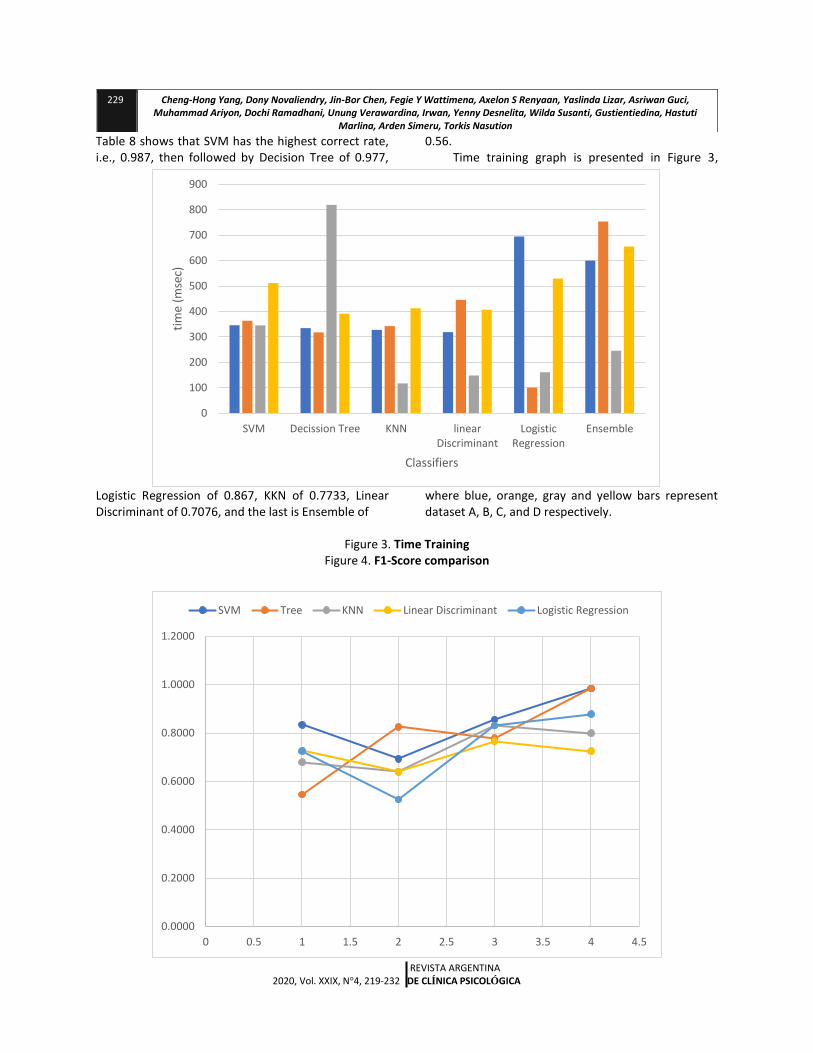
Table 8 shows that SVM has the highest correct rate, i.e., 0.987, then followed by Decision Tree of 0.977,
Logistic Regression of 0.867, KKN of 0.7733, Linear Discriminant of 0.7076, and the last is Ensemble of
0.56. Time training graph is presented in Figure 3,
where blue, orange, gray and yellow bars represent dataset A, B, C, and D respectively.
Figure 3. Time Training Figure 4. F1-Score comparison
229 Cheng-Hong Yang, Dony Novaliendry, Jin-Bor Chen, Fegie Y Wattimena, Axelon S Renyaan, Yaslinda Lizar, Asriwan Guci, Muhammad Ariyon, Dochi Ramadhani, Unung Verawardina, Irwan, Yenny Desnelita, Wilda Susanti, Gustientiedina, Hastuti
Marlina, Arden Simeru, Torkis Nasution
0
100
200
300
400
500
600
700
800
900
SVM Decission Tree KNN linearDiscriminant
LogisticRegression
Ensemble
tim
e (m
sec)
Classifiers
0.0000
0.2000
0.4000
0.6000
0.8000
1.0000
1.2000
0 0.5 1 1.5 2 2.5 3 3.5 4 4.5
SVM Tree KNN Linear Discriminant Logistic Regression
REVISTA ARGENTINA 2020, Vol. XXIX, N°4, 219-232 DE CLÍNICA PSICOLÓGICA
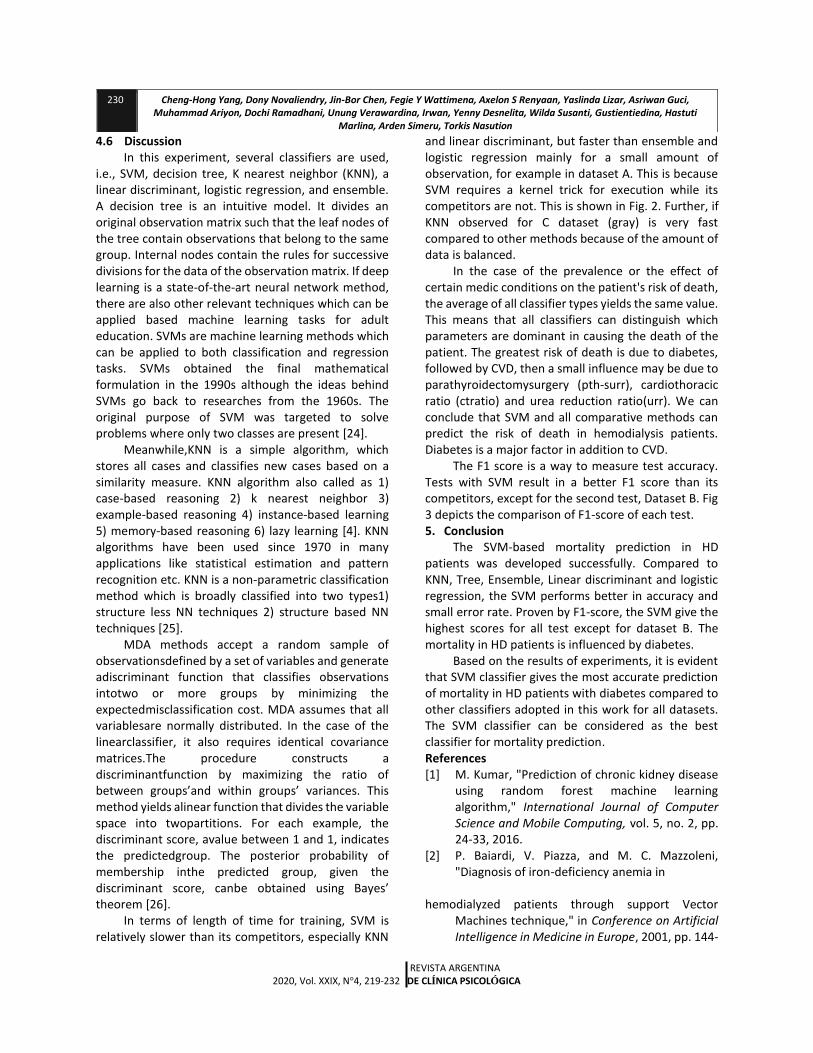
4.6 Discussion In this experiment, several classifiers are used,
i.e., SVM, decision tree, K nearest neighbor (KNN), a linear discriminant, logistic regression, and ensemble. A decision tree is an intuitive model. It divides an original observation matrix such that the leaf nodes of the tree contain observations that belong to the same group. Internal nodes contain the rules for successive divisions for the data of the observation matrix. If deep learning is a state-of-the-art neural network method, there are also other relevant techniques which can be applied based machine learning tasks for adult education. SVMs are machine learning methods which can be applied to both classification and regression tasks. SVMs obtained the final mathematical formulation in the 1990s although the ideas behind SVMs go back to researches from the 1960s. The original purpose of SVM was targeted to solve problems where only two classes are present [24].
Meanwhile,KNN is a simple algorithm, which stores all cases and classifies new cases based on a similarity measure. KNN algorithm also called as 1) case-based reasoning 2) k nearest neighbor 3) example-based reasoning 4) instance-based learning 5) memory-based reasoning 6) lazy learning [4]. KNN algorithms have been used since 1970 in many applications like statistical estimation and pattern recognition etc. KNN is a non-parametric classification method which is broadly classified into two types1) structure less NN techniques 2) structure based NN techniques [25].
MDA methods accept a random sample of observationsdefined by a set of variables and generate adiscriminant function that classifies observations intotwo or more groups by minimizing the expectedmisclassification cost. MDA assumes that all variablesare normally distributed. In the case of the linearclassifier, it also requires identical covariance matrices.The procedure constructs a discriminantfunction by maximizing the ratio of between groups’and within groups’ variances. This method yields alinear function that divides the variable space into twopartitions. For each example, the discriminant score, avalue between 1 and 1, indicates the predictedgroup. The posterior probability of membership inthe predicted group, given the discriminant score, canbe obtained using Bayes’ theorem [26].
In terms of length of time for training, SVM is relatively slower than its competitors, especially KNN
and linear discriminant, but faster than ensemble and logistic regression mainly for a small amount of observation, for example in dataset A. This is because SVM requires a kernel trick for execution while its competitors are not. This is shown in Fig. 2. Further, if KNN observed for C dataset (gray) is very fast compared to other methods because of the amount of data is balanced.
In the case of the prevalence or the effect of certain medic conditions on the patient's risk of death, the average of all classifier types yields the same value. This means that all classifiers can distinguish which parameters are dominant in causing the death of the patient. The greatest risk of death is due to diabetes, followed by CVD, then a small influence may be due to parathyroidectomysurgery (pth-surr), cardiothoracic ratio (ctratio) and urea reduction ratio(urr). We can conclude that SVM and all comparative methods can predict the risk of death in hemodialysis patients. Diabetes is a major factor in addition to CVD.
The F1 score is a way to measure test accuracy. Tests with SVM result in a better F1 score than its competitors, except for the second test, Dataset B. Fig 3 depicts the comparison of F1-score of each test. 5. Conclusion
The SVM-based mortality prediction in HD patients was developed successfully. Compared to KNN, Tree, Ensemble, Linear discriminant and logistic regression, the SVM performs better in accuracy and small error rate. Proven by F1-score, the SVM give the highest scores for all test except for dataset B. The mortality in HD patients is influenced by diabetes.
Based on the results of experiments, it is evident that SVM classifier gives the most accurate prediction of mortality in HD patients with diabetes compared to other classifiers adopted in this work for all datasets. The SVM classifier can be considered as the best classifier for mortality prediction. References [1] M. Kumar, "Prediction of chronic kidney disease
using random forest machine learning algorithm," International Journal of Computer Science and Mobile Computing, vol. 5, no. 2, pp. 24-33, 2016.
[2] P. Baiardi, V. Piazza, and M. C. Mazzoleni, "Diagnosis of iron-deficiency anemia in
hemodialyzed patients through support Vector
Machines technique," in Conference on Artificial Intelligence in Medicine in Europe, 2001, pp. 144-
230 Cheng-Hong Yang, Dony Novaliendry, Jin-Bor Chen, Fegie Y Wattimena, Axelon S Renyaan, Yaslinda Lizar, Asriwan Guci, Muhammad Ariyon, Dochi Ramadhani, Unung Verawardina, Irwan, Yenny Desnelita, Wilda Susanti, Gustientiedina, Hastuti
Marlina, Arden Simeru, Torkis Nasution
REVISTA ARGENTINA 2020, Vol. XXIX, N°4, 219-232 DE CLÍNICA PSICOLÓGICA
147: Springer. [3] N. Borisagar, D. Barad, and P. Raval, "Chronic
kidney disease prediction using back propagation neural network algorithm," in Proceedings of International Conference on Communication and Networks, 2017, pp. 295-303: Springer.
[4] S.-L. Developers, "Plot different SVM classifiers in the iris dataset," 2017.
[5] T. B. Drüeke et al., "Normalization of hemoglobin level in patients with chronic kidney disease and anemia," New England Journal of Medicine, vol. 355, no. 20, pp. 2071-2084, 2006.
[6] R. Lacson, "Predicting hemodialysis mortality utilizing blood pressure trends," in AMIA Annual Symposium Proceedings, 2008, vol. 2008, p. 369: American Medical Informatics Association.
[7] H. Mirinejad and T. Inanc, "RBF method for optimal control of drug administration in the anemia of hemodialysis patients," in Biomedical Engineering Conference (NEBEC), 2015 41st Annual Northeast, 2015, pp. 1-2: IEEE.
[8] S. Patil, "A literature Review on Prediction of Chronic Kidney Disease Using Data Mining Techniques."
[9] S. P. Potharaju and M. Sreedevi, "Ensembled rule based classification algorithms for predicting imbalanced kidney disease data," Journal of engineering science and technology review, vol. 9, no. 5, pp. 201-207, 2016.
[10] S. Ramya and N. Radha, "Diagnosis of chronic kidney disease using machine learning algorithms," International Journal of Innovative Research in Computer and Communication Engineering, vol. 4, no. 1, pp. 812-820, 2016.
[11] A. D. Wibawa, M. A. Sitorus, and M. H. Purnomo, "CLASSIFICATION OF IRIS IMAGE OF PATIENT CHRONIC RENAL FAILUR (CRF) USING WATERSHED ALGORITHM AND SUPPORT VECTOR MACHINE (SVM)," Journal of Theoretical and Applied Information Technology, vol. 91, no. 2, p. 390, 2016.
[12] J.-Y. Yeh, T.-H. Wu, and C.-W. Tsao, "Using data mining techniques to predict hospitalization of hemodialysis patients," Decision Support Systems, vol. 50, no. 2, pp. 439-448, 2011.
[13] Z. Liu, Z. Liu, Z. Zhu, Y. Shen, and J. Dong,
"Simulated annealing for a multi-level nurse rostering problem in hemodialysis service," Applied Soft Computing, vol. 64, pp. 148-160, 2018.
[14] P. Escandell-Montero et al., "Optimization of anemia treatment in hemodialysis patients via
reinforcement learning," Artificial intelligence in medicine, vol. 62, no. 1, pp. 47-60, 2014.
[15] J. W. Choi et al., "Application of genetic algorithm for hemodialysis schedule optimization," Computer Methods and Programs in Biomedicine, vol. 145, pp. 35-43, 2017.
[16] J.-X. Wu, C.-M. Li, G.-C. Chen, Y.-R. Ho, and C.-H. Lin, "Peripheral arterial disease screening for hemodialysis patients using a fractional-order integrator and transition probability decision-making model," IET systems biology, vol. 11, no. 2, pp. 69-76, 2017.
[17] P. Panwong and N. Iam-On, "Predicting transitional interval of kidney disease stages 3 to 5 using data mining method," in Defence Technology (ACDT), 2016 Second Asian Conference on, 2016, pp. 145-150: IEEE.
[18] W.-L. Chen, C.-D. Kan, C.-H. Lin, and T. Chen, "A rule-based decision-making diagnosis system to evaluate arteriovenous shunt stenosis for hemodialysis treatment of patients using fuzzy petri nets," IEEE Journal of Biomedical and Health Informatics, vol. 18, no. 2, pp. 703-713, 2014.
[19] D. Novaliendy, Y. Hendriyani, C.-H. Yang, and H. Hamimi, "The Optimized K-Means Clustering Algorithms To Analyzed the Budget Revenue Expenditure in Padang," Proceeding of the Electrical Engineering Computer Science and Informatics, vol. 2, no. 1, pp. 61-66, 2015.
[20] D. Novaliendry, C.-H. Yang, and A. D. G. Labukti, "The expert system application for diagnosing human vitamin deficiency through forward chaining method," in 2015 International Conference on Information and Communication Technology Convergence (ICTC), 2015, pp. 53-58: IEEE.
[21] J. I. Titapiccolo et al., "Predictive modeling of cardiovascular complications in incident hemodialysis patients," in Engineering in Medicine and Biology Society (EMBC), 2012 Annual International Conference of the IEEE,
2012, pp. 3943-3946: IEEE.
[22] S. Sun, H. Wang, Z. Jiang, Y. Fang, and T. Tao, "Segmentation-based heart sound feature extraction combined with classifier models for a VSD diagnosis system," Expert Systems with Applications, vol. 41, no. 4, pp. 1769-1780, 2014.
[23] MathWorks. (2018). svmtrain. Available: https://www.mathworks.com/help/stats/svmtrain.html
[24] J. Rasku, P. Kuusipalo, and H. Joutsijoki, "Decision
REVISTA ARGENTINA 2020, Vol. XXIX, N°4, 219-232 DE CLÍNICA PSICOLÓGICA
Support Systems Review." [25] B. Deekshatulu and P. Chandra, "Classification of
heart disease using k-nearest neighbor and genetic algorithm," Procedia Technology, vol. 10,
pp. 85-94, 2013. [26] M. Y. Kiang, "A comparative assessment of
classification methods," Decision support systems, vol. 35, no. 4, pp. 441-454, 2003.
Supplementary Results
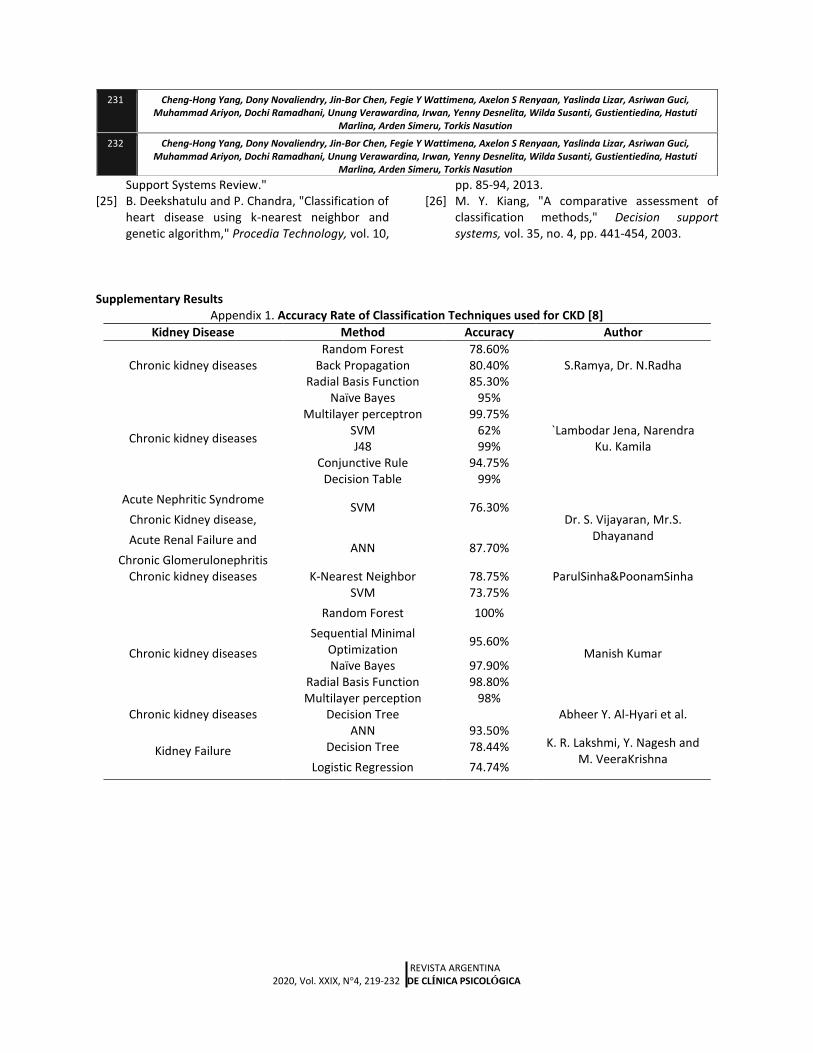
Appendix 1. Accuracy Rate of Classification Techniques used for CKD [8]
Kidney Disease Method Accuracy Author
Chronic kidney diseases Random Forest 78.60%
S.Ramya, Dr. N.Radha Back Propagation 80.40% Radial Basis Function 85.30%
Chronic kidney diseases
Naïve Bayes 95%
`Lambodar Jena, Narendra Ku. Kamila
Multilayer perceptron 99.75% SVM 62% J48 99%
Conjunctive Rule 94.75% Decision Table 99%
Acute Nephritic Syndrome SVM 76.30%
Dr. S. Vijayaran, Mr.S. Dhayanand
Chronic Kidney disease,
Acute Renal Failure and ANN 87.70%
Chronic Glomerulonephritis Chronic kidney diseases K-Nearest Neighbor 78.75% ParulSinha&PoonamSinha
SVM 73.75%
Chronic kidney diseases
Random Forest 100%
Manish Kumar
Sequential Minimal Optimization
95.60%
Naïve Bayes 97.90% Radial Basis Function 98.80% Multilayer perception 98%
Chronic kidney diseases Decision Tree Abheer Y. Al-Hyari et al.
Kidney Failure
ANN 93.50% K. R. Lakshmi, Y. Nagesh and
M. VeeraKrishna Decision Tree 78.44%
Logistic Regression 74.74%
231 Cheng-Hong Yang, Dony Novaliendry, Jin-Bor Chen, Fegie Y Wattimena, Axelon S Renyaan, Yaslinda Lizar, Asriwan Guci, Muhammad Ariyon, Dochi Ramadhani, Unung Verawardina, Irwan, Yenny Desnelita, Wilda Susanti, Gustientiedina, Hastuti
Marlina, Arden Simeru, Torkis Nasution
232 Cheng-Hong Yang, Dony Novaliendry, Jin-Bor Chen, Fegie Y Wattimena, Axelon S Renyaan, Yaslinda Lizar, Asriwan Guci, Muhammad Ariyon, Dochi Ramadhani, Unung Verawardina, Irwan, Yenny Desnelita, Wilda Susanti, Gustientiedina, Hastuti
Marlina, Arden Simeru, Torkis Nasution
REVISTA ARGENTINA 2020, Vol. XXIX, N°4, 219-232 DE CLÍNICA PSICOLÓGICA
Appendix 2. Features of hemodialysis patients
Number Features Data types
1 survival year numeric 2 CVD binary 3 hemodialysis duration numeric 4 Diabetes (dm) binary 5 parathyroidectomy surgery (ipth) binary 6 Gender (sex) binary 7 Functional status numeric 8 albumin level numeric 9 hemoglobin level (hbc) numeric
10 Hematocrit (hct) numeric 11 ferritin ion (fe) numeric 12 blood urea nitrogen (bun) numeric 13 Creatinine (cr) numeric 14 Potassium (k) numeric 15 Phosphorus (p) numeric 16 urea reduction ratio (urr) numeric 17 ktv numeric 18 intact parathyroid hormone numeric 19 cardiothoracic ratio (ctratio) numeric 20 adjusted calcium level (correct_ca) numeric 21 death binary 22 ctgrp binary with scale (0: <0.5, 1: >=0.5) 23 urrgrp binary with scale (0: <0.65, 1: >=0.65) 24 age group integer scale
Appendix3. Specification of Dataset A, Dataset B, Dataset C and Dataset D
Dataset A
Sex ctratio urrgrp cvd dm pth_sur total
Male 12 30 0 4 14 31 Female 27 44 2 2 15 35
Dataset B
Sex ctratio urrgrp cvd dm pth_sur total
Male 85 144 7 39 41 153 Female 115 201 11 37 78 201
Dataset C
Sex ctratio urrgrp cvd dm pth_sur total
Male 51 81 10 35 14 85 Female 68 85 5 19 23 85
Dataset D
Sex ctratio urrgrp cvd dm pth_sur total
Male 16 21 3 6 2 21 Female 46 53 12 18 7 54