Embed Size (px)
Citation preview
I N F O R M A Ç Ã O
D E M E R C A D O S
MARKET INFORMATION
P R O D U T O S
A N I M A I S
ANIMAL PRODUCTS
2017
INFORMAÇÃO DE MERCADOS / MARKET INFORMATION
2
E F E T I V O S / L I V E S T O C K 0 5
A B A T E S P A R A C O N S U M O / S L A U G H T E R S F O R C O M S U P T I O N 0 9
P R O D U Ç Ã O D E L E I T E / M I L K P R O D U C T I O N 1 3
P R E Ç O S N A P R O D U Ç Ã O / P R O D U C E R P R I C E S 1 4
C O M É R C I O I N T E R N A C I O N A L / F O R E I G N T R A D E 2 0
B A L A N Ç O D E A P R O V I S I O N A M E N T O / S U P P L Y B A L A N C E S H E E T 2 3
PRODUTOS ANIMAIS / ANIMAL PRODUCTS
3
PRODUTOS ANIMAIS | ANIMAL PRODUCTS
Enquadramento | Introduction
Nesta brochura, o Gabinete de Planeamento, Políticas e Administração Geral (GPP) pretende divulgar informação sucinta que dê a conhecer o que no setor agrícola,
a nível de produção animal, se produz em Portugal.
Para o efeito foi selecionada informação que se afigura essencial para um conhecimento geral dos produtos, incluindo os efetivos e abates efetuados, os preços a
que são vendidos os produtos, as condições em que se processa o seu escoamento – colocação no mercado nacional ou externo – e o que representam para o
abastecimento interno do país.
In this booklet, the Office for Planning, Policies and Administration (GPP) publishes a summary of statistics about animal products in Portugal.
A set of the most important data, including animal production, slaughtering, prices, marketing, imports and exports and domestic supply, have been selected for
publication.
INFORMAÇÃO DE MERCADOS / MARKET INFORMATION
4
Em 2016, o valor da produção animal (Portugal) a preços correntes (2 630,9 milhões de Euros), correspondeu a 37,9% do valor da Produção do Ramo Agrícola,
segundo as Contas Económicas da Agricultura (INE). De 2010 para 2015, a taxa de crescimento médio anual foi de 0,5%. A principal parcela é a do leite (24,8%
do valor em 2016), seguindo-se-lhe os bovinos (21,6%), as aves de capoeira (18,6%), os suínos (18,5%), os ovos (5,2%) e os ovinos e caprinos (5,1%). De 2015
para 2016, todos os produtos com exceção dos outros produtos animais (+5,1%) sofreram uma redução, sendo de destacar a quebra nos ovos (-17,7%), no leite
(-7,4%) e nas aves de capoeira (-6,6%).
In 2016, the value of livestock production (Portugal) at current prices (M€ 2 630.9), corresponded to 37.9% of the total value of agricultural production, according
to the Economic Accounts for Agriculture (INE - Statistics Portugal). From 2010 to 2015, the annual average growth rate was 0.5%. The main product is milk
(24.8% of the total value in 2016), followed by cattle (21.6%), poultry (18.6%), pigs (18.5%), eggs (5.2%) and sheep and goats (5.1%). From 2015 to 2016, there
was a decrease in eggs (-17.7%), milk (-7.4%) and poultry (-6.6%), but an increase in other animal products (+5.1%).
PRODUTOS ANIMAIS / ANIMAL PRODUCTS
5
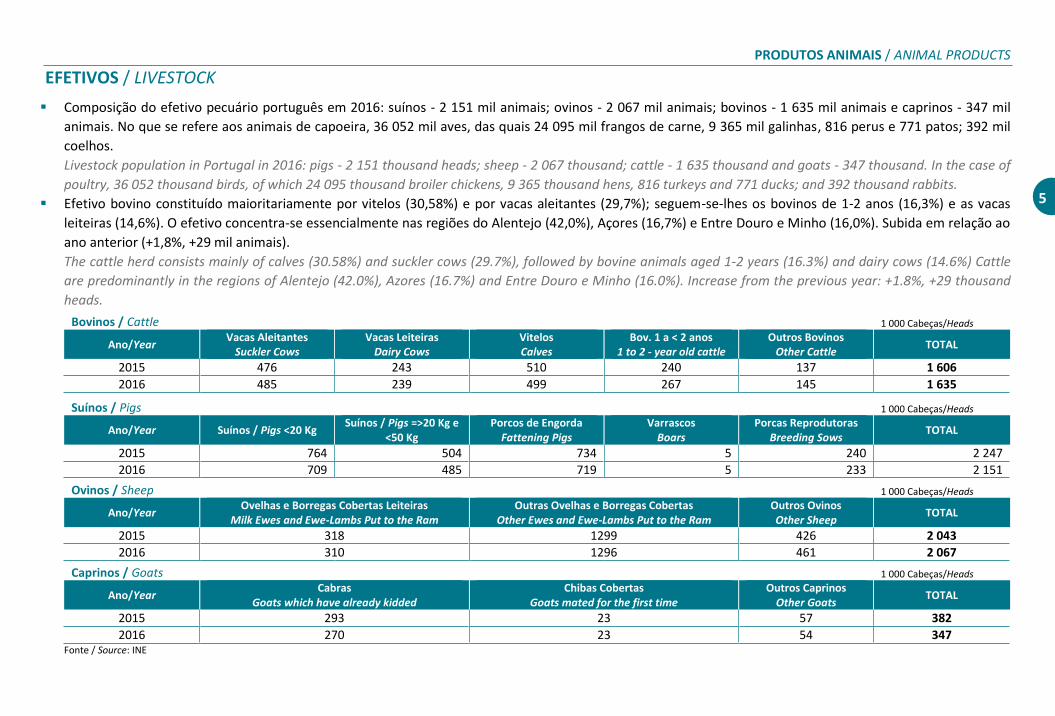
EFETIVOS / LIVESTOCK
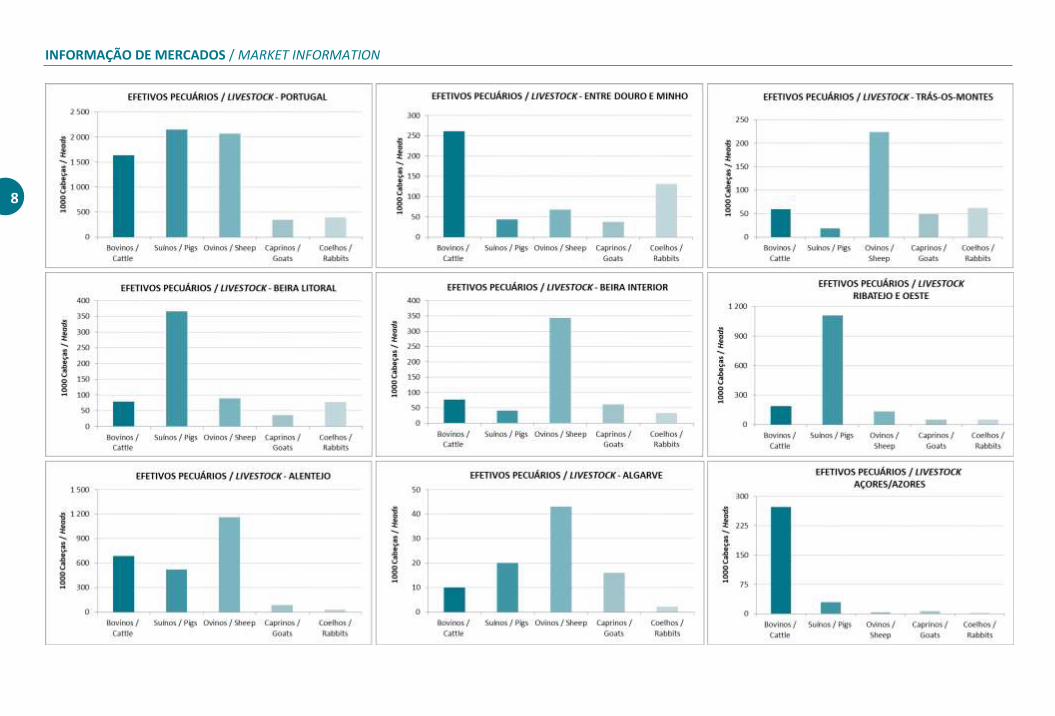
Composição do efetivo pecuário português em 2016: suínos - 2 151 mil animais; ovinos - 2 067 mil animais; bovinos - 1 635 mil animais e caprinos - 347 mil
animais. No que se refere aos animais de capoeira, 36 052 mil aves, das quais 24 095 mil frangos de carne, 9 365 mil galinhas, 816 perus e 771 patos; 392 mil
coelhos.
Livestock population in Portugal in 2016: pigs - 2 151 thousand heads; sheep - 2 067 thousand; cattle - 1 635 thousand and goats - 347 thousand. In the case of
poultry, 36 052 thousand birds, of which 24 095 thousand broiler chickens, 9 365 thousand hens, 816 turkeys and 771 ducks; and 392 thousand rabbits.
Efetivo bovino constituído maioritariamente por vitelos (30,58%) e por vacas aleitantes (29,7%); seguem-se-lhes os bovinos de 1-2 anos (16,3%) e as vacas
leiteiras (14,6%). O efetivo concentra-se essencialmente nas regiões do Alentejo (42,0%), Açores (16,7%) e Entre Douro e Minho (16,0%). Subida em relação ao
ano anterior (+1,8%, +29 mil animais).
The cattle herd consists mainly of calves (30.58%) and suckler cows (29.7%), followed by bovine animals aged 1-2 years (16.3%) and dairy cows (14.6%) Cattle
are predominantly in the regions of Alentejo (42.0%), Azores (16.7%) and Entre Douro e Minho (16.0%). Increase from the previous year: +1.8%, +29 thousand
heads.
Bovinos / Cattle 1 000 Cabeças/Heads
Ano/Year Vacas Aleitantes
Suckler Cows Vacas Leiteiras
Dairy Cows Vitelos Calves
Bov. 1 a < 2 anos 1 to 2 - year old cattle
Outros Bovinos Other Cattle
TOTAL
2015 476 243 510 240 137 1 606
2016 485 239 499 267 145 1 635
Suínos / Pigs 1 000 Cabeças/Heads
Ano/Year Suínos / Pigs <20 Kg Suínos / Pigs =>20 Kg e
<50 Kg Porcos de Engorda
Fattening Pigs Varrascos
Boars Porcas Reprodutoras
Breeding Sows TOTAL
2015 764 504 734 5 240 2 247
2016 709 485 719 5 233 2 151
Ovinos / Sheep 1 000 Cabeças/Heads
Ano/Year Ovelhas e Borregas Cobertas Leiteiras
Milk Ewes and Ewe-Lambs Put to the Ram Outras Ovelhas e Borregas Cobertas
Other Ewes and Ewe-Lambs Put to the Ram Outros Ovinos Other Sheep
TOTAL
2015 318 1299 426 2 043
2016 310 1296 461 2 067
Caprinos / Goats 1 000 Cabeças/Heads
Ano/Year Cabras
Goats which have already kidded Chibas Cobertas
Goats mated for the first time Outros Caprinos
Other Goats TOTAL
2015 293 23 57 382
2016 270 23 54 347 Fonte / Source: INE
INFORMAÇÃO DE MERCADOS / MARKET INFORMATION
6
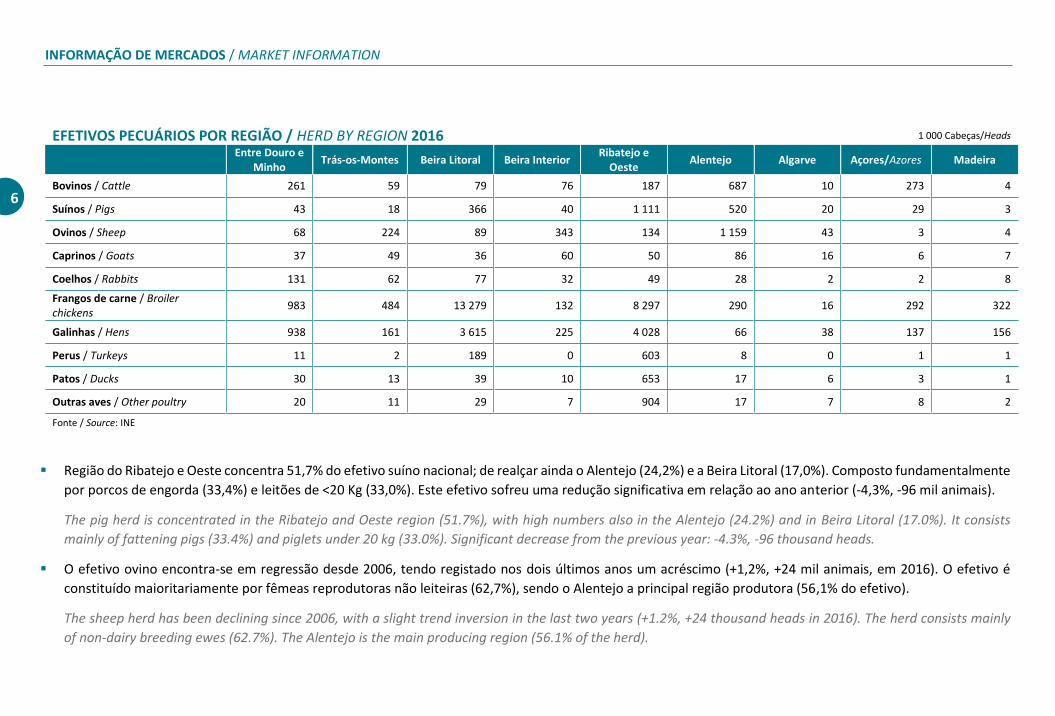
EFETIVOS PECUÁRIOS POR REGIÃO / HERD BY REGION 2016 1 000 Cabeças/Heads
Entre Douro e
Minho Trás-os-Montes Beira Litoral Beira Interior
Ribatejo e Oeste
Alentejo Algarve Açores/Azores Madeira Bovinos / Cattle 261 59 79 76 187 687 10 273 4 Suínos / Pigs 43 18 366 40 1 111 520 20 29 3 Ovinos / Sheep 68 224 89 343 134 1 159 43 3 4 Caprinos / Goats 37 49 36 60 50 86 16 6 7 Coelhos / Rabbits 131 62 77 32 49 28 2 2 8 Frangos de carne / Broiler chickens 983 484 13 279 132 8 297 290 16 292 322 Galinhas / Hens 938 161 3 615 225 4 028 66 38 137 156 Perus / Turkeys 11 2 189 0 603 8 0 1 1 Patos / Ducks 30 13 39 10 653 17 6 3 1 Outras aves / Other poultry 20 11 29 7 904 17 7 8 2 Fonte / Source: INE
Região do Ribatejo e Oeste concentra 51,7% do efetivo suíno nacional; de realçar ainda o Alentejo (24,2%) e a Beira Litoral (17,0%). Composto fundamentalmente
por porcos de engorda (33,4%) e leitões de <20 Kg (33,0%). Este efetivo sofreu uma redução significativa em relação ao ano anterior (-4,3%, -96 mil animais).
The pig herd is concentrated in the Ribatejo and Oeste region (51.7%), with high numbers also in the Alentejo (24.2%) and in Beira Litoral (17.0%). It consists
mainly of fattening pigs (33.4%) and piglets under 20 kg (33.0%). Significant decrease from the previous year: -4.3%, -96 thousand heads.
O efetivo ovino encontra-se em regressão desde 2006, tendo registado nos dois últimos anos um acréscimo (+1,2%, +24 mil animais, em 2016). O efetivo é
constituído maioritariamente por fêmeas reprodutoras não leiteiras (62,7%), sendo o Alentejo a principal região produtora (56,1% do efetivo).
The sheep herd has been declining since 2006, with a slight trend inversion in the last two years (+1.2%, +24 thousand heads in 2016). The herd consists mainly
of non-dairy breeding ewes (62.7%). The Alentejo is the main producing region (56.1% of the herd).

PRODUTOS ANIMAIS / ANIMAL PRODUCTS
7
O efetivo caprino, constituído em 77,8% por cabras, está disperso por todo o país: Alentejo (24,8%), Beira Interior (17,3%), Ribatejo e Oeste (14,4%), Trás-os-
Montes (14,1%), Entre Douro e Minho (10,7%) e Beira Litoral (10,4%). O efetivo caprino está em regressão desde 2006, a qual prosseguiu em 2016 (-9,2%, -35
mil animais).
The goat herd (consisting of 77.8% she-goats) is scattered throughout the country: Alentejo (24.8%), Beira Interior (17.3%), Ribatejo e Oeste (14.4%), Trás-os-
Montes (14.1%), Entre Douro e Minho (10.7%) and Beira Litoral (10.4%). Goat numbers have been declining since 2006, and this trend continued in 2016 (-9.2%,
-35 thousand heads).
O efetivo de coelhos reduziu-se para menos de metade de 2013 para 2016 (-52,9%, -439 mil animais). As principais regiões produtoras são Entre Douro e Minho
(33,5%), Beira Litoral (19,7%), Trás-os-Montes (15,8%) e Ribatejo e Oeste (12,6%).
The number of rabbits fell to less than half from 2013 to 2016 (-52.9%, -439 thousand heads). The main producing regions are Entre Douro e Minho (33.5%), Beira
Litoral (19.7%), Trás-os-Montes (15.8%) and Ribatejo e Oeste (12.6%).
Pelo contrário, o efetivo total de aves aumentou 26,0% de 2013 para 2016 (+7 437 mil animais). A distribuição por espécies é a seguinte: 66,8% de frangos de
carne, 26,0% de galinhas, 2,3% de perus, 2,1% de patos e 2,8% outras aves. O efetivo de aves concentra-se fundamentalmente na Beira Litoral (48%) e no Ribatejo
e Oeste (36%). Os frangos de carne predominam na Beira Litoral (55,1%), enquanto as galinhas (43,0%), os perus (73,9%) e os patos (84,6%) são mais numerosos
no Ribatejo e Oeste.
On the contrary, poultry numbers increased by 26.0% from 2013 to 2016 (+7 437 thousand birds). The distribution by species is as follows: 66.8% of broiler
chickens, 26.0% of hens, 2.3% of turkeys, 2.1% of ducks and 2.8% of other birds. The bird population is mainly concentrated in Beira Litoral (48%) and in Ribatejo
e Oeste (36%). Broiler chickens predominate in Beira Litoral (55.1%), whereas hens (43.0%), turkeys (73.9%) and ducks (84.6%) are more abundant in Ribatejo e
Oeste.
INFORMAÇÃO DE MERCADOS / MARKET INFORMATION
8
PRODUTOS ANIMAIS / ANIMAL PRODUCTS
9
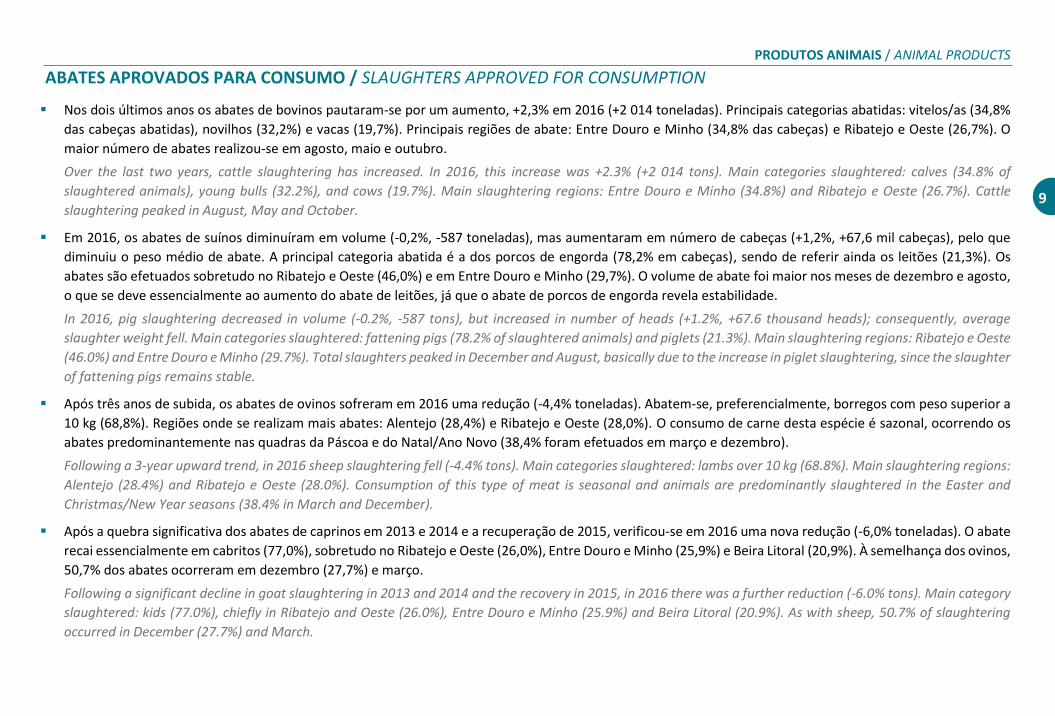
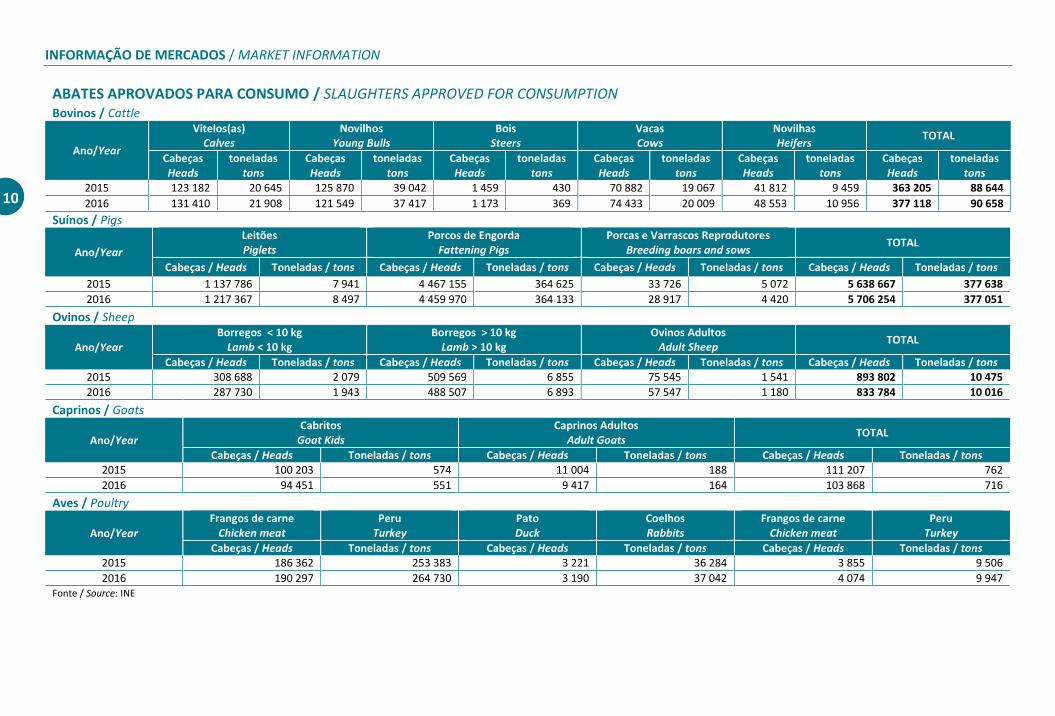
ABATES APROVADOS PARA CONSUMO / SLAUGHTERS APPROVED FOR CONSUMPTION
Nos dois últimos anos os abates de bovinos pautaram-se por um aumento, +2,3% em 2016 (+2 014 toneladas). Principais categorias abatidas: vitelos/as (34,8%
das cabeças abatidas), novilhos (32,2%) e vacas (19,7%). Principais regiões de abate: Entre Douro e Minho (34,8% das cabeças) e Ribatejo e Oeste (26,7%). O
maior número de abates realizou-se em agosto, maio e outubro.
Over the last two years, cattle slaughtering has increased. In 2016, this increase was +2.3% (+2 014 tons). Main categories slaughtered: calves (34.8% of
slaughtered animals), young bulls (32.2%), and cows (19.7%). Main slaughtering regions: Entre Douro e Minho (34.8%) and Ribatejo e Oeste (26.7%). Cattle
slaughtering peaked in August, May and October.
Em 2016, os abates de suínos diminuíram em volume (-0,2%, -587 toneladas), mas aumentaram em número de cabeças (+1,2%, +67,6 mil cabeças), pelo que
diminuiu o peso médio de abate. A principal categoria abatida é a dos porcos de engorda (78,2% em cabeças), sendo de referir ainda os leitões (21,3%). Os
abates são efetuados sobretudo no Ribatejo e Oeste (46,0%) e em Entre Douro e Minho (29,7%). O volume de abate foi maior nos meses de dezembro e agosto,
o que se deve essencialmente ao aumento do abate de leitões, já que o abate de porcos de engorda revela estabilidade.
In 2016, pig slaughtering decreased in volume (-0.2%, -587 tons), but increased in number of heads (+1.2%, +67.6 thousand heads); consequently, average
slaughter weight fell. Main categories slaughtered: fattening pigs (78.2% of slaughtered animals) and piglets (21.3%). Main slaughtering regions: Ribatejo e Oeste
(46.0%) and Entre Douro e Minho (29.7%). Total slaughters peaked in December and August, basically due to the increase in piglet slaughtering, since the slaughter
of fattening pigs remains stable.
Após três anos de subida, os abates de ovinos sofreram em 2016 uma redução (-4,4% toneladas). Abatem-se, preferencialmente, borregos com peso superior a
10 kg (68,8%). Regiões onde se realizam mais abates: Alentejo (28,4%) e Ribatejo e Oeste (28,0%). O consumo de carne desta espécie é sazonal, ocorrendo os
abates predominantemente nas quadras da Páscoa e do Natal/Ano Novo (38,4% foram efetuados em março e dezembro).
Following a 3-year upward trend, in 2016 sheep slaughtering fell (-4.4% tons). Main categories slaughtered: lambs over 10 kg (68.8%). Main slaughtering regions:
Alentejo (28.4%) and Ribatejo e Oeste (28.0%). Consumption of this type of meat is seasonal and animals are predominantly slaughtered in the Easter and
Christmas/New Year seasons (38.4% in March and December).
Após a quebra significativa dos abates de caprinos em 2013 e 2014 e a recuperação de 2015, verificou-se em 2016 uma nova redução (-6,0% toneladas). O abate
recai essencialmente em cabritos (77,0%), sobretudo no Ribatejo e Oeste (26,0%), Entre Douro e Minho (25,9%) e Beira Litoral (20,9%). À semelhança dos ovinos,
50,7% dos abates ocorreram em dezembro (27,7%) e março.
Following a significant decline in goat slaughtering in 2013 and 2014 and the recovery in 2015, in 2016 there was a further reduction (-6.0% tons). Main category
slaughtered: kids (77.0%), chiefly in Ribatejo and Oeste (26.0%), Entre Douro e Minho (25.9%) and Beira Litoral (20.9%). As with sheep, 50.7% of slaughtering
occurred in December (27.7%) and March.
INFORMAÇÃO DE MERCADOS / MARKET INFORMATION
10
ABATES APROVADOS PARA CONSUMO / SLAUGHTERS APPROVED FOR CONSUMPTION Bovinos / Cattle
Ano/Year
Vitelos(as) Calves
Novilhos Young Bulls
Bois Steers
Vacas Cows
Novilhas Heifers
TOTAL
Cabeças Heads
toneladas tons
Cabeças Heads
toneladas tons
Cabeças Heads
toneladas tons
Cabeças Heads
toneladas tons
Cabeças Heads
toneladas tons
Cabeças Heads
toneladas tons
2015 123 182 20 645 125 870 39 042 1 459 430 70 882 19 067 41 812 9 459 363 205 88 644
2016 131 410 21 908 121 549 37 417 1 173 369 74 433 20 009 48 553 10 956 377 118 90 658
Suínos / Pigs
Ano/Year
Leitões Piglets
Porcos de Engorda Fattening Pigs
Porcas e Varrascos Reprodutores Breeding boars and sows
TOTAL
Cabeças / Heads Toneladas / tons Cabeças / Heads Toneladas / tons Cabeças / Heads Toneladas / tons Cabeças / Heads Toneladas / tons
2015 1 137 786 7 941 4 467 155 364 625 33 726 5 072 5 638 667 377 638
2016 1 217 367 8 497 4 459 970 364 133 28 917 4 420 5 706 254 377 051
Ovinos / Sheep
Ano/Year Borregos < 10 kg
Lamb < 10 kg Borregos > 10 kg
Lamb > 10 kg Ovinos Adultos
Adult Sheep TOTAL
Cabeças / Heads Toneladas / tons Cabeças / Heads Toneladas / tons Cabeças / Heads Toneladas / tons Cabeças / Heads Toneladas / tons 2015 308 688 2 079 509 569 6 855 75 545 1 541 893 802 10 475
2016 287 730 1 943 488 507 6 893 57 547 1 180 833 784 10 016
Caprinos / Goats
Ano/Year
Cabritos Goat Kids
Caprinos Adultos Adult Goats
TOTAL
Cabeças / Heads Toneladas / tons Cabeças / Heads Toneladas / tons Cabeças / Heads Toneladas / tons 2015 100 203 574 11 004 188 111 207 762
2016 94 451 551 9 417 164 103 868 716
Aves / Poultry
Ano/Year
Frangos de carne Chicken meat
Peru Turkey
Pato Duck
Coelhos Rabbits
Frangos de carne Chicken meat
Peru Turkey
Cabeças / Heads Toneladas / tons Cabeças / Heads Toneladas / tons Cabeças / Heads Toneladas / tons 2015 186 362 253 383 3 221 36 284 3 855 9 506
2016 190 297 264 730 3 190 37 042 4 074 9 947 Fonte / Source: INE
PRODUTOS ANIMAIS / ANIMAL PRODUCTS
11
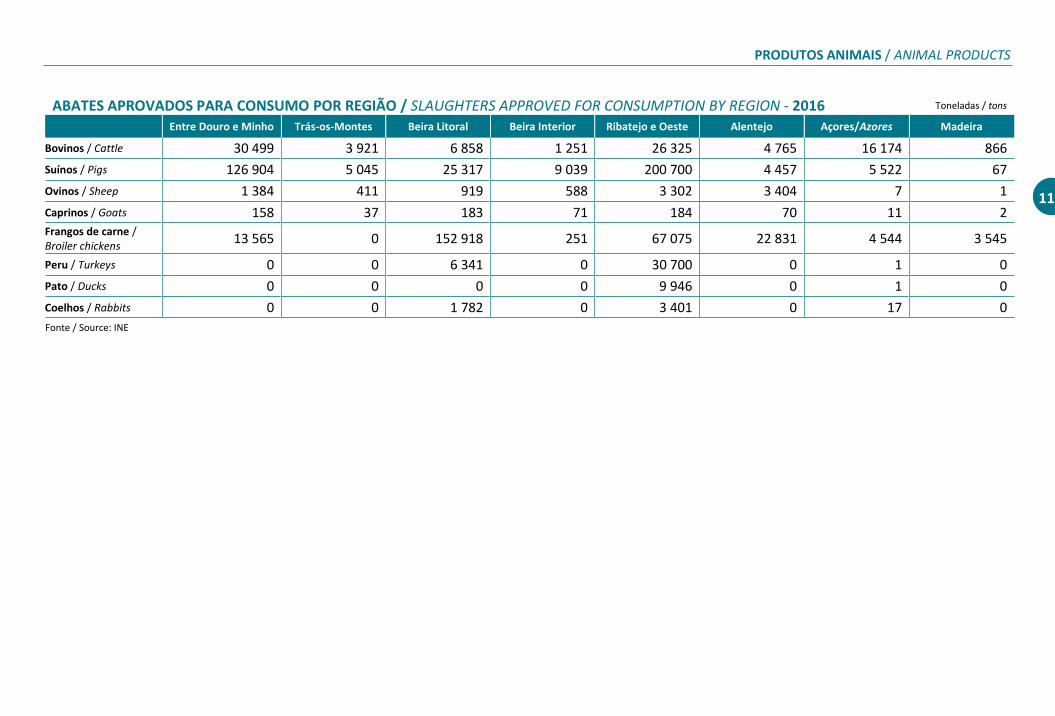
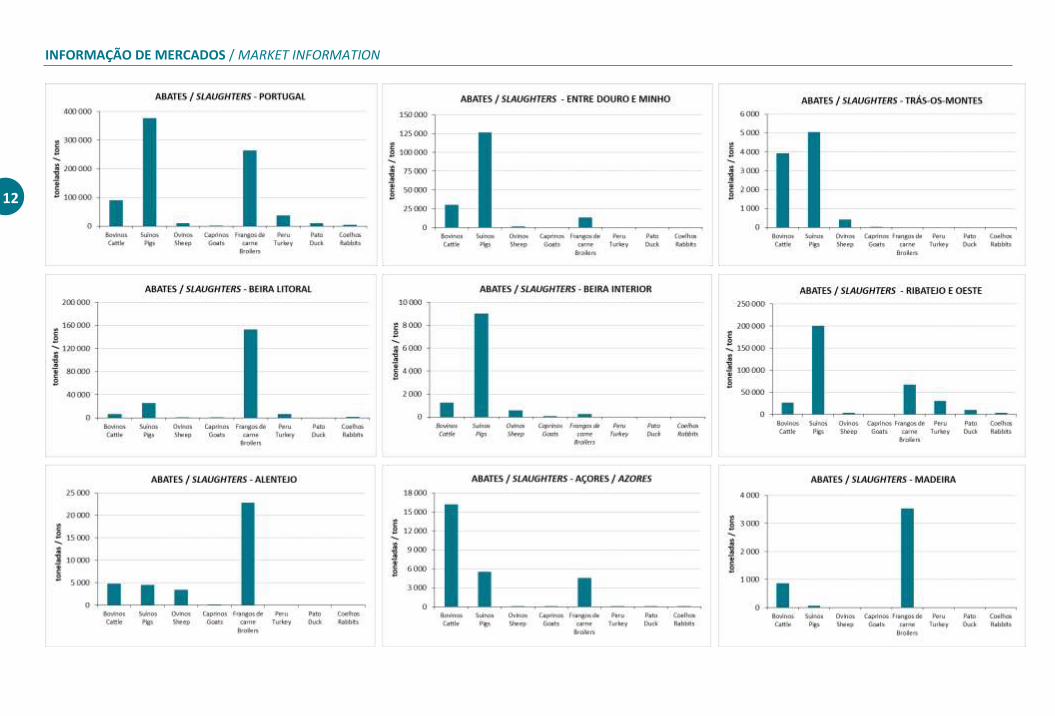
ABATES APROVADOS PARA CONSUMO POR REGIÃO / SLAUGHTERS APPROVED FOR CONSUMPTION BY REGION - 2016 Toneladas / tons
Entre Douro e Minho Trás-os-Montes Beira Litoral Beira Interior Ribatejo e Oeste Alentejo Açores/Azores Madeira
Bovinos / Cattle 30 499 3 921 6 858 1 251 26 325 4 765 16 174 866
Suínos / Pigs 126 904 5 045 25 317 9 039 200 700 4 457 5 522 67
Ovinos / Sheep 1 384 411 919 588 3 302 3 404 7 1
Caprinos / Goats 158 37 183 71 184 70 11 2 Frangos de carne / Broiler chickens
13 565 0 152 918 251 67 075 22 831 4 544 3 545
Peru / Turkeys 0 0 6 341 0 30 700 0 1 0
Pato / Ducks 0 0 0 0 9 946 0 1 0
Coelhos / Rabbits 0 0 1 782 0 3 401 0 17 0
Fonte / Source: INE
INFORMAÇÃO DE MERCADOS / MARKET INFORMATION
12
PRODUTOS ANIMAIS / ANIMAL PRODUCTS
13
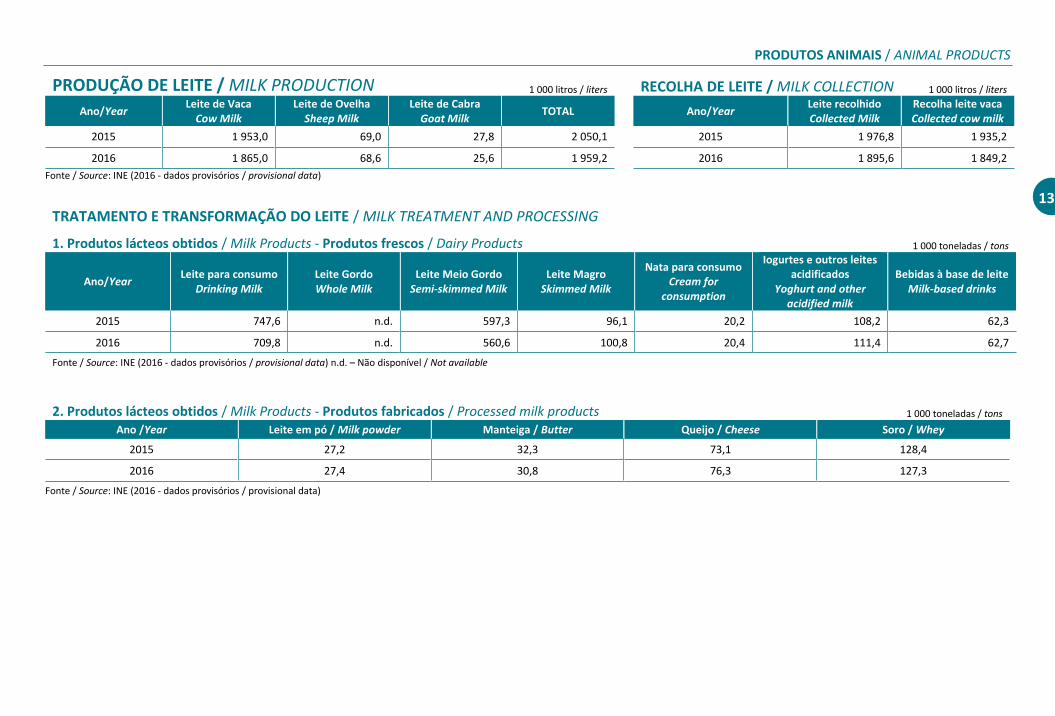
PRODUÇÃO DE LEITE / MILK PRODUCTION 1 000 litros / liters RECOLHA DE LEITE / MILK COLLECTION 1 000 litros / liters
Ano/Year Leite de Vaca
Cow Milk Leite de Ovelha
Sheep Milk Leite de Cabra
Goat Milk TOTAL Ano/Year
Leite recolhido Collected Milk
Recolha leite vaca Collected cow milk
2015 1 953,0 69,0 27,8 2 050,1 2015 1 976,8 1 935,2
2016 1 865,0 68,6 25,6 1 959,2 2016 1 895,6 1 849,2
Fonte / Source: INE (2016 - dados provisórios / provisional data)
TRATAMENTO E TRANSFORMAÇÃO DO LEITE / MILK TREATMENT AND PROCESSING
1. Produtos lácteos obtidos / Milk Products - Produtos frescos / Dairy Products 1 000 toneladas / tons
Ano/Year Leite para consumo
Drinking Milk Leite Gordo Whole Milk
Leite Meio Gordo Semi-skimmed Milk
Leite Magro Skimmed Milk
Nata para consumo Cream for
consumption
Iogurtes e outros leites acidificados
Yoghurt and other acidified milk
Bebidas à base de leite Milk-based drinks
2015 747,6 n.d. 597,3 96,1 20,2 108,2 62,3
2016 709,8 n.d. 560,6 100,8 20,4 111,4 62,7
Fonte / Source: INE (2016 - dados provisórios / provisional data) n.d. – Não disponível / Not available
2. Produtos lácteos obtidos / Milk Products - Produtos fabricados / Processed milk products 1 000 toneladas / tons Ano /Year Leite em pó / Milk powder Manteiga / Butter Queijo / Cheese Soro / Whey
2015 27,2 32,3 73,1 128,4
2016 27,4 30,8 76,3 127,3
Fonte / Source: INE (2016 - dados provisórios / provisional data)
INFORMAÇÃO DE MERCADOS / MARKET INFORMATION
14
PREÇOS NA PRODUÇÃO / PRODUCER PRICES
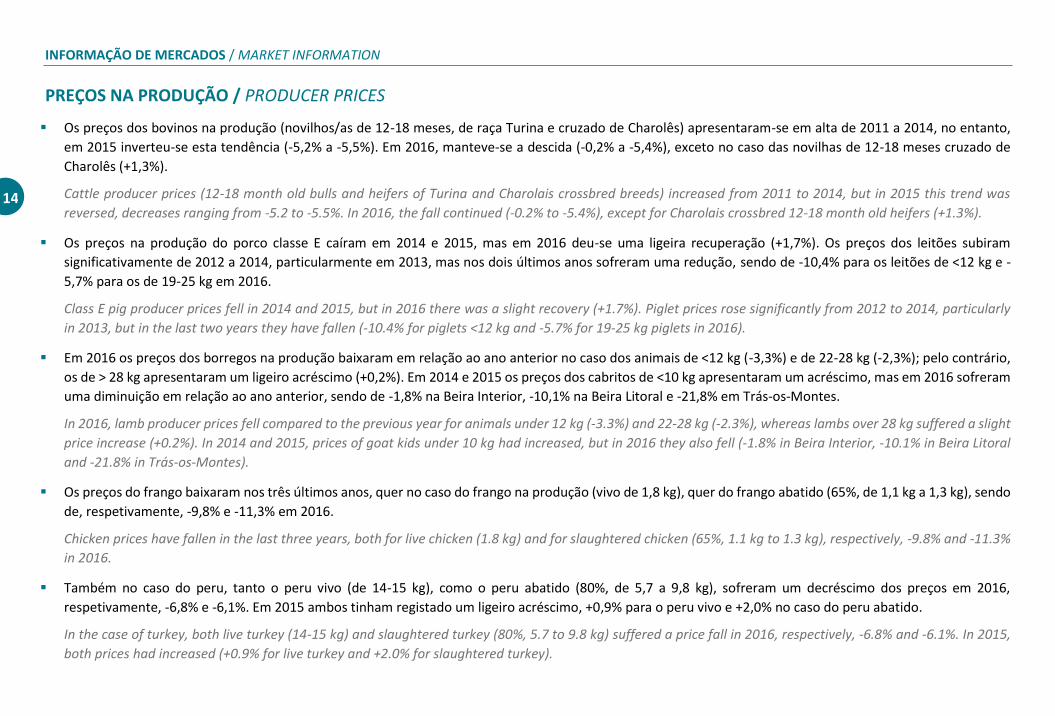
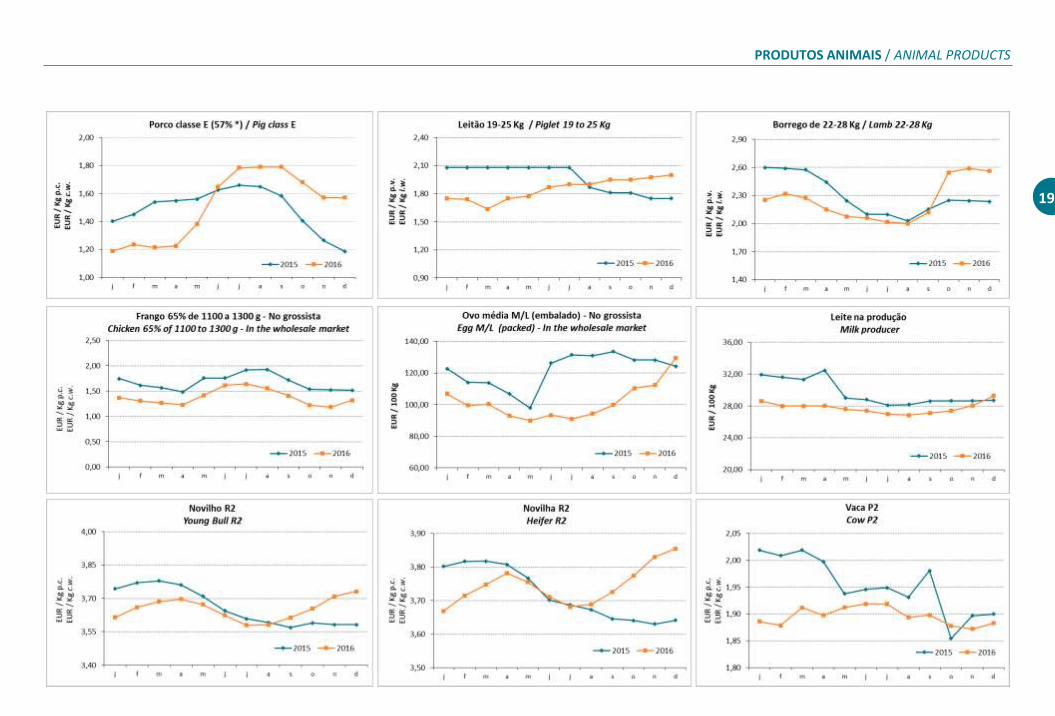
Os preços dos bovinos na produção (novilhos/as de 12-18 meses, de raça Turina e cruzado de Charolês) apresentaram-se em alta de 2011 a 2014, no entanto,
em 2015 inverteu-se esta tendência (-5,2% a -5,5%). Em 2016, manteve-se a descida (-0,2% a -5,4%), exceto no caso das novilhas de 12-18 meses cruzado de
Charolês (+1,3%).
Cattle producer prices (12-18 month old bulls and heifers of Turina and Charolais crossbred breeds) increased from 2011 to 2014, but in 2015 this trend was
reversed, decreases ranging from -5.2 to -5.5%. In 2016, the fall continued (-0.2% to -5.4%), except for Charolais crossbred 12-18 month old heifers (+1.3%).
Os preços na produção do porco classe E caíram em 2014 e 2015, mas em 2016 deu-se uma ligeira recuperação (+1,7%). Os preços dos leitões subiram
significativamente de 2012 a 2014, particularmente em 2013, mas nos dois últimos anos sofreram uma redução, sendo de -10,4% para os leitões de <12 kg e -
5,7% para os de 19-25 kg em 2016.
Class E pig producer prices fell in 2014 and 2015, but in 2016 there was a slight recovery (+1.7%). Piglet prices rose significantly from 2012 to 2014, particularly
in 2013, but in the last two years they have fallen (-10.4% for piglets <12 kg and -5.7% for 19-25 kg piglets in 2016).
Em 2016 os preços dos borregos na produção baixaram em relação ao ano anterior no caso dos animais de <12 kg (-3,3%) e de 22-28 kg (-2,3%); pelo contrário,
os de > 28 kg apresentaram um ligeiro acréscimo (+0,2%). Em 2014 e 2015 os preços dos cabritos de <10 kg apresentaram um acréscimo, mas em 2016 sofreram
uma diminuição em relação ao ano anterior, sendo de -1,8% na Beira Interior, -10,1% na Beira Litoral e -21,8% em Trás-os-Montes.
In 2016, lamb producer prices fell compared to the previous year for animals under 12 kg (-3.3%) and 22-28 kg (-2.3%), whereas lambs over 28 kg suffered a slight
price increase (+0.2%). In 2014 and 2015, prices of goat kids under 10 kg had increased, but in 2016 they also fell (-1.8% in Beira Interior, -10.1% in Beira Litoral
and -21.8% in Trás-os-Montes).
Os preços do frango baixaram nos três últimos anos, quer no caso do frango na produção (vivo de 1,8 kg), quer do frango abatido (65%, de 1,1 kg a 1,3 kg), sendo
de, respetivamente, -9,8% e -11,3% em 2016.
Chicken prices have fallen in the last three years, both for live chicken (1.8 kg) and for slaughtered chicken (65%, 1.1 kg to 1.3 kg), respectively, -9.8% and -11.3%
in 2016.
Também no caso do peru, tanto o peru vivo (de 14-15 kg), como o peru abatido (80%, de 5,7 a 9,8 kg), sofreram um decréscimo dos preços em 2016,
respetivamente, -6,8% e -6,1%. Em 2015 ambos tinham registado um ligeiro acréscimo, +0,9% para o peru vivo e +2,0% no caso do peru abatido.
In the case of turkey, both live turkey (14-15 kg) and slaughtered turkey (80%, 5.7 to 9.8 kg) suffered a price fall in 2016, respectively, -6.8% and -6.1%. In 2015,
both prices had increased (+0.9% for live turkey and +2.0% for slaughtered turkey).
PRODUTOS ANIMAIS / ANIMAL PRODUCTS
15
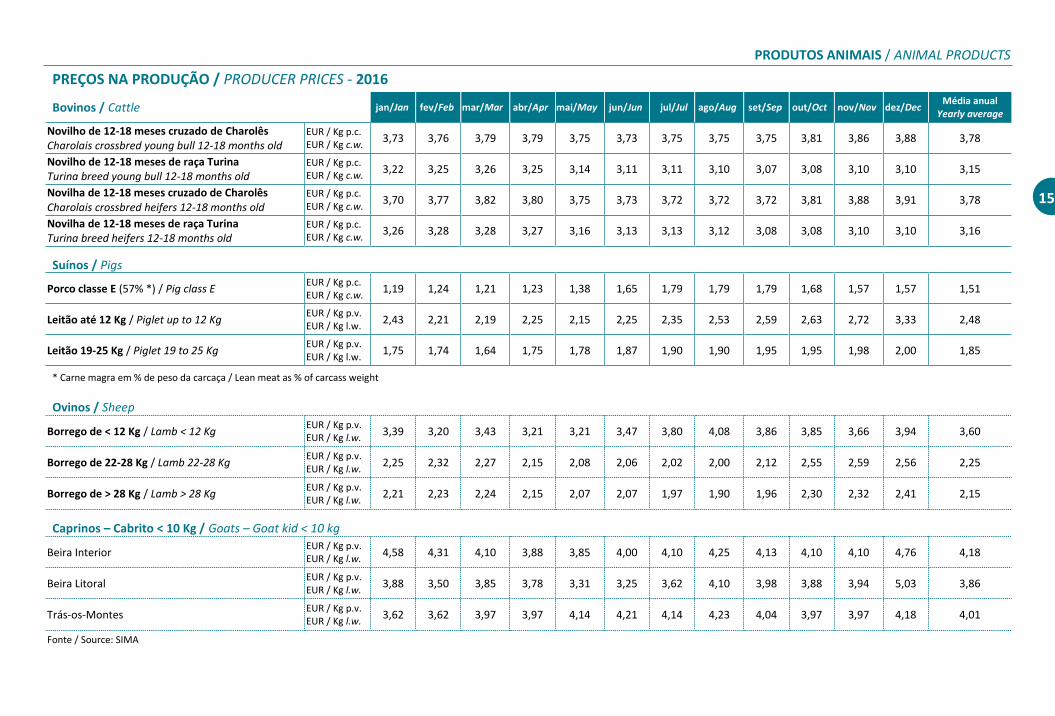
PREÇOS NA PRODUÇÃO / PRODUCER PRICES - 2016
Bovinos / Cattle jan/Jan fev/Feb mar/Mar abr/Apr mai/May jun/Jun jul/Jul ago/Aug set/Sep out/Oct nov/Nov dez/Dec Média anual
Yearly average
Novilho de 12-18 meses cruzado de Charolês Charolais crossbred young bull 12-18 months old
EUR / Kg p.c. EUR / Kg c.w.
3,73 3,76 3,79 3,79 3,75 3,73 3,75 3,75 3,75 3,81 3,86 3,88 3,78
Novilho de 12-18 meses de raça Turina Turina breed young bull 12-18 months old
EUR / Kg p.c. EUR / Kg c.w.
3,22 3,25 3,26 3,25 3,14 3,11 3,11 3,10 3,07 3,08 3,10 3,10 3,15
Novilha de 12-18 meses cruzado de Charolês Charolais crossbred heifers 12-18 months old
EUR / Kg p.c. EUR / Kg c.w.
3,70 3,77 3,82 3,80 3,75 3,73 3,72 3,72 3,72 3,81 3,88 3,91 3,78
Novilha de 12-18 meses de raça Turina Turina breed heifers 12-18 months old
EUR / Kg p.c. EUR / Kg c.w.
3,26 3,28 3,28 3,27 3,16 3,13 3,13 3,12 3,08 3,08 3,10 3,10 3,16
Suínos / Pigs
Porco classe E (57% *) / Pig class E EUR / Kg p.c. EUR / Kg c.w.
1,19 1,24 1,21 1,23 1,38 1,65 1,79 1,79 1,79 1,68 1,57 1,57 1,51
Leitão até 12 Kg / Piglet up to 12 Kg EUR / Kg p.v. EUR / Kg l.w.
2,43 2,21 2,19 2,25 2,15 2,25 2,35 2,53 2,59 2,63 2,72 3,33 2,48
Leitão 19-25 Kg / Piglet 19 to 25 Kg EUR / Kg p.v. EUR / Kg l.w.
1,75 1,74 1,64 1,75 1,78 1,87 1,90 1,90 1,95 1,95 1,98 2,00 1,85
* Carne magra em % de peso da carcaça / Lean meat as % of carcass weight
Ovinos / Sheep
Borrego de < 12 Kg / Lamb < 12 Kg EUR / Kg p.v. EUR / Kg l.w.
3,39 3,20 3,43 3,21 3,21 3,47 3,80 4,08 3,86 3,85 3,66 3,94 3,60
Borrego de 22-28 Kg / Lamb 22-28 Kg EUR / Kg p.v. EUR / Kg l.w.
2,25 2,32 2,27 2,15 2,08 2,06 2,02 2,00 2,12 2,55 2,59 2,56 2,25
Borrego de > 28 Kg / Lamb > 28 Kg EUR / Kg p.v. EUR / Kg l.w.
2,21 2,23 2,24 2,15 2,07 2,07 1,97 1,90 1,96 2,30 2,32 2,41 2,15
Caprinos – Cabrito < 10 Kg / Goats – Goat kid < 10 kg
Beira Interior EUR / Kg p.v. EUR / Kg l.w.
4,58 4,31 4,10 3,88 3,85 4,00 4,10 4,25 4,13 4,10 4,10 4,76 4,18
Beira Litoral EUR / Kg p.v. EUR / Kg l.w.
3,88 3,50 3,85 3,78 3,31 3,25 3,62 4,10 3,98 3,88 3,94 5,03 3,86
Trás-os-Montes EUR / Kg p.v. EUR / Kg l.w.
3,62 3,62 3,97 3,97 4,14 4,21 4,14 4,23 4,04 3,97 3,97 4,18 4,01
Fonte / Source: SIMA
INFORMAÇÃO DE MERCADOS / MARKET INFORMATION
16
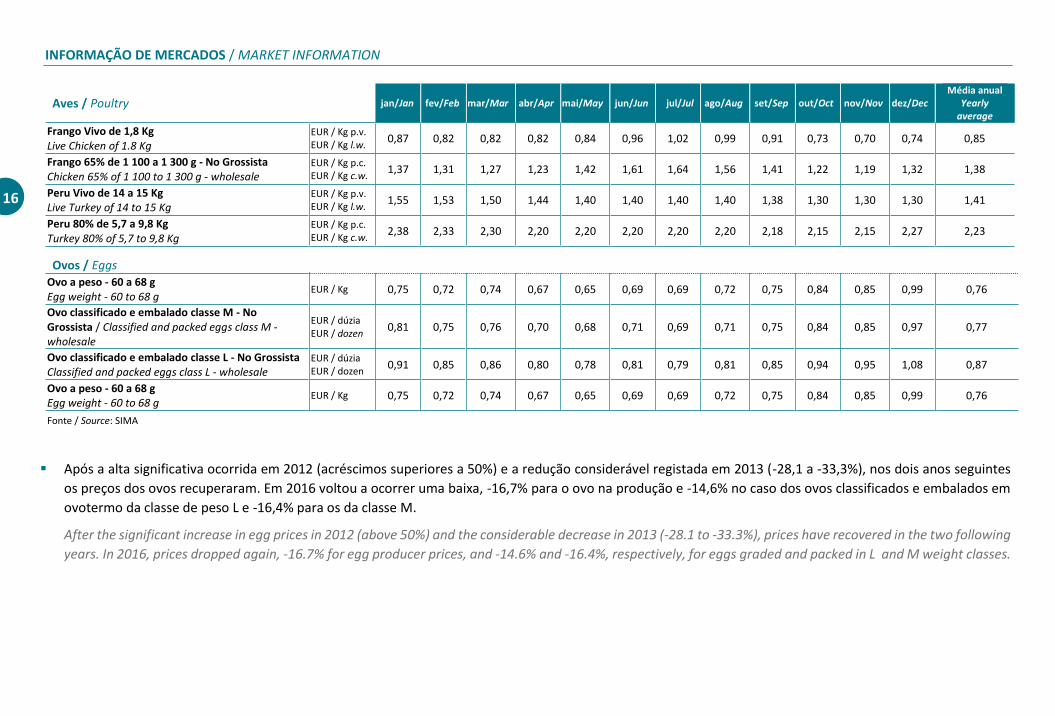
Aves / Poultry jan/Jan fev/Feb mar/Mar abr/Apr mai/May jun/Jun jul/Jul ago/Aug set/Sep out/Oct nov/Nov dez/Dec Média anual
Yearly average
Frango Vivo de 1,8 Kg Live Chicken of 1.8 Kg
EUR / Kg p.v. EUR / Kg l.w.
0,87 0,82 0,82 0,82 0,84 0,96 1,02 0,99 0,91 0,73 0,70 0,74 0,85
Frango 65% de 1 100 a 1 300 g - No Grossista Chicken 65% of 1 100 to 1 300 g - wholesale
EUR / Kg p.c. EUR / Kg c.w.
1,37 1,31 1,27 1,23 1,42 1,61 1,64 1,56 1,41 1,22 1,19 1,32 1,38
Peru Vivo de 14 a 15 Kg Live Turkey of 14 to 15 Kg
EUR / Kg p.v. EUR / Kg l.w.
1,55 1,53 1,50 1,44 1,40 1,40 1,40 1,40 1,38 1,30 1,30 1,30 1,41
Peru 80% de 5,7 a 9,8 Kg Turkey 80% of 5,7 to 9,8 Kg
EUR / Kg p.c. EUR / Kg c.w.
2,38 2,33 2,30 2,20 2,20 2,20 2,20 2,20 2,18 2,15 2,15 2,27 2,23
Ovos / Eggs
Ovo a peso - 60 a 68 g Egg weight - 60 to 68 g
EUR / Kg 0,75 0,72 0,74 0,67 0,65 0,69 0,69 0,72 0,75 0,84 0,85 0,99 0,76
Ovo classificado e embalado classe M - No Grossista / Classified and packed eggs class M - wholesale
EUR / dúzia EUR / dozen
0,81 0,75 0,76 0,70 0,68 0,71 0,69 0,71 0,75 0,84 0,85 0,97 0,77
Ovo classificado e embalado classe L - No Grossista Classified and packed eggs class L - wholesale
EUR / dúzia EUR / dozen
0,91 0,85 0,86 0,80 0,78 0,81 0,79 0,81 0,85 0,94 0,95 1,08 0,87
Ovo a peso - 60 a 68 g Egg weight - 60 to 68 g
EUR / Kg 0,75 0,72 0,74 0,67 0,65 0,69 0,69 0,72 0,75 0,84 0,85 0,99 0,76
Fonte / Source: SIMA
Após a alta significativa ocorrida em 2012 (acréscimos superiores a 50%) e a redução considerável registada em 2013 (-28,1 a -33,3%), nos dois anos seguintes
os preços dos ovos recuperaram. Em 2016 voltou a ocorrer uma baixa, -16,7% para o ovo na produção e -14,6% no caso dos ovos classificados e embalados em
ovotermo da classe de peso L e -16,4% para os da classe M.
After the significant increase in egg prices in 2012 (above 50%) and the considerable decrease in 2013 (-28.1 to -33.3%), prices have recovered in the two following
years. In 2016, prices dropped again, -16.7% for egg producer prices, and -14.6% and -16.4%, respectively, for eggs graded and packed in L and M weight classes.
PRODUTOS ANIMAIS / ANIMAL PRODUCTS
17
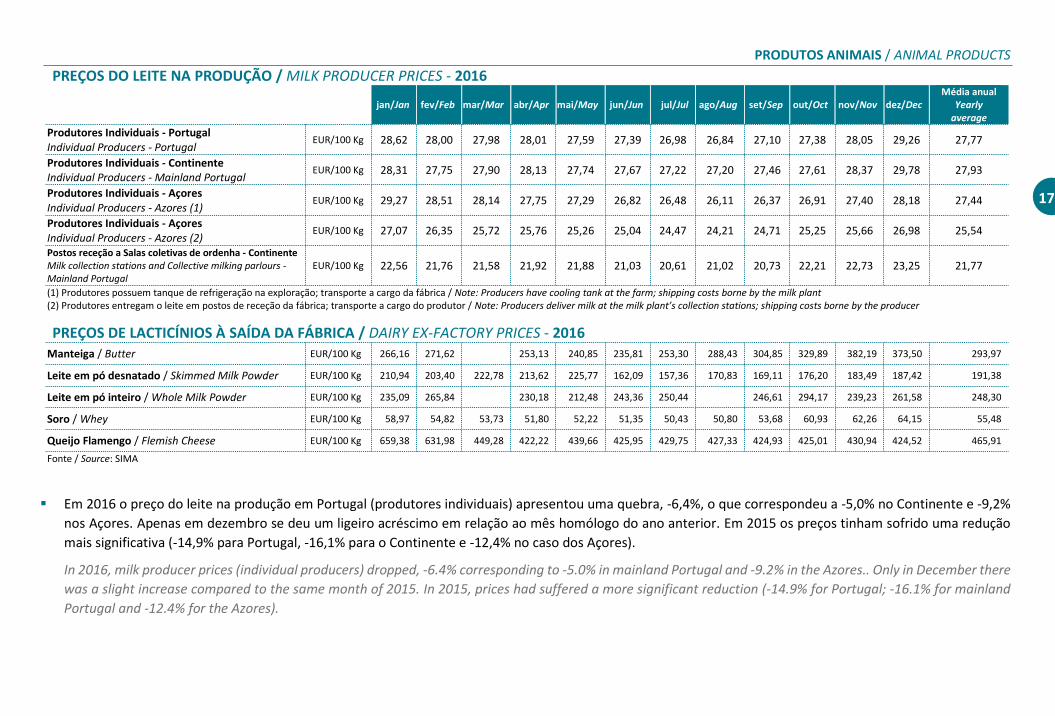
PREÇOS DO LEITE NA PRODUÇÃO / MILK PRODUCER PRICES - 2016
jan/Jan fev/Feb mar/Mar abr/Apr mai/May jun/Jun jul/Jul ago/Aug set/Sep out/Oct nov/Nov dez/Dec Média anual
Yearly average
Produtores Individuais - Portugal Individual Producers - Portugal
EUR/100 Kg 28,62 28,00 27,98 28,01 27,59 27,39 26,98 26,84 27,10 27,38 28,05 29,26 27,77
Produtores Individuais - Continente Individual Producers - Mainland Portugal
EUR/100 Kg 28,31 27,75 27,90 28,13 27,74 27,67 27,22 27,20 27,46 27,61 28,37 29,78 27,93
Produtores Individuais - Açores Individual Producers - Azores (1)
EUR/100 Kg 29,27 28,51 28,14 27,75 27,29 26,82 26,48 26,11 26,37 26,91 27,40 28,18 27,44
Produtores Individuais - Açores Individual Producers - Azores (2)
EUR/100 Kg 27,07 26,35 25,72 25,76 25,26 25,04 24,47 24,21 24,71 25,25 25,66 26,98 25,54
Postos receção a Salas coletivas de ordenha - Continente Milk collection stations and Collective milking parlours - Mainland Portugal
EUR/100 Kg 22,56 21,76 21,58 21,92 21,88 21,03 20,61 21,02 20,73 22,21 22,73 23,25 21,77
(1) Produtores possuem tanque de refrigeração na exploração; transporte a cargo da fábrica / Note: Producers have cooling tank at the farm; shipping costs borne by the milk plant (2) Produtores entregam o leite em postos de receção da fábrica; transporte a cargo do produtor / Note: Producers deliver milk at the milk plant’s collection stations; shipping costs borne by the producer
PREÇOS DE LACTICÍNIOS À SAÍDA DA FÁBRICA / DAIRY EX-FACTORY PRICES - 2016
Manteiga / Butter EUR/100 Kg 266,16 271,62 253,13 240,85 235,81 253,30 288,43 304,85 329,89 382,19 373,50 293,97
Leite em pó desnatado / Skimmed Milk Powder EUR/100 Kg 210,94 203,40 222,78 213,62 225,77 162,09 157,36 170,83 169,11 176,20 183,49 187,42 191,38
Leite em pó inteiro / Whole Milk Powder EUR/100 Kg 235,09 265,84 230,18 212,48 243,36 250,44 246,61 294,17 239,23 261,58 248,30
Soro / Whey EUR/100 Kg 58,97 54,82 53,73 51,80 52,22 51,35 50,43 50,80 53,68 60,93 62,26 64,15 55,48
Queijo Flamengo / Flemish Cheese EUR/100 Kg 659,38 631,98 449,28 422,22 439,66 425,95 429,75 427,33 424,93 425,01 430,94 424,52 465,91
Fonte / Source: SIMA
Em 2016 o preço do leite na produção em Portugal (produtores individuais) apresentou uma quebra, -6,4%, o que correspondeu a -5,0% no Continente e -9,2%
nos Açores. Apenas em dezembro se deu um ligeiro acréscimo em relação ao mês homólogo do ano anterior. Em 2015 os preços tinham sofrido uma redução
mais significativa (-14,9% para Portugal, -16,1% para o Continente e -12,4% no caso dos Açores).
In 2016, milk producer prices (individual producers) dropped, -6.4% corresponding to -5.0% in mainland Portugal and -9.2% in the Azores.. Only in December there
was a slight increase compared to the same month of 2015. In 2015, prices had suffered a more significant reduction (-14.9% for Portugal; -16.1% for mainland
Portugal and -12.4% for the Azores).
INFORMAÇÃO DE MERCADOS / MARKET INFORMATION
18
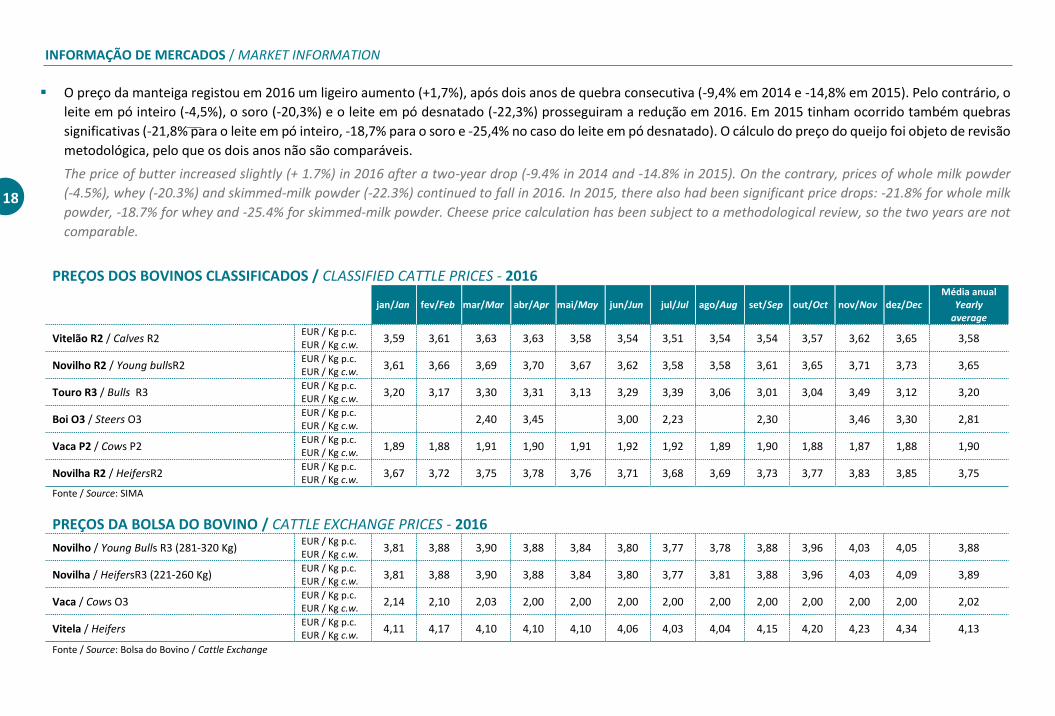
O preço da manteiga registou em 2016 um ligeiro aumento (+1,7%), após dois anos de quebra consecutiva (-9,4% em 2014 e -14,8% em 2015). Pelo contrário, o
leite em pó inteiro (-4,5%), o soro (-20,3%) e o leite em pó desnatado (-22,3%) prosseguiram a redução em 2016. Em 2015 tinham ocorrido também quebras
significativas (-21,8% para o leite em pó inteiro, -18,7% para o soro e -25,4% no caso do leite em pó desnatado). O cálculo do preço do queijo foi objeto de revisão
metodológica, pelo que os dois anos não são comparáveis.
The price of butter increased slightly (+ 1.7%) in 2016 after a two-year drop (-9.4% in 2014 and -14.8% in 2015). On the contrary, prices of whole milk powder
(-4.5%), whey (-20.3%) and skimmed-milk powder (-22.3%) continued to fall in 2016. In 2015, there also had been significant price drops: -21.8% for whole milk
powder, -18.7% for whey and -25.4% for skimmed-milk powder. Cheese price calculation has been subject to a methodological review, so the two years are not
comparable.
PREÇOS DOS BOVINOS CLASSIFICADOS / CLASSIFIED CATTLE PRICES - 2016
jan/Jan fev/Feb mar/Mar abr/Apr mai/May jun/Jun jul/Jul ago/Aug set/Sep out/Oct nov/Nov dez/Dec Média anual
Yearly average
Vitelão R2 / Calves R2 EUR / Kg p.c. EUR / Kg c.w.
3,59 3,61 3,63 3,63 3,58 3,54 3,51 3,54 3,54 3,57 3,62 3,65 3,58
Novilho R2 / Young bullsR2 EUR / Kg p.c. EUR / Kg c.w.
3,61 3,66 3,69 3,70 3,67 3,62 3,58 3,58 3,61 3,65 3,71 3,73 3,65
Touro R3 / Bulls R3 EUR / Kg p.c. EUR / Kg c.w.
3,20 3,17 3,30 3,31 3,13 3,29 3,39 3,06 3,01 3,04 3,49 3,12 3,20
Boi O3 / Steers O3 EUR / Kg p.c. EUR / Kg c.w.
2,40 3,45 3,00 2,23 2,30 3,46 3,30 2,81
Vaca P2 / Cows P2 EUR / Kg p.c. EUR / Kg c.w.
1,89 1,88 1,91 1,90 1,91 1,92 1,92 1,89 1,90 1,88 1,87 1,88 1,90
Novilha R2 / HeifersR2 EUR / Kg p.c. EUR / Kg c.w.
3,67 3,72 3,75 3,78 3,76 3,71 3,68 3,69 3,73 3,77 3,83 3,85 3,75
Fonte / Source: SIMA
PREÇOS DA BOLSA DO BOVINO / CATTLE EXCHANGE PRICES - 2016
Novilho / Young Bulls R3 (281-320 Kg) EUR / Kg p.c. EUR / Kg c.w.
3,81 3,88 3,90 3,88 3,84 3,80 3,77 3,78 3,88 3,96 4,03 4,05 3,88
Novilha / HeifersR3 (221-260 Kg) EUR / Kg p.c. EUR / Kg c.w.
3,81 3,88 3,90 3,88 3,84 3,80 3,77 3,81 3,88 3,96 4,03 4,09 3,89
Vaca / Cows O3 EUR / Kg p.c. EUR / Kg c.w.
2,14 2,10 2,03 2,00 2,00 2,00 2,00 2,00 2,00 2,00 2,00 2,00 2,02
Vitela / Heifers EUR / Kg p.c. EUR / Kg c.w.
4,11 4,17 4,10 4,10 4,10 4,06 4,03 4,04 4,15 4,20 4,23 4,34 4,13
Fonte / Source: Bolsa do Bovino / Cattle Exchange
PRODUTOS ANIMAIS / ANIMAL PRODUCTS
19
INFORMAÇÃO DE MERCADOS / MARKET INFORMATION
20
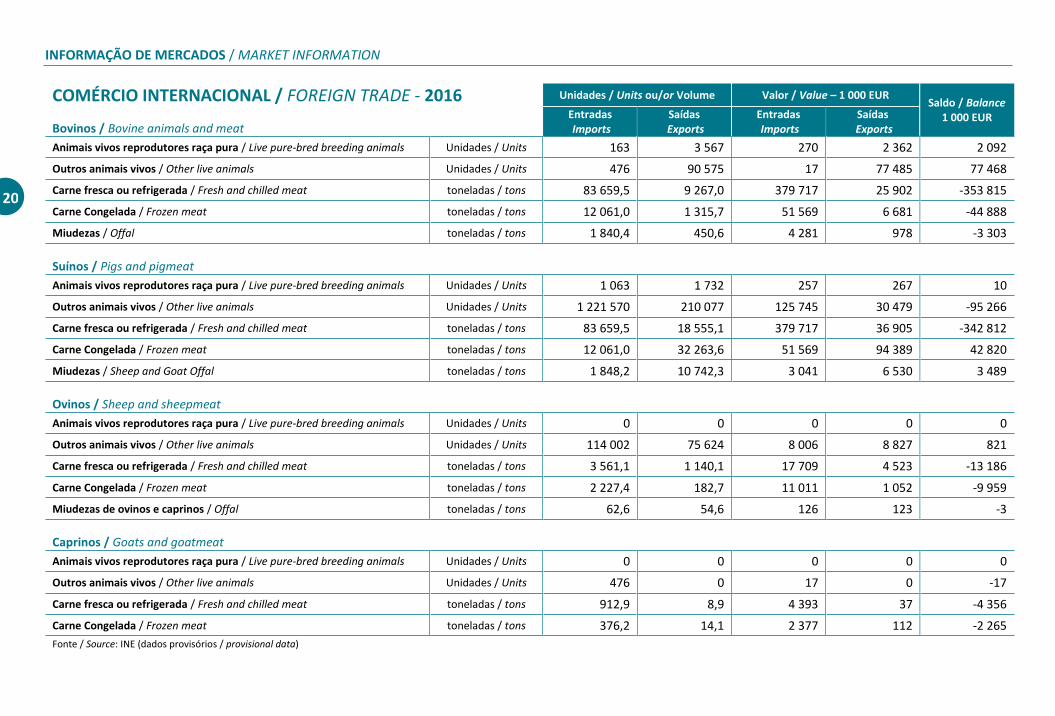
COMÉRCIO INTERNACIONAL / FOREIGN TRADE - 2016 Unidades / Units ou/or Volume Valor / Value – 1 000 EUR Saldo / Balance
1 000 EUR Bovinos / Bovine animals and meat
Entradas Imports
Saídas Exports
Entradas Imports
Saídas Exports
Animais vivos reprodutores raça pura / Live pure-bred breeding animals Unidades / Units 163 3 567 270 2 362 2 092
Outros animais vivos / Other live animals Unidades / Units 476 90 575 17 77 485 77 468
Carne fresca ou refrigerada / Fresh and chilled meat toneladas / tons 83 659,5 9 267,0 379 717 25 902 -353 815
Carne Congelada / Frozen meat toneladas / tons 12 061,0 1 315,7 51 569 6 681 -44 888
Miudezas / Offal toneladas / tons 1 840,4 450,6 4 281 978 -3 303
Suínos / Pigs and pigmeat
Animais vivos reprodutores raça pura / Live pure-bred breeding animals Unidades / Units 1 063 1 732 257 267 10
Outros animais vivos / Other live animals Unidades / Units 1 221 570 210 077 125 745 30 479 -95 266
Carne fresca ou refrigerada / Fresh and chilled meat toneladas / tons 83 659,5 18 555,1 379 717 36 905 -342 812
Carne Congelada / Frozen meat toneladas / tons 12 061,0 32 263,6 51 569 94 389 42 820
Miudezas / Sheep and Goat Offal toneladas / tons 1 848,2 10 742,3 3 041 6 530 3 489
Ovinos / Sheep and sheepmeat
Animais vivos reprodutores raça pura / Live pure-bred breeding animals Unidades / Units 0 0 0 0 0
Outros animais vivos / Other live animals Unidades / Units 114 002 75 624 8 006 8 827 821
Carne fresca ou refrigerada / Fresh and chilled meat toneladas / tons 3 561,1 1 140,1 17 709 4 523 -13 186
Carne Congelada / Frozen meat toneladas / tons 2 227,4 182,7 11 011 1 052 -9 959
Miudezas de ovinos e caprinos / Offal toneladas / tons 62,6 54,6 126 123 -3
Caprinos / Goats and goatmeat
Animais vivos reprodutores raça pura / Live pure-bred breeding animals Unidades / Units 0 0 0 0 0
Outros animais vivos / Other live animals Unidades / Units 476 0 17 0 -17
Carne fresca ou refrigerada / Fresh and chilled meat toneladas / tons 912,9 8,9 4 393 37 -4 356
Carne Congelada / Frozen meat toneladas / tons 376,2 14,1 2 377 112 -2 265
Fonte / Source: INE (dados provisórios / provisional data)
PRODUTOS ANIMAIS / ANIMAL PRODUCTS
21
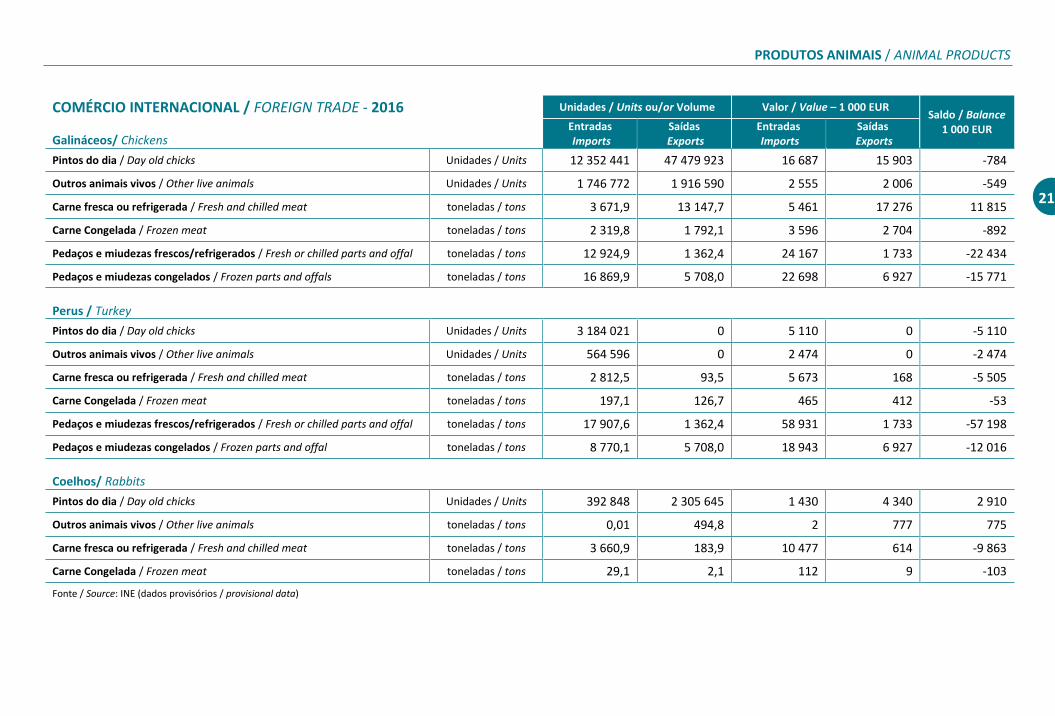
COMÉRCIO INTERNACIONAL / FOREIGN TRADE - 2016 Unidades / Units ou/or Volume Valor / Value – 1 000 EUR Saldo / Balance
1 000 EUR Galináceos/ Chickens
Entradas Imports
Saídas Exports
Entradas Imports
Saídas Exports
Pintos do dia / Day old chicks Unidades / Units 12 352 441 47 479 923 16 687 15 903 -784
Outros animais vivos / Other live animals Unidades / Units 1 746 772 1 916 590 2 555 2 006 -549
Carne fresca ou refrigerada / Fresh and chilled meat toneladas / tons 3 671,9 13 147,7 5 461 17 276 11 815
Carne Congelada / Frozen meat toneladas / tons 2 319,8 1 792,1 3 596 2 704 -892
Pedaços e miudezas frescos/refrigerados / Fresh or chilled parts and offal toneladas / tons 12 924,9 1 362,4 24 167 1 733 -22 434
Pedaços e miudezas congelados / Frozen parts and offals toneladas / tons 16 869,9 5 708,0 22 698 6 927 -15 771
Perus / Turkey
Pintos do dia / Day old chicks Unidades / Units 3 184 021 0 5 110 0 -5 110
Outros animais vivos / Other live animals Unidades / Units 564 596 0 2 474 0 -2 474
Carne fresca ou refrigerada / Fresh and chilled meat toneladas / tons 2 812,5 93,5 5 673 168 -5 505
Carne Congelada / Frozen meat toneladas / tons 197,1 126,7 465 412 -53
Pedaços e miudezas frescos/refrigerados / Fresh or chilled parts and offal toneladas / tons 17 907,6 1 362,4 58 931 1 733 -57 198
Pedaços e miudezas congelados / Frozen parts and offal toneladas / tons 8 770,1 5 708,0 18 943 6 927 -12 016
Coelhos/ Rabbits
Pintos do dia / Day old chicks Unidades / Units 392 848 2 305 645 1 430 4 340 2 910
Outros animais vivos / Other live animals toneladas / tons 0,01 494,8 2 777 775
Carne fresca ou refrigerada / Fresh and chilled meat toneladas / tons 3 660,9 183,9 10 477 614 -9 863
Carne Congelada / Frozen meat toneladas / tons 29,1 2,1 112 9 -103
Fonte / Source: INE (dados provisórios / provisional data)
INFORMAÇÃO DE MERCADOS / MARKET INFORMATION
22
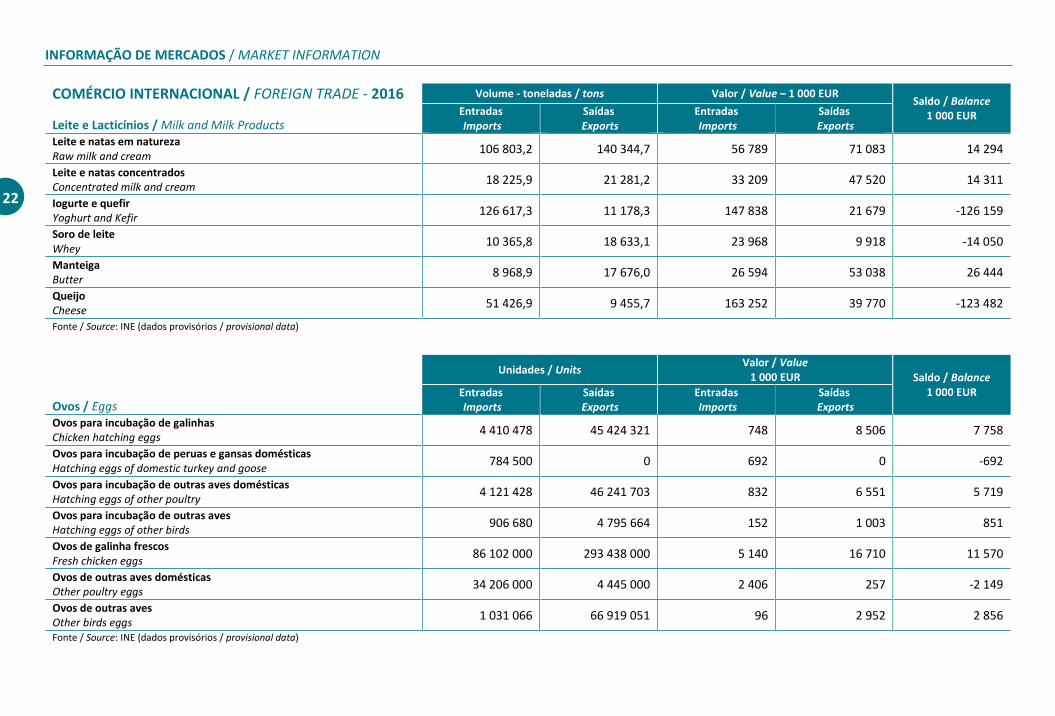
COMÉRCIO INTERNACIONAL / FOREIGN TRADE - 2016 Volume - toneladas / tons Valor / Value – 1 000 EUR Saldo / Balance
1 000 EUR Leite e Lacticínios / Milk and Milk Products
Entradas Imports
Saídas Exports
Entradas Imports
Saídas Exports
Leite e natas em natureza Raw milk and cream
106 803,2 140 344,7 56 789 71 083 14 294
Leite e natas concentrados Concentrated milk and cream
18 225,9 21 281,2 33 209 47 520 14 311
Iogurte e quefir Yoghurt and Kefir
126 617,3 11 178,3 147 838 21 679 -126 159
Soro de leite Whey
10 365,8 18 633,1 23 968 9 918 -14 050
Manteiga Butter
8 968,9 17 676,0 26 594 53 038 26 444
Queijo Cheese
51 426,9 9 455,7 163 252 39 770 -123 482
Fonte / Source: INE (dados provisórios / provisional data)
Unidades / Units Valor / Value
1 000 EUR Saldo / Balance 1 000 EUR
Ovos / Eggs Entradas Imports
Saídas Exports
Entradas Imports
Saídas Exports
Ovos para incubação de galinhas Chicken hatching eggs
4 410 478 45 424 321 748 8 506 7 758
Ovos para incubação de peruas e gansas domésticas Hatching eggs of domestic turkey and goose
784 500 0 692 0 -692
Ovos para incubação de outras aves domésticas Hatching eggs of other poultry
4 121 428 46 241 703 832 6 551 5 719
Ovos para incubação de outras aves Hatching eggs of other birds
906 680 4 795 664 152 1 003 851
Ovos de galinha frescos Fresh chicken eggs
86 102 000 293 438 000 5 140 16 710 11 570
Ovos de outras aves domésticas Other poultry eggs
34 206 000 4 445 000 2 406 257 -2 149
Ovos de outras aves Other birds eggs
1 031 066 66 919 051 96 2 952 2 856
Fonte / Source: INE (dados provisórios / provisional data)
PRODUTOS ANIMAIS / ANIMAL PRODUCTS
23
BALANÇOS DE APROVISIONAMENTO / SUPPLY BALANCE SHEET
Em 2016 o consumo per capita total de carnes e miudezas aumentou em relação a 2015, atingindo 112,3 kg / habitante / ano, sendo de referir a evolução
registada nos últimos trinta e cinco anos, em que quase duplicou. O valor máximo foi atingido em 2009, com 113,7 kg, diminuiu depois até 2013 e recuperou
nos três últimos anos.
In 2016, total per capita consumption of meat and offal increased from 2015, reaching 112.3 kg/inhabitant/year. In fact, it has almost doubled in the last thirty-
five years. Per capita consumption peaked in 2009 at 113.7 kg, and then decreased until 2013, recovering in the last three years.
O consumo humano de carne de bovino baixou nos últimos anos, particularmente em 2012 e 2013 (177 mil toneladas), tendo recuperado ligeiramente nos três
anos seguintes (183, 184 e 188 mil toneladas). A evolução do consumo per capita teve um comportamento semelhante (16,9, 17,6 e 17,8 e 18,2 kg de 2013 a
2016). O setor bovino é o setor das carnes onde se regista uma maior dependência do exterior, no entanto, o grau de autoaprovisionamento melhorou um
pouco de 2015 para 2016, 53,8% para 56,9%.
Human consumption of beef has fallen in recent years, particularly in 2012 and 2013 (177 thousand tons), recovering slightly in the next three years (183, 184
and 188 thousand tons). Changes in per capita consumption were rather similar (16.9, 17.6 and 17.8 and 18.2 kg from 2013 to 2016). Beef is the sector where
there is a greater dependence on imports, although the degree of self-sufficiency has improved slightly between 2015 and 2016, from 53.8% to 56.9%.
A carne de suíno é o tipo de carne mais consumida no nosso país. O consumo de carne de suíno baixou de 2010 a 2013, recuperou um pouco em 2014 (454 mil
toneladas) e 2015 (465 mil toneladas) e voltou a cair em 2016 (452 mil toneladas). O consumo per capita progrediu sucessivamente de 2013 a 2015 - 43,0, 43,6
e 44,9 kg/habitante/ano -, no entanto, em 2016 sofreu um ligeiro retrocesso, passando para 43,6 kg. O grau de autoaprovisionamento melhorou
significativamente de 2015 para 2016, 68,6% para 73,9%.
Pig meat is the most consumed type of meat in our country. Pig meat consumption fell from 2010 to 2013, recovered slightly in 2014 (454 thousand tons) and
2015 (465 thousand tons) and fell again in 2016 (452 thousand tons). Per capita consumption kept increasing from 2013 to 2015: 43.0, 43.6 and 44.9
kg/inhabitant/year. However, in 2016 it suffered a slight fall back to 43.6 kg. The degree of self-sufficiency improved significantly from 68.6% in 2015 to 73.9% in
2016.
O consumo de carne de ovino e caprino tem vindo a baixar desde 2008, constatando-se, em 2016, uma capitação de apenas 2,2 kg. O consumo humano passou
de 24 mil toneladas em 2015 para 23 mil toneladas em 2016. O grau de autoaprovisionamento melhorou de 2015 (79,2%) para 2016 (82,6%).
Consumption of sheep and goat meat has been declining since 2008. Per capita consumption in 2016 was only 2.2 kg. Human consumption fell from 24 thousand
tons in 2015 to 23 thousand tons in 2016. The degree of self-sufficiency improved from 79.2% in 2015 to 82.6% in 2016.
INFORMAÇÃO DE MERCADOS / MARKET INFORMATION
24
A carne de aves é a segunda mais consumida em Portugal, registando-se mesmo um aumento do consumo nos quatro últimos anos, correspondendo sucessivamente a 381, 393, 405 e 423 mil toneladas. No que se refere ao consumo per capita nesse período os valores foram de 36,4, 37,8, 39,1 e 40,8 Kg/habitante/ano. O grau de autoaprovisionamento tem registado pequenas oscilações, tendo diminuído ligeiramente de 2015 para 2016, 87,2% para 86,8%.
Poultry meat is the second most consumed meat in Portugal, and consumption has increased over the last four years: 381, 393, 406 and 423 thousand tons, respectively. Per capita consumption follows a similar trend: 36.4, 37.8, 39.0 and 40.8 kg/inhabitant/year. The degree of self-sufficiency has fluctuated slightly, falling from 87.2% in 2015 to 86.8% in 2016.
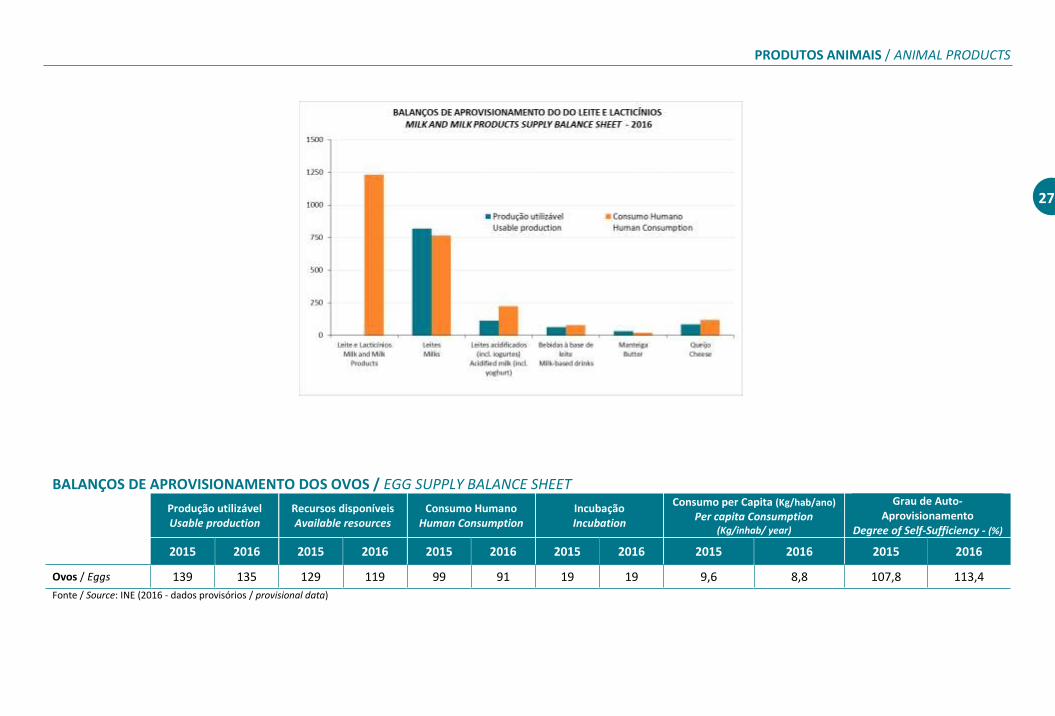
Os ovos apresentaram um grau de autoaprovisionamento superior a 100% nos sete últimos anos. De 2014 para 2015 este reduziu-se de 114,8% para 107,8%, no entanto em 2016 voltou a recuperar, atingindo 113,4%. Este facto ficou a dever-se em parte à redução do consumo humano, de 99 para 91 mil toneladas. A evolução correspondente do consumo per capita foi de 9,6 kg para 8,8 kg.
In the last seven years, the degree of self-sufficiency in eggs has always been above 100%. However, from 2014 to 2015 it decreased from 114.8% to 107.8%, only to recover in 2016, reaching 113.4%. This was due in part to a decrease in human consumption, from 99 to 91 thousand tons. Likewise, per capita consumption fell from 9.6 to 8.8 kg.
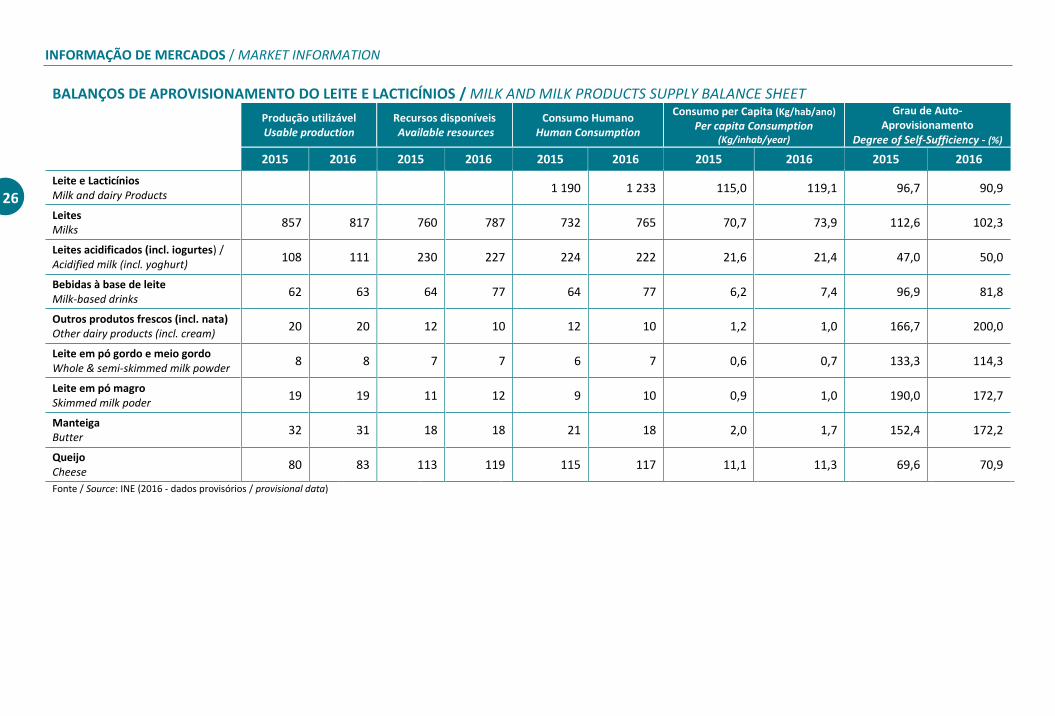
No setor do leite e lacticínios existem diferenças significativas por produto: enquanto nos leites (grau de autoaprovisionamento de 102,3% em 2016), natas (200,0%), leite em pó (150,0%) e manteiga (172,2%), Portugal é mais do que autossuficiente, pelo contrário nos iogurtes (50,0%) e no queijo (70,9%), apresenta dependência do exterior. O consumo per capita de leite e lacticínios (expresso em Kg /habitante/ano) reduziu-se de 2008 (135,6 kg) a 2015 (115,0 kg), tendo registado em 2016 uma ligeira recuperação (119,1 kg). Esta evolução deve-se fundamentalmente ao leite para consumo (88,9 para 70,7 kg de 2008 a 2015 e 73,9 Kg em 2016). Em 2016, para além do leite para consumo, os lacticínios em progressão foram as bebidas à base de leite (6,2 para 7,4 kg), o leite em pó (1,5 para 1,7 kg) e o queijo (11,1 para 11,3 kg).
In the milk and dairy sector there are significant differences by product type: whereas in milk (degree of self-sufficiency of 102.3% in 2016), cream (200.0%), milk powder (150.0%) and butter (172.2%), Portugal is more than self-sufficient, in yoghurts (50.0%) and cheese (70.9%) it depends on its imports. Per capita consumption of milk and dairy products decreased from 2008 (135.6 kg) to 2015 (115.0 kg), with a slight recovery in 2016 (119.1 kg). This is mainly due to milk for consumption (from 88.9 in 2008 to 70.7 kg in 2015 and 73.9 kg in 2016). In 2016, in addition to milk for consumption, dairy consumption increased for milk-based drinks (6.2 to 7.4 kg), milk powder (1.5 to 1.7 kg) and cheese (11.1 to 11.3 kg).
PRODUTOS ANIMAIS / ANIMAL PRODUCTS
25
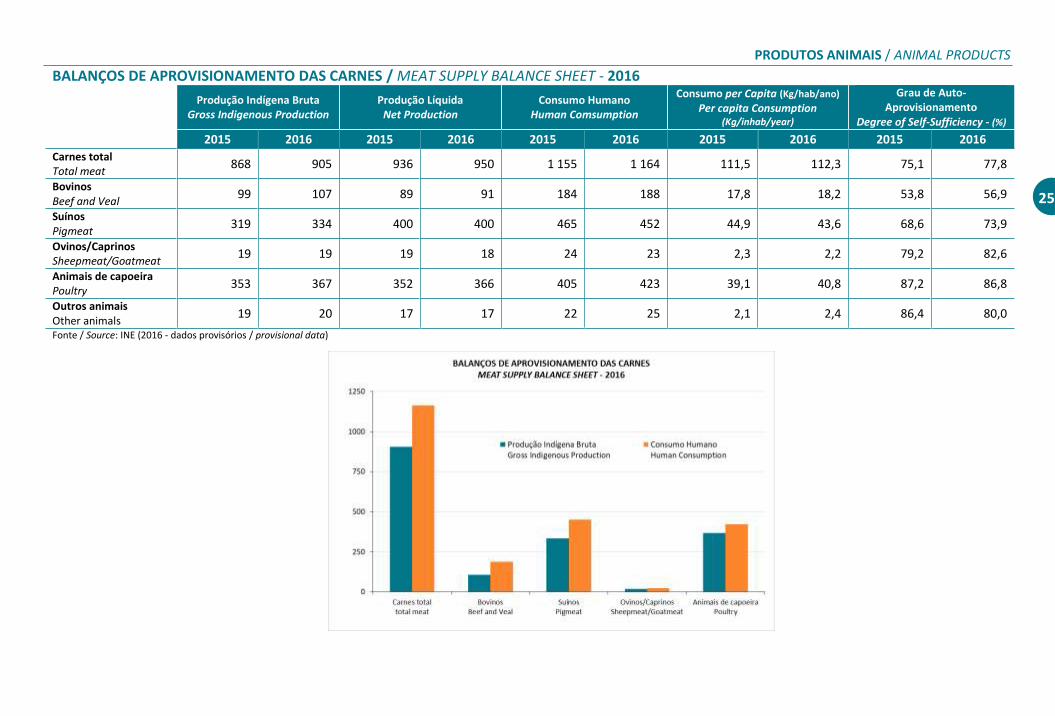
BALANÇOS DE APROVISIONAMENTO DAS CARNES / MEAT SUPPLY BALANCE SHEET - 2016
Produção Indígena Bruta
Gross Indigenous Production Produção Líquida
Net Production Consumo Humano
Human Comsumption
Consumo per Capita (Kg/hab/ano) Per capita Consumption
(Kg/inhab/year)
Grau de Auto-Aprovisionamento
Degree of Self-Sufficiency - (%)
2015 2016 2015 2016 2015 2016 2015 2016 2015 2016
Carnes total Total meat
868 905 936 950 1 155 1 164 111,5 112,3 75,1 77,8
Bovinos Beef and Veal
99 107 89 91 184 188 17,8 18,2 53,8 56,9
Suínos Pigmeat
319 334 400 400 465 452 44,9 43,6 68,6 73,9
Ovinos/Caprinos Sheepmeat/Goatmeat
19 19 19 18 24 23 2,3 2,2 79,2 82,6
Animais de capoeira Poultry
353 367 352 366 405 423 39,1 40,8 87,2 86,8
Outros animais Other animals
19 20 17 17 22 25 2,1 2,4 86,4 80,0
Fonte / Source: INE (2016 - dados provisórios / provisional data)
INFORMAÇÃO DE MERCADOS / MARKET INFORMATION
26
BALANÇOS DE APROVISIONAMENTO DO LEITE E LACTICÍNIOS / MILK AND MILK PRODUCTS SUPPLY BALANCE SHEET Produção utilizável
Usable production Recursos disponíveis Available resources
Consumo Humano Human Consumption
Consumo per Capita (Kg/hab/ano) Per capita Consumption
(Kg/inhab/year)
Grau de Auto-Aprovisionamento
Degree of Self-Sufficiency - (%)
2015 2016 2015 2016 2015 2016 2015 2016 2015 2016
Leite e Lacticínios Milk and dairy Products
1 190 1 233 115,0 119,1 96,7 90,9
Leites Milks
857 817 760 787 732 765 70,7 73,9 112,6 102,3
Leites acidificados (incl. iogurtes) / Acidified milk (incl. yoghurt)
108 111 230 227 224 222 21,6 21,4 47,0 50,0
Bebidas à base de leite Milk-based drinks
62 63 64 77 64 77 6,2 7,4 96,9 81,8
Outros produtos frescos (incl. nata) Other dairy products (incl. cream)
20 20 12 10 12 10 1,2 1,0 166,7 200,0
Leite em pó gordo e meio gordo Whole & semi-skimmed milk powder
8 8 7 7 6 7 0,6 0,7 133,3 114,3
Leite em pó magro Skimmed milk poder
19 19 11 12 9 10 0,9 1,0 190,0 172,7
Manteiga Butter
32 31 18 18 21 18 2,0 1,7 152,4 172,2
Queijo Cheese
80 83 113 119 115 117 11,1 11,3 69,6 70,9
Fonte / Source: INE (2016 - dados provisórios / provisional data)
PRODUTOS ANIMAIS / ANIMAL PRODUCTS
27
BALANÇOS DE APROVISIONAMENTO DOS OVOS / EGG SUPPLY BALANCE SHEET Produção utilizável
Usable production Recursos disponíveis Available resources
Consumo Humano Human Consumption
Incubação Incubation
Consumo per Capita (Kg/hab/ano) Per capita Consumption
(Kg/inhab/ year)
Grau de Auto-Aprovisionamento
Degree of Self-Sufficiency - (%) 2015 2016 2015 2016 2015 2016 2015 2016 2015 2016 2015 2016
Ovos / Eggs 139 135 129 119 99 91 19 19 9,6 8,8 107,8 113,4
Fonte / Source: INE (2016 - dados provisórios / provisional data)
INFORMAÇÃO DE MERCADOS / MARKET INFORMATION
28
GPP – Gabinete de P laneamento ,
Po l í t i cas e Administ ração Gera l
www.gpp.pt
facebook.com/SIMA.Portugal
Edição: 2018