Embed Size (px)
Citation preview
CuritibaMaio, 2018
Relatório de Mercado: Produção Industrial(Março/2018)
Market Report: Industrial Production(March/2018)
CONTEÚDO
2
1. INDÚSTRIA BRASILEIRA – BRAZILIAN INDUSTRY 3
2. CELULOSE – PULP 4
3. PAPEL E EMBALAGENS DE PAPEL – PAPER AND PAPER-BASED PACKAGING 5
4. PRODUTOS DA MADEIRA – TIMBER PRODUCTS 6
5. FERRO GUSA – PIG IRON 7
6. MÓVEIS – FURNITURE 8
7. SÍNTESE COMPARATIVA – SUMMARY 9
8. CONHEÇA A CONSUFOR 10
9. CONSUFOR`S BACKGROUND 11
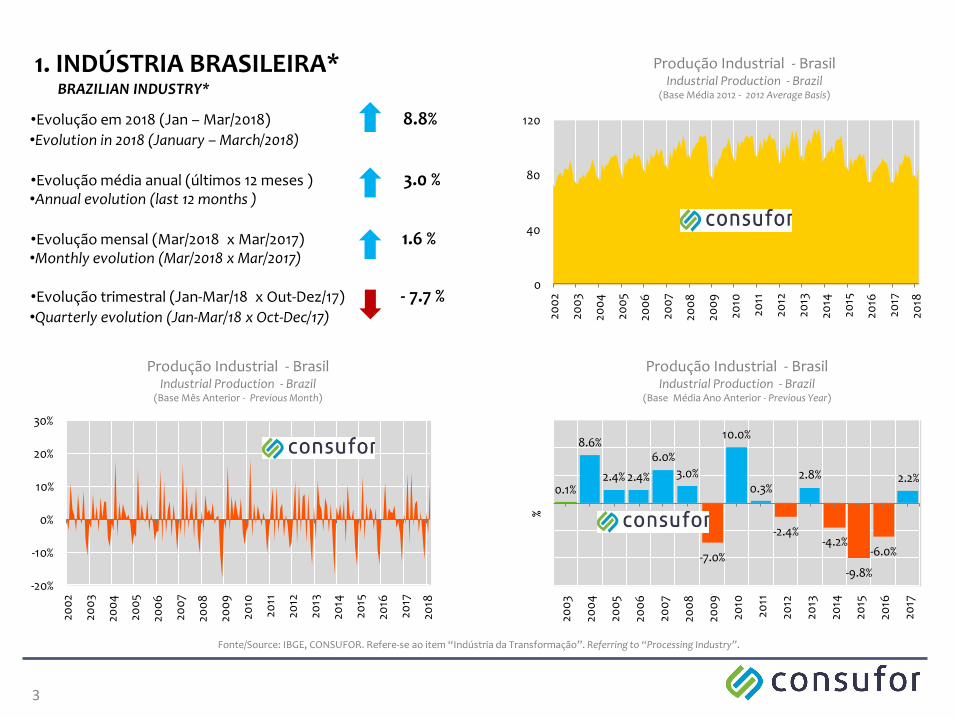
•Evolution in 2018 (January – March/2018)
•Annual evolution (last 12 months )
•Monthly evolution (Mar/2018 x Mar/2017)
•Quarterly evolution (Jan-Mar/18 x Oct-Dec/17)
3
•Evolução em 2018 (Jan – Mar/2018) 8.8%
•Evolução média anual (últimos 12 meses ) 3.0 %
•Evolução mensal (Mar/2018 x Mar/2017) 1.6 %
•Evolução trimestral (Jan-Mar/18 x Out-Dez/17) - 7.7 %
1. INDÚSTRIA BRASILEIRA*BRAZILIAN INDUSTRY*
Produção Industrial - BrasilIndustrial Production - Brazil
(Base Média 2012 - 2012 Average Basis)
Produção Industrial - BrasilIndustrial Production - Brazil
(Base Mês Anterior - Previous Month)
Produção Industrial - BrasilIndustrial Production - Brazil
(Base Média Ano Anterior - Previous Year)
Fonte/Source: IBGE, CONSUFOR. Refere-se ao item “Indústria da Transformação”. Referring to “Processing Industry”.
0
40
80
120
200
2
200
3
200
4
200
5
200
6
200
7
200
8
200
9
2010
2011
2012
2013
2014
2015
2016
2017
2018
0.1%
8.6%
2.4% 2.4%
6.0%
3.0%
-7.0%
10.0%
0.3%
-2.4%
2.8%
-4.2%
-9.8%
-6.0%
2.2%
200
3
200
4
200
5
200
6
200
7
200
8
200
9
2010
2011
2012
2013
2014
2015
2016
2017
%
-20%
-10%
0%
10%
20%
30%
200
2
200
3
200
4
200
5
200
6
200
7
200
8
200
9
2010
2011
2012
2013
2014
2015
2016
2017
2018
4
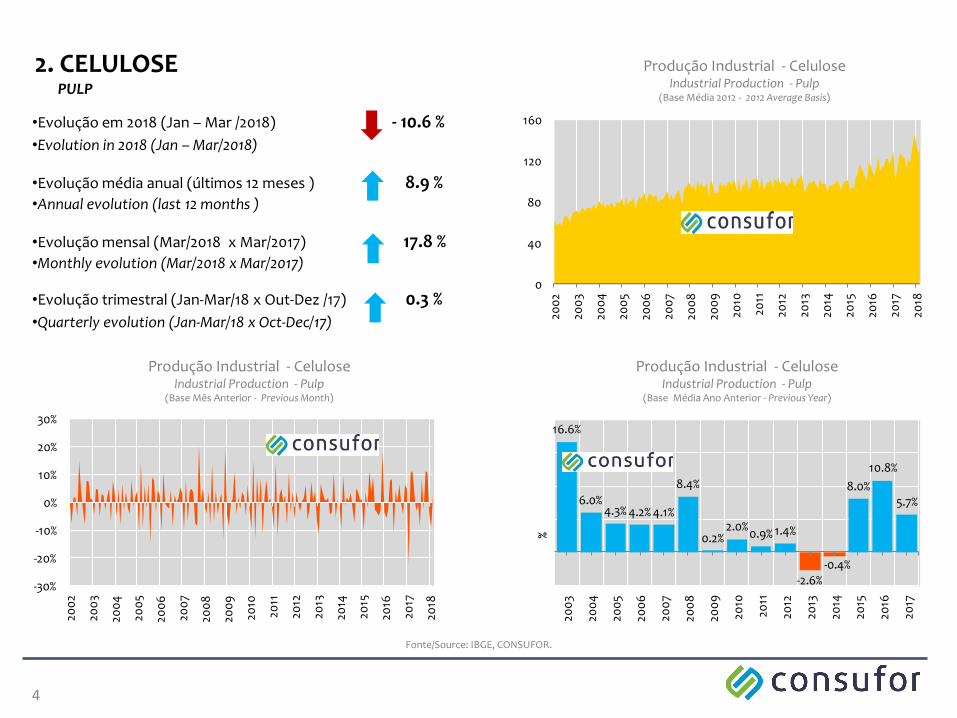
2. CELULOSEPULP
Produção Industrial - CeluloseIndustrial Production - Pulp
(Base Média 2012 - 2012 Average Basis)
Produção Industrial - CeluloseIndustrial Production - Pulp
(Base Mês Anterior - Previous Month)
Produção Industrial - CeluloseIndustrial Production - Pulp
(Base Média Ano Anterior - Previous Year)
Fonte/Source: IBGE, CONSUFOR.
•Evolução em 2018 (Jan – Mar /2018) - 10.6 %
•Evolução média anual (últimos 12 meses ) 8.9 %
•Evolução mensal (Mar/2018 x Mar/2017) 17.8 %
•Evolução trimestral (Jan-Mar/18 x Out-Dez /17) 0.3 %
•Evolution in 2018 (Jan – Mar/2018)
•Annual evolution (last 12 months )
•Monthly evolution (Mar/2018 x Mar/2017)
•Quarterly evolution (Jan-Mar/18 x Oct-Dec/17)
16.6%
6.0%4.3% 4.2% 4.1%
8.4%
0.2%2.0%
0.9% 1.4%
-2.6%-0.4%
8.0%
10.8%
5.7%
200
3
200
4
200
5
200
6
200
7
200
8
200
9
2010
2011
2012
2013
2014
2015
2016
2017
%
0
40
80
120
160
200
2
200
3
200
4
200
5
200
6
200
7
200
8
200
9
2010
2011
2012
2013
2014
2015
2016
2017
2018
-30%
-20%
-10%
0%
10%
20%
30%
200
2
200
3
200
4
200
5
200
6
200
7
200
8
200
9
2010
2011
2012
2013
2014
2015
2016
2017
2018
5
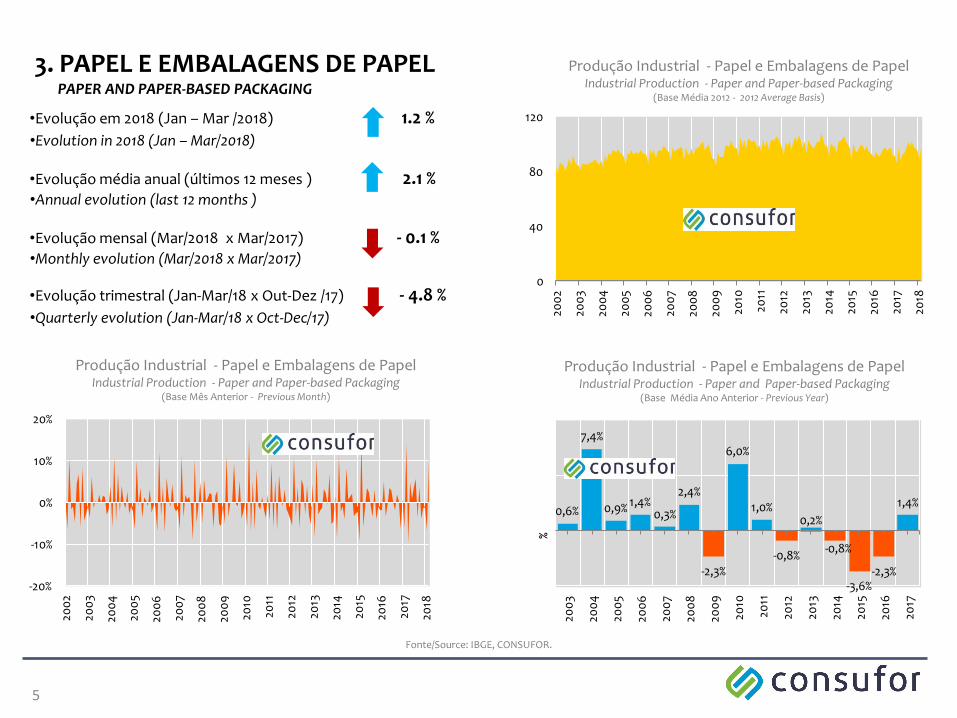
3. PAPEL E EMBALAGENS DE PAPELPAPER AND PAPER-BASED PACKAGING
Produção Industrial - Papel e Embalagens de PapelIndustrial Production - Paper and Paper-based Packaging
(Base Média 2012 - 2012 Average Basis)
Produção Industrial - Papel e Embalagens de PapelIndustrial Production - Paper and Paper-based Packaging
(Base Mês Anterior - Previous Month)
Produção Industrial - Papel e Embalagens de PapelIndustrial Production - Paper and Paper-based Packaging
(Base Média Ano Anterior - Previous Year)
Fonte/Source: IBGE, CONSUFOR.
•Evolução em 2018 (Jan – Mar /2018) 1.2 %
•Evolução média anual (últimos 12 meses ) 2.1 %
•Evolução mensal (Mar/2018 x Mar/2017) - 0.1 %
•Evolução trimestral (Jan-Mar/18 x Out-Dez /17) - 4.8 %
•Evolution in 2018 (Jan – Mar/2018)
•Annual evolution (last 12 months )
•Monthly evolution (Mar/2018 x Mar/2017)
•Quarterly evolution (Jan-Mar/18 x Oct-Dec/17)
0
40
80
120
200
2
200
3
200
4
200
5
200
6
200
7
200
8
200
9
2010
2011
2012
2013
2014
2015
2016
2017
2018
-20%
-10%
0%
10%
20%
200
2
200
3
200
4
200
5
200
6
200
7
200
8
200
9
2010
2011
2012
2013
2014
2015
2016
2017
2018
0,6%
7,4%
0,9% 1,4%0,3%
2,4%
-2,3%
6,0%
1,0%
-0,8%
0,2%
-0,8%
-3,6%-2,3%
1,4%
200
3
200
4
200
5
200
6
200
7
200
8
200
9
2010
2011
2012
2013
2014
2015
2016
2017
%

6
4. PRODUTOS DE MADEIRATIMBER PRODUCTS
Produção Industrial - Produtos da MadeiraIndustrial Production - Timber Products
(Base Média 2012 - 2012 Average Basis)
Produção Industrial - Produtos da MadeiraIndustrial Production - Timber Products
(Base Mês Anterior - Previous Month)
Produção Industrial - Produtos da MadeiraIndustrial Production - Timber Products
(Base Média Ano Anterior - Previous Year)
Fonte/Source: IBGE, CONSUFOR.
•Evolution in 2018 (Jan – Mar/2018)
•Annual evolution (last 12 months )
•Monthly evolution (Mar/2018 x Mar/2017)
•Monthly evolution (Jan-Mar / 18 x Oct-Dec /17)
•Evolução em 2018 (Jan – Mar/2018) 13.8 %
•Evolução média anual (últimos 12 meses ) 4.7 %
•Evolução mensal (Mar/2018 x Mar/2017) 3.7 %
•Evolução trimestral (Jan-Mar/ 18 x Out-Dez/17) 3.3 %
5.5%7.8%
-4.5%-7.0%
-2.8%
-10.2%
-17.7%
16.2%
-0.5%
8.7%
2.1%
-2.7%-4.5%
1.3% 1.9%
200
3
200
4
200
5
200
6
200
7
200
8
200
9
2010
2011
2012
2013
2014
2015
2016
2017
%
0
40
80
120
160
200
2
200
3
200
4
200
5
200
6
200
7
200
8
200
9
2010
2011
2012
2013
2014
2015
2016
2017
2018
-20%
-10%
0%
10%
20%
30%
200
2
200
3
200
4
200
5
200
6
200
7
200
8
200
9
2010
2011
2012
2013
2014
2015
2016
2017
2018
7
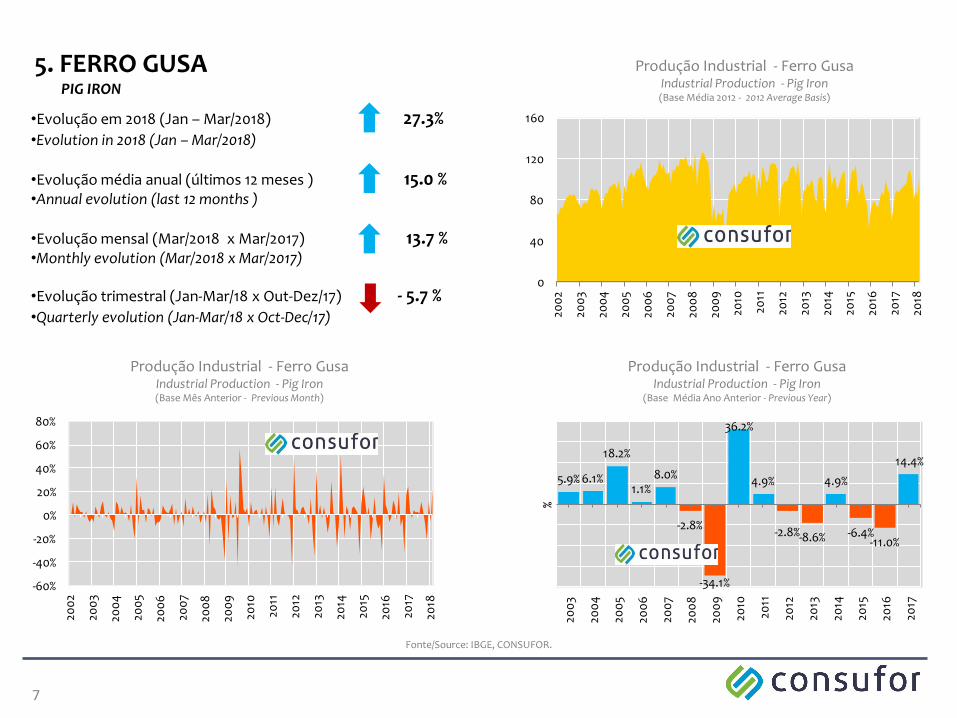
5. FERRO GUSAPIG IRON
Produção Industrial - Ferro GusaIndustrial Production - Pig Iron(Base Média 2012 - 2012 Average Basis)
Produção Industrial - Ferro GusaIndustrial Production - Pig Iron(Base Mês Anterior - Previous Month)
Produção Industrial - Ferro GusaIndustrial Production - Pig Iron
(Base Média Ano Anterior - Previous Year)
Fonte/Source: IBGE, CONSUFOR.
•Evolution in 2018 (Jan – Mar/2018)
•Annual evolution (last 12 months )
•Monthly evolution (Mar/2018 x Mar/2017)
•Quarterly evolution (Jan-Mar/18 x Oct-Dec/17)
•Evolução em 2018 (Jan – Mar/2018) 27.3%
•Evolução média anual (últimos 12 meses ) 15.0 %
•Evolução mensal (Mar/2018 x Mar/2017) 13.7 %
•Evolução trimestral (Jan-Mar/18 x Out-Dez/17) - 5.7 %
5.9% 6.1%
18.2%
1.1%8.0%
-2.8%
-34.1%
36.2%
4.9%
-2.8%-8.6%
4.9%
-6.4%-11.0%
14.4%
200
3
200
4
200
5
200
6
200
7
200
8
200
9
2010
2011
2012
2013
2014
2015
2016
2017
%
0
40
80
120
160
200
2
200
3
200
4
200
5
200
6
200
7
200
8
200
9
2010
2011
2012
2013
2014
2015
2016
2017
2018
-60%
-40%
-20%
0%
20%
40%
60%
80%
200
2
200
3
200
4
200
5
200
6
200
7
200
8
200
9
2010
2011
2012
2013
2014
2015
2016
2017
2018
8
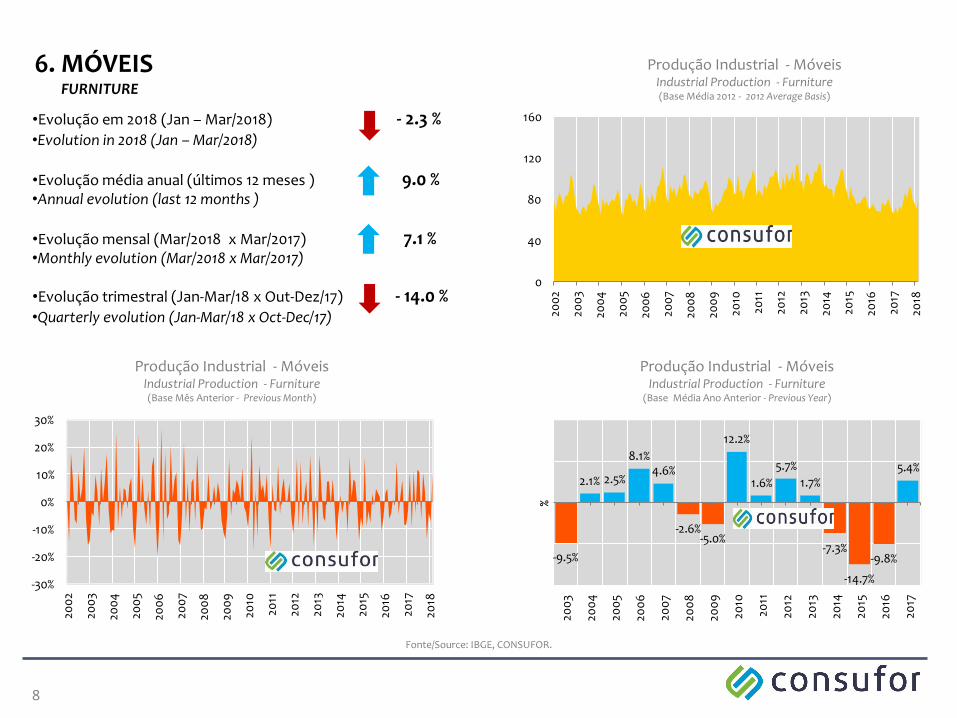
6. MÓVEISFURNITURE
Produção Industrial - MóveisIndustrial Production - Furniture(Base Média 2012 - 2012 Average Basis)
Produção Industrial - MóveisIndustrial Production - Furniture(Base Mês Anterior - Previous Month)
Produção Industrial - MóveisIndustrial Production - Furniture
(Base Média Ano Anterior - Previous Year)
Fonte/Source: IBGE, CONSUFOR.
•Evolution in 2018 (Jan – Mar/2018)
•Annual evolution (last 12 months )
•Monthly evolution (Mar/2018 x Mar/2017)
•Quarterly evolution (Jan-Mar/18 x Oct-Dec/17)
•Evolução em 2018 (Jan – Mar/2018) - 2.3 %
•Evolução média anual (últimos 12 meses ) 9.0 %
•Evolução mensal (Mar/2018 x Mar/2017) 7.1 %
•Evolução trimestral (Jan-Mar/18 x Out-Dez/17) - 14.0 %
-9.5%
2.1% 2.5%
8.1%4.6%
-2.6%-5.0%
12.2%
1.6%
5.7%
1.7%
-7.3%
-14.7%
-9.8%
5.4%
200
3
200
4
200
5
200
6
200
7
200
8
200
9
2010
2011
2012
2013
2014
2015
2016
2017
%
0
40
80
120
160
200
2
200
3
200
4
200
5
200
6
200
7
200
8
200
9
2010
2011
2012
2013
2014
2015
2016
2017
2018
-30%
-20%
-10%
0%
10%
20%
30%
200
2
200
3
200
4
200
5
200
6
200
7
200
8
200
9
2010
2011
2012
2013
2014
2015
2016
2017
2018

7. SÍNTESE COMPARATIVASUMMARY
•Maior alta trimestral: Madeira +3.3 %
•Maior queda trimestral: Móveis - 14 %
•Maior alta anual: Ferro Gusa + 14.4%
•Menor alta anual: Papel e Embalagens de Papel +1.4%
•Highest quarterly growth rate: Timber
•Highest quarterly fall: Furniture
•Highest annual growth rate: Pig Iron
•Lowest annual fall: Paper and Paper-based Packaging
9
Produção Industrial Industrial Production
(Base Trimestre Anterior - Previous Quarter)
Produção IndustrialIndustrial Production
(Base Média Ano Anterior - Previous Year)
Fonte: IBGE, CONSUFOR
-7,7%
0,3%
-4,8%
3,3%
-5,7%
-14,0%
Brasil Ind. de Transformação / Brazil Processing Industry
Celulose / Pulp
Papel e Embalagens de Papel / Paper and Paper-based Packaging
Madeira / Timber
Ferro Gusa / Pig Iron
Móveis / Furniture
2,2%
5,7%
1,4%
1,9%
14,4%
5,4%
Brasil Ind. de Transformação / Brazil Processing Industry
Celulose / Pulp
Papel e Embalagens de Papel / Paper and Paper-based Packaging
Madeira / Timber
Ferro Gusa / Pig Iron
Móveis / Furniture

•Valuation•Due diligence•Identificação de parceiros e investidores•Preparação de Books comerciais•Prospecção de oportunidades•Preparação e condução de negociações•Fair opinion reports•Elaboração de laudos técnicos
•Diagnóstico e Estratégia•Benchmarking•Reestruturação de empresas•Planejamento operacional•Modelagem de gestão•Auditorias•Melhoria de processos•Capacitação e empowerment•Mensuração de custos
•Planos de Negócios•Estudos de oportunidades de investimentos•Seleção de Sites•Estudos logísticos de suprimento e distribuição•Formação de preços•Análise de viabilidade econômica•Apoio à obtenção de financiamentos•Captação de recursos•Composição de funding•Planos de Desenvolvimento Setoriais
•Estudos Setoriais•Dimensionamento de mercado•Identificação de players•Análise de preços e custos•Análise conjuntural•Modelos econométricos•Mapeamento de estratégias•Modelos de comercialização•Percepção de sentimento de mercado•Projeção de cenários futuros
10
Fusões e AquisiçõesInteligência de Mercado Engenharia de Negócios Gestão Empresarial
A CONSUFOR é uma empresa de consultoria em negócios e estratégias, especializada nos setores da indústria damadeira, papel e celulose, bioenergia, siderúrgico, floresta e agronegócio. Para atender às necessidades domercado, a CONSUFOR desenvolve serviços de consultoria e pesquisa focando em quatro áreas:
8. CONHEÇA A CONSUFOR
11
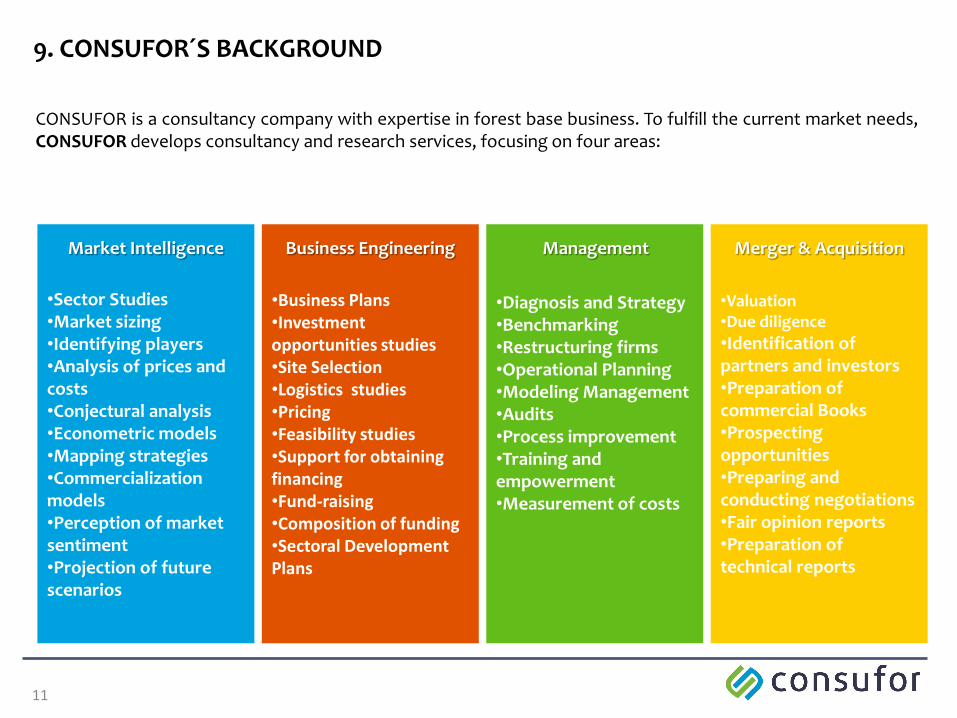
9. CONSUFOR´S BACKGROUND
•Valuation•Due diligence
•Identification of partners and investors•Preparation of commercial Books•Prospecting opportunities•Preparing and conducting negotiations•Fair opinion reports•Preparation of technical reports
•Diagnosis and Strategy•Benchmarking•Restructuring firms•Operational Planning•Modeling Management•Audits•Process improvement•Training and empowerment•Measurement of costs
•Business Plans•Investment opportunities studies•Site Selection•Logistics studies•Pricing•Feasibility studies•Support for obtaining financing•Fund-raising•Composition of funding•Sectoral Development Plans
•Sector Studies•Market sizing•Identifying players•Analysis of prices and costs•Conjectural analysis•Econometric models•Mapping strategies•Commercialization models•Perception of market sentiment•Projection of future scenarios
Merger & AcquisitionMarket Intelligence Business Engineering Management
CONSUFOR is a consultancy company with expertise in forest base business. To fulfill the current market needs,CONSUFOR develops consultancy and research services, focusing on four areas:
12
© 2018 Consufor Advisory & Research - todos os direitos reservados.Nenhuma parte desta publicação pode ser reproduzida por nenhum meio (eletrônico ou mecânico). Asinformações contidas neste documento não podem ser divulgadas sem a expressa permissão da CONSUFOR. Aretransmissão por fax, e-mail ou qualquer outra forma é ilegal.
© 2018 Consufor Advisory & Research reserves all rights.All rights reserved. No part of this document may be reproduced in any form or by any means without permissionin writing from CONSUFOR.

Curitiba – Paraná – Celulose
+ 55 41 3538 4497
www.consufor.com
Twitter: @consufor
Facebook: /consufor
13


![RADAR INTERFEROMETRY: 2D PHASE UNWRAPPING VIA GRAPH … › ~gvaladao › pdfs › ValadaoMSc.pdf · ]− π,π]2, i.e., the acquisition system wraps the phase around that interval](https://img.document.onl/doc/110x75/5f04b5dc7e708231d40f5211/radar-interferometry-2d-phase-unwrapping-via-graph-a-gvaladao-a-pdfs-a-.jpg)