Embed Size (px)
Citation preview

Scilab
Aula 3 – Chapter 1
Signals and Systems

Solução de sistemas lineares
Para resolver um sistema linear utilizamos a seguinte fórmula: X = inv(A) * B (admitindo
que A possui inversa)
Onde AX = B

Verificação do exercício da aula passada
B.31 Considere o seguinte sistema de equações:
X1 + x2 + x3 = 1
X1 + 2x2 + 3x3 = 3
X1 – x2 = -3
Utilize o novo método para encontrar a solução:
. X1 = -1 X2 = 2 X3 = 0
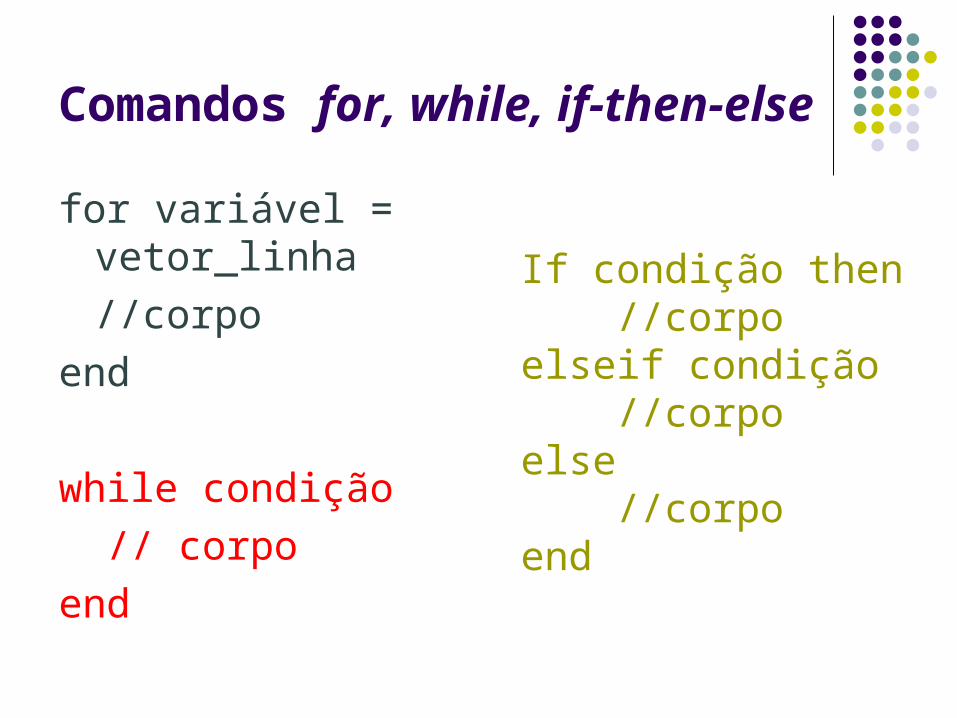
Comandos for, while, if-then-else
for variável = vetor_linha
//corpo
end
while condição
// corpo
end
If condição then//corpo
elseif condição//corpo
else//corpo
end
Plot: Funções
Lembrando:
function[retorno] = nome(param)
Ex.: Funcão degrau (Step)
t = [-%pi:0.01:%pi] ou
linspace(-%pi,%pi,100)
plot (t, degrau(t),[‘color’])

Plot: Funções
Possível Solução…
function[v] = degrau(t)v = [];b = size(t);for u = [1:b(2)]if (t(u)>=0) thenv = [v 1];elsev = [v 0];endendendfunction
Plot: função degrau
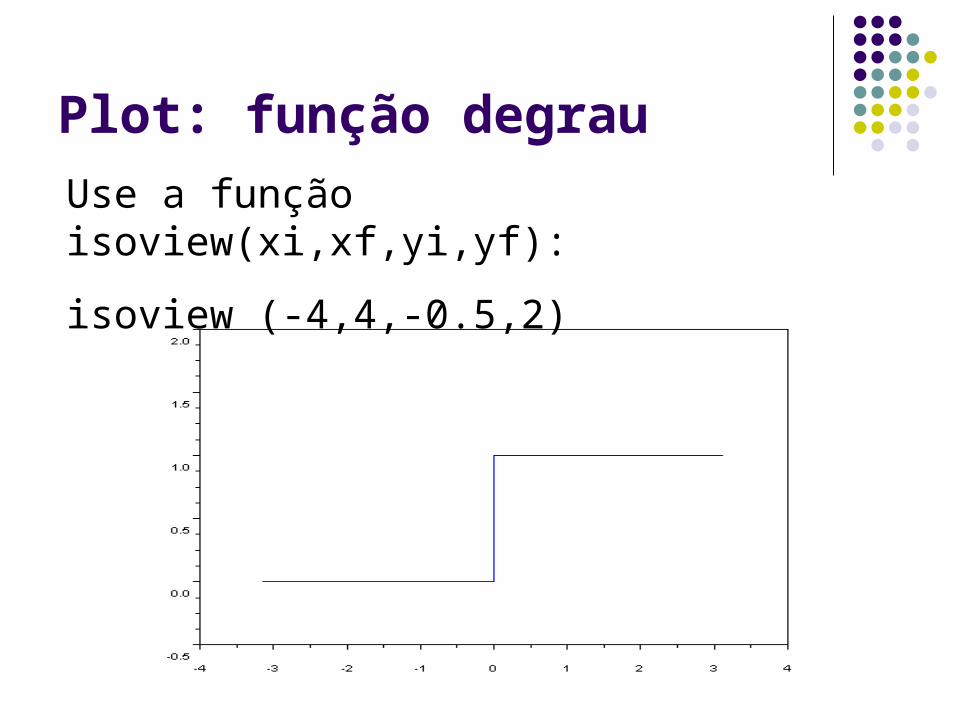
Use a função isoview(xi,xf,yi,yf):
isoview (-4,4,-0.5,2)

Exercício 1 Defina a função para o sinal abaixo:

Exercício 1
function [r] = pe(t)
r = degrau(t-1) - degrau(t-3);
endfunction
Outras funções auxiliares de plot:
xtitle(‘title’), xgrid(),

Signal Operations Time Reversal φ(t) = pe(-t)
plot(t, pe(-t))
φ(t)

Signal Operations
Time Shifting φ(t) = pe(t - 1)
φ(t)

Signal Operations
Time Scaling φ(t) = pe(2.5*t)
φ(t)

Plot: Função Exponecial est
s = a – b * %i
t = [-%pi: 0.01: %pi]
plot(t, exp(s*t))
s = 0 s = a + 0j est = eat(cos bt + j sin bt) s = 0 + bj s = a + bj Ex: a = ±1 b = ±2π

Plot: Função Exponecial est
s = 0

Plot: Função Exponecial est
s = a + 0j
a > 0
a < 0

Plot: Função Exponecial est
s = 0 + bj // b = ±2π

Plot: Função Exponecial est
s = a + bj // s = ±1 ± 2*%pi*%i
a < 0 a > 0

Plot: Função Exponecial est
Possível solução...
function[v] = myExpo(t,a,b)
s = a + b*%i;
v = exp(s*t);
endfunction
plot(t, myExpo(t,1,2*%pi))
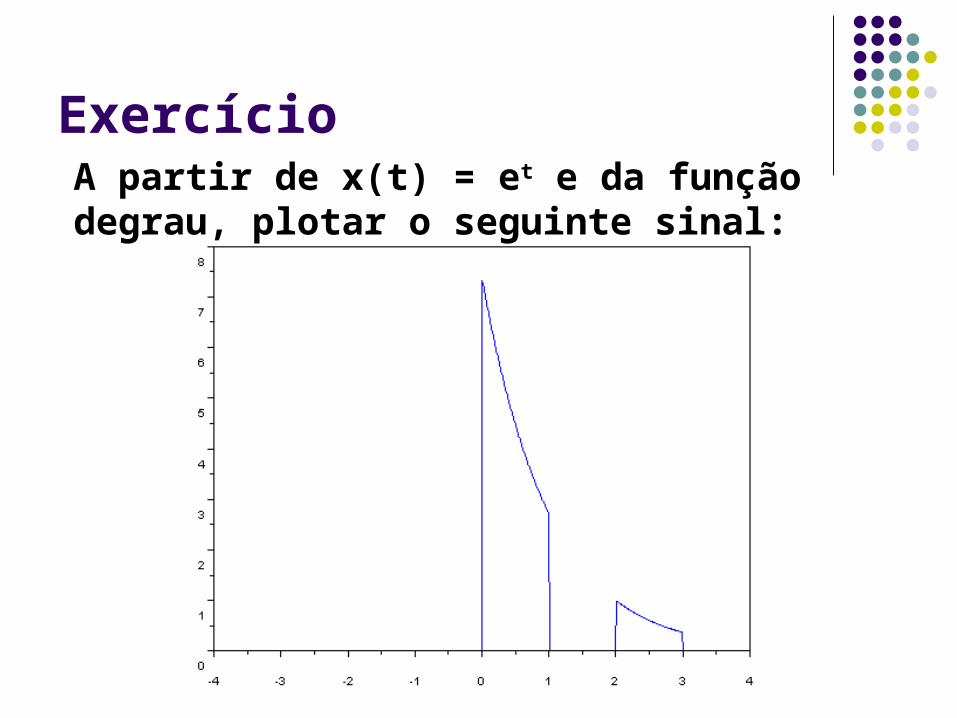
ExercícioA partir de x(t) = et e da função degrau, plotar o seguinte sinal:
Integração
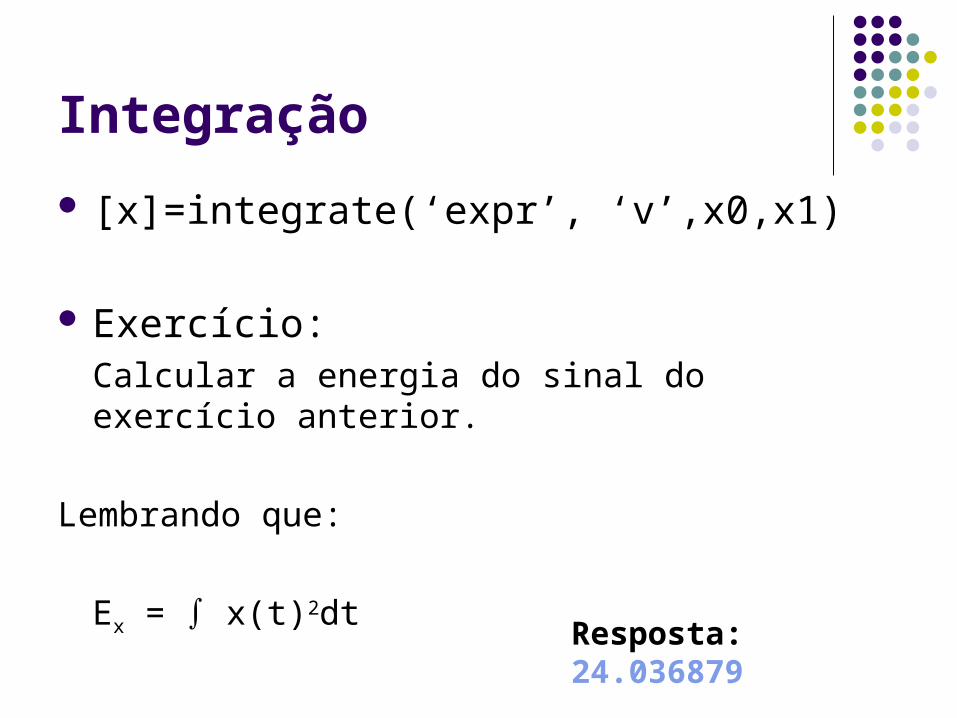
[x]=integrate(‘expr’, ‘v’,x0,x1)
Exercício:Calcular a energia do sinal do exercício anterior.
Lembrando que:
Ex = ∫ x(t)2dt
Resposta: 24.036879

Integração
Definindo Logaritimo Natural a partir de sua definição
function[res] = ln(x)
if (x > 0) then
res = integrate('1/t', 't', 1, x);
else
printf("parametro inválido..!");
res = x;
end
endfunction