Embed Size (px)
Citation preview

Universidade de Lisboa Faculdade de Ciências
Departamento de Física
Dynamics of Large-Scale Brain Activity
in Health and Disease
Maria Teresa Andrade Santos Costa Montez
Doutoramento em Engenharia Biomédica e Biofísica
2008


Universidade de Lisboa Faculdade de Ciências
Departamento de Física
Dynamics of Large-Scale Brain Activity
in Health and Disease
Maria Teresa Andrade Santos Costa Montez
Thesis supervised by
Dr. Klaus Linkenkaer-Hansen
Center for Neurogenomics and Cognitive Research,
Section Integrative Neurophysiology, VU University Amsterdam,
Netherlands
Prof. Doutor Eduardo Ducla-Soares
Instituto de Biofísica e Engenharia Biomédica, Faculdade de
Ciências, Universidade de Lisboa
Doutoramento em Engenharia Biomédica e Biofísica
2008


To the memory of
my grandmother Lídia
and my friend Luís Guisado.


Contents
LIST OF ORIGINAL PUBLICATIONS ................................................................................ III
ABBREVIATIONS ..................................................................................................................... V
ABSTRACT .............................................................................................................................. VII
KEYWORDS ............................................................................................................................. IX
SUMÁRIO ................................................................................................................................. XI
ACKNOWLEDGMENTS .................................................................................................... XVII
1. INTRODUCTION....................................................................................................................1
2. OVERVIEW OF THE LITERATURE..................................................................................5
2.1 ELECTRO- AND MAGNETOENCEPHALOGRAPHY ...................................................................5
Virtual Planar Gradiometers ..................................................................................................7
Artefact removal using Independent Component Analysis ......................................................8
2.2 ALZHEIMER’S DISEASE ....................................................................................................... 11
Prominence and characteristics ............................................................................................ 11
EEG and MEG studies of AD ................................................................................................ 13
2.3 ANALYSIS OF RESTING-STATE EEG AND MEG DATA ......................................................... 17
Evaluation of functional coupling ......................................................................................... 19
Temporal correlations as an index of memory ...................................................................... 28
Temporal correlations of synchronization levels .................................................................. 35
3. AIMS OF THE STUDY ......................................................................................................... 37
4. MATERIALS AND METHODS .......................................................................................... 39
4.1 SUBJECTS ............................................................................................................................ 39
4.2 RECORDINGS ....................................................................................................................... 39
4.3 DATA ANALYSIS ................................................................................................................. 40
i

5. RESULTS ............................................................................................................................... 43
5.1 TIME-DELAY EMBEDDING BASED ON THE FREQUENCY CONTENT OF INTEREST. ................ 43
5.2 SL REVEALED LOSS OF LONG DISTANCE INTRA-HEMISPHERIC INTERACTIONS IN
THE ALPHA BAND RESTING-STATE OSCILLATIONS OF AD PATIENTS MEASURED BY
MEG. ........................................................................................................................................ 47
5.3 IMPAIRED TEMPORAL CORRELATIONS IN TEMPORO-PARIETAL OSCILLATIONS IN
EARLY-STAGE ALZHEIMER’S DISEASE. .................................................................................... 51
5.4 DISTURBED FLUCTUATIONS OF RESTING STATE EEG SYNCHRONIZATION IN
ALZHEIMER’S DISEASE. ............................................................................................................ 55
6. DISCUSSION ......................................................................................................................... 57
6.1 PHYSIOLOGY OF RECURRENT PATTERNS IN NEURONAL ACTIVITY ..................................... 57
6.2 THE ROLE OF ALPHA OSCILLATIONS ................................................................................... 59
6.3 CONCLUSION AND OUTLOOK .............................................................................................. 60
APPENDIX: ORIGINAL PUBLICATIONS ........................................................................... 73
ii

List of Original Publications
P1 Montez T, Linkenkaer-Hansen K, van Dijk BW, Stam CJ. 2006. Synchronization likelihood with explicit time-frequency priors. NeuroImage 33: 1117−1125.
P2 Stam CJ, Jones BF, Manshanden I, van Cappellen van Walsum AM, Montez T, Verbunt JP, de Munck JC, van Dijk BW, Berendse HW, Scheltens P. 2006. Magnetoencephalographic evaluation of resting-state functional connectivity in Alzheimer's disease. NeuroImage 32: 1335−1344.
P3 Montez T, Poil S-S, Jones B, Manshanden I, Verbunt JPA, van Dijk BW, Brussaard AB, van Ooyen A, Stam CJ, Scheltens P, Linkenkaer-Hansen K. Impaired temporal correlations in temporo-parietal oscillations in early-stage Alzheimer’s disease. (Submitted)
P4 Stam CJ, Montez T, Jones BF, Rombouts SA, van der Made Y, Pijnenburg YA, Scheltens P. 2005. Disturbed fluctuations of resting state EEG synchronization in Alzheimer's disease. Clin Neurophysiol 116: 708−715.
iii

iv

Abbreviations
ACF Autocorrelation function
AD Alzheimer’s disease
CDF Cumulative probability Distribution Function
CSF Cerebrospinal Fluid
DFA Detrended Fluctuation Analysis
ECG Electrocardiographic
EEG/MEG Electro- / Magnetoencephalography
FIR Finite Impulse Response
FFT Fast Fourier Transform
(f)MRI (functional) Magnetic Resonance Imaging
iEEG Intracranial Electroencephalography
LRTC Long-range Temporal Correlations
MMSE Mini Mental State Examination
PDF Probability Distribution Function
PET Positron Emission Tomography
PSD Power Spectral Density
S Interdependency measure
SOC Self-Organized Criticality
TF-SL Time-frequency Synchronization Likelihood
WM Working Memory
v

vi

Abstract
Cognition relies on the integration of information processed in widely
distributed brain regions. Neuronal oscillations are thought to play an
important role in the supporting local and global coordination of neuronal
activity. This study aimed at investigating the dynamics of the ongoing
healthy brain activity and early changes observed in patients with Alzheimer’s
disease (AD). Electro- and magnetoencephalography (EEG/MEG) were used
due to high temporal resolution of these techniques. In order to evaluate the
functional connectivity in AD, a novel algorithm based on the concept of
generalized synchronization was improved by defining the embedding
parameters as a function of the frequency content of interest. The
time-frequency synchronization likelihood (TF-SL) revealed a loss of
fronto-temporal/parietal interactions in the lower alpha (8–10 Hz) oscillations
measured by MEG that was not found with classical coherence. Further,
long-range temporal (auto-) correlations (LRTC) in ongoing oscillations were
assessed with detrended fluctuation analysis (DFA) on times scales from
1–25 seconds. Significant auto-correlations indicate a dependence of the
underlying dynamical processes at certain time scales of separation, which
may be viewed as a form of "physiological memory". We tested whether the
DFA index could be related to the decline in cognitive memory in AD. Indeed,
a significant decrease in the DFA exponents was observed in the alpha band
(6–13 Hz) over temporo-parietal regions in the patients compared with the
age-matched healthy control subjects. Finally, the mean level of SL of EEG
signals was found to be significantly decreased in the AD patients in the beta
(13–30 Hz) and in the upper alpha (10–13 Hz) and the DFA exponents
computed as a measure of the temporal structure of SL time series were
larger for the patients than for subjects with subjective memory complaint.
The results obtained indicate that the study of spatio-temporal dynamics of
resting-state EEG/MEG brain activity provides valuable information about the
vii

AD pathophysiology, which potentially could be developed into clinically
useful indices for assessing progression of AD or response to medication.
viii

Keywords
Alzheimer’s disease, electro- and magnetoencephalography, generalized
synchronization, temporal correlations, functional connectivity.
Doença de Alzheimer, electro- e magnetoencefalografia, sincronização
generalizada, correlações temporais, conectividade funcional.
ix

x

Sumário
A doença de Alzheimer é uma doença neurodegenerativa
responsável pela maioria dos casos de demência no mundo ocidental. O
aumento da prevalência da doença e os avultados custos económicos
associados ao acompanhamento dos doentes colocam como prioridades nas
agendas científicas mundiais questões como: a identificação das causas
desta patologia; a descoberta de biomarcadores para o diagnóstico precoce;
a compreensão dos mecanismos afectados que levam às deficiências
progressivas nas memórias episódica e de trabalho e diminuição de
capacidades cognitivas observadas nos doentes e a procura de tratamentos
eficazes.
Mais de um século passou desde que o psiquiatra alemão Alois
Alzheimer descobriu, através de autopsias a doentes seus, placas beta
amilóide e tranças neurofibrilhares (resultantes de alterações na
conformação da proteína tau no interior dos microtúbulos). Apesar de nos
nossos dias se terem aprofundado conhecimentos relativos à epidemiologia,
à sintomatologia clínica, ao prognóstico e às alterações a nível celular e
molecular, a causa da doença de Alzheimer não foi ainda determinada e os
medicamentos disponíveis limitam-se a actuar ao nível dos sintomas. As
teorias actuais para as causas da doença são as hipóteses associadas à
proteína amilóide e à proteína tau responsáveis respectivamente pelas
placas e pelas tranças neurofibrilhares observados por Alois Alzheimer e a
hipótese colinérgica que relaciona a patologia com uma diminuição do
neurotransmissor acetilcolina.
Com o avanço das técnicas de imagiologia e dos métodos de análise
desenvolvidos esperam-se também progressos que permitirão o diagnóstico
da doença em fases menos avançadas. Por exemplo, recorrendo a
Tomografia por Emissão de Positrões é hoje possível mapear a deposição
de amilóide; através de análises ao líquido encefaloraquidiano podem ser
xi

quantificadas as concentrações de amilóide e tau; a diminuição do volume
de regiões cerebrais pode ser medida em imagens de Ressonância
Magnética e deficiências ao nível de fluxo sanguíneo associadas a
diminuição de activação neural podem ser estudadas utilizando Ressonância
Magnética funcional. As técnicas referidas anteriormente são apropriadas
para a análise de alterações estruturais graças às suas resoluções
espaciais. No entanto, é provável que as mudanças que ocorrem no início da
doença sejam mais facilmente detectadas pelas alterações provocadas na
dinâmica da actividade cerebral do que através de modificações estruturais
características de um estado mais avançado da doença.
As técnicas de Electro- e Magnetoencefalografia (EEG/MEG) são
técnicas de electrofisiologia que medem de forma não invasiva os campos
electromagnéticos criados pela actividade síncrona de redes neuronais
distribuídas pelo córtex com uma resolução temporal na ordem dos
milissegundos permitindo o estudo da dinâmica da actividade cerebral a uma
escala macroscópica. A importância das oscilações observadas na
actividade neuronal para o processamento de informação pelo cérebro tem
vindo a ser empiricamente reforçada por uma série de estudos que
estabelecem a correspondência entre actividade em determinadas regiões
em certas bandas de frequência com diversas funções desempenhadas pelo
cérebro. Estudos de EEG/MEG revelaram um abrandamento nos doentes de
Alzheimer dos ritmos encontrados nos cérebros saudáveis, isto é, um
aumento da amplitude das frequências mais baixas e uma diminuição da
amplitude nas frequências mais elevadas. Entrando em mais detalhe,
verifica-se aumento de amplitude na banda delta (2-4 Hz) nas zonas frontais
e occipitais, aumento global na banda teta (4-7 Hz), diminuição na banda
alfa (8-12 Hz) na zona occipital e parietal e diminuição da banda beta
(12-30 Hz) na zona frontal. Este abrandamento foi correlacionado com
diminuição do volume cerebral e com alterações genéticas e provavelmente
está relacionado com alterações no sistema colinérgico. A dessincronização
das oscilações está associada à libertação de acetilcolina. Nos cérebros dos
xii
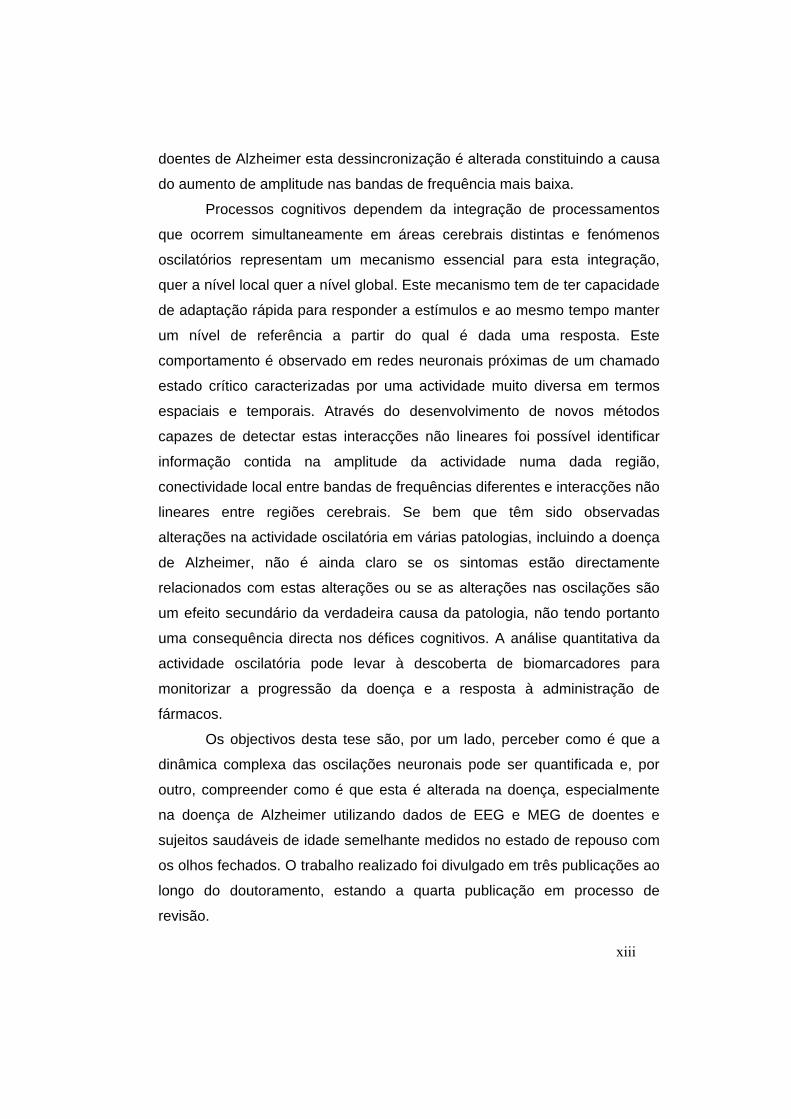
doentes de Alzheimer esta dessincronização é alterada constituindo a causa
do aumento de amplitude nas bandas de frequência mais baixa.
Processos cognitivos dependem da integração de processamentos
que ocorrem simultaneamente em áreas cerebrais distintas e fenómenos
oscilatórios representam um mecanismo essencial para esta integração,
quer a nível local quer a nível global. Este mecanismo tem de ter capacidade
de adaptação rápida para responder a estímulos e ao mesmo tempo manter
um nível de referência a partir do qual é dada uma resposta. Este
comportamento é observado em redes neuronais próximas de um chamado
estado crítico caracterizadas por uma actividade muito diversa em termos
espaciais e temporais. Através do desenvolvimento de novos métodos
capazes de detectar estas interacções não lineares foi possível identificar
informação contida na amplitude da actividade numa dada região,
conectividade local entre bandas de frequências diferentes e interacções não
lineares entre regiões cerebrais. Se bem que têm sido observadas
alterações na actividade oscilatória em várias patologias, incluindo a doença
de Alzheimer, não é ainda claro se os sintomas estão directamente
relacionados com estas alterações ou se as alterações nas oscilações são
um efeito secundário da verdadeira causa da patologia, não tendo portanto
uma consequência directa nos défices cognitivos. A análise quantitativa da
actividade oscilatória pode levar à descoberta de biomarcadores para
monitorizar a progressão da doença e a resposta à administração de
fármacos.
Os objectivos desta tese são, por um lado, perceber como é que a
dinâmica complexa das oscilações neuronais pode ser quantificada e, por
outro, compreender como é que esta é alterada na doença, especialmente
na doença de Alzheimer utilizando dados de EEG e MEG de doentes e
sujeitos saudáveis de idade semelhante medidos no estado de repouso com
os olhos fechados. O trabalho realizado foi divulgado em três publicações ao
longo do doutoramento, estando a quarta publicação em processo de
revisão.
xiii

Na primeira publicação foi desenvolvido um algoritmo baseado no
conceito de sincronização generalizada denominado Time-Frequency
Synchronization Likelihood (TF-SL) que permite detectar conectividade
funcional entre regiões cerebrais envolvendo termos não lineares. O
conceito de sincronização generalizada pressupõe a repetição síncrona de
estados em duas regiões, isto é, sempre que uma determinada região repita
um determinado estado, outra região que esteja sincronizada com esta
repetirá um outro estado. Estes estados são representados por vectores que
correspondem a padrões, sendo uma das vantagens deste método,
comparativamente com outros métodos utilizados, como por exemplo a
correlação, o facto de estes padrões poderem ser diferentes nas duas
regiões. O desenvolvimento introduzido no algoritmo prende-se com a
definição dos parâmetros utilizados para a construção dos vectores
(time-delay embedding) em função das frequências mais baixa e mais alta
que compõem os padrões de interesse. Testes realizados ao método de
TF-SL com dados de EEG mostram que o algoritmo é mais adequado à
detecção do início de uma crise epiléptica do que a coerência clássica, tem
uma maior resolução temporal e permite seguir a sincronização entre sinais
provenientes de duas zonas do cérebro apresentando padrões de actividade
complexos e consideravelmente diferentes numa zona e noutra.
Na segunda publicação quantificaram-se alterações na conectividade
funcional em doentes de Alzheimer através da aplicação do método
desenvolvido na primeira publicação e validado empiricamente na segunda
publicação a dados de MEG obtidos com os sujeitos em estado de repouso
de olhos fechados e compararam-se os resultados com os obtidos com
coerência. Observou-se uma diminuição significativa da conectividade
funcional entre as regiões do hemisfério esquerdo frontal e parietal, bem
como frontal e temporal, na banda alfa mais baixa (8–10 Hz) que não foi
encontrada para a coerência. As alterações verificadas sugerem uma
associação com a perda de ligações entre diferentes regiões anatómicas, a
redução de actividade colinérgica e o consequente declínio cognitivo.
xiv
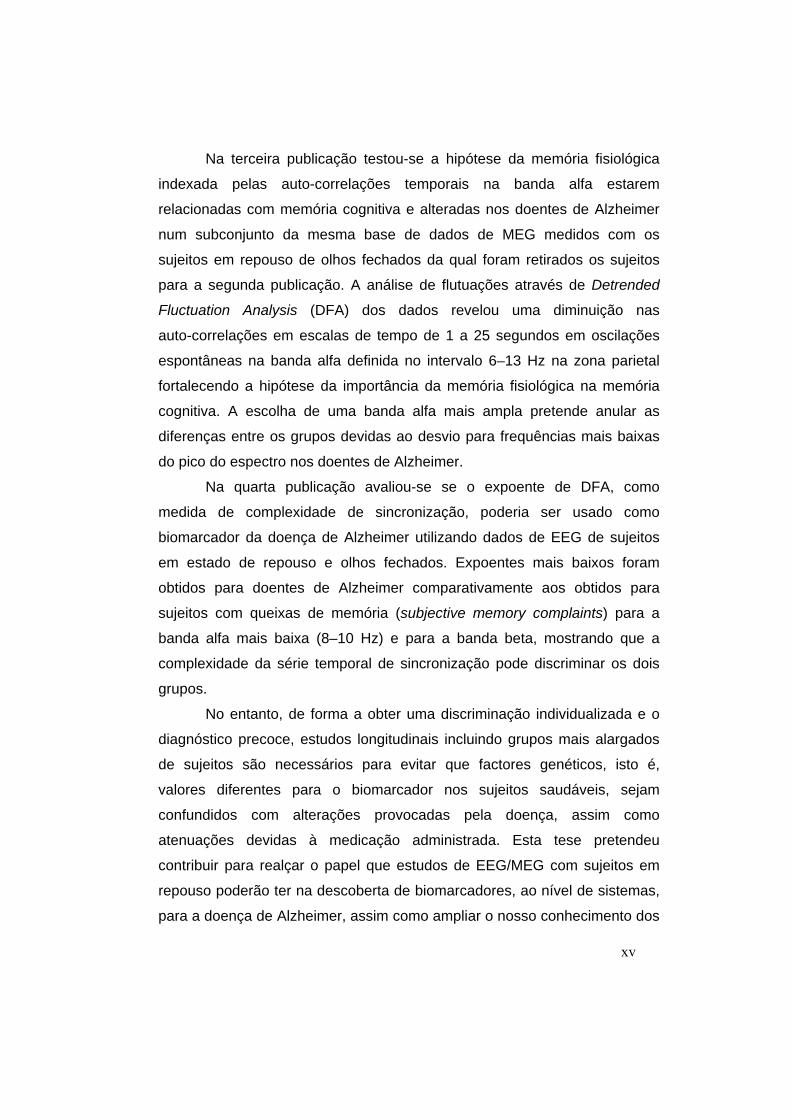
Na terceira publicação testou-se a hipótese da memória fisiológica
indexada pelas auto-correlações temporais na banda alfa estarem
relacionadas com memória cognitiva e alteradas nos doentes de Alzheimer
num subconjunto da mesma base de dados de MEG medidos com os
sujeitos em repouso de olhos fechados da qual foram retirados os sujeitos
para a segunda publicação. A análise de flutuações através de Detrended
Fluctuation Analysis (DFA) dos dados revelou uma diminuição nas
auto-correlações em escalas de tempo de 1 a 25 segundos em oscilações
espontâneas na banda alfa definida no intervalo 6–13 Hz na zona parietal
fortalecendo a hipótese da importância da memória fisiológica na memória
cognitiva. A escolha de uma banda alfa mais ampla pretende anular as
diferenças entre os grupos devidas ao desvio para frequências mais baixas
do pico do espectro nos doentes de Alzheimer.
Na quarta publicação avaliou-se se o expoente de DFA, como
medida de complexidade de sincronização, poderia ser usado como
biomarcador da doença de Alzheimer utilizando dados de EEG de sujeitos
em estado de repouso e olhos fechados. Expoentes mais baixos foram
obtidos para doentes de Alzheimer comparativamente aos obtidos para
sujeitos com queixas de memória (subjective memory complaints) para a
banda alfa mais baixa (8–10 Hz) e para a banda beta, mostrando que a
complexidade da série temporal de sincronização pode discriminar os dois
grupos.
No entanto, de forma a obter uma discriminação individualizada e o
diagnóstico precoce, estudos longitudinais incluindo grupos mais alargados
de sujeitos são necessários para evitar que factores genéticos, isto é,
valores diferentes para o biomarcador nos sujeitos saudáveis, sejam
confundidos com alterações provocadas pela doença, assim como
atenuações devidas à medicação administrada. Esta tese pretendeu
contribuir para realçar o papel que estudos de EEG/MEG com sujeitos em
repouso poderão ter na descoberta de biomarcadores, ao nível de sistemas,
para a doença de Alzheimer, assim como ampliar o nosso conhecimento dos
xv

mecanismos subjacentes a esta patologia através do desenvolvimento e
aplicação de métodos que permitem a detecção de alterações ténues na
dinâmica da actividade cerebral em fases iniciais da doença.
xvi

Acknowledgments
I would like to thank Dr. Cornelius J. Stam from the Department of Clinical
Neurophysiology and MEG Centre of the VU University Medical Centre for sharing
the valuable database of MEG recordings of Alzheimer patients (and elderly age
matched controls) and for all the support given on the analysis of the data and
clinical background on the disease. It is difficult for me to put in words my gratitude
to Dr. Klaus Linkenkaer-Hansen from the CNCR, Section Integrative
Neurophysiology, VU, Amsterdam, The Netherlands as he was an exemplar
supervisor in the guidance of research questions to address, always motivating me to
find my own ways. I am also deeply thankful to Professor Ducla-Soares from the
Institute of Biophysics and Biomedical Engineering (IBEB), Science Faculty,
University of Lisbon who has supported me since my first steps in scientific research
and had a fundamental incentive role in the final stage of the PhD. The teamwork
with Simon-Shlomo Poil proved me that the show will go on: I wish you good luck
with your further research, my friend. The results achieved would not have been
possible if I had not been fortunate to have fruitful discussions with Philip Scheltens,
Bob van Dijk, Bethany Jones, Ilonka Manshanden, Jeroen Verbunt, Jan de Munck
and Andreas Daffertshofer. I thank my colleagues at the VUmc: Sandra, Patrik,
Mafalda, Sónia, Izabella, Ilonka, Geert, Arent, Fetsje, Adam, Fabrice, Dennis, Keith
and Linda for creating a warm atmosphere, for example while eating cold
sandwiches in the cantina. I would like to express my gratitude to Sandra L. for her
sympathy and solutions to housing issues during my stay in Amsterdam. Huge hugs
to João Graciano, Sandra and Rui, Roman B. and Marjan, Zsofi and Roman K.,
Patrik and Mia, Alexis, Susie, Christiaan, Maria and Alexandre, Duarte, Miguel and
Inês for drying me up in the rainy days.
I would like to thank the Professors at IBEB: Pedro Miranda, Pedro Almeida
and Alexandre Andrade for all the teachings. I am grateful to my colleagues from the
doctoral programme (particularly Ana Carolina, Lília, Paulo and Pedro) and the
residents: Sandra, Nuno M., Mónica, Hugo, Luís J., Luís F., Sofia, Susana, Paula,
xvii

Ricardo, Nuno O., Patrícia and Carlos for cooling me down while eating warm dishes
at lunch as well as during stress peaks. Specials thanks to Ana Sousa and Beatriz
Lampreia for making me feel in a nest. I would like to express also my gratitude to
Dr. Claúdio for the graph analysis of weekly working hours and to the neighbours in
Benfica for the coffee breaks,
Finalmente, agradeço à minha família por “tudo” e um beijinho especial para
o meu sobrinho.
xviii

xix
This study was financially supported by grants from the Fundação para a Ciência e
Tecnologia (SFRH/BD/10592/2002) financed by POCI 2010 and FSE and the
Fundação Calouste Gulbenkian (Proc. 79037) and resulted from the collaboration
between the VU University Amsterdam, The Netherlands and the University of
Lisbon, Portugal.


1. Introduction
Synchronized neuronal activity is a prominent feature of cortical networks
and gives rise to oscillatory electromagnetic fields, which can be non-invasively
measured with electro- or magnetoencephalography (EEG/MEG). The EEG and
MEG are particularly well suited for the study of temporal dynamics of large-scale
brain activity, because of the high temporal resolution of these techniques
(~ millisecond). The importance of neuronal oscillations for information processing
in the brain remains debated (Buzsaki and Draguhn, 2004); however, the past decade
has witnessed an explosion in empirical evidence and theoretical arguments
supporting a crucial role of oscillations in diverse brain functions (Buzsaki, 2006). In
particular, it is increasingly acknowledged that cognition depends on integration of
simultaneous processing in spatially distinct brain areas and that oscillations may
provide an important mechanism for orchestrating this activity both locally and
globally (Varela et al., 2001; Fries, 2005).
If oscillations are to play a role in coordinating activity on different spatial
scales, it seems that oscillations need to balance the needs to swiftly adapt to
processing demands while also providing a stable reference for neuronal
representations. In recent years, several authors have advanced the hypothesis that
this balancing act is supported by neuronal networks operating near a so-called
critical state, which is characterized by a large variability in spatio-temporal activity
(Linkenkaer-Hansen et al., 2001; Chialvo, 2007; Plenz and Thiagarajan, 2007).
Critical or "meta-stable" dynamics may also be important for the transient coupling
and exchange of information in distributed neuronal populations (Friston, 1994;
Tononi et al., 1998; Stam, 2000; Varela et al., 2001). Advances in algorithms that can
1

identify and quantify changes in "meta-stable" or nonlinear dynamics have made it
evident that neuronal oscillations are neither stable sinusoidal waves nor a form of
filtered noise; rather, oscillations carry information in their waxing and waning
amplitude patterns (Linkenkaer-Hansen et al., 2007), exhibit cross-frequency
coupling locally (Palva et al., 2005a) and nonlinear interactions across brain regions
(Stam et al., 2003a).
Brain-related disorders are commonly associated with aberrant oscillatory
activity and much effort has been devoted to the characterization of the impact of
pathology on neuronal oscillations. It remains a challenge, however, to understand
whether symptoms are directly related to these changes or whether altered oscillatory
activity is a side-effect of the underlying pathology without consequences for the
cognitive impairments. Quantitative analysis of oscillatory activity may nevertheless
lead to biomarkers for monitoring disease progression or responsiveness to
therapeutic intervention (Frank and Hargreaves, 2003; Matthews et al., 2006). Much
of the work in this thesis is aimed at understanding how the complex dynamics of
neuronal oscillations may be quantified and how it is impaired in disease, especially
Alzheimer's disease.
Alzheimer’s disease (AD) is a neurodegenerative disorder characterized by a
progressive decline in episodic and working memories and cognition. Although
much is known about the epidemiology, clinical presentation, prognosis and the
pathology at the cellular and molecular level, the cause of AD has not been identified
and available treatment is only symptomatic. Many techniques have been used to
investigate how the brain is affected in AD. For example, magnetic resonance
imaging (MRI) has revealed atrophy of the medial temporal lobe, including the
hippocampus and entorhinal cortex (van der Flier and Scheltens, 2005); functional
magnetic resonance imaging (fMRI) and positron emission tomography (PET) have
pointed to deficits in blood flow and metabolism in the posterior cingulate gyrus and
precuneus (Fox et al., 2001); analysis of CSF from AD patients showed a decrease in
the concentration of amyloid Aβ42 and an increase of tau (Waldemar, 2000); and
EEG/MEG studies have shown slowing of spontaneous oscillations in AD with a
suggested anterior displacement of the sources (Jeong, 2004; Osipova et al., 2005).
2
None of these techniques, however, allow for individual discrimination and
diagnosis in the early stages of the disease (Nestor et al., 2004). Nevertheless, it is
hoped that by studying the disease with a multitude of techniques and experimental
protocols as well as through continued progress in the development of signal
processing algorithms, this situation may one-day change to the benefit of the
patients and a better understanding of the pathophysiology underlying the cognitive
deficits. As an important spin-off from these pre-clinical studies, we are likely to
learn about the neural basis of cognitive functions in the healthy brain.
3

4

2. Overview of the literature
2.1 Electro- and Magnetoencephalography
Electroencephalography (EEG) and magnetoencephalography (MEG) are
non-invasive measures of the electric activity in the brain. EEG measures electric
potential differences on the scalp and MEG records extracranial magnetic fields both
generated by postsynaptic currents (Lopes da Silva and Van Rotterdam, 1999). These
techniques require the summation of synchronous activity of thousands of pyramidal
neurons that are oriented parallel to each other and perpendicular to the surface of the
cortex. The EEG voltages are generated by extracellular compensatory currents,
whereas the MEG measures intracellular activity located in the sulci where the
pyramidal neurons are parallel to the surface of the head.
The localisation of the sources producing the electrical potentials and the
magnetic fields is called the inverse problem and has no unique solution as different
distributions of sources can lead to the same measured EEG and MEG signals
(Helmholtz, 1853). The derivation from Maxwell’s laws of the basic equations for
solving the forward problem, i.e., computing the magnetic field created outside of the
head by the distribution of currents within the brain, can be found in a review article
(Hämäläinen et al., 1993). A comparison between different methods for source
localisation has recently been reported (Liljeström et al., 2005).
The conventional whole-head EEG electrode locations and names are
specified by the 10-20 system, reflecting the distance between adjacent electrodes to
be either 10% or 20% of the total front-back or right-left distances of the skull and
5

identifying the lobe and the hemisphere location. The voltage differences measured
from the scalp typically range from 10 to 100 μV (much larger values can be found
especially in young children during sleep, and in brain pathology). EEG always has
to be measured against some reference. Different montages reflect different solutions
to this problem: “bipolar” if the difference is computed between adjacent channels;
“referential” if a reference electrode is subtracted from each channel; “average” if the
average of all the channels is used as the reference; and “laplacian” if the reference
used is a weighted average of the neighbouring channels. None of these montages is
perfect since the reference is seldom neutral. In contrast to EEG, MEG
measurements are reference-free so that the problem with montages does not arise
here. Perhaps due to the reference-free character MEG is more sensitive to nonlinear
correlations and thus may be more suitable than EEG to assess functional
connectivity (Stam et al., 2003a; Guevara et al., 2005).
The detection of the weak magnetic fields created by the brain ranging from
50 to 500 femtoTesla (up to a thousand femtoTesla in the case of epileptic spikes) is
only possible using Superconducting Quantum Interference Devices (SQUIDs) and
by attenuating environmental magnetic noise (e.g., from car traffic, power lines and
the Earth’s field) by measuring inside magnetically shielded rooms.
Flux-transformers couple the magnetic flux to the SQUID and are required to be
immerged in liquid Helium. The simplest flux transformer is a magnetometer, which
measures the projection of the magnetic field along the normal of a single coil. When
two magnetometers of opposite polarities are connected together and oriented along
the radial (Fig. 1a), they form a 1st-order axial gradiometer (Vrba and Robinson,
2001). If the two opposite coils are placed in the same plane tangential to the scalp
they form a planar gradiometer and, unlike for axial gradiometers, the largest signal
is obtained directly above a given neuronal source (Fig. 1b and 2).
6

Figure 1 – Axial (a) and planar (b) gradiometers placed where the measured signal is
maximal: on the side and just above the source, respectively. Simões (2002) adapted
from Hari (1999).
Virtual Planar Gradiometers
The normal component of the magnetic field measured by axial gradiometers is
considered a scalar field on a surface defined by the sensor array: and may
be transformed into virtual planar gradiometers by computing spatial derivatives
(Fig. 2) for the two directions tangential to the scalp and orthogonal to each other:
and
),( vuB
uB ∂∂ / vB ∂∂ / using a 3D spline interpolation (Bastiaansen and Knösche,
2000).
Figure 2 –Topographic representations of the magnetic field measured by axial
gradiometers (left) and the gradient field representing the spatial derivative (right).
(Bastiaansen and Knösche, 2000)
The decay of the gradient fields as a function of distance is more pronounced
than the decay of electric fields, therefore MEG is more sensitive to superficial
cortical activity and EEG detects more easily activity from deep sources than
currents near the skull.
7

EEG and MEG share a temporal resolution of the order of milliseconds. EEG
has a poorer spatial resolution than MEG due to smearing of the potentials caused by
the different conductivities of the grey matter, cerebrospinal fluid, skull and scalp
that do not affect the magnetic fields (i.e., volume conduction). However, EEG can
be acquired simultaneously with functional magnetic resonance imaging (fMRI)
taking advantage of the high spatial resolution of this technique.
Artefact removal using Independent Component Analysis
Since the first application of independent component analysis (ICA) to EEG
(Makeig et al., 1996), the method is often used to detect and remove
electrocardiographic (ECG), eye movements and muscular artefacts in EEG and
MEG recordings (Jung et al., 2000).
The signals measured x1(t), x2(t), …, xm(t) corresponded to a sum of the
independent components s1(t), s2(t), …, sn(t), and can thus be written as :
xi = ai1s1 + ai2s2+ … + ainsn = with i = 1, …., m. ∑=
n
jjijsa
1
The ICA model is given by x = A s, where A is the matrix of weights aij. It
follows that s = W x, where W is the inverse of A. The components are assumed to be
nongaussian, and are found by maximizing their nongaussianity. The outputs of the
algorithm are time courses of the magnitude of each component and weights
expressing the contribution of each channel signal to that component allowing a
topographical representation (Fig. 3).
8

Figure 3 – Artefact removal by ICA. EEG time series (left), the corresponding ICA
component activation (left middle), scalp maps of five of the components (right middle)
and the EEG corrected for artefacts by removing the five selected components (right).
(Jung et al., 2000)
Several algorithms are developed for computation of ICA, such as JADE
(Cardoso et al., 1993) and the infomax (Bell and Sejnowski, 1995). Improved
versions of the infomax, the so-called extended infomax (Amari et al., 1996; Makeig
et al., 1997; Lee et al., 1999) and fixed-point ICA (Hyvarinen and Oja, 2000), have
been implemented in the EEGLAB open source toolbox (Delorme and Makeig,
2004).
9

10

2.2 Alzheimer’s Disease
Three studies in this thesis have investigated large-scale neuronal activity in
Alzheimer’s disease with the aim of identifying abnormal neurophysiological
processes that could underlie parts of the cognitive dysfunction associated with
Alzheimer’s disease (AD). By studying large-scale neuronal activities we hope to
help bridge the gap between our understanding of disease changes at cellular and
sub-cellular levels on one hand, and clinical behavioural levels on the other hand.
Prominence and characteristics
The essential feature of dementia has been defined by the American Academy of
Neurology as “impairment in short- and long-term memory, associated with
impairment in abstract thinking, impaired judgement, other disturbances of higher
cortical function, or personality change (…) severe enough to interfere significantly
with work or usual social activities” (American Psychiatric Association, 1987).
The most important cause of dementia in the Western world was named after
Alois Alzheimer, the German psychiatrist who discovered amyloid senile plaques
and neurofibrillary tangles (formed by hyperphosphorylation of a
microtubule-associated protein known as tau) in the atrophied brains of his patients
while performing autopsies. Two competing theories attribute the cause of the
disease to these two proteins, and are known as the amyloid (Hardy and Allsop,
1910) and the tau (Mudher and Lovestone, 2002) hypotheses. A third theory, the
cholinergic hypothesis, associates AD with a decrease of the acetylcholine
neurotransmitter (Shen, 2004).
A certain diagnosis of Alzheimer's disease continues to require post-mortem
analysis, although nowadays we can track changes due to a probable AD in vivo,
e.g., using MRI to measure the brain atrophy (Karas et al., 2004); PET to map the
amyloid deposition; analysis of CSF for quantifying the concentration of amyloid
11

and tau (Jeong, 2004; Waldemar et al., 2007), and EEG (Boerman et al., 1994;
Jonkman, 1997; Jeong, 2004) and MEG (Berendse et al., 2000; Maestu et al., 2001;
Fernandez et al., 2002; Osipova et al., 2005) to follow electrophysiological changes
that will be addressed in more detail in this thesis.
Early affected regions in AD are the medial temporal lobe, retrosplenial and
posterior cingulate cortex. The retrosplenial cortex has dense reciprocal projections
to the hippocampus and parahippocampal gyrus, where morphological changes occur
in AD patients (Hyman et al., 1984; Braak et al., 1993) and are likely to be the cause
of the prominent memory deficits characterizing the disease.
Posterior and frontal regions showing a consistent decrease of activity during
attention demanding cognitive tasks have been identified in a PET study (Raichle et
al., 2001), suggesting the existence of a default mode of brain function. The
functional connectivity of these regions was addressed for the first time in a later
study (Greicius et al., 2003) using fMRI. The same regions have shown metabolism
differences (Fig. 4) and amyloid deposition (Fig. 5) in older adults with AD.
Figure 4 – Precuneus activity correlates with successful recall of items in healthy
subjects (left) and show reduced metabolism in AD (right). (Buckner, 2004)
Decreased fMRI resting-state activity was also found with ICA in the
posterior cingulate cortex and hippocampus of patients of AD, distinguishing them
from healthy aging controls (Greicius et al., 2004). The disrupted connectivity
between these two regions is in agreement with the posterior cingulate cortex
hypo-metabolism reported in PET studies.
12

Figure 5 – Amyloid deposition in AD in the posterior parietal (A) and fontal cortex (B).
(Buckner, 2004)
At later stages of the disease, distributed neocortical areas are affected
(Braak et al., 1999) giving rise to other cognitive dysfunctions. EEG (Jonkman,
1997; Jeong, 2004) and MEG may allow the study of dynamical changes at early
stages of AD (Stam, 2007).
EEG and MEG studies of AD
EEG dominant rhythms found in the healthy human brain (Berger, 1929)
have been known for many years to be affected in AD (Weiner and Schuster, 1956;
Letemendia and Pampiglione, 1958; Liddell, 1958; Gordon and Sim, 1967; Soininen
et al., 1982; Coben et al., 1983; Penttila et al., 1985).
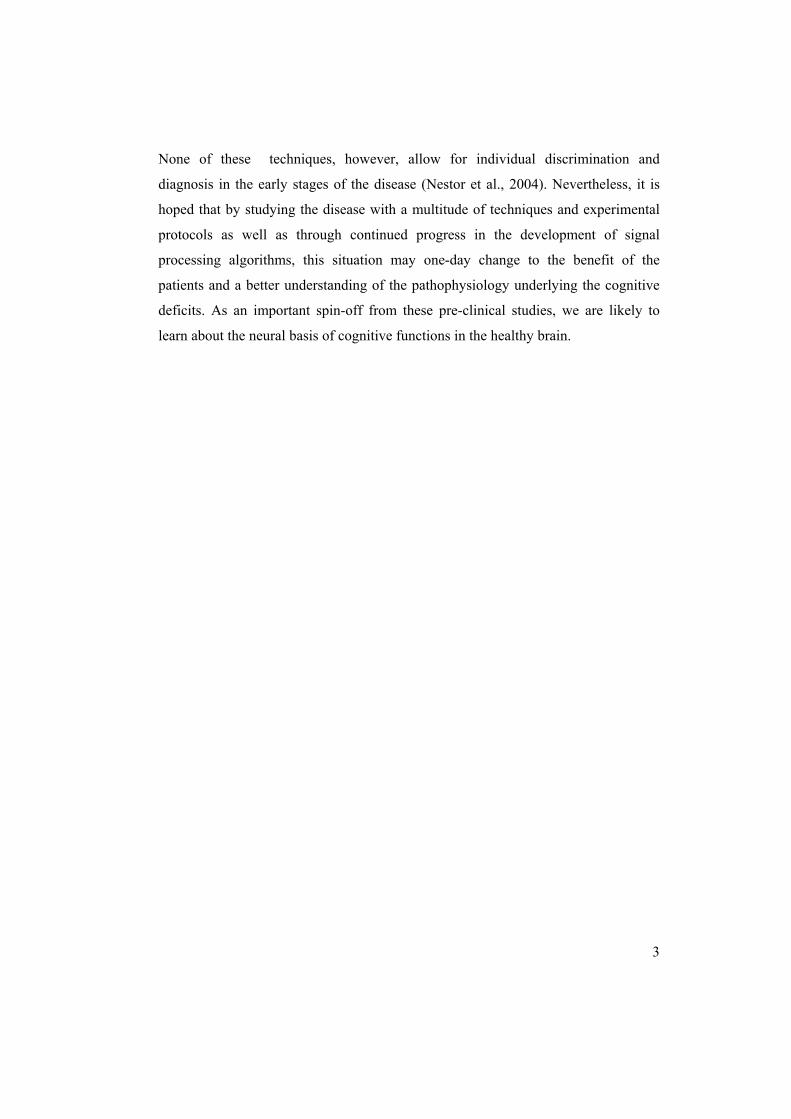
EEG studies have shown a slowing of the dominant rhythms in AD, meaning
that an increase of power was observed in the delta (2-4 Hz) and theta (4-7 Hz)
frequencies, and a decrease was reported for the alpha (8-12 Hz) and beta (12-30 Hz)
bands (Jeong, 2004). MEG studies have confirmed these findings (Fig. 6) and
suggested an anterior displacement of the sources of these rhythms (Berendse et al.,
2000; Maestu et al., 2001; Fernandez et al., 2002; Fernandez et al., 2003; Maestu et
al., 2003; Maestu et al., 2004; Maestú et al., 2005; Osipova et al., 2005; Fernandez et
al., 2006).
13
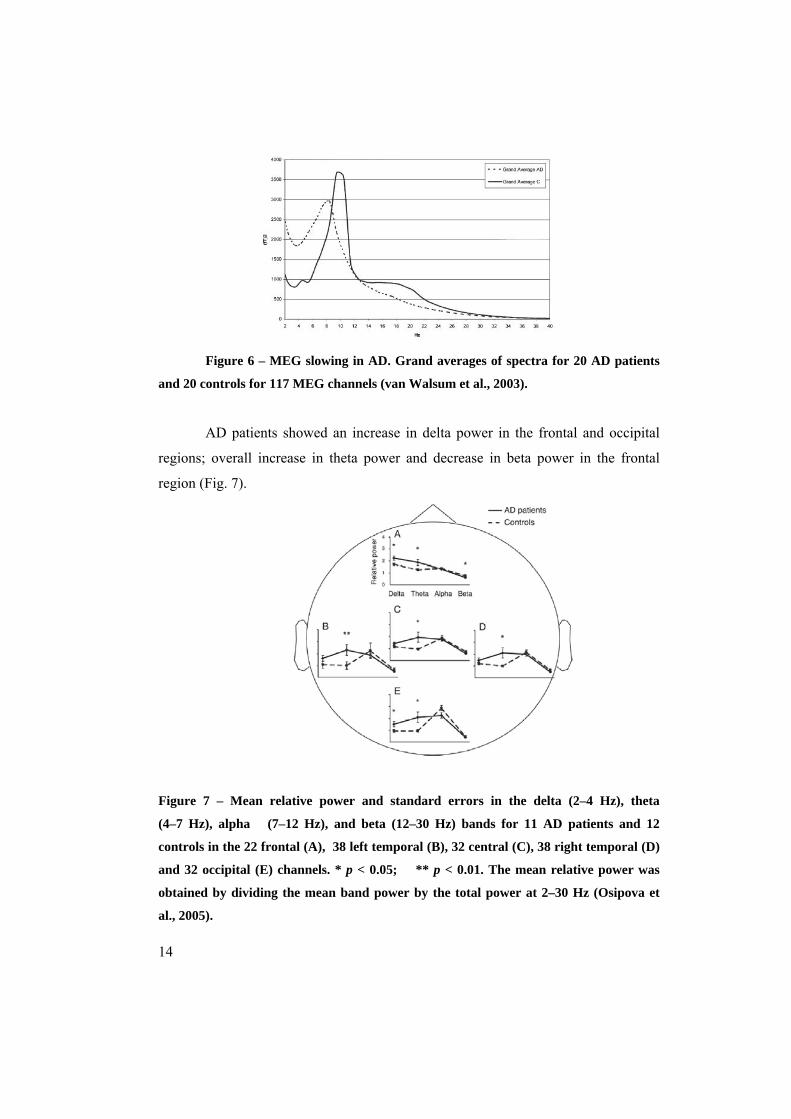
Figure 6 – MEG slowing in AD. Grand averages of spectra for 20 AD patients
and 20 controls for 117 MEG channels (van Walsum et al., 2003).
AD patients showed an increase in delta power in the frontal and occipital
regions; overall increase in theta power and decrease in beta power in the frontal
region (Fig. 7).
Figure 7 – Mean relative power and standard errors in the delta (2–4 Hz), theta
(4–7 Hz), alpha (7–12 Hz), and beta (12–30 Hz) bands for 11 AD patients and 12
controls in the 22 frontal (A), 38 left temporal (B), 32 central (C), 38 right temporal (D)
and 32 occipital (E) channels. * p < 0.05; ** p < 0.01. The mean relative power was
obtained by dividing the mean band power by the total power at 2–30 Hz (Osipova et
al., 2005).
14

The EEG and MEG slowing has been correlated with brain atrophy and the
APOE genotype and is likely to be caused by the loss of cholinergic innervation of
the cortex (Riekkinen et al., 1991; Lehtovirta et al., 1996). The desynchronization of
spontaneous oscillations across various brain regions in the waking stage is
associated with the release of acetylcholine (Celesia and Jasper, 1911; Kanai and
Szerb, 1965). Pathological changes in the cholinergic system and the administration
of pharmacological acetylcholine antagonists, by reducing the available
acetylcholine, affect the desynchronization mechanisms and cause an increase of
high amplitude slow-wave activity (Longo, 1966; Vanderwolf and Robinson, 1981).
Transient cognitive deficits caused by the administration of cholinergic
antagonists to healthy subjects are reflected by similar changes in EEG and MEG
signals (Sannita et al., 1987; Neufeld et al., 1994; Osipova et al., 2003).
15

16

2.3 Analysis of resting-state EEG and MEG data
The analysis of EEG and MEG data may be divided into stimulus-driven activity or
intrinsically generated ongoing activity. Stimulus-driven activity leads to
event-related potentials or fields and was not studied in this thesis. Here we focussed
on the classical condition of eyes-closed rest, which is associated with prominent
ongoing or spontaneous oscillations. Resting-state brain activity has also been
studied intensively with metabolic techniques, e.g., PET and fMRI (Fox and Raichle,
2007) or the combination of EEG and fMRI (Mantini et al., 2007). Only little is
known about the functional role of brain activity during rest (Raichle and Mintun,
2006), but the experimental condition has proven useful for clinical studies. The use
of specific tasks aimed at activating brain regions assumed to be involved in AD
might result in abnormally high as well as abnormally low task-related activation
(Pijnenburg et al., 2004; Osipova et al., 2005).
Despite the general acceptance of the notion that synchronous oscillations
present an important mechanism for integrating information processing in the brain
(Singer, 1999), they are only a partial explanation of the relation between brain
dynamics and cognition. Several authors have pointed out that information
processing requires a self-organized dynamical process, whereby synchronous cell
assemblies are continuously being formed and destroyed (Friston, 2000; Breakspear,
2002; Freeman and Rogers, 2002). Each synchronous cell assembly is hypothesized
to be a fragile or "meta-stable" short-lived structure that may represent complex
information; information processing required for cognition then consists of a
succession of such short-lived synchronous cell assemblies exhibiting a scale-free
spatial and temporal behaviour analogous to that of meta-stable patterns formed in
equilibrium systems at the critical point of a phase transition (Beggs. 2007. Phil
Trans R Soc. The criticality hypothesis; Chialvo DR (2007): The brain near the edge.
Cooperative Behavior in Neural Systems: Ninth Granada Lectures. pp 1–12.).
Analytical tools determining the level of synchronization with a high time resolution
are required to study this ‘fragile binding’. Section 2.3.1 presents a brief explanation
17

of some methods for the evaluation of linear and nonlinear statistical dependencies
that have been used in this thesis. A substantial part of this thesis consisted in the
improvement of an algorithm based on generalized synchronization.
Optimal brain function has been suggested to require a suitable balance
between local specialization and global integration of brain activity (Tononi et al.,
1998). A large number of studies have aimed at identifying functional connectivity as
defined by correlations between activity in different brain regions and interpreted this
as a "functional coupling". Only little attention has been paid, however, to the
potential importance of correlations over time, e.g., for ongoing mnemonic processes
during resting-state periods. Spontaneous resting-state activity is characterized by
amplitude modulation of ongoing oscillations in time-scales up to tens of seconds as
indicated by long-range temporal auto-correlations (Linkenkaer-Hansen et al., 2001).
The observed power-law form suggests existence of critical dynamics, supporting the
theory of a critical state in the underlying neuronal network [see e.g. (Bak, 1997;
Chialvo and Bak, 1999; Beggs and Plenz, 2003; Beggs and Plenz, 2004; Abbott and
Rohrkemper, 2007; Mazzoni et al., 2007) (Kinouchi and Copelli, 2006; Levina et al.,
2007; Poil et al., 2008b)]. In fact, the phenomenon of so-called self-organized
criticality has been found in many manifestations of nature. Section 2.3.2 presents
the definitions of different measures that can be used to quantify long-range temporal
correlations (LRTC) in time series.
The measures used to quantify modulation of amplitude can also be used to
follow temporal correlations of functional connectivity levels expressed by
synchronization time series. It has been shown that the level of synchronization
shows considerable fluctuations in healthy subjects (Gong et al., 2003), and that
these fluctuations are affected by a working memory task (Stam et al., 2002a).
Further support for the hypothesis of fluctuating synchronization levels comes from a
study demonstrating nonlinear and non-stationary aspects of coupling in healthy
subjects (Stam et al., 2003a). There seems to be increasing evidence that cognition
depends not exclusively upon synchronization per se, but rather on the dynamics of
synchronization.
18

Evaluation of functional coupling
Review of methods detecting nonlinear statistical dependencies
One key challenge in systems neuroscience is to develop tools to detect when, where,
and how spatially distributed populations of neurons communicate. A large number
of factors contribute to this challenge, e.g., the poor spatial resolution of non-invasive
EEG/MEG data, an often low signal-to-noise ratio, and the fact that the function that
governs the coupling of neuronal assemblies is not known a priori and may include
nonlinear terms. Methods detecting linear statistical dependencies remain the most
commonly used in studies on neuronal interactions; however, the nonlinear terms
may reveal essential aspects of the coupling and require sensitive methods (Fig. 8)
for their detection and quantification (Pereda et al., 2005; Stam, 2005).
Figure 8 – Methods to evaluate linear and nonlinear statistical dependencies across
sensors. Adapted with permission from Onderzoek naar “functionele connectiviteit” met
19

EEG en MEG, oral presentation by C.J. Stam at Medische Natuurwetenschappen, 6-6-
2005.
Correlation is the oldest and most classical measure of interdependencies
between two time series and remains one of the mostly used measures. The
cross-correlation function, between signals normalized to have zero mean and
unit variance and is given by:
xyC
))(tx (ty
∑−
=
+−
=τ
ττ
τN
kxy kykx
NC
1)()(1)(
(1)
where is the total number of samples and N τ the time lag between the signals. The
introduction of the fast Fourier transform (FFT) turned frequency-based measures
increasingly popular. The coherence function gives the linear correlation between
two signals as a function of the frequency. Coherence is a measure of linear phase
correlations in a sliding window. The data set is divided into segments of length
equal to the time resolution wanted and the spectra are estimated by averaging the
periodogram over these segments (Welch, 1967). Coherence spectrum is normally
computed as:
)()(
)()(
2
2
fSfS
fSfk
yyxx
xyxy =
(2)
where ⋅ denotes average over the segments, is the frequency, is the
periodogram and is the coherence. Coherence computation requires a large
number of oscillation cycles to estimate the consistency of linear correlations
between oscillations. The size of the sliding window gives the time resolution.
f S
xyk
To detect statistical interdependencies that are not governed by simple linear
functions methods able to detect nonlinear interdependencies are required. Phase
synchronization in contrast to coherence is not dependent upon the amplitudes of the
signals and can be computed using the Hilbert transform (Tass et al., 1998) or
wavelet analysis (Lachaux et al., 1999). However, the concept of phase makes sense
20

only in oscillatory systems. Neurophysiological signals are often noisy and exhibit
random phase slips, thus the phase-locking condition:
≤−= πφφϕ 2mod)()()(', tmtnt yxmn constant (3)
must be understood in a statistical sense, i.e., as the existence of a preferred value in
the distribution of the relative phase (Rosenblum and Pikovsky, 2001).
Generalized Synchronization
Generalized synchronization is the most general form of interaction between two
dynamical systems, where the state of a response system Y is a function of the state
of the driver system : X )(XFY = (Rulkov et al., 1995). Generalized
synchronization extends the study of coupling between identical systems to systems
with different dynamics. Several algorithms have been proposed to measure
Generalized synchronization defined from a state-space representation of the signals.
One approach is based on cross prediction, i.e., the improvement in the prediction of
knowing X Y (Schiff et al., 1996; Le Van Quyen et al., 1998). More reliable
methods rely on the quantification of how embedding vectors that are close in the
state space of one signal map on to vectors that are also close in the state space of the
other signal, thus requiring the definition of a “critical distance”. The
interdependency measure (S) is sensitive to signals having different amplitudes or
different degrees of freedom (Arnhold et al., 1999; Pereda et al., 2001).
Synchronization likelihood
A novel method referred to as synchronization likelihood (SL) was developed to
solve the dependence of generalized synchronization measures on local power (Stam
and van Dijk, 2002). The lack of a rigorous definition of SL parameters based on the
frequency content of the neurophysiological data and an incomplete understanding of
the influence of the parameter choices on the estimation of the interdependency
21
between signals motivated the introduction of an SL algorithm with explicit
time-frequency priors (Montez et al., 2006) and Publication P1 of this thesis.
Signals are often bandpass filtered in a frequency band of interest: [LF, HF],
before the computation of SL. The computation of SL can be divided into steps that
will be explained in detail in this section: (i) state-space representation; (ii) detection
of recurrences within each channel; (iii) computation of the likelihood of
simultaneous recurrences in the two channels; and finally (iv) repetition of steps i–iii
for different time points.
I. From time series to state-space representations of data: time-delay embedding
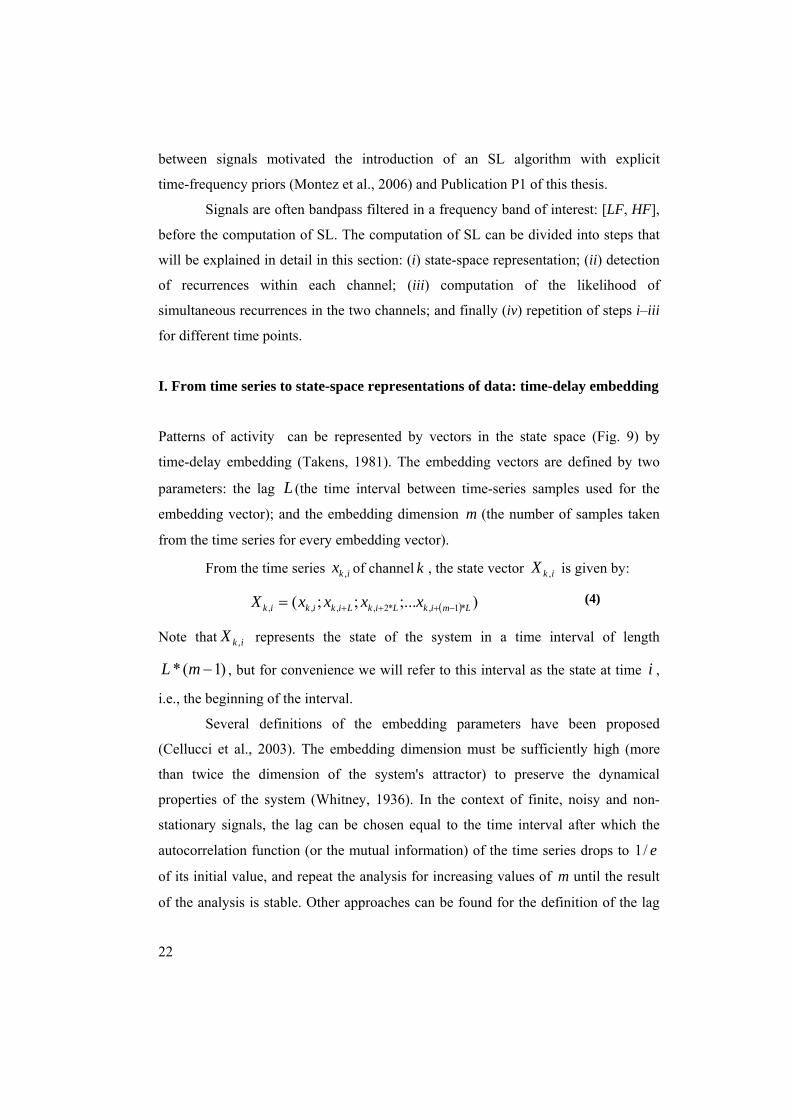
Patterns of activity can be represented by vectors in the state space (Fig. 9) by
time-delay embedding (Takens, 1981). The embedding vectors are defined by two
parameters: the lag (the time interval between time-series samples used for the
embedding vector); and the embedding dimension (the number of samples taken
from the time series for every embedding vector).
Lm
From the time series of channel , the state vector is given by: ikx , k ikX ,
( ) );...;;( *1,*2,,,, LmikLikLikikik xxxxX −+++= (4)
Note that represents the state of the system in a time interval of length
, but for convenience we will refer to this interval as the state at time ,
i.e., the beginning of the interval.
ikX ,
)1(* −mL i
Several definitions of the embedding parameters have been proposed
(Cellucci et al., 2003). The embedding dimension must be sufficiently high (more
than twice the dimension of the system's attractor) to preserve the dynamical
properties of the system (Whitney, 1936). In the context of finite, noisy and non-
stationary signals, the lag can be chosen equal to the time interval after which the
autocorrelation function (or the mutual information) of the time series drops to
of its initial value, and repeat the analysis for increasing values of until the result
of the analysis is stable. Other approaches can be found for the definition of the lag
e/1
m
22
(Rosenstein et al., 1994) and the embedding dimension (Kennel et al., 1992). It has
also been suggested to define the embedding window to be equal to the time after
which the autocorrelation function of the times series becomes zero (Albano and
Rapp, 1993).
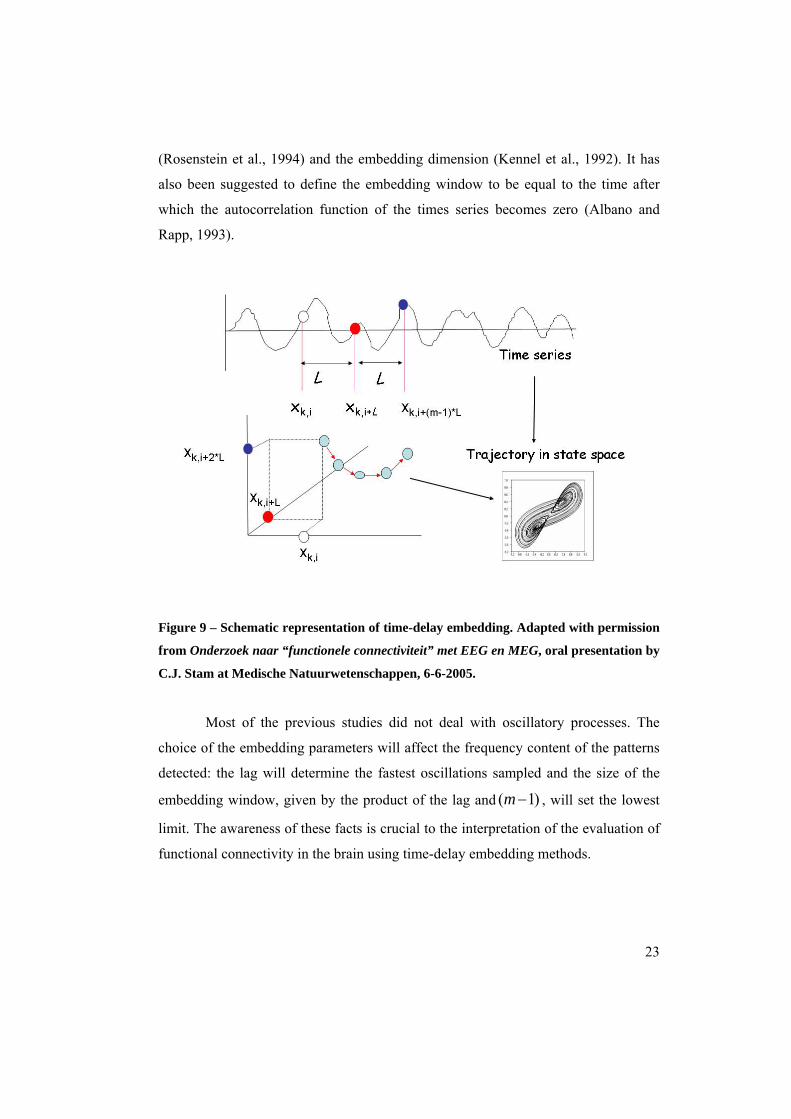
Figure 9 – Schematic representation of time-delay embedding. Adapted with permission
from Onderzoek naar “functionele connectiviteit” met EEG en MEG, oral presentation by
C.J. Stam at Medische Natuurwetenschappen, 6-6-2005.
Most of the previous studies did not deal with oscillatory processes. The
choice of the embedding parameters will affect the frequency content of the patterns
detected: the lag will determine the fastest oscillations sampled and the size of the
embedding window, given by the product of the lag and )1( −m , will set the lowest
limit. The awareness of these facts is crucial to the interpretation of the evaluation of
functional connectivity in the brain using time-delay embedding methods.
23

II. Detection of recurrences of states in two potentially coupled systems
We start by constructing a reference vector in channel A at time i, XA,i. Then we
construct vectors XA,j along the time series at times j inside a time window and
outside a time window (Fig. 10).
2W
1W
Figure 10 - State vectors and SL parameters ( , , , and L m 1W 2W s ) with respect to the
time series of channels A and B. (a) The reference vector of channel A, XA,i was obtained
for m = 3 samples (small ticks) and L = 2 samples (dots). The state vectors (squares) are
defined for times outside W1 and inside W2 and pairs for two time points XA,3 and XB,3
,and XA,7 and XB,7 are marked. The time windows are centred at i. The time series of the
channels are represented by solid horizontal lines and the range of the times of the state
vectors is indicated with a dashed line. The vectors that are closer than the respective
critical distances rA,i and rB,i are represented in white and the vectors that are not within
the respective critical distance are represented in grey. The pair XA,3 and XB,3 is an
example of a simultaneous recurrence. (b) A new reference vector is constructed for
channel A at a time point with an increment s (arrow). The windows W1 and W2 are
centred at i + s and the state vectors close and distant from the reference vector are
represented as in panel a (Montez et al., 2006).
24

1W is defined in order to prevent autocorrelation effects. Finally, we compute the
Euclidean distance to the reference vector. The criterion for considering vectors
close, meaning that they represent recurrences, is defined by the parameter pref equal
to the ratio between the number of vectors considered close and the total number of
vectors. The same procedure is applied to channel B.
The number of vectors considered close, referred to as recurrences, is the
same for both channels and is given by:
refrec pWWn *]1[ 12 +−= (5)
A vector XA,j is considered a recurrence of the reference vector XA,i if its
distance to the reference vector given by jAiA XX ,, − is lower than the critical
distance rA,i. The same is valid for a vector XB,j and the critical distance rB,i. The
introduction of the parameter pref is the key improvement of SL when compared to
the interdependency measure, because the critical distances are allowed to be
different for each channel.
III. Computation of the likelihood (SL) that states recur simultaneously in the
two systems
The times at which the recurrences occur in each channel are obtained and the
number of simultaneous recurrences in both channels is determined:
∑∑+
+=
−
−=
+=2/
2/
2/
2/
2
1
1
2
Wi
Wij
Wi
WijAB nnn
)()( ,,,,,, jBiBiBjAiAiA XXrXXrn −−−−= θθ
(6)
where θ represents the Heaviside function which is equal to one if the argument is
positive or zero and equal to zero if the argument is negative.
A better understanding of the advantages of the introduction of the parameter
pref on the computation of SL can be facilitated by a schematic representation of the
formulas and the mapping of the state vectors from channel A into the state space of
channel B (Fig. 11).
25

Figure 11 – Schematic representation of SL between two channels in terms of state
vectors and critical distances. State vectors of channel A closer to the reference vector
XA,i than the critical distances rA,i are shown inside white ellipses and connected by
lines to state vectors of channel B, XB = F(XA), at the same time points. Two out of four
recurrences of XA,i in channel A are associated with simultaneous recurrences of XB,i in
channel B, whereas the others fall outside the respective critical distance and are
represented inside grey ellipses. Pref is given by the ratio between the number of vectors
close than the critical distance and the total number of state vectors. Pref is the same for
both channels whereas the critical distances are usually different. SL between channel A
and B at time i is given by the ratio between the number of simultaneous recurrences
and the total number of recurrences within channels, which per definition is nrec.
Adapted with permission (Posthuma et al., 2005) and included in P1 (Montez et al.,
2006).
The parameter pref gives the ratio between the state space (strictly speaking
the number of state-space vectors) that are defined by the critical distance to be
closest to the reference vector, and the total state space (i.e., all state-space vectors).
Generalized synchronization occurs when the state vectors at times j that are close to
the reference vector in channel A are “mapped” into the state space of channel B, i.e.,
if recurrences of the references vector in channel A appear at the same times that
recurrences of the reference vector of channel B appear in channel B (Fig. 10). SL is
an index of the likelihood that recurrences of a reference state in channel A at certain
26

time points are associated with recurrences of a reference state in channel B at those
same time points.
SL is given by the ratio between the number of simultaneous recurrences and
the total number of recurrences in each channel, which per definition is nrec.:
rec
ABi n
nSL = (7)
Note once more that the value of SL for a time point i is a measure of the
synchronization between the two channels based on the simultaneous repetition of
states, represented by state vectors, within a time window of length W2.
IV. Computation of SL for different time points
In order to obtain an SL time series, new reference vectors are constructed along the
time series of the channels and the previous steps are repeated. The sampling
frequency of SL is given by the ratio between the sampling frequency of the raw data
and the time increment s. It is important to acknowledge that the temporal resolution
of SL is high in the sense that SL values can vary dramatically from one reference
time point to another, but that the time resolution is low in the sense that each SL
value refers to the temporal structure of the signals in a window of length W2, which
is usually several orders of magnitude larger than the time increment s.
A conservative definition of s equal to one sample will lead to longer
computational processing time and possibly redundant information, because the same
states might be represented by several reference vectors, though it is the
recommended procedure as it is the safest choice.
Boundary conditions must be taken into consideration, because it is not
possible to fit a window W2/2 on both sides of reference vectors at the beginning and
at the end of the time series of data. In Publication P1, we dealt with this issue in a
very pragmatic way as described in section 4.3 of this thesis.
27

Temporal correlations as an index of memory
In the previous section, we outlined recent developments for identifying correlations
between neuronal signals obtained from different sensors or brain regions with the
aim of revealing so-called "functional connectivity"—a coupling of activity that is
thought to be crucial for parallel processing. Brain activity, however, may also be
highly organized over time and it is therefore expected that a quantitative analysis of
correlations in EEG/MEG signals on multiple time scales may reveal important
information about the functional organization of the underlying neuronal networks
(Linkenkaer-Hansen et al., 2005). Indeed, it has been observed that the amplitude
envelope of neural oscillations exhibits a slow power-law decay of autocorrelations
up to several tens of seconds, indicating that these rhythms carry a memory of their
own dynamics (Linkenkaer-Hansen et al., 2001; Nikulin and Brismar, 2004). Further,
LRTC are stronger in the vicinity of epileptic zones (Parish et al., 2004; Monto et al.,
2007) and are influenced by genes (Linkenkaer-Hansen et al., 2007). Here we shall
learn about the putative relevance of self-organized criticality for understanding the
temporal correlation properties in ongoing oscillations.
Self-Organized Criticality: An explanation of Noise f/1
The title of this chapter was taken from the paper introducing the self-organized
criticality (SOC) theory (Bak et al., 1987). The authors used the dynamical response
of a sandpile to small random perturbations to hypothesize about an explanation for
the scale invariance observed in different manifestations of nature (Bak, 1997;
Buchanan, 2000). The randomness of the perturbations introduced to the system,
driving it to the critical state, reflects the feature of the ‘self-organization’ being an
‘internal’ phenomenon. The ‘criticality’ is characterized by spatial and temporal
correlations of a power-law form, meaning that the system is scale-free, i.e., that
event sizes are broadly distributed. SOC has been proposed as an explanation for
28

fractal structures observed in systems as diverse as earthquakes (Bak et al., 2002;
Turcotte and Malamud, 2004; Lippiello et al., 2005); forest fires (Malamud et al.,
1998; Turcotte and Malamud, 2004); financial markets (Mantegna and Stanley, 1995;
Lux and Marchesi, 1999; Bartolozzi et al., 2005); avalanches in rice piles (Frette et
al., 1996; Aegerter et al., 2003); epidemics (Rhodes and Anderson, 1996); evolution
(Bak and Sneppen, 1993; Sneppen et al., 1995; Paczuski et al., 1996); solar flares
(Charbonneau et al., 2001; Paczuski and Hughes, 2004); open source software
evolution (Nakakoji et al., 2002; Wu, 2006) and, more important in the context of
this thesis, also in neuronal activity (Jung et al., 1998; Linkenkaer-Hansen et al.,
2001; Chialvo, 2004; de Arcangelis et al., 2006; Beggs, 2007; Plenz and Thiagarajan,
2007). In the next section, methods for the evaluation of the presence of SOC will be
described and the range of time scales at which the temporal correlations are
estimated will be clarified.
Assessment of long-range temporal correlations in time series
If the autocorrelation function (ACF) of a stationary stochastic process in discrete time kξ with 0=kξ and 22 σξ =k , where denotes ensemble average, given
by:
nkknC += ξξ)( (8)
scales with the lag as: nγ−nnC ~)( (9)
for large , where n 10 << γ , then the process is long-range correlated (Beran, 1994).
The power spectrum is defined as (Chatfield, 1989):
∑∞
=
+=1
)2cos()(2)0()(n
fnnCCfP π (10)
and, in the presence of scaling of the ACF, given by:
)2cos(2)(1
fnnfPn
πγ∑∞
=
−≈ (11)
29

For small we get a power-law form: f
βffP 1)( =
(12)
where β is the power spectrum density (PSD) exponent.
In order to meaningfully apply detrended fluctuation analysis (DFA) to ongoing oscillations, we focus on their amplitude modulations. Thus, first we bandpass filter and extract the amplitude envelope, W , using the Hilbert transform (Fig. 13 B, thick line). The mean value of the amplitude envelope is then subtracted and the cumulative sum is computed:
( )∑=
−=t
t
WtWty1
'
'
)()( (13)
The resulting vector is then divided into time windows of size y τ and in each window the local trend computed by a least-square fit is subtracted (Fig. 12). Finally, the average fluctuation is evaluated as the average root-mean-square:
)(tyτ
ατ ττ ≈−= ∑
=
N
t
tytyN
F1
2))()((1)( (14)
The DFA exponent (α ) is 0.5 for an uncorrelated signal; ranges from 0.5
and 1 for power-law correlated signals; and if α is above 1 the correlations are not
ruled by power-scaling. For timescales larger than the period of repetition the DFA
exponent will be zero, whereas anti-correlations are characterized by values between
0 and 0.5 (Peng et al., 1995).
The relationship between the DFA exponent (α), the PSD exponent (β), and
the autocorrelation function exponent (γ) is given by (Rangarajan and Ding, 2000):
22
21 γβα −
=+
= (15)
Whereas PSD analysis is particularly suited for identifying the presence of
characteristic scales, DFA (Peng, et al. 1994) provides greater accuracy in estimating
temporal (auto-)correlations when the amount of data available is limited (Gao, et al.
30

2006), which is particularly important at long time scales. Notice that DFA will give
an incorrect estimation of correlations in the presence of sharp artefacts.
Figure 12 – DFA computation steps. The mean value of the signal is subtracted (A). The
cumulative sum is computed (B). A time window with a certain length is selected from
the integrated signal, a least-square line is fitted (C) and the linear trend is subtracted
(D). The average of the root-mean-square fluctuation of the entire integrated and
detrended signal is computed for that time scale and plotted in double logarithmic
coordinates (arrow in E). The procedure starting in C is repeated for several window
sizes to obtain the other data points in the plot (E). The power-law exponent is given by
the slope of the line fitted within the indicated (arrowheads) bounds
(Linkenkaer-Hansen et al., 2001).
31

Branching processes and brain oscillations
Critical networks may be simulated by ensuring that the average ratio of current to
past activity, as expressed by the so-called branching ratio (σ), is close to one
(Chialvo, 2006). Networks with a branching ratio larger than one are termed
super-critical, whereas a ratio smaller than one prevents activity to propagate far in a
so-called sub-critical network. In model networks with probabilistic activity
propagation, the branching ratio corresponds to the average number of units activated
by each active unit per time step and it has been observed that values not far from
one as 1.06 and 0.96 are sufficient to induce, respectively, super-critical and
sub-critical dynamics (Poil et al., 2008a).
The authors used MEG signals to introduce a novel method based on the
definition of the duration or so-called ‘life-time’ of an oscillation burst as the time
that the amplitude envelope after bandpass filtering and Hilbert transform remains
above its median level (Fig. 13).
Figure 13 – Definition of the life-time of an oscillation burst. The MEG signal (A) is
band-pass filtered in the frequency band of interest (thin line, B) and the amplitude
envelope of the oscillations (thick line, B) is extracted with the Hilbert transform. The
life-times of the bursts (shadowed) are defined by the length of the time intervals the
amplitude envelope stays above a threshold (horizontal dashed line, B) defined as the
median amplitude. C) On larger times scales the signal exhibits an oscillatory burst
structure (Poil et al., 2008a).
32

Probability distributions of life-times decaying in a power-law form on time
scales of 153–893 ms were found in spontaneous alpha oscillations in all subjects
considered in the study measured by representative parietal and right sensorimotor
channels. The same approach was used in the Publication P3 of this thesis.
The power-law exponents (slope in double-logarithmic coordinates) obtained
for the life-times in the super-critical and sub-critical networks were significantly
larger than for the critical network. Similar life-time exponents were found for the
MEG channels in the sensorimotor and parietal regions and were not correlated with
amplitude, indicating that the duration and amplitude of oscillations provide
complementary indices of the underlying physiological process. Temporal
correlations in time scales only up to the length of the longest avalanche were found
in a model network with critical connectivity, whereas temporal correlations on time
scales corresponding to several burst events could be observed in spontaneous alpha
oscillations recorded with MEG. The authors speculate that temporal patterning on
longer time scales are dependent also on mechanisms of sub-cortical modulation
(Steriade 1990), or other mechanisms involved in slowly varying cortical excitability
(Vanhatalo 2004), or activity-dependent plasticity (Marder and Goaillard 2006, van
Ooyen 1994, Zhang and Linden 2003). Interestingly, there may be a relationship
between the fractal temporal structure of oscillation amplitude and hemodynamic
changes observed with fMRI (Bullmore 2004, Maxim 2005). Life-times,
characterizing amplitude dynamics on short to intermediate time scales (< 1s), and
DFA exponents, reflecting the temporal structure of tens of oscillations bursts, were
significantly correlated in the sensorimotor region, but showed only a trend in
parietal channels. The new life-time approach for the study of ongoing oscillations
provides a more straightforward interpretation of changes in the temporal structure of
oscillations than that of LRTC as indexed with the DFA algorithm.
Dynamical systems exhibiting SOC or 1/f power spectra are often said to
have "memory", because fluctuations on many time scales are exhibiting a degree of
dependence. In Publication P3 we investigated the intriguing possibility that this
"physiological memory" would be important for cognitive memory and impaired in
AD patients. Several studies, however, have shown that a modulation of oscillation
33
amplitudes on time scales of seconds occurs during working memory tasks in several
frequency bands and brain regions, which provides an additional rationale for
implementing indices of oscillation life-time in the study of AD as we did in
Publication P3. Some of these studies are summarized below.
Oscillations are amplitude modulated on time scales of seconds in working-
memory tasks
Modulation of the amplitude of oscillations during working memory tasks has been
reported on several studies for several frequencies bands and brain regions. The
amplitude of theta oscillations measured with EEG in the frontal midline increased
with load in a ‘n-back’ working memory (WM) task, whereas alpha activity in the
posterior region decreased (Gevins, 1997). In a ‘n-back’ task the subjects are
presented with a continuous stream of items and have to indicate whether the probe
matches the element presented n positions back. Measurements of intracranial EEG
(iEEG) during a Sternberg working memory task revealed sustained theta activity
during the entire duration of the trials, with an increase of power with the increase of
the number of elements for a subdural electrode in the parietal cortex and a depth
electrode in the left temporal lobe (Raghavachari et al., 2001). In a Sternberg task a
series of items is presented; after a delay period a probe item is shown and subjects
indicate if the probe was on the list. The main advantage of the Sternberg task over
the ‘n-back’ task is the separation in time of the encoding, retention and retrieval.
When consonants (meaningful linguistic units) are used as items the task is
considered a verbal working memory task (Baddeley, 1986). Sustained theta activity
was also obtained in a MEG study using a similar WM task in a frontal brain region
(Jensen et al., 2002). In addition an increase of the alpha amplitude was found with
the increase of the number of items.
34

Temporal correlations of synchronization levels
Synchronization likelihood time-series obtained from EEG recordings of
spontaneous activity during resting-state show a complicated structure (Stam and de
Bruin, 2004).
The fluctuations observed at short time scales are a result of the high
temporal resolution of the SL reflected in the ability to detect sharp changes of
coupling between nonlinear systems. Though each value of the SL time series
represents the degree of simultaneous repetition of patterns in two channels over a
considerable long time window, the adaptive nature of SL allows consecutive
reference vectors to be completely different and represent distinct dynamical states.
The algorithm of DFA can be used to quantify the extent to which the
temporal structure of the SL time series differ from a random signal. This approach
was pursued in Publication P4.
35

36

3. Aims of the study
The aim of this thesis was to investigate the complex spatio-temporal dynamics of
brain activity in patients with Alzheimer's disease and healthy control subjects, using
whole-head electro- or magnetoencephalographic recordings and novel algorithms.
The specific goals of each study were:
P1:
To develop and validate a "synchronization likelihood" algorithm for quantifying
generalized synchronization, which is logically defined with respect to the time-
frequency information of the signals of interest.
P2:
To assess resting-state functional connectivity in AD with TF-SL and to compare the
results obtained with this measure able to detect nonlinear dependencies with the
ones obtained with coherence.
P3:
To test the hypothesis that physiological memory as indexed by temporal correlations
in ongoing alpha oscillations is related to cognitive memory and, therefore, impaired
in AD.
P4:
To evaluate if the DFA exponent, as a measure of the complex temporal structure of
Synchronization Likelihood time series, could be used as a biomarker for AD.
37

38

4. Materials and Methods
4.1 Subjects
For P1 EEG data of an epileptic patient showing an absence seizure was
used.
The subjects studied in P2, P3 and P4 were chosen from databases of the
Alzheimer Centre of the VU University Medical Center. Patients were diagnosed
with probable AD according to the NINCDS-ADRDA criteria (McKhann, 1984). For
P2, we selected 18 patients (mean age 72.1 ± SD 5.6 years; 11 males) and 18 healthy
control subjects (69.1 ± 6.8 years; 7 males). In P3, we included 19 patients
(73.9 ± 6.4 years; 11 males) and 16 healthy control subjects (70 ± 6.2 years;
7 males). In P4, we studied 24 patients (76.3 ± 7.8 years; 9 males) and
19 non-demented subjects with subjective memory complaints (76.1 ± 6.7 years;
9 males).
4.2 Recordings
During all the recordings the subjects sat comfortably, in sound attenuated
and dimly lit environments, and were instructed to close their eyes. For P1, EEG data
were acquired at 500 Hz with an OSG Brain Lab ® digital system with an common
average reference electrode, involving all electrodes except Fp2 and Fp1. For P4,
data was acquired at 200 Hz with a Nihon Kohden digital EEG apparatus (EEG
2100) against C3-C4. For P1 and P4, the impedance of the electrodes at 10-20
39

positions was kept below 5 kΩ. For P2 and P3, signals were acquired inside a
magnetically shielded room (Vacuumschmelze GmbH, Hanau, Germany) using a
151-channel MEG system (CTF Systems Inc., Vancouver, Canada) at 625 Hz and
band-pass filtered from 0.25 to 125 Hz. The head position relative to the coordinate
system of the helmet was measured at the beginning and at the end of each recording
by leading small alternating currents through three head position coils placed at left
and right pre-auricular and nasion sites. Head position changes up to approximately
1.5 cm were accepted.
4.3 Data Analysis
In P1, the EEG signals of channels F7 and F8 were down-sampled off-line to
100 Hz and band-pass filtered with a 4th order Butterworth filter in the band 3-20 Hz.
SL was computed with the set of parameters used in previous studies (L=10 samples,
m=10 samples, W1=100 samples, W2/2=10% of the length of the data set and
pref=0.01) and with embedding parameters defined with time-frequency priors (TF),
the lag (L) as:
HFfsL
*3=
(16)
where fs is the sampling frequency and HF the highest frequency; and the embedding
dimension (m) as:
1*3+=
LFHFm
(17)
where LF is the lowest frequency (giving: L=1/fs=0.01 s, m=21/fs=0.21 s and
W1=40/fs=0.4 s).
The window W1 was defined as twice the length of the embedding vectors:
)1(**21 −= mLW (18)
This definition of W1 was considered safe since it is well known that neuronal
activity transients may emerge or fade away within one oscillation cycle (Palva et al.,
2005b).
40

The same pref was used and we chose W2=10 s in order to get 10 recurrences.
A window W2/2 was discarded from the beginning and the end of the raw data. SL
and TF-SL were computed for two distances between references vectors s=1/fs and
s=20/fs.
To study signals using coherence based on the Welch method, the windows
are required to contain at least three periods of the lowest frequency and an overlap
of half the size is advised; for a LF = 3 Hz (three periods ~ 1 s) the use of a window
of 5 s = W2/2 was appropriate. The time-frequency coherence was averaged in the
3–20 Hz frequency band and compared to TF-SL.
Unidirectionally coupled Hénon system time series were computer-generated
with a total length of 4000 samples and different values of the coupling parameter
(C) in a window between samples 1500 and 2500 (C was zero elsewhere). The power
spectrum of the simulated data was computed to determine the frequencies of interest
(9–16 Hz) and the TF embedding parameters (L=2/fs, m=7/fs, fs=100 Hz). SL and
TF-SL were computed for all the time series and the mean value within the window
where the signals were coupled was determined for each of the coupling strength.
In P2, the MEG data were down-sampled off-line to 312.5 Hz and zero-phase
lag filtered for the frequency bands: delta (0.5–4 Hz), theta (4–8 Hz), alpha1
(8–10 Hz), alpha2 (10–13 Hz), beta (13–30 Hz) and gamma (30–45 Hz). SL was
computed with TF parameters for all pair-wise combinations of the channels and
averaged over three artefact-free visually selected epochs of 13,083 s for each subject
and over groups of channels representing long distance intra- and inter-hemispheric
and short distance connections. Similar analysis was performed with complex
coherency. The cross-correlation was computed for the beta band.
In P3, the MEG signals were down-sampled off-line to 125 Hz, high-passed
filtered at 1 Hz and low-pass filtered at 45 Hz using finite impulse response (FIR)
filters. Non-periodic artefacts were visually selected and removed from the data.
Independent components analysis was performed with EEGLAB (Delorme and
Makeig, 2004) and components representing ECG, eye movements or muscular
artefacts were removed. Bad channels were replaced by the average of their
neighbours and planar synthetic gradiometers were computed using Fieldtrip
41

(Bastiaansen and Knösche, 2000). Bandpass FIR filters (with a Hamming window
and filter order 28) at 6–13 Hz and the Hilbert transform were used to extract the
amplitude envelope of the signal. Detrended fluctuation analysis accurately estimates
the decay of LRTC in time scales of at least 10% of the total length of the signal; for
the 4 min signals, we extracted scaling exponents of the time range of 1–25 s.
Oscillation life- and waiting-times were defined as the length of the intervals where
the amplitude envelope remains above or below the median value and probability
distributions were computed using equidistant binning on logarithmic axis with
10 bins per decade. Visual inspection of probability distributions for parietal
channels determined the least-square fitting time range (119–538 ms) for the
computation of the power-law exponents.
In P4, epochs of 20.475 s were selected by visual inspection to avoid
artefacts, such as eye-blinks, slow eye-movements, excess muscle activity and ECG,
and SL was computed for delta, theta, alpha1, alpha2, beta (defined in the same way
as in P2) and gamma (30–48 Hz) bands with the parameters used in previous studies
(before the introduction of the TF definitions) and a distance s between the reference
vectors of 16 samples / 200 Hz = 0.08 s. DFA was applied to the SL time series and
exponents were computed for times scales of 0.32–10.48 s.
42
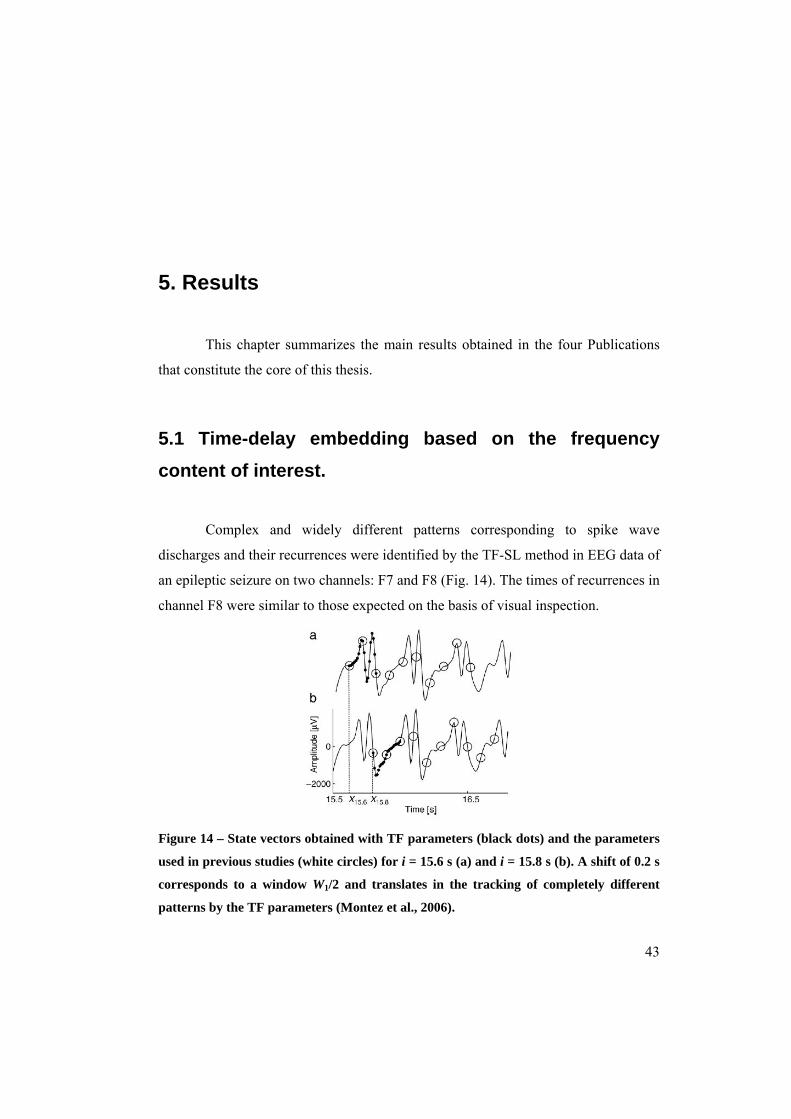
5. Results
This chapter summarizes the main results obtained in the four Publications
that constitute the core of this thesis.
5.1 Time-delay embedding based on the frequency content of interest.
Complex and widely different patterns corresponding to spike wave
discharges and their recurrences were identified by the TF-SL method in EEG data of
an epileptic seizure on two channels: F7 and F8 (Fig. 14). The times of recurrences in
channel F8 were similar to those expected on the basis of visual inspection.
Figure 14 – State vectors obtained with TF parameters (black dots) and the parameters
used in previous studies (white circles) for i = 15.6 s (a) and i = 15.8 s (b). A shift of 0.2 s
corresponds to a window W1/2 and translates in the tracking of completely different
patterns by the TF parameters (Montez et al., 2006).
43

For channel F7, the reference patterns were different from those in channel
F8, but its recurrences occasionally appeared at the same times as the recurrences in
channel F8. At the onset of the seizure, when the channels visually seem to be
synchronized, the TF-SL value increases reflecting the fact that the recurrences are
occurring simultaneously in both channels and drops back at the end of the seizure to
the baseline value it had before the seizure. We have shown that TF-SL is insensitive
to the distance in time between consecutive reference vectors. This study thus gave
empirical evidence for the advantage of TF-SL in tracking the onset and end of an
epileptic seizure on EEG recordings compared to classical coherence.
The time-frequency coherence plot reflects the wide frequency content of the
epileptic activity (Fig. 15).
Figure 15 – Comparison between the classical coherence and TF-SL in the 3–20 Hz
band. (a) The time-frequency coherence plot shows peaks for lower frequencies
(5–10 Hz) around 10 s, higher frequencies (8–14 Hz) around 15 s and for frequencies
above 15 Hz around 12 s. (b) Though the mean value of the classical coherence averaged
in the 3–20 Hz is higher than the TF-SL values; classical coherence do not have a stable
plateau during the seizure (10–20 seconds). The TF-SL increases on the onset of the
seizure until a lower mean value compared to classical coherence and drops back at the
end of the seizure to the baseline value it had before the seizure (Montez et al., 2006).
44

Classical coherence averaged in the same frequency band does not show
stability during the seizure as the TF-SL.
Application to simulated data with manipulated coupling showed that the
TF-SL based choice of the embedding parameters tracks the change of coupling
strength between two unidirectionally coupled Hénon systems.
45

46

5.2 SL revealed loss of long distance intra-hemispheric interactions in the alpha band resting-state oscillations of AD patients measured by MEG.
Alzheimer patients showed a loss of long distance intra-hemispheric
interactions in the alpha1 (8–10 Hz) and beta (13–30 Hz) bands with a focus on left
fronto-temporal/parietal connections as revealed by significant SL group differences
(Figs. 16 e 17). These changes may reflect loss of anatomical connections and/or
reduced cholinergic activity.
Figure 16 – Significantly lower SL in AD patients compared with healthy age-matched
controls in the 8–10 Hz band for long (A) and short (B) distances. Lines correspond to
significant changes of average SL between two regions and squares to significant
changes of local SL. T-tests determined significant changes involving pairs of channels
(arrows) in the left fronto-temporal (p = 0.009), left fronto-parietal (p = 0.012) and the
right fronto-temporal (p = 0.015) regions. A significant (p < 0.01) local decrease of SL
was observed for combinations of right frontal vectors (blue square). (Stam et al., 2006)
Positive correlations were found between mini-mental state exam score
referred to as MMSE score (Folstein et al., 1975) and averaged inter-hemispheric SL
in the alpha1 band (R = 0.727; P = 0.002) and in the beta band (R = 0.688; P = 0.005)
47

indicating that the decreased functional connectivity could underlie the cognitive
impairment.
Coherence was significantly lower between the left fronto-temporal regions,
but only in the beta band (Fig. 17).
Figure 17 – Significant lower (blue) and higher (red) SL (up) and coherence (down) in
AD patients compared with healthy age-matched controls in the 13-30 Hz band. The
structure is the same as in the previous figure (thin line/light square: p < 0.05; thick
line/dark square: p < 0.01). Both SL and coherence are significantly lower between the
left fronto-temporal regions and significantly higher between the left parieto-occipital
and right parieto-occipital regions with a local decrease in the left temporal region and
local increase in the right parietal regions. SL is also significantly lower between the left
fronto-parietal and coherence is locally increased in the left parietal region.
This study showed that both short distance interactions that might underlie
specialization and long distance interactions that might be associated with global
48

integration (Tononi et al., 1998; van Walsum et al., 2003) are impaired in AD. This
may reflect that the necessary balance between local specialization and global
integration is compromised. Further, the study shows that short recordings
(13 seconds of data) of resting-state activity are sufficient to detect AD-associated
changes in large-scale brain networks.
49

50

5.3 Impaired temporal correlations in temporo-parietal oscillations in early-stage Alzheimer’s disease.
A significant decrease in long-range temporal correlations was observed in
AD patients in the alpha band (6–13 Hz) over temporo-parietal regions on time
scales of 1–25 seconds as indexed by the DFA exponents obtained: 0.66 ± 0.01 for
the AD patients and 0.71 ± 0.01 for the controls (Fig. 18). No significant group effect
was found for the amplitude.
Figure 18 – Impaired LRTC in temporo-parietal oscillations in AD for the 6–13 Hz
band. Grand-average plot of a parietal channel for AD patients (red diamonds), control
subjects (blue circles) and an empty-room recording (black dots). (B) The individual
DFA exponents averaged over the 33 channels marked in C with white circles are
significantly lower for AD patients (p < 0.005). Mean ± SEM are represented in the
middle. Grand-average topographies of the DFA exponents (C) and the amplitude (F)
for the AD patients (left), control subjects (middle) and controls minus patients (right).
White circles denote channels with p < 0.05 (open) and p < 0.01 (filled). (D) The
individual peak frequencies in a parietal channel were significantly (p < 0.05) lower for
patients. (E) Individual amplitudes averaged over the 12 channels showing the largest
group difference.
51

Significantly reduced probability for the occurrence of bursts in alpha
oscillations with long life- or waiting-times on shorter time scales (< 1 second) was
found for the AD patients in the same temporo-parietal regions, as indicated by the
respective power-law exponents obtained: life-times exponents of 1.91 ± 0.06 for the
AD patients and 1.68 ± 0.04 for the controls; and waiting-times exponents of
1.77 ± 0.04 for the AD patients and 1.60 ± 0.04 for the controls (Fig. 19).
Figure 19 – Altered life- and waiting-times of temporal-parietal oscillations in AD. The
colour coding and structure are the same as in the previous figure. (A) Grand-average
probability distribution function (PDF) of oscillation life-times. (B) The individual life-
time exponents averaged over the 25 channels marked with white circles in C are
significantly (p < 0.005) higher for AD patients. Grand-average topographies of the
life-time exponents (C), the cumulative life-times at the 95%-percentile (F) and the
waiting-times (I). (D) Cumulative probability distribution function (CDF) of oscillation
life-times. (E) The individual cumulative life-time averaged over the 45 channels
52

marked with white circles in F. (G) Grand-average probability distribution of
waiting-times for channels with a significant group difference. (H) The individual
waiting-times averaged over the 18 channels marked with white circles in I.
The cumulative probability distribution of life-times showed significant
differences at percentiles around 88–100%. The 95%-percentile, e.g., was
383 ± 11 ms for the AD patients and 439 ± 12 ms for the controls. This decrease
reflects the impaired generation of long-lasting oscillations by the disease.
The DFA, life- and waiting-time exponents were not significantly correlated
(data not shown). Thus, the three methods provide complementary indices of
abnormalities in the temporal structure of ongoing oscillations.
53

54

5.4 Disturbed fluctuations of resting state EEG synchronization in Alzheimer’s disease.
Alzheimer’s patients showed a significant decrease in the mean levels of
EEG synchronization for the upper alpha (10–13 Hz) and beta (13–30 Hz) frequency
bands (Fig. 20). These results are in agreement with the results of earlier EEG and
MEG studies (Stam et al., 2002b; Stam et al., 2003b; Babiloni et al., 2004;
Pijnenburg et al., 2004).
Figure 20 – Mean SL of AD patients and subjects with subjective memory complaints
for different frequency bands. Error bars denote standard deviation and p-values
correspond to two-tailed t-test (Stam et al., 2005).
Besides the decreased level of mean synchronization, the impaired functional
connectivity was also indexed by disturbed fluctuations of the synchronization levels,
extending the results obtained for healthy subjects in a previous study to longer time
scales (Stam and de Bruin, 2004).
The study revealed trends for the lower (8–10 Hz) alpha (p = 0.085) and the
beta (p = 0.059) bands in the direction of a smaller DFA exponent in the AD group
compared to the group of subjects with subjective memory complaints (Fig. 21).
55

Figure 21 – Grand-average DFA plots for the AD patients and subjects with subjective
memory complaints for the lower alpha band. For comparison, control white noise
epochs were subjected to the same analysis (filtering, SL computation and DFA). The
exponents obtained had a trend (p < 0.10) in the direction of smaller DFA exponents for
the AD patients than for the subjects with subjective memory complaints (Stam et al.,
2005).
56

6. Discussion
In this thesis, the SL algorithm was improved in P1 in order to account for
the time-frequency content of the recurring patterns in the quantification of
generalized synchronization and validated by tracking recurrences in EEG data of an
epileptic seizure corresponding to those expected by visual inspection. The method
was further applied in P2 to MEG data of AD patients and a decrease of left fronto-
temporal and fronto-parietal resting-state functional connectivity was found in the
lower alpha (8–10 Hz) band, whereas no significant differences were found in this
band with coherence. DFA of MEG data from AD patients (P3) revealed a decrease
in LRTC on time scales of 1–25 seconds in ongoing alpha oscillations (6–13 Hz),
corroborating the hypothesis that physiological memory may be important for
cognitive memory. Finally, DFA of SL time series obtained from resting-state EEG
data (P4) resulted in trends towards smaller exponents for the AD patients than for
subjects with subjective memory complaints for the lower alpha (8–10 Hz) and beta
bands showing that the complexity of SL time series may capture differences in the
spatio-temporal dynamics of oscillatory activity in these two groups.
6.1 Physiology of recurrent patterns in neuronal activity
Synchronization likelihood may become an important tool in cognitive
research due to the ability to detect linear and nonlinear interactions between brain
regions. SL may be used to study ongoing data since it automatically detects
recurrences without a priori assumptions regarding the times of interactions. SL may
57

be a valuable algorithm for testing whether generalized synchronization is an
important phenomenon in the human brain. Since the existence of recurrences is the
assumption for studying generalized synchronization, it is recommended that special
attention is paid to the visual inspection of patterns picked up by the algorithm as
well as the temporal distribution of the occurrence of recurrences. SL is based on the
search for a constant number of most similar patterns that represent the system at the
same state in different time intervals. In some situations the method might pick up
only random noise or recurrences representing the stability of the system in a certain
state as opposed to the situation when the system comes back to a certain state after
being in a different one.
Very similar patterns in neighbouring channels might be the result of volume
conduction effects rather than synchronization. Strategies to avoid this situation
should be considered in the decision of a SL analysis framework, though classical
correlation analysis based on coherence suffers from the same problem. An option
might be the use of source modelling, having the advantage of decreasing the
computational time. It is in my opinion, a better option to look in more detail into
pair-wise combination of sources, rather than computing SL for a large number of
sensors and average the obtained time series over brain regions. Besides sparing time
spent with redundant computations, i.e., computing SL for pairs of channels that
reflect the same brain sources, the source approach would allow for visual inspection
of the recurrent patterns and their temporal distribution as suggested above, which
may reduce the probability of averaging out differences between groups of healthy
controls and patients at specific channel combinations [that's what you mean?] and
would bring advantages for the comparison between results obtained using MEG
systems with axial or planar gradiometers. A deeper knowledge of the recurrent
patterns possibly present in ongoing brain data would strengthen the interpretation of
SL results and is likely to motivate a wider application of the algorithm.
58

6.2 The role of alpha oscillations
Several decades after the discovery of the so-called alpha activity there is
still no consensus on the functional role of these oscillations and little is known about
their mechanism of generation (Steriade, 2000). The initial idea that alpha
oscillations were important for the maintenance of an ‘idling’ state of the brain
(Adrian 1934) was based on attenuation by eye opening, visual stimuli and by
increased attentiveness. An inhibition theory suggesting that alpha activity prevents
flow of information into other active areas has become increasingly popular
(Klimesch et al., 2007). A competing hypothesis is that not only alpha but
simultaneous alpha, beta and gamma oscillations are directly involved in the
selection and maintenance of neuronal object representation during working memory,
perception and consciousness (Palva and Palva, 2007). In fact alpha
desynchronization has been found to be accompanied by beta desynchronization and
alpha synchronization by beta synchronization (Pfurtscheller and Klimesch, 1992).
Definition of “lower” and “upper” alpha and AD slowing
The definition of a lower alpha defined in the frequency band
8–10 Hz and an upper alpha of 10–13 Hz, used in Publications P2 and P4 of this
thesis, was based on the definition by Klimesch that associated the lower alpha to
attention and upper alpha (10–12 Hz) to stimulus encoding and long term memory
processes (Klimesch, 1996). Differential reactivity of lower and upper alpha band
may, however, also reflect differential involvement of alpha from different
anatomical locations, because alpha activity from posterior sites tends to have a
higher frequency than that of anterior sites (Hari and Salmelin, 1997; Klimesch et al.,
2000). For P3, the alpha band was defined as a broad band from 6 to 13 Hz in order
to include the peaks of the AD patients that were shifted to lower frequencies and
thus avoid amplitude confounds on the DFA analysis.
59

6.3 Conclusion and Outlook
Longitudinal studies may give an important contribution to the evaluation of
candidate Alzheimer’s disease biomarkers, because they allow for tracking the
evolution of the biomarker from a healthy value for that individual to normal aging
or disease value and, thus, are not confounded by genetic variability. Genetic
variance is presumably a leading cause for why several candidate biomarkers, e.g.,
based on blood tests, MRI or EEG, have not yet achieved a sensitivity that allows for
diagnostic use. Another interesting avenue to explore in future studies is the power of
the presented biomarkers to track the effects of medication, which should also be
done in a longitudinal fashion by comparing biomarker values of the same patients
before treatment started.
60

References Abbott LF, Rohrkemper R (2007) A simple growth model constructs critical
avalanche networks. Prog Brain Res 165:13-19. Aegerter CM, Günther R, Wijngaarden RJ (2003) Avalanche dynamics, surface
roughening, and self-organized criticality: Experiments on a three-dimensional pile of rice. Physical Review E 67:51306.
Albano AM, Rapp PE (1993) On the reliability of dynamical measures of EEG signals. The 2nd Annual Conference on Nonlinear Dynamics Analysis of the EEG, World Scientific, Singapore:117–139.
Amari S, Cichocki A, Yang HH (1996) A new learning algorithm for blind signal separation. Advances in Neural Information Processing Systems 8:757–763.
American Psychiatric Association (1987) Diagnostic and Statistical Manual of Mental Disorders, 3rd edition, revised. Washington, DC.
Arnhold J, Grassberger P, Lehnertz K, Elger CE (1999) A robust method for detecting interdependences: application to intracranially recorded EEG. Physica D: Nonlinear Phenomena 134:419-430.
Babiloni C, Ferri R, Moretti DV, Strambi A, Binetti G, Dal Forno G, Ferreri F, Lanuzza B, Bonato C, Nobili F, Rodriguez G, Salinari S, Passero S, Rocchi R, Stam CJ, Rossini PM (2004) Abnormal fronto-parietal coupling of brain rhythms in mild Alzheimer's disease: a multicentric EEG study. Eur J Neurosci 19:2583-2590.
Baddeley AD (1986) Working memory. Oxford, UK: Clarendon. Bak P (1997) How nature works: The science of self-organized criticallity. Oxford:
Oxford. Bak P, Sneppen K (1993) Punctuated equilibrium and criticality in a simple model of
evolution. Physical Review Letters 71:4083-4086. Bak P, Tang C, Wiesenfeld K (1987) Self-organized criticality: An explanation of the
1/f noise. Physical Review Letters 59:381. Bak P, Christensen K, Danon L, Scanlon T (2002) Unified Scaling Law for
Earthquakes. Physical Review Letters 88:178501. Bartolozzi M, Leinweber DB, Thomas AW (2005) Self-organized criticality and
stock market dynamics: an empirical study. Physica A: Statistical Mechanics and its Applications 350:451-465.
Bastiaansen MCM, Knösche TR (2000) Tangential derivative mapping of axial MEG applied to event-related desynchronization research. Clinical Neurophysiology 111:1300-1305.
Beggs JM (2007) The criticality hypothesis: how local cortical networks might optimize information processing. Philos Transact A Math Phys Eng Sci.
Beggs JM, Plenz D (2003) Neuronal Avalanches in Neocortical Circuits. J Neurosci 23:11167-11177.
Beggs JM, Plenz D (2004) Neuronal Avalanches Are Diverse and Precise Activity Patterns That Are Stable for Many Hours in Cortical Slice Cultures. Journal of Neuroscience 24:5216-5229.
61

Bell AJ, Sejnowski TJ (1995) An Information-Maximization Approach to Blind Separation and Blind Deconvolution. Neural Computation 7:1129-1159.
Beran J (1994) Statistics for Long-Memory Processes: Chapman & Hall/CRC. Berendse HW, Verbunt JPA, Scheltens P, van Dijk BW, Jonkman EJ (2000)
Magnetoencephalographic analysis of cortical activity in Alzheimer's disease: a pilot study. Clinical Neurophysiology 111:604-612.
Berger H (1929) Über das Elektroenkephalogramm des Menschen. Arch Psychiatr Nervenkr 87:527-570.
Boerman RH, Scheltens P, Weinstein HC (1994) Clinical neurophysiology in the diagnosis of Alzheimer's disease. Clin Neurol Neurosurg 96:111-118.
Braak E, Griffing K, Arai K, Bohl J, Bratzke H, Braak H (1999) Neuropathology of Alzheimer's disease: what is new since A. Alzheimer? European Archives of Psychiatry and Clinical Neuroscience 249:14-22.
Braak H, Braak E, Bohl J (1993) Staging of Alzheimer-related cortical destruction. European neurology 33:403-408.
Breakspear M (2002) Nonlinear phase desynchronization in human electroencephalographic data. Human Brain Mapping 15:175-198.
Buchanan M (2000) Ubiquity. London. Buckner RL (2004) Memory and Executive Function in Aging and AD: Multiple
Factors that Cause Decline and Reserve Factors that Compensate. Neuron 44:195-208.
Buzsaki G (2006) Rhythms of the Brain. Oxford University Press. Buzsaki G, Draguhn A (2004) Neuronal Oscillations in Cortical Networks. Science
304:1926-1929. Cardoso JF, Souloumiac A, Paris T (1993) Blind beamforming for non-Gaussian
signals. Radar and Signal Processing, IEE Proceedings F 140:362-370. Celesia GG, Jasper HH (1911) Acetylcholine released from cerebral cortex in
relation to state of activation. Neurology 1966:1053-1063. Cellucci CJ, Albano AM, Rapp PE (2003) Comparative study of embedding
methods. Physical Review E 67:66210. Charbonneau P, McIntosh SW, Liu HL, Bogdan TJ (2001) Avalanche models for
solar flares (Invited Review). Solar Physics 203:321-353. Chatfield C (1989) The Analysis of Time Series: An Introduction, 4th ed. London:
Chapman & Hall. Chialvo DR (2004) Critical brain networks. Physica A: Statistical Mechanics and its
Applications 340:756-765. Chialvo DR (2006) Psychophysics: Are our senses critical? Nature Physics 2:301-
302. Chialvo DR (2007) The brain near the edge. Cooperative Behavior in Neural
Systems: Ninth Granada Lectures:1-12. Chialvo DR, Bak P (1999) Learning from mistakes. Neuroscience 90:1137-1148. Coben LA, Danziger WL, Berg L (1983) Frequency analysis of the resting awake
EEG in mild senile dementia of Alzheimer type. Electroencephalogr Clin Neurophysiol 55:372-380.
de Arcangelis L, Perrone-Capano C, Herrmann HJ (2006) Self-Organized Criticality Model for Brain Plasticity. Physical Review Letters 96:28107.
62
Delorme A, Makeig S (2004) EEGLAB: an open source toolbox for analysis of single-trial EEG dynamics including independent component analysis. Journal of Neuroscience Methods 134:9-21.
Fernandez A, Hornero R, Mayo A, Poza J, Gil-Gregorio P, Ortiz T (2006) MEG spectral profile in Alzheimer's disease and mild cognitive impairment. Clinical Neurophysiology 117:306-314.
Fernandez A, Arrazola J, Maestu F, Amo C, Gil-Gregorio P, Wienbruch C, Ortiz T (2003) Correlations of Hippocampal Atrophy and Focal Low-Frequency Magnetic Activity in Alzheimer Disease: Volumetric MR Imaging-Magnetoencephalographic Study. AJNR Am J Neuroradiol 24:481-487.
Fernandez A, Maestu F, Amo C, Gil P, Fehr T, Wienbruch C, Rockstroh B, Elbert T, Ortiz T (2002) Focal temporoparietal slow activity in Alzheimer's disease revealed by magnetoencephalography. Biol Psych 52:764-770.
Folstein MF, Folstein SE, McHugh PR (1975) "Mini-mental state": A practical method for grading the cognitive state of patients for the clinician. J Psych Res 12:189-198.
Fox MD, Raichle ME (2007) Spontaneous fluctuations in brain activity observed with functional magnetic resonance imaging. Nature Rev Neurosci 8:700-711.
Fox NC, Crum WR, Scahill RI, Stevens JM, Janssen JC, Rossor MN (2001) Imaging of onset and progression of Alzheimer's disease with voxel-compression mapping of serial magnetic resonance images. The Lancet 358:201-205.
Frank R, Hargreaves R (2003) CLINICAL BIOMARKERS IN DRUG DISCOVERYAND DEVELOPMENT. NATURE REVIEWS| DRUG DISCOVERY 2:567.
Freeman WJ, Rogers LJ (2002) Fine Temporal Resolution of Analytic Phase Reveals Episodic Synchronization by State Transitions in Gamma EEGs. Journal of Neurophysiology 87:937-945.
Frette V, Christensen K, Malthe-Soerenssen A, Feder J, Joessang T, Meakin P (1996) Avalanche dynamics in a pile of rice. Nature 379:49-52.
Fries P (2005) A mechanism for cognitive dynamics: neuronal communication through neuronal coherence. Trends Cogn Sci 9:474-480.
Friston KJ (1994) Functional and effective connectivity in neuroimaging: A synthesis. Hum Brain Mapp 2:56-78.
Friston KJ (2000) The labile brain. I. Neuronal transients and nonlinear coupling. Philosophical Transactions of the Royal Society B: Biological Sciences 355:215-236.
Gevins A (1997) High-resolution EEG mapping of cortical activation related to working memory: effects of task difficulty, type of processing, and practice. Cerebral Cortex 7:374-385.
Gong P, Nikolaev AR, van Leeuwen C (2003) Scale-invariant fluctuations of the dynamical synchronization in human brain electrical activity. Neuroscience Letters 336:33-36.
Gordon EB, Sim M (1967) The E.E.G. in presenile dementia. J Neurol Neurosurg Psychiatry 30:285-291.
63

Greicius MD, Krasnow B, Reiss AL, Menon V (2003) Functional connectivity in the resting brain: A network analysis of the default mode hypothesis. Proc Natl Acad Sci USA 100:253-258.
Greicius MD, Srivastava G, Reiss AL, Menon V (2004) Default-mode network activity distinguishes Alzheimer's disease from healthy aging: Evidence from functional MRI. Proc Natl Acad Sci USA 101:4637-4642.
Guevara R, Velazquez JLP, Nenadovic V, Wennberg R, Senjanovic G, Dominguez LG (2005) Phase synchronization measurements using electroencephalographic recordings. NeuroInformatics 3:301-313.
Hämäläinen M, Hari R, Ilmoniemi RJ, Knuutila J, Lounasmaa OV (1993) Magnetoencephalography—theory, instrumentation, and applications to noninvasive studies of the working human brain. Reviews of Modern Physics 65:413-497.
Hardy J, Allsop D (1910) Amyloid deposition as the central event in the aetiology of Alzheimer's disease. Trends Pharmacol Sci 1991:383-388.
Hari R (1999) Magnetoencephalography as a tool of clinical neurophysiology. In: Electroencephalography: Basic Principles, Clinical Applications, and Related Fields. 4th Edition (Niedermeyer E, Lopes da Silva F, eds), pp 1107-1134: Williams & Wilkins.
Hari R, Salmelin R (1997) Human cortical oscillations: a neuromagnetic view through the skull. Trends in Neurosciences 20:44-49.
Helmholtz H (1853) Ueber einige Gesetze der Vertheilung elektrischer Ströme in körperlichen Leitern, mit Anwendung auf die thierisch-elektrischen Versuche (Schluss.). Annalen der Physik 165:353-377.
Hyman BT, Van Hoesen GW, Damasio AR, Barnes CL (1984) Alzheimer's disease: cell-specific pathology isolates the hippocampal formation. Science 225:1168-1170.
Hyvarinen A, Oja E (2000) Independent component analysis: algorithms and applications. Neural Netw 13:411-430.
Jensen O, Gelfand J, Kounios J, Lisman JE (2002) Oscillations in the Alpha Band (9-12 Hz) Increase with Memory Load during Retention in a Short-term Memory Task. Cereb Cortex 12:877-882.
Jeong J (2004) EEG dynamics in patients with Alzheimer's disease. Clinical Neurophysiology 115:1490-1505.
Jonkman EJ (1997) The role of the electroencephalogram in the diagnosis of dementia of the Alzheimer type: an attempt at technology assessment. Neurophysiologie Clinique/Clinical Neurophysiology 27:211-219.
Jung P, Cornell-Bell A, Madden KS, Moss F (1998) Noise-Induced Spiral Waves in Astrocyte Syncytia Show Evidence of Self-Organized Criticality. In, pp 1098-1101: Am Physiological Soc.
Jung T-P, Makeig S, Humphries C, Lee T-W, McKeown MJ, Iragui V, Sejnowski TJ (2000) Removing electroencephalographic artifacts by blind source separation. Psychophysiology 37:163-178.
Kanai T, Szerb JC (1965) Mesencephalic reticular activating system and cortical acetylcholine output. Nature 205:80-82.
64

Karas GB, Scheltens P, Rombouts S, Visser PJ, van Schijndel RA, Fox NC, Barkhof F (2004) Global and local gray matter loss in mild cognitive impairment and Alzheimer's disease. Neuroimage 23:708-716.
Kennel MB, Brown R, Abarbanel HDI (1992) Determining embedding dimension for phase-space reconstruction using a geometrical construction. Physical Review A 45:3403-3411.
Kinouchi O, Copelli M (2006) Optimal dynamical range of excitable networks at criticality. Nature Physics 2:348-351.
Klimesch W (1996) Memory processes, brain oscillations and EEG synchronization. International Journal of Psychophysiology 24:61-100.
Klimesch W, Sauseng P, Hanslmayr S (2007) EEG alpha oscillations: The inhibition-timing hypothesis. Brain Research Reviews 53:63-88.
Klimesch W, Doppelmayr M, Röhm D, Pöllhuber D, Stadler W (2000) Simultaneous desynchronization and synchronization of different alpha responses in the human electroencephalograph: a neglected paradox? Neuroscience Letters 284:97-100.
Lachaux JP, Rodriguez E, Martinerie J, Varela FJ (1999) Measuring Phase Synchrony in Brain Signals. Human Brain Mapping 8:194-208.
Le Van Quyen M, Adam C, Baulac M, Martinerie J, Varela FJ (1998) Nonlinear interdependencies of EEG signals in human intracranially recorded temporal lobe seizures. Brain Research 792:24-40.
Lee TW, Girolami M, Sejnowski TJ (1999) Independent Component Analysis Using an Extended Infomax Algorithm for Mixed Subgaussian and Supergaussian Sources. Neural Computation 11:417-441.
Lehtovirta M, Partanen J, Kononen M, Soininen H, Helisalmi S, Mannermaa A, Ryynanen M, Hartikainen P, Riekkinen Sr P (1996) Spectral analysis of EEG in Alzheimer's disease: relation to apolipoprotein E polymorphism. Neurobiol Aging 17:523-526.
Letemendia F, Pampiglione G (1958) Clinical and electroencephalographic observations in Alzheimer's disease. J Neurol Neurosurg Psychiatry 21:167-172.
Levina A, Herrmann JM, Geisel T (2007) Dynamical synapses causing self-organized criticality in neural networks. Nature Physics 3:857-860.
Liddell DW (1958) Investigations of E.E.G. findings in presenile dementia. J Neurol Neurosurg Psychiatry 21:173-176.
Liljeström M, Kujala J, Jensen O, Salmelin R (2005) Neuromagnetic localization of rhythmic activity in the human brain: a comparison of three methods. Neuroimage 25:734-745.
Linkenkaer-Hansen K (2004) Long-range temporal correlations in brain activity in health and disease. ZonMW, VENI 016056181.
Linkenkaer-Hansen K, Nikouline VV, Palva JM, Ilmoniemi RJ (2001) Long-Range Temporal Correlations and Scaling Behavior in Human Brain Oscillations. J Neurosci 21:1370-1377.
Linkenkaer-Hansen K, Monto S, Rytsälä H, Suominen K, Isometsä E, Kähkönen S (2005) Breakdown of Long-Range Temporal Correlations in Theta
65

Oscillations in Patients with Major Depressive Disorder. J Neurosci 25:10131-10137.
Linkenkaer-Hansen K, Smit DJA, Barkil A, van Beijsterveldt TEM, Brussaard AB, Boomsma DI, van Ooyen A, de Geus EJC (2007) Genetic Contributions to Long-Range Temporal Correlations in Ongoing Oscillations. J Neurosci 27:13882-13889.
Lippiello E, de Arcangelis L, Godano C (2005) Memory in self-organized criticality. Europhysics Letters 72:678-684.
Longo VG (1966) Behavioral and electroencephalographic effects of atropine and related compounds. Pharmacol Rev 18:965-996.
Lopes da Silva F, Van Rotterdam A (1999) Biophysical aspects of EEG and magnetoencephalogram generation. Electroencephalography: basic principles, clinical applications, and related fields (4th ed) Lippincott: Williams & Wilkins p:93–109.
Lux T, Marchesi M (1999) Scaling and criticality in a stochastic multi-agent model of a financial market. Nature 397:498-500.
Maestu F, Fernandez A, Simos PG, Gil-Gregorio P, Amo C, Rodriguez R, Arrazola J, Ortiz T (2001) Spatio-temporal patterns of brain magnetic activity during a memory task in Alzheimer's disease. Neuroreport 12:3.917-913.922.
Maestu F, Arrazola J, Fernandez A, Simos PG, Amo C, Gil-Gregorio P, Fernandez S, Papanicolaou A, Ortiz T (2003) Do cognitive patterns of brain magnetic activity correlate with hippocampal atrophy in Alzheimer's disease? J Neurol Neurosurg Psychiatry 74:208-212.
Maestu F, Fernandez A, Simos PG, Lopez-Ibor MI, Campo P, Criado J, Rodriguez-Palancas A, Ferre F, Amo C, Ortiz T (2004) Profiles of brain magnetic activity during a memory task in patients with Alzheimer's disease and in non-demented elderly subjects, with or without depression. J Neurol Neurosurg Psychiatry 75:1160-1162.
Maestú F, García-Segura J, Ortiz T, Montoya J, Fernández A, Gil-Gregorio P, Campo P, Fernández S, Viaño J, Portera A (2005) Evidence of Biochemical and Biomagnetic Interactions in Alzheimer's Disease: An MEG and MR Spectroscopy Study. Dementia and Geriatric Cognitive Disorders 20:145-152.
Makeig S, Bell AJ, Jung TP, Sejnowski TJ (1996) Independent component analysis of electroencephalographic data. Advances in Neural Information Processing Systems 8:145-151.
Makeig S, Jung TP, Bell AJ, Ghahremani D, Sejnowski TJ (1997) Blind separation of auditory event-related brain responses into independent components. Proceedings of the National Academy of Sciences 94:10979.
Malamud BD, Morein G, Turcotte DL (1998) Forest Fires: An Example of Self-Organized Critical Behavior. Science 281:1840.
Mantegna RN, Stanley HE (1995) Scaling behaviour in the dynamics of an economic index. Nature 376:46-49.
Mantini D, Perrucci MG, Del Gratta C, Romani GL, Corbetta M (2007) Electrophysiological signatures of resting state networks in the human brain. PNAS 104:13170-13175.
66

Matthews PM, Honey GD, Bullmore ET (2006) Applications of fMRI in translational medicine and clinical practice. Nat Rev Neurosci 7:732-744.
Mazzoni A, Broccard FD, Garcia-Perez E, Bonifazi P, Ruaro ME, Torre V (2007) On the Dynamics of the Spontaneous Activity in Neuronal Networks. PLoS ONE 2:e439.
McKhann G (1984) Clinical diagnosis of Alzheimer's disease: report of the NINCDS-ADRDA Work Group under the auspices of Department of Health and Human Services Task Force on Alzheimer's Disease. In, pp 939-944: AAN Enterprises.
Montez T, Linkenkaer-Hansen K, van Dijk BW, Stam CJ (2006) Synchronization likelihood with explicit time-frequency priors. NeuroImage 33:1117-1125.
Monto S, Vanhatalo S, Holmes MD, Palva JM (2007) Epileptogenic Neocortical Networks Are Revealed by Abnormal Temporal Dynamics in Seizure-Free Subdural EEG. Cereb Cortex 17:1386-1393.
Mudher A, Lovestone S (2002) Alzheimer's disease–do tauists and baptists finally shake hands? Trends in Neurosciences 25:22-26.
Nakakoji K, Yamamoto Y, Nishinaka Y, Kishida K, Ye Y (2002) Evolution patterns of open-source software systems and communities. Proceedings of the International Workshop on Principles of Software Evolution:76-85.
Nestor PJ, Scheltens P, Hodges JR (2004) Advances in the early detection of Alzheimer's disease. Nat Med 10:S34-41.
Neufeld MY, Rabey MJ, Parmet Y, Sifris P, Treves TA, Korczyn AD (1994) Effects of a single intravenous dose of scopolamine on the quantitative EEG in Alzheimer's disease patients and age-matched controls. Electroencephalogr Clin Neurophysiol 91:407-412.
Nikulin VV, Brismar T (2004) Long-range temporal correlations in alpha and beta oscillations: effect of arousal level and test-retest reliability. Clinical Neurophysiology 115:1896-1908.
Osipova D, Ahveninen J, Jensen O, Ylikoski A, Pekkonen E (2005) Altered generation of spontaneous oscillations in Alzheimer's disease. NeuroImage 27:835-841.
Osipova D, Ahveninen J, Kaakkola S, Jaaskelainen IP, Huttunen J, Pekkonen E (2003) Effects of scopolamine on MEG spectral power and coherence in elderly subjects. Clinical Neurophysiology 114:1902-1907.
Paczuski M, Hughes D (2004) A heavenly example of scale-free networks and self-organized criticality. Physica A: Statistical Mechanics and its Applications 342:158-163.
Paczuski M, Maslov S, Bak P (1996) Avalanche dynamics in evolution, growth, and depinning models. Physical Review E 53:414-443.
Palva JM, Palva S, Kaila K (2005a) Phase Synchrony among Neuronal Oscillations in the Human Cortex. J Neurosci 25:3962-3972.
Palva S, Palva JM (2007) New vistas for [alpha]-frequency band oscillations. Trends in Neurosciences 30:150-158.
Palva S, Linkenkaer-Hansen K, Naatanen R, Palva JM (2005b) Early Neural Correlates of Conscious Somatosensory Perception. J Neurosci 25:5248-5258.
67
Parish LM, Worrell GA, Cranstoun SD, Stead SM, Pennell P, Litt B (2004) Long-range temporal correlations in epileptogenic and non-epileptogenic human hippocampus. Neuroscience 125:1069-1076.
Peng CK, Havlin S, Stanley HE, Goldberger AL (1995) Quantification of scaling exponents and crossover phenomena in nonstationary heartbeat time series. Chaos: An Interdisciplinary Journal of Nonlinear Science 5:82-87.
Penttila M, Partanen JV, Soininen H, Riekkinen PJ (1985) Quantitative analysis of occipital EEG in different stages of Alzheimer's disease. Electroencephalogr Clin Neurophysiol 60:1-6.
Pereda E, Quiroga RQ, Bhattacharya J (2005) Nonlinear multivariate analysis of neurophysiological signals. Prog Neurobiol 77:1-37.
Pereda E, Rial R, Gamundi A, González J (2001) Assessment of changing interdependencies between human electroencephalograms using nonlinear methods. Physica D: Nonlinear Phenomena 148:147-158.
Pfurtscheller G, Klimesch W (1992) Event-related synchronization and desynchronization of alpha and beta waves in a cognitive task. Induced Rhythms in the Brain:117-128.
Pijnenburg YAL, vd Made Y, van Cappellen van Walsum AM, Knol DL, Scheltens P, Stam CJ (2004) EEG synchronization likelihood in mild cognitive impairment and Alzheimer's disease during a working memory task. Clinical Neurophysiology 115:1332-1339.
Plenz D, Thiagarajan TC (2007) The organizing principles of neuronal avalanches: cell assemblies in the cortex? Trends Neurosci 30:101-110.
Poil S-S, van Ooyen A, Linkenkaer-Hansen K (2008a) Avalanche dynamics of human brain oscillations: relation to critical branching processes and temporal correlations. Human Brain Mapping In Press.
Poil SS, van Ooyen A, Linkenkaer-Hansen K (2008b) Avalanche dynamics of human brain oscillations: Relation to critical branching processes and temporal correlations. Human Brain Mapping 29:770-777.
Posthuma D, de Geus EJC, Mulder E, Smit DJA, Boomsma DI, Stam CJ (2005) Genetic components of functional connectivity in the brain: the heritability of synchronization likelihood. Hum Brain Mapp 26:191-198.
Raghavachari S, Kahana MJ, Rizzuto DS, Caplan JB, Kirschen MP, Bourgeois B, Madsen JR, Lisman JE (2001) Gating of Human Theta Oscillations by a Working Memory Task. J Neurosci 21:3175-3183.
Raichle ME, Mintun MA (2006) Brain Work and Brain Imaging. Annual Review of Neuroscience 29:449-476.
Raichle ME, MacLeod AM, Snyder AZ, Powers WJ, Gusnard DA, Shulman GL (2001) Inaugural Article: A default mode of brain function. Proc Natl Acad Sci USA 98:676-682.
Rangarajan G, Ding M (2000) Integrated approach to the assessment of long range correlation in time series data. Physical Review E 61:4991-5001.
Rhodes CJ, Anderson RM (1996) Power laws governing epidemics in isolated populations. Nature 381:600-602.
68

Riekkinen P, Buzsaki G, Riekkinen Jr P, Soininen H, Partanen J (1991) The cholinergic system and EEG slow waves. Electroencephalogr Clin Neurophysiol 78:89-96.
Rosenblum MG, Pikovsky AS (2001) Detecting direction of coupling in interacting oscillators. Physical Review E 64:45202.
Rosenstein MT, Collins JJ, De Luca CJ (1994) Reconstruction expansion as a geometry-based framework for choosing proper delay times. Physica D 73:82-98.
Rulkov NF, Sushchik MM, Tsimring LS, Abarbanel HDI (1995) Generalized synchronization of chaos in directionally coupled chaotic systems. Physical Review E 51:980-994.
Sannita WG, Maggi L, Rosadini G (1987) Effects of Scopolamine (0.25-0.75 mg im) on the Quantitative EEG and the Neuropsychological Status of Healthy Volunteers. Logo 17.
Schiff SJ, So P, Chang T, Burke RE, Sauer T (1996) Detecting dynamical interdependence and generalized synchrony through mutual prediction in a neural ensemble. Physical Review E 54:6708-6724.
Shen ZX (2004) Brain cholinesterases: II. The molecular and cellular basis of Alzheimer's disease. Medical Hypotheses 63:308-321.
Simoes C (2002) Neuromagnetic characterization of the human secondary somatosensory cortex.
Singer W (1999) Neuronal Synchrony: A Versatile Code Review for the Definition of Relations? Neuron 24:49-65.
Sneppen K, Bak P, Flyvbjerg H, Jensen MH (1995) Evolution as a self-organized critical phenomenon. Proceedings of the National Academy of Sciences of the United States of America 92:5209-5213.
Soininen H, Partanen VJ, Helkala EL, Riekkinen PJ (1982) EEG findings in senile dementia and normal aging. Acta Neurol Scand 65:59-70.
Stam CJ (2000) Brain dynamics in theta and alpha frequency bands and working memory performance in humans. Neuroscience Letters 286:115-118.
Stam CJ (2005) Nonlinear dynamical analysis of EEG and MEG: Review of an emerging field. Clinical Neurophysiology 116:2266-2301.
Stam CJ (2007) Electrophysiological tests. In: Clinical diagnosis and management of Alzheimer's disease, 3rd ed. (Gauthier S, ed), pp 111-123. Oxford: Informa Healthcare.
Stam CJ, van Dijk BW (2002) Synchronization likelihood: an unbiased measure of generalized synchronization in multivariate data sets. Physica D: Nonlinear Phenomena 163:236-251.
Stam CJ, de Bruin EA (2004) Scale-free dynamics of global functional connectivity in the human brain. Human Brain Mapping 22:97-109.
Stam CJ, van Cappellen van Walsum AM, Micheloyannis S (2002a) Variability of EEG synchronization during a working memory task in healthy subjects. International Journal of Psychophysiology 46:53-66.
Stam CJ, Breakspear M, van Walsum AMC, van Dijk BW (2003a) Nonlinear synchronization in EEG and whole-head MEG recordings of healthy subjects. Human Brain Mapping 19:63-78.
69

Stam CJ, van der Made Y, Pijnenburg YAL, Scheltens P (2003b) EEG synchronization in mild cognitive impairment and Alzheimer's disease. Acta Neurologica Scandinavica 108:90-96.
Stam CJ, van Walsum AMC, Pijnenburg YAL, Berendse HW, de Munck JC, Scheltens P, van Dijk BW (2002b) Generalized Synchronization of MEG Recordings in Alzheimer's Disease: Evidence for Involvement of the Gamma Band. Journal of Clinical Neurophysiology 19:562.
Stam CJ, Montez T, Jones BF, Rombouts SA, van der Made Y, Pijnenburg YA, Scheltens P (2005) Disturbed fluctuations of resting state EEG synchronization in Alzheimer's disease. Clin Neurophysiol 116:708-715.
Stam CJ, Jones BF, Manshanden I, van Cappellen van Walsum AM, Montez T, Verbunt JPA, de Munck JC, van Dijk BW, Berendse HW, Scheltens P (2006) Magnetoencephalographic evaluation of resting-state functional connectivity in Alzheimer's disease. NeuroImage 32:1335-1344.
Steriade M (2000) Corticothalamic resonance, states of vigilance and mentation. Neuroscience 101:243-276.
Takens F (1981) Detecting strange attractors in turbulence. In: Dynamical Systems and Turbulence, Warwick 1980, pp 366-381: Springer Berlin / Heidelberg.
Tass P, Rosenblum MG, Weule J, Kurths J, Pikovsky A, Volkmann J, Schnitzler A, Freund HJ (1998) Detection of n: m Phase Locking from Noisy Data: Application to Magnetoencephalography. Physical Review Letters 81:3291-3294.
Tononi G, Edelman GM, Sporns O (1998) Complexity and coherency: integrating information in the brain. Trends in Cognitive Sciences 2:474-484.
Turcotte DL, Malamud BD (2004) Landslides, forest fires, and earthquakes: examples of self-organized critical behavior. Physica A: Statistical Mechanics and its Applications 340:580-589.
van der Flier WM, Scheltens P (2005) Use of laboratory and imaging investigations in dementia. J Neurol Neurosurg Psychiatry 76:v45-52.
van Walsum AMC, Pijnenburg YAL, Berendse HW, van Dijk BW, Knol DL, Scheltens P, Stam CJ (2003) A neural complexity measure applied to MEG data in Alzheimer’s disease. Clinical Neurophysiology 114:1034-1040.
Vanderwolf CH, Robinson TE (1981) Reticulo-cortical activity and behavior: a critique of the arousal theory and a new synthesis. Behav Brain Sci 4:459-514.
Varela F, Lachaux J-P, Rodriguez E, Martinerie J (2001) The brainweb: Phase synchronization and large-scale integration. Nature Rev Neurosci 2:229-239.
Vrba J, Robinson SE (2001) Signal Processing in Magnetoencephalography. Methods 25:249-271.
Waldemar G (2000) Diagnosis and management of Alzheimer’s disease and other disorders associated with dementia. The role of neurologists in Europe. European Journal of Neurology 7:133.
Waldemar G, Dubois B, Emre M, Georges J, McKeith IG, Rossor M, Scheltens P, Tariska P, Winblad B (2007) Recommendations for the diagnosis and management of Alzheimer's disease and other disorders associated with dementia: EFNS guideline. European Journal of Neurology 14:e1.
70

Weiner H, Schuster DB (1956) The electroencephalogram in dementia. Some preliminary observations and correlations. Electroencephalogr Clin Neurophysiol 8:479-488.
Welch P (1967) The use of fast Fourier transform for the estimation of power spectra: A method based on time averaging over short, modified periodograms. Audio and Electroacoustics, IEEE Transactions on 15:70-73.
Whitney H (1936) Differentiable manifolds. Ann Math 37:645-680. Wu J (2006) Open Source Software Evolution and Its Dynamics. In: University of
Waterloo.
71

72

73
Appendix: Original Publications


P1 ………
P2 ………
P3 ………
P4 ………


www.elsevier.com/locate/ynimgNeuroImage 33 (2006) 1117–1125
Technical Note
Synchronization likelihood with explicit time-frequency priors
T. Montez,a,b,⁎ K. Linkenkaer-Hansen,c B.W. van Dijk,a and C.J. Stama
aDepartment of Clinical Neurophysiology and MEG Centre, VU University Medical Center, Amsterdam, The NetherlandsbInstitute of Biophysics and Biomedical Engineering, Faculty of Sciences, University of Lisbon, PortugalcCenter for Neurogenomics and Cognitive Research (CNCR), Department of Experimental Neurophysiology,Vrije Universiteit Amsterdam, The Netherlands
Received 24 November 2005; revised 29 May 2006; accepted 25 June 2006Available online 3 October 2006
Cognitive processing requires integration of information processedsimultaneously in spatially distinct areas of the brain. The influencethat two brain areas exert on each others activity is usually governedby an unknown function, which is likely to have nonlinear terms. If thefunctional relationship between activities in different areas is domi-nated by the nonlinear terms, linear measures of correlation may notdetect the statistical interdependency satisfactorily. Therefore, algo-rithms for detecting nonlinear dependencies may prove invaluable forcharacterizing the functional coupling in certain neuronal systems,conditions or pathologies. Synchronization likelihood (SL) is a methodbased on the concept of generalized synchronization and detectsnonlinear and linear dependencies between two signals (Stam, C.J.,van Dijk, B.W., 2002. Synchronization likelihood: An unbiasedmeasure of generalized synchronization in multivariate data sets.Physica D, 163: 236–241.). SL relies on the detection of simultaneouslyoccurring patterns, which can be complex and widely different in thetwo signals. Clinical studies applying SL to electro- or magnetoence-phalography (EEG/MEG) signals have shown promising results. Inprevious implementations of the algorithm, however, a number ofparameters have lacked a rigorous definition with respect to the time-frequency characteristics of the underlying physiological processes.Here we introduce a rationale for choosing these parameters as afunction of the time-frequency content of the patterns of interest. Thenumber of parameters that can be arbitrarily chosen by the user of theSL algorithm is thereby decreased from six to two. Empirical evidencefor the advantages of our proposal is given by an application to EEGdata of an epileptic seizure and simulations of two unidirectionallycoupled Hénon systems.
© 2006 Elsevier Inc. All rights reserved.
Keywords: Nonlinear dynamics; Generalized synchronization; Synchroniza-tion likelihood; EEG;MEG; Time-delay embedding; Functional connectivity
⁎ Corresponding author. MEGCentre, VUUniversityMedical Center, P.O.Box 7057, 1007 MB Amsterdam, The Netherlands. Fax: +31 20 444 4816.
E-mail address: [email protected] (T. Montez).Available online on ScienceDirect (www.sciencedirect.com).
1053-8119/$ - see front matter © 2006 Elsevier Inc. All rights reserved.doi:10.1016/j.neuroimage.2006.06.066
Introduction
Cognition depends on coordinated neuronal activity inspatially distinct areas of the brain (Varela et al., 2001). Twocentral issues in cognitive neuroscience are to detect the brainareas that interact during various tasks and to reveal the nature oftheir interaction. It is natural to assume that the coordination ofactivity or exchange of information between brain areas gives riseto a statistical interdependence between the activities in theseareas. In other words, we may reveal the spatial functionalconnectivity underlying cognitive processing by mapping thestatistical interdependencies between time series of neuronal datarecorded from different anatomical locations (Lee et al., 2003).The evidence suggests that functional interactions are mediated bysynchronization of oscillations and that the frequency content ofthese oscillations has some specificity to the function that theyserve (Sarnthein et al., 1998; von Stein and Sarnthein, 2000;Varela et al., 2001). Nevertheless, neuronal activity patterns maybe related through nonlinear functions including strongly transientor cross-frequency phase locking (Friston, 2000; Stam et al.,2003; Palva et al., 2005a). To detect statistical interdependenciesthat are not governed by simple linear functions, so-called“nonlinear methods” are required.
Many coupling measures for detecting linear and nonlinearinterdependencies have been proposed (for a review, see Stam,2005). Currently, there is no consensus on how to best detect non-linear interdependencies in neurophysiological data (Quiroga et al.,2002; David et al., 2004). In fact, different algorithms have beenshown to detect nonlinear interactions between brain regions (Stamet al., 2003). The most general form of interaction between twodynamical systems is generalized synchronization, where the state ofa response system Y is a function of the state of the driver system X:Y=F(X) (Rulkov et al., 1995). For neural systems, this implies that ifa given area generates a specific pattern of activity (X) at differenttimes, the functionally connected brain areas are likely to generatespecific patterns of activity F(X) at those same points in time. Notethat the patterns in the different areas may be widely differentbecause of the potentially nonlinear coupling that governs thefunctional relationships (in other words, F may be a nonlinear

1118 T. Montez et al. / NeuroImage 33 (2006) 1117–1125
function). Moreover, one may be interested in the coupling betweenorgans that produce qualitatively different signals, e.g., heart-ratevariability and sleep EEG (Dumont et al., 2004).
A natural way to investigate generalized synchronization is torepresent the state of dynamic systems in a given time window byvectors in the so-called state space formed by time-delay embedding(Takens, 1981;Ott, 1993). The problem of detecting similar dynamicstates then translates into finding embedding vectors that are close instate space. This approach was used in the interdependency measureof generalized synchronization between two time series (Arnhold etal., 1999). However, as pointed out previously, the interdependencymeasure is sensitive to signals having different amplitudes ordifferent degrees of freedom (Arnhold et al., 1999; Pereda et al.,2001). To solve this problem, Stam and van Dijk (2002) introduced ameasure of generalized synchronization termed synchronizationlikelihood. In synchronization likelihood, the critical distancesdetermining whether state vectors are close or not are definedseparately for the two systems. The interdependency measure (S)and the synchronization likelihood (SL) share the problem, however,of having six parameters to be chosen by the user of the algorithmsand little is known about their influence on the estimation ofinterdependency between coupled systems.
Here we argue that when choosing the values of the time-delayparameters, the SL algorithm is implicitly biased towards detectingpatterns in certain frequency bands. Thus, we introduce lower orupper bounds for the values of SL parameters on the basis of thefrequency range of interest and the sampling frequency of the signals.Moreover, we show for the first time examples of recurrent patternsdetected by the SL algorithm and how these patterns are distributed inthe time series. Finally, we explain the importance of having a lowerbound for the number of recurrences and in what sense the temporalresolution of the SL algorithm is surprisingly good.
Methods
Time-frequency synchronization likelihood
Here we describe the synchronization likelihood method withexplicit time-frequency priors. The differences between thepresent and the previous version of SL are addressed in thediscussion.
The basic assumption of the method is that the state of thesystem at any given moment may be represented by an embeddingvector, and thus that recurrent states are represented by similarembedding vectors (Takens, 1981). The computation of SLbetween two time series can be divided into the following fivesteps: (1) definition of the frequency band of interest and band-passfiltering; (2) construction of time-delay embedding vectors thatrepresent dynamical states of the neural systems; (3) localization ofthe times of recurrent dynamical states in both systems; (4)computation of the likelihood (SL) that the recurrence of a state inone system is accompanied also by a recurrent state in the othersystem; and (5) repetition of steps 2–4 at different times in order toobtain a time series of SL values.
Definition of the frequency band of interest and band-passfiltering
Before applying the SL algorithm, one has to decide for thefrequency band of interest, i.e., the lower and upper bounds of thefrequency content of the patterns. Note that this does not imply thatthe patterns cannot have complex shapes, although this would
usually require a broad range of frequencies. The signals are thenfiltered with a suitable band-pass filter.
Representation of the dynamical state of the neural systems withtime-delay embedding vectors
Following the decision on the frequency range of interest, we usetime-delay embedding to form a state-space representation of thesystem dynamics. The rationale in the present study is that the statevector must sample the signal at sufficiently short intervals to pickup the fastest oscillation and also to be long enough to sample theslowest oscillation. From the time series xk,i of channel k, the statevector Xk,i representing the state of the system at time i is given by:
Xk;i ¼ ðxk;i; xk;iþL; xk;iþ2*L; N ;xk;iþðm1Þ*LÞ ð1Þ
Here, L is the lag and m is the dimension of the embedding vector instate space. Note that Xk,i represents the state of the system in a timeinterval of length L*(m−1), but for convenience we will refer to thisinterval as the state at time i, i.e., the beginning of the interval.
The SL method assumes that in a given period of time a patternof activity will closely repeat itself a number of times in one signaland in the case of generalized synchronization between two signalsanother pattern tends to repeat itself in the other signal at thosesame times. The likelihood of repetition in the second signal maydepend, e.g., on the strength of coupling between the two systemsor on the signal-to-noise ratio of the data. The highest frequency inthe patterns was defined above (step 1) and the embedding lag ischosen so as to sample the fastest oscillations. According to theNyquist sampling theorem, a dynamical process must be sampledat minimum twice the highest frequency (HF) of its fluctuations inorder for the discrete signal to adequately represent the dynamicsof the underlying system. In practice, however, a factor of three iscommonly used (Smith, 1999):
L ¼ fs3*HF
ð2Þ
where fs is the sampling frequency in Hz.The lowest frequency (LF) has the longest period and thus
determines the length of the state vector:
L* m 1ð Þ ¼ fsLF
fm ¼ 3*HFLFþ 1 ð3Þ
Detection of recurrences of states in two potentially coupledsystems
Having the dynamical states of a system A represented in statespace, a criterion for when to consider states at different timessimilar or “recurrent” is needed. We construct a reference vector inchannel A at time i, XA,i, and vectors XA,j at times j, ranging fromi−W2/2 to i−W1/2 and from i+W1/2 to i+W2/2 in steps of 1/fs(Fig. 1a). The time windows W1 and W2 are defined later in thissection. The Euclidean distance between the state vectors XA,j andthe reference vector is computed (other distance measures such asthe maximum norm may also be used). The pref is now introducedto denote the percentage of vectors XA,j that are considered closeenough to XA,i to represent the same state of the system (Fig. 2),which leads to the definition of a critical Euclidean distance, rA,for which: |XA,i−XA,j|<rA. A pref =0.05 means that five percent ofthe vectors XA,j will be considered recurrences of XA,i. The sameprocedure is applied to channel B at the same time point. The prefis generally associated with different critical distances (rA and rB)

Fig. 2. Schematic representation of SL between two channels in terms ofstate vectors and critical distances (adapted with permission from Posthumaet al., 2005). XA,i and XB,i are the reference vectors of channels A and B,respectively. State vectors that are closer than the critical distance are showninside white ellipses, whereas those that are not within the critical distanceare represented inside grey ellipses. The lines connect pairs of state vectors atthe same time point in both channels, i.e., state vectors XB=F(XA). There aretwo simultaneous recurrences out of four possible. SL of channel A and B attime i is the ratio between the number of simultaneous recurrences and thetotal number of recurrences within channels. In order words, SL is an indexof the likelihood that a recurrence of a reference state in channel A isassociated also with a recurrence of a reference state in channel B. pref is theratio between the number of vectors closer than the critical distance and thetotal number of state vectors. Note that pref is the same for A and B, while thecritical distance for A and B is usually different.
Fig. 1. Illustration of state vectors and synchronization likelihood parameters(L, m, W1, W2 and s) with respect to the time series of channels A and B. (a)The reference vector of channel A is denoted XA,i (thick line square) herechosen to have embedding dimension m=3 samples (small ticks) and lagL=2 samples (dots). The reference vector is compared with state vectors(squares) XA,j (j=±1,2 … n) within a window ofW2. State vectors starting attimes j in the time interval outside the windowW1 and within the windowW2
(windows centered at time i) are compared with the reference vector. Thetime series is indicated with a solid horizontal line and the time intervalswhere the state vectors are constructed are indicated with a dashed line. Thevectors XA,j closer to the reference vector XA,i than the critical distance, rA(see also Fig. 2) are represented in white, whereas the vectors that are notwithin the critical distance are represented in grey. The white squares aretermed recurrences. Similarly for channel B, a reference vector XB,i iscompared with all state vectors XB,j (j=1,2 … n). If the vectors are closer toXB,i than rB they are represented in white, otherwise in grey. Synchronizationlikelihood is the number of simultaneous recurrences in channels A and B(e.g., at j=3) divided by the total number of recurrences within channels (b)In order to obtain a SL time series, a new reference vector is constructed attime point i+ s (the arrow represents the s increment), and the procedure inpanel a is repeated with respect to the new time point (the windows W1
and W2 are now centered at i+ s).
1119T. Montez et al. / NeuroImage 33 (2006) 1117–1125
in the two channels, but the number of vectors within the criticaldistance is determined by pref and therefore the same for the twochannels. The definition of critical distances separately for the twochannels is a crucial difference between the SL algorithm and thenonlinear interdependency measure (Arnhold et al., 1999). Alsonote that the critical distance may as well differ at different timeintervals, as it is determined for each XA,i.
To prevent the inclusion of states that are similar because ofautocorrelation effects, i.e., because states vary slowly relative to thesampling frequency, we define a window W1 around time i, wherestate vectors are not compared for their possible similarity. Thevectors starting inside the W1 window are likely to not represent arecurrence of the reference state but the state itself (Theiler, 1986). IfW1 is twice the length of the embedding vectors, the overlap betweenthe first vector XA,j and the reference vector is only one sample, i.e.,W1/2 is larger than the period of the lowest frequency in the signalafter the filtering (cf. step 1):
W1 ¼ 2*L*ðm 1Þ ð4ÞThis definition of W1 represent a physiologically conservative
lower bound as it is well known that neuronal activity transientsmay emerge or fade away within one oscillation cycle (Palva et al.,2005b).
The windowW2 defines the time interval where the similarity ofany given state vector is compared with the reference vector. W2
has to be large enough to allocate a sufficient number of vectors in
order to make sense to take pref of them as recurrences. Therelationship betweenW2, pref and the number of recurrences (nrec) is
nrec ¼ ½W2 W1 þ 1*pref : ð5ÞWe consider nrec=10 a lower bound for pref=0.01 and emphasize
that it is safe to have amuch higher value of nrec because the selectionof recurrences XA,j and XB,j that do not resemble the referencepatterns XA,i and XB,i, respectively, are unlikely to be coincident.
Computation of the likelihood (SL) that states recur simultaneouslyin the two systems
Having introduced a rational choice of the parameters L and m,we can now formulate the SL at time i as:
SLi ¼ nAB½W2 W1 þ 1*pref ð6Þ
where nAB is the number of simultaneous repetitions in channels Aand B given by:
nAB ¼Xiw1=2
j¼iw2=2
nþXiþw2=2
j¼iþw1=2
n
n ¼ h rA;i jXA;i XA; jj
h rB;i jXB;i XB; jj
ð7Þθ is the Heaviside function, which attains the value of one if theargument is positive or zero, and the value of zero if the argument isnegative.
Having pref constant means that the number of recurrences isfixed, whether they exist or not. It is possible that the SL algorithm

Fig. 3. An epileptic seizure filtered at 3−20 Hz, for channels F8 and F7 in anEEG average montage. (a) The signals represented for the time interval from5 to 25 s. Note the clear onset of the seizure around 10 s, lasting until around20 s shown in both channels. (b) Visualization of recurrences of a referencepattern occurring in EEG signals during an epileptic seizure. The referencevectors (thick-line boxes) are located at time 15.6 s and have the duration of0.2 s. The number of state vectors considered close to the reference vector ineach channel (thin-line boxes) is determined by pref (here nrec=10, see alsoEq. (5)). The state vectors comprise complex patterns with multiplefrequencies content. The vertical arrows indicate the simultaneousrecurrences. SL at time 15.6 s is the ratio between the number ofsimultaneous recurrences and the number of vectors closer than the criticaldistance, i.e., SL=5/10=0.5.
1120 T. Montez et al. / NeuroImage 33 (2006) 1117–1125
considers a random pattern a recurrence because of its state vectorcoincidentally being close to that of the reference pattern.Nevertheless, the probability that such chance inclusion of randompatterns as recurrences occur at identical times in the two timeseries is small (inversely proportional to the square of the numberof state vectors considered) and only simultaneous recurrencescontribute to higher values of SL. Therefore, using a higher prefwill increase the number of possible values of SL withoutintroducing spurious high values. Note, in the case of no coupling,the mean SL value over time will be equal to pref.
Computation of SL for different time pointsTo obtain a time series of SL values, a new reference vector,XA,i+s,
is chosen and steps (2) to (4) repeated, etc. (Fig. 1b). Choosing anincrement, s, of one sample is safe; however, this is computationallydemanding and provides redundant information. Empirical testingsuggests that one may gain from s smaller than W1 in the sense thatreference patterns and SL values can vary radically on time scalessmaller than W1 (see Fig. 4). The sampling frequency of SL is theratio between the sampling frequency of the raw data and s.
Reference vectors at the beginning and at the end of the data setlack data points to fit a window W2 /2 on both sides. Necessarily,the algorithm must pay attention to these boundary conditions. Inthis paper, we solved the problem by not computing the SL withina window W2 /2 from the beginning and the end of the time series.Another solution is to define periodic boundary conditions, i.e., touse the points in the end of the data set to fill the missing points inthe beginning and vice versa.
In summary, the parameters necessary for computing the SL attime i can be classified in two groups. The first group includes theparameters related to the time-delay embedding (L and m), whichare defined as a function of the frequency band of interest andsampling frequency. The second group includes the W1, W2 andpref, which are related to the process of finding recurrent stateswithin a suitably defined window.
EEG data
EEG data of an absence seizure was acquired at 500 Hz with aOSG Brain Lab (R) digital system at the 10–20 positions. Electrodeimpedance was kept below 5 kΩ and an average reference electrodewas used, involving all electrodes except Fp2 and Fp1. EEGs wererecorded in a sound attenuated, dimly lit room while patients sat in aslightly reclined chair. The signals were down sampled offline to100 Hz and band-pass filtered with a 4th order Butterworth filter.The data in EEG channels F8 and F7 were chosen for the presentstudy and are displayed in Fig. 3a for the pass band: 3–20 Hz.
Simulated data
To test the performance of SL in data with controlled coupling amodel of two unidirectionally coupled Hénon systems (Schiff et al.,1996) was used:
xiþ1 ¼ 1:4 x21 þ 0:3uiuiþ1 ¼ xiyiþ1 ¼ 1:4 ðCxi þ ð1 CÞyiÞyi þ Bviviþ1 ¼ yi
8>><>>:
ð7Þ
The state of the driver system X is given by xi and the state ofthe response system Y is represented by yi. For B=0.3 the systems
are identical. The coupling parameter C gives the strength of thecoupling, ranging from zero if the systems are uncoupled system toone if the coupling is complete.
Time series xi and yi of 4000 samples were simulated. C wasequal to zero except for the time interval between 1500 and 2500where different values were used. For each value of C, the first5000 iterations were discarded. We averaged over 10 realizationsconsidering random numbers between 0 and 1 for the initial valuesof x, u, y and v.
Results
Using EEG recordings of an epileptic seizure, we compare theperformance of SL as implemented previously (Stam et al., 2003,2005, Stam and de Bruin, 2004) and synchronization likelihoodwith explicit time-frequency (TF) priors as explained in theprevious section. Previous studies used L=10 samples, m=10samples,W1=100 samples,W2/2=10% of the length of the data set,pref =0.01 or pref =0.05 and different sampling frequencies (200,

1121T. Montez et al. / NeuroImage 33 (2006) 1117–1125
250, 313 and 500 Hz). These parameter values are henceforthreferred to as “previous parameters” as opposed to “TF parameters”.
From recurrences of patterns of interest to SL
For the priors in the frequency band of 3–20 Hz andfs=100 Hz, the TF parameters follow from Eqs. (2), (3) and (4):L=1/fs=0.01 s, m=21/fs=0.21 s, W1=40/fs=0.4 s, W2=10 s andpref =0.01 corresponding to nrec=10. A reference pattern and thecorresponding recurrences as detected by the SL algorithm with TFpriors are indicated in Fig. 3b. The times of recurrences in channelF8 were similar to those expected on the basis of visual inspection.For channel F7, the pattern at the reference time point is differentfrom that in channel F8, but its recurrences occasionally appear atthe same times as the recurrences in channel F8. SL is given by theratio between the number of recurrences that occur simultaneouslyin both channels and the total number of recurrences considered ineach channel.
SL depends on the choice of the time-delay embedding parameters:L and m
Fig. 4 shows a short segment of data and how different choicesof L and m leads to the sampling of different patterns. At 15.6 s, thevector obtained with the TF parameters (samples represented withblack dots) tracks the pattern of interest in channel F8, while theprevious parameters do not (white circles), picking up points fromthree potential occurrences of the pattern of interest. The TFparameters also track the pattern well in the absence of high-frequency components as seen at 15.8 s, which is just a window
Fig. 4. The reference vectors of SL with TF priors track the patterns ofinterest. State vectors from Fig. 3b shown at a shorter time scale, at 15.6 s (a)and 15.8 s (b) for channel F8. White circles represent the samples that areselected for the reconstruction of the state vectors for the parameters used inprevious studies (L=10 samples and m=10 samples) and black circles markthe samples of the state vectors based on time-frequency priors (L=1/fs andm=21/fs, fs=100 Hz). The TF parameters pick up the pattern at 15.6 s withhigh frequency components, as well as the pattern at 15.8 s mostlycomprising a low frequency component indicating the adaptive ability of theSL algorithm. Note that the shift of 0.2 s corresponds to a window W1/2with the TF parameters. Note that the previous parameters lead to undersampling and alias-type of problems in the context of sampling theorem andNyquist- frequency.
Fig. 5. Stability of the SL time series computed with the parameters based onthe TF priors (L=1/fs and m=21/fs, fs=100 Hz) and the ones used inprevious studies (L=10 samples and m=10 samples). SL time series for asampling frequency of 100 Hz and s=1/fs for the TF parameters (a) and forthe previous parameters (b) and for s=20/fs for both sets of parameters (c).The TF-SL for s=1/fs shows the onset and end of the seizure and when s isincreased to 20/fs, i.e., when the SL time series is re-sampled by a factor of20, a mean value of 0.3 is maintained during the entire seizure. This meansthat the TF parameters are robust to changes in the spacing of consecutivereference vectors, i.e., the TF-SL is stable. The SL time series for theprevious parameters and s=1/fs increases from zero up to 0.6 in 0.02 s and isunstable, e.g., it is difficult to see where the middle of the seizure is. Whenthe s is increased to 20/fs (0.2 s), previous SL mean value drops to 0.1 in themiddle of the seizure and there is a peak around 22 s after the seizure.
W1/2 away and thereby also pointing to a high temporal resolutionand ability to adapt to changing patterns.
SL with TF priors is insensitive to the spacing of consecutivereference vectors
Fig. 5a shows the results obtained with the TF parameters fors=1/fs. The SL time series shows an increase at around 10 s, whichlasts until around 18 s and then a brief increase around 20 s. Fig. 5bshows the results with the previous parameters. The SL timeseries is very unstable with large fluctuations on time scales
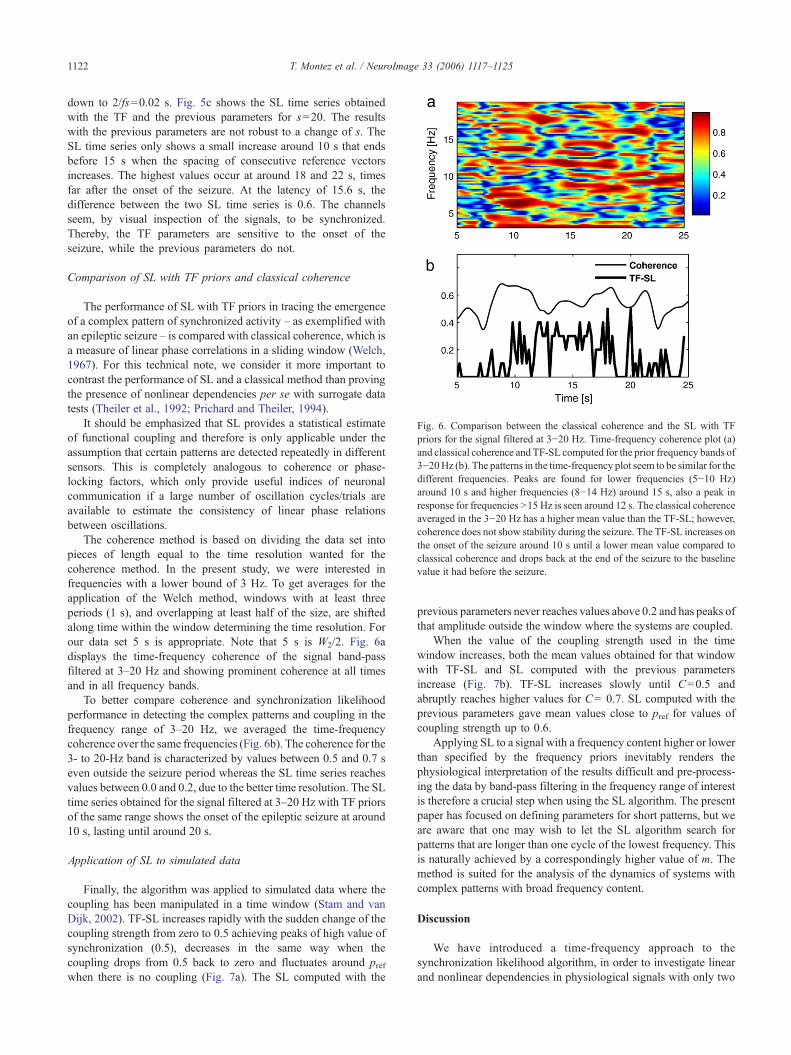
Fig. 6. Comparison between the classical coherence and the SL with TFpriors for the signal filtered at 3−20 Hz. Time-frequency coherence plot (a)and classical coherence and TF-SL computed for the prior frequency bands of3−20Hz (b). The patterns in the time-frequency plot seem to be similar for thedifferent frequencies. Peaks are found for lower frequencies (5−10 Hz)around 10 s and higher frequencies (8−14 Hz) around 15 s, also a peak inresponse for frequencies >15 Hz is seen around 12 s. The classical coherenceaveraged in the 3−20 Hz has a higher mean value than the TF-SL; however,coherence does not show stability during the seizure. The TF-SL increases onthe onset of the seizure around 10 s until a lower mean value compared toclassical coherence and drops back at the end of the seizure to the baselinevalue it had before the seizure.
1122 T. Montez et al. / NeuroImage 33 (2006) 1117–1125
down to 2/fs=0.02 s. Fig. 5c shows the SL time series obtainedwith the TF and the previous parameters for s=20. The resultswith the previous parameters are not robust to a change of s. TheSL time series only shows a small increase around 10 s that endsbefore 15 s when the spacing of consecutive reference vectorsincreases. The highest values occur at around 18 and 22 s, timesfar after the onset of the seizure. At the latency of 15.6 s, thedifference between the two SL time series is 0.6. The channelsseem, by visual inspection of the signals, to be synchronized.Thereby, the TF parameters are sensitive to the onset of theseizure, while the previous parameters do not.
Comparison of SL with TF priors and classical coherence
The performance of SL with TF priors in tracing the emergenceof a complex pattern of synchronized activity – as exemplified withan epileptic seizure – is compared with classical coherence, which isa measure of linear phase correlations in a sliding window (Welch,1967). For this technical note, we consider it more important tocontrast the performance of SL and a classical method than provingthe presence of nonlinear dependencies per se with surrogate datatests (Theiler et al., 1992; Prichard and Theiler, 1994).
It should be emphasized that SL provides a statistical estimateof functional coupling and therefore is only applicable under theassumption that certain patterns are detected repeatedly in differentsensors. This is completely analogous to coherence or phase-locking factors, which only provide useful indices of neuronalcommunication if a large number of oscillation cycles/trials areavailable to estimate the consistency of linear phase relationsbetween oscillations.
The coherence method is based on dividing the data set intopieces of length equal to the time resolution wanted for thecoherence method. In the present study, we were interested infrequencies with a lower bound of 3 Hz. To get averages for theapplication of the Welch method, windows with at least threeperiods (1 s), and overlapping at least half of the size, are shiftedalong time within the window determining the time resolution. Forour data set 5 s is appropriate. Note that 5 s is W2/2. Fig. 6adisplays the time-frequency coherence of the signal band-passfiltered at 3–20 Hz and showing prominent coherence at all timesand in all frequency bands.
To better compare coherence and synchronization likelihoodperformance in detecting the complex patterns and coupling in thefrequency range of 3–20 Hz, we averaged the time-frequencycoherence over the same frequencies (Fig. 6b). The coherence for the3- to 20-Hz band is characterized by values between 0.5 and 0.7 seven outside the seizure period whereas the SL time series reachesvalues between 0.0 and 0.2, due to the better time resolution. The SLtime series obtained for the signal filtered at 3–20 Hz with TF priorsof the same range shows the onset of the epileptic seizure at around10 s, lasting until around 20 s.
Application of SL to simulated data
Finally, the algorithm was applied to simulated data where thecoupling has been manipulated in a time window (Stam and vanDijk, 2002). TF-SL increases rapidly with the sudden change of thecoupling strength from zero to 0.5 achieving peaks of high value ofsynchronization (0.5), decreases in the same way when thecoupling drops from 0.5 back to zero and fluctuates around prefwhen there is no coupling (Fig. 7a). The SL computed with the
previous parameters never reaches values above 0.2 and has peaks ofthat amplitude outside the window where the systems are coupled.
When the value of the coupling strength used in the timewindow increases, both the mean values obtained for that windowwith TF-SL and SL computed with the previous parametersincrease (Fig. 7b). TF-SL increases slowly until C=0.5 andabruptly reaches higher values for C= 0.7. SL computed with theprevious parameters gave mean values close to pref for values ofcoupling strength up to 0.6.
Applying SL to a signal with a frequency content higher or lowerthan specified by the frequency priors inevitably renders thephysiological interpretation of the results difficult and pre-process-ing the data by band-pass filtering in the frequency range of interestis therefore a crucial step when using the SL algorithm. The presentpaper has focused on defining parameters for short patterns, but weare aware that one may wish to let the SL algorithm search forpatterns that are longer than one cycle of the lowest frequency. Thisis naturally achieved by a correspondingly higher value of m. Themethod is suited for the analysis of the dynamics of systems withcomplex patterns with broad frequency content.
Discussion
We have introduced a time-frequency approach to thesynchronization likelihood algorithm, in order to investigate linearand nonlinear dependencies in physiological signals with only two

Fig. 7. TF-SL tracks the change of coupling strength between systems more accurately than previous SL. (a) The signals are coupled in a window between timesi=1500 and 2500 with coupling parameter equal to 0.5. The frequencies of interest: 9–16 Hz (giving embedding parameters: l=2/fs and m=7/fs, fs=100 Hz)were chosen after analysis of the power spectrum of the simulated time series (not shown). We usedW2=1000 samples and pref=0.05. (b) Mean values, betweentimes i=1500 and 2500, of SL as a function of the value of the coupling strength. The results obtained with TF-SL are always larger than the ones obtained withthe previous parameter for all values of coupling strength.
1123T. Montez et al. / NeuroImage 33 (2006) 1117–1125
free parameters: W2 and pref. We have shown that the method isrobust to changes in the sampling frequency of the data and tracksrecurrences of complex patterns with broad frequency content.Finally, our results indicate that SL is adaptive, i.e., the patternsmay change radically as the reference window is moved throughthe time series, making SL a potentially powerful algorithm for thestudy of linear and nonlinear coupling between dynamical systems.
A rational choice of the embedding parameters: L and m
In previous applications of SL (Stam et al., 2003, 2005, Stamand de Bruin, 2004), the parameters L and m were fixed both to 10samples (despite different studies using different samplingfrequencies). Here, we have shown that this is not a suitablechoice for low sampling frequencies because the L is then too largeto sample the higher frequencies. Dumont et al. (2004) computedthe embedding parameters: L was one-fourth of the time it takes forthe normalized autocorrelation function to drop to 1/e. L may thenbe different for each channel and, consequently, the state vectorswill sample different higher frequencies. Our definition of theembedding parameters is based on the frequency range of interest.Considering a too low dimension may lead to “unfolding” of thestate space and the existence of false neighbors, i.e., points thatappear to be nearest neighbors because the embedded space is toosmall (Kennel et al., 1992). Theoretically, attractors are unfoldedwith an embedding dimension higher than twice the dimension ofthe attractor (Takens, 1981). In the case of the epileptic seizure, theTF approach leads to a higher m (21/fs) than the previousparameters (10/fs); in the case of the simulated data, m is equal to7/fs. A too high dimension makes the method more sensitive toinfluence of noise.
Parameters related to finding recurrent states: W1, W2 and pref
SL is not very sensitive to the choice of W1, as long as W1 is aslong as it takes the system to change state and thereby preventtrivial recurrences caused by the reference state being sampledmultiple times. The window W1 is not applied around the other
embedded vectors. If we get in one channel consecutive vectors fortimes j and (j+1/fs) as recurrences they represent the samerecurrence. However, if in the other channel we only get the vectorembedded at time (j+1/fs) as a recurrence, we would miss thesimultaneous recurrence if W1 was defined around time j.
We did not propose a strict definition of W2 and pref because itdepends on the data. W2 has to be large enough to allocate asufficient number of state vectors as potential recurrent states.From these vectors, a fraction pref is taken and considered to berecurrences (see also Eq. (5)). Choosing W2 to be the entire datainterval with periodic boundary conditions reduces the freeparameters only to pref, with the only drawback of an increaseof the computation time. Higher pref for the same W2 implies alarger number of recurrences. We have shown that somerecurrences are tracked more than once (at adjacent samples), sothis might mean picking up the same number of recurrences, buteach one more than once. This happens because, in some cases,the time increment (1/fs) is not enough for the system to changeits state. It is naturally interesting to know how recurrences areclustering; suggesting that in future applications of SL theimportant patterns and the dynamics of their appearance should beexplicitly studied, e.g., in pathologic subjects or different stages ofsleep.
Physiology of recurrent patterns in neuronal activity
Recurrent patterns in neuronal activity have been recognized inneocortical circuits of rats in vitro (Beggs and Plenz, 2004;Rosanova and Ulrich, 2005); in primary visual cortex in vivo(Ikegaya et al., 2004, Kenet et al., 2003), cerebellum and rednucleus (Kalużny and Tarnecki, 1993) and in primary somatosen-sory cortex (Rosanova and Ulrich, 2005) of anesthetized cats, aswell as in hippocampus of rats (Nádasdy et al., 1999). Altogether,these studies suggest that recurrent patterns are common inneuronal systems. SL and other algorithms that aim at quantifyinggeneralized synchronization assume that when a given activitypattern is repeated in a certain area, functionally connected areasalso tend to exhibit repetitions of a certain activity pattern.
1124 T. Montez et al. / NeuroImage 33 (2006) 1117–1125
Generally speaking, SL may detect spatiotemporally distributedprocessing that involves not only linear interactions betweenneuronal populations – such as coherence in distinct frequencybands (Fries, 2005) – but also nonlinear interactions. A nonlinearinteraction between two brain regions may show up as radicallydifferent temporal activation patterns in recordings from theseregions. This is a well-known phenomenon in the study of event-related fields, where the time-frequency profile of activationsrecorded over sensory and association cortices may differsignificantly, although clearly a result of uni- or bi-directionalneuronal communication. One advantage of SL, in addition to itspotential of also detecting nonlinear interactions, is the absence ofa priori assumptions regarding the times of interactions: recurrentpatterns within channels and across channels are detectedautomatically and may therefore equally well be studied inongoing data without well-defined stimulus- or task-inducedactivations. Nonlinear transient patterns are thought to mediateadaptive perceptual synthesis and sensorimotor integration (Fris-ton, 2000) and the SL algorithm may therefore become animportant tool in cognitive research.
The adaptive nature of SL
We showed that the SL method is better than classicalcoherence at tracking the onset of an epileptic seizure. It has ahigher temporal resolution and is able to follow the synchroniza-tion between two channels with complex activity patterns. This isan advantage when compared to the computation of coherence as afunction of time and frequency. We have shown that the TF-SL isable to pick up completely different patterns at a distance of W1/2,some patterns with high frequency components, others with lowand also other patterns with a combination of high and lowfrequencies within the frequency band of interest. The results of thetests with the simulated data showed that the temporal resolution ofthe TF-SL allows the detection of sharp changes of couplingbetween nonlinear systems and the mean value reflects the strengthof the coupling.
Nonlinear methods are needed for studying neuronal activitypatterns related through nonlinear functions (Friston, 2000; Stamet al., 2003; Palva et al., 2005a). The complexity of the problem –
to detect and quantify functional relationships of an arbitrary formin noisy signals from stochastic systems with nonlinear coupling –
is probably so great that no single algorithm with a fixed set ofparameters will ever suffice. Each method extracts differentinformation from the data and the use of different measures mightbe an interesting approach in some cases. Phase synchronization,e.g., discloses correlations between the phases of systemsindependently from amplitude relationships (for a review, seePereda et al., 2005). To discuss effects of amplitude on SL, twosituations have to be considered: differences in amplitude withinthe same channel and between the channels. Within the channel,the sliding window might miss patterns with different amplitudesas recurrences at one time point, but at another time point thosepatterns will be used as the reference, and the comparison with thepaired channel will be done again. Thus, if the channels continueto be synchronized, SL will not be affected. Differences inamplitudes between channels only cause problems with a constantcritical distance and not with a fixed pref. Every analysis hasassumptions concerning the relevant time scales of the dynamics.The present paper defines the synchronization likelihood para-meters with explicit time-frequency priors, which clarifies the
assumptions of the algorithm and facilitates future applicationsand interpretation of results.
Acknowledgments
T.M. is the recipient of a Praxis XXI doctoral fellowship fromFCT, Ministry of Science, Portugal. K.L.-H. is funded by theDanish Research Agency and the Innovative Research IncentiveSchemes of the Netherlands Organization for Scientific Research(NWO). This study was supported in part by a Neuro-Bsik grant tothe Department of Experimental Neurophysiology, see www.mousephenomics.org. We thank Rik Jansen for comments on anearlier version of the manuscript, Jimmy Chui for an earlier versionof the Matlab script used for computing the SL in the present paperand Andreas Daffertshofer for the Matlab script used forcomputing the time-frequency coherence. We thank the twoanonymous reviewers for helpful comments on an earlier draft ofthis paper.
References
Arnhold, J., Grassberger, P., Lehnertz, K., Elger, C.E., 1999. A robustmethod for detecting interdependencies: application to intracraniallyrecorded EEG. Physica D 134, 419–430.
Beggs, J.M., Plenz, D., 2004. Neuronal avalanches are diverse and preciseactivity patterns that are stable for many hours in cortical slice cultures.J. Neurosci. 24 (22), 5216–5229.
David, O., Cosmelli, D., Friston, K.J., 2004. Evaluation of differentmeasures of functional connectivity using a neural mass model.NeuroImage 21, 659–673.
Dumont, M., Jurysta, F., Lanquart, J.P., Migeotte, P.F., van de Borne, P.,Linkowsi, F., 2004. Interdependency between heart rate variability andsleep EEG: linear/non-linear? Clin. Neurophysiol. 115 (9), 2031–2040.
Fries, P., 2005. A mechanism for cognitive dynamics: neuronal communi-cation through neuronal coherence. Trends Cogn. Sci. 9 (10), 474–480.
Friston, K.J., 2000. The labile brain. I. Neuronal transients and nonlinearcoupling. Philos. Trans. R. Soc. London, B 355, 215–236.
Ikegaya, Y., Aaron, G., Cossart, R., Aronov, D., Lampl, I., Ferster, D., Yuste,R., 2004. Synfire chains and cortical songs: temporal modules of corticalactivity. Science 304 (5670), 559–564.
Kalużny, P., Tarnecki, R., 1993. Recurrences plots of neuronal spike trains.Biol. Cybern. 68, 527–534.
Kenet, T., Bibitchkov, D., Tsodyks, M., Grinvals, A., Arieli, A., 2003.Spontaneous emerging cortical representations of visual attributes.Nature 425 (6961), 954–956.
Kennel, M.B., Brown, R., Abarbanel, H.D.I., 1992. Determining embeddingdimension for phase-space reconstruction using a geometrical construc-tion. Phys. Rev., A 45, 6.
Lee, L., Harrison, L.M., Mechelli, A., 2003. A report of the functionalconnectivity workshop, Dusseldorf 2002. NeuroImage 19, 457–465.
Nádasdy, Z., Hirase, H., Czurkó, A., Csicsvari, J., Buzsáki, G., 1999. Replayand time compression of recurring spike sequences in the hippocampus.J. Neurosci. 19 (21), 9497–9507.
Ott, E., 1993. Chaos in Dynamical Systems. Cambridge Univ. Press.Palva, J.M., Palva, S., Kaila, K., 2005a. Phase synchrony among neuronal
oscillations in the human cortex. J. Neurosci. 25 (15), 3962–3972.Palva, S., Linkenkaer-Hansen, K., Näätänen, R., Palva, J.M., 2005b. Early
neural correlates of conscious somatosensory perception. J. Neurosci.25, 5248–5258.
Pereda, E., Rial, R., Gamundi, A., Gonzalez, J., 2001. Assessment ofchanging interdependencies between human electroencephalogramsusing nonlinear methods. Physica D 148, 147–158.
Pereda, E., Quiroga, R.Q., Bhattacharya, J., 2005. Nonlinear multivariateanalysis of neurophysiological signals. Prog. Neurobiol. 77, 1–37.

1125T. Montez et al. / NeuroImage 33 (2006) 1117–1125
Posthuma, D., de Geus, E.J., Mulder, E.J., Smit, D.J., Boomsma, D.I., Stam,C.J., 2005. Genetic components of functional connectivity in the brain:the heritability of synchronization likelihood. Hum. Brain Mapp. 26 (3),191–198.
Prichard, D., Theiler, J., 1994. Generating surrogate data for time serieswith several simultaneously measured variables. Phys. Rev. Lett. 73,951–954.
Quiroga, R.Q., Kraskov, A., Kreuz, T., Grassberger, G., 2002. Performanceof different synchronization measures in real data: a case study onelectroencephalographic signals. Phys. Rev., E Stat. Nonlinear SoftMatter Phys. 65, 041903.
Rosanova, M., Ulrich, D., 2005. Pattern-specific associative long-termpotentiation induced by a sleep spindle-related spike train. J. Neurosci.25 (41), 9398–9405.
Rulkov, N.F., Sushchik, M.M., Tsimring, L.S., Abarbanel, H.D.I., 1995.Generalized synchronization of chaos in directionally coupled chaoticsystems. Phys. Rev., E Stat. Phys. Plasmas Fluids Relat. Interdiscip.Topics 51 (2), 980–994.
Sarnthein, J., Petsche, H., Rappelsberger, P., Shaw, G.L., von Stein, A.,1998. Synchronization between prefrontal and posterior associationcortex during human working memory. Proc. Natl. Acad. Sci. U. S. A.95, 7092–7096.
Schiff, S.J., So, P., Chang, T., Burke, R.E., Sauer, T., 1996. Detectingdynamical interdependence and generalized synchrony through mutualprediction in a neural ensemble. Phys. Rev., E 54, 6708.
Smith, S.W., 1999. The Scientist and Engineer's Guide to Digital SignalProcessing. California Technical Publishing.
Stam, C.J., 2005. Nonlinear dynamical analysis of EEG andMEG: review ofan emerging field. Clin. Neurophysiol. 116 (10), 2266–2301.
Stam, C.J., de Bruin, E.A., 2004. Scale-free dynamics of global functionalconnectivity in the human brain. Hum. Brain Mapp. 22 (2), 97–104.
Stam, C.J., van Dijk, B.W., 2002. Synchronization likelihood: an unbiasedmeasure of generalized synchronization in multivariate data sets.Physica D 163, 236–241.
Stam, C.J., Breakspear, M., van Cappellen van Walsum, A.M., van Dijk,B.W., 2003. Nonlinear synchronization in EEG and whole-head MEGrecordings of healthy subjects. Hum. Brain Mapp. 19, 63–78.
Stam, C.J., Montez, T., Jones, B.F., Rombouts, S.A., van der Made, Y.,Pijnenburg, Y.A., Scheltens, P., 2005. Disturbed fluctuations of restingstate EEG synchronization in Alzheimer's disease. Clin. Neurophysiol.116 (3), 708–715.
Takens, F., 1981. Detecting strange attractors in turbulence. Lect. NotesMath. 898, 366–381.
Theiler, J., 1986. Spurious dimension from correlation algorithms applied tolimited time-series data. Phys. Rev., A 34, 2427–2432.
Theiler, J., Eubank, S., Longtin, A., Galdrikian, B., Farmer, J.D., 1992.Testing for nonlinearity in time series: the method of surrogate data.Physica D 58, 77–94.
Varela, F., Lachaux, J.-P., Rodriguez, E., Martinerie, J., 2001. The brainweb:phase synchronization and large-scale integration. Nat. Rev., Neurosci.2 (4), 229–239.
von Stein, A., Sarnthein, J., 2000. Different frequencies for different scalesof cortical integration: from local gamma to long range alpha/thetasynchronization. Int. J. Psychophysiol. 38 (3), 301–313.
Welch, P.D., 1967. The use of fast Fourier transform for the estimation ofpower spectra: a method based on time averaging over short,modified periodograms. IEEE Trans. Audio Electroacoust. AU-15,70–73.


P1 ……
P2 ……
P3 ……
P4 ……


www.elsevier.com/locate/ynimg
NeuroImage 32 (2006) 1335 – 1344
Magnetoencephalographic evaluation of resting-state functional
connectivity in Alzheimer’s disease
C.J. Stam,a,* B.F. Jones,b,f I. Manshanden,a A.M. van Cappellen van Walsum,c T. Montez,d
J.P.A. Verbunt,a,e J.C. de Munck,e B.W. van Dijk,a,e H.W. Berendse,a and P. Scheltens b
aDepartment of Clinical Neurophysiology and MEG, VU University Medical Center, P.O. Box 7057 1007 MB Amsterdam, The NetherlandsbAlzheimer Center, Department of Neurology, VU University Medical Center, Amsterdam, NetherlandscRadboud University Nijmegen Medical Centre, Department of Anatomy, Nijmegen, NetherlandsdInstitute of Biophysics and Biomedical Engineering, Faculty of Sciences, University of Lisbon, PortugaleDepartment of Medical Physics and Technology, VU University Medical Center, Amsterdam, NetherlandsfDementia Research Centre, Institute of Neurology, UCL, London, UK
Received 15 March 2006; revised 11 May 2006; accepted 15 May 2006
Available online 11 July 2006
Statistical interdependencies between magnetoencephalographic sig-
nals recorded over different brain regions may reflect the functional
connectivity of the resting-state networks. We investigated topograph-
ic characteristics of disturbed resting-state networks in Alzheimer’s
disease patients in different frequency bands. Whole-head 151-
channel MEG was recorded in 18 Alzheimer patients (mean age
72.1 years, SD 5.6; 11 males) and 18 healthy controls (mean age 69.1
years, SD 6.8; 7 males) during a no-task eyes-closed resting state.
Pair-wise interdependencies of MEG signals were computed in six
frequency bands (delta, theta, alpha1, alpha2, beta and gamma) with
the synchronization likelihood (a nonlinear measure) and coherence
and grouped into long distance (intra- and interhemispheric) and
short distance interactions. In the alpha1 and beta band, Alzheimer
patients showed a loss of long distance intrahemispheric interactions,
with a focus on left fronto-temporal/parietal connections. Functional
connectivity was increased in Alzheimer patients locally in the theta
band (centro-parietal regions) and the beta and gamma band
(occipito-parietal regions). In the Alzheimer group, positive correla-
tions were found between alpha1, alpha2 and beta band synchroni-
zation likelihood and MMSE score. Resting-state functional
connectivity in Alzheimer’s disease is characterized by specific
changes of long and short distance interactions in the theta, alpha1,
beta and gamma bands. These changes may reflect loss of anatomical
connections and/or reduced central cholinergic activity and could
underlie part of the cognitive impairment.
D 2006 Elsevier Inc. All rights reserved.
Keywords: Alzheimer’s disease; Resting state; Functional connectivity;
MEG; Synchronization likelihood; Crosscorrelation; Coherence; Cognition
1053-8119/$ - see front matter D 2006 Elsevier Inc. All rights reserved.
doi:10.1016/j.neuroimage.2006.05.033
* Corresponding author. Fax: +31 20 4444816.
E-mail address: [email protected] (C.J. Stam).
Available online on ScienceDirect (www.sciencedirect.com).
Introduction
The neurophysiological mechanisms that underlie cognitive and
behavioral dysfunction in Alzheimer’s disease (AD) are still
incompletely understood. Despite an enormous increase in knowl-
edge about the cellular, molecular, vascular (chronical cerebral
hypoperfusion) and genetic processes involved in AD pathology,
the relationship between these fundamental changes and abnormal
functioning of large scale brain networks remains unclear.
One approach to this problem has concentrated on the idea that
AD pathology at the cellular and molecular level could give rise to
impaired activation of specific brain regions or a slowing down of
local electrophysiological oscillatory activity. Evidence for such
local abnormalities has been found with fMRI studies showing
impaired activation, in particular, of the hippocampus and related
areas during memory tasks (Rombouts et al., 2000). Neurophysio-
logical techniques such as EEG and more recently MEG have also
been used to identify local physiological abnormalities (for a
review, see Jeong, 2004). EEG studies have demonstrated a
slowing of the dominant rhythms, in particular, over the posterior
temporal parietal and occipital brain areas (Boerman et al., 1994;
Jeong, 2004; Jonkman, 1997). This EEG slowing has been
correlated with brain atrophy, APOE genotype and low central
cholinergic activity (Lehtovirta et al., 1996; Riekkinen et al.,
1991). MEG studies have confirmed the notion of a slowing of
brain rhythms and have also suggested an anterior displacement of
the sources of these rhythms (Berendse et al., 2000; Fernandez et
al., 2002, 2003, 2006; Maestu et al., 2001, 2003, 2004, 2005;
Osipova et al., 2005). However, a limitation of these approaches is
that it is unclear how these local abnormalities influence the
functioning of the brain as an integrated system.
A promising alternative approach focuses on connections rather
than on local dysfunction. A central problem in cognitive
neuroscience is the question how different, widely distributed

C.J. Stam et al. / NeuroImage 32 (2006) 1335–13441336
and specialized brain areas integrate their activity. It is widely
believed that such large scale functional integration is crucial for
higher cognitive and behavioral functioning (Fuster, 2003;
Mesulam, 1990, 1998; Tononi et al., 1998). One candidate
mechanism for large scale functional integration is the phenome-
non of synchronization or temporal correlations between neural
activity in different brain regions (Le van Quyen, 2003; Varela et
al., 2001). Synchronization of brain regions can be studied by
measuring statistical interdependencies (functional connectivity)
between physiological signals such as fMRI BOLD, EEG or MEG
from different brain regions either during a resting state or during a
task (Lee et al., 2003; Fingelkurts et al., 2005; Pereda et al., 2005;
Stam, 2005). Studies of functional connectivity have revealed the
existence of synchronized neural networks in different frequency
bands and involving different brain regions. For instance, working
memory is associated with long distance interactions in the theta
band, while gamma synchronization may be related to perception
and consciousness (Rodriguez et al., 1999; Sarnthein et al., 1998;
Stam et al., 2002a; Micheloyannis et al., 2005). Large scale low
frequency synchronization has been associated with a context of
cognition, while smaller scale high frequency synchronization
might be related to content (Palva et al., 2005).
This raises the question whether AD is perhaps better character-
ized by abnormalities at the network level in addition to, or instead
of, the well-known local disturbances. Disturbed functional con-
nectivity would support a Fdisconnection hypothesis_ of cognitivedysfunction in AD (Delbeuck et al., 2003). Several EEG studies
have demonstrated a lower coherence, a linear measure of functional
connectivity, of EEG, especially in the alpha band, in AD (Adler et
al., 2003; Babiloni et al., 2004a; Besthorn et al., 1994; Dunkin et al.,
1994; Hogan et al., 2003; Jelic et al., 1996; Jiang, 2005; Koenig et
al., 2005; Knott et al., 2000; Leuchter et al., 1992; Locatelli et al.,
1998; Pogarell et al., 2005; Stevens et al., 2001). Changes in
coherence outside the alpha band have been reported less frequently,
and controversy exists about the question whether delta and theta
band coherence are decreased or increased in AD.
Use of nonlinear measures has also suggested a loss of
functional connectivity in AD, especially in the alpha and beta
bands (Babiloni et al., 2004a,b; Jeong et al., 2001; Pijnenburg et
al., 2004; Stam et al., 2003a). MEG may be more suitable than
EEG to assess functional connectivity since MEG does not require
the use of a reference and is more sensitive to nonlinear
correlations (Stam et al., 2003b). In a pilot study, Berendse et al.
showed a lower coherence in all frequency bands in AD patients
(Berendse et al., 2000). More recently, we used the synchronization
likelihood, a measure of generalized synchronization, to study
functional connectivity in a larger group of AD subjects and
controls (Stam and van Dijk, 2002; Stam et al., 2002b). This study
revealed a lower level of synchronization in the upper alpha band,
the beta and the gamma band in AD (Stam et al., 2002b). However,
lower levels of functional connectivity per se may not yet explain
why the large scale brain networks are functioning abnormally.
Recently, we found that in AD abnormal topographic organization
of large scale brain networks was present, with loss of so called
Fsmall-world_ features which correlated with MMSE scores (Stam
et al., 2006). This points to the possibility that in AD a specific loss
of certain long or short distance connections occurs, involving
brain regions at risk in AD.
The present study was undertaken to study in more detail
resting-state functional connectivity changes in AD. In particular,
we addressed the question whether AD might be associated with a
specific loss of either long distance or short distance interactions in
particular regions and frequency bands. To this end, MEG was
recorded during an eyes-closed no-task state in 18 AD patients and
18 healthy controls. The synchronization likelihood and coherence
were computed between all pairs of sensors for signal filtered in
delta, theta, alpha1, alpha2, beta and gamma bands. SL and
coherence values were averaged for long distance (intra- and
interhemispheric) and short distance local sensor pairs.
Methods
Subjects
The study involved 18 patients (mean age 72.1 years, SD 5.6;
11 males; mean MMSE 19.2, range: 13–25) with a diagnosis of
probable AD according to the NINCDS-ADRDA criteria
(McKhann et al., 1984) and 18 healthy control subjects (mean
age 69.1 years, SD 6.8; 7 males; mean MMSE 29, range: 27–30),
mostly spouses of the patients. Patients and control subjects were
recruited from the Alzheimer Center of the VU University Medical
Center. Subjects were assessed according to a clinical protocol,
which involved history taking, physical and neurological exami-
nation, blood tests, MMSE (Folstein et al., 1975) neuropsycho-
logical work up (administration of a battery of neuropsychological
tests), MRI of the brain according to a standard protocol and
routine EEG. The final diagnosis was based upon a consensus
meeting where all the available clinical data and the results of the
ancillary investigations were considered. The study was approved
by the Local Research Ethics Committee, and all patients or their
caregivers had given written informed consent.
MEG recording
Magnetic fields were recorded while subjects were seated inside
a magnetically shielded room (Vacuumschmelze GmbH, Hanau,
Germany) using a 151-channel whole-head MEG system (CTF
Systems Inc., Port Coquitlam, BC, Canada). Average distance
between sensors in this system is 3.1 cm. A third-order software
gradient (Vrba et al., 1999) was used with a recording pass band of
0.25 to 125 Hz. Sample frequency was 625 Hz. Fields were
measured during a no-task eyes-closed condition. At the beginning
and at the end of each recording, the head position relative to the
coordinate system of the helmet was recorded by leading small
alternating currents through three head position coils attached to
the left and right pre-auricular points and the nasion on the
subject’s head. Head position changes during the recording up to
approximately 1.5 cm were accepted. During the MEG recording,
patients were instructed to close their eyes to reduce artefact
signals due to eye movements.
For further off-line processing, the recordings were converted
to ASCII files and down-sampled to 312.5 Hz. For each subject,
three artefact-free epochs of 4096 samples (13,083 s) were
selected by two of the investigators (BFJ and IM). Visual
inspection and selection of epochs were done with the
DIGEEGXP software (CS).
Nonlinear data analysis
Nonlinear correlations between all pair-wise combinations of
MEG channels were computed with the synchronization

Fig. 2. Mean theta band SL (error bars indicate standard deviation) of
Alzheimer patients and healthy controls for ten local regions (L = left; R =
right hemisphere. cen = central; fron = frontal; occ = occipital; par =
parietal; tem = temporal). For each region, the mean SL values obtained for
all possible pairs of sensors within that region were averaged. SL was
higher in Alzheimer patients at left and right central and parietal regions; in
the other regions, SL in the patients was lower than or equal to that of the
control subjects.
C.J. Stam et al. / NeuroImage 32 (2006) 1335–1344 1337
likelihood (Stam and van Dijk, 2002). Mathematical details can
be found in Appendix A; here, we give a brief description. The
synchronization likelihood (SL) is a general measure of the
correlation or synchronization between two time series which is
sensitive to linear as well as nonlinear interdependencies. The
SL fluctuates around Pref (a small positive number) in case of
independent time series and reaches the value of 1 in case of
maximally synchronous signals. Pref is a parameter which has
to be chosen; in the present study, Pref was set at 0.01. The
basic principle of the SL is to divide each time series into a
series of Fpatterns_ (roughly, brief time intervals containing a
few cycles of the dominant frequency) and to search for a
recurrence of these patterns. The SL then is the chance that
pattern recurrences in time series X coincide with pattern
recurrences in time series Y; Pref is the small but non-zero
likelihood of coincident pattern recurrence in the case of
independent time series. The end result of computing the SL
for all pair-wise combinations of channels is an N N matrix
with N equal to 149 (sensor 150 and 151 were not used),
where each entry Ni ,j contains the value of the SL for the
channels i and j.
SL was computed for the following frequency bands: delta
(0.5–4 Hz), theta (4–8 Hz), alpha1 (8–10 Hz), alpha2 (10–
13 Hz), beta (13–30 Hz) and gamma (30–45 Hz). Digital,
zero-phase lag filtering was done off-line. Results for the three
epochs were averaged. Further averaging was done to obtain
long distance intra- and interhemispheric and short distance
local measures. For this, MEG channels were grouped into
(left and right) central, frontal, occipital, parietal and temporal
regions (based upon the naming of the CTF sensors). Long
distances (8 intrahemispheric: fronto-temporal, fronto-parietal,
parieto-occipital, occipito-temporal; 5 interhemispheric: central,
frontal, occipital, parietal and temporal) involved correlations
between two different regions (within one hemisphere and
homologue regions of two hemispheres), and short distances
involved correlations within one region. Midline sensors were
not used. The procedure is illustrated in Fig. 1.
Fig. 1. Illustration of the allocation of sensor pairs to short and long
distances. The figure shows the sensor positions of the CTF MEG system
projected onto a two-dimensional surface. Sensors are grouped into frontal
(red), central (purple), parietal (yellow), occipital (blue) and temporal
(green) regions for both hemispheres. The short distance SL was computed
as the average SL between all sensor pairs within one region (two such pairs
are shown for the left frontal region). Long distance SL was computed from
sensor pairs where one sensor was in one region, and the other sensor was
in another region. This is illustrated for right occipito-temporal long
distance SL and for temporal interhemispheric long distance SL.
Linear analysis
Linear correlations between all pair-wise combinations of MEG
channels were computed with coherence analysis (Nunez et al.,
1997; Nolte et al., 2004).The complex coherency between two time
series can be defined as the cross spectrum divided by the product
of the two power spectra. As described by Nolte et al. (2004), its
mean overall frequencies can alternatively be computed via the
mean over time of the corresponding analytical signals like:
c ¼ bA1A2eiDfffiffiffiffiffiffiffiffiffiffiffiffiffiffiffiffiffi
bA21bA
22
p ð1Þ
Here, A1 and A2 are the amplitudes of the two time series, and
D/ is the instantaneous phase difference between (the Hilbert
transforms of) the two time series. The absolute value of coherency
is coherence bounded between 0 and 1. Coherence was computed
all for pairs of channels, for the six frequency bands described
above. Results were averaged for long distance intra- and
interhemispheric and short distance channel pairs as described
for the synchronization likelihood. For the beta band, we also
computed the crosscorrelation (correlation coefficient between the
two time series) to check whether any significant effects detected
by this basic measure would also be picked up by the coherence
and SL analysis.
Statistical analysis
Statistical analysis was done with SPSS for Windows (version
10.0.7). For each frequency band, three separate repeated-
measures ANOVAs were done, using Greenhouse–Geisser
corrected degrees of freedom to correct for lack of sphericity.
In some cases (when the ANOVA showed significant main effects
or interactions), t test was used for detailed analysis. For the long
distance intrahemispheric data, the repeated-measures factor had
8 levels (left and right fronto-temporal, fronto-parietal, parieto-
occipital, occipito-temporal); for the long distance data, the
repeated-measures factor had 5 levels (central, frontal, occipital,
parietal and temporal) and for the short distance data the

Fig. 3. Schematic illustration of SL (SL) results for the alpha1 band. A.
Long distances. Decrease of bilateral fronto-temporal and left fronto-
parietal SL in Alzheimer patients. B. Short distances. Local decrease of SL
in right frontal region. Lines correspond to significant changes of average
SL between two regions and squares to significant changes of local SL (thin
line/light square: P < 0.05; thick line/dark square: P < 0.01; blue:
Alzheimer lower than controls; red: Alzheimer higher than controls;
significance is based upon two-tailed t tests and intended for illustration;
formal testing was based upon a repeated-measures ANOVA).
Fig. 5. Correlation between MMSE (15 Alzheimer patients for whom a
score was available) score and averaged interhemispheric SL in the alpha1
band. R = 0.727; P = 0.002.
C.J. Stam et al. / NeuroImage 32 (2006) 1335–13441338
repeated-measures factor had 10 levels (left and right central,
frontal, occipital, parietal and temporal). The group factor had
two levels (Alzheimer/control). Age was not used as a covariate
since the age difference between the groups was not significant.
A significance level of P < 0.05 was used.
Results
Nonlinear analysis
The delta band showed no significant effects involving the
factor Group. In the theta band, a significant Group Region
interaction (F[9,306] = 2.604; P = 0.029) was found for short
distances. This interaction effect is illustrated in Fig. 2. Inspection
of Fig. 2 shows that the SL was higher in AD patients compared to
controls in the right and left parietal and to a lesser extent central
regions. This difference was significant for the right parietal region
Fig. 4. Schematic illustration of SL (SL) results for the beta band. A. Long
distances. Decrease of left fronto-temporal and fronto-parietal SL and
increase in bilateral occipito-parietal SL in Alzheimer patients. B. Short
distances. Local increase of SL in right parietal region and local decrease of
SL in left temporal region. Lines correspond to significant changes of
average SL between two regions and squares to significant changes of local
SL (thin line/light square: P < 0.05; thick line/dark square: P < 0.01; blue:
Alzheimer lower than controls; red: Alzheimer higher than controls;
significance is based upon two-tailed t tests and intended for illustration;
formal testing was based upon a repeated-measures ANOVA).
(two-sided t test, P = 0.037) In the other regions, SL was slightly
lower in the AD group or comparable between the two groups. The
interaction thus reflects a selective increase of SL in the central
parietal areas in the AD patients.
In the alpha1 band, a significant main effect of Group was
found (F[1,34] = 5.745; P = 0.022) for long distance intrahemi-
spheric connections. This Group effect is illustrated schematically
in Fig. 3. SL was lower in the AD group compared to the control
group; the most significant changes involved the left fronto-
temporal (t test: P = 0.009), left fronto-parietal (t test: P = 0.012)
an the right fronto-temporal (t test: P = 0.015) connections.
The alpha2 band showed no significant effects involving the
factor Group. In the beta band, two significant interactions were
present: the first involved a significant Group Region interaction
(F[7,238] = 4.042; P = 0.023) for long distance intrahemispheric
connections, and the second one a significant Group Region
interaction (F[9,306] = 3.610; P = 0.006) for short distance
connections. These interaction effects are illustrated schematically
in Fig. 4.
For all the frequency bands, correlations between SL measures
and MMSE scores were computed. The correlations were
computed for the AD subjects only. For the delta, theta and
gamma bands, no significant correlations were found. For the
alpha1 band, significant positive correlations were found between
Fig. 6. Correlation between MMSE (15 Alzheimer patients for whom a
score was available) score and averaged interhemispheric SL in the beta
band. R = 0.688; P = 0.005.

C.J. Stam et al. / NeuroImage 32 (2006) 1335–1344 1339
the MMSE score and average interhemispheric SL (R = 0.727; P =
0.002), interhemispheric temporal SL (R = 0.632; P = 0.011), left
frontal (R = 0.673; P = 0.006) and right frontal SL (R = 0.551; P =
0.033). The correlation between MMSE and average interhemi-
spheric SL is shown in Fig. 5.
For the alpha2 band, significant positive correlations between
SL and MMSE were found for interhemispheric connections (R =
0.690; P = 0.005), temporal interhemispheric connections (R =
0.578; P = 0.024), left frontal local connections (R = 0.532; P =
0.041) and left temporal local connections (R = 0.526; P = 0.044).
In the beta band, significant positive correlations between SL and
MMSE were found for right temporo-occipital connections (R =
0.599; P = 0.018), average interhemispheric SL (R = 0.688; P =
0.005) and interhemispheric temporal SL (R = 0.619; P = 0.014).
The correlation between MMSE and average interhemispheric SL
is shown in Fig. 6.
Linear analysis
Coherence showed no significant effects of Group or Group Region interactions for the delta, theta and alpha1 bands. In the
alpha2 band, there was a significant Group Region interaction
for short distances (F[9,306] = 2.372; P = 0.033). Post hoc t tests
only showed a higher coherence in AD patients at the right parietal
region (t test: P = 0.026). In the beta band, there was a significant
Group Region interaction for long intrahemispheric distances
(F[7,238] = 4.044; P = 0.012) and for short distances (F[9,306] =
4.700; P = 0.001). These interactions are illustrated in Fig. 7. AD
patients had a lower left fronto-temporal coherence (t test: P =
0.010) and a higher left (t test: P = 0.038) and right (t test: P =
0.004) parietal coherence. Short distance coherence was lower in
the AD group in the left temporal region (t test: P = 0.044) and
higher in left (t test: P = 0.016) and right (t test: P = 0.001) parietal
regions. In the gamma band, there was a significant main effect of
Group for long distances (F[1,34] = 4.755; P = 0.036). AD
patients had higher left (t test, P = 0.023) and right (t test, P =
0.003) parieto-occipital coherence.
Fig. 7. Schematic illustration of coherence results for the beta band. A.
Long distances. Decrease of left fronto-temporal coherence and increase in
bilateral occipito-parietal coherence in Alzheimer patients. B. Short
distances. Local increase of coherence in right and left parietal regions
and local decrease of SL in left temporal region. Lines correspond to
significant changes of average coherence between two regions and squares
to significant changes of local coherence (thin line/light square: P < 0.05;
thick line/dark square: P < 0.01; blue: Alzheimer lower than controls; red:
Alzheimer higher than controls; significance is based upon two-tailed t tests
and intended for illustration; formal testing was based upon a repeated-
measures ANOVA).
For the beta band, results were checked with a crosscorrelation
analysis. For long distance intrahemispheric crosscorrelations,
there was a significant Group Region interaction (F[7,238] =
4.013; P = 0.005). t tests showed a lower correlation in the AD
group for left fronto-temporal connections (t test: P = 0.006) and
higher correlations in the AD group for left (t test: P = 0.010) and
right (t test: P = 0.023) parieto-occipital connections. For long
distance, interhemispheric correlations no significant effects were
found. For short distances, a significant Group Region
interaction was found (F[9,306] = 4.009; P = 0.003). The
correlation was lower in the AD group at left temporal (t test: P =
0.017) and right frontal (t test: P = 0.038) locations; it was higher
in the AD group at left (t test: P = 0.012) and right (t test: P =
0.001) parietal regions.
Discussion
This study demonstrated a specific pattern of changes in
resting-state functional connectivity in AD patients. SL was
increased in the theta band over the central and parietal areas
and in the beta band over the parietal and occipital areas.
Coherence showed a similar pattern of parieto-occipital increase
in AD in alpha2, beta and gamma bands. In contrast, SL was
decreased in the alpha1 band for long distance intrahemispheric
sensor pairs, and both SL and coherence (and crosscorrelation)
were decreased in the beta band for long distance frontal temporal/
parietal and short distance left temporal sensor pairs. Lower SL,
especially for temporal interhemispheric connections correlated
with disease severity as expressed by a lower MMSE score.
In studies of this kind, it is always important to consider the
question whether correlations between signals recorded at different
sensors can be interpreted in terms of physiological interactions
between different brain regions. In the case of EEG, an active
reference electrode can cause spurious correlations between signals
recorded at different electrodes (Guevara et al., 2005; Nunez et al.,
1997). MEG does not require the use of a reference electrode and
thus may be more suitable for estimating functional connectivity
than EEG (Guevara et al., 2005). However, even with MEG
correlations between signals from nearby sensors could be due to
common sources rather than true interactions. Furthermore, the
location of the sources giving rise to the signal recorded at the
sensors is generally not known. This is the well-known problem of
volume conduction that may give rise to spurious correlations in
sensor space.
One possible solution is to estimate correlations between
signals from reconstructed sources (Fsource space_) rather than
the actually recorded signal (Fsignal space_) (David et al., 2002;
Gross et al., 2001; Hadjipapas et al., 2005). However, no unique
way exists to reconstruct the sources, and the source reconstruction
algorithm used could influence the interdependencies between the
sources (Hadjipapas et al., 2005). A possible alternative is the use
of the imaginary component of the coherency, which is not
sensitive to a linear mixing of independent sources (Nolte et al.,
2004). However, even this approach may not always be effective
(Wheaton et al., 2005). In the present study, we adopted a
pragmatic approach, restricting the analysis to signal space, and
grouping the sensor pairs in long and short distances. While SL and
coherence estimated in this way will be influenced by volume
conduction, it is less likely that volume conduction can explain
group differences in SL between AD patients and controls.

C.J. Stam et al. / NeuroImage 32 (2006) 1335–13441340
Furthermore, several of our main results involve changes in long
distance interactions which are less likely to be due to volume
conduction. Note that changes observed in regions of the signal
space cannot be interpreted as reflecting physiological changes in
the brain regions underlying the sensors. Even so, we should stress
that MEG is especially sensitive to superficial cortical sources. The
changes over parietal regions we describe are supported by MRI
findings with voxel-based morphometry (Karas et al., 2004).
Theoretically, estimates of statistical interdependencies be-
tween different channels could also be influenced by differences
in signal power. Assuming a constant level of measurement/
background noise, signals with lower power could be expected
to have a lower signal-to-noise ration. A lower SNR ration might
produce biased lower values of functional connectivity. However,
we consider it unlikely that the main results of the present study
can be explained in this way. The absolute signal power in the
beta band in the AD group was either comparable to or lower
than the power in the control group (Fig. 8). All three measures
(SL, coherence and crosscorrelation) showed an increase of
parieto-occipital connectivity in the AD group, while the power
in the AD group was significantly lower in the parietal and
occipital regions. Furthermore, the significant loss of connectiv-
ity in left fronto-temporal regions in the AD group was not
associated with significant power changes at all. Thus, the
assessment of functional connectivity provides information that is
independent from signal power and is more likely related to
functional interactions between brain regions.
Another methodological consideration concerns the use of
drugs that influence the cholinergic system. In theory, such drugs
could influence the EEG and the MEG, most likely by reverting the
slowing and loss of connectivity due to the AD pathology (Adler
and Brassen, 2001; Osipova et al., 2003). In our study, 6 of the 18
patients used cholinesterase inhibitors. To determine the possible
influence of drug use on our results, we compared the SL
(averaged over all possible pairs of sensors) in the theta, alpha1
and beta band between AD patients who did and who did not use
cholinesterase inhibitors. No significant differences were found
which suggests that our results are unlikely to be strongly
influenced by medication effects.
Fig. 8. Mean beta band absolute power (error bars indicate standard
deviation) of Alzheimer patients and healthy controls for ten local regions
(L = left; R = right hemisphere. cen = central; fron = frontal; occ = occipital;
par = parietal; tem = temporal). For each region, the mean power values
obtained for all sensors within that region were averaged. Power was
significantly lower in Alzheimer patients at left and right parietal and
occipital regions. *t test: P < 0.05 **t test: P < 0.01.
Our study was conducted during an eyes-closed no-task
condition. One might ask whether such a Fresting state_ is the
most effective condition for demonstrating abnormalities of
functional connectivity in AD. For instance, a recent EEG study
using spectral analysis and cognitive tasks has suggested that task-
induced EEG changes might increase the discrimination between
controls and MCI subjects (van der Hiele et al., 2006). However, a
number of recent fMRI studies have shown that the resting state is
a far more stable and active condition than has often been assumed
(Gusnard and Raichle, 2001). The resting state is characterized by
the activation of a Fdefault_ network, which consists of frontal,
posterior cingulate, parietal and medial temporal areas (Laufs et al.,
2003). Abnormalities of this resting-state network have been
demonstrated in AD (Lustig et al., 2003). Although the use of
specific tasks, aimed at activating brain areas assumed to be
involved in AD, might be expected to be more sensitive in
demonstrating abnormalities, this is often not the case. One reason
may be that the pathology may be associated with abnormally high
as well as abnormally low task-related activation, which seriously
complicates interpretation of the results (Osipova et al., 2005;
Pijnenburg et al., 2004). Furthermore, the present study confirms
that a simple resting-state condition is sufficient to demonstrate
widespread changes in functional connectivity in AD. The
relevance of resting-state SL for cognition is further supported
by the fact that alpha1 and beta band SL, especially involving
interhemispheric temporal connections, were positively correlated
to MMSE scores.
The pattern of functional connectivity changes in the present
study shows similarities as well as differences with previous EEG
and MEG work. A lower level of synchronization in alpha band
and beta band has been reported by most earlier EEG and MEG
studies (Adler et al., 2003; Babiloni et al., 2004a; Besthorn et al.,
1994; Dunkin et al., 1994; Hogan et al., 2003; Jelic et al., 1996;
Jiang, 2005; Koenig et al., 2005; Knott et al., 2000; Leuchter et al.,
1992; Locatelli et al., 1998; Pogarell et al., 2005; Stevens et al.,
2001). In contrast to our previous MEG study (Stam et al., 2002b),
we found a loss of lower instead of upper alpha band synchroni-
zation. Two factors may be involved in the differences between the
present and previous MEG study: (i) the different way in which the
embedding parameters L and M were chosen; (ii) the different
choice of frequency bands.
In the 2002 study, the choice of L and M for the computation of
the SL was still fairly arbitrary. Recently, it has been shown that an
incorrect choice of L and M can result in unexpected frequency
content of the patterns considered by the SL algorithm and that a
proper choice of L and M should take into account the low and
high frequency filters settings (Montez et al., submitted for
publication). In the present study, we used a different approach
to the choice of L and M based explicitly on the frequency content
of the data (Montez et al., submitted for publication). There was
also a different definition of the two alpha bands in the two studies:
in the previous 2002 study, alpha1 was defined as 6–10 Hz and
alpha2 as 10–14. Hz. Failure to find an effect in the lower alpha
band in the 2002 study could be due to the fact that this band
incorporated part of the theta band, where, as shown in the present
study, changes are in the opposite direction. The significant effect
in the upper alpha band in the 2002 study might be caused by
incorporating part of the beta band, which showed a significant
effect in both studies, as well as in EEG studies of SL (Stam et al.,
2003a; Pijnenburg et al., 2004). In a similar way, the significant
gamma band effects of the 2002 study partly overlap the beta band

C.J. Stam et al. / NeuroImage 32 (2006) 1335–1344 1341
results of the present study. With SL, we could not demonstrate
significant effects in a higher gamma band of 30–45 Hz. In an
EEG study, Babiloni et al. demonstrated a lower SL in a wide range
of frequencies in AD patients (Babiloni et al., 2004b). This could
be due to the much larger group size of this study, although the
larger age difference between controls and patients might also have
influenced the results. In the present study, no significant age
effects were present between patients and controls.
The principal aim of the present study was to determine the
relative contribution of long distance and short distance inter-
actions in different frequency bands to impaired functional
connectivity in AD. Short and long distance interactions might
underlie local specialization and global integration of brain
dynamics, which have to be balanced to ensure optimal
information processing (Tononi et al., 1998; Van Cappellen van
Walsum et al., 2003). We used the SL as well as the more
commonly used coherence to study the contribution of short and
long distance interactions. We expected SL to be sensitive to both
nonlinear as well as linear aspects of a correlation, i.e. detects
interdependencies between complex patterns that can be different
in each channel and would not be detected by classical measures.
In the present study, SL showed group differences in the theta and
alpha1 that were not detected by coherence. In the beta band, both
SL and coherence (as well as the crosscorrelation analysis)
detected a similar pattern of fronto-temporal decrease and
parieto-occipital increase in AD. In the alpha2 and gamma band,
coherence revealed changes that were not picked up by SL. We
have previously shown that SL may be more sensitive than
coherence in detecting subtle differences between controls and AD
patients (Stam et al., 2002b). Furthermore, SL can detect weak
nonlinear coupling which has been demonstrated in MEG record-
ings (Stam et al., 2003b). The results of the present study show a
more complex picture which might be due to the fact that we have
now taken into account the spatial details of connectivity: in some
cases, linear and nonlinear measures perform equally well, in other
cases, one of the two approached may reveal information not
picked up by the other approach.
Lower SL in the alpha1 band was restricted to long distance,
intrahemispheric fronto-temporal and fronto-parietal interactions.
This might reflect loss of long distance association fibers
connecting frontal, temporal, parietal and occipital areas. The
beta band also showed a loss of long distance intrahemispheric
linear and nonlinear connectivity, involving especially left
frontal, temporal and parietal connections. Although interhemi-
spheric correlations were not significantly lower in AD subjects,
the SL did show a strong correlation with lower MMSE scores.
Of interest, lower interhemispheric coherence in AD has been
shown to be correlated with atrophy of the corpus callosum
(Pogarell et al., 2005). This further supports the concept that
lower long distance synchronization might reflect loss of
anatomical connections. Two studies suggest that the relationship
between long distance anatomical connections and functional
connectivity could be partly genetically determined. In a large
study in twins, it was shown that alpha band SL was strongly
inherited (Posthuma et al., 2005). Lower EEG coherence in AD
has been associated with the e4 allele of the APOE genotype
(Jelic et al., 1997).
Short distance linear and nonlinear interactions in the beta band
were mainly impaired in the left temporal region. The activity
recorded by the MEG sensors mainly originates in the superficial
neocortical temporal areas. Activity from the medial hippocampal
and entorhinal cortex will have a much smaller amplitude at the
scalp surface. However, both areas are strongly connected and
abnormal temporal connectivity may reflect the primary pathology
of the medial temporal lobe. Other MEG studies in AD have also
stressed the importance of the (left) temporal region (Maestu et al.,
2004, 2005). Left temporal disturbances have been associated with
a higher chance of conversion to MCI (Maestu et al., 2006).
A surprising finding in the present study was the increase in
SL and coherence of occipito-parietal connections and the right
parietal region in the beta band and for coherence also in the
alpha2 and gamma band. These regions may be relatively spared
in the early stages of AD. Thus, it seems unlikely that this local
increase in connectivity is due to loss of association fibers or
lower acetylcholine levels. A possible, but at this stage highly
speculative explanation could be that the parieto-occipital
connectivity reflects a compensation mechanism in a relatively
healthy part of the network. That the functional architecture of
widespread brain networks can be influenced even at sites far
away from local pathology has recently been demonstrated in
patients with brain tumors (Bartolomei et al., 2006). Future
studies will have to confirm the existence of the compensation
mechanism and the possible influence of treatment on this
phenomenon. More generally, it would be of interest to back up
the correlations between impaired functional connectivity de-
scribed in the present study by a more causal approach. The
hypothesis is that the extent to which treatment with cholines-
terase inhibitors or even rTMS restores normal functional
connectivity would predict their favorable impact on cognitive
functioning in AD.
Acknowledgments
The study was financially supported by a grant from Alzheimer
Nederland. T.M. is the recipient of a Praxis XXI doctoral
fellowship from FCT, Ministry of Science, Portugal.
Appendix A. Mathematical background of synchronization
likelihood
The synchronization likelihood (SL) is a measure of the
generalized synchronization between two dynamical systems X
and Y (Stam and van Dijk, 2002). Generalized synchronization
(Rulkov et al., 1995) exists between X and Y of the state of the
response system is a function of the driver system: Y = F(X). The
first step in the computation of the SL is to convert the time series Xi
and Yi recorded from X and Y as a series of state space vectors using
the method of time delay embedding (Takens, 1982):
Xi ¼ Xi;XiþL;Xiþ2L;Xiþ3L N ;Xiþ m1ð ÞL ð1Þ
where L is the time lag andm the embedding dimension. From a time
series of N samples, N(m L) vectors can be reconstructed. State
space vectors Yi are reconstructed in the same way.
SL is defined as the conditional likelihood that the distance
between Yi and Yj will be smaller than a cutoff distance ry, given
that the distance between Xi and Xj is smaller than a cutoff distance
rx. In the case of maximal synchronization, this likelihood is 1; in
the case of independent systems, it is a small, but nonzero number,
namely Pref. This small number is the likelihood that two randomly

C.J. Stam et al. / NeuroImage 32 (2006) 1335–13441342
chosen vectors Y (or X) will be closer than the cut-off distance r. In
practice, the cut-off distance is chosen such that the likelihood of
random vectors being close is fixed at Pref, which is chosen the
same for X and for Y. To understand how Pref is used to fix rx and
ry, we first consider the correlation integral:
Cr ¼ 2
N N wð ÞXNi ¼ 1
XNwj ¼ iþw
h r jXi Xjj ð2Þ
Here, the correlation integral Cr is the likelihood that two
randomly chosen vectors X will be closer than r. The vertical bars
represent the Euclidian distance between the vectors. N is the
number of vectors, w is the Theiler correction for autocorrelation
(Theiler, 1986), and h is the Heaviside function: h(X) = 0 if X 0
and h(X) = 1 if X < 0. Now, rx is chosen such that Crx = Pref and ryis chosen such that Cry = Pref. The SL between X and Y can now be
formally defined as:
SL ¼ 2
N N wð ÞPref
XNi ¼ 1
XNwj ¼ iþw
h rxjXi Xjj
h ry jYi Yjj ð3Þ
SL is a symmetric measure of the strength of synchronization
between X and Y (SLXY = SLYX). In Eq. (3), the averaging is done
over all i and j; by doing the averaging only over j, SL can be
computed as a function of time i. From Eq. (3), it can be seen that
in the case of complete synchronization SL = 1; in the case of
complete independence, SL = Pref. In the case of intermediate
levels of synchronization, Pref < SL < 1.
In the present paper, the choice of the two most important
embedding parameters L and m was based upon the frequency
content of the time series (Montez et al., submitted for
publication). L is chosen small enough to over-sample the
highest frequencies present in the signal, and the embedding
window L m long enough to capture the period of the slowest
frequency. For a given sample frequency in Hz and low
frequency (LF) and high frequency (HF) filters in Hz, L
(expressed in samples) is chosen such that L = sample frequency
/ (HF 4). The embedding dimension m (expressed in samples)
follows from: m = sample frequency / (LF L). The Theiler
correction w was chosen equal to the embedding window L m
and Pref = 0.01.
References
Adler, G., Brassen, S., 2001. Short-term rivastigmine treatment reduces
EEG slow-wave power in Alzheimer patients. Neuropsychobiology 43,
273–276.
Adler, G., Brassen, S., Jajcevic, A., 2003. EEG coherence in Alzheimer’s
dementia. J. Neural Transm. 110, 1051–1058.
Babiloni, C., Miniussi, C., Moretti, D.V., Vecchio, F., Salinari, S., Rossini,
P.M., 2004a. Cortical networks generating movement-related EEG
rhythms in Alzheimer’s disease: an EEG coherence study. Behav.
Neurosci. 118, 698–706.
Babiloni, C., Ferri, F., Moretti, D.V., Strambi, A., Binetti, G., Dal Forno, G.,
Ferreri, F., Lanuzza, B., Bonato, C., Nobili, F., Rodriguez, G., Salinari,
S., Passero, S., Rocchi, R., Stam, C.J., Rossini, P.M., 2004b. Abnormal
fronto-parietal coupling of brain rhythms in mild Alzheimer’s disease: a
multicentric EEG study. Eur. J. Neurosci. 19, 1–9.
Bartolomei, F., Bosma, I., Klein, M., Baayen, J.C., Reijneveld, J.C.,
Postma, T.J., Heimans, J.J., van Dijk, B.W., de Munck, J.C., de Jongh,
A., Cover, K.S., Stam, C.J., 2006. How do brain tumors alter functional
connectivity? A magnetoencephalography study. Ann. Neurol. 59,
128–138.
Berendse, H.W., Verbunt, J.P.A., Scheltens, Ph., van Dijk, B.W., Jonk-
man, E.J., 2000. Magnetoencephalographic analysis of cortical
activity in Alzheimer’s disease. A pilot study. Clin. Neurophysiol.
111, 604–612.
Besthorn, C., Forstl, H., Geiger-Kabisch, C., Sattel, H., Gasser, T.,
Schreiter-Gasser, U., 1994. EEG coherence in Alzheimer disease.
Electroencephalogr. Clin. Neurophysiol. 90, 242–245.
Boerman, R.H., Scheltens, P., Weinstein, H.C., 1994. Clinical neurophys-
iology in the diagnosis of Alzheimer’s disease. Clin. Neurol. Neurosurg.
96, 111–118.
David, O., Garnero, L., Cosmelli, D., Varela, F.J., 2002. Estimation of
neural dynamics from MEG/EEG cortical current density maps:
application to the reconstruction of large-scale cortical synchrony. IEEE
Trans. Biomed. Eng. 49, 975–987.
Delbeuck, X., Van der Linder, M., Colette, F., 2003. Alzheimer’s disease as
a disconnection syndrome? Neuropyschol. Rev. 13, 79–92.
Dunkin, J.J., Leuchter, A.F., Newton, T.F., Cook, I.A., 1994. Reduced
EEG coherence in dementia: state or trait marker? Biol. Psychiatry 35,
870–879.
Fernandez, A., Maestu, F., Amo, C., Gil, P., Fehr, Th., Wienbruch, Ch.,
Rockstroh, B., Elbert, Th., Ortiz, T., 2002. Focal temporoparietal slow
activity in Alzheimer’s disease revealed by magnetoencephalography.
Biol. Psychiatry 52, 764–770.
Fernandez, A., Arazzola, J., Maestu, F., Amo, C., Gil-Gregorio, P.,
Wienbruch, C., Ortiz, T., 2003. Correlations of hippocampal atrophy
and focal low-frequency magnetic activity in Alzheimer disease:
volumetric MR imaging–magnetoencephalographic study. Am. J.
Neuroradiol. 24, 481–487.
Fernandez, A., Hornero, R., Mayo, A., Poza, J., Gil-Gregorio, Ortiz, T.,
2006. MEG spectral profile in Alzheimer’s disease and mild cognitive
impairment. Clin. Neurophysiol. 117, 306–314.
Fingelkurts, A.A., Fingelkurts, A.A., Kahkonen, S., 2005. Functional
connectivity in the brain—Is it a elusive concept? Neurosci. Biobehav.
Rev. 28, 827–836.
Folstein, M.F., Folstein, S.E., McHugh, P.R., 1975. ‘‘Mini-mental state’’. A
practical method for grading the cognitive state of patients for the
clinician. J. Psychiatr. Res. 12, 189–198.
Fuster, J.M., 2003. Cortex and Mind. Unifying Cognition. Oxford Univ.
Press, New York.
Gross, J., Kujala, J., Hamalainen, M., Timmermann, L., Schnitzler, A.,
Salmelin, R., 2001. Dynamic imaging of coherent sources: studying
neural interactions in the human brain. Proc. Natl. Acad. Sci. 98,
694–699.
Guevara, R., Velazguez, J.L.P., Nenadovic, V., Wennberg, R., Senjanovic,
G., Dominguez, L.G., 2005. Phase synchronization measurements using
electroencephalographic recordings. What can we really say about
neuronal synchrony?. Neuroinformatics 3, 301–314.
Gusnard, D.A., Raichle, M.E., 2001. Searching for a baseline: functional
imaging and the resting brain. Nat. Rev., Neurosci. 2, 685–694.
Hadjipapas, A., Hillebrand, A., Holliday, I.E., Singh, K., Barnes, G., 2005.
Assessing interactions of linear and nonlinear neuronal sources using
MEG beamformers: a proof of concept. Clin. Neurophysiol. 116,
1300–1313.
Hogan, M.J., Swanwick, G.R.J., Kaiser, J., Rowan, M., Lawlor, B., 2003.
Memory-related EEG power and coherence reductions in mild
Alzheimer’s disease. Int. J. Psychophysiol. 49, 147–163.
Jelic, V., Shigeta, M., Julin, P., Almkvist, O., Winblad, B., Wahlung,
W.O., 1996. Quantitative electroencephalography power and coher-
ence in Alzheimer’s disease and mild cognitive impairment. Dementia
7, 314–323.
Jelic, V., Julin, P., Shigeta, M., Lannfelt, A., Winblad, L., Wahlund, B.,
1997. Apolipoprotein E e4 allele decreases functional connectivity in
Alzheimer’s disease as measured by EEG coherence. J. Neurol.
Neurosurg. Psychiatry 63, 59–65.

C.J. Stam et al. / NeuroImage 32 (2006) 1335–1344 1343
Jeong, J., 2004. EEG dynamics in patients with Alzheimer’s disease. Clin.
Neurophysiol. 115, 1490–1505.
Jeong, J., Gore, J.C., Peterson, B.S., 2001. Mutual information analysis of
the EEG in patients with Alzheimer’s disease. Clin. Neurophysiol. 112,
827–835.
Jiang, Z.Y., 2005. Abnormal cortical functional connections in Alzheim-
er’s disease: analysis of inter- and intra-hemispheric EEG coherence.
J. Zhejiang Univ. Sci., B 6, 259–264.
Jonkman, E.J., 1997. The role of the electroencephalogram in the diagnosis
of dementia of the Alzheimer type: an attempt at technology
assessment. Neurophysiol. Clin. 27, 211–219.
Karas, G.B., Scheltens, P., Rombouts, S.A., Visser, P.J., van Schijndel,
R.A., Fox, N.C., Barkhof, F., 2004. Global and local gray matter loss in
mild cognitive impairment and Alzheimer’s disease. NeuroImage 23,
708–716.
Knott, V., Mohr, E., Mahoney, C., Ilivitsky, V., 2000. Electroencephalo-
graphic coherence in Alzheimer’s disease: comparisons with a control
group and population norms. J. Geriatr. Psychiatry Neurol. 13, 1–8.
Koenig, T., Prichep, L., Dierks, T., Hubl, D., Wahlund, L.O., John,
E.R., Jelic, V., 2005. Decreased EEG synchronization in Alzheim-
er’s disease and mild cognitive impairment. Neurobiol. Aging 26,
165–171.
Laufs, H., Krakow, K., Sterzer, P., Eger, E., Beyerle, A., Salek-Haddadi, A.,
Kleinschmidt, A., 2003. Electroencephalographic signatures of atten-
tional and cognitive default modes in spontaneous brain activity
fluctuations at rest. Proc. Natl. Acad. Sci. 100, 11053–11058.
Lee, L., Harrison, L.M., Mechelli, A., 2003. A report of the functional
connectivity workshop, Dusseldorf 2002. NeuroImage 19, 457–465.
Le van Quyen, M., 2003. Disentangling the dynamic core: a research
program for a neurodynamics at the large scale. Biol. Res. 36, 67–88.
Lehtovirta, M., Partanen, J., Kononen, M., Soininen, H., Helisalmi, S.,
Mannermaa, A., Ryynanen, M., Hartikainen, P., Riekkinen Sr., P., 1996.
Spectral analysis of EEG in Alzheimer’s disease: relation to Apolipo-
protein E polymorphism. Neurobiol. Aging 4, 523–526.
Leuchter, A.F., Newton, T.F., Cook, A.A., Walter, D.O., 1992. Changes in
brain functional connectivity in Alzheimer-type and multi-infarct
dementia. Brain 115, 1543–1561.
Locatelli, T., Cursi, M., Liberati, D., Francheschi, M., Comi, G., 1998. EEG
coherence in Alzheimer’s disease. Electroencephalogr. Clin. Neuro-
physiol. 106, 229–237.
Lustig, C., Snyder, A.Z., Bhakta, M., O_Brien, K.C., AcAvoy, M., Raichle,
M.E., Morris, J.C., Buckner, R.L., 2003. Functional deactivations:
change with age and dementia of the Alzheimer type. Proc. Natl. Acad.
Sci. 100, 14504–14509.
Maestu, F., Fernandez, A., Simos, P.G., Gil-Gregorio, P., Amo, C.,
Rodriguez, R., Arrazola, J., Ortiz, T., 2001. Spatio-temporal patterns
of brain magnetic activity during a memory task in Alzheimer’s disease.
NeuroReport 12, 3917–3922.
Maestu, F., Arrazola, J., Fernandez, A., Simos, P.G., Amo, C., Gil-
Gregorio, P., Fernandez, S., 2003. Do cognitive patterns of brain
magnetic activity correlate with hippocampal atrophy in Alzheimer’s
disease? J. Neurol. Neurosurg. Psychiatry 74, 208–212.
Maestu, F., Fernandez, A., Simos, P.G., Lopez-Ibor, M.I., Campo, P.,
Criado, J., Rodriguez-Palancas, A., Ferre, F., Amo, C., Ortiz, T.,
2004. Profiles of brain magnetic activity during a memory task in
patients with Alzheimer’s disease and in non-demented elderly
subjects, with or without depression. J. Neurol. Neurosurg. Psychiatry
75, 1160–1162.
Maestu, F., Garcia-Segura, J., Ortiz, T., Montoya, J., Fernandez, A., Gil-
Gregorio, P., Campo, P., Fernandez, S., Viano, J., Portera, A., 2005.
Evidence of biochemical and biomagnetic interactions in Alzheimer’s
disease: an MEG and MR spectroscopic study. Dement. Geriatr. Cogn.
Disord. 20, 145–152.
Maestu, F., Campo, P., Gil-Gregorio, P., Fernandez, S., Fernandez, A.,
Ortiz, T., 2006. Medial temporal lobe neuromagnetic hypoactivation
and risk for developing cognitive decline in elderly population: a 2-year
follow-up study. Neurobiol. Aging 27, 32–37.
McKhann, G., Drachman, D., Folstein, M., Katzman, R., Price, D., Stadlan,
E.M., 1984. Clinical diagnosis of Alzheimer’s disease: report of the
NINCDS-ADRDA Work Group under the auspices of Department of
Health and Human Services Task Force on Alzheimer’s Disease.
Neurology 34, 939–944.
Mesulam, M.M., 1990. Large-scale neurocognitive networks and distribut-
ed processing for attention, language, and memory. Ann. Neurol. 28,
597–613.
Mesulam, M.M., 1998. From sensation to cognition. Brain 121, 1013–1052.
Micheloyannis, S., Sakkalis, V., Vourkas, M., Stam, C.J., Simos, P.G., 2005.
Neural networks involved in mathematical thinking: evidence for linear
and non-linear analysis of electroencephalographic activity. Neurosci.
Lett. 373, 212–217.
Montez, T., Linkenkaer-Hansen, K., van Dijk, B.W., Stam, C.J., submitted
for publication. Synchronization likelihood with explicit time–
frequency priors (revised manuscript).
Nolte, G., Wheaton, O.B.L., Mari, Z., Vorbach, S., Hallett, M., 2004.
Identifying true brain interaction from EEG data using the imaginary
part of coherency. Clin. Neurophysiol. 115, 2292–2307.
Nunez, P.L., Srinivasan, R., Westdorp, A.F., Wijesinghe, R.S., Tucker,
D.M., Silberstein, R.B., Cadusch, P.J., 1997. EEG coherency I:
statistics, reference electrode, volume conduction, Laplacians, cortical
imaging, and interpretation at multiple scales. Electroencephalogr. Clin.
Neurophysiol. 103, 499–515.
Osipova, D., Ahveninen, J., Kaakkola, S., Jaaskelainen, I.P., Huttunen, J.,
Pekkonen, E., 2003. Effects of scopolamine on MEG spectral power
and coherence in elderly subjects. Clin. Neurophysiol. 114, 1902–1907.
Osipova, D., Ahveninen, J., Jensen, O., Ylikoski, A., Pekkonen, E., 2005.
Altered generation of spontaneous oscillations in Alzheimer’s disease.
NeuroImage 27, 835–841.
Palva, J.M., Palva, S., Kaila, K., 2005. Phase synchrony among neuronal
oscillations in the human cortex. J. Neurosci. 25, 3962–3972.
Pereda, E., Quian Quiroga, R., Bhattacharya, J., 2005. Nonlinear
multivariate analysis of neurophysiological signals. Prog. Neurobiol.
77, 1–37.
Pijnenburg, Y.A.L., van de Made, Y., van Cappellen van Walsum,
A.M., Knol, D.L., Scheltens, Ph., Stam, C.J., 2004. EEG synchro-
nization likelihood in mild cognitive impairment and Alzheimer’s
disease during a working memory task. Clin. Neurophysiol. 115,
1332–1339.
Pogarell, O., Teipel, S.J., Juckel, G., Gootjes, L., Moller, T., Burger, K.,
Leinsinger, G., Moller, H.J., Hegerl, U., Hampel, H., 2005. EEG
coherence reflects regional corpus callosum area in Alzheimer’s disease.
J. Neurol. Neurosurg. Psychiatry 76, 109–111.
Posthuma, D., de Geus, E.J.C., Mulder, E.J.C.M., Smit, D.J.A., Boomsma,
D.I., Stam, C.J., 2005. Genetic components of functional connectivity in
the brain: the heritability of synchronization likelihood. Hum. Brain
Mapp. 26, 191–198.
Riekkinen, P., Buzsaki, G., Riekkinen Jr., P., Soininen, H., Partanen, J.,
1991. The cholinergic system and EEG slow waves. Electroencepha-
logr. Clin. Neurophysiol. 78, 89–96.
Rodriguez, E., George, N., Lachauz, J.P., Martinerie, J., Renault, B., Varela,
F.J., 1999. Perception’s shadow: long distance synchronization of
human brain activity. Nature 397, 430–433.
Rombouts, S.A.R.B., Barkhof, F., Veltman, D.J., Machielsen, W.C.M.,
Witter, M.P., Bierlaagh, M.A., Lazeron, R.H.C., Valk, J., Scheltens, P.,
2000. Functional MR imaging in Alzheimer’s disease during memory
encoding. Am. J. Neuroradiol. 21, 1869–1875.
Rulkov, N.F., Sushchik, M.M., Ysimring, L.S., Abarbanel, H.D.I., 1995.
Generalized synchronization of chaos in directionally coupled chaotic
systems. Phys. Rev., E 51, 980–994.
Sarnthein, J., Petsche, H., Rappelsberger, P., Shaw, G.L., von Stein, A.,
1998. Synchronization between prefrontal and posterior association
cortex during human working memory. Proc. Natl. Acad. Sci. 95,
7092–7096.
Stam, C.J., 2005. Nonlinear dynamical analysis of EEG and MEG: review
of an emerging field. Clin. Neurophysiol. 116, 2266–2301.

C.J. Stam et al. / NeuroImage 32 (2006) 1335–13441344
Stam, C.J., van Dijk, B.W., 2002. Synchronization likelihood: an unbiased
measure of generalized synchronization in multivariate data sets.
Physica, D 163, 236–241.
Stam, C.J., van Cappellen van Walsum, A.M., Micheloyannis, S., 2002a.
Variability of EEG synchronization during a working memory task in
healthy subjects. Int. J. Psychophysiol. 46, 53–66.
Stam, C.J., van Cappellen van Walsum, A.M., Pijnenburg, Y.A.L.,
Berendse, H.W., de Munck, J.C., Scheltens, Ph., van Dijk, B.W.,
2002b. Generalized synchronization of MEG recordings in Alzheimer’s
disease: evidence for involvement of the gamma band. J. Clin.
Neurophysiol. 19, 562–574.
Stam, C.J., van der Made, Y., Pijnenburg, Y.A.L., Scheltens, Ph., 2003a.
EEG synchronization in mild cognitive impairment and Alzheimer’s
disease. Acta Neurol. Scand. 108, 90–96.
Stam, C.J., Breakspear, M., van Cappellen van Walsum, A.M., van Dijk,
B.W., 2003b. Nonlinear synchronization in EEG and whole-head MEG
recordings of healthy subjects. Hum. Brain Mapp. 19, 63–78.
Stam, C.J., Jones, B.F., Nolte, G., Breakspear, M., Scheltens, Ph., 2006.
Small-world networks and functional connectivity in Alzheimer’s
disease. Cerebral Cortex. doi:10.1093/cercor/bhj127. [electronic publi-
cation ahead of print].
Stevens, A., Kircher, T., Nickola, M., Bartels, M., Rosellen, N., Wormstall,
H., 2001. Dynamic regulation of EEG power and coherence is lost early
and globally in probable DAT. Eur. Arch. Psychiatry Clin. Neurosci.
251, 199–204.
Takens, F., 1982. Detecting strange attractors in turbulence. Lect. Notes
Math. 898, 366–381.
Theiler, J., 1986. Spurious dimension from correlation algorithms applied to
limited time-series data. Phys. Rev., A 34, 2427–2432.
Tononi, G., Edelman, G.M., Sporns, O., 1998. Complexity and coherency:
integrating information in the brain. TICS 2, 474–484.
Van Cappellen van Walsum, A.-M., Pijnenburg, Y.A.L., Berendse, H.W.,
van Dijk, B.W., Knol, D.L., Scheltens, Ph., Stam, C.J., 2003. A neural
complexity measure applied to MEG data in Alzheimer’s disease. Clin.
Neurophysiol. 114, 1034–1040.
van der Hiele, K., Vein, A.A., Kramer, C.G., Reijntjes, R.H., van Buchem,
M.A., Westendorp, R.G., Bollen, E.L., van Dijk, J.G., Middelkoop,
H.A., 2006. Memory activation enhances EEG abnormality in mild
cognitive impairment. Neurobiol. Aging ([electronic publication ahead
of print] PMID: 16406153).
Varela, F., Lachaux, J.-P., Rodriguez, E., Martinerie, J., 2001. The
brainweb: phase synchronization and large-scale integration. Nat.
Rev., Neurosci. 2, 229–239.
Vrba, J., Anderson, G., Betts, K., et al., 1999. 151-Channel whole-cortex
MEG system for seated or supine positions. In: Yoshimoto, T., Kotani,
M., Kuriki, S., et al., (Eds.), Recent Advances in Biomagnetism.
Tohoku Univ. Press, Sendai, Japan, pp. 93–96.
Wheaton, L.A., Nolte, G., Bohlhalter, S., Fridman, E., 2005. Synchroniza-
tion of parietal and premotor areas during preparation an execution of
praxis hand movement. Clin. Neurophysiol. 116, 1382–1390.

P1 ……
P2 ……
P3 ……
P4 ……

Impaired temporal correlations in temporo-parietal oscillations in early-stage Alzheimer's disease
Teresa Montez a,b, Simon-Shlomo Poile, Bethany F. Jonesb, Ilonka Manshandenb, Jeroen P. A. Verbuntb,d , Bob W. van Dijkb,d, Arjen B Brussaarde, Arjen van Ooyene, Cornelis J. Stamb, Philip Scheltensc, Klaus Linkenkaer-Hansene
a Institute of Biophysics and Biomedical Engineering, Faculty of Sciences of the University of Lisbon, Campo Grande, 1749-016 Lisbon, Portugal.
b Department of Clinical Neurophysiology and MEG Centre, VU University Medical Center, PO Box 7057, 1007 MB Amsterdam, The Netherlands.
c Alzheimer Center and Department of Neurology, VU University Medical Center, PO Box 7057, 1007 MB Amsterdam, The Netherlands
d Department of Physics and Medical Technology, VU University Medical Center, De Boelelaan 1117, 1081 HV Amsterdam, The Netherlands.
e Department of Experimental Neurophysiology, Center for Neurogenomics and Cognitive search (CNCR), VU University Amsterdam, De Boelelaan 1085, 1081 HV Amsterdam, The Netherlands.
Corresponding author: Klaus Linkenkaer-Hansen, Dr. Department of Experimental Neurophysiology Center for Neurogenomics and Cognitive Research (CNCR) VU University Amsterdam De Boelelaan 1085 1081 HV Amsterdam, The Netherlands Phone (office): +31 20 5986479 Fax: +31 20 5987112 E-mail: [email protected]
Classification: Biological sciences
Text pages 23 Figures 4 Tables 0 Abstract word count 229 Character count (including character equivalents of figures) 48981
Author contributions:B.J. and Ph.S. were involved in patient recruitment. I.M., J.P.A.V, and B.W.v.D helped with acquisition and pre-processing of the data. T.M., S.-S.P., and K.L.-H. analyzed data. C.J.S., Ph.S., A.B.B., A.v.O., and K.L.-H. designed research and supervised the project. K.L.-H. wrote the first draft of the MS. All authors commented on the manuscript.

Abstract
Encoding and retention of information in memory modulate the amplitude of neuronal
oscillations up to several seconds. Interestingly, during resting-state conditions, which
are known to be associated with prominent mnemonic activity, ongoing oscillations also
exhibit amplitude modulations on multiple time scales, as indicated by long-range
temporal correlations (LRTC) up to tens of seconds. We reasoned that correlations in
oscillations over time might be important for memory and could therefore be abnormal
in Alzheimer's disease (AD). To test this hypothesis, we measured
magnetoencephalography (MEG) during eyes-closed rest in 19 patients diagnosed with
early-stage AD and 16 age-matched control subjects and characterized temporal
correlations in ongoing oscillations using detrended fluctuation analysis and a novel
"avalanche analysis" that quantifies the life- and waiting-time probability distributions
of oscillation bursts. We found that Alzheimer’s patients had markedly weaker long-
range temporal correlations in the alpha band (6-13 Hz) over temporo-parietal regions
on time scales of 1–25 seconds. On shorter time scales (< 1 second), abnormal
dynamics of alpha oscillations in AD patients were expressed as a strongly reduced
probability for the occurrence of oscillation bursts with long life- or waiting-times in the
temporo-parietal regions. These regions have been associated with mnemonic functions
in healthy subjects and show metabolic and structural deficits in AD, suggesting that the
tendency for ongoing alpha oscillations to carry a memory of their own amplitude
dynamics is important for cognition.

Introduction
Psychological and neuroimaging data suggest that the brain performs many important
functions during rest, such as retrieval and manipulation of information in short-term
memory, and problem solving and planning (1, 2). These resting-state functions may
represent an essential aspect of human self-awareness and are susceptible to impairment
in brain-related disorders including dementia, depression, and schizophrenia (3).
Neuroimaging has identified anatomical patterns of activity that are remarkably
consistent across resting-state experiments, most notably in the precuneus, lateral
parietal and medial prefrontal cortices (4, 5). The existence of such a "resting-state
network" may suggest that the brain has a "default mode" of operation in the absence of
goal-directed behavior (6). Connectivity analysis has aimed at understanding the
integrity of the distributed resting-state network using metabolic, hemodynamic or
electrophysiological techniques. This has revealed disturbances in the resting-state
networks in Alzheimer's disease (7-9) and other pathologies (4, 10).
Functional connectivity has traditionally been considered a phenomenon in the
spatial domain (11-13), and it is widely accepted that correlations between neuronal
activities in anatomically distributed networks are important for cognition (14-16).
Correlations over time, however, may be equally important for brain function; e.g.,
cognitive functions typically involve a series of operations requiring temporal
coordination of neuronal activity across many time scales (17, 18). This is true
particularly during rest where thoughts unfold on time scales of several seconds and,
thus, require ongoing mnemonic activity and "binding" in the temporal domain to
ensure continuity and integrity of conscious experiences (3). In experiments where the
timing of such mnemonic operations is explicitly known, a sustained increase in the
oscillation amplitude has been observed for several seconds in multiple brain areas and

frequency bands during information encoding and retention (19-21). These results
suggest that oscillations related to ongoing mnemonic operations during rest are
amplitude modulated on long time scales and that a slow modulation of oscillatory
activity may serve a "binding" function in the temporal domain.
We and others have recently shown that ongoing oscillations during rest are
modulated in amplitude on multiple time scales, as reflected in the slow power-law
decay of autocorrelations of up to several tens of seconds, also known as "long-range
temporal correlations" (LRTC) (22-25). This indicates that oscillations may carry a
"memory" of their own dynamics. It remains unknown, however, whether this
physiological memory is related to cognitive memory. If this were the case, one would
expect a memory disease like Alzheimer's to show abnormally weak temporal
correlations in oscillations that have been implicated with mnemonic operations (19-
21). To test this we measured ongoing activity with whole-scalp
magnetoencephalography (MEG) in patients diagnosed with early-stage Alzheimer's
disease (AD) and in age-matched control subjects. We have identified four
complementary biomarkers of temporal correlations in ongoing oscillations that point to
an impaired physiological memory of alpha oscillations over temporo-parietal cortices
in AD.
Results
Spectral analysis revealed prominent oscillations in the alpha-frequency band in the
occipito-parietal region in all subjects, albeit that the AD patients had peak frequencies
in the range of 6.3–10.0 Hz, which is lower than the age-matched control subjects (7.1–
10.7 Hz, p < 0.05, two-tailed t-test, Fig. 1 A and 2 D). This is in agreement with the
well-known slowing of the alpha rhythm in AD (26-28). Thus, to avoid confounding

frequency and amplitude effects, we defined the alpha-frequency band to be 6–13 Hz.
Alpha oscillations in both groups exhibited erratic fluctuations in amplitude (Fig. 1 D
and E) and a high signal-to-noise ration relative to the background noise in the MEG
recording room (Fig. 1 F), which is important for an accurate estimation of temporal
correlations (29). We used three complementary methods to test whether the temporal
correlations of these fluctuations carry functionally relevant information about the state
of the underlying networks.
On long time scales (1–25 s), we used detrended fluctuation analysis (DFA)
(Fig. 1 G), which has previously been shown to robustly estimate the strength of long-
range temporal correlations of a power-law form (22, 29). The DFA analysis identified
a highly significant drop in LRTC in several channels over temporo-parietal regions
(Fig. 2 A–C, DFA exponents 0.66 ± 0.01 in AD and 0.71 ± 0.01 in the control group, p
< 0.005 for the mean DFA exponent across 33 channels, two-tailed t-test, see Methods).
This is particularly interesting in view of the lack of a group effect on oscillation
amplitudes (Fig. 2 E). Note that the MEG data were transformed to planar synthetic
gradiometers, which are maximally sensitive to neuronal currents immediately below
the sensor (see Methods).
The DFA exponent being larger than 0.5 on time scales of 1–25 seconds clearly
indicates that the oscillations do not wax and wane randomly. The DFA analysis,
however, is not suitable for quantifying the dynamics on time scales shorter than 1
second (see Methods). Hence, to further understand the meta-stable dynamics of the
oscillations on short to intermediate time scales, we therefore adopted an "avalanche
analysis" from the study of critical phenomena (30, 31). We quantified the time periods
that oscillation amplitudes stayed above or below the median level in individual
channels (Fig. 1 B, see Methods). These periods are termed "oscillation life- and

waiting-times", respectively, and their probability distributions decayed as power-laws
(Fig. 1 H and I). The corresponding power-law exponents, and w, therefore provide a
convenient index of the variation in oscillation-burst life-times: the less likely the
occurrence of a long-lasting oscillation, the larger the life-time exponent. A random
signal that is filtered and analyzed identically to the MEG signal is characterized by
rapidly decreasing life- and waiting-time distributions (Fig. 1 H and I). Interestingly,
and in line with the analysis of LRTC, group differences in life-time exponents were
identified in the temporo-parietal regions (Fig. 3 C), with life-time exponents 1.91 ±
0.06 in AD and 1.68 ± 0.04 in the control group (Fig. 3 B; p < 0.005). A different way
of illustrating the lower capacity of AD patients to generate long-lasting oscillations is
to compute the cumulative probability distribution of life-times, which showed
significant differences at percentiles around 88–100%. The 95%-percentile, e.g., was
383 ± 11 ms in AD and 439 ± 12 ms in controls (Fig. 3 D and E; p < 0.005).
Surprisingly, also the waiting times were highly affected with waiting-time exponents
1.77 ± 0.04 in AD and 1.60 ± 0.04 in the control group (Fig. 3 G and H; p < 0.005),
which further supports the conclusion that oscillatory dynamics is considerably more
random in Alzheimer's patients than in age-matched control subjects.
Finally, we correlated the exponents from the analysis of LRTC and oscillation
life- and waiting-times. The group effect for both DFA, life- and waiting-time
exponents may lead to the impression that these exponents are correlated; however, the
Pearson correlation analysis did not indicate a significant linear correlation in any of the
groups for any of the measures (r in the range of –0.42 to –0.32 with p > 0.05, Fig. 4).
This reflects the different time scales that the methods are sensitive to, and suggest that
Alzheimer's patients have abnormal temporal structure of oscillations both within and
across multiple bursts.

Discussion
Resting-state alpha oscillations carry a memory of their own amplitude dynamics for
tens of seconds, as reflected by long-range temporal correlations (LRTC) (22, 29). We
investigated whether this physiological memory may be impaired in a disease of
cognitive memory. Here, we report that patients with early-stage Alzheimer's disease
(AD) have impaired temporal correlations in temporo-parietal alpha oscillations. These
brain regions have been implicated with mnemonic operations in normal subjects and
exhibit structural, metabolic, and blood-flow deficits in AD. Taken together with
previous electrophysiological data from working memory tasks (19-21), our results
suggest that the capacity to modulate neuronal oscillations on multiple time scales may
be important for memory.
Biomarkers of pathology derived from amplitude dynamics of oscillations
The DFA analysis of LRTC in ongoing oscillations has previously been shown to
identify pathophysiological states with spectral and anatomical specificity. In major
depressive disorder, temporal correlations were selectively attenuated in the theta band
(17), whereas abnormally strong correlations were found near the seizure zone in
epilepsy patients primarily in the beta band (32, 33). Here, we identified a pattern of
weaker LRTC in alpha oscillations in AD extending from the parietal region and
bilaterally towards the temporal lobes. This is particularly interesting in view of the
insignificant effect of AD on oscillation amplitude at 6–13 Hz and in line with a recent
study in twins showing that power and LRTC convey complementary information (29).
The analysis of oscillation life-times complemented the DFA in identifying impaired

temporal correlation properties of temporo-parietal oscillations in AD. This topography
agrees remarkably well with previously identified anatomical regions expressing
Alzheimer's associated pathologies based on reductions in blood flow and metabolism
during rest (34, 35), cortical atrophy (36), or amyloid deposition (34).
Together, these findings suggest that the amplitude modulation of temporo-
parietal alpha oscillations on both short to intermediate (< ~1 s) and long (1–25 s) time
scales represents a physiological memory that is important for cognitive memory.
Further, the lack of an amplitude effect suggests that temporal correlations may be more
important for mnemonic operations than the capacity to generate large-amplitude
oscillations. This highlights the importance of quantifying the amplitude dynamics of
oscillations in fundamental and clinical research on ongoing oscillations.
Mnemonic processing and temporal correlation properties of oscillations
Electrophysiological studies using intracranial electrode recordings, EEG, or MEG have
identified a sustained increase in parietal alpha activity as a hallmark of mnemonic
activity in humans (19-21). We have previously proposed that the amplitude modulation
of oscillations and their temporal correlations on time scales of seconds to tens of
seconds may provide a temporal dimension to functional connectivity that is important
for the temporal integrity of working-memory (17). In other words, higher cognitive
functions, such as maintaining continuity of thoughts during rest, require integrity of
neuronal processing over time to make sense (18) and this may require correlated
activity on multiple time scales. Interestingly, psychological and fMRI studies have
pointed to prominent mnemonic activity during rest (1), and brain regions involved in
mnemonic tasks (34, 37) overlap considerably with those showing high activity during
rest (4). Thus, converging functional and anatomical evidence suggests that one indeed

would expect impaired amplitude dynamics of temporo-parietal alpha oscillations as we
have reported here.
Functional connectivity and temporal correlation properties of oscillations
Memory is believed to depend on the functional connectivity between different brain
areas, and the cognitive symptoms of AD have therefore been proposed to reflect a
"disconnection syndrome" (38). Indeed, there is considerable evidence pointing to
deficits in the functional connectivity of resting-state networks in AD, especially a
reduced involvement of parietal cortices as revealed by functional magnetic resonance
imaging (7, 8, 39). In electrophysiological recordings, linear (40) and non-linear
measures of synchronization (41-43) have been used to identify reduced interregional
correlations, in particular between frontal and parietal regions. Impaired functional
connections in AD may be related to structural atrophy (34), but most likely also
include deficits in cholinergic or other neurotransmitter systems (27, 38, 44, 45).
Failures in any of the components of a large-scale circuit are expected to disrupt
its reverberating activity (14, 46) and to affect the temporal dynamics of activity also
locally. It is therefore plausible that the abnormally weak correlations in alpha
oscillations on time scales up to 25 seconds are in part caused by a "disconnection" in a
large-scale network. It is increasingly being recognized that resting-state activity in
neurocognitive networks have a multi-scale spatio-temporal structure (47); however,
only few studies have explicitly addressed the time-scale dependence of functional
connectivity (48, 49).
Summary and outlook

We have shown that temporal correlations in alpha oscillations, as characterized by
LRTC, life- and waiting-time statistics, are abnormal in temporo-parietal regions in AD.
These brain regions have been implicated with mnemonic processing and exhibit
deficits in blood-flow and metabolism in Alzheimer's patients during rest. To our
knowledge, this is the first study to identify an electrophysiological memory that
operates on time scales up to tens of seconds and that is impaired in a disease of
cognitive memory. We propose that non-invasive mapping of LRTC and other indices
of temporal correlations may provide important biological markers in pre-clinical trials
aimed at investigating the progression and treatment response of patients with AD or
other memory disorders (50).
Methods
Subjects
The study involved 19 patients (73.9 ± 6.4 years (mean ± standard deviation); 11 males)
with a diagnosis of probable AD according to the NINCDS-ADRDA criteria (51) and
16 healthy control subjects (70 ± 6.2 years; 7 males), mostly spouses of the patients.
Patients and control subjects were recruited from the Alzheimer Center at the VU
University Medical Center. Subjects were assessed according to a clinical protocol,
which involved history taking, physical and neurological examination, blood tests, mini-
mental state examination (MMSE) (52), several neuropsychological tests, and routine
EEG. The final diagnosis was based upon a consensus meeting where all the available
clinical data and the results of the ancillary investigations were considered. Mean
MMSE of patients was 21.3 (range: 14–28) and five controls were tested with MMSE
(mean score 29, range: 26–30). Ten patients were taking cholinesterase inhibitors: seven

were taking 24 mg/d of galantamine and three were taking 12 mg/d of rivastigmine. The
same patients and MEG recordings were used in the study of Stam et al. (43). The study
was approved by the Local Research Ethics Committee, and all patients or their
caregivers had given written informed consent.
MEG recording
Four minutes of data were acquired in a 151-channel MEG system (CTF Systems Inc.,
Vancouver, Canada) at 625 Hz and band-pass filtered from 0.25 to 125 Hz. The subjects
were comfortably seated and were instructed to close their eyes. The same acquisition
settings were used for an empty-room recording without a subject in the MEG device to
estimate the background noise of the laboratory.
Data analysis
The recordings were down-sampled off-line to 125 Hz, high-pass filtered at 1 Hz and
low-pass filtered at 45 Hz using finite impulse response filters. The broadband data
were visually inspected in segments of 5 seconds in the EEGLAB (53) data scroll
viewer and segments containing non-periodic artifacts were marked and omitted from
the analysis. Independent component analysis was performed with EEGLAB and
components representing ECG, eye movements or muscular artifacts were removed.
Bad channels were repaired by replacing them with the average of their neighbors, and
planar synthetic gradiometers (for two orthogonal directions giving 300 synthetic
sensors) were computed using the Fieldtrip toolbox
(http://www.ru.nl/fcdonders/fieldtrip/) and the method described in (54). The planar
gradient fields are typically largest in magnitude directly above a given source (21, 54)
and, therefore, provide an interpretation of topographic distributions that is analogous to

projections of statistical maps onto the surface of the brain in PET and fMRI. The
amplitude envelope in the alpha-frequency band was extracted using bandpass filters at
6–13 Hz (finite impulse response filters with a Hamming window and filter order 28)
and the Hilbert transform (Fig. 1C). In this study, we focus on alpha oscillations
because of their known amplitude modulation in mnemonic tasks (19-21) and the
importance of a high signal-to-noise ratio for a robust estimation of temporal
correlations (29).
Analysis of oscillation power and long-range temporal correlations. The decay of
temporal (auto-)correlations in the time range of 1–25 s was estimated with detrended
fluctuation analysis (DFA). The DFA was introduced as a method to quantify
correlations in complex data with less strict assumptions about the stationarity of the
signal than the classical auto-correlation function or power spectral density (55). An
additional advantage of DFA is the greater accuracy in the estimates of correlations,
which facilitates a reliable analysis of LRTC up to time scales of at least 10% of the
duration of the signal (56). The main steps from the broadband MEG signal to the
quantification of LRTC using DFA have been explained in detail elsewhere (22-24). In
brief, the DFA measures the scaling of the root-mean-square fluctuation of the
integrated and linearly detrended signals, F(t), as a function of time window size, t (Fig.
1G). For signals that are uncorrelated or have persistent power-law correlations, the
average fluctuation <F(t)> is of the form <F(t)> = t , where is the DFA scaling
exponent. If 0.5 1.0, this indicates power-law scaling behavior and the presence of
temporal correlations, whereas 0.5 indicates the ideal case of an uncorrelated signal.
The amplitude of oscillations was computed as the mean amplitude envelope after
bandpass filtering and Hilbert transform.
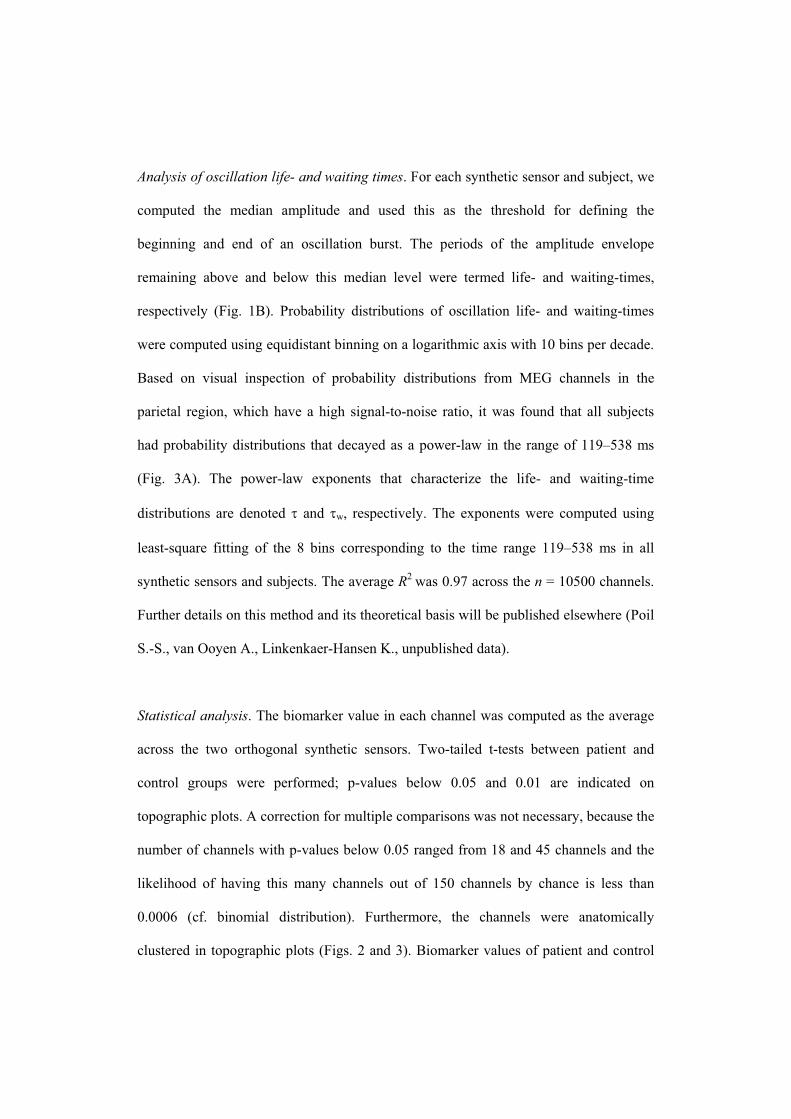
Analysis of oscillation life- and waiting times. For each synthetic sensor and subject, we
computed the median amplitude and used this as the threshold for defining the
beginning and end of an oscillation burst. The periods of the amplitude envelope
remaining above and below this median level were termed life- and waiting-times,
respectively (Fig. 1B). Probability distributions of oscillation life- and waiting-times
were computed using equidistant binning on a logarithmic axis with 10 bins per decade.
Based on visual inspection of probability distributions from MEG channels in the
parietal region, which have a high signal-to-noise ratio, it was found that all subjects
had probability distributions that decayed as a power-law in the range of 119–538 ms
(Fig. 3A). The power-law exponents that characterize the life- and waiting-time
distributions are denoted and w, respectively. The exponents were computed using
least-square fitting of the 8 bins corresponding to the time range 119–538 ms in all
synthetic sensors and subjects. The average R2 was 0.97 across the n = 10500 channels.
Further details on this method and its theoretical basis will be published elsewhere (Poil
S.-S., van Ooyen A., Linkenkaer-Hansen K., unpublished data).
Statistical analysis. The biomarker value in each channel was computed as the average
across the two orthogonal synthetic sensors. Two-tailed t-tests between patient and
control groups were performed; p-values below 0.05 and 0.01 are indicated on
topographic plots. A correction for multiple comparisons was not necessary, because the
number of channels with p-values below 0.05 ranged from 18 and 45 channels and the
likelihood of having this many channels out of 150 channels by chance is less than
0.0006 (cf. binomial distribution). Furthermore, the channels were anatomically
clustered in topographic plots (Figs. 2 and 3). Biomarker values of patient and control

groups are reported as mean ± standard error of mean (SEM) based on the average
values across channels with p < 0.05 in the initial two-tailed t-test. Group differences in
these cross-channel means were computed using two-tailed t-test.
Acknowledgements. T.M. was the recipient of a doctoral fellowship from FCT,
Ministry of Science, Portugal financed by POCI 2010 and FSE and a grant from the
Calouste Gulbenkian Foundation. K.L.-H. received funding from the Danish Research
Agency and the Innovative Research Incentive Schemes of the Netherlands
Organization for Scientific Research (NWO).
References
1. Binder R, et al. (1999) Conceptual Processing during the Conscious Resting
State: A Functional MRI Study. J Cognit Neurosci 11:80-93.
2. Mason MF, et al. (2007) Wandering Minds: The Default Network and Stimulus-
Independent Thought. Science 315:393-395.
3. Smallwood J & Schooler JW (2006) The Restless Mind. Psychological Bulletin
132:946-95813.
4. Fox MD & Raichle ME (2007) Spontaneous fluctuations in brain activity
observed with functional magnetic resonance imaging. Nature Rev Neurosci
8:700-711.
5. Damoiseaux JS, et al. (2006) Consistent resting-state networks across healthy
subjects. Proc Natl Acad Sci USA 103:13848-13853.

6. Gusnard DA & Raichle ME (2001) Searching for a baseline: functional imaging
and the resting human brain. Nature Rev Neurosci 2:685-694.
7. Greicius MD, Srivastava G, Reiss AL, & Menon V (2004) Default-mode
network activity distinguishes Alzheimer's disease from healthy aging: Evidence
from functional MRI. Proc Natl Acad Sci USA 101:4637-4642.
8. Rombouts SA, et al. (2005) Altered resting state networks in mild cognitive
impairment and mild Alzheimer's disease: an fMRI study. Hum Brain Mapp
26:231-239.
9. Babiloni C, et al. (2004) Abnormal fronto-parietal coupling of brain rhythms in
mild Alzheimer's disease: a multicentric EEG study. Eur J Neurosci 19:2583-
2590.
10. Greicius MD, et al. (2007) Resting-State Functional Connectivity in Major
Depression: Abnormally Increased Contributions from Subgenual Cingulate
Cortex and Thalamus. Biol Psych 62:429-437.
11. Aertsen AM, Gerstein GL, Habib MK, & Palm G (1989) Dynamics of neuronal
firing correlation: modulation of "effective connectivity". J Neurophysiol
61:900-917.
12. Friston KJ (1994) Functional and effective connectivity in neuroimaging: A
synthesis. Hum Brain Mapp 2:56-78.
13. Sporns O, Chialvo DR, Kaiser M, & Hilgetag CC (2004) Organization,
development and function of complex brain networks. Trends Cogn Sci 8:418-
425.
14. Varela F, Lachaux J-P, Rodriguez E, & Martinerie J (2001) The brainweb: Phase
synchronization and large-scale integration. Nature Rev Neurosci 2:229-239.

15. Singer W (1999) Neuronal Synchrony: A Versatile Code Review for the
Definition of Relations? Neuron 24:49-65.
16. Fries P (2005) A mechanism for cognitive dynamics: neuronal communication
through neuronal coherence. Trends Cogn Sci 9:474-480.
17. Linkenkaer-Hansen K, et al. (2005) Breakdown of Long-Range Temporal
Correlations in Theta Oscillations in Patients with Major Depressive Disorder. J
Neurosci 25:10131-10137.
18. Cowan N (1998) Visual and auditory working memory capacity. Trends Cogn
Sci 2:77-77.
19. Raghavachari S, et al. (2001) Gating of Human Theta Oscillations by a Working
Memory Task. J Neurosci 21:3175-3183.
20. Jensen O, Gelfand J, Kounios J, & Lisman JE (2002) Oscillations in the Alpha
Band (9-12 Hz) Increase with Memory Load during Retention in a Short-term
Memory Task. Cereb Cortex 12:877-882.
21. Jokisch D & Jensen O (2007) Modulation of Gamma and Alpha Activity during
a Working Memory Task Engaging the Dorsal or Ventral Stream. J Neurosci
27:3244-3251.
22. Linkenkaer-Hansen K, Nikouline VV, Palva JM, & Ilmoniemi RJ (2001) Long-
Range Temporal Correlations and Scaling Behavior in Human Brain
Oscillations. J Neurosci 21:1370-1377.
23. Linkenkaer-Hansen K, et al. (2004) Stimulus-induced change in long-range
temporal correlations and scaling behaviour of sensorimotor oscillations. Eur J
Neurosci 19:203-218.

24. Nikulin VV & Brismar T (2005) Long-range temporal correlations in
electroencephalographic oscillations: Relation to topography, frequency band,
age and gender. Neuroscience 130:549-558.
25. Leopold DA, Murayama Y, & Logothetis NK (2003) Very Slow Activity
Fluctuations in Monkey Visual Cortex: Implications for Functional Brain
Imaging. Cereb Cortex 13:422-433.
26. Jeong J (2004) EEG dynamics in patients with Alzheimer's disease. Clinical
Neurophysiology 115:1490-1505.
27. Osipova D, et al. (2005) Altered generation of spontaneous oscillations in
Alzheimer's disease. NeuroImage 27:835-841.
28. Fernandez A, et al. (2002) Focal temporoparietal slow activity in Alzheimer's
disease revealed by magnetoencephalography. Biol Psych 52:764-770.
29. Linkenkaer-Hansen K, et al. (2007) Genetic Contributions to Long-Range
Temporal Correlations in Ongoing Oscillations. J Neurosci 27:13882-13889.
30. Harris TE (2002) The Theory of Branching Processes (Courier Dover
Publications).
31. Plenz D & Thiagarajan TC (2007) The organizing principles of neuronal
avalanches: cell assemblies in the cortex? Trends Neurosci 30:101-110.
32. Monto S, Vanhatalo S, Holmes MD, & Palva JM (2007) Epileptogenic
Neocortical Networks Are Revealed by Abnormal Temporal Dynamics in
Seizure-Free Subdural EEG. Cereb Cortex 17:1386-1393.
33. Parish LM, et al. (2004) Long-range temporal correlations in epileptogenic and
non-epileptogenic human hippocampus. Neuroscience 125:1069-1076.

34. Buckner RL (2004) Memory and Executive Function in Aging and AD: Multiple
Factors that Cause Decline and Reserve Factors that Compensate. Neuron
44:195-208.
35. Johannsen P, Jakobsen J, & Gjedde A (2000) Statistical maps of cerebral blood
flow deficits in Alzheimer's disease. Eur J Neurol 7:385-392.
36. Thompson PM, et al. (2003) Dynamics of Gray Matter Loss in Alzheimer's
Disease. J Neurosci 23:994-1005.
37. Kuhl BA, Dudukovic NM, Kahn I, & Wagner AD (2007) Decreased demands
on cognitive control reveal the neural processing benefits of forgetting. Nature
Neurosci 10:908-914.
38. Delbeuck X, Van der Linden M, & Collette F (2003) Alzheimer' Disease as a
Disconnection Syndrome? Neuropsych Rev 13:79-92.
39. Lustig C, et al. (2003) Functional deactivations: Change with age and dementia
of the Alzheimer type. Proc Natl Acad Sci USA 100:14504-14509.
40. Dunkin JJ, Leuchter AF, Newton TF, & Cook IA (1994) Reduced EEG
coherence in dementia: State or trait marker? Biol Psych 35:870-879.
41. Babiloni C, et al. (2004) Abnormal fronto-parietal coupling of brain rhythms in
mild Alzheimer's disease: a multicentric EEG study. European Journal of
Neuroscience 19:2583-2590.
42. Stam CJ, et al. (2005) Disturbed fluctuations of resting state EEG
synchronization in Alzheimer's disease. Clin Neurophysiol 116:708-715.
43. Stam CJ, et al. (2006) Magnetoencephalographic evaluation of resting-state
functional connectivity in Alzheimer's disease. NeuroImage 32:1335-1344.
44. Osipova D, et al. (2003) Effects of scopolamine on MEG spectral power and
coherence in elderly subjects. Clinical Neurophysiology 114:1902-1907.

45. Maxim V, et al. (2005) Fractional Gaussian noise, functional MRI and
Alzheimer's disease. NeuroImage 25:141-158.
46. Maestu F, et al. (2003) Do cognitive patterns of brain magnetic activity correlate
with hippocampal atrophy in Alzheimer's disease? J Neurol Neurosurg
Psychiatry 74:208-212.
47. Bressler SL & Tognoli E (2006) Operational principles of neurocognitive
networks. Int J Psychophysiol 60:139-148.
48. Honey CJ, Kotter R, Breakspear M, & Sporns O (2007) Network structure of
cerebral cortex shapes functional connectivity on multiple time scales. Proc Natl
Acad Sci USA 104:10240.
49. Nikouline VV, Linkenkaer-Hansen K, Huttunen J, & Ilmoniemi RJ (2001)
Interhemispheric phase synchrony and amplitude correlation of spontaneous
beta oscillations in human subjects: a magnetoencephalographic study.
NeuroReport 12:2487-2491.
50. Thal LJ, et al. (2006) The role of biomarkers in clinical trials for Alzheimer
disease. Alzheimer Dis Assoc Disord 20:6-15.
51. McKhann G (1984) (AAN Enterprises), pp. 939-944.
52. Folstein MF, Folstein SE, & McHugh PR (1975) "Mini-mental state": A
practical method for grading the cognitive state of patients for the clinician. J
Psych Res 12:189-198.
53. Delorme A & Makeig S (2004) EEGLAB: an open source toolbox for analysis
of single-trial EEG dynamics including independent component analysis. J
Neurosci Meth 134:9-21.

54. Bastiaansen MCM & Knosche TR (2000) Tangential derivative mapping of
axial MEG applied to event-related desynchronization research. Clinical
Neurophysiology 111:1300-1305.
55. Peng CK, et al. (1994) Mosaic organization of DNA nucleotides. Physical
Review E 49:1685.
56. Gao J, et al. (2006) Assessment of long-range correlation in time series: How to
avoid pitfalls. Physical Review E (Statistical, Nonlinear, and Soft Matter
Physics) 73:016117-016110.
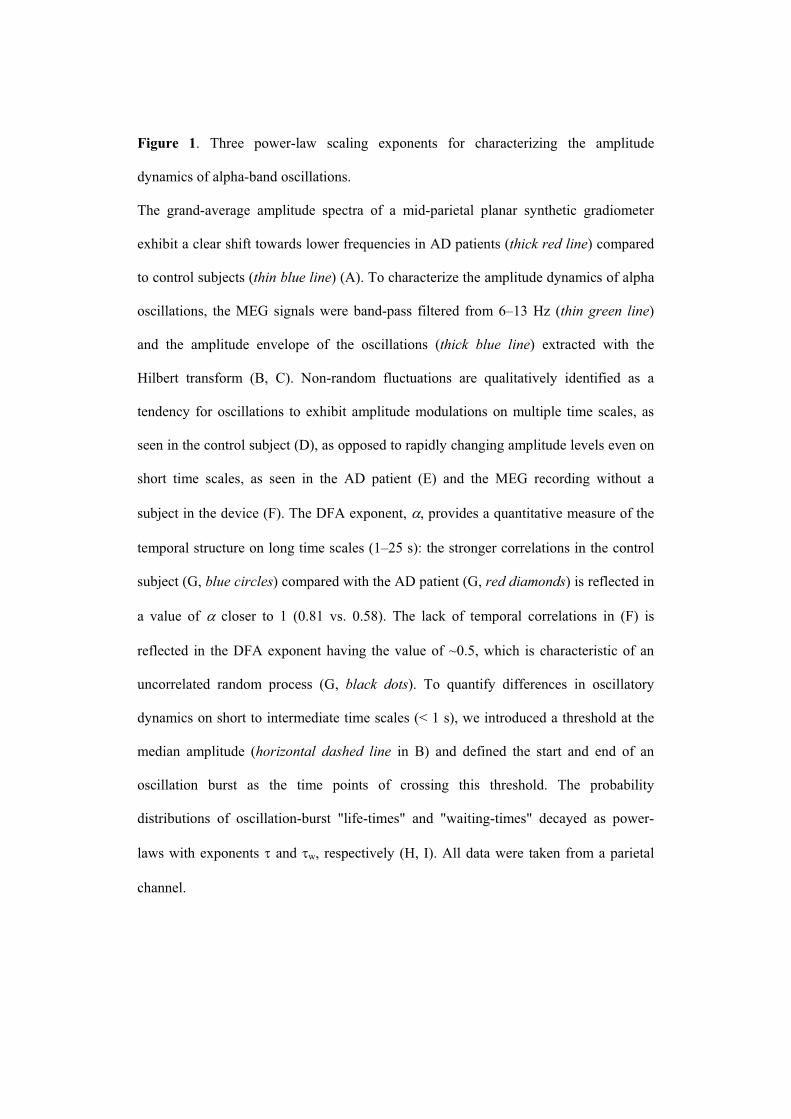
Figure 1. Three power-law scaling exponents for characterizing the amplitude
dynamics of alpha-band oscillations.
The grand-average amplitude spectra of a mid-parietal planar synthetic gradiometer
exhibit a clear shift towards lower frequencies in AD patients (thick red line) compared
to control subjects (thin blue line) (A). To characterize the amplitude dynamics of alpha
oscillations, the MEG signals were band-pass filtered from 6–13 Hz (thin green line)
and the amplitude envelope of the oscillations (thick blue line) extracted with the
Hilbert transform (B, C). Non-random fluctuations are qualitatively identified as a
tendency for oscillations to exhibit amplitude modulations on multiple time scales, as
seen in the control subject (D), as opposed to rapidly changing amplitude levels even on
short time scales, as seen in the AD patient (E) and the MEG recording without a
subject in the device (F). The DFA exponent, , provides a quantitative measure of the
temporal structure on long time scales (1–25 s): the stronger correlations in the control
subject (G, blue circles) compared with the AD patient (G, red diamonds) is reflected in
a value of closer to 1 (0.81 vs. 0.58). The lack of temporal correlations in (F) is
reflected in the DFA exponent having the value of ~0.5, which is characteristic of an
uncorrelated random process (G, black dots). To quantify differences in oscillatory
dynamics on short to intermediate time scales (< 1 s), we introduced a threshold at the
median amplitude (horizontal dashed line in B) and defined the start and end of an
oscillation burst as the time points of crossing this threshold. The probability
distributions of oscillation-burst "life-times" and "waiting-times" decayed as power-
laws with exponents and w, respectively (H, I). All data were taken from a parietal
channel.
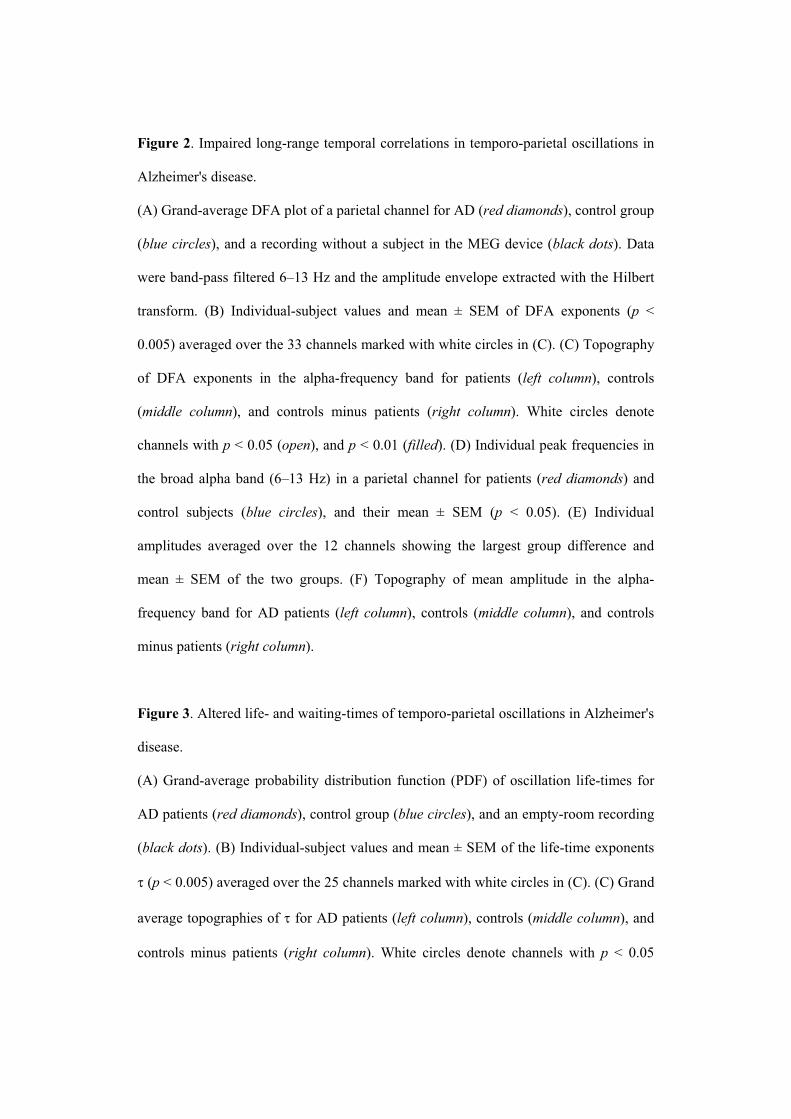
Figure 2. Impaired long-range temporal correlations in temporo-parietal oscillations in
Alzheimer's disease.
(A) Grand-average DFA plot of a parietal channel for AD (red diamonds), control group
(blue circles), and a recording without a subject in the MEG device (black dots). Data
were band-pass filtered 6–13 Hz and the amplitude envelope extracted with the Hilbert
transform. (B) Individual-subject values and mean ± SEM of DFA exponents (p <
0.005) averaged over the 33 channels marked with white circles in (C). (C) Topography
of DFA exponents in the alpha-frequency band for patients (left column), controls
(middle column), and controls minus patients (right column). White circles denote
channels with p < 0.05 (open), and p < 0.01 (filled). (D) Individual peak frequencies in
the broad alpha band (6–13 Hz) in a parietal channel for patients (red diamonds) and
control subjects (blue circles), and their mean ± SEM (p < 0.05). (E) Individual
amplitudes averaged over the 12 channels showing the largest group difference and
mean ± SEM of the two groups. (F) Topography of mean amplitude in the alpha-
frequency band for AD patients (left column), controls (middle column), and controls
minus patients (right column).
Figure 3. Altered life- and waiting-times of temporo-parietal oscillations in Alzheimer's
disease.
(A) Grand-average probability distribution function (PDF) of oscillation life-times for
AD patients (red diamonds), control group (blue circles), and an empty-room recording
(black dots). (B) Individual-subject values and mean ± SEM of the life-time exponents
(p < 0.005) averaged over the 25 channels marked with white circles in (C) (C) Grand
average topographies of for AD patients (left column), controls (middle column), and
controls minus patients (right column). White circles denote channels with p < 0.05

(open), and p < 0.01 (filled) in all topographic plots. (D) Cumulative probability
distribution function (CDF) of oscillation life-times for AD (red line) and control group
(blue line). The grand-average 95%-percentiles are marked with vertical lines. (E)
Individual values and means ± SEM of cumulative life-times averaged over the 45
channels marked with white circles in (F) (p < 0.005). (F) Grand average topographies
of cumulative life-times at the 95%-percentile for AD patients (left column), controls
(middle column), and controls minus patients (right column). (G) Grand-average
probability distribution of waiting-times for channels with a significant group difference
for AD (red diamonds), control group (blue circles), and the empty-room recording
(black dots). (H) Individual values and means ± SEM of w averaged over the 18
channels marked with white circles in (I) (p < 0.005). (I) Grand-average topography of
waiting-times for AD patients (left column), controls (middle column), and controls
minus patients (right column).
Figure 4. Temporal correlation properties of alpha oscillations are different on short
and long time scales.
Scatter plots showing insignificant correlations between DFA exponents and power-law
exponents of oscillation life-times (A) and waiting-times (B) for AD patients (red
diamonds) and control group (blue circles).


1
2
3
Am
pl.s
pect
rum
3
2
1
A
1
2
3
5 10 15 20 25 30Frequency [Hz]
B 321012
Life-time
Waiting-time
Threshold
C2
0
2
1.5 s0.5 s
Am
pl. [
rel.]
1
2
3
0.1
0.20.3
0 10 20 30 40 50Time [s]
Am
pl. [
rel.]
1
Log 10
(P(t)
)
Life-time [ms]119 538 119 5381 20
Waiting-time [ms]
0
Log 10
(<F(t)>
)
t [s]
D
F
E
G H I
3
2
1
2
Figure 1
Control subject
Alzheimer’s Patient
Empty-room recording

1 2 10 20
1
2
t [s]
Figure 2Lo
g 10 (<F
(t)>)
A
6
8
10
Pea
k fre
quen
cy [H
z]
0
1
2
Am
plitu
de [r
el.]
B C
D E F
AD Control Control AD
0.08 0.0800.6 0.80.7
0.1 1.40.7 0.2 0.20
* ns.
**
DFA
Am
plitu
de
AD Control AD Control
AD Control
Ampl.
0.8
0.7
0.6

1.2
1.4
1.6
1.8
2.0
2.2
1.4
1.6
1.8
2.0
A
127 201 319 505
B C
E F
G H I
**
Figure 3
0
1Log 10
(P(t)
)
0
1
127 201 319 505t [ms]
2.5 1.52 0.300.3
304 488396 0 7878
2.2 1.51.85 0.2500.25
AD Control Control AD
88
95
100
P(Li
fe-ti
me
< t)
[%]
80
D
240 400 560 720
Log 10
(P(t)
)
Life
-tim
e P
DF
Life
-tim
e C
DF
Wai
ting-
time
PD
F
w
t (95%)
AD Control
AD Control
**
w
480
AD
**
Control
t (95
%) [
ms]
400
320
560

Figure 4
[DFA]
[Life
-tim
e]
w[W
aitin
g-tim
e]
0.6 0.7 0.8 0.6 0.7 0.8
2.2
1.8
1.4
2.0
1.2
1.6
A BrAD= 0.3ns
rC = 0.3nsrAD= 0.4ns
rC = 0.4ns
[DFA]

P1 ……
P2 ……
P3 ……
P4 ……


Disturbed fluctuations of resting state EEG synchronization
in Alzheimer’s disease
C.J. Stama,*, T. Montezb,e, B.F. Jonesa,c, S.A.R.B. Romboutsd,Y. van der Madea, Y.A.L. Pijnenburgc, Ph. Scheltensc
aAlzheimer Centre, Department of Clinical Neurophysiology, VU University Medical Centre, P.O. Box 7057, 1007 MB Amsterdam, The NetherlandsbMEG Centre, VU University Medical centre, P.O. Box 7057, 1007 MB Amsterdam, The Netherlands
cAlzheimer Centre, Department of Neurology, VU University Medical Centre, P.O. Box 7057, 1007 MB Amsterdam, The NetherlandsdDepartment of Physics & Medical Technology, VU University Medical Centre, P.O. Box 7057, 1007 MB Amsterdam, The Netherlands
eInstitute of Biophysics and Biomedical Engineering, Faculty of Sciences, University of Lisbon, Portugal
Accepted 25 September 2004
Available online 28 October 2004
Abstract
Objective: We examined the hypothesis that cognitive dysfunction in Alzheimer’s disease is associated with abnormal spontaneous
fluctuations of EEG synchronization levels during an eyes-closed resting state.
Methods: EEGs were recorded during an eyes-closed resting state in Alzheimer patients (NZ24; 9 males; mean age 76.3 years; SD 7.8;
range 59–86) and non-demented subjects with subjective memory complaints (NZ19; 9 males; mean age 76.1 years; SD 6.7; range: 67–89).
The mean level of synchronization was determined in different frequency bands with the synchronization likelihood and fluctuations of the
synchronization level were analysed with detrended fluctuation analysis (DFA).
Results: The mean level of EEG synchronization was lower in Alzheimer patients in the upper alpha (10–13 Hz) and beta (13–30 Hz)
band. Spontaneous fluctuations of synchronization were diminished in Alzheimer patients in the lower alpha (8–10 Hz) and beta bands.
In patients as well as controls the synchronization fluctuations showed a scale-free pattern.
Conclusions: Alzheimer’s disease is characterized both by a lower mean level of functional connectivity as well as by diminished
fluctuations in the level of synchronization. The dynamics of these fluctuations in patients and controls was scale-free which might point to
self-organized criticality of neural networks in the brain.
Significance: Impaired functional connectivity can manifest itself not only in decreased levels of synchronization but also in disturbed
fluctuations of synchronization levels.
q 2004 International Federation of Clinical Neurophysiology. Published by Elsevier Ireland Ltd. All rights reserved.
Keywords: Alzheimer’s disease; EEG synchronization; Detrended fluctuation analysis; Functional connectivity; Resting state; Self-organized criticality
1. Introduction
The exact nature of the neurophysiological processes
underlying cognitive dysfunction in Alzheimer’s disease is
still incompletely understood. Many EEG studies have
shown a slowing of the dominant rhythms in Alzheimer’s
disease (for a recent review see Jeong, 2004). This EEG
slowing is usually interpreted as an indication of impaired
activity of neural networks, possibly due to a lack of
1388-2457/$30.00 q 2004 International Federation of Clinical Neurophysiology.
doi:10.1016/j.clinph.2004.09.022
* Corresponding author. Tel.: C31 20 4440727; fax: C31 20 4444816.
E-mail address: [email protected] (C.J. Stam).
the excitatory neurotransmitter acetylcholine (Francis et al.,
1999). Studies with functional MRI also point in the
direction of impaired activity, especially during tasks
that involve the medial temporal lobe memory systems
(Rombouts et al., 2000). However, a simple relation
between EEG slowing/impaired activity and cognitive
dysfunction does not exist. For instance, there is no
correlation between the frequency of the dominant alpha
rhythm and intelligence (Posthuma et al., 2001).
Another approach focuses on the notion that higher brain
functions invariably require cooperation of widely distri-
buted specialized brain regions. According to this view,
Clinical Neurophysiology 116 (2005) 708–715
www.elsevier.com/locate/clinph
Published by Elsevier Ireland Ltd. All rights reserved.

C.J. Stam et al. / Clinical Neurophysiology 116 (2005) 708–715 709
cognitive dysfunction in Alzheimer’s disease might be due to
a disturbance of these functional interactions between
different brain regions. The idea that Alzheimer’s disease is
a disconnection syndrome is supported by neuropsychologi-
cal, neuroanatomical and neurophysiological data
(Delbeuck et al., 2003). Because of their high temporal
resolution, EEG and MEG (magneto encephalography) are
particularly suited for studying functional interactions
between brain regions, although interpretation of such
studies is complicated by the influence of volume conduction
(Nolte et al., 2004). Abnormalities in coherence, which is a
linear measure of the frequency dependent correlation
between different EEG channels, support the notion of a
disconnection syndrome in Alzheimer’s disease (Adler et al.,
2003; Berendse et al., 2000; Besthorn et al., 1994; Dunkin
et al., 1994; Knott et al., 2000; Leuchter et al., 1987, 1992;
Locatelli et al., 1998). Recently, these results have been
confirmed with nonlinear measures of correlation between
EEG and MEG signals such as the mutual information (Jeong
et al., 2001) and the synchronization likelihood (Pijnenburg
et al., 2004; Stam et al., 2002b, 2003b).
However, a decrease in the mean level of functional
interactions between different brain regions may reflect only
part of the abnormalities in Alzheimer’s disease. There is
increasing support for the notion that cognition is essentially a
dynamic process which requires the constant creation and
destruction of different synchronized neural networks
(Breakspear and Terry, 2002; Freeman and Rogers, 2002;
Friston, 2000; Rodriguez et al., 1999). This process of
formation and destruction of synchronous networks is
reflected in spontaneous fluctuations in the mean level of
synchronization. A promising method to characterize these
spontaneous fluctuations in the mean level of synchronization
is detrended fluctuation analysis (Peng et al., 1992, 1995).
This method characterizes the relation between the variance
of some measure (after correction for the local linear trend) as
a function of time scale. In complex dynamical systems this
relation often obeys a power law. Consequently, in this case,
the logarithm of the fluctuations is a simple linear function of
the logarithm of the time scale and can be characterized
completely by its slope (DFA exponent) and its intercept with
the Y-axis. Systems that display this kind of behaviour are said
to be ‘scale free’. Such systems do not have one characteristic
time scale, but show similar statistical properties on all
timescales. Several studies have applied detrended fluctu-
ation analysis to single channel EEG analysis and have found
indications for scale free fluctuations (Linkenkaer-Hansen
et al., 2001; Worrell et al., 2002). Recently, we have shown
that spontaneous fluctuations of synchronization between
EEG channels in healthy subjects also display scale free
characteristics (Stam and de Bruin, 2004).
The present study was undertaken to examine the
hypothesis that Alzheimer’s disease is characterized not
only by a decrease in the mean level of synchronization, but
also by abnormalities in the spontaneous fluctuations of the
synchronization level. For this purpose we examined resting
state EEG recordings of 24 patients with Alzheimer’s
disease and 19 non-demented subjects with subjective
memory complaints. Global levels of EEG synchronization
in different frequency bands were quantified with the
synchronization likelihood (Stam and van Dijk, 2002).
Time series of spontaneous fluctuations in the synchroniza-
tion likelihood level were examined with detrended
fluctuation analysis.
2. Methods and materials
2.1. Subjects
The study involved consecutive subjects referred to the
Alzheimer Centre at the VU university medical centre (Y.P.;
P.S.). All subjects were studied according to a protocol
which involved history taking, physical and neurological
examination, blood tests (ESR, hemoglobin, white cell
count, serum electrolytes, glucose, BUN, creatinine, liver
function tests, TSH and free thyroid hormone, vitamin B1
and B6 levels, syphilis serology), MMSE, neuropsycholo-
gical examination, MRI of the brain and a quantitative EEG.
The final diagnosis was based upon a consensus meeting
where all the available clinical data and the results of the
ancillary investigations were considered. A diagnosis of
probable Alzheimer’s disease was based upon the McKhann
criteria (McKhann et al., 1984).
The present study concerns 43 subjects, 24 with a
diagnosis of probable Alzheimer’s disease (9 males; mean
age 76.3 years; SD 7.8; range 59–86); and 19 control
subjects with only subjective memory complaints (‘SC’; 9
males; mean age 76.1 years; SD 6.7; range: 67–89). Mean
MMSE score of the Alzheimer patients was 18.8 (SD 3.8;
range 10–26); mean MMSE score of the SC subjects was
27.6 (SD 2.5; range 22–30).
2.2. EEG recording
EEGs were recorded in all subjects as part of the
examination protocol. EEGs were recorded (against C3–C4)
with a Nihon Kohden digital EEG apparatus (EEG 2100) at
the following positions of the 10–20 system: Fp2, Fp1, F8,
F7, F4, F3, A2, A1, T4, T3, C4, C3, T6, T5, P4, P3, O2, O1,
Fz, Cz, Pz. ECG was recorded in a separate channel.
Electrode impedance was below 5 kOhm. Initial filter
settings were: time constant, 1 s; low pass filter, 70 Hz.
Sample frequency was 200 Hz and A–D precision 12 bit.
EEGs were recorded in a sound attenuated, dimly lit room
while patients sat in a slightly reclined chair. Care was taken
by the EEG technicians to keep the patients awake during
the whole recording. For the present analysis artefact-free
epochs (containing no eye-blinks, slow eye-movements,
excess muscle activity, ECG artefacts etc.) of 4096 samples
(20.475 s) were selected off-line. These epochs were re-
referenced to an average reference electrode, involving all

C.J. Stam et al. / Clinical Neurophysiology 116 (2005) 708–715710
electrodes except Fp2 and Fp1. Computation of the
synchronization likelihood and detrended fluctuation anal-
ysis were done with the DIGEEGXP software written by
one of the authors (CS). The synchronization likelihood
time series was determined and the detrended fluctuation
analysis was done on this time series. All analyses were
done separately for the following frequency bands: delta
(0.5–4 Hz); theta (4–8) Hz, lower alpha or alpha1
(8–10 Hz), upper alpha or alpha 2 (10–13 Hz), beta (13–
30 Hz) and gamma (30–48 Hz).
Fig. 1. Mean synchronization likelihood (error bars denote standard
deviations) of Alzheimer patients (AD; NZ24) and subjects with subjective
memory complaints (SC; NZ19) for different frequency bands. Alzheimer
patients had a significantly lower synchronization in the upper alpha and
beta band. P values in plot correspond to two-tailed t-test.
2.3. Synchronization likelihood
The synchronization likelihood (SL) is a measure of the
statistical interdependencies between two time series, for
instance two EEG channels. The synchronization likelihood
takes on values between Pref (a small number close to 0) in the
case of independent time series and one in the case of fully
synchronized time series. The synchronization likelihood is
sensitive to linear as well as non-linear interdependencies
and can be computed for each time sample, making it suitable
for tracking time-dependent changes in the synchronization
level. For a technical description of the method and its
properties we refer to Stam and van Dijk (2002). Here we
explain the general principles.
Assume we have two time series xi and yi, where the
index i denotes discrete time. From each of these time series
and for each time i we construct m dimensional vectors Xi
and Yi in state space with the method of time-delay
embedding (Takens, 1981) as follows:
Xi Z ðxi; xiCL; xiC2L; xiC3L;.; xiCðmK1ÞLÞ (1)
where L is the time lag, and m the embedding dimension.
These m-dimensional vectors Xi (Yi is defined similarly) can
be thought of as representing the ‘state’ of the system
underlying the time series at a moment in time. Synchroni-
zation likelihood is now defined as the conditional likelihood
that Yi and Yj will be very close together (‘close together’
means that the distance between Yi and Yj in state space is
smaller than the critical cut-off distance), given that Xi and Xj
are very close together. In other words, the synchronization
likelihood is the likelihood that if system X is (almost) in the
same state at two different times i and j, that system Y will
also be (almost) in the same state at i and j. In the case of
maximal synchronization this chance is 1; in the case of
independent systems, it is a small, but non-zero number,
namely Pref. This small number is the likelihood that two
randomly chosen vectors Y (or X) will be closer than the cut-
off distance. In practice, the cut-off distance is chosen such
that the likelihood of random vectors being close is fixed at
Pref, which is chosen the same for X and for Y.
In the computation of distances between the vectors Xi,
Xj and Yi, Yj, further restrictions are involved: only those
vectors are used where the time indices fall in a range
determined by two windows: (w1!jiKjj!w2) (jj denotes
absolute values). The first window w1, also termed Theiler
correction, excludes vector pairs from the calculations that
are close together simply due to autocorrelation properties
of the time series (Theiler, 1986). The second window w2
increases the time resolution of the SL computation by
excluding vector pairs that are too far away in time. In the
present study w1Z100 and w2 was 1/10 of the length of the
EEG time series. The other parameters were set as follows:
log LZ10; embedding dimension mZ10; PrefZ0.01. With
the exception of Pref, these choices were the same as in a
number of previous studies (Stam et al., 2002a,b, 2003a,b).
In the present study we computed the synchronization
likelihood averaged over all possible pairs of channels
(19!18/2) for each 16th time sample of the EEG time
series. This resulted in a ‘time series’ of SL values with a
length of 4096/16Z256 samples (the length of the EEG
time series was 4096 samples). This time series of
synchronization values was subjected to detrended fluctu-
ation analysis.
2.4. Detrended fluctuation analysis
Detrended fluctuation analysis (DFA) is a technique used
to characterize the correlation structure of non-stationary
time series. DFA studies investigate how the variance in a
time series depends upon the timescale used to determine
this variance; this dependence is characterized by the
exponent of a linear fit through a double logarithmic plot of
variance as a function of timescale. It was initially
introduced to characterize long-range correlations between
nucleotide sequences (Peng et al., 1992). Here we closely
follow the description of the method as given by Peng et al.
(1995). A schematic representation is shown in Fig. 1 of
Stam and de Bruin (2004).
The analysis is applied to a discrete time series x(i),
iZ1.N, which in the present study represents

C.J. Stam et al. / Clinical Neurophysiology 116 (2005) 708–715 711
the synchronization likelihood averaged over all pairs of
channels for each time sample (NZ4096/16Z256). In the
first step, the mean is subtracted from this time series and
the time series is integrated
yðkÞ ZXk
iZ1
½xðiÞK hxi (2)
where hxi is the average of the synchronization likelihood
time series. Next, the de-meaned, integrated time series y(k)
is divided in a number of segments with length n (n
represents the time scale of observation). In this study we
used the following segment lengths: 4, 8, 16, 32, 64 and 128
samples. For each of these segments, the local least-squares
linear fit is determined. The ensuing piece-wise linear fit is
designated yn(k). Then, the integrated time series y(k) is
detrended by subtracting the local linear fit yn(k) for each
segment. The root mean square fluctuation of this integrated
and detrended time series is given by:
FðnÞ Z
ffiffiffiffiffiffiffiffiffiffiffiffiffiffiffiffiffiffiffiffiffiffiffiffiffiffiffiffiffiffiffiffiffiffiffiffiffiffiffiffiffi1
N
XN
kZ1
½yðkÞKynðkÞ2
vuut (3)
Subsequently, this determination of F(n) is repeated for a
range of different scales n (in the present study n ranged
from 4 samples to 128 samples). In a final step, the
logarithm of F(n) is plotted as a function of the logarithm of
the time scale n (we used logarithms with a base of 2). If the
time series x(i) has self-similar, scale-free (fractal) proper-
ties, this plot will display a linear scaling region with a
certain scaling exponent. The exponent of the plot of
Log2(F(n))/Log2(n) is called the scaling or self-similarity
coefficient. This exponent is 0.5 if x(i) is uncorrelated white
noise; it is 1.5 if x(i) is Brownian noise (which is highly
correlated), and it is 1 if x(i) is 1/f noise.
However, it cannot be excluded that the exponent will be
influenced by such factors as finite data length, filtering and
computation of the synchronization likelihood (which
involves several windows). To determine the extent to
Table 1
Mean results (SD in brackets) of the detrended fluctuation analysis of the synchr
Measure Group Frequency band
0.5–4 Hz 4–8 Hz 8
Exponent AD 0.841* (0.092) 0.900* (0.117) 0
SC 0.838* (0.087) 0.959* (0.139) 1
Noise 0.673 (0.083) 0.710 (0.061)
Intercept AD K8.493 (0.192) K8.814 (0.262) K
SC K8.528 (0.272) K8.852 (0.339) K
Noise K9.232 (0.213) K9.652 (0.131) K
R2 AD 0.990$ (0.007) 0.984 (0.011)
SC 0.989 (0.011) 0.988 (0.010)
Noise 0.984 (0.011) 0.980 (0.015)
‘Exponent’, exponent of the linear fit through the DFA plot; ‘Intercept’, intercep
goodness of fit; AD, Alzheimer patients (NZ24); SC, subjects with subjective m
*P!0.001 (significant difference compared with noise); $P!0.05 (significant d&P!0.10 (trend AD–SC).
which this is the case, and to allow a statistical test of the
hypothesis that the DFA exponentOexponent of noise, 20
control data sets were generated. These data sets had the
same dimensions (data length; number of channels) as the
EEG data, but all channels were filled with white noise, and
there were no correlations between the channels. These 20
data sets were analysed in the same way as the EEG data.
In the present study the linear fit was determined from 6
points of the DFA plot. From this fit the exponent, the
intercept with the Y-axis and the goodness of fit (expressed
as the squared correlation coefficient R2) were determined.
2.5. Statistical analysis
Statistical analysis was done with SPSS for Windows,
version 10.0.7. Differences in group means were tested with
independent samples t-tests. Correlations between MMSE
scores and EEG measures (mean synchronization, DFA
exponent, intercept and R2 for all frequency bands) were
determined with Pearson correlation coefficients. The
significance level was set at P!0.05.
3. Results
The mean synchronization likelihood (averaged over all
pair-wise combinations of channels and all time points) for
both groups and all frequency bands is shown in Fig. 1.
Differences between Alzheimer patients and subjects with
subjective complaints were tested with independent samples
t-tests (equal variances not assumed) for each frequency
band. Mean synchronization was significantly lower in the
Alzheimer group in the alpha 2 band (t[41]ZK2.362; PZ0.024) and in the beta band (t[41]ZK2.630; PZ0.013).
Group differences in the other frequency bands were not
significant.
The mean results of the DFA analysis are shown in
Table 1. In all frequency bands the 3 DFA measures
(exponent, intercept and goodness of fit) were compared
onization likelihood time series in different frequency bands
–10 Hz 10–13 Hz 13–30 Hz 30–48 Hz
.970*& (0.134) 0.842*# (0.104) 0.690* (0.091) 0.618* (0.070)
.031*& (0.093) 0.786*# (0.077) 0.707* (0.091) 0.639* (0.092)
0.716 (0.074) 0.681 (0.076) 0.580 (0.058) 0.551 (0.068)
9.096 (0.432) K9.312# (0.180) K9.361& (0.241) K9.410 (0.254)
8.920 (0.481) K9.085# (0.218) K9.180& (0.342) K9.470 (0.219)
9.900 (0.198) K9.875 (0.178) K10.044 (0.151) K9.98 (0.166)
0.994 (0.005) 0.992 (0.0112) 0.988 (0.008) 0.988 (0.112)
0.996$ (0.004) 0.987 (0.014) 0.987 (0.014) 0.992$ (0.006)
0.990 (0.012) 0.987 (0.015) 0.987 (0.013) 0.981 (0.019)
t of the linear fit; ‘R2’, squared correlation coefficient as a measure of the
emory complaints (NZ19); Noise, uncorrelated noise data sets (NZ20).
ifference compared with noise); #P!0.05 (significant difference AD–SC);

Fig. 2. Mean DFA plots (error bars denote standard deviations) of
Alzheimer patients (AD; NZ24) and subjects with subjective memory
complaints (SC; NZ19) for the lower alpha band (8–10 Hz). The plot
shows the LOG2 of the detrended fluctuation FN as a function of time scale
N (s). For comparison the results of a control data set of 20 white noise
epochs subjected to the same analysis (filtering, SL computation and DFA
analysis of the SL time series) as the EEG data are shown.
C.J. Stam et al. / Clinical Neurophysiology 116 (2005) 708–715712
between AD patients, subjects with subjective complaints
and noise control data (however, for the noise control data
the intercep was not considered in the statistical analysis
since it is arbitrary). Although the exponent for the noise
data was higher than 0.5, the exponent of the EEG data
(both AD and SC) was significantly larger compared to the
exponent of the noise data in all frequency bands (P!0.001 for all comparisons). The goodness of fit for the
noise data was close to 1 in all frequency bands, but it was
significantly smaller (implying a worse linear fit) compared
to the fit for the AD group in the delta band, and compared
to the fit for the SC group in the lower alpha and the
gamma band.
In the lower alpha band there was a trend in the
direction of a smaller DFA exponent for the AD group
compared to the SC group (PZ0.085); in the upper alpha
band the DFA exponent was significantly larger in the
AD group compared to the SC group (PZ0.048). The
DFA intercept was smaller in the AD group compared to
the SC group in the upper alpha band, (PZ0.008) and
there was a trend in the same direction in the beta band
(PZ0.059). Detailed results for the lower alpha band are
shown in Fig. 2, for the upper alpha band in Fig. 3 and
for the beta band in Fig. 4. In the theta band there was a
positive correlation between the DFA exponent and the
MMSE score.
In the upper alpha band a significant negative correlation
was found between DFA exponent, goodness of fit and the
MMSE score.
4. Discussion
The most important finding of the present study is that
Alzheimer’s disease is characterized not only by a
decrease in mean levels of EEG synchronization, but
also by changes in the spontaneous fluctuations of EEG
synchronization. Mean levels of synchronization were
decreased in Alzheimer patients in the upper alpha band
and the beta band. Spontaneous fluctuations of the
synchronization level were diminished in Alzheimer
patients in the upper alpha band and to a lesser extent
in the beta band. In the upper alpha band, the DFA
exponent was larger in the Alzheimer group for the
upper alpha band. Finally, both mean synchronization
level as well as DFA parameters showed correlations
with the MMSE score.
The changes in mean synchronization level in the
present study are largely in agreement with the results of
earlier studies using synchronization likelihood to charac-
terize statistical interdependencies between EEG or MEG
signals in early and mild Alzheimer’s disease (Stam et al.,
2002b, 2003b; Pijnenburg et al., 2004). The general pattern
in these studies in early and mild Alzheimer patients was a
preferential involvement of the upper alpha and especially
the beta band. Loss of synchronization in the gamma band
could only be shown in the MEG study, and this might be
due to the higher sensitivity of MEG compared to EEG for
subtle, possibly nonlinear coupling at higher frequencies
(Stam et al., 2002b; 2003a). Another recent study that used
synchronization likelihood reported a lower synchroniza-
tion in Alzheimer patients in the delta, theta, alpha and beta
bands (Babiloni et al., 2004). The involvement of lower
frequency bands in this study could be due to the fact that
the control subjects were healthy subjects without memory
complaints, whereas the other studies as well as the present
one used non-demented subjects with subjective memory
complaints as controls. Furthermore, in the Babiloni et al.
study the control subjects were significantly younger than
the patients, requiring a statistical correction for age
effects. Finally, in contrast to the other studies in which
an average reference was used, Babiloni et al. used a
source montage (determined from the local average of the
surrounding electrodes) which will result in different and
lower synchronization values (Babiloni et al., 2004; Stam
and de Bruin, 2004). In the present study Alzheimer
patients and subjects with subjective memory complaints
were carefully matched for age (AD, mean age 76.3 year;
SD 7.8; range 59–86; SC, mean age 76.1 year; SD 6.7;
range, 67–89). Consequently, the synchronization loss in
the upper alpha and beta band may well represent the first
change in Alzheimer’s disease.
Other studies using different nonlinear measures (Jeong
et al., 2001) or the more usual coherence analysis have also
reported loss of functional connectivity in Alzheimer’s
disease in different frequency bands (Adler et al., 2003;
Berendse et al., 2000; Besthorn et al., 1994; Dunkin et al.,
1994; Knott et al., 2000; Leuchter et al., 1987, 1992;
Locatelli et al., 1998). Although these studies vary greatly in
terms of characteristics of patient and control groups, choice
of electrode pairs and montage, and choice of frequency
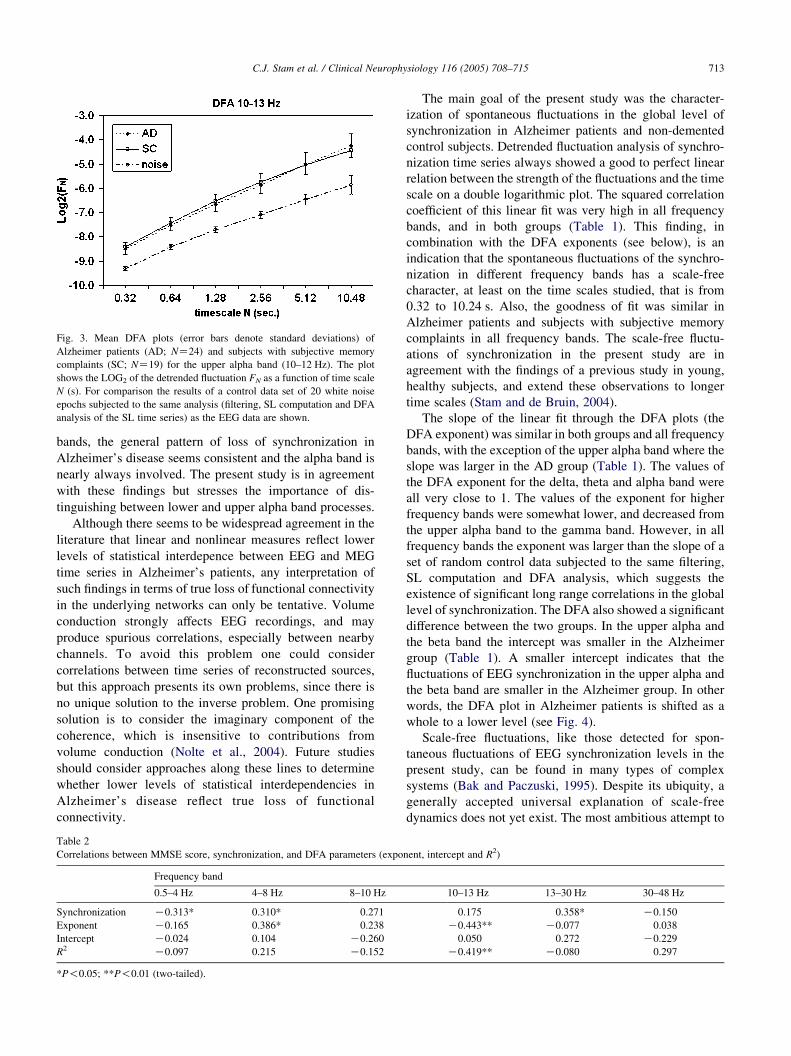
Fig. 3. Mean DFA plots (error bars denote standard deviations) of
Alzheimer patients (AD; NZ24) and subjects with subjective memory
complaints (SC; NZ19) for the upper alpha band (10–12 Hz). The plot
shows the LOG2 of the detrended fluctuation FN as a function of time scale
N (s). For comparison the results of a control data set of 20 white noise
epochs subjected to the same analysis (filtering, SL computation and DFA
analysis of the SL time series) as the EEG data are shown.
C.J. Stam et al. / Clinical Neurophysiology 116 (2005) 708–715 713
bands, the general pattern of loss of synchronization in
Alzheimer’s disease seems consistent and the alpha band is
nearly always involved. The present study is in agreement
with these findings but stresses the importance of dis-
tinguishing between lower and upper alpha band processes.
Although there seems to be widespread agreement in the
literature that linear and nonlinear measures reflect lower
levels of statistical interdepence between EEG and MEG
time series in Alzheimer’s patients, any interpretation of
such findings in terms of true loss of functional connectivity
in the underlying networks can only be tentative. Volume
conduction strongly affects EEG recordings, and may
produce spurious correlations, especially between nearby
channels. To avoid this problem one could consider
correlations between time series of reconstructed sources,
but this approach presents its own problems, since there is
no unique solution to the inverse problem. One promising
solution is to consider the imaginary component of the
coherence, which is insensitive to contributions from
volume conduction (Nolte et al., 2004). Future studies
should consider approaches along these lines to determine
whether lower levels of statistical interdependencies in
Alzheimer’s disease reflect true loss of functional
connectivity.
Table 2
Correlations between MMSE score, synchronization, and DFA parameters (expo
Frequency band
0.5–4 Hz 4–8 Hz 8–10 Hz
Synchronization K0.313* 0.310* 0.271
Exponent K0.165 0.386* 0.238
Intercept K0.024 0.104 K0.260
R2 K0.097 0.215 K0.152
*P!0.05; **P!0.01 (two-tailed).
The main goal of the present study was the character-
ization of spontaneous fluctuations in the global level of
synchronization in Alzheimer patients and non-demented
control subjects. Detrended fluctuation analysis of synchro-
nization time series always showed a good to perfect linear
relation between the strength of the fluctuations and the time
scale on a double logarithmic plot. The squared correlation
coefficient of this linear fit was very high in all frequency
bands, and in both groups (Table 1). This finding, in
combination with the DFA exponents (see below), is an
indication that the spontaneous fluctuations of the synchro-
nization in different frequency bands has a scale-free
character, at least on the time scales studied, that is from
0.32 to 10.24 s. Also, the goodness of fit was similar in
Alzheimer patients and subjects with subjective memory
complaints in all frequency bands. The scale-free fluctu-
ations of synchronization in the present study are in
agreement with the findings of a previous study in young,
healthy subjects, and extend these observations to longer
time scales (Stam and de Bruin, 2004).
The slope of the linear fit through the DFA plots (the
DFA exponent) was similar in both groups and all frequency
bands, with the exception of the upper alpha band where the
slope was larger in the AD group (Table 1). The values of
the DFA exponent for the delta, theta and alpha band were
all very close to 1. The values of the exponent for higher
frequency bands were somewhat lower, and decreased from
the upper alpha band to the gamma band. However, in all
frequency bands the exponent was larger than the slope of a
set of random control data subjected to the same filtering,
SL computation and DFA analysis, which suggests the
existence of significant long range correlations in the global
level of synchronization. The DFA also showed a significant
difference between the two groups. In the upper alpha and
the beta band the intercept was smaller in the Alzheimer
group (Table 1). A smaller intercept indicates that the
fluctuations of EEG synchronization in the upper alpha and
the beta band are smaller in the Alzheimer group. In other
words, the DFA plot in Alzheimer patients is shifted as a
whole to a lower level (see Fig. 4).
Scale-free fluctuations, like those detected for spon-
taneous fluctuations of EEG synchronization levels in the
present study, can be found in many types of complex
systems (Bak and Paczuski, 1995). Despite its ubiquity, a
generally accepted universal explanation of scale-free
dynamics does not yet exist. The most ambitious attempt to
nent, intercept and R2)
10–13 Hz 13–30 Hz 30–48 Hz
0.175 0.358* K0.150
K0.443** K0.077 0.038
0.050 0.272 K0.229
K0.419** K0.080 0.297

Fig. 4. Mean DFA plots (error bars denote standard deviations) of
Alzheimer patients (AD; NZ24) and subjects with subjective memory
complaints (SC; NZ19) for the beta band (13–30 Hz). The plot shows the
LOG2 of the detrended fluctuation FN as a function of time scale N (s). For
comparison the results of a control data set of 20 white noise epochs
subjected to the same analysis (filtering, SL computation and DFA analysis
of the SL time series) as the EEG data are shown.
C.J. Stam et al. / Clinical Neurophysiology 116 (2005) 708–715714
provide a general explanation is the theory of self-organized
criticality (SOC) introduced by Per Bak (Bak et al., 1987,
1988). Self-organized criticality refers to large systems with
local non-linear interactions in which a slow build-up of
some energy value is alternated with brief bursts (‘ava-
avalanches’) of energy redistribution. Such systems evolve
to a critical state without tuning, which is characterized by
spatial and temporal power laws and scale-free dynamics.
The critical state of this type of system is very robust (it is a
powerful attractor of the dynamics), and is associated with an
optimal response to outside disturbances.
Several models have been proposed for self-organized
criticality (Turcotte, 1999). Neurons can be modelled as
integrate-and-fire oscillators, where the integration (slow
changes in the membrane potential) corresponds with the
slow build-up of energy, and the firing (action potential)
corresponds with the fast energy redistribution. Conse-
quently, large networks of interconnected neurons are likely
candidates for self-organized criticality. Evidence for SOC
has been found in models of neural networks as well as in
neural networks cultured in vitro (Beggs and Plens, 2003;
Corral et al., 1995). Several studies of EEG and MEG provide
further support for the hypothesis that the neural networks of
the brain also display SOC at a macroscopic level
(Linkenkaer-Hansen et al., 2001; Nikulin and Brismar,
2004; Stam and de Bruin, 2004; Worrell et al., 2002).
The present study suggests that self-organized criticality
might explain normal as well as abnormal brain dynamics,
since scale-free dynamics was equally clear in control
subjects and Alzheimer patients. Apparently, the self-
organized state is very robust, and persists even in the case
of neural loss and changes in levels of neurotransmitters.
This resistance of the SOC against small parameter
changes was also reported for cultured neural networks
(Beggs and Plens, 2003). However, even though the
general pattern of SOC may persist in Alzheimer’s disease,
we could show that its specific parameters are changed,
and that the magnitude of synchronization fluctuations is
shifted to a lower level in patients in the upper alpha and to
a lesser extent in the beta band, at least on the time scales
studied. A possible interpretation of this finding is that
larger fluctuations of EEG synchronization reflect stronger
and more rapid creation and destruction of subsequent
synchronous neural networks. Disruption of this process
might be associated with a loss of cognitive flexibility and
processing speed in Alzheimer’s disease, and may manifest
itself in the ‘downward shift’ of the DFA plot, at least in
the upper alpha and beta band. This interpretation is
supported by the finding that the strongest correlation
between any EEG measure and an estimate of cognition
was that between a higher upper alpha band DFA intercept
(implying stronger synchronization fluctuations) and the
MMSE score (Table 2, Fig. 3).
In this context it is important to stress that the ‘eyes-
closed, resting state’ we studied is more closely related to
cognition than is often appreciated. Using fMRI Greicius
et al. showed that during such a resting state a complex
network involving the posterior cingulate gyrus, bilateral
inferior parietal cortex, left inferolateral temporal cortex,
and ventral anterior cingulated cortex, is active (Greicius et
al., 2003). In a recent study the same group showed that this
resting state network is disrupted in Alzheimer’s disease
(Greicius et al., 2004). This supports an interpretation of the
synchronization and DFA findings of the present study in
terms of a disrupted ‘default network’. Functional MRI and
EEG are complementary in demonstrating spatial and time
dependent characteristics of the default network and its
abnormalities in Alzheimer’s disease. Integrated EEG/fMRI
will become available soon and may enable further
exploring the pathophysiology of neural networks involved
in cognitive dysfunction in Alzheimer’s disease.
Acknowledgements
TM is the recipient of a Praxis XXI doctoral fellowship
from FCT, Ministry of Science, Portugal. SARB R is
supported by a grant of the Netherlands Organisation for
Scientific Research (NWO). The authors would like to thank
the two anonymous referees for valuable comments on an
earlier draft of this paper.
References
Adler G, Brassen S, Jajcevic A. EEG coherence in Alzheimer’s dementia.
J Neural Transm 2003;110:1051–8.
Babiloni C, Ferri F, Moretti DV, Strambi A, Binetti G, Dal Forno G,
Ferreri F, Lanuzza B, Bonato C, Nobili F, Rodriguez G, Salinari S,

C.J. Stam et al. / Clinical Neurophysiology 116 (2005) 708–715 715
Passero S, Rocchi R, Stam CJ, Rossini PM. Abnormal fronto–parieto
coupling of brain rhythms in mild Alzheimer’s disease: a multicentric
EEG study. Eur J Neurosci 2004;19:1–9.
Bak P, Paczuski M. Complexity, contingency, and criticality. Proc Natl
Acad Sci 1995;92:6689–96.
Bak P, Tang Ch, Wiesenfeld K. Self-organized criticality: an explanation of
1/f noise. Phys Rev Lett 1987;59:381–4 [83].
Bak P, Tang Ch, Wiesenfeld K. Self-organized criticality. Phys Rev A
1988;38:364–74.
Beggs JM, Plens D. Neuronal avalanches in neocortical circuits. J Neurosci
2003;23:11167–77.
Berendse HW, Verbunt JPA, Scheltens Ph, van Dijk BW, Jonkman EJ.
Magnetoencephalographic analysis of cortical activity in Alzheimer’s
disease. A pilot study. Clin Neurophysiol 2000;111:604–12.
Besthorn C, Forstl H, Geiger-Kabisch C, Sattel H, Gasser T, Schreiter-
Gasser U. EEG coherence in Alzheimer disease. Electroencephal Clin
Neurophysiol 1994;90:242–5.
Breakspear M, Terry JR. Nonlinear interdependence in neural systems:
motivation, theory, and relevance. Int J Neurosci 2002;112:1263–84.
Corral A, Perez J, Diaz-Guilera A, Arenas A. Self-organized criticality and
synchronization in a lattice model of integrate-and-fire oscillators. Phys
Rec Lett 1995;74:118–21.
Delbeuck X, Van der Linder M, Colette F. Alzheimer’s disease as a
disconnection syndrome? Neuropyschol Rev 2003;13:79–92.
Dunkin JJ, Leuchter AF, Newton TF, Cook IA. Reduced EEG coherence in
dementia: state or trait marker? Biol Psychiatry 1994;35:870–9.
Francis PT, Palmer AM, Snape M, Wilcock GK. The cholinergic
hypohtesis of Alzheimer’s disease: a review of the progress. J Neurol
Neurosurg Psychiatry 1999;66:137–47.
Freeman WJ, Rogers LJ. Fine temporal resolution of analytic phase reveals
episodic synchronization by state transitions in gamma EEGs.
J Neurophysiol 2002;87:937–45.
Friston KJ. The labile brain. I. Neuronal transients and nonlinear coupling.
Phil Trans R Soc Lond B 2000;355:215–36.
Greicius MD, Krasnow B, Reiss AL, Menon V. Functional connectivity in
the resting brain: a network analysis of the default mode hypothesis.
Proc Natl Acad Sci 2003;100:253–8.
Greicius MD, Srivastava G, Reiss AL, Menon V. Default-mode network
activity distinguishes Alzheimer’s disease from healthy aging: evidence
from functional MRI. Proc Natl Acad Sci 2004;101:4637–42.
Jeong J. EEG dynamics in patients with Alzheimer’s disease. Clin
Neurophysiol 2004;115:1490–505.
Jeong J, Gore JC, Peterson BS. Mutual information analysis of the EEG in
patients with Alzheimer’s disease. Clin Neurophysiol 2001;112:
827–35.
Knott V, Mohr E, Mahoney C, Ilivitsky V. Electroencephalographic
coherence in Alzheimer’s disease: comparisons with a control group
and population norms. J Geriatr Psychiatry Neurol 2000;13:1–8.
Leuchter AF, Spar JE, Walter DO, Weiner H. Electroencephalographic
spectra and coherence in the diagnosis of Alzheimer’s-type and multi-
infarct dementia. A pilot study. Arch Gen Psychiatry 1987;44:993–8.
Leuchter AF, Newton TF, Cook AA, Walter DO. Changes in brain
functional connectivity in Alzheimer-type and multi-infarct dementia.
Brain 1992;115:1543–61.
Linkenkaer-Hansen K, Nikouline VV, Palva JM, Ilmoniemi RJ. Long-
range temporal correlations and scaling behavior in human brain
oscillations. J Neurosci 2001;21:1370–7.
Locatelli T, Cursi M, Liberati D, Francheschi M, Comi G. EEG coherence
in Alzheimer’s disease. Electroencephal Clin Neurophysiol 1998;106:
229–37.
McKhann G, Drachman D, Folstein M, Katzman R, Price D, Stadlan EM.
Clinical diagnosis of Alzheimer’s disease: report of the NINCDS-
ADRDA Work Group under the auspices of Department of Health and
Human Services Task Force on Alzheimer’s disease. Neurology 1984;
34:939–44.
Nikulin VV, Brismar T. Long-range temporal correlations in alpha and beta
oscillations: effect of arousal level and test–retest reliability. Clin
Neurophysiol 2004;115:1896–908.
Nolte G, Wheaton OBL, Mari Z, Vorbach S, Hallett M. Identifying true
brain interaction from EEG data using the imaginary part of coherency.
Clin Neurophysiol 2004;115:2292–307.
Peng CK, Buldyrev SV, Goldberger AL, Havlin S, Sciortino F, Simons M,
Stanley HE. Long-range correlations in nucleotide sequences. Nature
1992;356:168–70.
Peng CK, Havlin S, Stanley HE, Goldbergeer AL. Quantification of scaling
exponents and crossover phenomena in nonstationary hearbeat time
series. Chaos 1995;5:82–7.
Pijnenburg YAL, van de Made Y, van Cappellen van Walsum AM,
Knol DL, Scheltens Ph, Stam CJ. EEG synchronization likelihood in
mild cognitive impairment and Alzheimer’s disease during a working
memory task. Clin Neurophysiol 2004;115:1332–9.
Posthuma D, Neale MC, Boomsma DI, de Geus EJC. Are smarter brains
running faster? Heritability of alpha peak frequency, IQ, and their
interrelation Behav Genet 2001;31:567–79.
Rodriguez E, George N, Lachauz JP, Martinerie J, Renault B, Varela FJ.
Perception’s shadow: long distance synchronization of human brain
activity. Nature 1999;397:430–3.
Rombouts SARB, Barkhof F, Veltman DJ, Machielsen WCM, Witter MP,
Bierlaagh MA, Lazeron RHC, Valk J, Scheltens P. Functional MR
imaging in Alzheimer’s disease during memory encoding. Am
J Neuroradiol 2000;21:1869–75.
Stam CJ, de Bruin EA. Scale-free dynamics of global functional
connectivity in the human brain. Hum Brain Mapp 2004;22:97–109.
Stam CJ, van Dijk BW. Synchronization likelihood: an unbiased measure of
generalized synchronization in multivariate data sets. Physica D 2002;
163:236–41.
Stam CJ, van Cappellen van Walsum AM, Micheloyannis S. Variability of
EEG synchronization during a working memory task in healthy
subjects. Int J Psychophysiol 2002a;46:53–66.
Stam CJ, van Cappellen van Walsum AM, Pijnenburg YAL,
Berendse HW, de Munck JC, Scheltens Ph, van Dijk BW. Generalized
synchronization of MEG recordings in Alzheimer’s disease: evidence
for involvement of the gamma band. J Clin Neurophysiol 2002b;19:
562–74.
Stam CJ, Breakspear M, van Cappellen van Walsum AM, van Dijk BW.
Nonlinear synchronization in EEG and whole-head MEG recordings of
healthy subjects. Hum Brain Mapp 2003a;19:63–78.
Stam CJ, van der Made Y, Pijnenburg YAL, Scheltens Ph. EEG
synchronization in mild cognitive impairment and Alzheimer’s disease.
Acta Neurol Scand 2003b;108:90–6.
Takens F. Detecting strange attractors in turbulence. Lect Note Math 1981;
898:366–81.
Theiler J. Spurious dimension from correlation algorithms applied to
limited time-series data. Phys Rev A 1986;34:2427–32.
Turcotte DL. Self-organized criticality. Rep Prog Phys 1999;62:1377–429.
Worrell GA, Craunstoun SD, Echauz J, Litt B. Evidence for self-organized
criticality in human epileptic hippocampus. NeuroReport 2002;13:
2017–21.