Embed Size (px)
Citation preview
UNIVERSIDADE DE LISBOA
FACULDADE DE CIÊNCIAS
DEPARTAMENTO DE BIOLOGIA VEGETAL
Nitrification Control. How do the Natural
ecosystem do it?
Catarina Andreia Ricacho Gouveia
Tese de Mestrado
Dissertação
Mestrado em Microbiologia Aplicada
2012/2013

UNIVERSIDADE DE LISBOA
FACULDADE DE CIÊNCIAS
DEPARTAMENTO DE BIOLOGIA VEGETAL
Nitrification Control. How do the Natural
ecosystem do it?
Dissertação orientada pela Profª Dr.ª Maria Manuela Carolino (FCUL)
Catarina Andreia Ricacho Gouveia
Mestrado em Microbiologia Aplicada
2012/2013

Nitrification Control. How do the Natural
ecosystem do it?
Catarina Andreia Ricacho Gouveia
2012/2013
This thesis was fully performed at the Department of Plant Biology in the
University of Lisbon under the direct supervision of Prof. Dr. Maria Manuela
Carolino in the scope of the Master in Applied Microbiology of the Faculty of
Science University of Lisbon.

Master in Applied Microbiology 2012-2013
Master thesis Catarina Gouveia
Personal Acknowledgments……………………………………...…….………………………………………… I
Summary/Resumo (Portuguese)………………………………………………………………………………….. II
Abstract………………………………………………………………………………………………………………. 1
Introduction……………………………………………………………………………………………………..…….2
Materials and methods…………..……………………………………………….…………………………………8
Study site …………………………………………………………………………………………8
Experimental design …………………………………………………………………………….8
Soil and Root sampling …………………………………………………………………………9
AOA and AOB enrichments cultures ………………………………………………………...10
Ammonia and pH susceptibility ……………….................................................................10
Effect of organic compounds in AOB nitrite production…………………………………….10
AOM Indirect Growth Measurement …………………………………………………………10
DNA extraction …………………………………………………………………………………11
PCR conditions ………………………………………………………………………………...12
PCR-RFLP ……………………………………………………………………………………...12
Statistical analysis ……………………………………………………………………………..13
Results and Dicussion ……………………………………………………………………………………………13
Where does the ammonia oxidizing community prosper? ………………………………...13
Nitrite production by bacteria ………………………………………………………13
Nitrite production by archaea ………………………………………………………18
How would the AOB population respond to an increase in N input…….. ……………….21
Ammonia oxidizing activity by AOB from soils with and without N addition …..21
AOB community structure ………………………………………………………….27
Ammonia oxidizing activity by AOA from soils with and without N addition …. 29
How does the AOB population responds to abiotic factors? ……………………………...32
Ammonia susceptibility in AOB cultures from soils with and without N-
addition………………………………………………………………………………..32
pH susceptibility in AOB cultures from soils with and without N- addition
…………………………………………………………………………………….......33
Effects of organic compounds in AOB cultures from soils without N
addition………………………………………………………………………………..35
Conclusion ………………………………………………………………………………………………………….37
Acknowledgements ……………………………………………………………………………………………….38
References ………………………………………………………………………………………………………….38
Annex…………………………………………………………………………………………………………………40
Nitrification Control. How do the Natural ecosystem do it?
Master in Applied Microbiology 2012-2013
Master thesis Catarina Gouveia
Personal Acknowledgments
I would like to thank the Department of Plant Biology (DBV) of the Faculty of Sciences,
University of Lisbon for hosting and supporting the research project for the development of my
Master thesis.
My greatest appreciation to Prof. Dr. Maria Manuela Carolino, who directly supervised
the project, for the mentorship and help through my question filled work, for the friendship and for
the interesting and fun talks that allow me to work easier in longer days. I also thank prof. Dr.
Cristina Cruz and Dr. Sandra Chaves for their patience and support in supervising my Master
thesis laboratory work, for teaching me how to write, not only a good scientific report, but also a
story, and for the inquisitive question that have allowed me to improve my work and myself. My
thanks, also, to Dr. Teresa Dias, whose ideas and work in Arrábida were the bases for my thesis
and helped create my scientific questions.
I would also like to thank Prof. Dr. Rógerio Tenreiro and Dr. Luís Carvalho for the given
help in a troublesome statistical analysis. To prof. Dr. Ana Reis for the stimulating discussions
that raised some surprizing questions, ideas and conclusions in my work. To prof. Dr. Lélia
Chambel for the help choosing the best DNA fingerprinting method when I could not make my
mind. To prof. Dr. Margarida Barata and Dr. Patricia Correia for support and motivating talks. To
prof. Dr. Francisco Dionisio for helping me in data analysis. My thanks to Manuela Lucas,
Herculana, Teresa Granja, Célia Lima, Rute Miguel, for the indispensable help around the lab
and for their teachings. To my lab collegues, Maria Calado, Raquel Costa, Marta Delgado, Inês
Meleiro, Juliana Melo, Frederico Eutrópio and Florian Uhlm, whose good humour make the lab
into a warm and fun environment to work.
I thank my family and friends, whose curiosity and misunderstanding to subject in the
academic field and about my research made me think in a simpler and easier way to explain
science. To my aunt whose strength made keep going forward. To my sister for enduring my
anxiety and stress in a way only she could do. And to my parents, for their endless love and
dedication that helped me follow my dreams, for the debates and discussion that pushed me to
be grow as a person and for their understanding of who I am as a person and a scientist.
Nitrification Control. How do the Natural ecosystem do it? I

Master in Applied Microbiology 2012-2013
Master thesis Catarina Gouveia
Summary/Resumo
O ciclo do N, composto por diversas etapas, é mediado principalmente por
microrganismos. Os microrganismos diazotróficos fixam Azoto (N2), introduzindo-o na biosfera.
Os compostos orgânicos azotados são depois mineralizados, em ambientes aeróbios, a amónia.
Esta é rapidamente oxidada a nitrito (NO2-) e nitrato (NO3
-) pelos microrganismos oxidantes de
amónia (AOM) e oxidantes de nitrito (NOM), processo denominado de nitrificação. Em ambientes
anaeróbios, pode ocorrer a desnitrificação com a redução do nitrato a óxido nítrico (NO), óxido
nitroso (N2O) e azoto molecular (N2) (Bock and Wagner, 2006).
Um equilíbrio da forma e quantidade de N nos ecossistemas é vital, pois o ecossistema
pode perder fertilidade com reduzida quantidade de N, mas pode sofrer eutrofização com
elevadas concentrações de N. O ciclo do Azoto pode não ocorrer linearmente, sendo a resposta
da comunidade microbiana responsável pelos processos de oxi-redução do azoto dependente
das condições do ecossistema, tal como, a taxa de conversão de cada processo dependente do
controlo da atividade microbiana, afeta a disponibilidade e a forma de azoto no ecossistema.
Com excesso de N na forma orgânica, deverá haver um aumento na atividade de mineralização,
seguido de nitrificação e desnitrificação, resultando na libertação de N para a atmosfera. Esta
situação ocorre, se existirem condições ótimas para todos os processos, no entanto, o aumento
da concentração de amónia, nitrito, nitrato, ou outros compostos resultantes dos processos oxi-
redutivos do ciclo do azoto, no solo, pode ocorrer se as condições necessárias para um dos
processos não se verificarem.
A nitrificação é o processo de oxidação da amónia a nitrito e nitrito a nitrato, catalisado
por 2 grupos de organismos distintos (Norton and Stark, 2011; Fienck et al. 2005; Sinha and
Annachhatre, 2007), sendo a oxidação da amónia considerado o passo limitante da nitrificação.
A oxidação da amónia é catalisada por diversos grupos, sendo as bactérias e árqueas
quimiolitotróficas oxidantes de amónia (AOB e AOA respetivamente) os principais intervenientes
em ambientes terrestres aeróbios (Norton and Stark, 2011; Sinha and Annachhatre, 2007).
As bactérias oxidantes de amónia (AOB) quimiolitotróficas são membros das classes β
ou γ de Proteobacteria. Nas β-proteobacteria existem 4 géneros diferentes, Nitrosomonas,
Nitrosospira, Nitrosolobus e Nitrosovibrio. O género Nitrosococcus pertence às γ-Proteobacteria
(Purkhold et al. 2000). As AOB estão distribuídas por diversos ambientes costeiros, marinhos e
ambientes polares (maioritariamente 2 clusters, Nitrosomonas e Nitrosospira), ambientes salinos
ou hipersalinos (Nitrosomonas), condições com temperaturas elevadas (Nitrosospira) e
ambientes acídicos (Nitrosomonas) (Junier et al. 2010; Prosser and Nicol, 2008).
AOB são bactérias litoautotróficas, tendo como substrato principal a amónia (NH3), e
como dador de eletrões a hidroxilamina. A oxidação da amónia é catalisada pela enzima amónia
monoxigenase (AMO), produzindo hidroxilamina, sendo esta oxidada a nitrito pela enzima
hidroxilamina oxiredutase (HAO) (Bock and Wagner, 2006; Hatzenpichler, 2012).
As árqueas oxidantes de amónia (AOA), pertencentes ao novo filo Thaumarchaeota
(Norton and Stark, 2011; Hatzenpichler, 2012) aparentam estar presentes em diversos ambientes
mesofilicos (marinhos, água-doce e terrestres) assim como em condições extremas (ambientes
Nitrification Control. How do the Natural ecosystem do it? II

Master in Applied Microbiology 2012-2013
Master thesis Catarina Gouveia
acidófilos, termófilos, águas profundas e fontes termais) (Junier et al. 2010; Nicol and Schleper,
2006). A via metabólica das AOA é pouco conhecida, não tendo sido ainda identificado nenhum
homologo da enzima HAO (Hatzenpichler, 2012; He et al. 2012). No entanto, parecem ter a
capacidade de utilizar fontes orgânicas de energia como aminoácidos (He et al. 2012; Tourna et
al. 2011; Hatzenpichler, 2012). A enzima AMO das AOA, comparativamente à AMO das AOB,
tem uma maior afinidade para a amónia, podendo ter as AOA uma maior contribuição para a
atividade nitrificante em ambientes oligotróficos (He et al. 2012; Martens-Habbena et al. 2009).
A importância da nitrificação baseia-se no facto de ser o único processo biológico
oxidativo que liga fontes de azoto inorgânico reduzido (amónia) e oxidado (nitrito e nitrato)
(Martens-Habbena et al. 2009; Norton and Stark, 2011; Fienck et al. 2005; Sinha and
Annachhatre, 2007). Nitrito, o produto da oxidação da amónia, é normalmente encontrado em
baixas concentrações nos solos devido à sua toxicidade, sendo essencial manter uma baixa
concentração (Bock and Wagner, 2006; Norton and Stark, 2011; Cleemput and Samater, 1996).
Para além do nitrito, o óxido nítrico e óxido nitroso também podem ser produzidos através da
redução do nitrito pela nitrito redutase (NIR) presente em algumas bactérias oxidantes de amónia
(Bremner, 1997; Burns et al. 1996). Além de promoverem a acidificação do solo com a formação
de ácidos, o óxido nitroso age como um gás com efeito de estufa, 310x mais potente que o
dióxido de carbono (Yamanaka, 2008; Bock and Wagner, 2006; Hatzenpichler, 2012). O nitrato
pode ser utilizado como fonte de azoto por diversos organismos, e em excesso pode causar
eutrofização desse ecossistema. Sendo facilmente lixiviado pode causar a contaminação de
águas subterrâneas (Fienck et al, 2005).
Tendo a nitrificação uma forte influência no fluxo de azoto nos sistemas terrestres e
marinhos, e os seus produtos importantes na determinação da qualidade de solos e águas, o
estudo da influência dos fatores bióticos e abióticos no controlo da atividade nitrificante e
crescimento dos organismos nitrificantes é essencial.
Existem diversos fatores estudados que influenciam o crescimento e atividade das
comunidades oxidantes de amónia. Um dos principais fatores é a concentração de substrato,
neste caso, amónia. Como foi referido, o aumento da concentração de N no ecossistema pode
levar a um aumento da atividade nitrificante, dependendo da suscetibilidade das estirpes de AOB
ao substrato e a sua adaptação ao aumento da amónia. Este aumento de atividade é
problemática se houver acumulação de nitrito, nitrato ou outros produtos resultantes dessa
atividade. A acumulação de nitrito ocorre em condições favoráveis à oxidação da amónia
desfavoráveis à oxidação de nitrito e desnitrificação, como, ambientes bem oxigenados e
condições alcalinas ou com pH neutro (Fienck et al. 2005), sendo as AOB muito suscetíveis a
alterações no pH. Logo, a oxigenação dos solos e pH são outros fatores a ter em conta. Em
ambientes pouco oxigenados (condições de microaerofilia) a formação de óxidos nitroso e nítrico
é estimulada (Fienck et al. 2005; Bock and Wagner, 2006). Em solos carbonatados a produção
de óxidos é reduzida pela interação química com os carbonatos, formando nitrito e nitrato. (Bock
and Wagner, 2006). A produção de nitritos pode ser inibida pela presença de compostos
orgânicos (Adair and Schwartz, 2008), no entanto algumas espécies de AOB podem crescer
Nitrification Control. How do the Natural ecosystem do it? III

Master in Applied Microbiology 2012-2013
Master thesis Catarina Gouveia
mixotroficamente (amónia e C orgânico como fonte de energia, podendo haver produção de
nitritos) com compostos como piruvato ou acetato, ou organotroficamente (C orgânico como fonte
de energia, sem produção de nitritos) com açúcares. Contudo a nitrificação pode ser importante
e benéfica para algumas plantas que utilizem preferencialmente o nitrato (Bock and Wagner,
2006), logo em ambientes pobres em nitrato a nitrificação pode ser estimulada pelas plantas.
Assim, fatores a considerar para o estudo de populações de microrganismos oxidantes de
amónia são nicho (solo rizosférico ou superfície das raízes), a adaptação à adição de N no solo,
a concentração de substrato, pH das culturas e presença de matéria orgânica.
Tendo em vista o estudo da comunidade oxidante de amónia (Bactérias e Árqueas) num
ecossistema mediterrânico os principais objetivos deste trabalho foram:
1. Estudar a localização preferencial da comunidade oxidante de amónia (solo
rizosférico ou superfície das raízes de Cistus ladanifer)
2. Estudar o efeito da adição de N no solo, na atividade e estrutura das
comunidades oxidantes de amónia
3. Estudar o efeito da concentração de substrato (amónia), pH e presença de
compostos orgânicos azotados/ glucose / acetato em culturas de AOB
provenientes de solos com e sem adição de N
Num ecossistema mediterrâneo, pobre em nutrientes, os nichos preferenciais para o
crescimento de microrganismos oxidantes de amónia deverão estar localizados perto da raiz das
plantas, ou na superfície das raizes, proporcionando uma maior troca de nutrientes entre planta-
microrganismos (Ochua-Hueso et al, 2011), além de facultar condições de oxigenação, pH e
conteúdo em água favoráveis para o crescimento e atividade de oxidantes de amónia.
Sendo os solos pobres em azoto e matéria orgânica (Dias et al. 2012), espera-se
encontrar populações de AOB mais adaptadas a ambientes oligotróficos. No entanto, em solos
com frequente adição de N ao longo de 6 (desde 2007), o aumento da disponibilidade de N na
forma de amónia, deverá determinar adaptação das populações de AOB, aumentando a
atividade oxidante de amónia, e alterando a comunidade ao nível estrutural.
Em relação ao efeito da concentração de amónia nas culturas de AOB, populações de
AOB adaptadas a baixas concentrações de amónia no solo, deverão ser mais suscetíveis a
elevadas concentrações de amónia, comparativamente com populações de AOB adaptadas a
maiores concentrações de amónia, ou seja provenientes de solos com frequente adição de azoto.
Relativamente ao efeito do pH, espera-se que populações com maior atividade nitritante sejam
mais tolerantes à acidificação, uma vez que o aumento da atividade leva a uma diminuição do
pH, podendo resultar ou não na acidificação do solo, dependendo da composição deste. No
efeito de compostos orgânicos nas culturas de AOB, espera-se que haja menor atividade com
fontes energéticas orgânicas (para crescimento mixotrófico ou organotrófico), uma vez que AOB
adaptadas a ambientes oligotróficos prefiram fontes energéticas e de carbono inorgânicas, como
amónia e CO2.
Para o estudo de microrganismos oxidantes de amónia, amostras de solo foram
recolhidas de um campo experimental, localizado no Parque Natural da Serra da Arrábida.
IV Nitrification Control. How do the Natural ecosystem do it?

Master in Applied Microbiology 2012-2013
Master thesis Catarina Gouveia
Plantas de Cistus ladanifer de solos sem adição de azoto foram recolhidas juntamente com solo
rizosférico a 5-6 cm de profundidade, em julho para estudar o nicho preferencial das AOM. Solo
rizosférico e raízes lavadas com água destilada foram utilizadas como inoculo para crescimento
de AOB. Para o estudo do efeito da adição de N no solo, amostras de solo foram retiradas a 1
cm da raiz primária de Cistus ladanifer a 5-6 cm de profundidade dentro dos talhões dos 4
tratamentos: controlo (solo sem fertilização) e três diferentes adições de azoto: 40 e 80 kg de N
/ha /y na forma de NH4NO3 (40AN e 80AN) e 40 kg de N/ ha /y na forma de NH4+ (40A). O solo
foi utilizado como inoculo no crescimento de AOB e AOA. As populações de AOM foram
seletivamente cultivadas por 30 (AOB) /60 (AOA) dias com 3 enriquecimentos sucessivos em
meio SFC (Synthetic Freshwater Crenoarchaeota) (Konneke et al. 2005; De La Torre et al. 2008),
de modo a assegurar a diluição de microrganismos heterotróficos e de matéria orgânica no
inoculo de solo inicial. O meio foi suplementando de acordo com a especificidade para bactérias
e/ou árqueas oxidantes de amónia (3 antibióticos diferentes). No 3º enriquecimento os meios e
condições de incubação foram suplementados/alterados de acordo com o objectivo (fonte de
azoto, carbono, concentração de amónia, pH). A atividade das comunidades oxidantes de
amónia foi avaliado regularmente pela quantificação do produto final de nitrito, permitindo
distinguir a cinética da produção de nitrito de cada cultura. A atividade de cada cultura foi
estudada no 3º enriquecimento de modo a ter-se culturas de AOB sem contaminantes. A
presença de árqueas e bactérias oxidantes de amónia foi confirmada pela amplificação do gene
16S rRNA e amoA, especifico para cada grupo. A estrutura das comunidades bacterianas
oxidantes de amónia foi avaliado por PCR-RFLP fingerprinting, com as enzimas de restrição HinfI
e HaeIII. A análise estatística dos dados foi efetuada em SPSS, versão 20 para Windows.
Comparando o número de culturas ativas, taxa de produção de nitrito e concentração
máxima de nitrito, uma localização preferencial de atividade das AOB foi observado no solo
rizosférico de Cistus ladanifer. No entanto, não foi detetada a presença de AOA nas culturas.
Relativamente ao efeito da adição de azoto no solo, verificou-se uma tendência para o
aumento da atividade oxidante de amónia das populações de AOB. No entanto, a resposta da
população ao aumento de N no solo depende da forma e quantidade de N aplicado. O controlo
da atividade dependerá também da disponibilidade da amónia nos solos, havendo uma
competição pelo substrato entre plantas e AOB (Verhagen et al. 1994), principalmente nos
tratamentos com maior cobertura vegetal como o 40AN (Dias et al, 2011). Embora a presença
de AOA não seja confirmada, as culturas de AOA provenientes de solos sem adição de azoto
apresentaram uma maior atividade oxidante de amónia, indicando uma resposta das populações
de AOA diferente das populações de AOB. Por PCR-RFLP verificou-se que a estrutura das
populações de AOB é alterada com a adição de azoto no solo, tendo os resultados também
demonstrado a heterogeneidade dos solos com o mesmo tratamento. Comparando os perfis de
PCR-RFLP realizados in-silico para as espécies conhecidas do género Nitrosomonas e
Nitrosospira e os perfis obtidos a partir das populações de AOB, Nitrosospira tenuis foi
identificada nas populações de AOB de solos com adição de azoto.
V Nitrification Control. How do the Natural ecosystem do it?
Master in Applied Microbiology 2012-2013
Master thesis Catarina Gouveia
Nas populações de AOB foram observadas diferentes suscetibilidades a concentrações
crescentes de amónia, tendo as comunidades AOB provenientes de solo sem adição de N uma
maior suscetibilidade à amónia, comparativamente a populações de AOB de solos com adição
de N. A atividade oxidante de amónia, com produção cumulativa de nitrito, das culturas de
populações de AOB presentes em solos sem adição de N foi inibida pela presença de compostos
orgânicos como peptona, glucose e acetato. No entanto, as populações de AOB parecem ter a
capacidade de utilizar ureia como fonte energética em substituição da amónia.
Considerando a influência dos fatores estudados: nicho preferencial, adição de N no
ecossistema, concentração de substrato, pH e presença de compostos orgânicos na atividade
das populações de AOB, estas demostraram ser suscetíveis a alterações, não são resilientes e
não aparentam ter redundância funcional (não têm o mesmo nível de atividade). Mas a influência
que os fatores exercem sobre a população nitrificante é necessária para controlar essa atividade,
de modo a que não haja perda de N no sistema. A adição de N no solo não implica
necessariamente um aumento da atividade nitritante, se este N não estiver em excesso. No
entanto, N em excesso aumentará a atividade nitrificante, com consequente diminuição da
quantidade de N inorgânico no solo. Este aumento de atividade levará a uma diminuição no pH,
particularmente em solos sem um forte efeito tampão, o que leva a uma inibição da nitrificação.
O aumento de nitrito leva também ao aumento de nitrato (oxidação do nitrito a nitrato), e ao
consequente aumento da biomassa e compostos orgânicos no solo, inibindo a atividade de AOB
sensíveis a matéria orgânica. Diminuindo a oxidação da amónia haverá novamente o aumento
de N inorgânico no solo, de modo a não haver perda de N e consequente perda de fertilidade do
solo. Esta regulação é mantida devido à sensibilidade apresentada pelas populações de AOB a
estes fatores, sendo essencial para o equilíbrio de N no ecossistema.
VI Nitrification Control. How do the Natural ecosystem do it?

Master in Applied Microbiology 2012-2013
Master thesis Catarina Gouveia
Nitrification control. How do the Natural ecosystem do it?
Catarina A.R. Gouveia Department of Plant Biology, University of Lisbon, Lisbon, Portugal Master in Applied Microbiology, Faculty of Sciences, University of Lisbon, Lisbon, Portugal
Nitrification is a fundamental and central step in the nitrogen cycle, linking the
reduced and oxidized nitrogen pools, which processes are mostly accomplished by
microorganisms. The first step is mainly done by ammonia oxidizing bacteria (AOB) and
by ammonia oxidizing archaea (AOA). Regulation of nitrification activity is essential in
ecosystem to maintain N balance, since N excess can cause eutrophication and
production of toxic compounds, and N limitation can reduce soil fertility. Mediterranean
ecosystem soils are poor in terms of N therefore microbial communities can be more
susceptible to change when confronted with N input, pH change or presence of organic
matter. This study aims to understand the niche preference, the impact of N addition in
soils, pH, substrate (ammonia) concentration and presence of organic compounds in
ammonia oxidizing populations from Mediterranean soils. Rhizospheric soil and root
samples from Cistus Ladanifer were collected from an experimental field in which has been
added 3 different N - treatments since 2007, in Serra da Arrábida Natural Park. By using
serial culture enrichments and nitrite quantification through incubation time it was
possible to quantify and study nitrifying activity. The presence of AOB and AOA in each
enrichment was confirmed by PCR. AOB structural community’s change by N-addition in
soils was assessed by PCR- RLFP. AOB susceptibility to ammonia, pH and organic
compounds was studied by testing several ammonia concentrations in the medium,
altering pH and supplementing the medium with organic compounds. As a preferential
niche for AOB activity, AOB populations appear to be more abundant in rhizospheric soil
of Cistus ladanifer. Soils with N-addition had altered AOB population with higher ammonia
oxidizing activity and a different community structure. By comparing in silico PCR-RFLP
profiles and the AOB profiles it was possible to identify Nitrosospira tenuis in the AOB
population. Though the presence of AOA was not confirmed in any of the treatments,
activity of possible AOA from soils without N –addition was higher, than of AOA from soils
with N-addition. AOB activity appeared to be influenced by the substrate concentration,
with AOB from soils with N-addition being less susceptible to change in substrate
concentration. AOB cultures appear to be susceptible to pH, having an activity inhibition
with pH above 7 and under 6. The populations are also sensible to the presence of organic
matter, however, being capable of using urea as a substrate for ammonia in litotrophic
growth and nitrite production activity. It was observed that ammonia oxidation activity can
be stimulated by N-addition, altering not just the activity but also the population structure
to have a higher tolerance to the substrate. While ammonia oxidising activity is inhibited
by pH changes and presence of organic matter.
1 Nitrification Control. How do the Natural ecosystem do it?

Master in Applied Microbiology 2012-2013
Master thesis Catarina Gouveia
Introduction
Nitrogen Cycle
Nitrogen is one of the important elements for life, as it is needed to synthesize major
molecules in cell components, as aminoacids and nucleotides being two of many examples. The
biogeochemical cycle of nitrogen comprises the biotic and abiotic conversion of the nitrogen
compounds between their oxidised and reduced forms. These conversions are done in the
atmosphere, in the biosphere and the interaction between both (Bock and Wagner, 2006). In the
biosphere, most of the reactions are catalysed by microorganisms. Dinitrogen (N2) can be fixed
and introduced in the biosphere by diazotrophs, in the form of ammonia (NH3) or organic nitrogen
(amine group). Ammonia, the most frequently found form of nitrogen in the biosphere can be
released from organic compounds by mineralization. In aerobic environments ammonia is quickly
oxidised to nitrite (NO2-) and nitrate (NO3
-) by ammonia-oxidizing microorganisms (AOM), and by
nitrite-oxidizing microorganisms (NOM) in a process called nitrification. In anoxic conditions
denitrification can occur. The nitrate is used by denitrifying microorganisms, producing dinitrogen
(N2), nitrous oxid (N2O) and nitric oxid (NO) (fig.1). (Bock and Wagner, 2006; Fiencke et al. 2005)
The cycle is not entirely linear. Depending on the ecosystem conditions the microbial community
responses change. So, the key processes stated above can directly affect the availability and
form of N within the ecosystems. The increase of nitrogen can augment the concentration of toxic
products, such as ammonia, nitrite, nitrous acid and nitric acid. It can also cause eutrophication
of that ecosystem, and the contamination of ground water supplies (Fiencke et al. 2005). The
decrease nitrogen can affect soil fertility and plant production (Bock and Wagner, 2006).
Strategies of the Natural ecosystem to
balance the nitrogen availability
The natural ecosystems have
developed mechanisms that involve
multiple paths to nitrogen conservation
(Dias et al. 2012). Paths to balance the
inorganic and organic nitrogen, and to
compensate the nitrogen increase or
decrease in soil are essentials to the
ecosystems. If there is an excess of
nitrogen in soils, it can be reduced by
mineralization (if the nitrogen appears as
an organic form) followed by nitrification
(directly if the nitrogen is in the form of
ammonia or urea) and denitrification
(directly with nitrate), resulting in the
formation of atmospheric nitrogen. If the
Fig. 1 Nitrogen Cycle Scheme 1) Nitrogen fixation; 2) Ammonia assimilation; 3) Ammonia mineralization; 4) Ammonia oxidation (1st step in Nitrification); 5) Nitrite oxidation (2nd step in Nitrification); 6)Nitrate reduction 7) Nitrite reduction; 8) Nitrate leaching; 9)Nitrate assimilation; 10) Denitrification
2 Nitrification Control. How do the Natural ecosystem do it?
Master in Applied Microbiology 2012-2013
Master thesis Catarina Gouveia
system has limited nitrogen there is a need to increase nitrogen fixation and diminished
nitrification and denitrification.
Nitrification and ammonia oxidation
Nitrification is the biological conversion of reduced nitrogen, ammonia, ammonium (NH4+)
or organic N to oxidized N, nitrite and to nitrate successively. The importance of this process lies
on the fact that it is the only oxidative biological process linking reduced and oxidized pools of
inorganic nitrogen in nature (Martens-Habbena et al. 2009; Norton and Stark, 2011; Fiencke et
al. 2005; Sinha and Annachhatre, 2007), and therefore has a strong influence in the fate of N in
terrestrial systems.
The oxidation of ammonia by microorganisms can be done by several groups. In the
presence of oxygen by the chemolithotrophic bacteria and heterotrophic bacteria. In the absence
of oxygen by Planctomycetes. In aerobic soil environments the key participants in nitrification are
chemolithotrophic bacteria and archaea. Heterotrophic nitrification can be catalysed by fungi,
actinomycetes, and other bacteria, and seems to be significant in some forest and acidic pasture
soils. The anaerobic oxidation of ammonium is known as the anammox process and it is
widespread in marine and freshwater environments, but rarely found in soil. (Norton and Stark,
2011; Sinha and Annachhatre, 2007).
Ammonia-oxidizing bacteria (AOB)
Since the first chemolithotroph ammonia oxidizing bacteria isolation at the end of the
nineteenth century by Winogradsky (1890), 16 more species of AOB have been described,
accounting for a total of 25 culturable species (Sinha and Annachhatre, 2007). However, many
not described species can be found, in culture collections at least 15 additional genospecies (Bock
and Wagner, 2006) and more in natural environments.
These 25 species of chemeolitotrophic ammonia oxidizing bacteria (AOB) are comprise
in the Proteobacteria phylum. Comparative 16S rRNA sequence analysis has shown that all
recognized AOB are members of the β- or γ-subclass of Proteobacteria. In the β-proteobacteria
there is 4 genera Nitrosomonas, Nitrosospira, Nitrosolobus and Nitrosovibrio. The Nitrosococcus
genus belongs to the γ-Proteobacteria (Purkhold et al. 2000).
AOB are widespread in coastal, open ocean, polar environments (mainly 2 clusters,
Nitrosomonas and Nitrosospira), hypersaline enviroments (Nitrosomonas), high temperatures
(Nitrosospira) and acid environments (Nitrosomonas) (Junier et al. 2010; Prosser and Nicol,
2008). Most soil bacterial ammonia oxidizers belong to Nitrosospira genera (Purkhold et al.
2000). Ammonia oxidizing Bacteria rarely grow in soils with a pH lower tan 7, however there are
several niches for AOB were the pH is optimal for AOB (Junier et al. 2010).
3 Nitrification Control. How do the Natural ecosystem do it?
Master in Applied Microbiology 2012-2013
Master thesis Catarina Gouveia
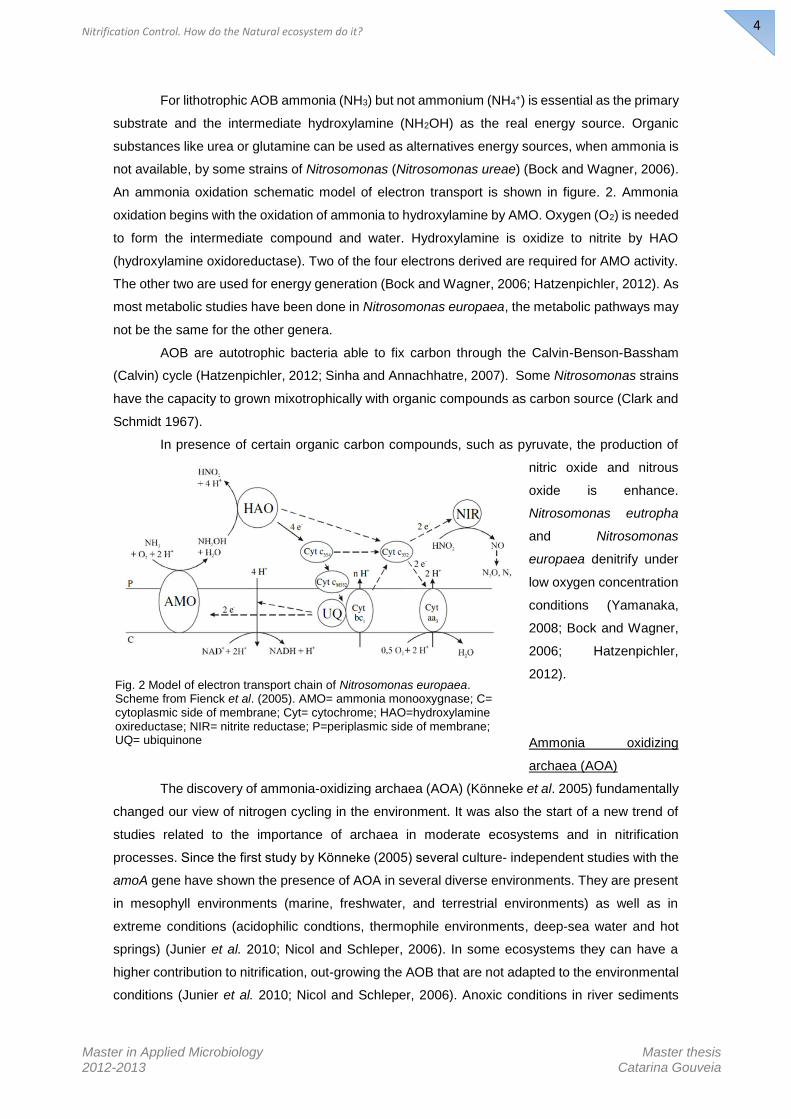
For lithotrophic AOB ammonia (NH3) but not ammonium (NH4+) is essential as the primary
substrate and the intermediate hydroxylamine (NH2OH) as the real energy source. Organic
substances like urea or glutamine can be used as alternatives energy sources, when ammonia is
not available, by some strains of Nitrosomonas (Nitrosomonas ureae) (Bock and Wagner, 2006).
An ammonia oxidation schematic model of electron transport is shown in figure. 2. Ammonia
oxidation begins with the oxidation of ammonia to hydroxylamine by AMO. Oxygen (O2) is needed
to form the intermediate compound and water. Hydroxylamine is oxidize to nitrite by HAO
(hydroxylamine oxidoreductase). Two of the four electrons derived are required for AMO activity.
The other two are used for energy generation (Bock and Wagner, 2006; Hatzenpichler, 2012). As
most metabolic studies have been done in Nitrosomonas europaea, the metabolic pathways may
not be the same for the other genera.
AOB are autotrophic bacteria able to fix carbon through the Calvin-Benson-Bassham
(Calvin) cycle (Hatzenpichler, 2012; Sinha and Annachhatre, 2007). Some Nitrosomonas strains
have the capacity to grown mixotrophically with organic compounds as carbon source (Clark and
Schmidt 1967).
In presence of certain organic carbon compounds, such as pyruvate, the production of
nitric oxide and nitrous
oxide is enhance.
Nitrosomonas eutropha
and Nitrosomonas
europaea denitrify under
low oxygen concentration
conditions (Yamanaka,
2008; Bock and Wagner,
2006; Hatzenpichler,
2012).
Ammonia oxidizing
archaea (AOA)
The discovery of ammonia-oxidizing archaea (AOA) (Könneke et al. 2005) fundamentally
changed our view of nitrogen cycling in the environment. It was also the start of a new trend of
studies related to the importance of archaea in moderate ecosystems and in nitrification
processes. Since the first study by Kӧnneke (2005) several culture- independent studies with the
amoA gene have shown the presence of AOA in several diverse environments. They are present
in mesophyll environments (marine, freshwater, and terrestrial environments) as well as in
extreme conditions (acidophilic condtions, thermophile environments, deep-sea water and hot
springs) (Junier et al. 2010; Nicol and Schleper, 2006). In some ecosystems they can have a
higher contribution to nitrification, out-growing the AOB that are not adapted to the environmental
conditions (Junier et al. 2010; Nicol and Schleper, 2006). Anoxic conditions in river sediments
Fig. 2 Model of electron transport chain of Nitrosomonas europaea. Scheme from Fienck et al. (2005). AMO= ammonia monooxygnase; C= cytoplasmic side of membrane; Cyt= cytochrome; HAO=hydroxylamine oxireductase; NIR= nitrite reductase; P=periplasmic side of membrane; UQ= ubiquinone
4 Nitrification Control. How do the Natural ecosystem do it?

Master in Applied Microbiology 2012-2013
Master thesis Catarina Gouveia
(Liu et al. 2013), acidic soils or poor nutrient ecosystems (He et al. 2012) are examples, among
other.
While in an aquatic environment the majority of AOA belong to “mesophilic
crenarchaeaota” 1.1a lineage, representing approximately 20% of all prokaryotes found in these
ecosystems (Karner et al. 2001; Prosser and Nicol, 2008), most soils are dominated by
sequences of ammonia oxidizing archaea belonging to 1.1b lineage.
The attention and studies done in this group of archaea culminated in a proposal of a third
archaeal phylum named Thaumarchaeota (Brochier-Armanet et al. 2008; Spang et al. 2010), with
a set of genomic characteristics that make it and distinct phylum (Hatzenpichler, 2012; Spang et
al. 2010). Currently the only common physiological trait is the chemolithoautotrophic growth by
ammonia oxidation. (Norton and Stark, 2011; Hatzenpichler, 2012; He et al. 2012).
The metabolic pathways for ammonia oxidation in AOA are still unclear. No HAO
homologue has been found in any AOA genome, so AMO may not catalyse the same reaction as
in AOB (Hatzenpichler, 2012; He et al. 2012). In contrast to AOB, thaumarchaeotal populations
seem to have the genetic potential and metabolic ability to use amino acid as energy source
(Hatzenpichler, 2012). This metabolic ability can also be seen by the preference for organic
sources of nitrogen, e.g. aminoacids (He et al. 2012; Tourna et al. 2011). AOA also have a higher
affinity for ammonia (Martens-Habbena et al. 2009), being more adaptable to low nutrients
conditions, AOA can out-number the AOB in oligotrophic environments.
Some marine species of AOA, e.g. “Candidatus Nitrosopumilus maritimus” have shown
a growth inhibition in presence of organic carbon. However the terrestrial Nitrososphaera strains
growth can be enhanced by small amounts of pyruvate. So in some soil environments the AOA
diversity can be enhance by a rich organic carbon content (Liu et al. 2013), contrasting with most
AOB species that are sensible to the presence of organic carbon. So, the preferential nutritional
and environmental conditions of AOB and AOA can be distinct, allowing a separation of both
communities in distinct niches.
Importance of nitrification and regulation:
Through the nitrification process, several compounds can be produced. The intermediary
product of nitrification, nitrite is usually is found in trace amounts comparing with other forms of N
that can appear in relatively high concentrations (Bock and Wagner, 2006; Norton and Stark,
2011, Dias et al., 2012). The maintenance of a low nitrite concentration in aerobic habitats is
essential since nitrite is toxic to microorganisms, root plants and seeds (Bock and Wagner, 2006;
Norton and Stark, 2011; Cleemput and Samater, 1996). So, a sequential and almost immediate
nitrite oxidation to nitrate by nitrite oxidizing bacteria (NOB) is fundamental in maintaining a low
nitrite concentration. The sequential nitrite consumption and oxidation is possible since ammonia
oxidation to nitrite is done at low rates, being considered the rate-limiting step of nitrification (Bock
and Wagner, 2006; Norton and Stark, 2011; Fiencke et al. 2005).
Nitrite accumulation can be found at low oxygen partial pressure, e.g. soil with a water
content, under alkaline conditions where ammonia oxidation is enhanced, in environments with
5 Nitrification Control. How do the Natural ecosystem do it?
Master in Applied Microbiology 2012-2013
Master thesis Catarina Gouveia
high ammonia concentrations and in conditions with decreased or inhibited nitrite oxidation
activity. Nitrite oxidising organisms (NOB) can be inhibited by high ammonia concentrations
(Norton and Stark, 2011) or by nitrite, since high concentrations are toxic. Without nitrite oxidation
by NOB, it becomes difficult to regenerate the low nitrite state of the ecosystem.
In anoxic conditions, nitrite accumulation can lead to nitric oxide and nitrous oxide
production by heterotrophic bacteria denitrifcation, or by AOB denitrification.. It was though that
these oxides were produced as intermediaries in ammonia oxidation (Cleemput and Samater,
1996; Bremner, 1997). However it is now known that AOB are capable producing these oxides
by a denitrification process, with the reduction of nitrite by nitrite reductase (NIR) in anoxic
conditions (Bremner, 1997; Burns et al. 1996), as seen in some species of AOB e.g. Nitrosomas
eutropha and Nitrosomonas europaea (Yamanaka, 2008; Bock and Wagner, 2006;
Hatzenpichler, 2012). The production of these oxides is problematic since both oxides form acids
(nitrous acid and nitric acid) when interacting with water and may contribute to soil acidification
and root damage (Fiencke et al., 2005). Nitrous oxide also acts like a greenhouse gas with a
potential 310 times higher than carbon dioxide (Bock and Wagner, 2006; Fiencke et al., 2005).
Therefore regulation of nitrifying activity is essential to maintain the level of ammonia,
nitrite and nitrate so that there is not a loss of fertility with low N quantities, nor a system
eutrophication due to high N quantities.
As it is mentioned above the main factors that can regulate ammonia oxidation activity
and AOM growth are substrate concentration (ammonia concentration), pH, presence of organic
matter, oxygenation, water content, temperature and biotic regulation through plant-AOM
interaction which can be by substrate competition with plants, or effect of plant exudates.
Mediterranean type ecosystem
This study focus on AOB and AOA communities found in Mediterranean-type ecosystem.
Mediterranean ecosystem can be characterized by a highly seasonal climate with hot dry
summers and mild wet winters. This asynchronous ecosystem with marked seasonal changes
greatly influences the N fluxes. In summer when soils become water-limited the microbial activity,
like decomposition and ammonia mineralization, tends to decrease, as should also occur to
nitrification. The microbial activity should be being higher in spring or/and autumn due to the
increase in water content (Ochua-Hueso et al. 2011; Dias et al. 2012). Concerning vegetation,
the study site, in Serra da Arrábida was characterized as being a dense maquis with Cistus
ladanifer as the dominant summer semi-deciduous plant (Dias et al. 2008). As for inorganic N
content, it is known to vary greatly through the year, being lower in August and higher in November
(Ochua-Hueso et al. 2011). Soil can be considered poor in N content, with the non-fertilized soils
(without any N addition) having a very low quantity of inorganic N even in spring when soils have
a greater nutrients turnover. It is an acidic soil with a pH of 5.8 ±0.2. (Dias et al. 2012). Microbial
communities from these types of ecosystem should be adapted to low water content, climate
changes, and low nutrient content. For microorganism adapted to low nutrient concentrations, as
6 Nitrification Control. How do the Natural ecosystem do it?

Master in Applied Microbiology 2012-2013
Master thesis Catarina Gouveia
the microbial communities found in Mediterranean soils, a nutrient input can cause abrupt and
drastic alterations in community structure and activity.
Aims of this thesis
The work presented in this thesis aims to understand the ammonia oxidizing community
in soils from a Mediterranean type ecosystem. The first objective was to know in which niche AOM
community’s had a higher ammonia oxidation activity. Two niches were studied the root surface
and rhizospheric soil of the most abundant plant species, Cistus ladanifer (Dias et al. 2008). After
assessing the niche with the higher ammonia oxidation activity, the second objective was to
compare the ammonia-oxidising communities from soils under nitrogen addition. The 3rd objective
was to assess the effect of ammonia concentration, pH and presence of organic matter in AOB
cultures.
Hypothesis:
In a poor nutrient ecosystem as the Mediterranean ecosystem, the preferential niche for
the AOM growth and activity should be near the plant root, to have a higher nutrient exchange
between the plant and AOM (Ochua-Hueso et al. 2011), besides giving conditions, as pH and
oxygenation, favourable to AOM. Microsite in the surface of the root may have the environmental
conditions to ammonia mineralization and production to occur, increasing the quantity of substrate
for AOM in that area (Cleemput and Samater, 1996), while rhizospheric soil around the root may
not have the same quantity of nutrients.
Bacterial or archaeal communities that are adapted to low nutrient conditions tend to
suffer great changes with nutrient addition. Although some microbial groups have shown a higher
degree of metabolic flexibility and physiological tolerance when changing the growth conditions
this case is not seen for AOB communities, as rapid growth rates and high abundances are
needed for the community’s strains to have that flexibility and adaptability (Allison et al. 2008).
Regarding the effect of N-addition in soils, the increase in ammonia-oxidation activity
when the ecosystem has an increase in N quantity is excepted since it can be a strategies to
counterbalance the nitrogen excess in the naturally low nutrient ecosystem. However, as AOM
populations in poor nutrient soils may be adapted to oligotrophic environments, a change in the
population structure may occur as adaptation to the higher N input.
As population adapted to low N content, the AOB population from soil without N addition
are expected to be more susceptible to higher ammonia concentrations. Concerning pH it is
described that AOB prefer pH basic to neutral (Bock and Wagner, 2006; Norton and Stark, 2011;
Hatzenpichler, 2012), however AOB population can have ammonia oxidation activity at a slightly
acid pH (>6, <7) (Hatzenpichler, 2012), so it is expected to have ammonia oxidation activity
between pH 6.5 and pH 7.8. As the soils are poor in organic matter (Dias et al. 2012), AOM
populations may prefer inorganic energy and carbon sources, though AOM can have a
mixotrophic or even organotrophic growth.
7 Nitrification Control. How do the Natural ecosystem do it?

Master in Applied Microbiology 2012-2013
Master thesis Catarina Gouveia
Materials and Methods:
Study site
The present study was conducted at Serra da Arrábida in the Arrábida Natural Park, a Natura
2000 site in south of Lisbon, Portugal (PTCON0010 Arrábida/Espichel). The study site (38º 29’ N
- 9º 01’ W) is located within a region belonging to the sub-humid thermo-mediterranean bioclimatic
domain (Clemente 2002). According to the climatic normal (2012) in July, when the first soil collect
was done, the mean maximum temperature was 28ºC, mean minimum temperature was 15ºC
and mean precipitation was 1 mm. In October, the second soil collect was done, the mean
maximum temperature was 22ºC, mean minimum temperature was 14ºC and mean precipitation
was 50 mm. Reported data refer to the nearest climatic station (Setúbal, 15 km distance –Instituto
Português do Mar e Atmosfera). The dominant plant species is Cistus ladanifer (Dias, 2008).
Experimental design
The experimental design was defined on the scope of FCT project “Spheres of ecosystem
response to nitrogen: a case Study in a Mediterranean-type ecosystem in the southern of Portugal
(SERN) PTDC/BIA BEC/099323/2008. It consists of 12 plots, of 400 m2 each. N availability was
modified by the addition of 40 and 80 kg N ha-1 yr-1 in the form of NH4NO3 (40AN and 80AN,
respectively) and 40 kg N ha-1 yr-1 as a 1:1 mixture of NH4Cl-N and (NH4)2SO4-N (40A) (Fig.2).
Each treatment had three replicates (3 plots). To prevent N ‘contamination’ through runoff from
fertilized plots, the experimental plots were distributed in three rows along the slope, with the
controls (without fertilization) being located in the top row. The fertilization began in January 2007
and it is still being applied. Three equal applications have been applied throughout the year:
middle autumn/winter, spring and summer.
Soil and Root sampling
The soil samples used for the study of ammonia oxidizing archaea (AOA) and ammonia oxidizing
bacteria (AOB) preferential distribution were
collected in July 2012. Three soil locations were
randomly chosen in each control plot (C, F and E)
(Fig. 3). None of the sample was taken from the
modified plots. For each sample rhizospheric soil
and roots were taken from seed germinated Cistus
ladanifer plants at a depth of 5 - 6 cm. Samples
were stored in clean plastic cups and refrigerated.
In the laboratory, individual samples were
immediately weighted and prepared for the
microbial enrichment cultures.
For the activity and community structure comparison of ammonia-oxidizing communities in the
non-fertilized and fertilized (altered) plots the sampling was performed in October 2012. Three
rhizospheric soil samples were taken from different seed germinated Cistus ladanifer at a depth
Fig.3 Experimental design scheme and the relative location of the experimental plots (Green - Control; Orange - 40A; Blue - 40AN; and Grey - 80AN)
8 Nitrification Control. How do the Natural ecosystem do it?

Master in Applied Microbiology 2012-2013
Master thesis Catarina Gouveia
of 5 - 6 cm in each plot (Fig.3). Samples were maintained cold in clean plastic cups. A composite
sample was obtained by homogenization of three samples from each of the three field replicate
plots. 1 gram of soil from each composite sample was used as inoculum for the sequential
enrichment cultures (AOB and AOA). A soil extract was prepared for each composite sample with
1 gram diluted in 10 ml of ultra-pure water for nitrite and ammonia quantification.
Ammonia oxidizing microorganism’s enrichments cultures
To compare the nitrifiying activity in Cistus ladanifer rhizospheric soil and roots three sequential
enrichments cultures were prepared to allow a selection and subsequent increase of the ammonia
oxidizing microorganism’s (AOM) population.
In the first enrichment 36 enrichment cultures were prepared: 18 cultures for AOB (9 for roots, 9
for rhizospheric soil) and 18 for Archaea (9 for roots, 9 for rhizospheric soil). Ammonia oxidizer
Bacteria enrichment cultures were achieved in 25 mL McCartney flasks containing 20 mL of Fresh
Synthetic Crenoarchaeota (SFC) with 1 mM of NH4Cl. 1 g of soil or roots were used to inoculate
20 ml of medium. SFC medium (Konneke et al. 2005; De La Torre et al. 2008) consistes of NaCl
(1 g L-1), MgCl2·6H2O (0.4 g L-1), CaCl2·2H2O (0.1 g L-1), KCl (0.5 g L-1), MgSO4.7H2O (5 g L-1)
and KBr (0.1 g L-1). After sterilization in autoclave (121ºC; 10min) the medium was supplemented
with: per litter of medium, 1 mL of non-chelated trace element mixture, 1 mL of vitamin solution,
10 ml of KH2PO4 solution (4 g L-1), 1 ml of tungstate-selenite solution, 1 ml of sodium bicarbonate
solution (1 M), and 1 ml of NH4Cl (1M). These solutions were prepared with distilled water and
sterilized in autoclave (121º for 10 min) or by filtration (0.45 µm) for heat-sensitive compounds.
The final pH is between 6.5 and 7. Ammonia oxidizer archaea (AOA) first enrichment cultures
were prepared with streptomycin in a concentration of 2.5 µg ml-1. Cultures were incubated at
28ºC without shaking during 30 and 60 days for AOB and AOA respectively. After the first
enrichment stage, AOM cultures producing more than 1 mg/L NO2- (positive cultures) were sub-
cultured into a second enrichment stage transferring 5% (v/v) inoculum to 20 mL SFC fresh
medium supplemented with sodium chlorate (5 mg L-1). For the second enrichment for AOA
streptomycin was replaced by ampicillin at 100 µg ml-1. AOM cultures that didn’t produce nitrites
(negative cultures) or those producing less than 1 mg /L of nitrites were discarded. The third
enrichment for AOB was obtained by transferring 5% (V/V) of inoculum into 20 ml of fresh SFC
medium. For AOA cultures ampicillin was replaced by 0.05% chloramphenicol.
For the study of ammonia oxidizing communities in the non-fertilized and in fertilized plots,
rhizospheric soil was used to inoculate 24 initial enrichment cultures: 12 initial cultures for AOB
and 12 for AOA. 1 g of soil was used to inoculate 20 ml of SFC medium with 1 mM of NH4Cl,
supplemented with Calcium Carbonate (7.5 gl-1), Pimaricine (0.04 gl-1), and sodium chlorate (5
mg l-1). The first enrichment for Archaea had ampicillin in a concentration of 100 µg/ml. For AOB
the medium was not altered in the sequential enrichments. For AOA cultures streptomycin (100
µg ml-1) was added to the 2nd and Chloranphenicol 0.05% to the 3rd enrichments.
9 Nitrification Control. How do the Natural ecosystem do it?

Master in Applied Microbiology 2012-2013
Master thesis Catarina Gouveia
In every enrichment 5 % (v/v) of inoculum was transferred from both positive and negative
cultures. Cultures were incubated at 28ºC without shaking during 30 and 60 days for AOB and
AOA respectively.
Ammonia susceptibility:
SFC medium was supplemented with 5mM of sodium chlorate, pimaricine (0.04 gL-1),
calcium carbonate (7.5 gL-1) and different ammonia concentrations: 1 mM, 10 mM, 50 mM, 100
mM and 500 mM. The medium was inoculated at 5 % with 2nd enrichment AOB community
cultures. Cultures were incubated at 28°C during 15 days without shaking. Growth was indirectly
estimated by assessing cultures activity by nitrite concentrations determinations at several time-
points by the Griess method.
pH susceptibility:
SFC medium was supplemented with 5mM of sodium chlorate, pimaricine (0.04 gL-1),
calcium carbonate (7.5 gL-1) and 1Mof ammonia concentrations. pH was altered with 1M and 10M
HCl and 1M NaOH to achieve pH 5.6, 6.7, 7.1 and 7.9. The medium was inoculated at 5 % V/V
with 2nd enrichment AOB community cultures. Cultures were incubated at 28°C during 30 days
without shaking. Growth was indirectly estimated by assessing cultures activity by nitrite
concentrations determinations at several time-points by the Griess method.
Effect of organic compounds in AOB nitrite production
SFC medium was supplemented with 5mM of sodium chlorate, pimaricine (0.04 gL-1),
calcium carbonate (7.5 gL-1) and different organic compounds: urea (46.8 mg/L), peptone (101
mg/L), sodium acetate (0.5 %) and glucose (0.5 %).Concentrations for urea and peptone were
calculated to have the same amount of N as the control media (1M of NH4C, corresponding to
0.78 mM of N). Media with a combination of ammonia and urea or peptone was prepared with 0.5
M of ammonia chlorate and urea (mg/L) and peptone (mg/L). Media with sodium acetate or
glucose had 1M of ammonia, but not sodium bicarbonate.The medium was inoculated at 5 % with
2nd enrichment AOB community cultures. Cultures were incubated at 28°C during 30 days without
shaking. Growth was indirectly estimated by assessing cultures activity by nitrite concentrations
determinations at several time-points by the Griess method.
AOM Indirect Growth Measurement
AOM indirect growth was estimated by measuring nitrite concentration at several time-
points by the Griess method (Standard Methods, 1999). 200 µl were removed from each culture
and the ammonia-oxidizing reaction was stopped with a 4 M KCl solution in a 1:2 proportion. 50
µl of the sample were mixed with 125 µl of a sulphanilamide solution (10 g L-1) diluted with 10%
concentrated HCl and 125 µl of N-(1-naphthyl)-ethylenediamine solution (100 mg L-1). The assays
were conducted in a 96-well microplate and the absorbance was read at 540 nm in a
spectrophotometric microplate reader (Tecan Spectra Rainbow Micrplate Reader 400-700nm,
10 Nitrification Control. How do the Natural ecosystem do it?
Master in Applied Microbiology 2012-2013
Master thesis Catarina Gouveia
Switzerland). Nitrite standard curve was prepared using sodium nitrite solutions with
concentrations ranging between 1–100 μM. Nitrite concentration of experimental samples were
obtained from the resulting standard curve of nitrite concentration vs. absorbance.
The nitrite concentration through time was used to establish a nitrite production profile
and typical parameters were determined. For the 1st enrichment, length of Lag phase, nitrite
production rate, maximum nitrite concentration and area under the curve were used to compare
the different cultures. For the 2nd and 3rd stages of enrichment, nitrite production rate and
maximum nitrite concentration were used to compare ammonia oxidizing community’s cultures.
Lag phase was defined as the time segment between the beginning of incubation time
and beginning of exponential nitrite production, expressed by days. Nitrite production rate was
define at exponential phase with linear regression and was expressed as mg of nitrite produced
per liter per incubation day (mg/L/d). Maximum nitrite concentration was determined as the
highest nitrite concentration value after the 1st day of incubation, expressed as mg of nitrite per
liter.
Additionally, ammonia concentration was determined in the end of each culture
enrichment stage by the Berthelot reaction. 50 µl of each culture was first mixed with 50 µl of 5 %
sodium citrate solution (pH 7). After 1 min of incubation at room temperature, 50 µl of 2-
phenylphenol nitroprusside (PPS-nitroprusside) solution was added. Then 25 µl of hypoclorite
buffer (pH 13) was added followed by 100 µl of deionized water. The microplate was incubated in
the dark at room temperature for 45 min before reading. The assays were conducted in a 96-well
microplate and the absorbance was read at 660 nm in a spectrophotometric microplate reader
(Tecan Spectra Rainbow Micrplate Reader 400-700nm, Switzerland). The PPS-nitroprusside
solution was prepared with 3.22 g of 2-hydroxybiphenyl sodium salt tetrahydrate and 0.015 g of
sodium nitroprusside dehydrate dissolved in 100 ml of deionized water. The buffer was prepared
by dissolving 1 g of tri-sodium phosphate dodecahydrate in deionized water and 10 ml of sodium
hypochlorite.
Subsequentially ammonia consumption (%) (equation 1) and nitrite production yield (%) (equation
2) were determined. The yield is calculated given in account the N weight, not the total molecule
weight.
( [𝑁𝐻4+]𝑓𝑖𝑛𝑎𝑙 − [𝑁𝐻4
+]𝑖𝑛𝑖𝑡𝑖𝑎𝑙 ) × 100 (equation 1)
(([𝑁𝑂2−]𝑚𝑎𝑥𝑖𝑚𝑢𝑚 × 0.31)/([𝑁𝐻4
+]𝑐𝑜𝑛𝑠𝑢𝑚𝑒𝑑 × 0.782)) × 100 (equation 2)
DNA extraction:
DNA was extracted from 10 - 15 ml of the enrichment cultures using a direct boiling method
(Sambrook et al. 2001). The samples were centrifuged at 4000 rpm for 10 minutes to remove the
medium precipitated CaCO2. The supernatant was centrifuged at 4000 rpm for 10 min. The pellet
was ressuspended in TE buffer (pH 8) and centrifuged at 13 000 rpm for 5 min to wash the cells.
1 30% of NO2- molecular weight is nitrogen 2 78% of NH4+ molecular weight is nitrogen
11 Nitrification Control. How do the Natural ecosystem do it?

Master in Applied Microbiology 2012-2013
Master thesis Catarina Gouveia
The supernatant was discarded and the pellet was ressuspend with TE supplemented with 0.1%
tween. The samples were incubated at 100ºC for 10 min.
PCR amplification
Each 50 μl PCR reaction contained: 0.2 µl (1 unit) BioTaq DNA Polymerase (Bioline, 500 units),
5 µl (1x) NH4+ Buffer (Bioline, 10X), 2 µl (2 mM) MgCl2 (Bioline, 50 mM), 1µl (0.2 mM each) dNTPs
(10 mM each), 1 µl (50 ρmol/µl) of each primer, and 2.5 µl of BSA (0.1 %). 1 μl of extracted DNA
was used as template.
Thermal conditions for the bacterial 16S RNA PCR were as follows: 3 min initial denaturing step
at 94 °C, followed by 35 cycles of 1 min denaturing at 94 °C, 2 min annealing at 50 °C and 1 min
extension at 72 °C, with a final extension step of 3 min at 72 °C.
All PCR products were verified on 1% agarose gels stained with ethidium bromide under UV light.
Primers used for amplification, targets and positive controls are listed in table 1.
Primer Sequence target Positive control Tested
dilutions reference
104F 5’-GGCGVAYGGGTGAGTAA-3’ Bacterial 16S
rRNA Escherichia coli
1:1; 1:10;
1:25
Sandra Chaves
907R 5’-CCGTCAATTCMTTTRAGTTT-3’ Muyzer et al. 1995
ArchF 5’-GAATTGGCGGGGGRGCA -3’ Archaeal 16S
rRNA
Halobacterium
salinarium
DSMZ
1:1
Sandra Chaves,
personal
communication ArchR 5’-TGTGTGCAAGGRGCAGGG – 3’
amoA-1F 5′-GGGGTTTCTACTGGTGGT-3′ Β-proteobacteria
amoA
Nitrosomonas
europaea 1:1; 1:10
Rotthauwe et al.
1997 amoA-2R 5′-CCCCTCKGSAAAGCCTTCTTC-3’
Arch-
amoA-rer 5´- TTCTTCTTTGTWGCCCARTA – 3’
Archaeal amoA - 1:1
Sandra Chaves,
personal
communication Arch-
amoA-for 5’ – CTGAYTGGGCYTGGACWTC – 3’
PCR- RFLP fingerprinting:
Selection of the restriction endonuclease was based on the in silico analysis of several selected
amoA sequences from the β-ammonia oxidizing bacteria group of AOB available on GenBank,
access numbers given by Purkhold et al. (2000), using the NEBCutter V2.0
(http://tools.neb.com/NEBcutter2/) from new England Biolabs. The enzyme HinfI and HaeIII was
selected given its ability to discriminate between the different strains, with 2 or 3 hydrolysis region,
and did not produced fragments with less than 20 bp length.
Amplification of amoA genes for RFLP analysis was performed as described above. The
restriction was done separately for each enzyme. Reactions contained 10 µl of PCR product from
each sample, 5 U of HinfI and 1x NEBuffer 2 (New England Biolabs GmbH, Frankfurt, Germany)
12 Nitrification Control. How do the Natural ecosystem do it?
Table 1. Primers used for PCR-amplifications of archaeal and bacterial 16S rRNA and amoA genes.
Master in Applied Microbiology 2012-2013
Master thesis Catarina Gouveia
or 5 U of HaeIII and M buffer (TAKARA bio INC. Kyoto, Japan). Restriction reactions were
performed at 37 ºC for 24 h. Full reaction volumes were loaded and visualized on a 1.5 % agarose
gel 1:3 high resolution ultra-pure agarose - 1000, 2:3 ultra-pure agarose (Invitrogen
Carlsbad, Estados Unidos) under UV light, after staining with ethidium bromide (EtBr) for 15 min.
Statistical analysis
The statistical analysis was performed using SPSS 20 software for Windows. All data was
checked for normality with the Levine’s test. The coefficient variation (equation 3) was calculated
as a normalized measure of dispersion for all the data. Linear data was checked for multiple
comparisons of means with ANOVA at p<0,05. Kruskal-Wallis test was performed for non-linear
data at p<0,05. Rank transformation followed by a two-way ANOVA was performed for the AOB
community’s ammonia sensibility data, as described by Iman and Conover (1983).
𝐶𝑉 = 𝜎 (𝑠𝑡𝑎𝑛𝑑𝑎𝑟𝑑 𝑑𝑒𝑣𝑖𝑎𝑛𝑡𝑖𝑜𝑛)
µ (𝑚𝑒𝑎𝑛) (equation 3)
Results and Discussion
Where does the Ammonia-oxidizing community prosper?
Cistus ladanifer as the most abundant plant species in the experimental study, was
expected to have the highest influence on soil microbial community. So, the activity of ammonia
oxidizing communities in Cistus ladanifer root surface and rhizospheric soil was assessed in order
to understand in which of these niches presents a higher ammonia oxidation activity. As described
in methods, 3 sequential enrichments were done. Active AOB and AOA cultures were defined as
cultures with nitrite accumulation through time, where the maximum nitrite concentration is higher
than the nitrite concentration found in lag phase.
Nitrite production by Ammonia-Oxidizing Bacteria
Ammonia-oxidizing bacteria growth is difficult to measure, so most of the studies are
based on the activity, or nitrite production. With the nitrite measurement through the incubation
time it is possible to have nitrite production curves to characterize that community.
In the rizospheric soil community 1st enrichment, nitrite accumulation can be seen during
the beginning of incubation, 2 days for soil and root AOB cultures (fig.4 a and d), but decreases
after that period of time. For soil AOB cultures nitrite starts to accumulate 7 days after the first
decrease. Nitrite production recovery for root AOB cultures starts after 15 days of incubation. Both
soil and roots AOB cultures had a 2nd decrease in nitrite concentration, more evident for root AOB
cultures at 22 days of incubation (fig. 4 d) than soil AOB cultures at 13 days of incubation (fig.4
a). If in the cultures AOB where the only functional community active then the nitrite production
from ammonia should be constant. However the community’s nitrite production dynamics includes
diauxic growth and the variations in nitrite concentration can be considered as a result of the
culture dynamics, since the coefficient variation (CV) for Griess method is 0.1, lower than these
variations.
13 Nitrification Control. How do the Natural ecosystem do it?

Master in Applied Microbiology 2012-2013
Master thesis Catarina Gouveia
The 1st enrichments are prepared from soil and roots, adding nutrients and organic
compounds to the medium. Since the microbial inoculum corresponds to the community present
in that soil and root surface, both AOM and other heterotrophic bacteria, capable of producing
nitrite, are present in the culture. AOM have a slow growth and most AOB species need several
days to weeks for growth, depending on the conditions such as substrate concentration, oxygen
availability, the temperature and pH values (Bock and Wagner, 2006). Since heterotrophic
bacteria tend to out-grow the AOM in selective media, using the soil inoculum nutrients, the
observed diauxic growth can be explained by the change in nutrient source from the ones in the
medium to the nutrients in soil and roots.
Concerning the studied nitrite production parameters: lag phase, time period, in days (d),
between the beginning of incubation and beginning of exponential phase; nitrite production rate,
mg of nitrite produced per day per liter of medium (mg/L/d), calculated in the exponential phase;
and maximum nitrite concentrations (mg/L), the enrichment community cultures from both soil
and roots AOB cultures presented a high heterogeneity (table. 2 in annex) for maximum nitrite
concentration (1.04 and 1.46, respectively) and nitrite production rate (1.59 and 2.3). Lag phase
for soil and root AOB culture present the lowest variation (0.26 and 0.32). Root AOB cultures had
higher CV for the studied parameters compared to soil AOB cultures.
The 3 studied plots (plot C, E and F) from soils without N addition, are considered field
replicates in the experimental design, however considering the natural heterogeneity found in
soils (Ochua-Hueso et al. 2011), it is expected to have a higher heterogeneity between
communities from the same plot and between communities between the 3 plots.
Comparing the maximum nitrite concentration produced by the AOB cultures in both
niches (Table 2), soil AOB cultures had higher maximum nitrite concentrations (3.59 mg/L) than
root surface AOB cultures (1.35 mg/L), though significant differences were not found (ANOVA
p=0.95, table 3 in annex). Particularly, communities from plot C had the highest values (9.36
mg/L, 3.06 mg/L and 11.27 mg/L) in soil AOB cultures. In root surface AOB cultures, plot C also
presents the highest values for maximum nitrite concentration (2.26 mg/L, 0.75 mg/L and 6.62
mg/L) (table 2). Soil communities also present higher nitrite production rates than root surface
communities (0.46 mg/L/d and 0.15 mg/L/d, respectively) (table.2), though significant differences
were not observed (ANOVA, p=0.95) (table. 3 in annex). The highest nitrite production rate was
also observed for plot C in soil AOB cultures and root AOB cultures (table.2).Concerning lag
phase, root AOB cultures had higher lag phases than soil AOB cultures (23.33 d and 16.67 d,
respectively) (table 2), lag phase was significant different between the soil and root AOB cultures
(sig of 0.049, ANOVA with p= 0.95) (table. 3 in annex).
Since root cultures had cultures without constant nitrite production, nitrite production rate
could not be calculated and where given a value of 0 mg/L/d. Lag phase for these cultures is 30
days, corresponding to the complete incubation time.
The soil used to prepare the 1st enrichment can have more nutrients and organic
compounds available than roots with complex organic compounds that need to be degraded
14 Nitrification Control. How do the Natural ecosystem do it?

Table. 2. 1st enrichment nitrite production parameters for the Rhizospheric Soil AOB community cultures and root surface AOB community culture of Cistus ladanifer from non-fertilized soils without N addition: Plot C, E and F. Parameters include lag phase, expressed by day, nitrite production Rate expressed by mg nitrite/L/d and maximum nitrite concentrationexpressed as mg/L. Plant 1, 2, 3 are field replicates from which the samples were collected.
Master in Applied Microbiology 2012-2013
Master thesis Catarina Gouveia
before being used as energy source for heterotrophic bacteria. This could explain the higher lag
phase in root community cultures, particularly in plot C communities.
To correctly compare the AOB community activity, cultures without growth of other
microorganisms are needed. Therefore a 2nd enrichment was performed.
From 9 inital rhizospheric soil community cultures, 7 were considered active and used as
inoculum for a 2nd serial enrichment. From root community cultures 3 were considered active and
used to prepare the 2nd enrichment (table. 1 in annex).
In the 2º enrichment’s community’s cultures (fig. 4 b and e) constant nitrite production
can be observed. No nitrite decrease is observed for the root or soil AOB cultures (fig. 4 b and e).
The nitrite concentration decrease observed in the 1st enrichment indicated a growth of other
microorganisms than AOB. With a serial transfer, nutrients and organic compounds found in the
1st enrichment were diluted, decreasing the growth of heterotrophic bacteria.
As nitrite-oxidizing bacteria could be one of the possible groups of bacteria existing in the
inoculum, in the 2nd enrichment a nitratation (nitrite oxidation to nitrate) inhibitor, sodium chlorate,
was added to the medium. Chlorate appears to affect specifically the nitrite-oxidizing bacteria,
and has little to none inhibitory effect on the growth and activity of ammonium oxidizers (Belser
and Mays, 1980). With a nitratation inhibitor the rate at which nitrite accumulates will be the rate
of ammonium oxidation (Norton and Stark, 2011), allowing a more correct determination of
ammonia oxidation parameters: maximum nitrite concentration and nitrite production rate.
Soil AOB cultures had a higher nitrite production rate and maximum nitrite concentrations
(2.15 mg/L/d and 27.26 mg/L) than root AOB cultures (1.19 mg/L/d and 14.91 mg/L) in average
(table 3). Observing each culture from soil and root AOB cultures, in soil AOB cultures Plot E
presents the highest values for maximum nitrite concentration (30.22 mg/L and 29.49 mg/L) while
plot C has the lowest value (23.01 mg/L), while the the lowest and highest nitrite production rates
rates can be seen for in plot E (1.48 mg/L/d and 2.89 mg/L/d). For root AOB cultures the highest
Rhizospheric Soil Cultures Roots Cultures
Plot Plant Lag phase (d) Nitrite production rate
(mg/L/d)
Maximum [nitrite] (mg/L)
Lag phase
(d)
Nitrite production rate
(mg/L/d)
Maximum [nitrite] (mg/L)
Plot C 1 7 0.65 9.36 15 0.18 2.26
2 16 0.15 3.06 15 0.05 0.75
3 21 2.48 11.27 15 1.08 6.62
Pot E 1 15 0.13 2.06 30 0 0.4
2 15 0.21 2.82 30 0 0.2
3 15 0.05 0.84 30 0 0.17
Plot F 1 21 0.07 0.46 30 0 0.43
2 21 0.45 1.52 30 0 0.26
3 19 0 0.89 15 0.07 1.06
mean 16,67 0,46 3,59 23,33 0,15 1,35
Standard deviation
4,27 0,74 3,72 7,45 0,35 1,96
15 Nitrification Control. How do the Natural ecosystem do it?

Table.3. 2nd enrichment nitrite production parameters for the Rhizospheric Soil AOB community cultures and root surface AOB community culture of Cistus ladanifer from non-fertlized soils without N addition: Plot C, E and F. Parameters include lag phase, expressed by day, nitrite production Rate expressed by mg nitrite/L/d and maximum nitrite concentrationexpressed as mg/L. Plant 1, 2, 3 are field replicates from which the samples were collected.
Master in Applied Microbiology 2012-2013
Master thesis Catarina Gouveia
maximum nitrite concentration and nitrite production rate can be observed in plot C (27.98 mg/L
and 2.39 mg/L/d), and the lowest values can also be observed in plot C (0.21 mg/L and 0 mg/L/d)
(table. 3).
Lag phase was measured, but not analysed, since it depends on the activity level of the
previous cultures when they were transferred, requiring a similar activity level to be comparable.
A higher homogeneity can be observed for the soil AOB cultures (CV of 0.2 for nitrite
production rate and 0.08 for maximum nitrite concentration) in the 2nd enrichment, though root
AOB cultures did not presented an increase in homogeneity (CV of 1.86 for nitrite production rate
and 0.92 for maximum nitrite production) in this enrichment as did the soil AOB cultures.
As the serial transfer dilutes the microbial cells from previous cultures, the prevailing
community in the following enrichments corresponds to the fast growing microorganism, capable
of growing in the selective medium. So, only a portion of the AOB, with “fast” growth among other
AOB, are being transferred to the following enrichment, explaining the homogeneity between
communities from different plots in soil AOB cultures.
Root AOB cultures presented a culture without nitrite production activity, and one culture
with low activity, explaining the high heterogeneity observed (table. 3).
Comparing soil AOB community culture parameters, maximum nitrite concentration and
nitrite production rate, for the values obtained in the 1st and 2º enrichment, an increase of the
nitrite maximum concentration can be observed (table.2 and table. 3) by 7 fold, and an increase
in nitrite production rate by 5 fold was observed (table 2 and 3).
2nd enrichment Rhizospheric Soil Cultures Roots Cultures
Plot Plant
Lag
phase
(d)
Nitrite
production
rate (mg /L/d)
Maximum nitrite
Concentration
Lag
phase
(d)
Nitrite production
rate (mg/L/d)
Maximum nitrite
Concentration
(mg/L)
Plot C
1 5 1.55 23.01 2 2.39 27.98
2 7 2.09 27.52 - - -
3 7 2.16 26.81 30 0 0.21
Pot E
1 9 1.46 30.22 - - -
2 7 2.89 27.28 - - -
3 19 2.67 29.49 - - -
Plot F
1 - - - - - -
2 9 2.22 26.474 - - -
3 - - - 30 0.47 4.19
Average 9 2.15 27.26 18.50 1.19 14.09
Standard
deviation 4.28 0.49 2.16 14.52 2.21 12.91
16 Nitrification Control. How do the Natural ecosystem do it?

Table. 4 3rd enrichment nitrite production parameters for the Rhizospheric Soil AOB community cultures and root surface AOB community culture of Cistus ladanifer from non-fertilized soils without N addition: Plot C, E and F. Parameters include lag phase, expressed by day, nitrite production Rate expressed by mg nitrite/L/d and maximum nitrite concentration expressed as mg/L. Plant 1, 2, 3 are field replicates from which the samples were collected.
Master in Applied Microbiology 2012-2013
Master thesis Catarina Gouveia
Given the highest number of active cultures from rhizospheric soil (7 cultures) and root
suface (2 cultures) (table. 1 in annex), it is though that the AOB community is more spread in
rhizospheric soil and more disperse in root surface.
To confirmed these results, and confirmed that the nitrite is being produced by AOB and
not by other bacteria another enrichment was implemented.
From the 2nd enrichment, positive cultures with nitrite production were transferred, 7 for
soil AOB cultures and 2 for roots AOB cultures (table.1 in annex).
Observing the nitrite production curves for root and soil AOB cultures (fig. 4 c and f), both
profiles seem similar though a high heterogeneity can be observed for soil AOB cultures.
Concerning maximum nitrite concentration the values are similar for root AOB cultures
(28.28 mg/L) and soil AOB cultures (27.95 mg/L) (table. 4). Nitrite production rate is higher for
root AOB cultures (2.37 mg/L/d), compared to soil AOB cultures (2.13 mg/L/d) (table.4).
Since both parameters are similar for root and soil AOB communities, the assessment of
AOB preferential environmental niche was based on the number of active cultures from each
niche. As it was mentioned before AOB community in rhizospheric soil is thought to be more
spread than in root surface, where could be and more disperse. So, what differs between niches
is the community abundance, being AOB communities more abundant in rhizospheric soil than
root surface
Comparing 2nd and 3rd enrichment root AOB community it is possible to detect the
differences in the analysed parameters (table 2 and 3). Nitrite production rate and maximum nitrite
production was lower in the 3rd enrichment.
Soil AOB community presented similar results for nitrite production rate and maximum
nitrite concentration in both enrichments. As the nitrite production dynamics were constant
between enrichments, soil AOB cultures appeared to be free of contaminants.
3rd Rhizospheric Soil AOB Cultures Roots AOB Cultures
Plot Plant
Lag
phase
(d)
Nitrite production
rate (mg/L/d)
Maximum nitrite
Concentration
(mg/L)
Lag
phase
(d)
Nitrite
production
rate (mg/L/d)
Maximum nitrite
Concentration
(mg/L)
Plot C
1 19 1.67 24.98 7 1.86 26.38
2 7 2.19 28.18 - - -
3 23 1.87 22.84 - - -
Pot E
1 7 2.39 32.79 - - -
2 7 2.39 29.68 - - -
3 7 2.03 28.04 - - -
Plot F
1 - - - - - -
2 7 2.36 32.18 - - -
3 - - - 9 2.89 29.53
average 11 2.13 28.38 8 2.37 27.95
Standard
deviation 6.41 0.26 3.34 1 0.51 1.58
17 Nitrification Control. How do the Natural ecosystem do it?

Master in Applied Microbiology 2012-2013
Master thesis Catarina Gouveia
Nitrite production by Archaea
As the nitrifying community composed by AOB, the presence and activity of AOA was
also assessed.To study of archaeal ammonia oxidizing activity, growth inhibiton of AOB was
necessary, since they can out-grow AOA. This was accomplished by adding antibiotics in the 3
enrichments preventing bacterial growth. Since the cellular targets for the antibiotics were
different and the antibiotic was changed in each enrichment, occurrence of resistant strains was
prevented.
AOA communities can only be analysed after the 3rd enrichment, since the 1st and 2nd
enrichment could have bacterial growth from resistant strains, or tolerant to the used antibiotic
CV 0.58 0.12 0.12 0.13 0.22 0.06
18 Nitrification Control. How do the Natural ecosystem do it?
a d
b e
Fig. 4. Nitrite production through incubation time for AOB cultures from Cistus ladanifer root surface and rhizospheric
soil. a) 1st enrichment soil AOB cultures; b) 2nd enrichment soil AOB cultures; c) 3rd enrichment soil AOB cultures; d)
1st enrichment root surface AOB cultures; e) 2nd enrichment root surface AOB cultures; f) 3rd enrichment root surface
AOB cultures. Cultures were incubated for 30 days at 28ºC. Standard deviation is represented as error bars
c f

Master in Applied Microbiology 2012-2013
Master thesis Catarina Gouveia
concentration. Concerning the number of active cultures in the 2rd enrichment, 2 for root
community and 2 for soil community were transferred to the 3rd.
Observing the culture’s nitrite production through incubation time (Fig. 5), only soil AOA
community culture presented nitrite production and accumulation.
A variation of nitrite concentration, with successive decrease and recovery can be
observed for root and soil AOA cultures, mainly after 30 days of incubation.
Decrease in nitrite concentration should have been prevented by growth inhibition of
nitrite consuming bacteria, or by the addition of sodium chlorate, a nitrite oxidation inhibitor (Belser
and Mays, 1980). Interesting Treusch et al. (2005) found a gene encoding a homologue of a
copperdependent nitrite reductase (NirK) in AOA. So some strains of AOA, like AOB may be able
to consume nitrite in anoxic conditions. The decrease in nitrite can occur due to
chemodenitrification, a nonenzymatically catalyzed reaction where nitrite self-decomposes in NO
(nitric oxide), NO2 (nitrogen dioxide), N2O (nitrous oxide) or N2 (dinitrogen) in acidic conditions
(Bock and Wagner, 2006; Cleemput and Samater, 1996). Since ammonia oxidation acidifies the
medium, chemodenitrification can explain the decrease in nitrite concentration.
Concerning nitrite production rate, due to the variation in nitrite concentration, it was not
possible to calculate nitrite production rate for root AOA cultures and soil AOA culture from plant
3, plot C. The observed maximum nitrite concentration (table. 5) were very low, compared to the
AOB communities (table. 4).
Though nitrite with a concentration above 0.1 mg/L can be considered nitrite production
by the cultures, active cultures were defined as cultures with nitrite accumulation through time of
incubation, therefore in the 3rd enrichment, only the AOA culture from soil was considered active
(fig.5). As the active culture was found to be in soil, AOA communities could be more abundant
and active in the rhizospheric soil. However archaeal 16S gene PCR amplification did not
confirmed the presence of archaea (fig. 6) in root or soil community culture, since positive control
has an amplicon with a molecular weight of 700 bp and the amplicons observed (fig.6 A and B)
have molecular weights between 300 bp and 500 bp.
19 Nitrification Control. How do the Natural ecosystem do it?
Fig. 5 Nitrite production Curves for the 3st enrichment culture of the Ammonia oxidizing archaea cultures from Cistus ladanifer: a)
rhizospheric soil; b) root surface
a b

Master in Applied Microbiology 2012-2013
Master thesis Catarina Gouveia
A higher archaea population abundance in root
surface was expected, since archaea and particularly,
Thaumarchaeota have been found to be more abundant in
the root surface (Simon et al. 2005), especially in consortia
with mycorrhiza (Timonen and Bomberg, 2009).
Ammonia oxidizing archaea cultivation is highly
difficult compared to Bacterial cultivation and although
enrichment of archaeal ammonia oxidizers from mesophilic
aquatic environments appears to be relatively easy the same
did not happen for AOA from terrestrial environments
(Prosser and Nicol, 2008). Other incubations conditions and
mediums must be developed.
3rd Rhizospheric Soil AOA Cultures Roots AOA Cultures
Plot Plant
Lag
phase
(d)
Nitrite
production
rate (mg/L/d)
Maximum nitrite
Concentration
(mg/L)
Lag
phase
(d)
Nitrite
production rate
(mg/L/d)
Maximum nitrite
Concentration
(mg/L)
Plot C
1 47 0.68 6.71 - - -
2 - - - 60 0 1.03
3 60 0 0.44 - - -
Pot E
1 - - - - - -
2 - - - - - -
3 - - - - - -
Plot F
1 - - - - - -
2 - - - - - -
3 - - - 60 0 1.45
Average 53.50 0.34 3.58 60.00 0 1,24
Standard
deviation 6.50 0.34 3.14 0 0 0.21
CV 0.12 1 0.88 0 - 0.17
Table. 5 3rd enrichment nitrite production parameters for the Rhizospheric Soil AOA community cultures and root surface AOA community culture of Cistus ladanifer from non-fertilized soils without N addition: Plot C, E and F. Parameters include lag phase, expressed by day, nitrite production Rate expressed by mg nitrite/L/d and maximum nitrite concentration expressed as mg/L. Plant 1, 2, 3 are field replicates from which the samples were collected.
Fig. 6 Archaeal 16S gene amplification results. A)
Plant 1 plot C Rhizospheric Soil AOA culture; B)
Plant 3 plot C Rhizospheric Soil AOA culture; C)
Plant 3 plot F Root AOA culture; D) Plant 2 plot C
Root AOA culture; E) positive control,
Halobacterium salinarium l; F) negative control.
A B C D E F
600 bp 500 bp
300 bp
20 Nitrification Control. How do the Natural ecosystem do it?

Master in Applied Microbiology 2012-2013
Master thesis Catarina Gouveia
How would the AOB population respond to an increase in N input?
Once the preferential niche for AOB and AOA was defined it was possible to select the
samples to be used for the second task. Rhizospheric soil, having the highest ammonia oxidizing
activity, should be used as inoculum to decrease the possibility of having false-negative results.
Ammonia oxidizing bacteria activity from fertilized and non-fertilized soil
In the 1st task, “Where does the ammonia oxidizing community prosper?” a heterogeneity
between the plant’s rhizosphere communities from the same plot and between plots of the same
treatment was observed. So to have a higher representation of the nitrifying community 3 different
communities were combined. Although the control plots (C, E and F) have different activity
profiles, they represent the natural field heterogeneity.
In the 1st enrichment the 80A and 40A AOB cultures presented the highest maximum
nitrite concentration (30.7 and 30.1 mg/L, respectively), the highest nitrite production rate (3.32
and 2.88 mg/L/d) and ammonia consumption (91.1% and 92.6%) (fig.7 a, b and c). The 40AN
AOB cultures had the lowest values for maximum nitrite concentration (19.83 mg/L) and nitrite
production rate (1.68 mg/L), ammonia consumption is higher than for control AOB cultures with
85.7% of consumption (fig.7 a, b and c). Control AOB cultures have a maximum nitrite
concentration of 22.27 mg/L, a nitrite production rate of 1.97 mg/L/d and the lowest ammonia
consumption with 72.5% (fig.7 a, b and c). No significant differences were observed parameters
mentioned above, between the communities from the control soil and communities from altered
soils (ANOVA, CI of 0.95 or 0.9) (table. 5 in annex). Concerning lag phase, control AOB cultures
had the highest lag phase with 16.7 d. 40A, 40AN and 80AN AOB cultures had similar lag phases
with 8.3, 7.7 and 7.7 d respectively. A significant difference can be observed for lag phase with
CI of 0.9 (Kruskal-Wallis, p=0.061). Regarding nitritation yield or nitrite production yield, 80 AN
AOB culture had the highest yield (53.7 %), followed by the control AOB cultures (49.1 %), 40A
AOB cultures (46.6%) and 40 AN AOB cultures had the lowest yield (39.7 %) (fig.7 d). No
significant differences were found for nitrite production yield (ANOVA, CI of 0.95, p=0.9) (table. 5
in annex).
Observing the several studied parameters (fig.7 a, b, c, d), there appears to be a tendency
for the control and 40AN AOB cultures to have a lower ammonia oxidation activity than 80 AN
and 40A AOB cultures, though significant differences between control and altered soils AOB
cultures weren’t found. However, as explained in the 1st task, nitrite produced by AOB cultures in
the 1st enrichment may not be resultant of ammonia oxidation, as the soil inoculum can have
enough organic matter to allow the growth of nitrite-producing heterotrophic bacteria.
Confirmation of AOB presence in the 1st enrichment cultures was done by amoA gene
amplification. No amplicons were attained with amoA amplification (data not shown).
Amplification of the 16S gene was also performed, with positive results for all the cultures (data
not shown).
21 Nitrification Control. How do the Natural ecosystem do it?
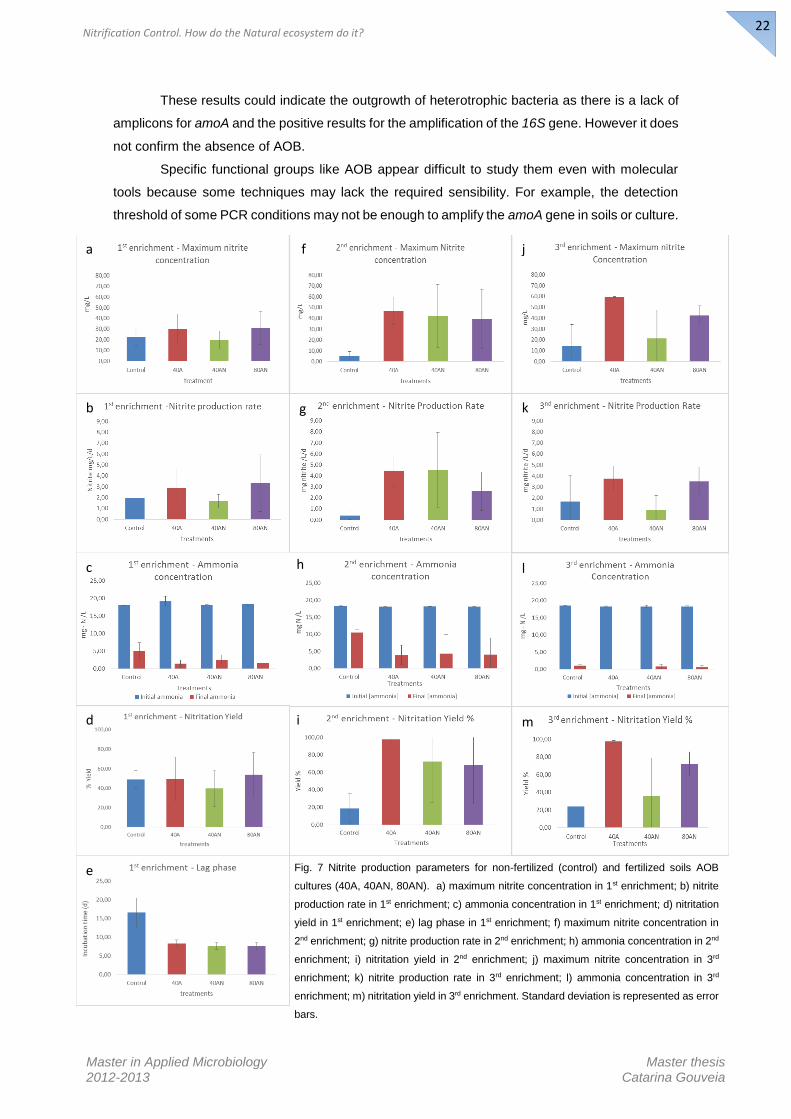
Master in Applied Microbiology 2012-2013
Master thesis Catarina Gouveia
These results could indicate the outgrowth of heterotrophic bacteria as there is a lack of
amplicons for amoA and the positive results for the amplification of the 16S gene. However it does
not confirm the absence of AOB.
Specific functional groups like AOB appear difficult to study them even with molecular
tools because some techniques may lack the required sensibility. For example, the detection
threshold of some PCR conditions may not be enough to amplify the amoA gene in soils or culture.
22 Nitrification Control. How do the Natural ecosystem do it?
Fig. 7 Nitrite production parameters for non-fertilized (control) and fertilized soils AOB
cultures (40A, 40AN, 80AN). a) maximum nitrite concentration in 1st enrichment; b) nitrite
production rate in 1st enrichment; c) ammonia concentration in 1st enrichment; d) nitritation
yield in 1st enrichment; e) lag phase in 1st enrichment; f) maximum nitrite concentration in
2nd enrichment; g) nitrite production rate in 2nd enrichment; h) ammonia concentration in 2nd
enrichment; i) nitritation yield in 2nd enrichment; j) maximum nitrite concentration in 3rd
enrichment; k) nitrite production rate in 3rd enrichment; l) ammonia concentration in 3rd
enrichment; m) nitritation yield in 3rd enrichment. Standard deviation is represented as error
bars.
d
e
a
b
c
f
g
h
i
j
k
l
m

Master in Applied Microbiology 2012-2013
Master thesis Catarina Gouveia
A nested PCR approach of the amoCAB sequence can increase the sensitivity in samples with
low abundances in AOB (Junier et al. 2010).
In the 2nd enrichment the 40A AOB cultures had the highest value for ammonia
consumption (78.2 %), maximum nitrite concentration (46.74 mg/L) and nitritation yield (97.7 %)
(fig.7f, g, h, i). Nitrite production rate was identical (4.5 mg/L/d) for 40A and 40AN AOB cultures.
40AN had a maximum nitrite concentration of 42.3 mg/L and a nitritation yield of 72.3 %, higher
than 80AN AOB culture with a maximum nitrite concentration of 39.5 mg/L and nitrite production
yield of 68.6 %, though ammonia consumption was higher for 80AN AOB culture (77.9 %) than
for 40AN culture (76.5%) (fig.7 f, g, h, i). 80 AN also had a nitrite production rate lower than 40A
and 40AN (2.6 mg/L/d). The control AOB cultures had the lowest values for all of the studied
parameters (fig.13). No significant differences between treatments were found (Kruskal-wallis and
ANOVA CI of 0.95, table. 5 in annex).
The 40A AOB culture was more homogeneous, having less variance in the studied
parameters with a lower coefficient of variation (CV) than the 40AN and 80AN AOB cultures. Both
cultures present very high CV for the studied parameters (table. 4 in annex).
In the second enrichment there is a difference between the control AOB culture and the
AOB from soils with different N-addition treatments. The nitrite maximum concentration, yield,
ammonia consumption and nitrite production rate are higher in the 40A, 40AN and 80AN AOB
cultures (fig.7 f, g, h, i). However the differences are not significant, probably due to the samples
high heterogeneity.
From the 1st to the 2nd enrichment it is possible to observe a decrease of the maximum
nitrite concentration, nitrite production rate, ammonia consumption (42.47%) and nitritation yield
(18.83%) in the control culture. If in the 1st enrichment nitrite production was mostly done by
heterotrophic bacteria then it could be possible to explain the decrease in activity in the 2nd
enrichment. By transferring and diluting organic matter, nutrients and bacterial cells in the culture
the conditions are better for AOB activity than for heterotrophic bacteria, so activity decreases.
Amplification of amoA can be seen in plot A from 80AN AOB cultures (fig. 8 a), light bands
can be observed for plots M from 80AN AOB cultures, for plot G from 40A AOB cultures and for
plot I and K from 40AN AOB cultures. Amplicons have a molecular weight of around 500 bp,
identical to the positive control.
Though positive amplification of amoA gene in the 1st enrichment was not observed,
amoA amplification occur in the 2nd serial enrichment, confirming the presence of AOB and
indicating cell growth of AOB in the cultures.
23 Nitrification Control. How do the Natural ecosystem do it?

Master in Applied Microbiology 2012-2013
Master thesis Catarina Gouveia
In the 3rd enrichment different nitrite production curves profiles (fig. 9) can be observed,
suggesting different ammonia oxidation activities in the control, 40A, 40AN and 80AN AOB
cultures. Concerning variability, AOB cultures from the 40A plot seem less heterogeneous, while
the control and 40AN AOB cultures appear to have high variability. The number of “active”
cultures, with nitrite production, could explain the variability since the 40A and 80AN AOB cultures
had 3 active cultures (replicates), while the control and 40AN AOB cultures had 1 active culture
each.
Regarding the maximum nitrite concentration in each treatment, (fig.7, j) the lowest
concentration seems to be produced by the control AOB cultures (14.3 mg/L), followed by the
40AN and 80AN AOB cultures (21.2 and 42.3 mg/L, respectively). 40A treatment has the highest
maximum nitrite concentration (59.3 mg/L). Significant differences for maximum nitrite
concentrations between AOB cultures were found with a CI of 0.9 (Kruskal-Wallis, p=0.063)
(table. 5 in annex). Concerning variability in maximum nitrite concentration, the control and 40AN
AOB cultures had the highest variation (CV of 138.7 and 123.1). High variability was expected,
since both cultures had one active culture in the total of 3, high deviation is expected.
Nitrite production (nitritation) yield, nitrite production rate and ammonia consumption
were higher in 40A AOB cultures (97.5%, 3.8 mg/L/d and 100%, repectively), followed by 80AN
AOB cultures (72.1 % of yield, 3.5 mg/L/d of rate and 96.2% of ammonia consumption) (fig. 7 k,
l). The control AOB cultures had the lowest maximum nitrite concentration (14.3 mg/L), nitrite
production yield (24.1%) and ammonia consumption (94.3%), while 40AN AOB cultures had the
lowest nitrite production rate (0.9 mg/L/d) (fig. 7 j, k, l, m). No significant differences were found
for nitrite production rate, and ammonia concentration decrease (Kruskal-Wallis, CI of 0.95)
(table. 5 in annex). Significant differences were found for nitrite production yield with a CI of 0.9
(Kruskal-Wallis, p=0.09) (Table. 5 in annex).
24 Nitrification Control. How do the Natural ecosystem do it?
Fig. 8 amoA gene amplification for the a) 2nd enrichment of AOB cultures; b) 3rd enrichment AOB
community cultures. Control AOB communities: F, E, C; 40A treatment: H, L, G; 40AN treatment: K, I, B;
80AN treatment: N, M, A. Samples outlined by green had positive amplification for amoA.
500
F E C H L G K I B N M A + -
Control 40A 40AN 80AN
500
a)
b)

Master in Applied Microbiology 2012-2013
Master thesis Catarina Gouveia
Concerning variability, the control and 40AN AOB cultures had the highest CV for the
studied parameters (table. 4 in annex), though for ammonia consumption, variability was low.
As the 3rd enrichment should have growth of AOB without the interference of heterotrophic
bacteria growth, AOB culture activity for the treatments should present the effect of N-addition in
the AOB. However the presence of heterotrophic growth should not be disregarded. The decrease
in ammonia concentration in control and 40AN AOB cultures was similar to the decrease in
ammonia concentration for 40A and 80AN AOB cultures, though nitrite production (rate and
maximum concentration) is different. This observation can be explained by growth of
microorganism other than AOB or by ammonia volatilization, though AOB growth was attained in
a closed system with the possible minimal gas exchange.
Presence of AOB was confirmed by amplification of the amoA gene (fig.8 b). Amplicons
with the same molecular weight as the positive control were seen for plot C from control AOB
cultures, for plots H, L and G from 40A AOB cultures, for plot I from 40A AOB cultures and for
plots M and A from 80AN AOB cultures.
Corresponding amoA amplification and AOB ammonia oxidation activity, it is possible to
observe that cultures with nitrite production and accumulation through time also had a positive
amoA amplification, e.g., in control AOB cultures, plot C had active AOB (fig.9 a) and AOB
presence was confirmed (fig.8 b), while control AOB cultures from plot F and E did not had nitrite
production (fig.9 a) and AOB was not detected by amoA amplification (fig.8 b). This
correspondence between ammonia oxidation activity and presence of amoA was also observed
for 40A, 40AN and 80AN AOB cultures.
Considering all the parameters, and confirmation of AOB presence by amoA amplification
(fig.8 b), it is possible to hypnotize an alteration in the AOB community’s ammonia oxidation
activity in response to the N-addition, though no significant differences between treatments were
found, given the high heterogeneity. The highest ammonia oxidation activity was found in the
40AN AOB cultures and use of ammonia (decrease in ammonia) also appears to be induced in
these cultures. 80AN AOB cultures also had a high ammonia oxidation activity, similar, but lower
than the activity found for 40A AOB cultures. The control and 40AN AOB cultures had similar
activities, as 40A AOB cultures had a high maximum nitrite concentration and yield and the control
AOB cultures have a higher nitrite production rate. Considering just the nitrite production rate,
control AOB cultures can be considered more active than 40A treatment AOB cultures.
Since the same amount of ammonia, but not the same form, is being added to the soils
from 40A and 80AN treatments it could explain the similar ammonia oxidation activity for 40A and
80AN AOB cultures. 40A and 80AN treatments do differ regarding the variability, which could be
an effect of the type of ammonia compound, though more studies are needed to study the effects
of different ammonia compounds in AOB activity. Concerning the effects of N-addition in different
forms and quantities of ammonia on AOB community structure, TGGE studies performed in scope
of the SERN (Spheres of Ecosystem Response to Nitrogen (SERN): A case study in a
Mediterranean-type ecosystem in southern Portugal) project (PTDC / BIA-BEC / 099323 / 2008),
suggested that the community structure changes more according with the quantity of N and not
25 Nitrification Control. How do the Natural ecosystem do it?
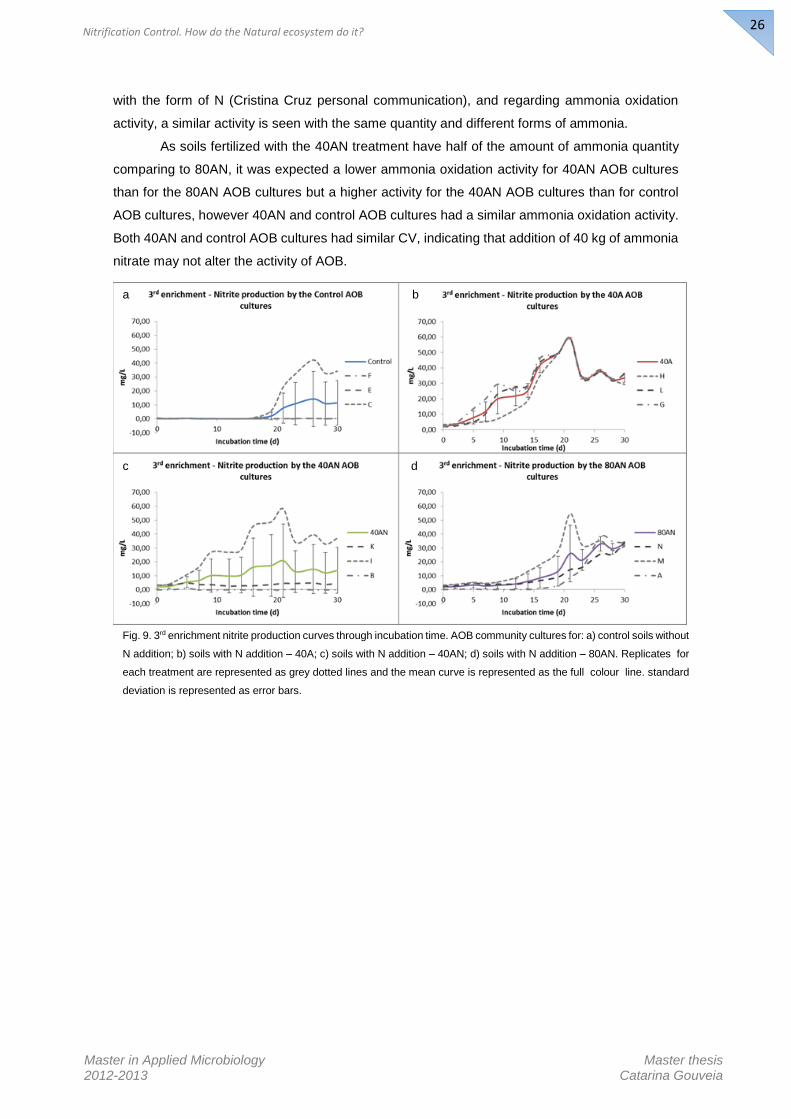
Master in Applied Microbiology 2012-2013
Master thesis Catarina Gouveia
with the form of N (Cristina Cruz personal communication), and regarding ammonia oxidation
activity, a similar activity is seen with the same quantity and different forms of ammonia.
As soils fertilized with the 40AN treatment have half of the amount of ammonia quantity
comparing to 80AN, it was expected a lower ammonia oxidation activity for 40AN AOB cultures
than for the 80AN AOB cultures but a higher activity for the 40AN AOB cultures than for control
AOB cultures, however 40AN and control AOB cultures had a similar ammonia oxidation activity.
Both 40AN and control AOB cultures had similar CV, indicating that addition of 40 kg of ammonia
nitrate may not alter the activity of AOB.
26 Nitrification Control. How do the Natural ecosystem do it?
Fig. 9. 3rd enrichment nitrite production curves through incubation time. AOB community cultures for: a) control soils without
N addition; b) soils with N addition – 40A; c) soils with N addition – 40AN; d) soils with N addition – 80AN. Replicates for
each treatment are represented as grey dotted lines and the mean curve is represented as the full colour line. standard
deviation is represented as error bars.
a b
c d

Master in Applied Microbiology 2012-2013
Master thesis Catarina Gouveia
AOB community structure assessed by PCR-RFLP
Ammonia oxidation activity among AOB cultures from non-fertilized and fertilized soils
were different, as well as the susceptibility to ammonia. Therefore is was of interest to understand
if these differences would also correspond to different community structures.
To assess the community structure possible changes, PCR-RFLP was performed. The
amoA gene was amplified from DNA extracted from the 3rd enrichment AOB cultures, with primers
amoA-1F and amoA-2R. The PCR products were used for restriction with 2 different enzymes,
HaeIII and HinfI. The results for the PCR-RFLP are shown in fig.10. Both HaeIII and HinfI
restriction enzymes originated 2 distinct patterns.
HaeIII hydrolysis of amoA amplified fragment presented 2 bands with a molecular weight
of 167, 124 or 102 bp, while HinfI restriction had bands with a molecular weight of 537 and 494
bp. Four different patterns for HAE III and 4 patterns for HinfI were obtained (table.6).
C H L G K N A C H L G K N A
Hae III Hinf I
Fig. 10 amoA PCR-RFLP profiles for the 3rd enrichment AOB community cultures. Control AOB communities: C; 40A
treatment: H, L, G; 40AN treatment: I; 80AN treatment: N, A. HaeIII and HinfI were used as restriction enzymes.
27 Nitrification Control. How do the Natural ecosystem do it?
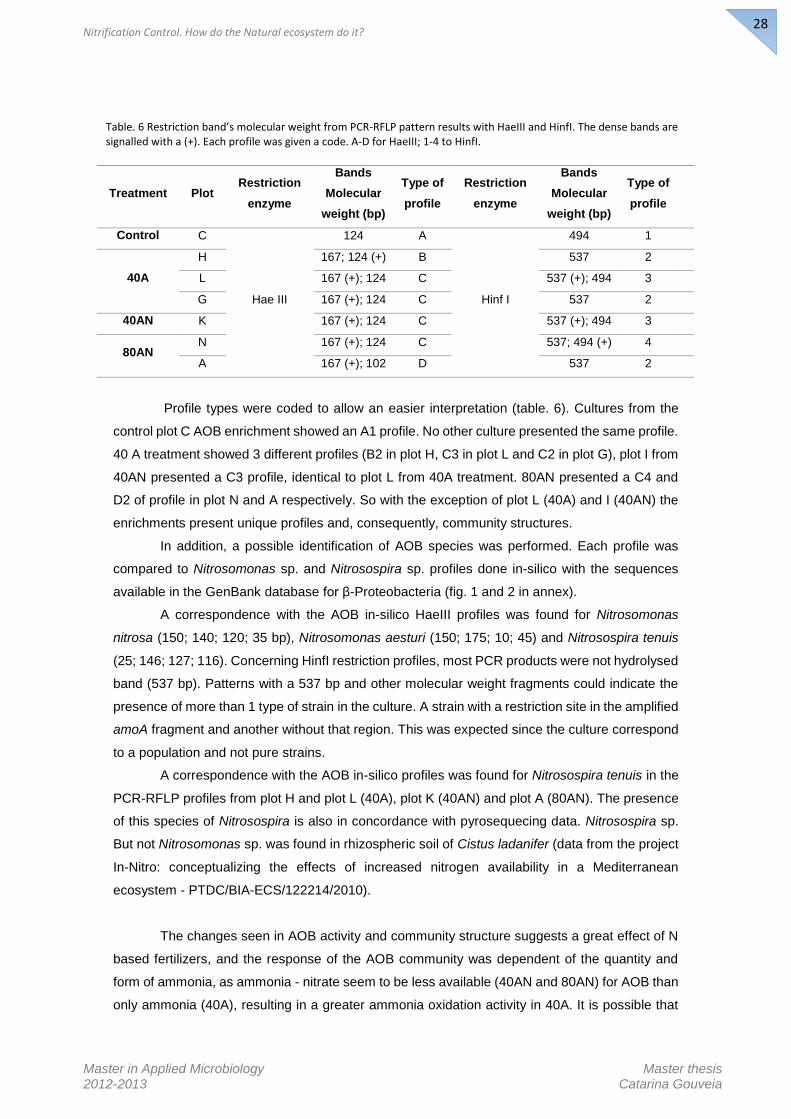
Master in Applied Microbiology 2012-2013
Master thesis Catarina Gouveia
Profile types were coded to allow an easier interpretation (table. 6). Cultures from the
control plot C AOB enrichment showed an A1 profile. No other culture presented the same profile.
40 A treatment showed 3 different profiles (B2 in plot H, C3 in plot L and C2 in plot G), plot I from
40AN presented a C3 profile, identical to plot L from 40A treatment. 80AN presented a C4 and
D2 of profile in plot N and A respectively. So with the exception of plot L (40A) and I (40AN) the
enrichments present unique profiles and, consequently, community structures.
In addition, a possible identification of AOB species was performed. Each profile was
compared to Nitrosomonas sp. and Nitrosospira sp. profiles done in-silico with the sequences
available in the GenBank database for β-Proteobacteria (fig. 1 and 2 in annex).
A correspondence with the AOB in-silico HaeIII profiles was found for Nitrosomonas
nitrosa (150; 140; 120; 35 bp), Nitrosomonas aesturi (150; 175; 10; 45) and Nitrosospira tenuis
(25; 146; 127; 116). Concerning HinfI restriction profiles, most PCR products were not hydrolysed
band (537 bp). Patterns with a 537 bp and other molecular weight fragments could indicate the
presence of more than 1 type of strain in the culture. A strain with a restriction site in the amplified
amoA fragment and another without that region. This was expected since the culture correspond
to a population and not pure strains.
A correspondence with the AOB in-silico profiles was found for Nitrosospira tenuis in the
PCR-RFLP profiles from plot H and plot L (40A), plot K (40AN) and plot A (80AN). The presence
of this species of Nitrosospira is also in concordance with pyrosequecing data. Nitrosospira sp.
But not Nitrosomonas sp. was found in rhizospheric soil of Cistus ladanifer (data from the project
In-Nitro: conceptualizing the effects of increased nitrogen availability in a Mediterranean
ecosystem - PTDC/BIA-ECS/122214/2010).
The changes seen in AOB activity and community structure suggests a great effect of N
based fertilizers, and the response of the AOB community was dependent of the quantity and
form of ammonia, as ammonia - nitrate seem to be less available (40AN and 80AN) for AOB than
only ammonia (40A), resulting in a greater ammonia oxidation activity in 40A. It is possible that
Treatment Plot Restriction
enzyme
Bands
Molecular
weight (bp)
Type of
profile
Restriction
enzyme
Bands
Molecular
weight (bp)
Type of
profile
Control C
Hae III
124 A
Hinf I
494 1
40A
H 167; 124 (+) B 537 2
L 167 (+); 124 C 537 (+); 494 3
G 167 (+); 124 C 537 2
40AN K 167 (+); 124 C 537 (+); 494 3
80AN N 167 (+); 124 C 537; 494 (+) 4
A 167 (+); 102 D 537 2
Table. 6 Restriction band’s molecular weight from PCR-RFLP pattern results with HaeIII and HinfI. The dense bands are signalled with a (+). Each profile was given a code. A-D for HaeIII; 1-4 to HinfI.
28 Nitrification Control. How do the Natural ecosystem do it?

Master in Applied Microbiology 2012-2013
Master thesis Catarina Gouveia
the apparent lower activity of 40AN AOB community can be due to the quick Ammonia-Nitrate
use by plants. Because the fertilization causes an increase in plant growth (Dias et al. 2011) AOB
communities in this treatment can have less substrate available than in control without N addition
since plants may have a higher demand for nutrients, and AOB, being bad competitors for
ammonium, may have less substrate available than in control without N addition (Verhagen et al.
1994). As, since 2007 N addition has been done AOB communities in 40AN could have been
altered to have less activity, less nutrient demand, and with a higher ammonia affinity.
Contrary to that happens in 40AN treatments, 40A treatments shows less plant coverage,
having more bare soil (Dias et al. 2011), therefore the AOB communities have more available
ammonia than communities in soils with a higher plant coverage. However AOB may not be
abundant in bare soil. Delgado-Baquerizo et al. (2013) have shown that, in Mediterranean
ecosystems, with limiting nutrients, AOB amoA genes are more abundant in rhizospheric soil
under the influence of Stipa tenacissima, while AOA amoA genes are more abundant in bare soil.
However in Mediterranean environments with N addition an increase in plant growth can lead to
a stronger competition for ammonia, inhibiting an ammonia oxidation increase.
Many studies show that AOB growth and activity normally benefits from an increase in
nitrogen addition to the soil (He et al. 2012; Allison et al. 2008; Mendum et al. 1999).
Ammonia oxidizing archaea activity in fertilized and non-fertilized soils
As it was mentioned in the 1st task, AOA activity analysis can only be done in the 3rd
enrichment to ensure the absence of AOB presence and activity. Since confirmation of presence
and activity of AOA was not possible, the cultures are referred to “AOA” as possible AOA culture.
Concerning the nitrite production curves, a similar profiles could be observed (Fig. 11).
The “AOA” cultures presented 2 exponential phases with a decrease in the nitrite concentration
between the phases. Since there is not a constant nitrite production through the incubation time,
nitrite production rate was not possible to calculate. Control and 40A “AOA” cultures appear to
have a nitrite concentration peak at 30 days and 50 days of incubation, while 40A and 80AN
“AOA” cultures have a nitrite concentration peak at 35 and 52 days of incubation.
Regarding maximum nitrite production and nitritation (nitrite production) yield (fig.12)
40AN “AOA” cultures had higher values (0.96 mg/L and 1.7%, respectively), followed by control
“AOA” cultures (0.73 mg/L and 1.2%), 80AN “AOA” cultures (0.32 mg/L and 0.6%), 40A “AOA”
cultures had the lowest maximum nitrite production and nitritation yield (0.18 mg/L and 0.3%)
(fig.19). No significant differences were found between treatments for maximum nitrite
concentration, nitrite production yield and ammonia decrease (Kruskal-Wallis, CI=0.95) (table. 5
in annex).
29 Nitrification Control. How do the Natural ecosystem do it?
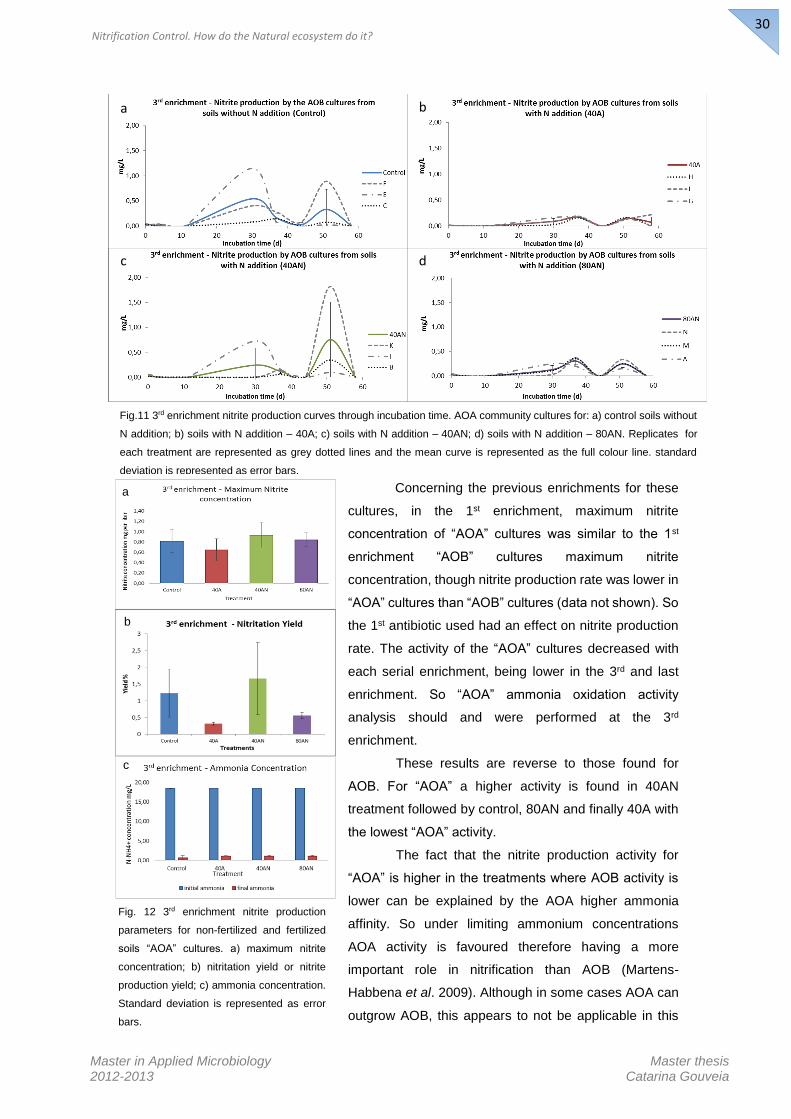
Master in Applied Microbiology 2012-2013
Master thesis Catarina Gouveia
Concerning the previous enrichments for these
cultures, in the 1st enrichment, maximum nitrite
concentration of “AOA” cultures was similar to the 1st
enrichment “AOB” cultures maximum nitrite
concentration, though nitrite production rate was lower in
“AOA” cultures than “AOB” cultures (data not shown). So
the 1st antibiotic used had an effect on nitrite production
rate. The activity of the “AOA” cultures decreased with
each serial enrichment, being lower in the 3rd and last
enrichment. So “AOA” ammonia oxidation activity
analysis should and were performed at the 3rd
enrichment.
These results are reverse to those found for
AOB. For “AOA” a higher activity is found in 40AN
treatment followed by control, 80AN and finally 40A with
the lowest “AOA” activity.
The fact that the nitrite production activity for
“AOA” is higher in the treatments where AOB activity is
lower can be explained by the AOA higher ammonia
affinity. So under limiting ammonium concentrations
AOA activity is favoured therefore having a more
important role in nitrification than AOB (Martens-
Habbena et al. 2009). Although in some cases AOA can
outgrow AOB, this appears to not be applicable in this
30 Nitrification Control. How do the Natural ecosystem do it?
Fig. 12 3rd enrichment nitrite production
parameters for non-fertilized and fertilized
soils “AOA” cultures. a) maximum nitrite
concentration; b) nitritation yield or nitrite
production yield; c) ammonia concentration.
Standard deviation is represented as error
bars.
a
b
c
Fig.11 3rd enrichment nitrite production curves through incubation time. AOA community cultures for: a) control soils without
N addition; b) soils with N addition – 40A; c) soils with N addition – 40AN; d) soils with N addition – 80AN. Replicates for
each treatment are represented as grey dotted lines and the mean curve is represented as the full colour line. standard
deviation is represented as error bars.
a b
c d

Master in Applied Microbiology 2012-2013
Master thesis Catarina Gouveia
case study. Although nitrite production is higher in control and 40AN treatment, the AOB activity
in these treatment is still higher than “AOA”.
Although AOB nitrite production is higher in 40A and 80AN treatments and “AOA” nitrite
production is higher in control and 40AN “AOA” treatments, the ammonia oxidation and nitrite
production attributed to AOB is higher than the nitrite production attributed to AOA. Thus, in soil
and under these incubation conditions, both AOM coexist in the environment, being the observed
differences due to AOA slower growth rate (Prosser and Nicol, 2008). The lower ammonia
oxidation, and consequently, nitrite production in the enrichment cultures can, then be explained
by the lower number of cells in the soil population.
Additionally, considering that AOA uses, preferentially, mineralized ammonia (urea) and
organic nitrogen source (amino acids) (He et al. 2012; Tourna et al. 2011; Hatzenpichler, 2012),
then growth and activity in a medium with ammonia as nitrogen and energy source may not be
the best to ensure a high nitrite production by AOA. So optimal conditions for these cultures
should be studied to understand which ammonia oxidizing group of organisms has the greatest
importance in the control and 40AN treatment.
The presence of Archaea was monitored in the 3 enrichments, amoA archaeal gene
presence was confirmed for cultures with confirmed archaea presence.
In the 1st enrichment, amplification of the 16S gene was negative (data not shown). In the
2nd enrichment bands of the same molecular weight as the positive control were observed in the
M, B, and K plots (80AN and 40AN treatments) (data not shown), amplicons of other molecular
weights were also observed.
In the amplification results of the archaeal 16S gene for the 3rd enrichments (fig 13),
amplicons with several molecular weights can be observed. For the control “AOA” cultures, plots
F and E, bands with around 200 bp can be observed. For 40A “AOA” cultures, bands with around
600 bp can be observed in plots L and G. The plots K and I from 40AN “AOA” cultures present
bands with around 600 bp, 500 bp and 300 bp. 80AN “AOA” cultures had bands with around 800
bp, 600 bp and 1000 bp for plots N and M.
However most of those appears to be unspecific amplifications, since the molecular
weight of the amplicon doesn’t correspond to the positive control. The presence of amoA gene
was studied in the cultures with bands with a correct molecular weight (600 bp). No positive
amplification occur for the amoA gene (data not shown).
31 Nitrification Control. How do the Natural ecosystem do it?
Control 40A 40AN 80AN
Fig. 13 16S Archaeal gene
amplification for 3rd enrichment AOA
community cultures. Control AOB
communities: F, E, C; 40A treatment:
H, L, G; 40AN treatment: K, I, B; 80AN
treatment: N, M, A. Samples outlined
by green had positive amplification for
16S rRNA, red outline indicates non-
specific amplification
F
3rd enrichment
E C HC
LC
GC
KC
I B N M A +
600 bp
600 bp
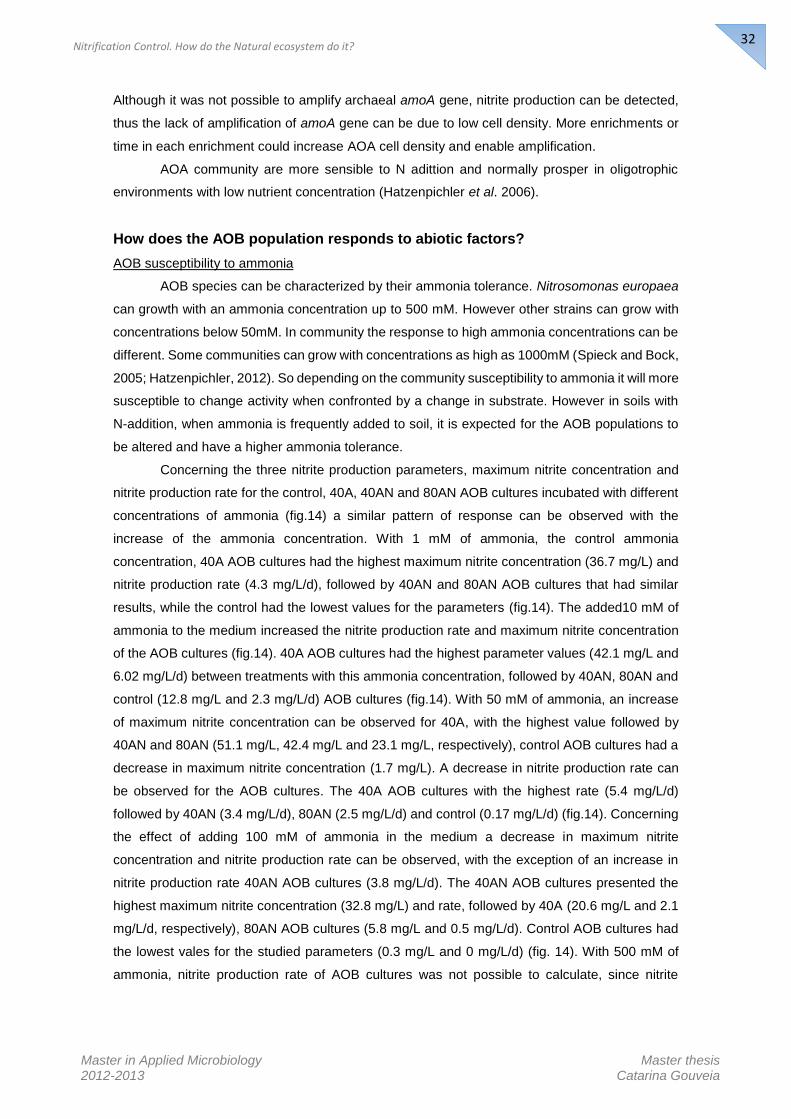
Master in Applied Microbiology 2012-2013
Master thesis Catarina Gouveia
Although it was not possible to amplify archaeal amoA gene, nitrite production can be detected,
thus the lack of amplification of amoA gene can be due to low cell density. More enrichments or
time in each enrichment could increase AOA cell density and enable amplification.
AOA community are more sensible to N adittion and normally prosper in oligotrophic
environments with low nutrient concentration (Hatzenpichler et al. 2006).
How does the AOB population responds to abiotic factors?
AOB susceptibility to ammonia
AOB species can be characterized by their ammonia tolerance. Nitrosomonas europaea
can growth with an ammonia concentration up to 500 mM. However other strains can grow with
concentrations below 50mM. In community the response to high ammonia concentrations can be
different. Some communities can grow with concentrations as high as 1000mM (Spieck and Bock,
2005; Hatzenpichler, 2012). So depending on the community susceptibility to ammonia it will more
susceptible to change activity when confronted by a change in substrate. However in soils with
N-addition, when ammonia is frequently added to soil, it is expected for the AOB populations to
be altered and have a higher ammonia tolerance.
Concerning the three nitrite production parameters, maximum nitrite concentration and
nitrite production rate for the control, 40A, 40AN and 80AN AOB cultures incubated with different
concentrations of ammonia (fig.14) a similar pattern of response can be observed with the
increase of the ammonia concentration. With 1 mM of ammonia, the control ammonia
concentration, 40A AOB cultures had the highest maximum nitrite concentration (36.7 mg/L) and
nitrite production rate (4.3 mg/L/d), followed by 40AN and 80AN AOB cultures that had similar
results, while the control had the lowest values for the parameters (fig.14). The added10 mM of
ammonia to the medium increased the nitrite production rate and maximum nitrite concentration
of the AOB cultures (fig.14). 40A AOB cultures had the highest parameter values (42.1 mg/L and
6.02 mg/L/d) between treatments with this ammonia concentration, followed by 40AN, 80AN and
control (12.8 mg/L and 2.3 mg/L/d) AOB cultures (fig.14). With 50 mM of ammonia, an increase
of maximum nitrite concentration can be observed for 40A, with the highest value followed by
40AN and 80AN (51.1 mg/L, 42.4 mg/L and 23.1 mg/L, respectively), control AOB cultures had a
decrease in maximum nitrite concentration (1.7 mg/L). A decrease in nitrite production rate can
be observed for the AOB cultures. The 40A AOB cultures with the highest rate (5.4 mg/L/d)
followed by 40AN (3.4 mg/L/d), 80AN (2.5 mg/L/d) and control (0.17 mg/L/d) (fig.14). Concerning
the effect of adding 100 mM of ammonia in the medium a decrease in maximum nitrite
concentration and nitrite production rate can be observed, with the exception of an increase in
nitrite production rate 40AN AOB cultures (3.8 mg/L/d). The 40AN AOB cultures presented the
highest maximum nitrite concentration (32.8 mg/L) and rate, followed by 40A (20.6 mg/L and 2.1
mg/L/d, respectively), 80AN AOB cultures (5.8 mg/L and 0.5 mg/L/d). Control AOB cultures had
the lowest vales for the studied parameters (0.3 mg/L and 0 mg/L/d) (fig. 14). With 500 mM of
ammonia, nitrite production rate of AOB cultures was not possible to calculate, since nitrite
32 Nitrification Control. How do the Natural ecosystem do it?

Master in Applied Microbiology 2012-2013
Master thesis Catarina Gouveia
accumulation through time did not occur. No significant difference was found between treatments
and ammonia concentration (2-way ANOVA, CI=0.95) (see table. 6 in annex).
Control AOB cultures had the highest maximum nitrite concentration and nitrite production
rate with 10 mM of ammonia,
indicating an optimal ammonia
concentration for ammonia
oxidation activity of 10 mM, having
an activity decrease with 50 mM.
The 40A, 40AN and 80AN
AOB cultures had the highest
maximum nitrite concentration with
50mM of ammonia and highest
nitrite production rate with 10 mM of
ammonia with 1 mM of ammonia.
40A and 80AN AOB cultures start to
have an ammonia oxidation activity
decrease with 100 mM of ammonia,
while 40AN AOB cultures had a
similar rate and maximum nitrite
concentration with 10 mM, 50 mM
and 100 mM, with and activity
decrease with 500 mM of ammonia.
So AOB cultures from soils
with different N-addition treatments
appear to have a distinct ammonia
tolerance. Control AOB cultures are
the most susceptible to ammonia,
being inhibit with 50mM of ammonia. 40A and 80AN treatments have higher tolerance, being
inhibit with 100mM of ammonia. 40AN treatment, though it has a lower activity at standard
conditions (1mM) than 40A and 80AN, it shows a higher ammonia tolerance, still having a high
activity at 100mM. More ammonia concentrations should be tested to fill the gap between 100mM
and 500mM and to know the inhibitory concentration of ammonia for the 40AN treatment.
AOB susceptibility to pH changes
Ammonia oxidation is considered to be optimal at neutral to slightly alkaline soil pH values
and the optimum pH for AOB cell growth being between 7.6–7.8 (Norton and Stark, 2011; Bock
and Wagner, 2006). However several nitrifiers have been found in environments with suboptimal
pH, either acidic or alkaline (Bock and Wagner, 2006), and are able to be active (are capable of
autotrophic nitrification) in soils with pH values from 3.0 to 10.0 (Norton and Stark, 2011). Still,
33 Nitrification Control. How do the Natural ecosystem do it?
Fig.14 Nitrite production parameters of the control, 40A, 40AN and 80AN
AOB cultures in relation with different ammonia concentration in the
medium(1 mM, 10 mM, 50 mM, 100 mM and 500 mM): a) nitrite production
rate; b) maximum nitrite concentration. Standard deviation is represented
as error bars.
a
b
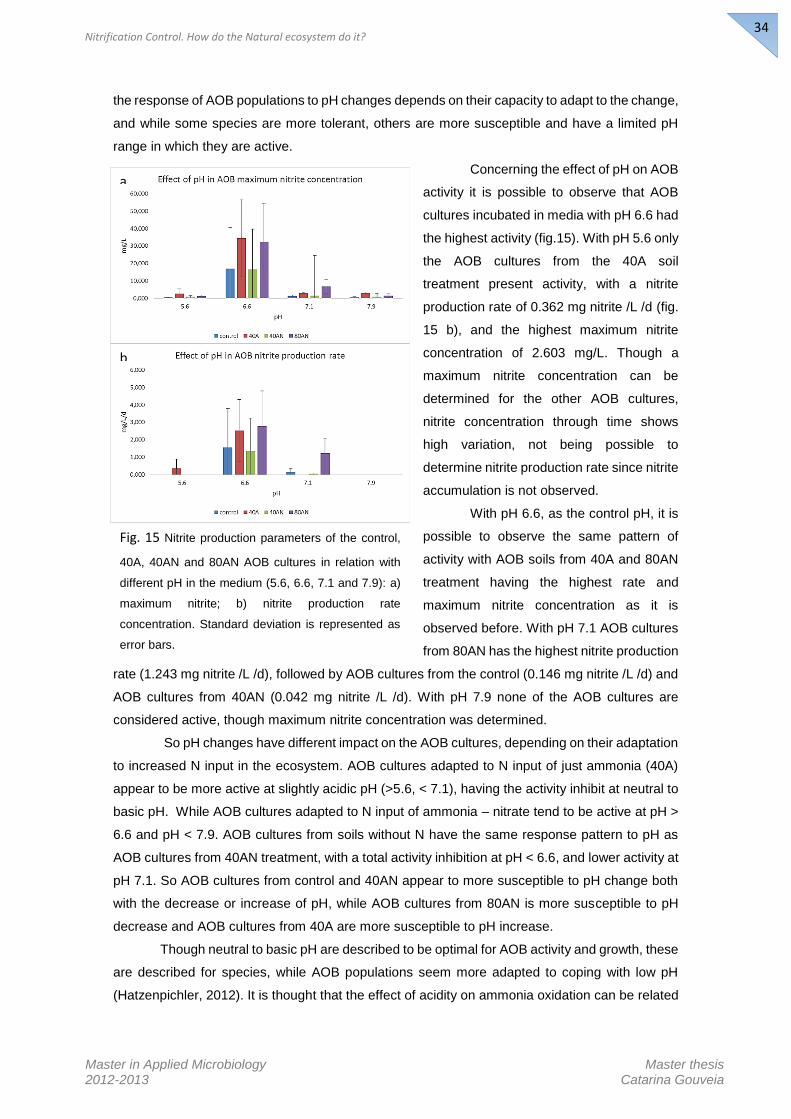
Master in Applied Microbiology 2012-2013
Master thesis Catarina Gouveia
the response of AOB populations to pH changes depends on their capacity to adapt to the change,
and while some species are more tolerant, others are more susceptible and have a limited pH
range in which they are active.
Concerning the effect of pH on AOB
activity it is possible to observe that AOB
cultures incubated in media with pH 6.6 had
the highest activity (fig.15). With pH 5.6 only
the AOB cultures from the 40A soil
treatment present activity, with a nitrite
production rate of 0.362 mg nitrite /L /d (fig.
15 b), and the highest maximum nitrite
concentration of 2.603 mg/L. Though a
maximum nitrite concentration can be
determined for the other AOB cultures,
nitrite concentration through time shows
high variation, not being possible to
determine nitrite production rate since nitrite
accumulation is not observed.
With pH 6.6, as the control pH, it is
possible to observe the same pattern of
activity with AOB soils from 40A and 80AN
treatment having the highest rate and
maximum nitrite concentration as it is
observed before. With pH 7.1 AOB cultures
from 80AN has the highest nitrite production
rate (1.243 mg nitrite /L /d), followed by AOB cultures from the control (0.146 mg nitrite /L /d) and
AOB cultures from 40AN (0.042 mg nitrite /L /d). With pH 7.9 none of the AOB cultures are
considered active, though maximum nitrite concentration was determined.
So pH changes have different impact on the AOB cultures, depending on their adaptation
to increased N input in the ecosystem. AOB cultures adapted to N input of just ammonia (40A)
appear to be more active at slightly acidic pH (>5.6, < 7.1), having the activity inhibit at neutral to
basic pH. While AOB cultures adapted to N input of ammonia – nitrate tend to be active at pH >
6.6 and pH < 7.9. AOB cultures from soils without N have the same response pattern to pH as
AOB cultures from 40AN treatment, with a total activity inhibition at pH < 6.6, and lower activity at
pH 7.1. So AOB cultures from control and 40AN appear to more susceptible to pH change both
with the decrease or increase of pH, while AOB cultures from 80AN is more susceptible to pH
decrease and AOB cultures from 40A are more susceptible to pH increase.
Though neutral to basic pH are described to be optimal for AOB activity and growth, these
are described for species, while AOB populations seem more adapted to coping with low pH
(Hatzenpichler, 2012). It is thought that the effect of acidity on ammonia oxidation can be related
a
b
Fig. 15 Nitrite production parameters of the control,
40A, 40AN and 80AN AOB cultures in relation with
different pH in the medium (5.6, 6.6, 7.1 and 7.9): a)
maximum nitrite; b) nitrite production rate
concentration. Standard deviation is represented as
error bars.
34 Nitrification Control. How do the Natural ecosystem do it?
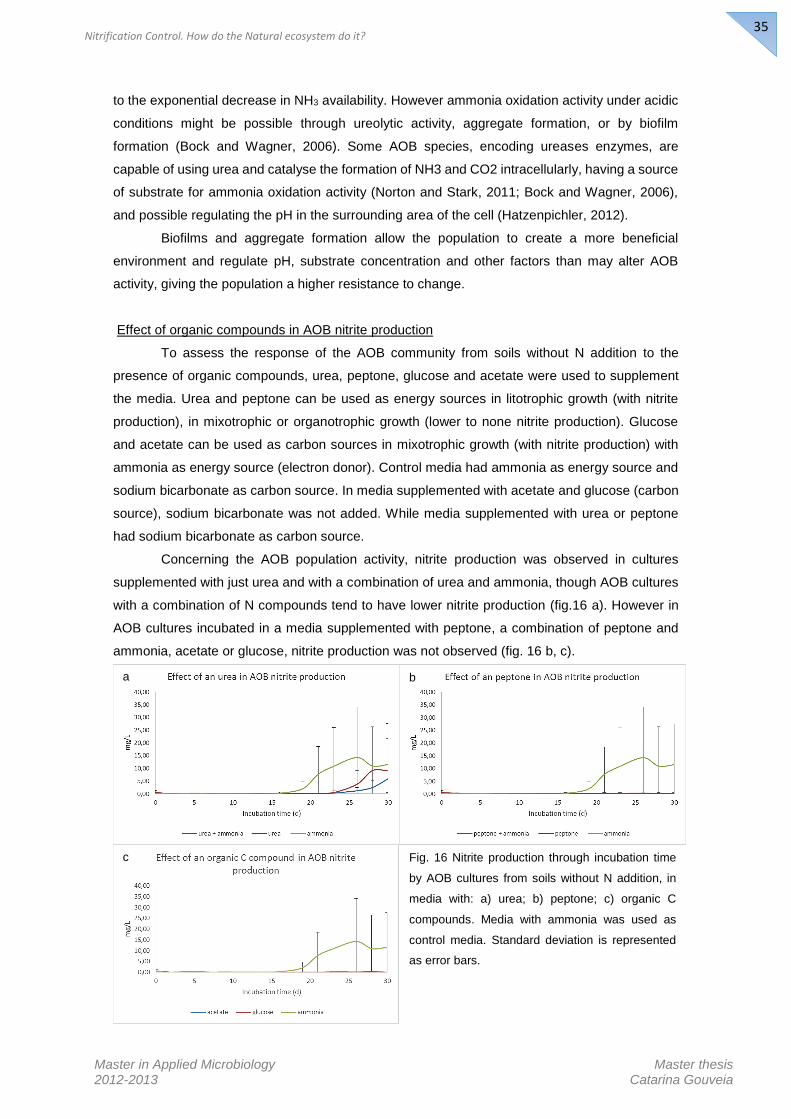
Master in Applied Microbiology 2012-2013
Master thesis Catarina Gouveia
to the exponential decrease in NH3 availability. However ammonia oxidation activity under acidic
conditions might be possible through ureolytic activity, aggregate formation, or by biofilm
formation (Bock and Wagner, 2006). Some AOB species, encoding ureases enzymes, are
capable of using urea and catalyse the formation of NH3 and CO2 intracellularly, having a source
of substrate for ammonia oxidation activity (Norton and Stark, 2011; Bock and Wagner, 2006),
and possible regulating the pH in the surrounding area of the cell (Hatzenpichler, 2012).
Biofilms and aggregate formation allow the population to create a more beneficial
environment and regulate pH, substrate concentration and other factors than may alter AOB
activity, giving the population a higher resistance to change.
Effect of organic compounds in AOB nitrite production
To assess the response of the AOB community from soils without N addition to the
presence of organic compounds, urea, peptone, glucose and acetate were used to supplement
the media. Urea and peptone can be used as energy sources in litotrophic growth (with nitrite
production), in mixotrophic or organotrophic growth (lower to none nitrite production). Glucose
and acetate can be used as carbon sources in mixotrophic growth (with nitrite production) with
ammonia as energy source (electron donor). Control media had ammonia as energy source and
sodium bicarbonate as carbon source. In media supplemented with acetate and glucose (carbon
source), sodium bicarbonate was not added. While media supplemented with urea or peptone
had sodium bicarbonate as carbon source.
Concerning the AOB population activity, nitrite production was observed in cultures
supplemented with just urea and with a combination of urea and ammonia, though AOB cultures
with a combination of N compounds tend to have lower nitrite production (fig.16 a). However in
AOB cultures incubated in a media supplemented with peptone, a combination of peptone and
ammonia, acetate or glucose, nitrite production was not observed (fig. 16 b, c).
Fig. 16 Nitrite production through incubation time
by AOB cultures from soils without N addition, in
media with: a) urea; b) peptone; c) organic C
compounds. Media with ammonia was used as
control media. Standard deviation is represented
as error bars.
a b
c
35 Nitrification Control. How do the Natural ecosystem do it?

Master in Applied Microbiology 2012-2013
Master thesis Catarina Gouveia
Regarding nitrite production rate, AOB cultures incubated with media supplemented with
just ammonia had similar rates as the AOB cultures incubated in control medium (1.68 and 1.69
mg nitrite /L /d), while in a media supplemented with both ammonia and urea the AOB nitrite
production rate was lower (1.17 mg nitrite /L /d) (Fig. 17 a). For AOB cultures incubated with
peptone, peptone with ammonia, acetate or glucose, nitrite production rate was low (0.02, 0.03,
0 and 0.01 mg nitrite /L /d) (fig. 17 b), therefore the cultures were considered non-active. Maximum
nitrite concentration was higher in the control AOB cultures (14.32 mg/L), followed by AOB
cultures in media supplemented with urea (9.2 mg/L), and AOB cultures in media with urea and
ammonia (5.95 mg/L). Though activities tend to be different according to the nitrogen compound,
no significant differences were found (Kruskal-Wallis, p of 0.95 table. 7 in annex). Amplification
of amoA was performed to confirm the presence of AOB, as addition of organic compounds will
increase the growth of heterotrophic bacteria than might still be in the inoculum. Positive
amplification for amoA was observed in the AOB cultures in media supplemented with just urea
and urea with ammonia (fig.18).
Considering the activity observed for AOB cultures, it is possible to say that the AOB
populations from soils without N addition are capable of using urea for litotrophic growth if
ammonia is not present, as it is described for some species of Nitrosomonas, as Nitrosomonas
ureae (Bock and Wagner, 2006). The use of urea is described as a source of ammonia, but not
as an energy source. Glutamine as source of ammonia for lithotrophic growth was also described
(Bock and Wagner, 2006), and though isolated aminoacids were not tested for their effect on AOB
Fig. 17 Effect of organic compounds in nitrite production parameters for AOB cultures from soils without N addition,
incubated in media with: a) effect of N organic compounds in maximum nitrite concentration; b) effect of N nitrite in
production rate; c) effect of C organic compounds in maximum nitrite concentration; d) effect of C organic
compounds in nitrite production rate Standard deviation is represented as error bars.
a b
c d
36 Nitrification Control. How do the Natural ecosystem do it?
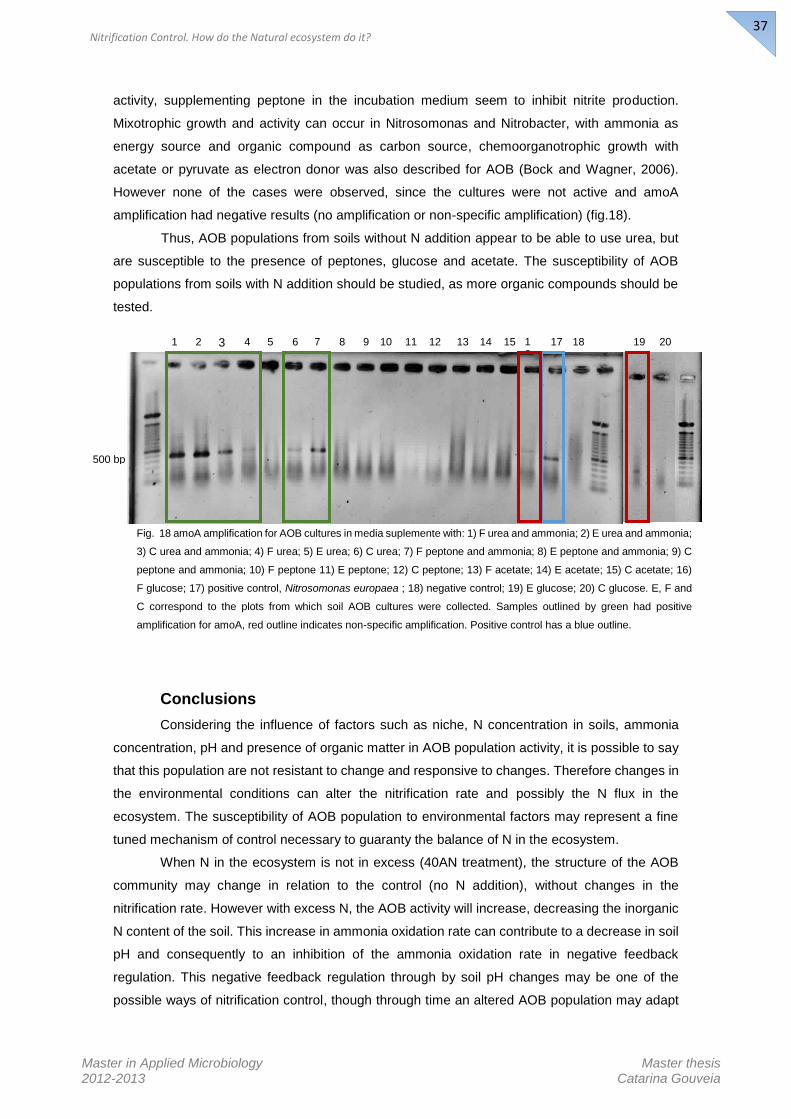
Master in Applied Microbiology 2012-2013
Master thesis Catarina Gouveia
activity, supplementing peptone in the incubation medium seem to inhibit nitrite production.
Mixotrophic growth and activity can occur in Nitrosomonas and Nitrobacter, with ammonia as
energy source and organic compound as carbon source, chemoorganotrophic growth with
acetate or pyruvate as electron donor was also described for AOB (Bock and Wagner, 2006).
However none of the cases were observed, since the cultures were not active and amoA
amplification had negative results (no amplification or non-specific amplification) (fig.18).
Thus, AOB populations from soils without N addition appear to be able to use urea, but
are susceptible to the presence of peptones, glucose and acetate. The susceptibility of AOB
populations from soils with N addition should be studied, as more organic compounds should be
tested.
Conclusions
Considering the influence of factors such as niche, N concentration in soils, ammonia
concentration, pH and presence of organic matter in AOB population activity, it is possible to say
that this population are not resistant to change and responsive to changes. Therefore changes in
the environmental conditions can alter the nitrification rate and possibly the N flux in the
ecosystem. The susceptibility of AOB population to environmental factors may represent a fine
tuned mechanism of control necessary to guaranty the balance of N in the ecosystem.
When N in the ecosystem is not in excess (40AN treatment), the structure of the AOB
community may change in relation to the control (no N addition), without changes in the
nitrification rate. However with excess N, the AOB activity will increase, decreasing the inorganic
N content of the soil. This increase in ammonia oxidation rate can contribute to a decrease in soil
pH and consequently to an inhibition of the ammonia oxidation rate in negative feedback
regulation. This negative feedback regulation through by soil pH changes may be one of the
possible ways of nitrification control, though through time an altered AOB population may adapt
37 Nitrification Control. How do the Natural ecosystem do it?
1 2 4 5 6 7 8 9 10 11 12 13 14 15 16
17 18 19 20
Fig. 18 amoA amplification for AOB cultures in media suplemente with: 1) F urea and ammonia; 2) E urea and ammonia;
3) C urea and ammonia; 4) F urea; 5) E urea; 6) C urea; 7) F peptone and ammonia; 8) E peptone and ammonia; 9) C
peptone and ammonia; 10) F peptone 11) E peptone; 12) C peptone; 13) F acetate; 14) E acetate; 15) C acetate; 16)
F glucose; 17) positive control, Nitrosomonas europaea ; 18) negative control; 19) E glucose; 20) C glucose. E, F and
C correspond to the plots from which soil AOB cultures were collected. Samples outlined by green had positive
amplification for amoA, red outline indicates non-specific amplification. Positive control has a blue outline.
500 bp
3
Master in Applied Microbiology 2012-2013
Master thesis Catarina Gouveia
to the acid pH, as it is seen for the AOB culture from the 40A treatment. Consequently changes
in pH may represent a transient mechanism to regulate the AOB activity. Nitrogen addition to the
soil is known to increase the ecosystem productivity, leading to an increase in the concentration
of organic compounds, which can inhibit the ammonia oxidation rate. Therefore another possibility
of nitrification control is through negative feedback by the increase of organic compounds.
Though nitrification appears to be a highly controlled process, the AOB population can
be altered in a way that the activity may not be easily regulated.
Acknowledgements
Organization of both sampling expedition to Arrábida’s experimental field was
accomplished thanks to Cristina Cruz (CBA – Center of Environmental Biology, Faculty of
Science, University of Lisbon, Lisbon, Portugal). Assay reagents, growth mediums were provided
by Cristina Cruz as part of a collaboration in the framework of the project In-Nitro: conceptualizing
the effects of increased nitrogen availability in a Mediterranean ecosystem (PTDC/BIA-
ECS/122214/2010). Molecular analysis, PCR and RFLP analysis were performed thanks to prof.
Dr. Rogério Tenreiro and Dr. Sandra Chaves (BioFig.)
I thank Dr. Stephen Unger for helping with the field work and suggestions regarding the sampling
sites. I also thank Teresa Dias for the help with the nitrite and ammonia quantification protocol
and experimental field description and characterization.
References
1. Adair K. L., Schwartz E. (2008). Evidence that Ammonia-Oxidizing Archaea are More Abundant than Ammonia-
Oxidizing Bacteria in Semiarid Soils of Northern Arizona, USA. Microbial Ecology Vol.56:420–426
2. Allison S. D., and Martiny J. B. H. (2008). Resistance, resilience, and redundancy in microbial communities.
PNAS vol. 105: 11512–11519
3. Andert J., Wessén E., Börjesson G., Hallin S. (2011). Temporal changes in abundance and composition of
ammonia-oxidizing bacterial and archaeal communities in a drained peat soil in relation to N2O emissions.
Journal of Soils Sediments 11: 1399–1407
4. Bates S. T., Berg-Lyons D., Caporaso J. G., Walters W. A., Knight R., Fierer N. (2011) Examining the global
distribution of dominant archaeal populations in soil. The ISME Journal 5: 908–917
5. Belser L. W. and Mays E. L. (1980) Specific Inhibition of Nitrite Oxidation by Chlorate and Its Use in Assessing
Nitrification in Soils and Sediments. Applied and Environmental Microbiology, Vol. 39, No. 3: 505-510
6. Bobbink, R., Hicks, K., Galloway, J., Spranger, T., Alkemade, R., Ashmore, M., Bustamante, M., Cinderby, S.,
Davidson, E., Dentener, F., Emmett, B., Erisman, J.-W., Fenn, M., Gilliam, F., Nordin, A., Pardo, L. & de Vries,
W. (2010) Global assessment of nitrogen deposition effects on terrestrial plant diversity: a synthesis. Ecological
Applications, Vol.20: 30-59
7. Bock E. and Wagner M. (2006). Oxidation of Inorganic Nitrogen Compounds as an Energy Source. Prokaryotes
Vol.2 chapter 1.16: 457–495
8. Bodelier, P. l. E., Libochant, J. A., Blom, C. W. P. M. and Laanbroek H. J. (1996) Dynamics of Nitrification and
Denitrification in Root-Oxygenated Sediments and Adaptation of Ammonia-Oxidizing Bacteria to Low-Oxygen
or Anoxic Habitats. Applied and Environmental Microbiology, Vol. 62, No. 11: 4100–4107
9. Bollmann A., Laanbroek H. J. (2001). Continuous culture enrichments of ammonia-oxidizing bacteria at low
ammonium concentrations. FEMS Microbiology Ecology Vol.37:211-221
10. Bremner J. M. (1997) Sources of nitrous oxide in soils. Nutrient Cycling in Agroecosystems Vol.49: 7–16
11. Brochier-Armanet, C., Boussau, B., Gribaldo, S., and Forterre, P. (2008) Mesophilic Crenarchaeota: proposal
for a third archaeal phylum, the Thaumarchaeota. Nature Reviews Microbiology 6: 245-252.
12. Burns L. C., Stevens R. J., Laughlin R. J. (1996). Production of nitrite in soil by simultaneous nitrification and
denitrification. Soil Biology and Biochemistry. Vol. 28, No. 415:609-616
13. Cabello P., Roldán M. D., Moreno-Vivián C. (2004) Nitrate reduction and the nitrogen cycle in archaea.
Microbiology Vol.150: 3527–3546
38 Nitrification Control. How do the Natural ecosystem do it?

Master in Applied Microbiology 2012-2013
Master thesis Catarina Gouveia
14. Cleemput O., V., Samater A., H. (1996) Nitrite in soils: accumulation and role in the formation of gaseous N
compounds. Fertilizer Research 45:81-89
15. De la Torre, J. R., Walker, C. B., Ingalls, A. E., Konneke, M. & Stahl, D. A. (2008) Cultivation of a thermophilic
ammonia oxidizing archaeon synthesizing crenarchaeol. Environmental Microbiology. 10, 810–818
16. Delgado-Baquerizo, M., Gallardo, A., Wallenstein, M. D., Maestre F. T. (2013).Vascular plants mediate the
effects of aridity and soil properties on ammonia-oxidizing bacteria and archaea. FEMS Microbiology Ecology
Nº 85 (2013) 273–282
17. Dias T., Malveiro S., Martins-Loução M. A., Sheppard L. J., Cruz C. (2011) Linking N-driven biodiversity
changes with soil N availability in a Mediterranean ecosystem. Plant Soil. Vol 34:125-136
18. Dias T., Martins-Loução M.A., Sheppard L., Cruz C. (2012) The Strenght of the biotic compartment in retaining
nitrogen additions prevents nitrogen losses from a Mediterranean maquis. Biogeociences Vol.9 193-201
19. Dias, T., Malveiro, S., Chaves, S., Tenreiro, R., Branquinho, C., Martins-Loução, M.A., Sheppard, L. & Cruz, C.
(2011) Effects of increased N availability on biodiversity of Mediterranean-type ecosystems: a case study in a
Natura 2000 site in Portugal. Nitrogen Deposition and Natura 2000: Science & practice in determining
environmental impacts (eds W.K. Hicks, C.P. Whitfield, W.J. Bealey & M.A. Sutton), pp. 171-180.
COST729/Nine/ESF/CCW/JNCC/SEI Workshop Proceedings, published by COST
20. Dilly, O. (2005) Microbial Energetics in Soils - Microorganisms in Soils: Roles in Genesis and Functions. Soil
Biology. Vol. 3: 123-136
21. Fiencke C., Spieck E., Bock E. (2005) Nitrifying Bacteria. Nitrogen Fixation in Agriculture, Forestry, Ecology,
and the Environment: 255-276.
22. Hanks, J. H., Weintraub R. L. (1936) “The pure culture isolation of ammonia-oxidizing bacteria”. Journal of
Bacteriology. Vol. 32 No.6
23. Harms, H., Koops, H.P., and Wehrmann, H. (1976) An ammonia-oxidizing bacterium, Nitrosovibrio tenuis
nov.gen. nov. sp. Archives of Microbiology Vol.108: 105-111.
24. Hatzenpichler R. (2012). Diversity, Physiology, and Niche Differentiation of Ammonia-Oxidizing Archaea.
Applied and Environmental Microbiology. Vol. 78. No. 21: 7501–7510.
25. He J., Hu H., Zhang L., (2012). Current insights into the autotrophic thaumarchaeal ammonia oxidation in acidic
soils. Soil Biology and Biochemistry. Archives of Microbiology Vol.55: 146-154
26. Iman R. L., Conover W.J. (1983). Modern Business Statistics. Wiley & Sons, Incorporated, New York
27. Junier P., Molina V., Dorador C., Hadas O., Kim O., Junier T., Witzel K., F. Imhoff J. (2010). Phylogenetic and
functional marker genes to study ammonia-oxidizing microorganisms (AOM) in the environment. Applied
Microbiology and Biotechnology. Vol.85:425–440
28. Kӧnneke M., Bernhard A. E., de La Torre J. R., Walker C. B., Waterbury J. B., Stahl D. A. (2005) Isolation of
an autotrophic ammonia-oxidizing marine archaeon. Nature. Vol. 437:543-546
29. Leininger S., Urich T., Schloter M., Schwark L., Qi J., Nicol G. W., Prosser J. I., Schuster S. C., Schleper C.
(2006) Archaea predominate among ammonia-oxidizing prokaryotes in soils. Nature Vol 442: 806-809
30. Lewis R. F. and Pramer D. (1958). Isolation of nitrosomonas in pure culture. Journal of bacteriology. Vol. 76:
524-528
31. Liu S., Shen L., Lou L., Tian G., Zheng P. and Hu B. (2013). Spatial Distribution and Factors Shaping the Niche
Segregation of Ammonia-Oxidizing Microorganisms in the Qiantang River, China. Applied Environmental
Microbiology Vol.79 No.13:4065
32. Martens-Habbena W., Berube P. M., Urakawa H., de La Torre J. R., Stahl D. A. (2009) Ammonia oxidation
kinetics determine niche separation of nitrifying Archaea and Bacteria. Nature Vol.461:976-980
33. Meiklejohn J. (1950) The Isolation of Nitrosomonas europaea in Pure Culture. Journal of General Microbiology.
Vol. 4, No. 2:185-191
34. Mendum T. A., Sockett R. E., and Hirsch P. R. (1999) Use of Molecular and Isotopic Techniques To Monitor
the Response of Autotrophic Ammonia-Oxidizing Populations of the b Subdivision of the Class Proteobacteria
in Arable Soils to Nitrogen Fertilizer. Applied and Environmental Microbiology. Vol. 65, No. 9, 4155–4162
35. Muyzer G, Hottentrager S, Teske A, Wawer C (1995) Denaturing gradient gel electrophoresis of PCR-amplified
16S rDNA—a new molecular approach to analyse the genetic diversity of mixed microbial communities. In:
Akkermans ADL, van Elsas JD, de Bruijn FJ (eds) Molecular microbial ecology manual. Kluwer Academic
Publishers, Dordrecht, pp 1–23
36. Nakatsu C. H., Torsvik V. and Øvreås L. (2000). Soil Community Analysis Using DGGE of 16S rDNA
polymerase chain reaction products. Soil Science Society of America Journal. Vol.64:1382 - 1388
37. Nicol G. W., Schleper C. (2006) Ammonia-Oxidising Crenoarchaeota: important players in the nitrogen cycle?
TRENDS in Microbiology Vol.14 No.5: 207-212
38. Norton J. M. and Stark J. M. (2011). Regulation and Measurement of Nitrification in Terrestrial Systems.
Methods in Enzymology. Vol. 486: 343-368
39. Ochua-Hueso R., Allen E., B., Branquinho C., Cruz C., Dias T., Fenn M., E., Manrique E., Pérez-Corona M.,
E., Sheppard L., J., Stock W., D. (2011) Nitrogen deposition effect on Mediterranean-type ecosystems: An
ecological assessment. Environmental Pollution. Vol.159: 2265–2279
40. Prosser J. I. (2002) Molecular and functional diversity in soil micro-organisms. Plant and Soil Vol.244:9-17
41. Prosser J.I., Nicol G. W. (2008) Relative Contributions of archaea and bacteria to aerobic ammonia oxidation
in the environment. Environmental Microbiology. Vol.10:2931-2941
42. Rhine E.D., Sims G.K., Mulvaney R.L., Pratt E.J. (1998) Improving the Berthelot reaction for determining
ammonium in soil extracts and water. Soil Science Society of America Journal. Vol.62 No.2: 473-480
39 Nitrification Control. How do the Natural ecosystem do it?

Master in Applied Microbiology 2012-2013
Master thesis Catarina Gouveia
43. Ronald L. Iman, W.J. Conover (1983). Modern Business Statistics. Wiley & Sons, Incorporated, New York
44. Rotthauwe J. H., Witzel K. P., Liesack W. (1997) The Ammonia Monooxygenase Structural Gene amoA as a
Functional Marker: Molecular Fine-Scale Analysis of Natural Ammonia-Oxidizing Populations. Applied and
environmental microbiology, Vol. 63, No. 12: 4704–4712
45. Ruiz G., Jeisonb D., Chamy R. (2003). Nitrification with high nitrite accumulation for the treatment of wastewater
with high ammonia concentration. Water Research. Vol.37:1371–1377
46. Simon H. M., Jahn C. E., Bergerud L. T., Sliwinski M. K., Weimer P. J., Willis D. K., Goodman R. M. (2005)
Cultivation of Mesophilic Soil Crenoarchaeotes in Enrichment Cultures from Plant Roots. Applied and
Environmental Microbiology. Vol. 71 No.8: 4751-4760
47. Sinha B., Annachhatre A., P. (2007) Partial nitrification – operational parameters and microorganisms involved.
Reviews in Environmental Science and Biotechnology. Vol.6:285-313
48. Soriano, S., and N. Walker. (1968) Isolation of ammonia oxidizing autotrophic bacteria. Journal of Applied
Bacteriology. Vol.31:493-497.
49. Spang A., Hatzenpichler R., Brochier-Armanet C., Rattei T., Tischler P., Spieck E., Streit W., Stahl D. A.,
Wagner M. and Schleper C. (2010)Distinct gene set in two different lineages of ammonia-oxidizing archaea
supports the phylum Thaumarchaeota. Trends in Microbiology. Vol.18: 331-340
50. Spieck E., Bock E. (2005) Nitrifying Bacteria. Bergey’s Manual of Systematic Bacteriology Vol. 2:137-140
51. Standard methods for the examination of water and wastewater (1999) 4500-NO3- E. Cadmium Reduction
method. American Public Health Association, American Water Works Association, Water environment
Federation
52. Timonen S., Bomberg M. (2009) Archaea in dry environments. Phytochemestry Reviews. Vol.8:505-518
53. Treusch A. H., Leininger S., Kletzin A., Schuster S. C., Klenk H. P., Schleper C. (2005) Novel genes for nitrite
reductase and Amo-related proteins indicate a role of uncultivated mesophilic crenarchaeota in nitrogen cycling.
Environmental Microbiology. Vol.7 No.12: 1985–1995
54. Verhagen, F.J.M., Hageman, P.E.J., Woldendorp, J.W. and Laanbroek, H.J. (1994) Competition for ammonium
between nitrifying bacteria and plant roots in soil in pots; effects of grazing by fagellates and fertilization. Soil
Biology and Biochemestry. Vol.26: 89-96.
55. Winogradsky S. (1890). Recherches sur les Organismes des la Nitrification, (Parts 1-3.) Annales de l'Institut
Pasteur. Vol. 4: 213, 257, 700.
56. Winogradsky S. (1892). Contribution à la Morphologie des Organismes de la Nitrification. Archives of Biological
Science. Vol. 1
57. Winogradsky S. and Winogradsky H. (1933). Études sur la Microbiologie du Sol: (7) Nouvelles Recherches sur
les organismes de la Nitrification. Annales de l'Institut Pasteur. Vol. 50: 350.
Annex
Table 1. Number of active AOB cultures from rhizospheric soil and root surface of Cistus ladanifer in each
enrichment after 30 days of incubation.
Initial culture
number
Number of active cultures
1st enrichment 2nd enrichment 3rd enrichment
Rhizospheric soil AOB culture 9 8 7 7
Rhizospheric soil AOA culture 9 4 2 1
Root surface AOB culture 9 4 3 2
Root surface AOA culture 9 4 2 0
40 Nitrification Control. How do the Natural ecosystem do it?

Master in Applied Microbiology 2012-2013
Master thesis Catarina Gouveia
Table. 2. Coefficient of variation calculated for the studied parameters: lag phase, maximum nitrite
concentration, nitrite production rate, attained for the 1st AOB enrichment cultures from rhizospheric soil and
root surface of Cistus ladanifer.
Table. 3 Statiscical analysis of studied parameters for: AOB 1st enrichment cultures from rhizospheric soil
and root surface of Cistus ladanifer
Sample
parameter Levene's test (CI = 0.95/
α = 0.05) Variance analysis
Result
p Result Transforma
tion Applied
test Confidence level (CI)
Α p Signifcant
1st
enrichment
AOB cultures
maximum nitrite concentration
0.1 linear - ANOVA 0.95 0.05
0.152
no
nitrite production rate 0.22 linear - ANOVA 0.95 0.05
0.292
no
Lag phase 0.18 linear - ANOVA 0.95 0.05
0.049
yes
Table.4 Coefficient of variation calculated for the studied parameters in the 2nd task: maximum nitrite
concentration, ammonia concentration decrease, nitrite production rate, lag phase and nitrite production
yield, attained for the 3 AOB enrichment cultures and 3rd AOA enrichment culture.
AOB cultures from:
CV
lag phase nitrite production
rate maximum nitrite concentration
Soil 0.26 1.59 1.03
Roots 0.32 2.3 1.46
Coefficient of variation (CV)
Sample (October)
treatment
Maximum nitrite
concentration (mg/L)
Ammonia Comsuption
(%)
Nitrite prodution rate
(mg/L/d) lag phase (d)
Nitrite production yield (%)
1st
enrichment AOB
Control 34.9 18.9 23.34 22.63 19.1
40A 46.9 5.8 63.3 11.31 44.6
40AN 42.03 8.57 37.1 12.3 46.34
80AN 49.8 9.52 78.71 12.3 42.77
2nd
enrichment AOB
Control 90.11 10.13 91.69 - 88.69
40A 27.27 19.7 32.54 - 7.5
40AN 68.63 40.6 74.7 - 64.54
80AN 69.1 34.38 67.7 - 65.53
3rd
enrichment AOB
Control 138.74 1.67 141.42 - 138.65
40A 0.85 0 30.1 - 1.18
40AN 123.07 3.33 141.42 - 122
80AN 21.04 2.77 37.59 - 18.8
3rd enrichment
AOA
Control 58.47 2.82 - - 58.91
40A 12.85 0.14 - - 12.88
40AN 64.66 0.78 - - 64.31
80AN 16.87 0.58 - - 17.30
41 Nitrification Control. How do the Natural ecosystem do it?
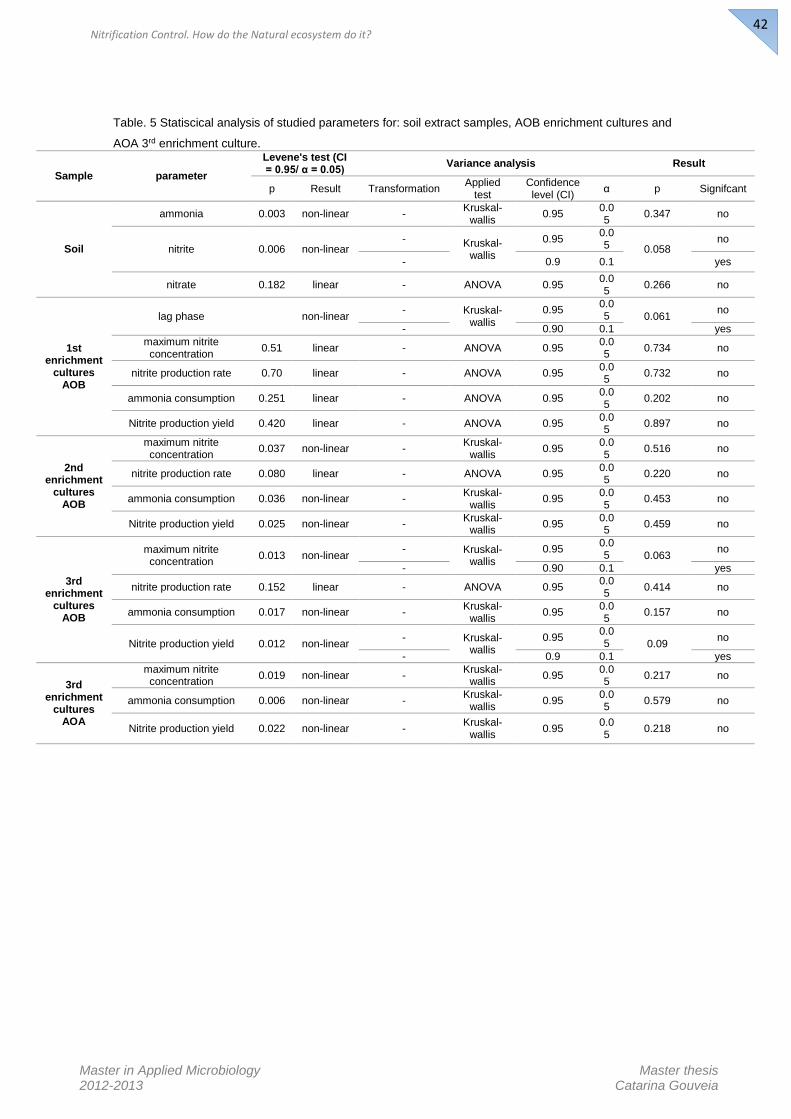
Master in Applied Microbiology 2012-2013
Master thesis Catarina Gouveia
Table. 5 Statiscical analysis of studied parameters for: soil extract samples, AOB enrichment cultures and
AOA 3rd enrichment culture.
Sample parameter
Levene's test (CI = 0.95/ α = 0.05)
Variance analysis Result
p Result Transformation Applied
test Confidence level (CI)
α p Signifcant
Soil
ammonia 0.003 non-linear - Kruskal-
wallis 0.95
0.05
0.347 no
nitrite 0.006 non-linear - Kruskal-
wallis
0.95 0.05 0.058
no
- 0.9 0.1 yes
nitrate 0.182 linear - ANOVA 0.95 0.05
0.266 no
1st enrichment
cultures AOB
lag phase non-linear - Kruskal-
wallis
0.95 0.05 0.061
no
- 0.90 0.1 yes
maximum nitrite concentration
0.51 linear - ANOVA 0.95 0.05
0.734 no
nitrite production rate 0.70 linear - ANOVA 0.95 0.05
0.732 no
ammonia consumption 0.251 linear - ANOVA 0.95 0.05
0.202 no
Nitrite production yield 0.420 linear - ANOVA 0.95 0.05
0.897 no
2nd enrichment
cultures AOB
maximum nitrite concentration
0.037 non-linear - Kruskal-
wallis 0.95
0.05
0.516 no
nitrite production rate 0.080 linear - ANOVA 0.95 0.05
0.220 no
ammonia consumption 0.036 non-linear - Kruskal-
wallis 0.95
0.05
0.453 no
Nitrite production yield 0.025 non-linear - Kruskal-
wallis 0.95
0.05
0.459 no
3rd enrichment
cultures AOB
maximum nitrite concentration
0.013 non-linear - Kruskal-
wallis
0.95 0.05 0.063
no
- 0.90 0.1 yes
nitrite production rate 0.152 linear - ANOVA 0.95 0.05
0.414 no
ammonia consumption 0.017 non-linear - Kruskal-
wallis 0.95
0.05
0.157 no
Nitrite production yield 0.012 non-linear - Kruskal-
wallis 0.95
0.05 0.09
no
- 0.9 0.1 yes
3rd enrichment
cultures AOA
maximum nitrite concentration
0.019 non-linear - Kruskal-
wallis 0.95
0.05
0.217 no
ammonia consumption 0.006 non-linear - Kruskal-
wallis 0.95
0.05
0.579 no
Nitrite production yield 0.022 non-linear - Kruskal-
wallis 0.95
0.05
0.218 no
42 Nitrification Control. How do the Natural ecosystem do it?

Master in Applied Microbiology 2012-2013
Master thesis Catarina Gouveia
Table. 6 Statiscical analysis of studied parameters for: AOB cultures with different ammonia concentrations in the media and different pH.
Sample parameter Levene's test (CI = 0.95/ α = 0.05)
Variance analysis Result
p Result Transformation Applied test Confidence level (CI)
α p Signifcant
Ammonia susceptibility
maximum nitrite
concentration
treatments 0.000 non-linear rank 2-way ANOVA 0.95 0.05 0.00 yes
[ammonia] 0.95 0.05 0.137 no
treatments*[ammonia] 0.95 0.05 0.991 no
nitrite production
rate
treatments 0.001 non-linear rank 2-way ANOVA 0.95 0.05 0.002 yes
[ammonia] 0.95 0.05 0.000 yes
treatments*[ammonia] 0.95 0.05 0.838 no
Nitrite production
yield
treatments 0.000 non-linear rank 2-way ANOVA 0.95 0.05 0.000 yes
[ammonia] 0.95 0.05 0.000 yes
treatments*[ammonia] 0.95 0.05 0.998 no
pH maximum nitrite
concentration
treatments 0.000 non-linear rank 2-way ANOVA 0.95 0.05 0.003 yes
pH 0.95 0.05 0.233 no
treatments*pH 0.95 0.05 0.982 no
nitrite production
rate
treatments 0.000 non-linear rank 2-way ANOVA 0.95 0.05 0.491 no
pH 0.95 0.05 0.003 yes
treatments*pH 0.95 0.05 0.424 no
Table. 7 Statiscical analysis of studied parameters for: AOB cultures incubated in media supplemented with different organic compounds.
Sample parameter Levene's test (CI = 0.95/ α = 0.05)
Variance analysis Result
p Result Transformation Applied test Confidence level (CI)
α p Signifcant
Organic carbon
compounds
maximum nitrite concentration 0.004 non-linear - Kruskal-Wallis 0.95 0.05 0.350 no
nitrite production rate 0.004 non-linear - Kruskal-Wallis 0.95 0.05 0.390 no
Nitrogen compounds
maximum nitrite concentration 0.002 non-linear - Kruskal-Wallis 0.95 0.05 0.572 no
nitrite production rate 0.003 non-linear - Kruskal-Wallis 0.95 0.05 0.847 no
43 Nitrification Control. How do the Natural ecosystem do it?

Master in Applied Microbiology 2012-2013
Master thesis Catarina Gouveia
In-silico RFLP patterns for species of Nitrosomonas and Nitrosospira genus:
Fig. 1 RFLP patterns for Nitrosomas know species, In-silico hydrolysisof amoA gene with: a) HaeIII; b) HinfI.
44 Nitrification Control. How do the Natural ecosystem do it?
N. europaea
N. nitrosa
N. oligotropha
N. ureae
N. aestuari
N. Communi
N. Cryotolerans
N. halophila
N. marina
500
100
600
200
300
400
700
500
100
600
200
300
400
700
N. europaea
N. nitrosa
N. oligotropha
N. ureae
N. aestuari
N. Communi
N. Cryotolerans
N. halophila
N. marina
a
b

Master in Applied Microbiology 2012-2013
Master thesis Catarina Gouveia
Fig. 2 RFLP patterns for Nitrosospira know species, In-silico hydrolysisof amoA gene with A) HaeIII
hydrolase; B) HinfI
45 Nitrification Control. How do the Natural ecosystem do it?
500
100
600
200
300
400
700
N. multiformis
N. tenuis
N. Briensis
800
500
100
600
200
300
400
700
N. multiformis
N. tenuis
N. Briensis
800 900
900
a b