Embed Size (px)
Citation preview

1
BBRREEWWEERRYY AANNDD WWIINNEERRYY WWAASSTTEEWWAATTEERR TTRREEAATTMMEENNTT:: SSOOMMEE FFOOCCAALL PPOOIINNTTSS OOFF DDEESSIIGGNN
AANNDD OOPPEERRAATTIIOONN
António G. Brito, João Peixoto, José M. Oliveira, José A. Oliveira, Cristina Costa, Regina Nogueira, and Ana Rodrigues *
1. INTRODUCTION
Environmental issues are a critical factor for the today industry competitiveness. Indeed, the society and the individual consumers could set a common framework for companies’ commitment and engagement regarding environment protection. Redesign the process, recover by-products or reuse effluents are some of the possible actions towards an eco-efficient strategy. Nevertheless, a point remains crucial in such mission: the ability to defend natural ecosystems from polluted wastewaters. For such purpose, a wastewater treatment plant that maximizes removal efficiency and minimizes investment and operation costs is a key factor.
Brewery and winery are traditional industries with an important economic value in the agro-food sector. In 2003, the total beer production in the European Union (18 countries) was 344 x 105 m3, being recorded around 1800 breweries with 110 thousand employees. If Norway, Switzerland and Turkey are also included, those numbers rise up to 358 x 105 m3, 1839 units and 117 thousand, respectively. The excise revenue from beer industry in all these countries reaches over 8800 x 106 € (The Brewers of Europe, 2004).
The worldwide wine production is 261 x 105 m3 (data from 2002), of which 69 % from Europe, 18 % from America, 5 % from Asia, 4 % from Africa and 4 % from Oceania. The worldwide wine consumption (2002) is 228 x 105 m3, distributed by Europe (68 %), America (20 %), Asia (7 %), Africa (3 %) and Oceania (2 %) (OIV, 2002).
This chapter intends to present some key points on design and operation in wastewater treatment of brewery and winery industries. Therefore, an introduction of the industrial processes is first presented and then wastewater characteristics and treatment processes are discussed. Finally, the experience of a collaborative effort between
* António G. Brito, João Peixoto, José M. Oliveira, Regina Nogueira, and Ana Rodrigues, University of Minho,
School of Engineering – Center of Biological Engineering, Campus de Gualtar, 4710-057 Braga, Portugal. José A. Oliveira, Adega Cooperativa de Ponte da Barca, Lugar de Agrelos, 4980-601 Ponte da Barca, Portugal. Cristina Costa, Unicer SA, Leça do Balio, Matosinhos, 4466-955 S. Mamede de Infesta, Portugal.

2 A. G. BRITO ET AL
University of Minho and two industrial companies, Unicer SA and ACPB (Adega Cooperativa de Ponte da Barca) is presented in order to address some practical problems of wastewater systems design and operation. Unicer SA and ACPB are very important players in their field of activity: Unicer has the major share of the beer market in Portugal and ACPB is a very well known producer of wine with appellation of origin Vinho Verde.
2. BREWERY AND WINERY INDUSTRIES: AN OVERVIEW
2.1. Brewing Processes
Beer is a soft drink obtained through alcoholic fermentation, using selected yeasts of the genera Saccharomyces, of wort prepared from malt cereals, mainly barley, and other amylaceous or sugar-based raw materials, to which were added hop flowers, or their derivatives, and adequate water. Figure 1 shows a typical technological process.
MALTING
MASHING
WORT BOILING HOPS
YEAST
MILLING (CORN GRITZ, BARLEY, RICE, WHEAT; ENZYMES; SUGAR, SUGAR SYRUPS)
WORT FILTRATION
FERMENTATION
BY-PRODUCTS (SPENT GRAINS)
MATURATION
STABILIZATION
CLARIFICATION
PACKAGING
SEDIMENT REMOVAL(TRUB)
WASTEWATER SOLIDS
WASTEWATER SOLIDS
O2
WATER
FINING AGENTS ANTI-OXIDISING AGENTS KIESELGUHR
BY-PRODUCTS (SURPLUS YEAST)
BARLEY
WATER
BREWHOUSE OPERATIONS
Figure 1. Technological process in breweries (adapted from Unicer SA and Varnam and Sutherland, 1994).
BREWERY AND WINERY 3
A mass balance is depicted in Figure 2, which represents water and energy inputs, and also the outputs respecting residues and sub-products, liquid effluents and air emissions. Residues similar to urban residues, simple industrial residues, glass, paper, cardboard, plastic, oils, wood, biological sludge, green residues, etc. are classified as solid wastes; surplus yeast and spent grains are considered sub-products. Brewer’s spent grains are generally used for the production of low value composts, livestock feed or disposed of in landfill as waste (Jay et al., 2004). Alternatively, the spent grains can be hydrolyzed for the production of xylo-oligosaccharides (probiotic effect), xylitol (sweetener), or pentose-rich culture media (Carvalheiro et al., 2004 and 2005; Duarte et al, 2004).
2.2. Winemaking Processes
Wine is the product obtained from the total or partial alcoholic fermentation of fresh grapes, whether or not crushed, or of grape must. Producing wine requires the implemen-tation of a biotechnological sequence involving several unit operations. Although some few products are added to the must and/or wine, several residues are rejected, either as liquid or solid wastes. White wine is normally produced by the fermentation of a clarified must, which is obtained after grape stem removal, pressing of the resulted grape berries and subsequent clarification. The production of red wines is usually conducted in non-clarified musts, prepared after grape stem removal and crushing of grape clusters. Musts can also be fermented in the presence of grape stems. After fermentation, wines must be clarified and stabilized, chemically and microbiologically, before bottling. Figure 3 shows a schematic process, applied at ACPB, to produce wines (Vinho Verde). These wines follow the ordinary winemaking process, but ageing is avoided, in order to preserve the original freshness and fruity characteristics.
Water 4.87 m3/m3
Beer Production
Gas emissions “greenhouse effect” 130.5 kg/m3
SOL
IDS
Electric energy 126.9 kWh/m3
Thermal energy 1.13 GJ/m3 Fossil Fuels 41.7 kg/m3
Acidifying emissions 1.1 kg/m3
Wastewaters 3.3 m3/m3
COD = 13.2 kg/m3 Solid Wastes: 51.2 kg/m3 Valorization index = 93 % Sub-products: 143.6 kg/m3 Valorization index = 100 %
Figure 2. Mass balance applied to Unicer SA breweries representing specific values, i. e., values per cubic meter of produced beer (Unicer SA, 2005).

4 A. G. BRITO ET AL
GRAPE RECEPTION
(CLARIFICATION)
SO2
YEAST
DESTEMMING + CRUSHING
FERMENTATION
TRANSFERS
LEESWASTEWATER
CONSERVATION
FINING
FILTRATION
BOTTLING
TARTRATESRESIDUES
SEDIMENTSWASTEWATER
GRAPE STEMSWASTEWATER
LEES + SEEDSWASTEWATER
TARTRATESWASTEWATER
SO2
COLD STABILIZATION
SO2
SO2POTASSIUM BICARBONATE
FINING AGENTSKIESELGUHRPOTASSIUM BITARTRATE
GUM ARABICCO2
WASTEWATER
(PRESSING) SKINS + SEEDSWASTEWATER
Figure 3. Technological process adopted at ACPB wine-cellar.
Wineries, distilleries and other grape processing industries annually generate large volumes of wastewater. This mainly originates from various washing operations during the crushing and pressing of grapes, as well as rinsing of fermentation tanks, barrels and other equipment or surfaces (Petruccioli et al., 2000). Over the year, volumes and pollution loads greatly vary in relation to the working period (vintage, racking, bottling) and to the winemaking technologies used, e. g., in the production of red, white and special wines (Rochard, 1995; Anon, 1996).
A mass balance of wine production is depicted in Figure 4, which represents water and energy inputs, and also the outputs respecting residues and sub-products, as well as liquid effluents. Simple municipal and some industrial residues (glass, paper, cardboard, plastic, wood and filtration earths) but also yeasts, grape stems, pomace and lees should be recycled and valorized whenever possible.

BREWERY AND WINERY 5
Figure 4. Mass balance applied to ACPB winery representing specific values, i. e., values per cubic meter of produced wine (2004). Losses of water by evaporation were neglected.
Yeasts cannot be used in animal dietary because they have high contents of polyphenols and may contain some residues coming from treatments; they can only be composted with pomace. However, pomace, seeds, lees, effluents resulting from tartar removal and wine rests can be valorized to produce compounds with adding value like alimentary colorant E163, alimentary oil, tartaric acid, 1,3-propanediol and dihydroxy-acetone (Bourzeix et al., 1998). On the other hand, the grape stems can be composted, the final compost being used as organic soil amendment and the grape pomace can be sold to distilleries.
3. WASTEWATER TREATMENT
3.1. Brewery Industry
3.1.1. Wastewater Characterization
The composition of brewing effluents can fluctuate significantly as it depends on various processes that take place within the brewery, but the amount of wastewater produced depends on the water consumption during the process. In general, water consumption per volume of produced beer attain 4.7 m3/m3 (Carlsberg, 2005) but it should be pointed that the wastewater to beer ratio is often 1.2 m3/m3 to 2 m3/ m3 less because part of the water is disposed off with by-products and lost by evaporation (Drissen and Vereijken, 2003).
Organic components in brewery effluent are generally easily biodegradable and mainly consist of sugars, soluble starch, ethanol, volatile fatty acids, etc., leading to a
Water 9.25 m3/m3
Wine Production
Electric energy 159.6 kWh/m3
SOL
IDS
Wastewaters 9.25 m3/m3
Solid wastes: 27.4 kg/m3 Valorization index = 43 %
Sub-products: 406.3 kg/m3 Valorization index = 100

6 A. G. BRITO ET AL
BOD/CODa ratio of 0.6 to 0.7. The effluent solids consist of spent grains, kieselguhr, waste yeast and “hot” trub. The pH levels are determined by the amount and the type of chemicals used at the CIP (clean in place) units (e.g. caustic soda, phosphoric acid, nitric acid). Nitrogenb and phosphorous levels are mainly depending on the handling of raw material and the amount of spent yeast present in the effluent. High phosphorous levels can also result from the chemicals used in the CIP unit. Table 1 summarizes some of the most important environmental parameters.
Table 1. Characteristics of some industrial brewery effluents including Unicer’s Parameter / benchmark Brewery effluent composition
per unit Unicer Typicala Opaque beerb
COD (mg/L) 800 – 3 500 2 000 – 6 000 8 240 – 20 000 BOD (mg/L) 520 – 2 300 1 200 – 3 600 TSSc (mg/L) 200 – 1 000 2 901 – 3 000 TSc (mg/L) 5 100 – 8 750
T oC 30 – 35 18 – 20 25 – 35 pH 6.5 – 7.9 4.5 – 12 3.3 – 6.3 Nitrogen (mg/L) 12 – 31 25 – 80 0.0196 – 0.0336 Phosphorous (mg/L) 9 – 15 10 – 50 16 – 24 (Water/Beer) (m3/m3) 4.87 (Liquid effluent/Beer) (m3/m3) 3.3 2 – 8 (COD/Beer) (kg/m3) 13.2 5 – 30 (BOD/Beer) (kg/m3) 2 – 20 (TSS/Beer) (kg/m3) 1 – 5
a Driessen and Vereijken (2003). b Parawira et al., (2005) c TS, TSS – Total solids, total suspended solids.
3.1.2. Treatment Processes
Different environmental and socio-economics criteria can be considered when deciding on a wastewater treatment plant for a brewery industry. The aim is to select a process that is flexible enough to cope with large fluctuations in organic load and characteristics of such wastewaters, while keeping capital and operating costs as low as possible. Because organic matter concentration in brewery effluent is significant, a high input of energy for aeration is required. Another factor is the amount of waste sludge generated from aerobic metabolism, which also needs to be handled and disposed of. Both increase the cost of operation of the treatment system. Therefore, anaerobic processes are preferred for the purpose of brewery wastewaters pre-treatment because energy is saved and sludge disposal costs are minimized. When discharging into surface
a BOD – Biochemical oxygen demand – and COD – Chemical oxygen demand – (mass of O2 per volume). b N – Nitrogen mass concentration (mass of N per volume). NO3
–-N, NO2
–-N, NH4
+-N – Nitrate, nitrite, and
ammonia mass concentration as mass of N per volume.

BREWERY AND WINERY 7
water bodies, anaerobic pre-treatment combined with subsequent aerobic post-treatment for organic or nutrient removal is considered to be the best solution (Rodrigues et al., 2001; Nogueira et al., 2002).
Several types of anaerobic reactors can be applied to brewery wastewater treatment. However, the Upflow Anaerobic Sludge Blanket (UASB) reactor clearly accounts for the most usual full-scale systems (Batston et al., 2004; Parawira et al., 2005). The upflow mode of operation induces the development of a characteristic biological self-aggregation process without addition of support material. The resulting biofilm structure is usually denominated “granules” and is the main factor for their high biomass concentration and biological activity (Brito et al., 1997a). The Expanded Granular Sludge Bed (EGSB) reactor is a tower reactor using granular anaerobic sludge, identical to UASB reactors, built with tank heights of 12 m to 16 m. The Internal Circulation (IC) reactor also uses granular anaerobic sludge and is built with higher tank heights (up to 24 m). Whereas the EGSB and UASB reactors separate the biomass, biogas and wastewater in a 1-step three-phase-separator located in top of the reactor, the IC reactor is a 2-staged UASB reactor design. The lower UASB receives extra mixing by an internal circulation, driven by its own gas production. While the first separator removes most of the biogas, turbulence is significantly reduced, allowing the second separator effectively separating the anaerobic sludge from the wastewater. The loading rate of the IC reactor, as COD, is typically twice as high as the UASB reactor (15 kg m–3 d–1 to 30 kg m–3 d–1). Another positive factor resulting from the applied high hydraulic upflow velocities is the selective washout of brewery solids, like kieselguhr, trub and yeast.
In order to meet stringent requirement of surface water quality, an aerobic polishing step is necessary after the anaerobic pre-treatment. Sequencing batch reactors (SBR) are well suited for such purpose (Brito et al., 1997b; Rodrigues et al., 2004). The SBR is a periodic process that performs multiple biological reactions in non steady-state conditions. Biomass retention throughout the introduction of a decanting step and the ease of automation are additional advantages for using SBR technology (Rodrigues et al., 1998). Nevertheless, some other interesting experiences regarding aerobic processes can be named. Selected examples are jet loop reactors (Bloor et al., 1995), fluidised bed bioreactor (Ochieng et al., 2002) and membrane bioreactors (Cornelissen et al., 2002). It should be noted that membrane bioreactors deserve a special attention within the brewing industry. Their market share can increase in the next few years, including in the anaerobic concept (Ince et al., 2000).
3.2. Winery Industry
3.2.1. Wastewater Characterization
Winemaking is seasonal with high activity in autumn (at north hemisphere), which corresponds to vintages and fermentations, a notoriously less important activity in spring on the occasion of transfers (racking period) and filtrations, and a weak activity during winter and summer. Winery effluents contain four types of principal pollutants:
• Sub-product residues – stems, seeds, skins, lees, sludge, tartar, etc.; • Loss of brut products – musts and wines occurred by accidental losses and
during washings; • Products used to wine treatments – fining agents, filtration earths, etc.;

8 A. G. BRITO ET AL
• Cleaning and disinfection products, used to wash materials and soils. Musts and wines constituents are present in wastewaters, in variable proportions:
sugars, ethanol, esters, glycerol, organic acids (e.g., citric, tartaric, malic, lactic, acetic), phenolic compounds (coloring matter and tannins) and a numerous population of bacteria and yeasts. They are easily biodegradable elements, except for polyphenols (60 mg/L to 225 mg/L) which make this biodegradation more difficult and requiring an adapted flora. Effluents have a pronounced demand in nitrogen and phosphorous, with a BOD5/N/P relation often near 100/1/0.3 (Torrijos and Moletta, 1998). Additionally, effluents have a daily great variability, in both quantity and quality, making evaluation of daily pollution complex. Generally, the production of 1 m3 of wine generates a pollution load equivalent to 100 persons. The pH is usually acidic but, punctually, it may display basic values, on the occasion of the cleaning operations (with alkaline products and organochlorides) and on the occasion of chemical detartaration.
Rejected volumes per volume of produced wine vary from one wine cellar to another, with extreme values comprised between 0.1 m3/m3 and 2.4 m3/m3. For the ratio of water consumption to produced wine, 1.0 m3/m3 is the rule of thumb, while Pévost and Gouzenes (2003) refer to values between 0.3 m3/m3 and 2.5 m3/m3. Table 2 shows some examples of winery effluents main characteristics. Washing operations carried out during different winemaking steps, which are at the origin of the rejection of fully charged wastewaters, can be distributed as follow:
– During vintage preparation – washing and disinfection of materials; – During grape reception – washing of reception materials (hoppers, destemmers,
crushers, presses, dejuicers, conveyors and transport pumps); cleaning the floors, with or without addition of cleaning products;
– During vinifications – rinsing of fermentation and clarification vats; cleaning the floors, with or without addition of cleaning products;
– During transfers – rinsing vats after transfers; cleaning the floors, with or without addition of cleaning products;
– During filtrations – rinsing kieselguhr and earth filters.
Table 2. Examples of effluent composition (mean or range values) of four different wineries, including that of ACPB
Wine cellara ACPB Ab Bb Cc Production (m3/year) 250 730 3000 6000 pH 5.7 4.9 4.7 4.0 – 4.3 COD (mg/L) 1 200 – 10 266 5 200 14 150 9 240 – 17 900 BOD (mg/L) 130 – 5 320 2 500 8 100 5 540 – 11 340 TSS (mg/L) 385 – 5 200 522 e 1 060 1 960 – 5 800 TVS d (mg/L) --- --- 742 81 – 86 % of the TSS Total N (kjeldahl) (mg/L) 12 – 93 61 48.2 74 – 260 Total P (mg/L) 23 25 5.5 16 to 68
a Torrijos and Moletta (1998). b Vintage period, mean value after 24 h. c Extreme values. d TVS – Total volatile solids. e After primary sedimentation.

BREWERY AND WINERY 9
3.2.2. Treatment Processes
The criteria for selecting an anaerobic or an aerobic biological treatment are identical in brewery and winery industries.
Like in the brewery industry, the winery wastewaters are characterized by their high content on organic biodegradable compounds. In this case, the anaerobic technology is the most economical bioprocess due to lower running costs for aeration and sludge processing. However, as previously mentioned for the brewery case, the anaerobic conversion is generally insufficient to attaint the effluent quality required for discharge in surface waters. Therefore, the anaerobic treatment should be followed by an aerobic system, if the option of co-treatment of the winery wastewaters in a (aerobic) municipal wastewater treatment plant is not available. Despite such rule, in the case of small wine industries where the minimization of investment costs is the key factor and only one biological process may be considered, the option must be an aerobic process if the objectives for effluent quality are high. Obviously, the financial burden of an aerobic operation is not so heavy in the case of a low wastewater flow.
Organic matter is essentially in soluble form. Therefore, a static sedimentation unit is not an option for significant concentration reduction. Besides, an important fraction of the suspended matters is easily removed by settling (seeds, tartaric salts, filtration earths). Another focal point is the removal of inorganic suspended solids from such type of wastewaters because the abrasive solids used in precoated filters can damage mechanical equipment. Furthermore, many biological processes face difficulties for treating non-soluble wastewaters: a pre-treatment step using screening and/or sedimentation is then mandatory.
The anaerobic process shows a very good reliability for winery wastewaters. The COD/N/P ratio is appropriate for anaerobic bacteria and the seasonal activity is not a problem for process start-up. The anaerobic digesters are generally heated to reach the mesophilic range (but psychrophilic conditions are possible) and is advisable to measure alkalinity routinely in order to avoid a sudden pH drop in one-stage processes. All anaerobic technologies can be applied for treating winery wastewaters. Among them, two of the most promising ones are granular UASB reactors and the anaerobic sequencing batch reactor (aSBR). An interesting approach is reported by Keyser et al. (2003) who evaluated three UASB reactors with the aim of tailoring granules for the treatment of winery wastewater, a novel ecotechnological approach. One reactor was seeded with granular sludge enriched with Enterobacter sakazakii and a 90 % COD removal at hydraulic retention time of 24 h could be reached. This performance compares favourable with a second reactor seeded with brewery granules that achieved 85 % COD removal and with a third one seeded with municipal sludge, which showed problems and had continuously to be re-seeded. Ruíz et al. (2002) operated an anaerobic sequencing batch reactor at an organic loading rate, as COD, around 8.6 kg/(m3 d) with soluble COD (sCOD) removal efficiency greater than 98 %, hydraulic retention time of 2.2 d and a specific organic loading rate, as COD/VSS (volatile suspended solids), of 0.96 g/(g d). Anaerobic filters and completely mixed reactors are also used in the winery industry, but fewer systems are under construction now.
As stated before, aerobic technologies are well suited for the depollution of wastewaters from wineries, if their running costs are not decisive. Sequencing batch reactors are becoming the most popular since Torrijos and Moletta (1997) used them to

10 A. G. BRITO ET AL
treat a winery wastewater and reported a 95 % sCOD elimination, and a nitrogen and phosphorous removal of 50 % and 88 %, respectively. These results could be generalized and the simplified automation and the possibility of coping with load fluctuations are decisive SBR advantages. Nevertheless, other different designs are currently available. Eusébio et al. (2004) have operated jet-loop reactors, Andreottola et al. (2005) performed the treatment of a winery wastewater applying a two-stage fixed bed biofilm reactor, and Coetzee et al. (2004) have implemented a pilot-scale rotating biological contactor. The seasonal operation of wineries may be a problem for aerobic biological systems leading to decreased sludge settleability, floc disintegration and increased solids in the treated effluent (Chudoba and Pujol, 1996). Therefore, in order to work efficiently, even during those temporary overloading periods, the plant has to be oversized. This strategy is rather costly, because such a plant has to run below its nominal capacity during a major part of the year.
In small wineries, simplified systems of low energy consumption – lagoons, constructed wetlands, land spreading/irrigation – are also scenarios for effluent treatment or polishing, but a landscape integration is sought and large areas of land should be available (Bustamante et al., 2005). The feasibility of such approach depends on external factors that restrain a generalized use, namely meteorological, hydrogeological, and soil and biomass characteristics. Therefore, the engineering of a specific biological treatment process for wineries wastewater, including the selection of ancillary equipment, should be decided on a case by case basis, as stated by Rochard and Kerner (2004).
4. CASE STUDY 1: BREWING WASTEWATER TREATMENT
The brewery industry Unicer SA has in operation a UASB reactor (1600 m3) for the industrial wastewater treatment. The start-up of UASB reactors often rely on a massive inoculation with biomass already in pellets/granules (Nollet et al., 2005), representing an additional cost for the brewery industry. Indeed, the Unicer SA reactor was inoculated with granular sludge imported from a paper factory in Spain. A 70 % to 80 % COD removal is generally recorded in the UASB process. In spite of such efficiency, the final COD and ammonium nitrogen levels are above the threshold values prescribed by legislation for wastewater discharge in surface waters. On the other hand, due to the anaerobic digestion process, the carbon concentration in the UASB effluent is very low, imposing difficulties on conventional post-denitrification processes. Therefore, as depicted in Figure 5, several steps were performed. First, there was the formation of anaerobic granules in a lab-scale UASB reactor using dispersed biomass as inoculum and the industrial wastewater from Unicer SA as substrate. Second, the feasibility of SBR technology for the post-treatment of the effluent from the UASB reactor was assessed. For the post-treatment of the brewery wastewater, two different SBR strategies for nitrogen removal were considered. One was based on an aerobic-anoxic sequence and the other one comprised a pre-denitrification step, that is, an anoxic-aerobic-anoxic sequence. In both tests, SBR performance and biological kinetics were evaluated.

BREWERY AND WINERY 11
Figure 5. Schematic diagram of the goals of the present chapter.
4.1. UASB Operation for the Formation of Biomass Granules
Non-aggregated biomass from an anaerobic digester used in the stabilization of activated sludge was tested for granulation. The operational protocol was based on the selection of aggregate-forming bacteria, mainly focused on the acetotrophic Methanothrix spp, by favouring the wash-out of non-aggregated biomass (Hulshoff Pol, 1989). In order to attain such objective, the loading rate was increased when acetate concentration was lower than 50 mg/L, a value near the half saturation constant of Methanothrix spp. During the first three months, the treated effluent was partly recycled to increase the hydraulic load. The operating temperature in the UASB reactor was 35 oC. The pH ranged from 6.5 to 7.9.
Figures 6 and 7 show the operational conditions and results of the UASB reactor, namely BV (volumetric organic load, organic matter mass concentration, as COD, per time unit), COD (influent and effluent), and COD removal efficiency. The granular activity sustained the application of high BV, up to 20 kg/(m3 d), with average COD removal efficiencies of 80 %. The objective of granulation process was successfully achieved but a six month period of operation was necessary. The sedimentation velocity of aggregated biomass attained 40 m/h to 50 m/h and the SVI (sludge volume index) was 10 mL/g. TS and TVS in granules amounted to 114 kg/m3 and 87 kg/m3. Figure 8 shows a SEM (scanning electron microscopy) picture of the granules, obtained at the end of operation.
The feasibility of UASB reactor start-up based on an inoculation with non-aggregated biomass was demonstrated for the treatment of brewery industry wastewaters, concerning organic matter elimination. However, an amonification processes occurred, NH4
+-N in the effluent ranging between 23 mg/L and 87 mg/L, while the influent NH4+-N
was just 12 mg/L to 29 mg/L. Therefore, a further nitrogen removal process was necessary in order to attain effluent thresholds for discharge into surface waters.
Effluent containing NH4+-N higher
than the required level for discharge into surface waters Anaerobic
pre-treatment in a full-scale UASB reactor
Lab UASB reactor to study the formation of anaerobic granules using a non-aggregated inoculum
Lab SBR for the post-treatment of the brewery wastewater to provide a base for the upgrading of Unicer SA treatment system
UNICER SA wastewater

12 A. G. BRITO ET AL
0
5
10
15
20
25
0 50 100 150 200 250t /d
B V
kg/(m3 d)
Figure 6. Organic load applied to the UASB reactor.
0
1000
2000
3000
4000
0 50 100 150 200 250t /d
CODmg/L
0
20
40
60
80
100
CODremoval
efficiency %
Figure 7. Results of UASB reactor operation along the operational time.
Legend: —∆— COD removal efficiency — — CODin —■— CODout
Figure 8. SEM photograph of the biomass after granulation.

BREWERY AND WINERY 13
4.2. SBR Operation for the Post-Treatment of the Brewery Wastewater
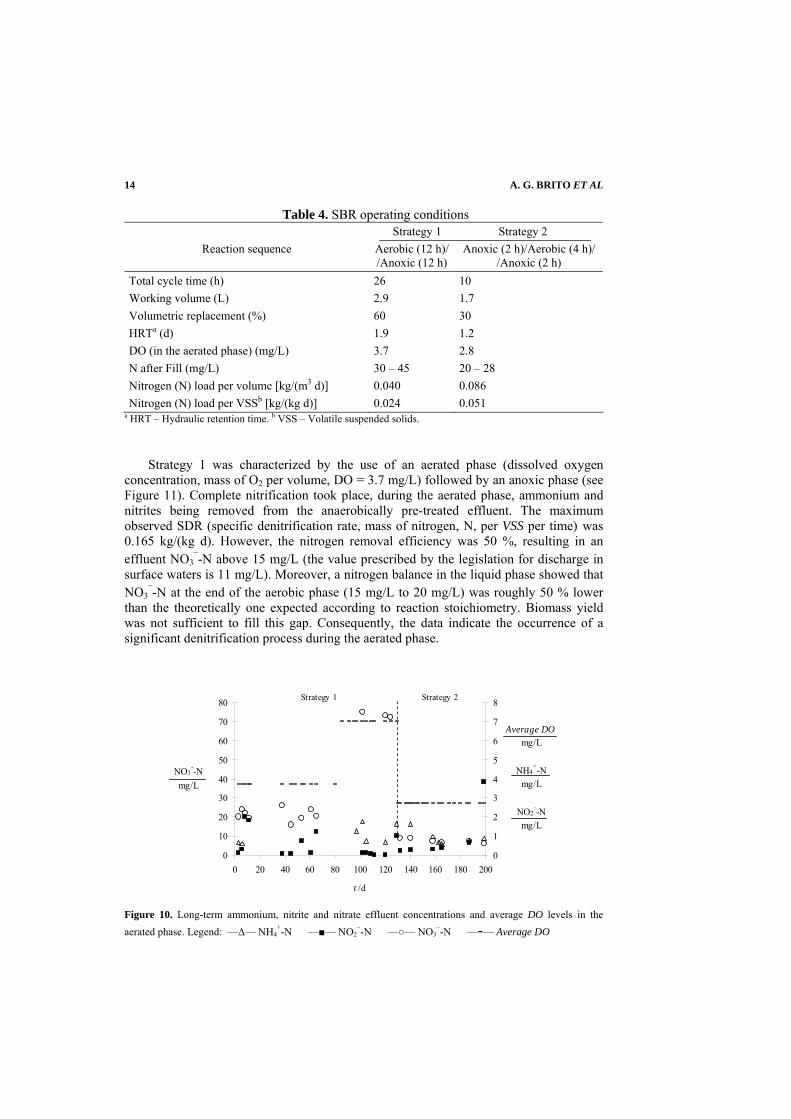
The average composition of the UASB effluent collected at Unicer SA brewery is shown in Table 3. The bench scale SBR was operated in the typical sequence of Fill, React, Settle and Draw. Two SBR operating strategies were tested during the present study. Their main features are summarized in Figure 9. The SBR operational conditions are described in Table 4. The biomass inoculum was a grab sample collected in a municipal activated sludge plant of the extended aeration type (around 90 % of the inoculum), supplemented with an inoculum of Alcaligenes denitrificans and nitrifying microorganisms. The average MLVSS (mixed liquor volatile suspended solids concentra-tion, mass per volume) during the experimental assays was 1690 mg/L. Solids sampling represented the only biomass wastage carried out along the experimental work. Therefore, the sludge age was rather long, being estimated as 37 d. The concentration of nitrogen compounds in the treated effluent is depicted in Figure 10.
Table 3. Brewery wastewater composition after UASB pre-treatment Parameter Range
pH 7.5 – 8.0 Total COD, tCOD (mg/L) 400 – 2 000 Soluble COD, sCOD (mg/L) < 470 Soluble organic carbon (C) (mg/L) 60 – 83 NH4
+-N (mg/L) 23 – 87 NO2
–-N (mg/L) 0 – 1.2 NO3
–-N (mg/L) 0 – 3 Soluble P (mg/L) 8 – 20 TSS (mg/L) 320 – 1440
Strategy 1: post-denitrification
Fill (0.5 h) Aerobic (12 h) Anoxic (12 h) Settle (1 h) Draw (0.5 h)
Fill (0.5 h) Anoxic (2 h)
Strategy 2: pre-denitrification Aerobic (4 h) Anoxic (2 h) Settle (1 h) Draw (0.5 h)
Figure 9. SBR operational strategies.
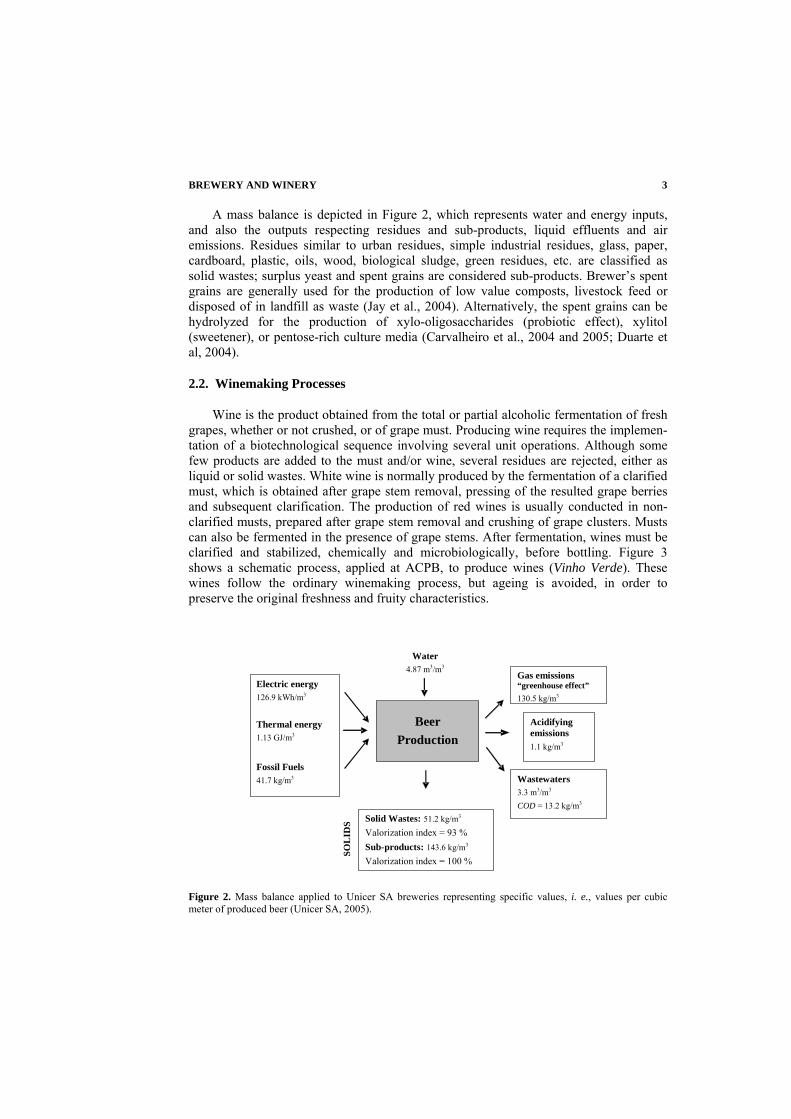
14 A. G. BRITO ET AL
Table 4. SBR operating conditions Strategy 1 Strategy 2
Reaction sequence
Aerobic (12 h)/ /Anoxic (12 h)
Anoxic (2 h)/Aerobic (4 h)/ /Anoxic (2 h)
Total cycle time (h) 26 10 Working volume (L) 2.9 1.7 Volumetric replacement (%) 60 30 HRTa (d) 1.9 1.2 DO (in the aerated phase) (mg/L) 3.7 2.8 N after Fill (mg/L) 30 – 45 20 – 28 Nitrogen (N) load per volume [kg/(m3 d)] 0.040 0.086 Nitrogen (N) load per VSSb [kg/(kg d)] 0.024 0.051
a HRT – Hydraulic retention time. b VSS – Volatile suspended solids.
Strategy 1 was characterized by the use of an aerated phase (dissolved oxygen concentration, mass of O2 per volume, DO = 3.7 mg/L) followed by an anoxic phase (see Figure 11). Complete nitrification took place, during the aerated phase, ammonium and nitrites being removed from the anaerobically pre-treated effluent. The maximum observed SDR (specific denitrification rate, mass of nitrogen, N, per VSS per time) was 0.165 kg/(kg d). However, the nitrogen removal efficiency was 50 %, resulting in an effluent NO3
–-N above 15 mg/L (the value prescribed by the legislation for discharge in surface waters is 11 mg/L). Moreover, a nitrogen balance in the liquid phase showed that NO3
–-N at the end of the aerobic phase (15 mg/L to 20 mg/L) was roughly 50 % lower than the theoretically one expected according to reaction stoichiometry. Biomass yield was not sufficient to fill this gap. Consequently, the data indicate the occurrence of a significant denitrification process during the aerated phase.
0
10
20
30
40
50
60
70
80
0 20 40 60 80 100 120 140 160 180 200
t /d
NO3--N
mg/L
0
1
2
3
4
5
6
7
8
Average DOmg/L
NH4+-N
mg/L
NO2--N
mg/L
Strategy 1 Strategy 2
Figure 10. Long-term ammonium, nitrite and nitrate effluent concentrations and average DO levels in the aerated phase. Legend: —∆— NH4
+-N —■— NO2–-N —○— NO3
–-N —-— Average DO

BREWERY AND WINERY 15
0
10
20
30
40
50
0 5 10 15 20 25 30t /h
ORPmV
-150
-100
-50
0
50
100
150
NH4+-N
mg/L
NO2--N
mg/L
NO3--N
mg/L
DO mg/L
Aerobic phase
Anoxic phase
Figure 11. ORP (oxidation-reduction – redox – potential) values and DO, ammonium, nitrite and nitrate nitrogen concentrations in the bulk liquid, along a typical SBR cycle, in strategy 1 (DO = 3.7 mg/L during the aerated phase). Legend: —■— ORP —●— DO —○— NH4
+-N —□— NO2–-N —∆— NO3
–-N
As declared above, the maximum observed SDR was 0.165 kg/(kg d). An explanation for such phenomenon relies on oxygen limitations within microbial flocs providing the oxygen free conditions for heterotrophic denitrifying bacteria activity (van Loosdrecht and Heijnen, 1993). Such hypothesis was tested setting a DO of 7 mg/L during the aerated phase (Figure 12). In fact, at such high DO, denitrification did not occur during the aerobic period, confirming that there was an oxygen limitation when the bulk liquid DO was 3.7 mg/L.
The strategy 2 involved a pre-denitrification step and thereafter the aerated phase (DO = 2.8 mg/L) and the anoxic phase. In Figure 13 the behavior of nitrogen compounds and the ORP and DO profiles during a typical SBR cycle are shown.
The overall experimental results (Figure 10) demonstrated that the most appropriate strategy for nitrogen removal in order to achieve the legal compliance for wastewater discharge in surface waters was the anoxic-aerobic-anoxic sequence, with DO = 2.8 mg/L in the aerated period, and a volumetric replacement of 30 % (strategy 2). Under such conditions, the maximum observed SNRR (specific nitrogen removal rate) had the value 0.038 kg/(kg d), and NO3
–-N in the effluent was lower than 8 mg/L. Thus, this strategy optimizes the energy requirements for aeration with an
appropriate effluent quality for discharge in surface waters. The denitrification during the final anoxic phase (after the aerobic period) was practically meaningless in all runs.

16 A. G. BRITO ET AL
0
10
20
30
40
50
60
70
0 5 10 15 20 25 30t /h
NH4+-N
mg/L
NO2--N
mg/L
NO3--N
mg/L
0
50
100
150
200
250
300
sCODmg/L
Aerobic phase Anoxic phase
Figure 12. Ammonium, nitrite, nitrate and soluble COD in the bulk liquid along a typical SBR cycle in strategy 1 (during the aerated phase: DO = 7 mg/L). Legend: — — NH4
+-N —□— NO2–-N —∆— NO3
–-N —■—sCOD
The C/N ratio in the UASB effluent had an average value of 0.8 and carbon requirements for complete nitrogen removal were not satisfied: the stoichiometric C/N ratio, using an easily degradable carbon source like acetate, must be 1.25. The results obtained when acetate was used to increase the mass C/N ratio to 1.3, during the anoxic phase, leading to a complete nitrate removal, confirmed that the soluble carbon source was limiting denitrification. Simultaneous nitrification and denitrification was detected during the aerated phase at DO = 2.8 mg/L and 3.7 mg/L (Figures 11 and 13). On the other hand, denitrification was inhibited during the aerated period when the bulk liquid DO was raised to 7 mg/L (Figure 12). The redox potential was kept within the range +100 mV to –240 mV, in response to oxygen concentration along each cycle. The ORP provides information about the process regime and can be used to control the duration of the denitrification phase (Demoulin et al., 1997). However, the typical breakpoint, the “nitrate knee”, that appears in the ORP curve at NO3
–-N close to zero, could not be observed (Figures 11 and 13). Due to the simultaneous nitrification-denitrification and carbon limitations, nitrate was always present, even if at low concentrations, along the whole operating cycle. An improvement of the biological floc settleability was noticed along SBR operation. Soon after the start-up, flocs became larger and the SVI decreased from 200 mL/g down to 115 mL/g. A concomitant decrease of TSS in the treated effluent was observed, attaining only 30 mg/L at the end of the experimental period.

BREWERY AND WINERY 17
0
10
20
30
40
50
0 2 4 6 8 10t /h
ORPmV
sCODmg/L
-250
-150
-50
50
150Anoxic phase
Aerobic phase
Anoxic phase
NH4+-N
mg/L
NO3--N
mg/L
DO mg/L
Figure 13. Variation of ORP values, DO, soluble COD and nitrogen compounds concentration in the bulk liquid along a typical SBR cycle, during strategy 2. Legend: —■— ORP —●— DO —□— sCOD —○— NH4
+-N —∆— NO3–-N
5. CASE STUDY 2: WINERY WASTEWATER TREATMENT
The start-up and optimization of the wastewater treatment process in the wine industry are presented using the ACPB case study. The aimed optimization was based on two operational strategies during the periods of high daily flows and organic loads.
5.1. Full-Scale Sequencing Batch Reactor Operation
A schematic diagram of the WWTP (wastewater treatment plant) is presented in Figure 14.
Figure 14. Schematic diagram of the WWTP from ACPB: 1 – Sand remover; 2 – Equalization/neutralization tank; 3 – Septic tank; 4 – Biological unit (SBR); 5 – Sludge thickener; 6 – River.
1
2
34
5
6

18 A. G. BRITO ET AL
A sand remover is located at the beginning of the WWTP in order to remove solid materials, including diatomaceous earth, from the wastewater. If necessary, the correction of the pH value is made in a 300 m3 equalization tank, throughout CaCO3 addition. Inside the SBR, two superficial jet aerators with swing-arms are installed, with a capacity of oxygenation of 5.5 kg/h each.
The SBR was inoculated with domestic sewage, with VSS = 540 mg/L. Nutrients were supplied throughout the SBR feeding with domestic wastewater produced at ACPB. The ratio BOD5/N/P was 100/10/0.4. The excess sludge from the SBR was conducted to a gravity thickener. According to the working conditions, nine operational phases were identified during the first year of operation of the SBR (Table 5). Each phase was either related to a working period of the wine industry (with a typical effluent composition), or to changes in the SBR operating conditions in order to increase the treatment efficiency. In order to deal with the high effluent volumes generated during the vinification and racking periods, the SBR was fed twice a day, representing a reduction of 50 % in the reaction time. The time based SBR schedule is depicted in Table 6, describing the operation with 1 and 2 cycles per day. Table 7 summarizes the general operating conditions of the SBR, considering the operation with 1 cycle per day.
The pH values of the effluent were in the range between 7 and 8. Nevertheless, during the vinification period, pH values of 3 were detected in the equalization tank. The temperature of the effluent ranged between 15 oC and 25 oC. In general, high COD removal efficiencies were detected, despite the BV changes (Figure 15) but during the vinification and racking periods, BV increase led to a significant decrease in the COD removal efficiency, due to oxygen limitations.
Table 5. Characterization of the different phases of WWTP operation Operational
phase Operational reactor
phases Working period at the winery Cycles per phase
Cycles per day
1 Start-up --- 65 1 2 Operation Washing operations and bottling 37 1 3 Operation Vinification 10 1 4 Operation Vinification and racking 29 1 5 Operation Bottling 24 1 6 Operation Second racking 42 1 → 2 7 1st sludge purge --- 26 2 8 2nd sludge purge --- 33 2
9 Biomass recirculation --- 27 1
Table 6. Time based SBR schedule for operation with 1 and 2 cycles per day Aerated fill Aerated react Settle Draw
1 cycle per day 0.5 h 21 h 2 h 0.5 h 2 cycles per day 0.5 h 10 h 1 h 0.5 h

BREWERY AND WINERY 19
Table 7. SBR general operating conditions (1 cycle per day) Parameter Value
Working volume (m3) 150 Volumetric replacement (%) 17 HRT (d) 5.7 VSS (g/L) 2.5 – 4.5 BV [kg/(m3 d)] 0.5 – 2.5 Applied specific load (as VSS) [kg/(kg d)] 0.26 – 0.57
In fact, BV, which was usually in the range between 0.5 kg/(m3 d) and 1.5 kg/(m3 d), reached, in this period, the averaged value of 2.5 kg/(m3 d). As a consequence, the biomass concentration increased significantly and the oxygen supply was not enough to fit the needs, resulting in tCOD values of 5000 mg/L in the discharge, despite the higher COD removal rates. A wash-out of the biomass was observed for VSS higher than about 4.5 g/L, leading to an increase in the final effluent total COD and TSS. In fact, for VSS higher than 4.5 g/L, the biomass exhibited a low sedimentation capability, due to the high sludge age (45 d), leading to SVI > 120 mL/g. The results obtained showed that SVI values should not exceed 80 mL/g, in order to maintain a good performance of the biological reactor.
Towards the goal of increasing the SBR performance during the vinification and racking periods and in order to account for the high daily flow and organic load of the industrial effluent, two operational strategies were tested (Figure 16).
0
1
2
3
4
5
Operational phase
B V
kg/(m3 d)
0
10
20
30
40
50
60
70
80
90
100
CODremoval
efficiency%
1 2 3 4 5 6 7 8 9
Figure 15. COD removal efficiency as a function of the applied volumetric load.
Legend: — — COD removal efficiency —■— BV

20 A. G. BRITO ET AL
0
20
40
60
80
100
120
0 2 4 6 8 10SBR cycles
COD removal
efficiency%
0
0.5
1
1.5
2
2.5
B V
kg/(m3 d)
Figure 16. COD removal efficiency according to the applied organic load for different operational strategies (1 and 2 cycles per day). Legend: —●— Efficiency (1 cycle) —○— Efficiency (2 cycles) —■— BV (1 cycle) —□— BV (2 cycles)
The first strategy, based on the operation of the SBR with two cycles per day (resulting in a 50 % decrease in HRT, from 7.4 d to 3.7 d, and, therefore, in the duplication of BV), was tested during the bottling period (average tCOD in the equalization tank of 4000 mg/L). At this time, the winery wastewater comes, mainly, from the washing operations and from the cooling processes, leading to high daily wastewater flows. The second strategy was used when BV was high [above 1.5 kg/(m3 d)] and consisted of the recirculation of biomass from the SBR to the equalization tank, and the use of an additional aeration system in both units, in order to provide the oxygen needed for the organic matter biodegradation. The biomass recirculation to the equalization tank and the aeration of the medium allowed the beginning of the biodegradation processes at this stage, thus reducing the organic load applied to the SBR.
The results of the present study showed the suitability of a SBR designed on the basis of averaged values of organic matter concentration and effluent flow, by changing the operational strategy during the vinification and racking periods. In fact, during the periods of high organic load (vinification and racking periods), the additional oxygen supply led to a significant improvement in the WWTP performance, in terms of COD elimination. During the rest of the year, the COD removal efficiency was always higher than 90 % (Figure 16), despite the operation of the SBR with one or two cycles per day, according to the industrial wastewater daily flow.
6. CONCLUSION
Brewery and winery industries are small and medium enterprises but with a significant social and economic value. Therefore, their sustainability policy requires wastewater treatment systems with the best performance and the fact is that well known processes and technologies are available for such purpose. The experience obtained at

BREWERY AND WINERY 21
Unicer SA and ACPB demonstrated that the technological solutions are much site specific – in their case, UASB and sequencing batch reactors were very appropriate –, and highlighted that a good operation requires a bioengineering knowledge but is much a continuous and endless effort in order to minimize costs maintaining the best quality and service.
Acknowledgements
The authors are deeply thankful to Gerd Teunissen, Patrícia Moreira and Agostinha Castro for their contribution during design, operation and analytical control of ACPB WWTP and UASB lab-scale reactor. We also want to leave here our recognition to Luís Melo for his pertinent research suggestions.
References
Andreottola, G., Foladori, P., Nardelli, P., Denicolo, A., 2005, Treatment of winery wastewater in a full-scale fixed bed biofilm reactor, Water Sci. Technol. 51(1):71.
Anon, 1996, La vendemmia 1996 nei paesi UE, Ind. Bev. 25:640. Batston, D. J., Keller, J., and Blackall, L. L., 2004, The influence of substrate kinetics on the microbial
community structure in granular anaerobic biomass, Water Res. 38:1390. Bloor, J. C., Anderson, G. K., Willey, A. R., 1995, High rate aerobic treatment of brewery wastewater using the
jet loop reactor, Water Res. 29(5):1217. Bourzeix, M., Escudier, J. L., and Mourgues, J., 1998, Produits de diversification, in: Œnologie – Fondements
Scientifiques et Technologiques, Flanzy C. (Coordonnateur), Éditions Tec & Doc, Paris, pp. 1143–1179. Brito, A. G., Rodrigues, A. C., and Melo, L. F., 1997a, Granulation during the start-up of a UASB reactor used
in the treatment of low strength wastewaters, Biotechnol. Lett. 19(4):363. Brito, A. G., Rodrigues, A. C., and Melo, L. F., 1997b, Feasibility of a pulsed sequencing batch reactor with
anaerobic aggregated biomass for the treatment of low strength wastewaters, Water Sci. Technol. 35(1):193.
Bustamante, M. A., Paredes, C., Moral, R., Moreno-Caselles, J., Pérez-Espinosa, A., Pérez-Murcia, M. D., 2005, Uses of winery and distillery effluents in agriculture: characterisation of nutrient and hazardous components, Water Sci. Technol. 51(1):145.
Carlsberg/Carlsberg Breweries A/S Environmental Report 2003 and 2004, 2005, Copenhagen (February 1, 2005); http://www.carlsberg.com/
Carvalheiro, F., Duarte, L. C., Lopes, S., Parajó, J. C., Pereira, H., and Gírio F. M., 2005, Evaluation of the detoxification of breweries spent grain hydrolysate for xylitol production by Debaryomyces hanseníi CCMI 941, Process Biochem. 40:1215.
Carvalheiro, F., Esteves, M. P., Parajó, J. C., Pereira, H., and Gírio F. M., 2004, Production of oligosaccharides by autohydrolysis of brewer’s spent grain, Bioresour. Technol. 91:93.
Chudoba, P., and Pujol, R., 1996, Activated sludge plant facing grape harvest period – a case study, Water Sci. Technol. 34(11):25.
Coetzee, G., Malandra, L., Wolfaardt, G.M., Viljoen-Bloom, M., 2004, Dynamics of a microbial biofilm in a rotating biological contactor for the treatment of winery effluent, Water SA 30(3):407.
Cornelissen, E.R., Janse, W., Koning, J., 2002, Wastewater treatment with the internal MEMBIOR, Desalination 146:463.
Demoulin, G., Goronsky, M. C., Wutscher, K., and Forsthuber, E., 1997, Co-current nitrification/denitrification and biological P-removal in cyclic activated sludge plants by redox controlled cycle operation, Water Sci. Technol. 35(1):215.
Driessen, W., and Vereijken, T., 2003, Recent developments in biological treatment of brewery effluent, The Institute and Guild of Brewing Convention, Livingstone, Zambia, March 2–7.
Duarte, L. C., Carvalheiro, F., Lopes, S., Marques, S., Parajó, S., and Gírio, F. M., 2004, Comparison of two post-hydrolysis processes of brewer’s spent grain autohydrolysis liquor to produce a pentose-containing culture media, Appl. Biochem. Biotechnol. ABAB Symposium Series, pp.1041–1058.
22 A. G. BRITO ET AL
Eusébio, A., Petruccioli, M., Lageiro, M., Federici, F., Duarte, J. C., 2004, Microbial characterisation of activated sludge in jet-loop bioreactors treating winery wastewaters, J. Ind. Microbiol. Biotechnol. 31:29.
Hulshoff Pol, L. W., 1989, The phenomenon of granulation of anaerobic sludge, Ph.D. Thesis, Agricultural University Wageningen, The Netherlands.
Ince, B. K., Ince, O., Sallis, P. J., Anderson, G. K., 2000, Inert COD production in a membrane anaerobic reactor treating brewery wastewater, Water Res. 34(16):3943.
Jay, A. J., Parker, M. L., Faulks, R., Smith, A. C., Wilde, P. J., Faulds, C. B., and Waldron, K. W, 2004, A systematic micro-dissection of brewer’s spent grain, in: Total Food – Exploiting Co-products – Minimizing Waste, Waldron, K., Faulds, C., and Smith, A., eds., Norwich, UK, pp. 150–156.
Keyser, M., Witthuhn, R. C., Ronquest, L.-C., Britz, T. J., 2003, Treatment of winery effluent with upflow anaerobic sludge blanket (UASB) – granular sludges enriched with Enterobacter sakazakii, Biotechnol. Lett. 25:1893.
Nogueira, R., Melo, L. F., Purkhold, U., Wuertz, S., and Wagner, M., 2002, Nitrifying and heterotrophic population dynamics in biofilm reactors: effects of hydraulic retention time and the presence of organic carbon, in: Modern Scientific Tools in Bioprocessing, P. Wilderer and S. Wuertz, eds., Ch. 10, Elsevier, Amsterdam, pp. 469–481.
Nollet, H., Van de Putte, I., Raskin, L., and Verstraete, W., 2005, Carbon/electron source dependence of polychlorinated biphenyl dechlorination pathways for anaerobic granules, Chemosphere 58:299.
Ochieng, A., Ogada, T., Sisenda, W., Wambua, P., 2002, Brewery wastewater treatment in a fluidised bed bioreactor, Journal Hazard. Mater. B 90:311.
OIV – International Organisation of Vine and Wine/Situation and Statistics of the World Vitiviniculture Sector 2002, 2002, Paris (February 1, 2005); http://www.oiv.org/.
Parawira, W., Kudita, I., Nyandoroh, and M. G., Zvauya, R., 2005, A study of industrial anaerobic treatment of opaque beer brewery wastewater in a tropical climate using a full-scale UASB reactor seeded with activated sludge, Process Biochem. 40:593.
Petruccioli, M., Duarte, J. C., and Federici F., 2000, High rate aerobic treatment of winery wastewater using bioreactors with free and immobilized activated sludge, J. Biosci. Bioeng. 90(4):381.
Pévost, M., and Gouzenes, E., 2003, Le traitment des effluents vinicoles du bassin adour garonne, Adour Garonne. Revue de l’Agence de l’Eau, 86:1.
Rochard, J., 1995, Nature et conséquences de la pollution vinicole: réduction de la charge polluante, Ind. Bev. 24:16.
Rochard, J., Kerner, S., 2004, Traitement d’épuration des effluents vinicoles, Revue des Œnologues 113:45. Rodrigues, A. C., Brito, A. G., and Melo, L. F., 1998, Fate of phosphorus concentration in a SBR designed for
nitrogen removal, in: 2nd European Symposium on Biochemical Engineering Science, Porto, Portugal, September 16–19, pp. 343.
Rodrigues, A. C., Brito, A. G., and Melo, L. F., 2001, Post-treatment of a brewery wastewater using a Sequencing Batch Reactor, Water Environ. Res. 73:45.
Rodrigues, A. C., Brito, A. G., and Melo, L. F., 2004, Biological treatment of hydrocarbon slurries by a Sequencing Batch Biofilm Reactor (SBBR), in: Proceedings of the Leading-Edge Conference on Water and Wastewater Treatment Technologies, Prague, Czech Republic, June 1–4.
Ruíz, C., Torrijos, M., Sousbie, P., Lebrato-Martinez, J., Moletta, R., Delgenes, J.P., 2002, Treatment of winery wastewater by anaerobic sequencing batch reactor, Water Sci.Technol. 45(10):219.
The Brewers of Europe/Beer Facts 2003, 2004, Brussels (February 1, 2005); http://www.brewersofeurope.org/. Torrijos, M., Moletta, R., 1997, Winery wastewater depollution by sequencing batch reactor, Water Sci.
Technol. 35(1):249. Torrijos, M., and Moletta, R., 1998, Effluents vinicoles et filières de traitement, in: Œnologie – Fondements
Scientifiques et Technologiques, Flanzy C. (Coordonnateur), Éditions Tec & Doc, Paris, pp. 1263–1284. Unicer SA/Sustainability Report 2004, 2005, Matosinhos (February 1, 2005); http://www.unicer.pt/ van Loosdrecht, M. C. M., and Heijnen, J. J., 1993, Biofilm bioreactors for wastewater treatment, TIBTECH,
11:117. Varnam, A. H., and Sutherland, J. P., 1994, Alcoholic beverages: I. Beer, in: Beverages – Technology,
Chemistry and Microbiology, Vol. 2, Food Products Series, 1st ed., Chapman & Hall, London, pp. 296–361.