Embed Size (px)
Citation preview
UNIVERSIDADE FEDERAL DE PERNAMBUCO
CENTRO DE CIÊNCIAS BIOLÓGICAS
PROGRAMA DE PÓS-GRADUAÇÃO EM BIOLOGIA VEGETAL
EDGAR ALBERTO DO ESPIRITO SANTO SILVA
ESTRUTURAÇÃO DE ASSEMBLEIAS ARBÓREAS EM UMA PAISAGEM
FRAGMENTADA: EXISTE RELAXAMENTO NA MORTALIDADE DEPENDENTE
DA DENSIDADE E DISTÂNCIA?
RECIFE
2014
EDGAR ALBERTO DO ESPIRITO SANTO SILVA
ESTRUTURAÇÃO DE ASSEMBLEIAS ARBÓREAS EM UMA PAISAGEM
FRAGMENTADA: EXISTE RELAXAMENTO NA MORTALIDADE
DEPENDENTE DA DENSIDADE E DISTÂNCIA?
Tese apresentada ao Programa de Pós-
Graduação em Biologia Vegetal da
Universidade Federal de Pernambuco,
como parte dos requisitos para obtenção
do título de Doutor em Biologia Vegetal.
Orientador: Dr. Marcelo Tabarelli
RECIFE
2014

Catalogação na fonte Elaine Barroso
CRB 1728 Silva, Edgar Alberto do Espírito Santo
Estruturação de assembleias arbóreas em uma paisagem fragmentada: existe relaxamento na mortalidade dependente da densidade e distância?/ – Recife: O Autor, 2014. 168 folhas : il., fig., tab.
Orientador: Marcelo Tabarelli Tese (doutorado) – Universidade Federal de Pernambuco,
Centro de Ciências Biológicas, Biologia Vegetal, 2014. Inclui bibliografia e anexo
1. Árvores 2. Florestas 3. Sementes I. Tabarelli, Marcelo
(orientador) II. Título 582.16 CDD (22.ed.) UFPE/CCB- 2014- 283

EDGAR ALBERTO DO ESPIRITO SANTO SILVA
“ESTRUTURAÇÃO DE ASSEMBLEIAS ARBÓREAS EM UMA
PAISAGEM FRAGMENTADA: EXISTE RELAXAMENTO NA
MORTALIDADE DEPENDENTE DA DENSIDADE E DISTÂNCIA?”
APROVADO EM 26/02/2014
BANCA EXAMINADORA:
Dr. Marcelo Tabarelli (Orientador) – UFPE
Dra. Deborah Maria de Faria – UESC
Dr. Enrico Bernard – UFPE
Dra. Inara Roberta Leal – UFPE
Dr. Bráulio Almeida Santos – UFPB
Recife - PE
2014

Dedico esta tese a minha esposa, Kátia, e aos meus pais,
José Patrício e Maria dos Prazeres.
AGRADECIMENTOS
À minha família que, mesmo sem ter ideia do que eu pesquisava ou porque eu
pesquisava, sempre me apoiou durante o doutorado;
Ao Dr. Marcelo Tabarelli pela orientação e oportunidade;
Ao Dr. Carlos A. Peres pela orientação durante o doutorado sanduíche na University of
East Anglia, Reino Unido;
Ao Dr. Felipe Melo pela parceria e coorientação durante este doutorado;
A Antônio Patriota pelo grande auxílio no desenvolvimento do projeto de tese;
À Fundação de Amparo à Ciência e Tecnologia do Estado de Pernambuco (FACEPE)
pela concessão da bolsa de doutorado;
À Coordenação de Aperfeiçoamento de Pessoal de Nível Superior (CAPES) pela
concessão da bolsa de doutorado sanduíche na University of East Anglia, Reino
Unido;
Ao Conselho Nacional de Desenvolvimento Científico e Tecnológico (CNPq) e CAPES
pelo financiamento dos projetos do Dr. Marcelo Tabarelli, e ao Centro de
Pesquisas Ambientais do Nordeste (CEPAN) e Usina Serra Grande (USGA) pelo
apoio logístico. Sem o auxílio dessas entidades não seria possível a realização
desta tese de doutorado;
Ao herbário UFP-UFPE pelo apoio logístico;
À minha amiga Laura Leal pelo imenso apoio pessoal e acadêmico;
Aos colegas do Laboratório de Ecologia Vegetal e Aplicada e do Laboratório de
Interação Planta-Animal;
A Michael Kröncke e Paulo Portes pelo imenso auxílio em campo;
À Fátima Araújo pela ajuda na identificação de espécies;

Ao povo do arruado de Coimbra e a Dona Marinalva pelo acolhimento e apoio prestado
durante os dias de campo;
Aos meus amigos de Norwich, que me ajudaram durante uma etapa curta, porém
fundamental, do desenvolvimento da minha tese;
Aos membros das bancas de qualificação e defesa da tese pela avaliação e importantes
contribuições fornecidas para a finalização deste produto;
E em especial, à minha esposa Kátia Rito que, com muito amor, carinho e
companheirismo, me ajudou a vencer mais esta etapa.
Muito obrigado!

LISTA DE FIGURAS
Fundamentação teórica
Figura 1. Modelo gráfico adaptado de Janzen (1970). A curva de recrutamento
populacional (CRP) é resultado da quantidade de sementes por unidade de área (I)
pela probabilidade de sobrevivência de sementes e plântulas (P), que aumenta com
a distância para a árvore parental.............................................................................. 17
Figura 2. Modelo gráfico adaptado de Janzen (1970). A curva de recrutamento
populacional (CRP) é resultado da quantidade de sementes por unidade de área (I)
pela probabilidade de sobrevivência de sementes e plântulas (P), que aumenta com
a distância para a árvore parental. As curvas em preto representam o modelo
criado por Janzen (1970), enquanto as curvas em vermelho representam possíveis
modificações desse modelo em florestas defaunadas................................................ 32
Capítulo 1
Figura 1. Localização da paisagem da Usina Serra Grande, nordeste do Brasil. O
desenho esquemático mostra a distribuição dos 19 pequenos fragmentos florestais
estudados (< 100 ha) e do maior remanescente florestal da paisagem, o fragmento
de Coimbra (3500 ha)................................................................................................... 83
Figura 2. Em A e B, relação entre a densidade média das espécies arbóreas em
floresta madura e pequenos fragmentos na paisagem da Usina Serra Grande,
nordeste do Brasil. Note que os eixos x e y apresentam a mesma amplitude de
valores, logo, pontos acima da linha tracejada representam espécies com densidades
maiores nos fragmentos florestais. Em C e D, relação entre a razão da densidade das
espécies em pequenos fragmentos pela densidade na floresta madura e o nicho de
regeneração (em ambas, P < 0.05). A e C são referentes à assembleia de adultos,
enquanto B e D demonstram os resultados para a assembleia de plântulas. Em C e
D, as caixas representam o 25º e 75º percentil, as barras de erro indicam o 10º e 90º
percentil, enquanto os pontos representam os valores extremos. As linhas sólidas e
tracejadas indicam a mediana e a média, respectivamente. PFF = pequenos
fragmentos florestais; FM = floresta madura................................................................ 84

Figura 3. Comparação entre a densidade média das espécies nas assembleias de
adultos e plântulas na paisagem da usina Serra Grande, nordeste do Brasil. Em A,
espécies tolerantes à sombra. Em B, espécies pioneiras. Cada seta descreve uma
espécie, onde a base da seta representa a densidade na assembleia de adultos e a
ponta da seta indica a densidade na assembleia de plântulas. Devido ao grande
número de espécies, aquelas espécies em que apenas os adultos foram encontrados
foram colocadas em cinza claro. Note que os eixos x e y apresentam a mesma
amplitude de valores, logo, pontos acima da linha tracejada representam espécies
com densidades maiores nos fragmentos florestais. PFF = pequenos fragmentos
florestais; FM = floresta madura................................................................................... 85
Figura 4. Ranking de espécies em função da abundância relativa (A e B) e do
número de parcelas em que foram encontradas (C e D). A e C descrevem a floresta
madura, enquanto B e D representam os pequenos fragmentos florestais na
paisagem da usina Serra Grande, nordeste do Brasil.................................................... 86
Capítulo 2
Figura 1. Frequência de distribuição (A, C) e distância média (B, D) de indivíduos
arbóreos jovens em relação ao adulto coespecífico mais próximo em áreas de
floresta madura (FM) e pequenos fragmentos florestais (FF) na paisagem de Serra
Grande, nordeste do Brasil. Em A e B, foram analisadas todas as espécies, enquanto
em C e D, foram analisadas apenas as espécies pioneiras. Em B e D, as caixas
representam o 25º e 75º percentil, as barras de erro indicam o 10º e 90º percentil,
enquanto os pontos representam os valores extremos. As linhas sólidas e tracejadas
indicam a mediana e a média, respectivamente............................................................ 108
Figura 2. Distância média entre adultos (A, B) e jovens (C, D) coespecíficos em
áreas de floresta madura (FM) e pequenos fragmentos florestais (FF) na paisagem
de Serra Grande, nordeste do Brasil. Em A e C, foram analisadas todas as espécies,
enquanto em B e D, foram analisadas apenas as espécies pioneiras. As caixas
representam o 25º e 75º percentil, as barras de erro indicam o 10º e 90º percentil,
enquanto os pontos representam os valores extremos. As linhas sólidas e tracejadas
indicam a mediana e a média, respectivamente. * P < 0,05......................................... 109

Capítulo 3
Fig. 1. Percentage of seeds of Tapirira guianensis predated/removed near and far
from nearest conspecific adult in small fragments and mature forest areas in the
Serra Grande landscape, northeast Brazil. Error bars indicates standard error………. 133
Fig. 2. Percentage of seeds of Tapirira guianensis predated/removed in different
exclosure treatments in small fragments and mature forest areas in the Serra Grande
landscape, northeast Brazil. Error bars indicates standard error…………………… 134

LISTA DE TABELAS
Capítulo 1
Tabela 1. Lista de espécies arbóreas encontradas em assembleias de
indivíduos adultos e de plântulas na paisagem da Usina Serra Grande,
nordeste do Brasil. O símbolo “↑” indica que a densidade média da espécie é
maior nos pequenos fragmentos que em áreas de floresta madura no maior
remanescente, enquanto “↓” indica que a densidade média é menor nos
pequenos fragmentos. O símbolo “―” indica que a espécie não foi encontrada
em nenhum dos habitats. Para detalhes da obtenção dos dados de nicho de
regeneração e tamanho de semente, veja a seção Métodos. PIO = pioneira, TS
= tolerante à sombra, P = pequeno (comprimento da semente < 0,6 cm), M =
médio (0,6-1,5 cm), G = grande (1,6-3 cm), MG = muito grande (> 3 cm)........ 73
Capítulo 3
Table 1. Results of repeated measures ANOVA. We tested the effect of
habitat type (small forest fragments vs. mature forest), distance to conspecific
tree and exclosure treatment on the percentage of predated/removed seeds of
Tapirira guianensis…………………………………………………………… 131
SUMÁRIO
1. APRESENTAÇÃO................................................................................................... 12
2. FUNDAMENTAÇÃO TEÓRICA............................................................................ 15
2.1. Diversidade de árvores em florestas tropicais................................................. 15
2.2. Mortalidade dependente da densidade e distância em árvores: o modelo
de Janzen-Connell................................................................................. ............. 16
2.2.1. Inimigos naturais............................................................................... 18
2.2.2. Fatores que podem favorecer o recrutamento próximo ao adulto
parental.................................................................................................. ..... 20
2.2.3. A discussão sobre modelo de Janzen-Connel..................................... 22
2.3. Fragmentação florestal................................................................................. 24
2.3.1. Mudanças na configuração da paisagem............................................ 25
2.3.2. Interações biológicas em paisagens fragmentadas............................. 27
2.3.3. Proliferação de plantas pioneiras e empobrecimento da flora
arbórea.................................................................................................... ..... 29
2.4. Mortalidade dependente da densidade e distância em paisagens
fragmentadas................................................................................................. ...... 31
3. REFERÊNCIAS........................................................................................................ 35
4. CAPÍTULO 1: HIPERABUNDÂNCIA DE ESPÉCIES PIONEIRAS EM
PEQUENOS REMANESCENTES DA FLORESTA ATLÂNTICA........................... 50
5. CAPÍTULO 2: DISTRIBUIÇÃO ESPACIAL DE ÁRVORES: INFERÊNCIAS
DO PAPEL DA MORTALIDADE DEPENDENTE DA DENSIDADE E
DISTÂNCIA EM UMA PAISAGEM FRAGMENTADA.......................................... 87
6. CAPÍTULO 3: SEED PREDATION IN A FRAGMENTED TROPICAL
FOREST: IS THERE A RELAXATION IN DISTANCE-DEPENDENT SEED
MORTALITY IN SMALL FOREST FRAGMENTS?................................................ 110

7. CONCLUSÕES........................................................................................................ 135
8. RESUMO.................................................................................................................. 138
9. ABSTRACT.............................................................................................................. 140
10. ANEXO................................................................................................................... 142
12
1. APRESENTAÇÃO
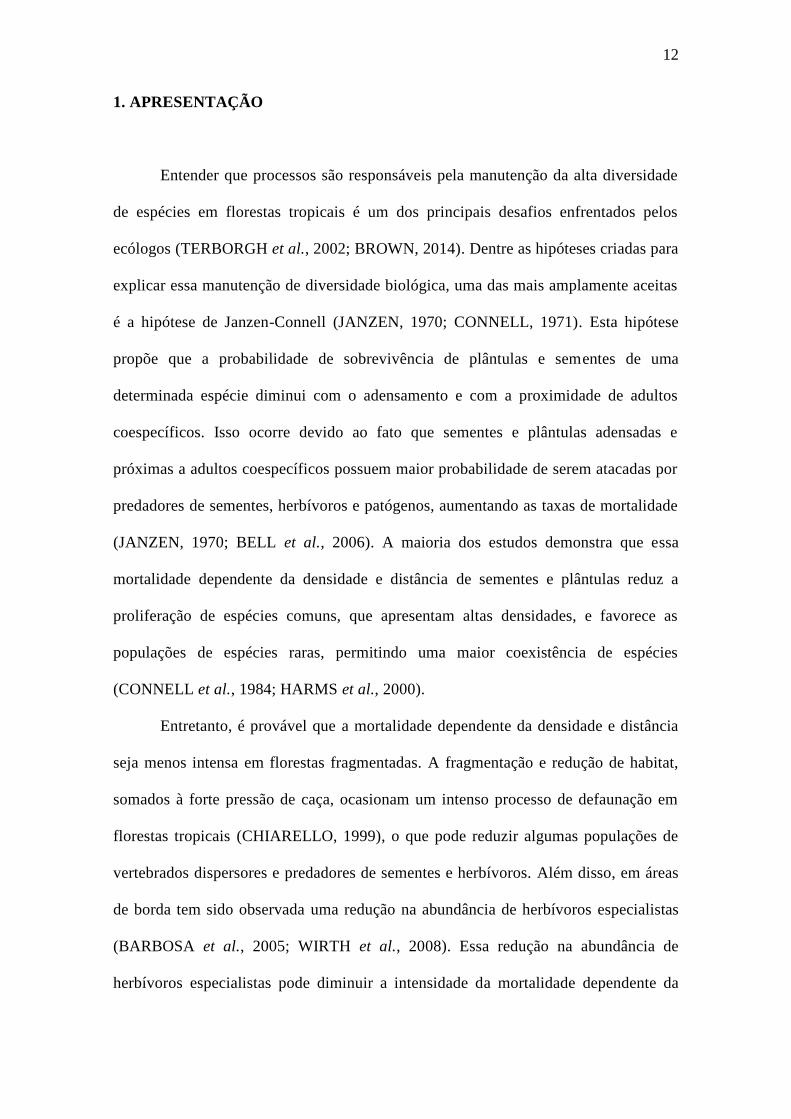
Entender que processos são responsáveis pela manutenção da alta diversidade
de espécies em florestas tropicais é um dos principais desafios enfrentados pelos
ecólogos (TERBORGH et al., 2002; BROWN, 2014). Dentre as hipóteses criadas para
explicar essa manutenção de diversidade biológica, uma das mais amplamente aceitas
é a hipótese de Janzen-Connell (JANZEN, 1970; CONNELL, 1971). Esta hipótese
propõe que a probabilidade de sobrevivência de plântulas e sementes de uma
determinada espécie diminui com o adensamento e com a proximidade de adultos
coespecíficos. Isso ocorre devido ao fato que sementes e plântulas adensadas e
próximas a adultos coespecíficos possuem maior probabilidade de serem atacadas por
predadores de sementes, herbívoros e patógenos, aumentando as taxas de mortalidade
(JANZEN, 1970; BELL et al., 2006). A maioria dos estudos demonstra que essa
mortalidade dependente da densidade e distância de sementes e plântulas reduz a
proliferação de espécies comuns, que apresentam altas densidades, e favorece as
populações de espécies raras, permitindo uma maior coexistência de espécies
(CONNELL et al., 1984; HARMS et al., 2000).
Entretanto, é provável que a mortalidade dependente da densidade e distância
seja menos intensa em florestas fragmentadas. A fragmentação e redução de habitat,
somados à forte pressão de caça, ocasionam um intenso processo de defaunação em
florestas tropicais (CHIARELLO, 1999), o que pode reduzir algumas populações de
vertebrados dispersores e predadores de sementes e herbívoros. Além disso, em áreas
de borda tem sido observada uma redução na abundância de herbívoros especialistas
(BARBOSA et al., 2005; WIRTH et al., 2008). Essa redução na abundância de
herbívoros especialistas pode diminuir a intensidade da mortalidade dependente da

13
densidade e distância, pois se os herbívoros não possuem alvos específicos, qualquer
indivíduo suscetível pode ser atacado quando a densidade de plântulas for alta, mesmo
sob a copa de adultos heteroespecíficos (JANZEN, 1970). Em uma paisagem
fragmentada na Floresta Atlântica nordestina, M. Oliveira e A. Grillo (dados não
publicados) observaram que determinadas espécies de árvores apresentam um
aumento em suas densidades em pequenos fragmentos florestais (< 100 ha). Por
exemplo, espécies como Tapirira guianensis e Schefflera morototoni apresentam
densidades aproximadamente três vezes maiores nesses pequenos fragmentos quando
comparado com porções de floresta madura no interior de um grande fragmento
(3.500 ha). Assim, é razoável pensar que as perturbações decorrentes das alterações na
paisagem possam ocasionar um relaxamento na mortalidade dependente da densidade
e distância de algumas espécies arbóreas em paisagens fragmentadas, favorecendo a
proliferação dessas espécies e, consequentemente, uma baixa diversidade biológica.
Diante do exposto, esta tese de doutorado teve como objetivo avaliar se o
aumento na densidade de determinadas espécies arbóreas em paisagens fragmentadas
pode ser resultado de um relaxamento nos mecanismos de mortalidade dependentes da
distância e densidade. Foram realizados três estudos: (1) Hiperabundância de espécies
pioneiras em pequenos remanescentes da Floresta Atlântica; (2) Distribuição espacial de
árvores: inferências do papel da mortalidade dependente da densidade e distância em
uma paisagem fragmentada; (3) Predação de sementes em uma floresta tropical
fragmentada: existe relaxamento na mortalidade de sementes dependente da distância
em pequenos fragmentos florestais? No primeiro estudo, antes de testar previsões
associadas à hipótese de Janzen-Connell, foram analisados os padrões de mudança nas
densidades populacionais, avaliando quais espécies tendem a predominar em
pequenos fragmentos florestais. Nos estudos subsequentes, foram analisadas a

14
distribuição espacial de árvores e as taxas de predação de sementes para inferir se em
pequenos fragmentos florestais existe um relaxamento no mecanismo de mortalidade
proposto pelo modelo de Janzen-Connell.
15
2. FUNDAMENTAÇÃO TEÓRICA
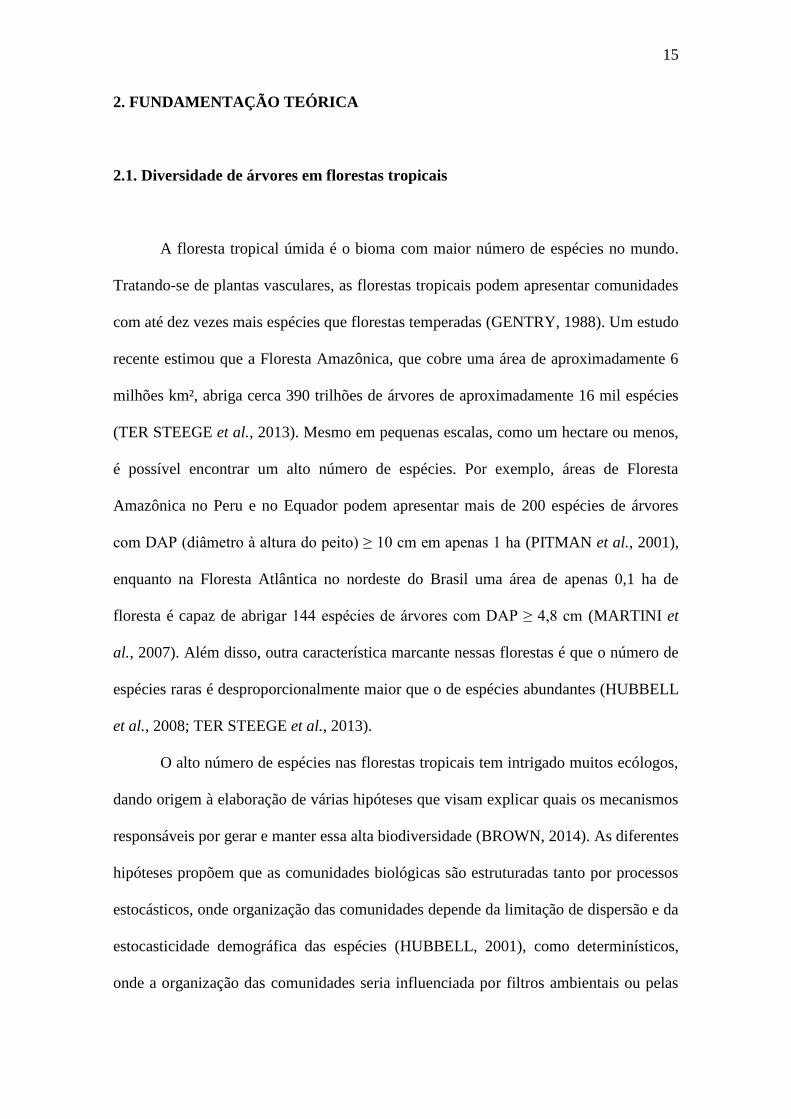
2.1. Diversidade de árvores em florestas tropicais
A floresta tropical úmida é o bioma com maior número de espécies no mundo.
Tratando-se de plantas vasculares, as florestas tropicais podem apresentar comunidades
com até dez vezes mais espécies que florestas temperadas (GENTRY, 1988). Um estudo
recente estimou que a Floresta Amazônica, que cobre uma área de aproximadamente 6
milhões km², abriga cerca 390 trilhões de árvores de aproximadamente 16 mil espécies
(TER STEEGE et al., 2013). Mesmo em pequenas escalas, como um hectare ou menos,
é possível encontrar um alto número de espécies. Por exemplo, áreas de Floresta
Amazônica no Peru e no Equador podem apresentar mais de 200 espécies de árvores
com DAP (diâmetro à altura do peito) ≥ 10 cm em apenas 1 ha (PITMAN et al., 2001),
enquanto na Floresta Atlântica no nordeste do Brasil uma área de apenas 0,1 ha de
floresta é capaz de abrigar 144 espécies de árvores com DAP ≥ 4,8 cm (MARTINI et
al., 2007). Além disso, outra característica marcante nessas florestas é que o número de
espécies raras é desproporcionalmente maior que o de espécies abundantes (HUBBELL
et al., 2008; TER STEEGE et al., 2013).
O alto número de espécies nas florestas tropicais tem intrigado muitos ecólogos,
dando origem à elaboração de várias hipóteses que visam explicar quais os mecanismos
responsáveis por gerar e manter essa alta biodiversidade (BROWN, 2014). As diferentes
hipóteses propõem que as comunidades biológicas são estruturadas tanto por processos
estocásticos, onde organização das comunidades depende da limitação de dispersão e da
estocasticidade demográfica das espécies (HUBBELL, 2001), como determinísticos,
onde a organização das comunidades seria influenciada por filtros ambientais ou pelas

16
interações entre espécies. Nestes processos determinísticos, os mecanismos são bastante
variados e a influência de cada um depende da escala espacial analisada (TERBORGH
et al., 2002).
Em escala local (hectare ou sub-hectare), uma das hipóteses mais amplamente
aceitas para explicar a alta coexistência de espécies nas florestas tropicais foi proposta
independentemente por Janzen (1970) e Connell (1971). Resumidamente, o modelo de
Janzen-Connell propõe que predadores de sementes, herbívoros e patógenos impedem o
adensamento de populações arbóreas, controlando principalmente as espécies mais
abundantes. O modelo de Janzen-Connell propõe uma explicação simples e, embora
seja um mecanismo de controle populacional, pode influenciar profundamente na
estrutura de comunidades vegetais.
2.2. Mortalidade dependente da densidade e distância em árvores: o modelo de
Janzen-Connell
O modelo de Janzen-Connell (modelo de J-C) propõe que a probabilidade de
sobrevivência de plântulas e sementes diminui com a proximidade de adultos
coespecíficos, onde essas plântulas e sementes são mais adensadas. Essa menor
probabilidade de sobrevivência se deve ao fato que plântulas e sementes que ocorrem
em altas densidades ou próximas a adultos coespecíficos possuem maior probabilidade
de serem atacadas por inimigos naturais, como predadores de sementes, herbívoros e
patógenos (JANZEN, 1970; BELL et al., 2006; YAMAZAKI et al., 2009). Dado que
a densidade de sementes é maior próximo ao adulto parental e diminui
exponencialmente com o distanciamento deste, o aumento na sobrevivência longe do
adulto parental resulta em um pico de recrutamento populacional em distâncias

17
intermediárias (Figura 1). Esse padrão de mortalidade dependente da densidade e
distância (MDDD) tem sido um dos padrões mais citados de mortalidade não aleatória
de plântulas e sementes, sendo suportado por vários estudos (CLARK & CLARK,
1984; TERBORGH et al., 1993; BELL et al., 2006; LI et al., 2009; SWAMY &
TERBORGH, 2010).
Figura 1. Modelo gráfico adaptado de Janzen (1970). A curva de recrutamento populacional
(CRP) é resultado da quantidade de sementes por unidade de área (I) pela probabilidade de
sobrevivência de sementes e plântulas (P), que aumenta com a distância para a árvore
parental.
Os mecanismos que ocasionam a MDDD em plantas são considerados um dos
principais responsáveis pela manutenção da biodiversidade em florestas tropicais
(PETERS, 2003; LEIGH et al., 2004). A maior mortalidade ao redor do adulto
parental libera espaço para o recrutamento de indivíduos heteroespecíficos, o que
permite uma maior coexistência de espécies. Além disso, esses mecanismos atuam de
forma mais intensa sobre as espécies comuns que, devido a sua grande densidade, têm
menor probabilidade de sobrevivência, resultando em uma vantagem para as espécies
raras (CONNELL et al., 1984). Uma forte evidência do efeito da MDDD na
Distância para árvore parental
Pro
babili
dade d
a s
em
ente
ou p
lântu
la d
e
atingir a
matu
ridade
Núm
ero
de s
em
ente
s p
or
unid
ade d
e á
rea
CRP
IP

18
manutenção de biodiversidade em florestas tropicais foi observada por Harms et al.
(2000). Ao compararem a chuva de sementes e o recrutamento de plântulas em
parcelas permanentes na Ilha de Barro Colorado, Panamá, esses autores observaram
uma maior diversidade de plântulas em relação às sementes, sendo esse aumento na
diversidade, em parte, explicado por um menor recrutamento de plântulas onde as
sementes coespecíficas eram mais adensadas.
Segundo Connell (1971), a MDDD seria mais intensa em plântulas do que em
sementes, pois sementes sempre possuem baixa probabilidade de sobrevivência,
independente de sua localização, devido aos múltiplos processos que contribuem para
a sua mortalidade. Além disso, esse mesmo autor afirma que a MDDD seria mais
intensa em plântulas mais jovens, pois a probabilidade de sobrevivência aumenta com
o crescimento da planta. Em uma meta-análise, Hyatt et al. (2003) analisaram estudos
com experimentos de mortalidade de sementes e plântulas publicados entre os anos de
1970 e 1998. Os resultados obtidos por esses autores demonstraram claramente uma
relação negativa entre a distância para um indivíduo adulto coespecífico e a
mortalidade de plântulas, porém, não foi observada uma relação quando analisados os
experimentos com sementes. Apesar disso, revisões da literatura feitas por Hammond
e Brow (1998) e Carson et al. (2008) demonstram vários estudos que observaram
MDDD em sementes.
2.2.1. Inimigos naturais
Vertebrados, insetos e micro-organismos patógenos têm sido sugeridos como
agentes de MDDD, e através de interações com as plantas como a predação de
sementes, a herbivoria e a infecção, esses organismos podem influenciar os padrões de

19
recrutamento, crescimento e mortalidade de plântulas (COLEY & BARONE, 1996;
NORGHAUER et al., 2006b; LI et al., 2009). Porém, estudos que confirmem o papel
desses organismos no recrutamento e sobrevivência de plântulas ainda são escassos
(Bell et al. 2006).
Tem sido observado um maior número dos estudos documentando casos de
MDDD com insetos do que com vertebrados. Em uma revisão, Hammond e Brown
(1998) observaram que, de 19 estudos com insetos, 15 mostraram evidências que
suportavam o modelo de J-C, enquanto de 27 estudos com vertebrados, apenas dois
apresentaram resultados condizentes com o modelo de J-C. Essa diferença entre
insetos e vertebrados certamente está relacionado ao modo como esses animais
forrageiam. De modo geral e ao contrário de muitos insetos, vertebrados forrageiam
por grandes áreas, exploram diferentes tipos de recurso vegetais (e.g., sementes,
folhas e frutos) e não apresentam especificidade na seleção de sementes e plântulas
(HAMMOND & BROWN, 1998; WRIGHT, 2002). Apesar disso, alguns casos de
MDDD por vertebrados têm sido documentados. Wyatt e Silman (2004), por exemplo,
observaram que as palmeiras Astrocaryum murumuru e Iriartea deltoidea
apresentavam um menor número de sementes próximas ao adulto quando o mamífero
Tayassu pecari estava presente. Dessa forma, embora não seja muito documentado, o
papel de vertebrados como agentes de MDDD não pode ser totalmente descartado.
Além disso, nos últimos anos tem crescido o número de estudos que
comprovam o papel de micro-organismos patógenos como agentes de MDDD (e.g.,
BELL et al., 2006; LI et al., 2009; YAMAZAKI et al., 2009; MANGAN et al., 2010),
sendo a maioria desses estudos focada em patógenos de solo. De acordo com Mangan
et al. (2010), patógenos de solo podem contribuir mais para MDDD de sementes e
plântulas que inimigos naturais acima do solo (i.e., vertebrados, insetos e patógenos

20
foliares). Patógenos de solo apresentam certa especificidade por seus hospedeiros,
uma vez que normalmente se concentram ao redor da planta que atacam, reduzindo o
crescimento e a sobrevivência de plântulas coespecíficas nessa área.
É importante ressaltar que independente do tipo de inimigo natural, o papel
apresentado por eles na MDDD está atrelado ao grau de especificidade pela plântula
ou semente que eles atacam (BELL et al., 2006; NORGHAUER et al., 2006a). É
esperado que ocorra MDDD quando os herbívoros e patógenos apresentam alta
especificidade pela planta. Se herbívoros e patógenos não possuem alvos específicos,
qualquer indivíduo suscetível pode ser atacado quando a densidade de sementes ou
plântulas for alta, mesmo sob a copa de adultos heteroespecíficos (JANZEN, 1970).
Janzen (1970) sugere que a MDDD deve ser mais fraca em florestas temperadas do
que em florestas tropicais, devido ao fato que herbívoros de florestas tropicais
possuem maior especificidade por determinadas espécies de plantas do que os
herbívoros de florestas temperadas. Assim, a abundância de inimigos naturais
especialistas e generalistas em um determinado local pode ser um fator determinante
na intensidade da MDDD de sementes e plântulas.
2.2.2. Fatores que podem favorecer o recrutamento próximo ao adulto parental
Alguns fatores além da distância para o adulto parental e do adensamento
podem influenciar nas taxas de mortalidade de sementes e plântulas, permitindo que
alguns indivíduos recrutem próximos à árvore parental. Um desses fatores é a
densidade de adultos coespecíficos no local. Sabe-se que, em alguns casos, o aumento
na densidade de indivíduos adultos coespecíficos pode atrair mais inimigos naturais,
aumentando as taxas de mortalidade de sementes e plântulas (NORGHAUER et al.,

21
2006a; NORGHAUER et al., 2006b). Entretanto, em locais onde uma espécie
apresenta uma densidade de árvores muito alta, é possível que ocorra uma saciação
dos inimigos naturais devido à grande quantidade de sementes produzida, o que
resultaria em um maior número de indivíduos se estabelecendo em baixo da copa do
adulto parental (SCHUPP, 1992). Além disso, essa saciação dos inimigos naturais
também pode ser ocasionada pela sincronização da produção de sementes de uma
população, o que resultaria um alto número de sementes em um determinado período
do ano (HAMMOND & BROWN, 1998).
Outro fator que pode influenciar as taxas de mortalidade é a disponibilidade de
luz. Augspurger (1983, 1984) observou que, mesmo quando ocorriam em grandes
densidades e próximas a adultos coespecíficos, plântulas em clareiras apresentavam
maiores taxas de sobrevivência que plântulas no sub-bosque. Pelo menos dois fatores
podem explicar essa maior sobrevivência em clareiras. Primeiro, o aumento na
quantidade de luz pode diminuir os impactos negativos da herbivoria por insetos, pois
nesse ambiente as plantas podem aumentar a produção de tecido foliar, compensando
rapidamente a parte consumida pelos herbívoros (HAMMOND & BROWN, 1998).
Segundo, áreas de clareiras podem apresentar uma redução na microbiota, uma vez
que a maior incidência de luz solar cria um microclima mais severo (i.e., menos
úmido e com maior temperatura) para esses micro-organismos (REINHART et al.,
2010). Dessa forma, fatores que contribuem tanto para um saciação dos inimigos
naturais bem como para um melhor desenvolvimento da plântula, podem favorecer um
maior recrutamento próximo à planta parental, demonstrado que a sobrevivência não
depende apenas da dispersão de sementes.
22
2.2.3. A discussão sobre modelo de Janzen-Connel
Desde que Janzen e Connell propuseram o seu modelo de MDDD na década de
1970, algumas críticas surgiram a esse modelo. O primeiro ponto criticado foi com
relação ao potencial do modelo de J-C em explicar a alta coexistência de espécies em
florestas tropicais. Esta crítica foi feita por Hubbell (1980) que, por meio de
modelagem, concluiu que o padrão espacial proposto pelo modelo de J-C resultaria em
uma diversidade de árvores muito menor do que a diversidade observada nas florestas
tropicais. Além disso, Hubbell argumentou que, mesmo com uma menor
probabilidade de sobrevivência, haveria um maior recrutamento embaixo da árvore
parental devido ao fato que o número de sementes presentes nesse local é muito maior
que nos locais longe da copa. No entanto, esse estudo foi posteriormente criticado por
não refutar de modo apropriado as previsões de Janzen-Connel (CLARK & CLARK,
1984). Além disso, evidências robustas da contribuição da MDDD para manutenção
da diversidade de plantas em florestas tropicais foram publicadas posteriormente (veja
HARMS et al., 2000).
Outro ponto do modelo de J-C que tem sido criticado é com relação à
especificidade dos inimigos naturais (NOVOTNY et al., 2002; NOVOTNY &
BASSET, 2005). De acordo com o modelo de J-C, a diversidade de plantas é mantida
pela ação de inimigos naturais que atacam alvos específicos (JANZEN, 1970).
Entretanto, essa especificidade por parte de insetos e patógenos em florestas tropicais
tem sido bastante contestada. Análises da comunidade de insetos mastigadores
demonstraram que a maioria deles é polífaga, atacando várias espécies de plantas
filogeneticamente aparentadas (NOVOTNY et al., 2002; NOVOTNY & BASSET,
2005). Ainda, Novotny et al. (2002) afirmam que, dado que a maioria dos gêneros de

23
plantas em florestas tropicais apresentam um grande número de espécies, é
improvável que existam muitas espécies monófagas de insetos herbívoros nessas
florestas. Esse mesmo padrão de polifagia pode ser atribuído aos patógenos, uma vez
que em um estudo com 53 espécies de fungos patogênicos no Panamá, Gilbert e Webb
(2007) observaram que apenas duas espécies de fungos atacaram uma única espécie de
planta.
Entretanto, Benítez et al. (2013) afirmam que, mesmo sendo polífagos,
patógenos podem contribuir para a manutenção da diversidade de plantas em florestas
tropicais. Esses autores sugerem que a interação entre patógenos (mesmo polífagos),
planta hospedeira e ambiente pode gerar casos de especialização efetiva que
causariam a mortalidade de uma única espécie de planta em um determinado local.
Três hipóteses foram propostas para explicar o surgimento dessas especializações: (1)
diferentes populações do mesmo patógeno podem apresentar diferentes níveis de
virulência aos hospedeiros locais; (2) a infecção simultânea por dois ou mais
patógenos pode gerar um efeito específico deletério em determinadas espécies de
planta; (3) a especialização pode ser resultado da interação entre patógenos, a genética
do hospedeiro e as condições ambientais. Todavia, estudos que comprovem a eficácia
dessa especialização do efeito para manutenção de biodiversidade ainda precisam ser
feitos.
Mesmo com estudos gerando evidências contrárias e favor do modelo de J-C
ao longo de 40 anos desde a sua publicação, este modelo continua sendo amplamente
aceito. Isso porque existem inúmeras evidências de maior mortalidade de sementes e
plântula em áreas próximas ao adulto coespecífico ou de um recrutamento condizente
com o modelo de J-C (HAMMOND & BROWN, 1998; HYATT et al., 2003;
CARSON et al., 2008).
24
Entretanto, o funcionamento desse mecanismo em florestas perturbadas ainda
não é bem compreendido. A rápida mudança mundial no uso de terra tem ocasionado
profundas alterações nas florestas tropicais, o que pode comprometer o funcionamento
desse e de outros mecanismos de manutenção de diversidade. Dado a importância do
mecanismo proposto por Janzen e Connell, é importante entender como este funciona
em florestas perturbadas, principalmente em paisagens fragmentadas, um cenário
extremamente comum nas paisagens tropicais em todo o globo.
2.3. Fragmentação florestal
O desmatamento florestal para a utilização do solo em atividades antrópicas é a
principal ameaça à biodiversidade em florestas tropicais (SALA et al., 2000),
transformando grandes áreas florestais em paisagens fragmentadas compostas por
pequenos remanescentes florestais circundados por matrizes não florestadas. Por
exemplo, a área remanescente da Floresta Atlântica representa apenas 11,7% de sua
área original (RIBEIRO et al., 2009), sendo constituída predominantemente por
fragmentos florestais menores que 50 ha e circundados principalmente por matrizes de
pasto ou monoculturas (RANTA et al., 1998; RIBEIRO et al., 2009). Essa conversão
drástica da paisagem tem resultado em uma série de efeitos em cascata que culminam
na modificação dos padrões de organização das comunidades biológicas. Em síntese, a
alteração na configuração da paisagem reduz, divide, isola e extingue populações de
plantas e animais (BIERREGAARD et al., 2001), além de ocasionar alterações no
microclima (PINTO et al., 2010), na composição de espécies e nas interações entre
elas (MURCIA, 1995) e facilitar atividades humanas como a caça predatória e a
extração de ilegal de madeira (TABARELLI et al., 2004). Como consequência,

25
florestas fragmentadas têm apresentado uma flora arbórea empobrecida, distinta
taxonomicamente e funcionalmente da flora original (LAURANCE et al., 2006a;
SANTOS et al., 2008).
2.3.1. Mudanças na configuração da paisagem
Fragmentação de habitat per se é um termo que remete apenas a divisão do
habitat, sem que ocorram perdas em sua quantidade (FAHRIG, 2003). Entretanto,
durante a transformação de uma paisagem contínua em uma paisagem fragmentada
sempre ocorre perda de habitat. Esse processo de perda e fragmentação de habitat
resulta em uma mudança na configuração da paisagem, onde três efeitos são
observados: aumento no número de manchas florestais, redução no tamanho dessas
manchas e aumento no isolamento das manchas (FAHRIG, 2003). Em conjunto, esses
efeitos podem impactar negativamente as assembleias arbóreas, uma vez que habitat
menores e mais isolados tendem a manter um menor número de espécies (BENÍTEZ-
MALVIDO & MARTÍNEZ-RAMOS, 2003; LAURANCE, 2008).
Todavia, o isolamento e a redução no tamanho dos fragmentos florestais não
são os únicos fatores na paisagem que influenciam as assembleias arbóreas. O tipo de
matriz, por exemplo, pode exercer uma forte influência sobre a composição de
espécies arbóreas (LAURANCE, 2008). O tipo de matriz pode limitar a dispersão de
sementes entre fragmentos, seja porque algumas espécies de aves, por exemplo, não
conseguem voar por distâncias muito longas, ou porque em paisagens com matrizes
muito abertas, como áreas de pasto, alguns animais não voadores evitam sair do
fragmento, uma vez que podem ficar muito expostos a predadores (veja LAURANCE
et al., 2002). Além disso, o tipo de matriz também pode influenciar diretamente nos
26
efeitos de borda, dado que quanto maior o contraste entre o fragmento florestal e a
matriz, maior a magnitude desses efeitos (HARPER et al., 2005).
Outro fator resultante da fragmentação e perda de habitat que é extremamente
nocivo à biodiversidade é a criação de novas bordas florestais. O aumento na
quantidade de áreas de borda tem provocado uma série de alterações abióticas e
bióticas nos remanescentes florestais, conhecidas como efeitos de borda (MURCIA,
1995; HARPER et al., 2005). A criação de bordas representa uma das principais
fontes de impactos para as assembleias arbóreas em florestas fragmentadas, reduzindo
quase pela metade a riqueza de espécies (OLIVEIRA et al., 2004). Em termos
abióticos, áreas de borda recebem uma maior quantidade de luz e apresentam um
microclima com temperaturas mais elevadas, menor umidade do ar e do solo e maior
déficit de pressão de vapor que áreas no interior da floresta (KAPOS, 1989), criando
um ambiente desfavorável para muitas espécies típicas de áreas sombreadas da
floresta. Como resultado, bordas florestais têm apresentado mudanças na composição
de espécies e, consequentemente, nas interações biológicas (LAURANCE et al.,
2002).
Um dos principais efeitos da criação de bordas sobre as assembleias arbóreas é o
aumento nas taxas de mortalidade (MÉRONA & HUTCHINGS, 2001). Além das
alterações nas condições microclimáticas, áreas de borda apresentam um aumento na
turbulência ocasionada pelos ventos, que tem sido responsável pela quebra de troncos
ou por arrancar as árvores do solo (D'ANGELO et al., 2004), resultando principalmente
na mortalidade de árvores de grande porte (LAURANCE et al., 2000).
Consequentemente, áreas de borda tendem a apresentar flora com menor estatura,
troncos com menor diâmetro e menos densos (LAURANCE et al., 2006a; OLIVEIRA
et al., 2008). Adicionalmente, o aumento na densidade de lianas em áreas próximas a

27
borda contribuem para a uma maior mortalidade de árvores. Lianas são parasitas
estruturais que se apoiam nas árvores para atingir o dossel, gerando estresse físico para
a árvore e um aumento na competição por luz, o que pode resultar em uma diminuição
nas taxas de crescimento e sobrevivência das árvores utilizadas como suporte
(LAURANCE et al., 2001).
Além da mortalidade de árvores, as alterações na composição das assembleias
arbóreas em áreas de borda são resultado de modificações no padrão de recrutamento.
Primeiro, o ambiente com maior luminosidade e mais seco favorece o recrutamento de
espécies pioneiras nas bordas (LAURANCE et al., 1998; SIZER & TANNER, 1999).
Além disso, a própria modificação na flora arbórea pode alterar a composição da chuva
de sementes, diminuindo a probabilidade de recrutamento de espécies típicas do interior
da floresta (MELO et al., 2006). Por último, a maior queda de árvores e o maior
acúmulo de serrapilheira nas bordas aumentam as taxas de mortalidade de plântulas
(AGUIAR & TABARELLI, 2010) e diminuem as taxas de germinação de sementes
(BRUNA, 1999). Consequentemente, áreas afetadas pela borda apresentam assembleias
de plântulas com menor densidade de indivíduos (BENÍTEZ-MALVIDO, 1998) e
composição florística distinta daquelas encontradas no interior da floresta (SANTO-
SILVA et al., 2013).
2.3.2. Interações biológicas em paisagens fragmentadas
As mudanças na composição das assembleias arbóreas em paisagens
fragmentadas também são resultados de alterações em algumas interações biológicas.
A redução de habitat bem como a caça tem ocasionado um processo defaunação em
florestas tropicais, reduzindo a abundância ou extinguindo localmente muitas
28
populações de vertebrados de médio e grande porte (CHIARELLO, 1999; DA SILVA
& MENDES PONTES, 2008; CANALE et al., 2012). Através de processos como a
dispersão e predação de sementes e a herbivoria, vertebrados influenciam na
localização e sobrevivência de sementes e plântulas (COLEY & BARONE, 1996;
CRAWLEY, 2000; CORDEIRO & HOWE, 2001; MELO et al., 2009). Dentre as
interações entre vertebrados e planta afetadas pelas mudanças na configuração da
paisagem, uma das mais documentadas é a dispersão de sementes (SILVA &
TABARELLI, 2000; MELO et al., 2006; CRAMER et al., 2007). Vertebrados
frugívoros são essenciais para a dispersão de muitas espécies com sementes grandes, e
a ausência desses animais resulta na formação de uma flora composta
predominantemente por espécies com sementes pequenas (MELO et al., 2007; MELO
et al., 2010), dispersas abioticamente (CORDEIRO & HOWE, 2001) ou por vetores
que não são afetados pela fragmentação, tais como alguns morcegos (BERNARD &
FENTON, 2003; GORRESEN & WILLIG, 2004; WILLIG et al., 2007). Embora a
redução de grandes vertebrados também possa reduzir a predação de sementes grandes
(DIRZO et al., 2007), essa liberação ecológica parece não favorecer espécies com tais
sementes em paisagens fragmentadas (SANTOS et al., 2008; MELO et al., 2010;
SANTO-SILVA et al., 2013).
Outro tipo de interação bastante estudado em paisagens fragmentadas são as
interações entre plantas e herbívoros. Em uma revisão de 55 artigos que avaliaram
diferenças na abundância de herbívoros ou nos danos causados pela herbivoria, Wirth
et al. (2008) observaram que muitos herbívoros se beneficiam da criação de bordas,
aumentando sua abundancia e ocasionando uma maior herbivoria nessas áreas da
floresta. Na Floresta Atlântica nordestina, esse aumento na herbivoria tem sido
observado para formigas cortadeiras do gênero Atta, que ocasionam uma herbivoria
29
duas vezes maior na borda que no interior da floresta (URBAS et al., 2007), alterando
os padrões de recrutamento de plântulas (CORRÊA et al., 2010). Entretanto, é
importante ressaltar que esse padrão de incremento de herbívoros em áreas afetadas
pela borda parece se resumir a herbívoros generalistas, sendo a abundância de
herbívoros especialistas reduzida nesse ambiente (BARBOSA et al., 2005; WIRTH et
al., 2008).
Por último, paisagens fragmentadas também demonstram alterações nas
interações entre plantas e micro-organismos. Estudos com plântulas de espécies
lenhosas e com herbáceas demonstraram que fungos patogênicos causam mais danos
foliares em áreas de borda que no interior da floresta (BENÍTEZ-MALVIDO &
LEMUS-ALBOR, 2005; SANTOS & BENITEZ-MALVIDO, 2012). É importante
ressaltar que estudos sobre interações entre plantas e micro-organismos em paisagens
fragmentadas ainda são escassos, sendo os estudos existentes focados principalmente
em patógenos que atacam as folhas.
2.3.3. Proliferação de plantas pioneiras e empobrecimento da flora arbórea
Devido à fragmentação e perda de habitat, as assembleias arbóreas em
paisagens fragmentadas de floresta tropical têm sofrido um forte processo de perda de
espécies (BENÍTEZ-MALVIDO & MARTÍNEZ-RAMOS, 2003; LAURANCE et al.,
2006a). Além de uma redução na biomassa (PAULA et al., 2011), as assembleias
arbóreas em pequenos fragmentos apresentam uma perda não aleatória de espécie,
onde espécies típicas de floresta madura (i.e., espécies tolerantes à sombra e com
sementes grandes) têm sido substituídas por espécies típicas de áreas perturbadas (i.e,
espécies pioneiras com sementes pequenas) (TABARELLI et al., 2012). Uma vez que

30
as paisagens tropicais são compostas por pequenos fragmentos florestais, essa perda
não aleatória de espécies tem aumentado a similaridade florística em escala regional,
ocasionando uma homogeneização biótica (LÔBO et al., 2011).
Indubitavelmente, o incremento na abundância relativa de espécies pioneiras é
a principal mudança nas assembleias arbóreas em paisagens fragmentadas
(TABARELLI et al., 2012). Na Floresta Atlântica nordestina, quase 80% das árvores
em pequenos fragmentos são pioneiras (SANTOS et al., 2008), enquanto em áreas de
floresta contínua na Amazônia, essas árvores representam apenas 2-3% da flora
(LAURANCE et al., 2006b). Aparentemente, a flora desses fragmentos florestais
apresenta uma trajetória sucessional alternativa, se “deslocando” para um estágio
inicial de sucessão ecológica (TABARELLI et al., 2008; PÜTZ et al., 2011). Essa
sucessão alternativa seria resultado principalmente das constantes alterações
microclimáticas e na maior penetração de luz ocasionadas pelo aumento na quantidade
de bordas, que criaria um ambiente favorável para a proliferação e ciclos de auto-
substituição de plantas pioneiras (TABARELLI et al., 2008). Evidências que
suportam essa ideia foram encontradas por Santo-Silva et al. (2013), ao constatarem
que assembleias de plântulas, além de serem dominadas por espécies pioneiras (75%
das espécies), continham apenas metade do número de espécies observadas nas
assembleias de árvores adultas.
Como consequência, essa substituição da flora madura por uma flora dominada
por espécies pioneiras tem culminado na perda de vários atributos e grupos
ecológicos. Fragmentos dominados por árvores pioneiras apresentam uma redução de
espécies com flores grandes e polinizadas por vertebrados (GIRÃO et al., 2007;
LOPES et al., 2009), espécies perenifólias, com floração e frutificação supra-anual
(TABARELLI et al., 2010) e espécies com madeira densa (MICHALSKI et al., 2007).

31
Adicionalmente, áreas de borda demonstram uma redução na diversidade filogenética
(SANTOS et al., 2010). Esses resultados indicam que paisagens fragmentadas tendem
a reter apenas um subgrupo de flora presente em áreas de floresta madura, sendo essa
flora simplificada em termos taxonômicos, funcionais e filogenéticos.
2.4. Mortalidade dependente da densidade e distância em paisagens
fragmentadas
Os mecanismos de MDDD propostos pelo modelo de J-C podem ser afetados
por fatores de origem antrópica (TERBORGH, 2013). Dado o papel imprescindível
prestado pelos inimigos naturais como reguladores da densidade populacional de
muitas espécies, atividades antrópicas como a caça podem ser consideradas uma das
principais ameaças a manutenção de biodiversidade em florestas tropicais
(REDFORD, 1992). Levando em consideração o modelo gráfico desenvolvido por
Janzen (1970; Figura 1), a defaunação pode alterar tanto a curva de dispersão de
sementes como a curva de sobrevivência. Primeiro, a redução de vertebrados
frugívoros pode reduzir a curva dispersão, aumentando a densidade de sementes ao
redor da árvore parental (WRIGHT, 2003). Segundo, a defaunação pode reduzir o
número de predadores de sementes e herbívoros, aumentando as taxas sobrevivência
nas áreas próximas ao adulto parental (SILMAN et al., 2003). Em conjunto, a redução
nas curvas de dispersão e o aumento nas taxas de sobrevivência poderiam resultar em
uma curva de recrutamento populacional mais próxima ao adulto parental,
aumentando a densidade populacional naquele local (Figura 2).
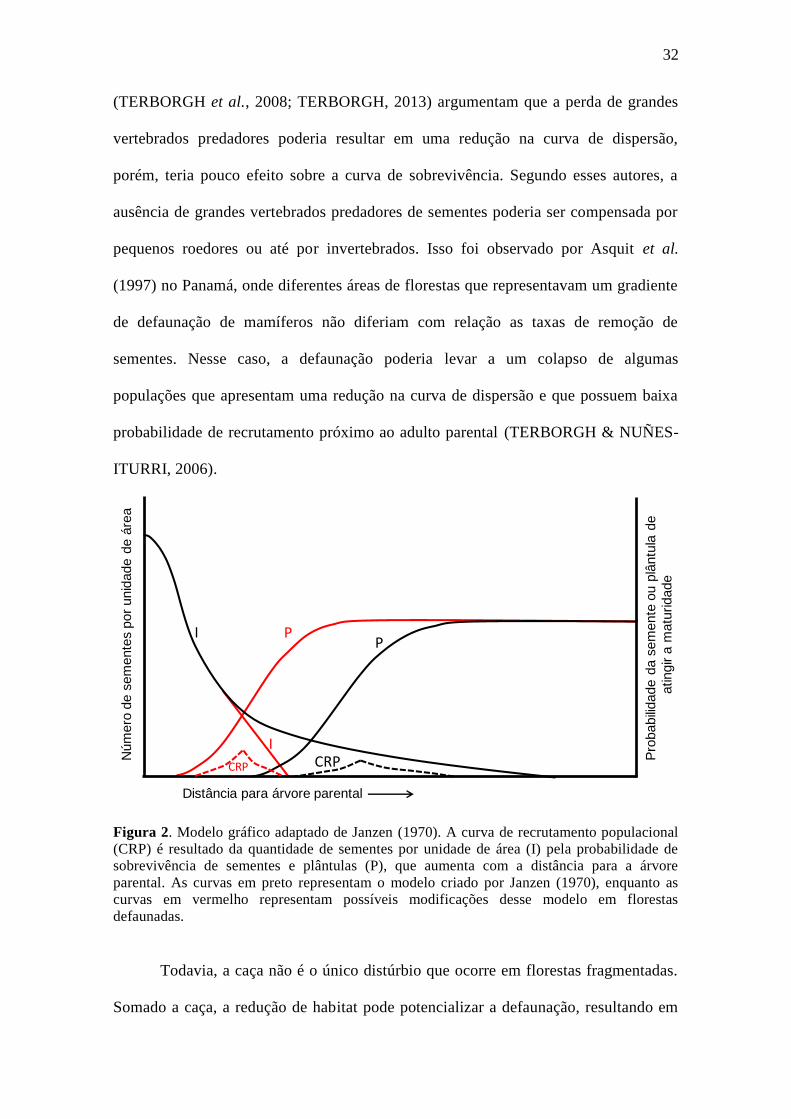
Entretanto, esse possível aumento nas taxas de sobrevivência em áreas
defaunadas tem sido contestada por alguns autores. Terborgh e seus colaboradores
32
(TERBORGH et al., 2008; TERBORGH, 2013) argumentam que a perda de grandes
vertebrados predadores poderia resultar em uma redução na curva de dispersão,
porém, teria pouco efeito sobre a curva de sobrevivência. Segundo esses autores, a
ausência de grandes vertebrados predadores de sementes poderia ser compensada por
pequenos roedores ou até por invertebrados. Isso foi observado por Asquit et al.
(1997) no Panamá, onde diferentes áreas de florestas que representavam um gradiente
de defaunação de mamíferos não diferiam com relação as taxas de remoção de
sementes. Nesse caso, a defaunação poderia levar a um colapso de algumas
populações que apresentam uma redução na curva de dispersão e que possuem baixa
probabilidade de recrutamento próximo ao adulto parental (TERBORGH & NUÑES-
ITURRI, 2006).
Figura 2. Modelo gráfico adaptado de Janzen (1970). A curva de recrutamento populacional
(CRP) é resultado da quantidade de sementes por unidade de área (I) pela probabilidade de
sobrevivência de sementes e plântulas (P), que aumenta com a distância para a árvore
parental. As curvas em preto representam o modelo criado por Janzen (1970), enquanto as
curvas em vermelho representam possíveis modificações desse modelo em florestas
defaunadas.
Todavia, a caça não é o único distúrbio que ocorre em florestas fragmentadas.
Somado a caça, a redução de habitat pode potencializar a defaunação, resultando em
Distância para árvore parental
Pro
babili
dade d
a s
em
ente
ou p
lântu
la d
e
atingir a
matu
ridade
Núm
ero
de s
em
ente
s p
or
unid
ade d
e á
rea
CRP
IP
CRP
P
I
33
uma redução de vários grupos de vertebrados, incluindo roedores (CHIARELLO,
1999). Além disso, locais perturbados podem apresentar alterações na composição de
insetos, onde uma fauna especialista é substituída por uma generalista
(TSCHARNTKE et al., 2002), o que tem sido observado nas áreas de bordas
(BARBOSA et al., 2005; WIRTH et al., 2008). É provável que essas alterações na
fauna em florestas fragmentadas resultem em uma maior sobrevivência de sementes e
plântulas próximas ao adulto parental.
Além disso, algumas características apresentadas por assembleias arbóreas em
uma paisagem fragmentada na Floresta Atlântica nordestina indicam que pode haver um
relaxamento na MDDD. Primeiro, as assembleias arbóreas apresentam um baixo
número de espécies em uma escala de sub-hectare, sendo aproximadamente dois terços
do número observado nas assembleias de áreas de floresta madura em um grande
remanescente (SANTOS et al., 2008). Segundo, algumas espécies pioneiras
apresentam densidades aproximadamente três vezes maiores em pequenos fragmentos
que em áreas no maior remanescente (M. Oliveira & A. Grillo, dados não publicados).
Por último, estudos com assembleias de plântulas arbóreas demonstraram uma redução
significativa no número de espécies raras em pequenos fragmentos (SANTO-SILVA et
al., 2013). Dessa forma, é provável que a estruturação de assembleias arbóreas em
pequenos fragmentos florestais seja resultado de relaxamentos em MDDD. Dado que o
processo de fragmentação de habitat tem ocorrido em várias áreas de floresta tropical
em todo globo, é fundamental entender como os mecanismos de manutenção de
espécie funcionam nessas florestas.
Assim, para um melhor entendimento a respeito do funcionamento dos
mecanismos de MDDD em paisagens fragmentadas de floresta tropical, realizei três
estudos que compões esta tese de doutorado. Nestes estudos busquei encontrar
34
evidências que indiquem um possível relaxamento em mecanismos de MDDD em uma
paisagem severamente fragmentada de floresta Atlântica no nordeste do Brasil. De
modo geral, avaliei (1) quais espécies tendem a apresentar um incremento em suas
densidades populacionais em pequenos fragmentos florestais; (2) se indivíduos
arbóreos jovens recrutam mais próximos de adultos coespecíficos e se existe uma
maior agregação espacial de populações em pequenos fragmentos florestais; e (3) se
existe uma diminuição na predação de sementes próximas a adultos coespecíficos em
pequenos fragmentos florestais. Em conjunto, esses estudos contribuem tanto para a
discussão a respeito do modelo proposto por Janzen e Connell, como para um melhor
entendimento dos mecanismos estruturadores de assembleias arbóreas em paisagens
fragmentadas de floresta tropical.
35
3. REFERÊNCIAS
AGUIAR, A.V. & TABARELLI, M. Edge effects and seedling bank depletion: the role
played by the early successional palm Attalea oleifera (Arecaceae) in the
Atlantic Forest. Biotropica, v. 42, p. 158-166. 2010.
ASQUITH, N.M.; WRIGHT, S.J. & CLAUSS, M.J. Does mammal community
composition control recruitment in neotropical forests? Evidence from Panama.
Ecology, v. 78, p. 941-946. 1997.
AUGSPURGER, C.K. Seed dispersal of the tropical tree, Platypodium elegans, and the
escape of its seedlings from fungal pathogens. Journal of Ecology, v. 71, p.
759-771. 1983.
AUGSPURGER, C.K. Seedling survival of tropical tree species - interactions of
dispersal distance, light-gaps, and pathogens. Ecology, v. 65, p. 1705-1712.
1984.
BARBOSA, V.S.; LEAL, I.R.; IANNUZZI, L. & ALMEIDA-CORTEZ, J. Distribution
pattern of herbivorous insects in a remnant of Brazilian Atlantic forest.
Neotropical Entomology, v. 34, p. 701-711. 2005.
BELL, T.; FRECKLETON, R.P. & LEWIS, O.T. Plant pathogens drive density-
dependent seedling mortality in a tropical tree. Ecology Letters, v. 9, p. 569-
574. 2006.
BENÍTEZ-MALVIDO, J. Impact of forest fragmentation on seedling abundance in a
tropical rain forest. Conservation Biology, v. 12, p. 380-389. 1998.
BENÍTEZ-MALVIDO, J. & LEMUS-ALBOR, A. The seedling community of tropical
rain forest edges and its interaction with herbivores and pathogens. Biotropica,
v. 37, p. 301-313. 2005.

36
BENÍTEZ-MALVIDO, J. & MARTÍNEZ-RAMOS, M. Impact of forest fragmentation
on understory plant species richness in Amazonia. Conservation Biology, v. 17,
p. 389-400. 2003.
BENÍTEZ, M.-S.; HERSH, M.H.; VILGALYS, R. & CLARK, J.S. Pathogen regulation
of plant diversity via effective specialization. Trends in ecology & evolution, v.
28, p. 705-711. 2013.
BERNARD, E. & FENTON, M.B. Bat mobility and roosts in a fragmented landscape in
central Amazonia, Brazil. Biotropica, v. 35, p. 262-277. 2003.
BIERREGAARD, R.O.; GASCON, C.; LOVEJOY, T.E. & MESQUITA, R.C.G.
Lessons from Amazonia: the ecology and conservation of a fragmented
forest. Yale University Press, New Haven. 2001.
BROWN, J.H. Why are there so many species in the tropics? Journal of
Biogeography, v. 41, p. 8-22. 2014.
BRUNA, E.M. Biodiversity - Seed germination in rainforest fragments. Nature, v. 402,
p. 139-139. 1999.
CANALE, G.R.; PERES, C.A.; GUIDORIZZI, C.E.; GATTO, C.A.F. & KIERULFF,
M.C.M. Pervasive Defaunation of Forest Remnants in a Tropical Biodiversity
Hotspot. Plos One, v. 7. 2012.
CARSON, W.P.; ANDERSON, J.T.; LEIGH, E.G. & SCHNITZER, S.A. Challenges
associated with testing and falsifying the Janzen-Connell hypothesis: a review
and critique. In: (eds) Carson, W.P. & Schnitzer, S.A. Tropical forest
community ecology. Wiley-Blackwell, Oxford, pp. 210-241. 2008.
CHIARELLO, A.G. Effects of fragmentation of the Atlantic forest on mammal
communities in south-eastern Brazil. Biological Conservation, v. 89, p. 71-82.
1999.

37
CLARK, D.A. & CLARK, D.B. Spacing dynamics of a tropical rain-forest tree:
evaluation of the Janzen-Connell model. American Naturalist, v. 124, p. 769-
788. 1984.
COLEY, P.D. & BARONE, J.A. Herbivory and plant defenses in tropical forests.
Annual Review of Ecology and Systematics, v. 27, p. 305-335. 1996.
CONNELL, J.H. On the role of natural enemies in preventing competitive exclusion in
some marine animals and in rain forest trees. In: (eds) J., d.B.P. & Gradwell,
G.R. Dynamics of populations. Centre for Agricultural Publishing and
Documentation, Wageningen, pp. 298-313. 1971.
CONNELL, J.H.; TRACEY, J.G. & WEBB, L.J. Compensatory recruitment, growth,
and mortality as factors maintaining rain-forest tree diversity. Ecological
Monographs, v. 54, p. 141-164. 1984.
CORDEIRO, N.J. & HOWE, H.F. Low recruitment of trees dispersed by animals in
African forest fragments. Conservation Biology, v. 15, p. 1733-1741. 2001.
CORRÊA, M.M.; SILVA, P.S.D.; WIRTH, R.; TABARELLI, M. & LEAL, I.R. How
leaf-cutting ants impact forests: drastic nest effects on light environment and
plant assemblages. Oecologia, v. 162, p. 103-115. 2010.
CRAMER, J.M.; MESQUITA, R.C.G. & WILLIAMSON, G.B. Forest fragmentation
differentially affects seed dispersal of large and small-seeded tropical trees.
Biological Conservation, v. 137, p. 415-423. 2007.
CRAWLEY, M.J. Seed predators and plant population dynamics. In: ed. Fenner, M.
Seeds: The ecology of regeneration in plant communities. University of
Southampton, Southampton, pp. 167-182. 2000.
38
D'ANGELO, S.A.; ANDRADE, A.C.S.; LAURANCE, S.G.; LAURANCE, W.F. &
MESQUITA, R.C.G. Inferred causes of tree mortality in fragmented and intact
Amazonian forests. Journal of Tropical Ecology, v. 20, p. 243-246. 2004.
DA SILVA, A.P., JR. & MENDES PONTES, A.R. The effect of a mega-fragmentation
process on large mammal assemblages in the highly-threatened Pernambuco
Endemism Centre, north-eastern Brazil. Biodiversity and Conservation, v. 17,
p. 1455-1464. 2008.
DIRZO, R.; MENDOZA, E. & ORTIZ, P. Size-related differential seed predation in a
heavily defaunated neotropical rain forest. Biotropica, v. 39, p. 355-362. 2007.
FAHRIG, L. Effects of habitat fragmentation on biodiversity. Annual Review of
Ecology Evolution and Systematics, v. 34, p. 487-515. 2003.
GENTRY, A.H. Changes in plant community diversity and floristic composition on
environmental and geographical gradients. Annals of the Missouri Botanical
Garden, v. 75, p. 1-34. 1988.
GILBERT, G.S. & WEBB, C.O. Phylogenetic signal in plant pathogen-host range.
Proceedings of the National Academy of Sciences of the United States of
America, v. 104, p. 4979-4983. 2007.
GIRÃO, L.C.; LOPES, A.V.; TABARELLI, M. & BRUNA, E.M. Changes in tree
reproductive traits reduce functional diversity in a fragmented Atlantic Forest
landscape. Plos One, v. 2, p. e908. 2007.
GORRESEN, P.M. & WILLIG, M.R. Landscape responses of bats to habitat
fragmentation in Atlantic forest of Paraguay. Journal of Mammalogy, v. 85, p.
688-697. 2004.
HAMMOND, D.S. & BROWN, V.K. Disturbance, phenology and lifehistory
characteristics: factors influencing distance/density dependent attack on tropical
39
seeds and seedlings. In: (eds) M., N.D., T., P.H.H. & D., B.N. Dynamics of
tropical communities. Blackwell, Oxford, pp. 51-78. 1998.
HARMS, K.E.; WRIGHT, S.J.; CALDERON, O.; HERNANDEZ, A. & HERRE, E.A.
Pervasive density-dependent recruitment enhances seedling diversity in a
tropical forest. Nature, v. 404, p. 493-495. 2000.
HARPER, K.A.; MACDONALD, S.E.; BURTON, P.J.; CHEN, J.Q.; BROSOFSKE,
K.D.; SAUNDERS, S.C.; EUSKIRCHEN, E.S.; ROBERTS, D.; JAITEH, M.S.
& ESSEEN, P.A. Edge influence on forest structure and composition in
fragmented landscapes. Conservation Biology, v. 19, p. 768-782. 2005.
HUBBELL, S.P. Seed predation and the coexistence of tree species in tropical forests.
Oikos, v. 35, p. 214-229. 1980.
HUBBELL, S.P. The unified neutral theory of biodiversity and biogeography.
Princeton University Press, Princeton. 2001.
HUBBELL, S.P.; HE, F.; CONDIT, R.; BORDA-DE-AGUA, L.; KELLNER, J. & TER
STEEGE, H. How many tree species and how many of them are there in the
Amazon will go extinct? Proceedings of the National Academy of Sciences of
the United States of America, v. 105, p. 11498-11504. 2008.
HYATT, L.A.; ROSENBERG, M.S.; HOWARD, T.G.; BOLE, G.; FANG, W.;
ANASTASIA, J.; BROWN, K.; GRELLA, R.; HINMAN, K.; KURDZIEL, J.P.
& GUREVITCH, J. The distance dependence prediction of the Janzen-Connell
hypothesis: a meta-analysis. Oikos, v. 103, p. 590-602. 2003.
JANZEN, D.H. Herbivores and number of tree species in tropical forests. American
Naturalist, v. 104, p. 501-&. 1970.
KAPOS, V. Effects of isolation on the water status of forest patches in the Brazilian
Amazon. Journal of Tropical Ecology, v. 5, p. 173-185. 1989.

40
LAURANCE, W.F. Theory meets reality: How habitat fragmentation research has
transcended island biogeographic theory. Biological Conservation, v. 141, p.
1731-1744. 2008.
LAURANCE, W.F.; DELAMONICA, P.; LAURANCE, S.G.; VASCONCELOS, H.L.
& LOVEJOY, T.E. Conservation - Rainforest fragmentation kills big trees.
Nature, v. 404, p. 836-836. 2000.
LAURANCE, W.F.; FERREIRA, L.V.; RANKIN-DE MERONA, J.M.; LAURANCE,
S.G.; HUTCHINGS, R.W. & LOVEJOY, T.E. Effects of forest fragmentation
on recruitment patterns in Amazonian tree communities. Conservation Biology,
v. 12, p. 460-464. 1998.
LAURANCE, W.F.; LOVEJOY, T.E.; VASCONCELOS, H.L.; BRUNA, E.M.;
DIDHAM, R.K.; STOUFFER, P.C.; GASCON, C.; BIERREGAARD, R.O.;
LAURANCE, S.G. & SAMPAIO, E. Ecosystem decay of Amazonian forest
fragments: A 22-year investigation. Conservation Biology, v. 16, p. 605-618.
2002.
LAURANCE, W.F.; NASCIMENTO, H.E.M.; LAURANCE, S.G.; ANDRADE, A.;
RIBEIRO, J.E.L.; GIRALDO, J.P.; LOVEJOY, T.E.; CONDIT, R.; CHAVE, J.;
HARMS, K.E. & D'ANGELO, S.A. Rapid decay of tree-community
composition in Amazonian forest fragments. Proceedings of the National
Academy of Sciences, v. 103, p. 19010–19014. 2006a.
LAURANCE, W.F.; NASCIMENTO, H.E.M.; LAURANCE, S.G.; ANDRADE, A.C.;
FEARNSIDE, P.M.; RIBEIRO, J.E.L. & CAPRETZ, R.L. Rain forest
fragmentation and the proliferation of successional trees. Ecology, v. 87, p. 469-
482. 2006b.
41
LAURANCE, W.F.; PEREZ-SALICRUP, D.; DELAMONICA, P.; FEARNSIDE,
P.M.; D'ANGELO, S.; JEROZOLINSKI, A.; POHL, L. & LOVEJOY, T.E. Rain
forest fragmentation and the structure of Amazonian liana communities.
Ecology, v. 82, p. 105-116. 2001.
LEIGH, E.G.; DAVIDAR, P.; DICK, C.W.; PUYRAVAUD, J.P.; TERBORGH, J.;
TER STEEGE, H. & WRIGHT, S.J. Why do some tropical forests have so many
species of trees? Biotropica, v. 36, p. 447-473. 2004.
LI, R.; YU, S.; WANG, Y.; STAEHELIN, C. & ZANG, R. Distance-dependent effects
of soil-derived biota on seedling survival of the tropical tree legume Ormosia
semicastrata. Journal of Vegetation Science, v. 20, p. 527-534. 2009.
LÔBO, D.; LEÃO, T.; MELO, F.P.L.; SANTOS, A.M.M. & TABARELLI, M. Forest
fragmentation drives Atlantic forest of northeastern Brazil to biotic
homogenization. Diversity and Distributions, v. 17, p. 287-296. 2011.
LOPES, A.V.; GIRAO, L.C.; SANTOS, B.A.; PERES, C.A. & TABARELLI, M. Long-
term erosion of tree reproductive trait diversity in edge-dominated Atlantic
forest fragments. Biological Conservation, v. 142, p. 1154-1165. 2009.
MANGAN, S.A.; SCHNITZER, S.A.; HERRE, E.A.; MACK, K.M.L.; VALENCIA,
M.C.; SANCHEZ, E.I. & BEVER, J.D. Negative plant-soil feedback predicts
tree-species relative abundance in a tropical forest. Nature, v. 466, p. 752-U710.
2010.
MARTINI, A.M.Z.; FIASCHI, P.; AMORIM, A.M. & DA PAIXAO, J.L. A hot-point
within a hot-spot: a high diversity site in Brazil's Atlantic Forest. Biodiversity
and Conservation, v. 16, p. 3111-3128. 2007.

42
MELO, F.P.L.; DIRZO, R. & TABARELLI, M. Biased seed rain in forest edges:
Evidence from the Brazilian Atlantic forest. Biological Conservation, v. 132, p.
50-60. 2006.
MELO, F.P.L.; LEMIRE, D. & TABARELLI, M. Extirpation of large-seeded seedlings
from the edge of a large Brazilian Atlantic forest fragment. Ecoscience, v. 14, p.
124-129. 2007.
MELO, F.P.L.; MARTINEZ-SALAS, E.; BENITEZ-MALVIDO, J. & CEBALLOS, G.
Forest fragmentation reduces recruitment of large-seeded tree species in a semi-
deciduous tropical forest of southern Mexico. Journal of Tropical Ecology, v.
26, p. 35-43. 2010.
MELO, F.P.L.; RODRIGUEZ-HERRERA, B.; CHAZDON, R.L.; MEDELLIN, R.A. &
CEBALLOS, G.G. Small Tent-Roosting Bats Promote Dispersal of Large-
Seeded Plants in a Neotropical Forest. Biotropica, v. 41, p. 737-743. 2009.
MÉRONA, J.M.R. & HUTCHINGS, R.W. Deforestation effects at the edge of an
Amazonian forest fragment: tree mortality, damage, and recruitment. In: (eds)
Bierregaard, R.O., Gascon, C., Lovejoy, T.E. & Mesquita, R.C.G. Lessons from
Amazonia: the ecology and conservation of a fragmented forest. Yale
University Press, New Haven, pp. 107 - 120. 2001.
MICHALSKI, F.; NISHI, I. & PERES, C.A. Disturbance-mediated drift in tree
functional groups in Amazonian forest fragments. Biotropica, v. 39, p. 691-701.
2007.
MURCIA, C. Edge effects in fragmented forests: implications for conservation. Trends
in ecology & evolution, v. 10, p. 58-62. 1995.
NORGHAUER, J.M.; MALCOLM, J.R. & ZIMMERMAN, B.L. Juvenile mortality and
attacks by a specialist herbivore increase with conspecific adult basal area of

43
Amazonian Swietenia macrophylla (Meliaceae). Journal of Tropical Ecology,
v. 22, p. 451-460. 2006a.
NORGHAUER, J.M.; MALCOLM, J.R.; ZIMMERMAN, B.L. & FELFILI, J.M. An
experimental test of density- and distant-dependent recruitment of mahogany
(Swietenia macrophylla) in southeastern Amazonia. Oecologia, v. 148, p. 437-
446. 2006b.
NOVOTNY, V. & BASSET, Y. Review - Host specificity of insect herbivores in
tropical forests. Proceedings of the Royal Society B-Biological Sciences, v.
272, p. 1083-1090. 2005.
NOVOTNY, V.; BASSET, Y.; MILLER, S.E.; WEIBLEN, G.D.; BREMER, B.;
CIZEK, L. & DROZD, P. Low host specificity of herbivorous insects in a
tropical forest. Nature, v. 416, p. 841-844. 2002.
OLIVEIRA, M.A.; GRILLO, A.S. & TABARELLI, M. Forest edge in the Brazilian
Atlantic forest: drastic changes in tree species assemblages. Oryx, v. 38, p. 389-
394. 2004.
OLIVEIRA, M.A.; SANTOS, A.M.M. & TABARELLI, M. Profound impoverishment
of the large-tree stand in a hyper-fragmented landscape of the Atlantic forest.
Forest Ecology and Management, v. 256, p. 1910-1917. 2008.
PAULA, M.D.; ALVES-COSTA, C.P. & TABARELLI, M. Carbon storage in a
fragmented landscape of Atlantic forest: the role played by edge-affected
habitats and emergent trees. Tropical Conservation Science, v. 4, p. 349-358.
2011.
PETERS, H.A. Neighbour-regulated mortality: the influence of positive and negative
density dependence on tree populations in species-rich tropical forests. Ecology
Letters, v. 6, p. 757-765. 2003.

44
PINTO, S.R.R.; MENDES, G.; SANTOS, A.M.M.; DANTAS, M.; TABARELLI, M. &
MELO, F.P.L. Landscape attributes drive complex spatial microclimate
configuration of Brazilian Atlantic forest fragments. Tropical Conservation
Science, v. 3, p. 389-402. 2010.
PITMAN, N.C.A.; TERBORGH, J.W.; SILMAN, M.R.; NUNEZ, P.; NEILL, D.A.;
CERON, C.E.; PALACIOS, W.A. & AULESTIA, M. Dominance and
distribution of tree species in upper Amazonian terra firme forests. Ecology, v.
82, p. 2101-2117. 2001.
PÜTZ, S.; GROENEVELD, J.; ALVES, L.F.; METZGER, J.P. & HUTH, A.
Fragmentation drives tropical forest fragments to early successional states: A
modelling study for Brazilian Atlantic forests. Ecological Modelling, v. 222, p.
1986-1997. 2011.
RANTA, P.; BLOM, T.; NIEMELA, J.; JOENSUU, E. & SIITONEN, M. The
fragmented Atlantic rain forest of Brazil: size, shape and distribution of forest
fragments. Biodiversity and Conservation, v. 7, p. 385-403. 1998.
REDFORD, K.H. The empty forest. Bioscience, v. 42, p. 412-422. 1992.
REINHART, K.O.; ROYO, A.A.; KAGEYAMA, S.A. & CLAY, K. Canopy gaps
decrease microbial densities and disease risk for a shade-intolerant tree species.
Acta Oecologica-International Journal of Ecology, v. 36, p. 530-536. 2010.
RIBEIRO, M.C.; METZGER, J.P.; MARTENSEN, A.C.; PONZONI, F.J. & HIROTA,
M.M. The Brazilian Atlantic Forest: How much is left, and how is the remaining
forest distributed? Implications for conservation. Biological Conservation, v.
142, p. 1141-1153. 2009.
SALA, O.E.; CHAPIN, F.S.; ARMESTO, J.J.; BERLOW, E.; BLOOMFIELD, J.;
DIRZO, R.; HUBER-SANWALD, E.; HUENNEKE, L.F.; JACKSON, R.B.;
45
KINZIG, A.; LEEMANS, R.; LODGE, D.M.; MOONEY, H.A.;
OESTERHELD, M.; POFF, N.L.; SYKES, M.T.; WALKER, B.H.; WALKER,
M. & WALL, D.H. Biodiversity - Global biodiversity scenarios for the year
2100. Science, v. 287, p. 1770-1774. 2000.
SANTO-SILVA, E.E.; ALMEIDA, W.R.; MELO, F.P.L.; ZICKEL, C.S. &
TABARELLI, M. The Nature of Seedling Assemblages in a Fragmented
Tropical Landscape: Implications for Forest Regeneration. Biotropica, v. 45, p.
386-394. 2013.
SANTOS, B.A.; ARROYO-RODRIGUEZ, V.; MORENO, C.E. & TABARELLI, M.
Edge-Related Loss of Tree Phylogenetic Diversity in the Severely Fragmented
Brazilian Atlantic Forest. Plos One, v. 5. 2010.
SANTOS, B.A. & BENITEZ-MALVIDO, J. Insect Herbivory and Leaf Disease in
Natural and Human Disturbed Habitats: Lessons from Early-Successional
Heliconia Herbs. Biotropica, v. 44, p. 53-62. 2012.
SANTOS, B.A.; PERES, C.A.; OLIVEIRA, M.A.; GRILLO, A.; ALVES-COSTA, C.P.
& TABARELLI, M. Drastic erosion in functional attributes of tree assemblages
in Atlantic forest fragments of northeastern Brazil. Biological Conservation, v.
141, p. 249-260. 2008.
SCHUPP, E.W. The Janzen-Connell model for tropical tree diversity - population
implications and the importance of spatial scale. American Naturalist, v. 140,
p. 526-530. 1992.
SILMAN, M.R.; TERBORGH, J.W. & KILTIE, R.A. Population regulation of a
dominant rain forest tree by a major seed predator. Ecology, v. 84, p. 431-438.
2003.
46
SILVA, J.M.C. & TABARELLI, M. Tree species impoverishment and the future flora
of the Atlantic forest of northeast Brazil. Nature, v. 404, p. 72-74. 2000.
SIZER, N. & TANNER, E.V.J. Responses of woody plant seedlings to edge formation
in a lowland tropical rainforest, Amazonia. Biological Conservation, v. 91, p.
135-142. 1999.
SWAMY, V. & TERBORGH, J.W. Distance-responsive natural enemies strongly
influence seedling establishment patterns of multiple species in an Amazonian
rain forest. Journal of Ecology, v. 98, p. 1096-1107. 2010.
TABARELLI, M.; AGUIAR, A.V.; GIRAO, L.C.; PERES, C.A. & LOPES, A.V.
Effects of Pioneer Tree Species Hyperabundance on Forest Fragments in
Northeastern Brazil. Conservation Biology, v. 24, p. 1654-1663. 2010.
TABARELLI, M.; DA SILVA, M.J.C. & GASCON, C. Forest fragmentation,
synergisms and the impoverishment of neotropical forests. Biodiversity and
Conservation, v. 13, p. 1419-1425. 2004.
TABARELLI, M.; LOPES, A.V. & PERES, C.A. Edge-effects Drive Tropical Forest
Fragments Towards an Early-Successional System. Biotropica, v. 40, p. 657-
661. 2008.
TABARELLI, M.; PERES, C.A. & MELO, F.P.L. The 'few winners and many losers'
paradigm revisited: Emerging prospects for tropical forest biodiversity.
Biological Conservation, v. 155, p. 136-140. 2012.
TER STEEGE, H.; PITMAN, N.C.A.; SABATIER, D.; BARALOTO, C.; SALOMAO,
R.P.; GUEVARA, J.E.; PHILLIPS, O.L.; CASTILHO, C.V.; MAGNUSSON,
W.E.; MOLINO, J.-F.; MONTEAGUDO, A.; NUNEZ VARGAS, P.; CARLOS
MONTERO, J.; FELDPAUSCH, T.R.; CORONADO, E.N.H.; KILLEEN, T.J.;
MOSTACEDO, B.; VASQUEZ, R.; ASSIS, R.L.; TERBORGH, J.;
47
WITTMANN, F.; ANDRADE, A.; LAURANCE, W.F.; LAURANCE, S.G.W.;
MARIMON, B.S.; MARIMON, B.-H., JR.; GUIMARAES VIEIRA, I.C.;
AMARAL, I.L.; BRIENEN, R.; CASTELLANOS, H.; CARDENAS LOPEZ,
D.; DUIVENVOORDEN, J.F.; MOGOLLON, H.F.; DE ALMEIDA MATOS,
F.D.; DAVILA, N.; GARCIA-VILLACORTA, R.; STEVENSON DIAZ, P.R.;
COSTA, F.; EMILIO, T.; LEVIS, C.; SCHIETTI, J.; SOUZA, P.; ALONSO, A.;
DALLMEIER, F.; DUQUE MONTOYA, A.J.; FERNANDEZ PIEDADE, M.T.;
ARAUJO-MURAKAMI, A.; ARROYO, L.; GRIBEL, R.; FINE, P.V.A.;
PERES, C.A.; TOLEDO, M.; GERARDO, A.A.C.; BAKER, T.R.; CERON, C.;
ENGEL, J.; HENKEL, T.W.; MAAS, P.; PETRONELLI, P.; STROPP, J.;
EUGENE ZARTMAN, C.; DALY, D.; NEILL, D.; SILVEIRA, M.; RIOS
PAREDES, M.; CHAVE, J.; DE ANDRADE LIMA, D.; JORGENSEN, P.M.;
FUENTES, A.; SCHOENGART, J.; CORNEJO VALVERDE, F.; DI FIORE,
A.; JIMENEZ, E.M.; PENUELA MORA, M.C.; FERNANDO PHILLIPS, J.;
RIVAS, G.; VAN ANDEL, T.R.; VON HILDEBRAND, P.; HOFFMAN, B.;
ZENT, E.L.; MALHI, Y.; PRIETO, A.; RUDAS, A.; RUSCHELL, A.R.;
SILVA, N.; VOS, V.; ZENT, S.; OLIVEIRA, A.A.; CANO SCHUTZ, A.;
GONZALES, T.; NASCIMENTO, M.T.; RAMIREZ-ANGULO, H.; SIERRA,
R.; TIRADO, M.; UMANA MEDINA, M.N.; VAN DER HEIJDEN, G.; VELA,
C.I.A.; VILANOVA TORRE, E.; VRIESENDORP, C.; WANG, O.; YOUNG,
K.R.; BAIDER, C.; BALSLEV, H.; FERREIRA, C.; MESONES, I.; TORRES-
LEZAMA, A.; URREGO GIRALDO, L.E.; ZAGT, R.; ALEXIADES, M.N.;
HERNANDEZ, L.; HUAMANTUPA-CHUQUIMACO, I.; MILLIKEN, W.;
PALACIOS CUENCA, W.; PAULETTO, D.; VALDERRAMA SANDOVAL,
E.; VALENZUELA GAMARRA, L.; DEXTER, K.G.; FEELEY, K.; LOPEZ-

48
GONZALEZ, G. & SILMAN, M.R. Hyperdominance in the Amazonian tree
flora. Science, v. 342, p. 325-+. 2013.
TERBORGH, J. Using Janzen-Connell to predict the consequences of defaunation and
other disturbances of tropical forests. Biological Conservation, v. 163, p. 7-12.
2013.
TERBORGH, J.; LOSOS, E.; RILEY, M.P. & RILEY, M.B. Predation by vertebrates
and invertebrates on the seeds of five canopy tree species of an Amazonian
forest. Vegetatio, v. 108, p. 375-386. 1993.
TERBORGH, J. & NUÑES-ITURRI, G. Disperser-free tropical forests await an
unhappy fate. In: (eds) Laurance, W.F. & Peres, C.A. Emerging threats to
tropical forests. The University of Chicago Press, Chicago, pp. 241-252. 2006.
TERBORGH, J.; NUNEZ-ITURRI, G.; PITMAN, N.C.A.; VALVERDE, F.H.C.;
ALVAREZ, P.; SWAMY, V.; PRINGLE, E.G. & PAINE, C.E.T. Tree
recruitment in an empty forest. Ecology, v. 89, p. 1757-1768. 2008.
TERBORGH, J.; PITMAN, N.; SILMAN, M.; SCHICHTER, H. & NÚÑEZ, P.
Maintenance of tree diversity in tropical forests. In: ed. Levey, D.J. Seed
dispersal and frugivory: ecology, evolution and conservation. CABI
Publishing, Wallingford, pp. 1-17. 2002.
TSCHARNTKE, T.; STEFFAN-DEWENTER, I.; KRUESS, A. & THIES, C.
Characteristics of insect populations on habitat fragments: A mini review.
Ecological Research, v. 17, p. 229-239. 2002.
URBAS, P.; ARAUJO, M.V., JR.; LEAL, I.R. & WIRTH, R. Cutting more from cut
forests: Edge effects on foraging and herbivory of leaf-cutting ants in Brazil.
Biotropica, v. 39, p. 489-495. 2007.
49
WILLIG, M.R.; PRESLEY, S.J.; BLOCH, C.P.; HICE, C.L.; YANOVIAK, S.P.; DIAZ,
M.M.; CHAUCA, L.A.; PACHECO, V. & WEAVER, S.C. Phyllostomid bats of
lowland Amazonia: Effects of habitat alteration on abundance. Biotropica, v.
39, p. 737-746. 2007.
WIRTH, R.; MEYER, S.T.; LEAL, I.R. & TABARELLI, M. Plant herbivore
interactions at the forest edge. In: (eds) Luttge, U., Beyschlag, W. & Murata, J.
Progress in Botany. pp. 423-448. 2008.
WRIGHT, S.J. Plant diversity in tropical forests: a review of mechanisms of species
coexistence. Oecologia, v. 130, p. 1-14. 2002.
WRIGHT, S.J. The myriad consequences of hunting for vertebrates and plants in
tropical forests. Perspectives in Plant Ecology Evolution and Systematics, v.
6, p. 73-86. 2003.
WYATT, J.L. & SILMAN, M.R. Distance-dependence in two Amazonian palms:
effects of spatial and temporal variation in seed predator communities.
Oecologia, v. 140, p. 26-35. 2004.
YAMAZAKI, M.; IWAMOTO, S. & SEIWA, K. Distance- and density-dependent
seedling mortality caused by several diseases in eight tree species co-occurring
in a temperate forest. Plant Ecology, v. 201, p. 181-196. 2009.

50
4. CAPÍTULO 1
HIPERABUNDÂNCIA DE ESPÉCIES PIONEIRAS EM PEQUENOS
REMANESCENTES DA FLORESTA ATLÂNTICA
Edgar E. Santo-Silvaa*, Marcelo Tabarelli
a, Carlos A. Peres
b
a Universidade Federal de Pernambuco, Departamento de Botânica, Av. Prof. Moraes
Rego, S/N, Cidade Universitária, 50670-901, Recife-PE, Brasil.
b School of Environmental Sciences, University of East Anglia, Norwich Research Park,
Norwich, NR47TJ, UK.
* e-mail: [email protected]
Manuscrito a ser submetido para o periódico Biological Conservation.
51
RESUMO
A perda e fragmentação de habitat têm alterado drasticamente as assembleias arbóreas,
criando uma flora composta predominantemente por espécies pioneiras e com sementes
pequenas. Todavia, ainda é incerto se atributos como o nicho de regeneração e o
tamanho de semente são bons preditores de quais espécies tendem a permanecer e/ou se
proliferar nessas paisagens fragmentadas. Neste estudo, nós analisamos as densidades
populacionais de espécies arbóreas em uma paisagem de Floresta Atlântica com
aproximadamente 200 anos de fragmentação e avaliamos se o nicho de regeneração e o
tamanho de semente explicam o aumento nas densidades populacionais em pequenos
fragmentos florestais. Nós analisamos assembleias de árvores adultas e plântulas em 19
pequenos fragmentos florestais (<100 ha) e em 20 áreas de floresta madura no maior
remanescente (3500 ha). Nas assembleias de adultos e plântulas, 56% e 63% das
espécies, respectivamente, tiveram maiores densidades em pequenos fragmentos
florestais. Essas maiores densidades populacionais foram explicadas apenas pelo nicho
de regeneração, sendo as pioneiras as espécies que mais aumentaram suas densidades
nos pequenos fragmentos. Entretanto, muitas espécies pioneiras nas assembleias de
plântulas apresentaram uma densidade populacional muito baixa ou não foram
encontradas nos pequenos fragmentos. Assim, nossos resultados demonstram que a
flora de pequenos fragmentos tende a ser composta por um pequeno grupo de espécies
pioneiras hiperabundantes e por poucas espécies raras. Mesmo após 200 anos de
fragmentação, pequenos fragmentos circundados por matrizes não florestadas podem
continuar apresentando respostas negativas a fragmentação e perda de habitat.
Palavras-chave: Assembleias arbóreas, densidade populacional, floresta tropical,
fragmentação florestal, nicho de regeneração, tamanho de semente.
52
1. INTRODUÇÃO
As florestas tropicais são os ambientes mais biodiversos e, ao mesmo tempo,
mais desmatados e fragmentados no mundo (FAO, 2011; Fearnside & Barbosa, 2004).
Atividades antrópicas, tais como a o uso da terra para criação de áreas de pastos ou
monocultura, têm alterado drasticamente a configuração das paisagens de floresta
tropical, sendo consideradas uma das maiores responsáveis pela crise global de
biodiversidade (Sala et al., 2000). Embora tenha sido sugerido que grandes
remanescentes florestais são mais efetivos para a conservação de espécies (Laurance,
2005; Peres, 2005), encontrar esses remanescentes já não é possível em muitas áreas de
floresta tropical. Na Floresta Atlântica brasileira, por exemplo, os remanescentes
florestais representam apenas 11,7% da vegetação original e aproximadamente 83%
desses remanescentes possuem menos de 50 ha (Ribeiro et al., 2009). Diante desse
cenário, ecólogos e biólogos da conservação estão depositando sua esperança nessas
paisagens antropizadas (Melo et al., 2013), entretanto, o potencial dessas paisagens para
a manutenção de biodiversidade ainda é incerto (veja Arroyo-Rodriguez et al., 2012;
Arroyo-Rodriguez et al., 2009; Santos et al., 2010; Santos et al., 2008).
Essas paisagens antropizadas são compostas por pequenos fragmentos florestais
circundados por matrizes não florestadas, tais como monoculturas e áreas de pasto, e a
maioria desses remanescentes florestais sofrem perturbações constantes dos efeitos de
borda (Melo et al., 2013). De fato, os efeitos de borda são os principais responsáveis
pelas mudanças na flora em paisagens fragmentadas, conduzindo a flora desses
ambientes para um estádio inicial de sucessão ecológica (Pütz et al., 2011; Tabarelli et
al., 2008). Os efeitos de borda, como o aumento na luminosidade e temperatura e a
redução na umidade (Kapos, 1989), ocasionam uma alta mortalidade árvores (D'Angelo
53
et al., 2004; Laurance et al., 2000) e criam um ambiente favorável para o recrutamento e
ciclos de auto-substituição de espécies pioneiras (Tabarelli et al., 2008), consideradas as
espécies “vencedoras” em pequenos fragmentos florestais (Tabarelli et al., 2012).
Evidências dessa proliferação e manutenção de espécies pioneiras têm sido obtidas tanto
na Floresta Amazônica (Laurance et al., 2011) como na Floresta Atlântica, onde
pequenos fragmentos florestais com aproximadamente 200 anos apresentam em média
um incremento de 73% na riqueza relativa de espécies pioneiras em relação a áreas de
floresta madura (Santos et al., 2008). Como resultado, essas paisagens fragmentadas
tendem a apresentar uma flora simplificada com baixa diversidade funcional, onde
espécies tolerantes à sombra (Santo-Silva et al., 2013; Santos et al., 2008), emergentes
(Oliveira et al., 2008), polinizadas por vertebrados (Girão et al., 2007; Lopes et al.,
2009) e com madeira densa (Michalski et al., 2007), aparentemente têm dificuldades de
recrutar e manter populações viáveis. Adicionalmente, falhas no processo de dispersão
de sementes grandes devido ao forte processo de defaunação influenciam negativamente
a abundância de espécies com tais sementes, contribuindo para a formação de
assembleias compostas predominantemente por espécies de sementes pequenas (Melo et
al., 2006; Melo et al., 2010; Santo-Silva et al., 2013). Consequentemente, esse
predomínio de espécies pioneiras e com sementes pequenas tem aumentado a
similaridade florística em escala regional, resultando em um processo de
homogeneização da biota (Lôbo et al., 2011).
Apesar do rearranjo da flora em pequenos fragmentos florestais ser bem
demonstrado (Laurance et al., 2006; Santo-Silva et al., 2013; Santos et al., 2008), nós
não estamos totalmente convencidos que o nicho de regeneração (i.e., pioneiras e
tolerantes à sombra) e o tamanho de semente são bons preditores de quais espécies
tendem a permanecer e/ou se proliferar nessas paisagens. Por exemplo, mesmo sendo

54
um habitat dominado por pioneiras, áreas afetadas pela borda parecem ser habitats
inóspitos para espécies pioneiras de ciclo de vida longo (Santos et al., 2012). Nós
propomos que uma avaliação das densidades populacionais pode proporcionar uma
melhor inferência sobre quais espécies tendem a permanecer em paisagens
fragmentadas. Mais especificamente, a avaliação de possíveis mudanças nas densidades
de várias populações arbóreas, bem como a comparação entre estágios ontogenéticos
(i.e., adultos e plântulas), podem fornecer subsídios para entender se o nicho de
regeneração e o tamanho de semente garantem a permanência e/ou proliferação de
espécies em paisagens fragmentadas.
Neste estudo, nós analisamos as densidades populacionais de espécies arbóreas
em uma paisagem de Floresta Atlântica com mais de 200 anos de fragmentação (Santos
et al., 2010). Se o nicho de regeneração e o tamanho de semente são atributos chave
para a manutenção e proliferação de espécies em paisagens fragmentadas, nós
esperamos que populações de espécies pioneiras e com sementes pequenas apresentem
maiores densidades em pequenos fragmentos florestais. Primeiro, nós documentamos as
diferenças nas densidades populacionais entre habitats (pequenos fragmentos florestais
vs. floresta madura no interior de um grande remanescente) separadamente no estágio
de plântula e adulto e posteriormente comparamos os dois estágios ontogenéticos.
Segundo, dado que nós observamos que apenas algumas das espécies pioneiras
aumentaram sua densidade populacional nos fragmentos florestais, nós também
avaliamos se as espécies pioneiras que estão proliferando em pequenos fragmentos
florestais possuem ciclo de vida curto, usando a densidade da madeira como indicador
do tempo do ciclo de vida. Terceiro, examinamos de que forma as mudanças nas
densidades populacionais podem influenciar na estrutura das comunidades. Por último,
nós discutimos sobre os possíveis mecanismos biológicos responsáveis por essas

55
mudanças nas densidades populacionais e suas implicações para conservação de
espécies em paisagens fragmentadas.
2. MÉTODOS
2.1. Área de estudo
O estudo foi realizado em uma paisagem severamente fragmentada de Floresta
Atlântica, localizada na propriedade da Usina Serra Grande, nordeste do Brasil (8º30’ S,
35º 50’ O; Fig. 1). A paisagem estudada apresenta uma área de 667 km² e possui 9000
ha de floresta, distribuídos em 109 fragmentos florestais com tamanhos variando entre
1,6 e 3500 ha e completamente circundados por uma matriz homogênea de cana-de-
açúcar. A região apresenta um clima tropical, com precipitação anual de
aproximadamente 2000 mm e temperatura variando entre 22 ºC e 24 ºC. A estação seca
no local apresenta uma duração de três meses, compreendendo o período de novembro a
janeiro. A vegetação é do tipo floresta Ombrófila Aberta Submontana (Veloso et al.,
1991) e as famílias com maior número de espécies são Lauraceae, Sapotaceae,
Moraceae e Fabaceae (Grillo et al., 2005).
A exploração da terra para o cultivo de cana-de-açúcar em Serra Grande data do
século XIX (Santos et al., 2008). Assim, Serra Grande representa uma paisagem antiga,
cuja forma e tamanho dos fragmentos são mantidos estáveis para garantir o suprimento
de água para a cana-de-açúcar. Nesta paisagem se encontra o maior remanescente de
Floresta Atlântica ao norte do Rio São Francisco, o fragmento de Coimbra
(aproximadamente 3500 ha). Apesar de não constituir uma floresta contínua, o
fragmento de Coimbra possui áreas de floresta madura que aparentemente não sofrem

56
os efeitos de borda, apresentando flora e fauna com espécies típicas de áreas não
perturbadas de floresta (Oliveira et al., 2004; Santos et al., 2008). Devido a essas
características, essas áreas de floresta madura foram utilizadas em estudos anteriores
como áreas controle (veja Girão et al., 2007; Lopes et al., 2009; Santo-Silva et al., 2013;
Santos et al., 2008; Tabarelli et al., 2010).
2.2. Levantamento da flora
O levantamento da flora foi realizado durante a estação seca. As assembleias
arbóreas foram amostradas em 39 parcelas de 0,1 ha (10 m × 100 m) em dois tipos de
habitat: (1) áreas de floresta madura – 20 parcelas em áreas de floresta preservada no
interior do fragmento de Coimbra, localizadas a uma distância mínima de 200 m da
borda florestal e em áreas sem efeito de borda detectável; e (2) fragmentos florestais –
19 parcelas em 19 fragmentos florestais completamente circundadas por uma matriz de
cana-de-açúcar com tamanhos variando entre 3,4 e 91,2 ha (média = 40,9; mediana =
31,7), sendo uma parcela no centro geométrico de cada fragmento. Para o levantamento
das assembleias dos indivíduos adultos, foram amostrados e identificados todos os
indivíduos com DAP ≥ 10 cm. Com relação às assembleias de plântulas, nós
amostramos aleatoriamente 100 indivíduos por parcela com altura ≥ 10 cm e ≤ 50 cm.
Para a seleção aleatória das plântulas, foram sorteados pontos dentro das parcelas por
meio de um sistema simples de coordenadas, onde foi coletada a plântula mais próxima
de cada ponto. Nós optamos por esse método para evitar agregações monoespecificas de
plântulas e para igualar o tamanho da amostra entre os diferentes sítios. Essas bases de
dados das assembleias de adultos e plântulas foram anteriormente utilizadas em Santos
et al. (2008) e Santo-Silva et al. (2013), respectivamente. A distribuição espacial das

57
parcelas foi limitada devido ao fato de que todas as áreas de floresta madura se
encontram dentro de Coimbra, que representa um único fragmento florestal. Entretanto,
efeitos da distribuição espacial na composição florística não têm sido observados na
paisagem de Serra Grande (Santos et al., 2008).
2.3. Grupos funcionais
Para identificar quais os atributos ecológicos são responsáveis pelo aumento em
densidades populacionais nos fragmentos florestais, todas as espécies identificadas
foram classificadas em grupos funcionais de acordo com o nicho de regeneração e o
tamanho de sementes. Esses atributos foram selecionados, pois são os principais
responsáveis por alterações na estrutura e composição das assembleias de árvores
adultas e plântulas (Santo-Silva et al., 2013; Santos et al., 2008). Com relação ao nicho
de regeneração as espécies foram classificadas em: (1) pioneiras – espécies que
necessitam de áreas ensolaradas para recrutar, como áreas de borda e clareiras; e (2)
tolerantes à sombra – espécies capazes de regenerar em locais sombreados da floresta
(Hartshorn, 1978). De acordo com o tamanho de semente as espécies foram
classificadas em quatro grupos: (1) sementes pequenas – < 0,6 cm de comprimento; (2)
sementes médias – 0,6-1,5 cm; (3) sementes grandes – 1,6-3 cm; e (4) sementes muito
grandes – > 3 cm. Todos esses critérios para classificação das espécies em grupos
funcionais foram utilizados em estudos anteriores (e.g., Oliveira et al., 2004; Santo-
Silva et al., 2013; Santos et al., 2008). As informações sobre os atributos das espécies
foram obtidas a partir de uma ampla revisão da literatura, incluindo teses de doutorado e
listas de espécies (e.g., Lorenzi, 1992; Oliveira, 2007; van Roosmalen, 1985) e pelo
conhecimento acumulado pelo nosso grupo de pesquisa por mais de dez anos em
58
estudos realizados na Floresta Atlântica (e.g., Melo et al., 2006; Oliveira et al., 2004;
Santo-Silva et al., 2013; Silva & Tabarelli, 2000; Tabarelli et al., 1999; Tabarelli &
Peres, 2002).
2.4. Análise dos dados
Para avaliar as mudanças nas densidades populacionais, nós selecionamos todos
os indivíduos identificados pelo menos até o nível de gênero e com informações sobre
nicho de regeneração e tamanho de semente. Para cada estágio ontogenético (plântulas e
adultos) e tipo de habitat (floresta madura e pequenos fragmentos), nós calculamos as
densidades médias das espécies em 0,1 ha. Para inferir se uma espécie apresentava um
incremento ou decréscimo em sua densidade nos fragmentos florestais, nós calculamos
a razão entre a densidade média nos fragmentos florestais e nas áreas de floresta
madura, separadamente para as assembleias de plântulas e adultos. Razões maiores que
1 indicam que a espécie apresenta maior densidade populacional nos pequenos
fragmentos que nas áreas de floresta madura. Uma vez que algumas espécies foram
encontradas em apenas um tipo de habitat, nós decidimos adicionar um indivíduo para
todas as espécies em cada tipo de habitat para viabilizar o cálculo da razão densidade
média nos fragmentos florestais pela densidade média na floresta madura.
Nós realizamos GLMs (do inglês, General Linear Models) utilizando o nicho de
regeneração e o tamanho de semente como variáveis independentes e a razão da
densidade nos fragmentos florestais pela densidade na floresta madura como variável
dependente. Nós realizamos GLMs separadamente para as assembleias de plântulas e
adultos. A razão da densidade em fragmentos florestais pela densidade em áreas de
floresta madura foi logaritimizada. Adicionalmente, para inferir se as espécies pioneiras
59
que estão proliferando nos pequenos fragmentos florestais apresentam ciclo de vida
curto, nós utilizamos a densidade da madeira como um indicativo do tempo do ciclo de
vida, uma vez que árvores de ciclo de vida curto e crescimento rápido normalmente
apresentam madeira menos densa (Enquist et al., 1999; Grime & Hunt, 1975). Os dados
de densidade de madeira foram obtidos em Zanne et al. (2009). Quando nós não
obtivemos a densidade da madeira de uma determinada espécie, nós utilizamos a média
para o gênero ou família. Para testar se as espécies pioneiras que estão proliferando nos
pequenos fragmentos florestais apresentam madeira menos densa, nós realizamos
GLM’s separadamente para assembleia de plântulas e adultos. Finalmente, nós criamos
curvas de ranking de espécies em função de sua abundância e do número de parcelas
encontradas para cada habitat utilizando todas as espécies encontradas nas assembleias
de adultos e plântulas (Magurran, 1988). Todas as análises estatísticas foram realizadas
no programa R (R Core Team, 2012).
3. RESULTADOS
3.1. Diferenças entre habitats nas densidades populacionais
No total, nós analisamos 2778 indivíduos adultos e 2640 plântulas, que
corresponderam a 103 e 76 espécies, respectivamente. Nas assembleias de adultos, nós
observamos que 58 (56,3%) espécies apresentavam densidades mais elevadas nos
fragmentos florestais em relação às áreas de floresta madura (i.e., densidade média nos
fragmentos florestais/densidade média na floresta madura > 1) (Tabela 1). Esse grupo
de espécies foi composto predominantemente por espécies pioneiras (62,1%) e com
sementes médias (60,3%) ou pequenas (24,1%). Espécies com sementes grandes e
60
muito grandes representaram 12% e 3,4% dessas espécies com maior densidade nos
pequenos fragmentos, respectivamente. De modo geral, as espécies tolerantes à sombra
apresentaram densidades baixas nos fragmentos florestais (Fig. 2A). Todavia, apenas o
nicho de regeneração influenciou na alteração da densidade de espécies nas assembleias
de adultos, sendo as espécies pioneiras as que apresentam maior incremento em sua
densidade nos fragmentos florestais (tamanho de semente, F = 2,23, gl = 1, P = 0,139;
nicho de regeneração, F = 4,76, gl = 1, P = 0,031; Fig. 2C).
Com relação às assembleias de plântulas, 48 (63,2%) espécies apresentaram
densidades maiores nos fragmentos florestais (Tabela 1). Assim como nas assembleias
de adultos, essas espécies são predominantemente pioneiras (72,9%; Fig. 2B) e possuem
sementes médias (50%) ou pequenas (27,1%). Espécies com sementes grandes e muito
grandes representaram 12,5% e 10,4% dessas espécies com maior densidade nos
pequenos fragmentos, respectivamente. As espécies pioneiras apresentaram uma maior
razão da densidade nos fragmentos florestais pela densidade na floresta madura (F =
4.59, gl = 1, P = 0,035; Fig. 2D), porém, nenhum efeito do tamanho de semente foi
detectado (F = 0,78, gl = 1, P = 0,379). Além disso, esse padrão de incremento na
densidade nos fragmentos florestais pelas espécies pioneiras foi visualmente mais
evidente nas assembleias de plântulas que de adultos (Fig. 2A, B).
Quando comparados os dois estágios ontogenéticos, as espécies tolerantes à
sombra de um modo geral demonstram uma diminuição na densidade em toda a
paisagem (Fig. 3A). Entretanto, as espécies pioneiras não apresentaram um padrão
definido. Apesar de algumas espécies pioneiras apresentarem um aumento na densidade
populacional nos fragmentos florestais, nós observamos que muitas estão aumentando
suas densidades nas áreas de floresta madura ou se tornando extremamente raras em
toda paisagem (Fig. 3B).
61
3.2. Densidade da madeira vs. razão da densidade populacional nos fragmentos
florestais pela densidade na floresta madura de espécies pioneiras
Nas assembleias de adultos, nós analisamos 62 espécies pioneiras com densidade
média de madeira 0,6 ± 0,16 g/cm³ (media ± DP). Com relação às assembleias de
plântulas, 52 espécies pioneiras foram analisadas e a média da densidade de madeira
dessas espécies foi 0,63 ± 0,14 g/cm³. Para ambos os estágios, não foi observada uma
relação entre a densidade da madeira e a razão da densidade média nos fragmentos
florestais pela densidade média na floresta madura (adultos, R² = 0,002, N = 62, P =
0,716; plântulas, R² = 0,06, N = 52, P = 0,081).
3.3. Curvas de ranking de species
Para construção das curvas de ranking foram analisadas 219 espécies nas
assembleias de adultos e 195 nas assembleias de plântulas. O ranking das espécies em
função da abundância relativa demonstrou uma estrutura similar entre as assembleias de
adultos e plântulas na floresta madura, porém, as assembleias de plântulas nos
fragmentos florestais apresentam um número bastante reduzido de espécies raras (Fig.
4A, B). Um padrão similar foi encontrado no ranking de espécies em função do número
de parcelas em que foram encontradas, uma vez que as assembleias de plântulas nos
pequenos fragmentos apresentaram um número reduzido de espécies com distribuição
restrita (Fig. 4C, D).
62
4. DISCUSSÃO
Embora o tamanho de semente e o nicho de regeneração sejam atributos
relacionados à vulnerabilidade das espécies de árvores em algumas florestas
fragmentadas (Laurance et al., 2006; Melo et al., 2010; Santo-Silva et al., 2013; Santos
et al., 2008), nossas análises de densidade populacional demonstram que o fato de uma
espécie ser pioneira e possuir semente pequena não garante a persistência e/ou
proliferação da mesma nessas paisagens antropizadas. Nossos resultados sustentam a
hipótese que pequenos fragmentos florestais estão sendo conduzidos para um estádio
inicial de sucessão ecológica, apresentando uma flora predominantemente composta por
espécies pioneiras (Tabarelli et al., 2008). Entretanto, o fato de muitas espécies
pioneiras nas assembleias de plântulas apresentarem uma densidade populacional muito
baixa ou não serem encontradas nos pequenos fragmentos, indica que as espécies que
estão se proliferando nos fragmentos representam apenas um subgrupo das espécies
pioneiras. Assim, a flora arbórea futura nos pequenos fragmentos florestais tende a ser
composta por um pequeno grupo de espécies pioneiras hiperabundantes e por poucas
espécies raras, além de apresentar baixa beta-diversidade.
A ideia que o tamanho de semente é um fator chave para a manutenção de uma
espécie em habitats fragmentados tem sido bastante estudada (Melo et al., 2010; Santo-
Silva et al., 2013; Santos et al., 2008). Vários estudos argumentam que a redução na
abundância de frugívoros de médio e grande porte reduz a dispersão de espécies com
sementes grandes (e.g., Cramer et al., 2007; Peres & Palacios, 2007; Silva & Tabarelli,
2000), o que resultaria em uma chuva de sementes alterada (Melo et al., 2006) e,
consequentemente, em um aumento na abundância relativa de indivíduos com sementes
pequenas (Melo et al., 2007; Melo et al., 2010; Santo-Silva et al., 2013). Evidências

63
dessa falha no processo de dispersão foram observadas inclusive em pequenos
fragmentos florestais na paisagem de Serra Grande (Portes, 2012). Todavia, o fato das
mudanças nas densidades populacionais ocorrerem independentemente do tamanho de
semente neste estudo indica que proliferação de espécies em pequenos fragmentos
florestais não está associada a falhas no processo de dispersão. Dessa forma, é provável
que os atributos responsáveis pela manutenção e proliferação das espécies em paisagens
fragmentadas estejam associados à capacidade de recrutamento e estabelecimento dos
indivíduos.
Apesar dos constantes efeitos de borda tornarem os pequenos fragmentos um
ambiente favorável para o recrutamento de espécies pioneiras (Laurance et al., 1998;
Tabarelli et al., 2008), nossos resultados demonstram que apenas um subgrupo delas
está se proliferando nesses fragmentos. Recentemente, Santos et al. (2012) sugeriram
que espécies pioneiras de ciclo de vida longo seriam afetadas negativamente pela
fragmentação florestal, dado que seus adultos emergentes apresentam maior mortalidade
em áreas de borda (D'Angelo et al., 2004; Laurance & Curran, 2008; Laurance et al.,
2000), resultando em um menor recrutamento dessas espécies. Entretanto, essa não
parece ser a explicação para o que está ocorrendo na paisagem de Serra Grande por dois
motivos. Primeiro, utilizando a densidade da madeira como um indicativo do tempo do
ciclo de vida, nós não observamos nenhuma evidência que suporte a hipótese que
espécies pioneiras de ciclo de vida curto tendem a predominar em pequenos fragmentos
florestais. Segundo, as assembleias de plântulas em áreas de floresta madura e pequenos
fragmentos não diferem com relação à riqueza de espécies emergentes (Santo-Silva et
al., 2013). Como os pequenos fragmentos em Serra Grande apresentam microclima
alterado devido a maior penetração de luz solar (e.g., maior temperatura; G. Mendes,
dados não publicados), nós sugerimos que espécies pioneiras com atributos

64
ecofisiológicos que confiram uma maior tolerância a esse microclima (e.g., maior
tolerância ao déficit hídrico) obtenham maior sucesso no recrutamento.
Além disso, as densidades bastante elevadas nos fragmentos florestais
apresentadas por algumas espécies sugerem que os pequenos fragmentos possam
apresentar um relaxamento nos mecanismos de controle de densidade populacional. Por
exemplo, nós observamos que as espécies Byrsonima sericea DC. e Cupania reacemosa
(Vell.) Radlk. apresentaram densidade média 52 e 36 vezes maior nos pequenos
fragmentos, respectivamente. Em escala local, inimigos naturais como predadores de
sementes, herbívoros e patógenos desempenham um papel fundamental no controle das
densidades populacionais, ocasionando maior mortalidade de sementes e plântulas onde
essas são mais adensadas e próximas à planta parental (Bell et al., 2006; Norghauer et
al., 2006a; Norghauer et al., 2006b), o que contribui para uma maior coexistência de
espécies (Harms et al., 2000). Todavia, a fragmentação florestal e as perturbações
decorrentes desta, principalmente os efeitos de borda, podem afetar negativamente esses
inimigos naturais, comprometendo o controle populacional de determinadas espécies. O
estudo dos mecanismos de mortalidade em florestas fragmentadas pode ajudar a
elucidar os reais fatores que contribuem para o incremento de pioneiras, dado que
inimigos naturais podem ser mais influentes no recrutamento de espécies que fatores
ambientais (Wright, 2002).
Em conclusão, mesmo após 200 anos de fragmentação, pequenos fragmentos
circundados por matrizes não florestadas podem continuar a apresentar respostas
negativas a fragmentação e perda de habitat. Dessa forma, a perda de espécies
documentada até o momento (Santo-Silva et al., 2013; Santos et al., 2008) pode ser
ainda mais drástica no futuro. Além disso, a flora futura desses fragmentos
provavelmente apresentará valores de similaridade florística maiores que os já
65
reportados (Lôbo et al., 2011), contribuindo para a homogeneização biótica. Diante
disso, nós acreditamos que esses pequenos fragmentos florestais, no seu atual estado,
apresentam baixo potencial para a conservação de espécies típicas de floresta madura.
Entretanto, é importante ressaltar que essa conclusão parece não se aplicar para todas as
paisagens severamente fragmentadas (Arroyo-Rodriguez et al., 2009; Sanchez-Gallen et
al., 2010). Paisagens como a de Serra Grande continuarão a apresentar assembleias
empobrecidas enquanto os fragmentos florestais persistirem totalmente influenciados
pelos efeitos de borda. Iniciativas de conservação que visem mitigar os efeitos de borda
são necessárias para interromper a perda de biodiversidade em pequenos fragmentos
florestais. Se esses efeitos não forem mitigados, a capacidade de manutenção de
biodiversidade nesses fragmentos poderá estar comprometida permanentemente.
66
REFERÊNCIAS
Arroyo-Rodriguez, V., Cavender-Bares, J., Escobar, F., Melo, F.P.L., Tabarelli, M.,
Santos, B.A., 2012. Maintenance of tree phylogenetic diversity in a highly
fragmented rain forest. Journal of Ecology 100, 702-711.
Arroyo-Rodriguez, V., Pineda, E., Escobar, F., Benitez-Malvido, J., 2009. Value of
Small Patches in the Conservation of Plant-Species Diversity in Highly
Fragmented Rainforest. Conservation Biology 23, 729-739.
Bell, T., Freckleton, R.P., Lewis, O.T., 2006. Plant pathogens drive density-dependent
seedling mortality in a tropical tree. Ecology Letters 9, 569-574.
Cramer, J.M., Mesquita, R.C.G., Williamson, G.B., 2007. Forest fragmentation
differentially affects seed dispersal of large and small-seeded tropical trees.
Biological Conservation 137, 415-423.
D'Angelo, S.A., Andrade, A.C.S., Laurance, S.G., Laurance, W.F., Mesquita, R.C.G.,
2004. Inferred causes of tree mortality in fragmented and intact Amazonian
forests. Journal of Tropical Ecology 20, 243-246.
Enquist, B.J., West, G.B., Charnov, E.L., Brown, J.H., 1999. Allometric scaling of
production and life-history variation in vascular plants. Nature 401, 907-911.
FAO, 2011. State of the World’s Forests 2011. Food and Agriculture Organization of
theUnited Nations, Rome.
Fearnside, P.M., Barbosa, K.I., 2004. Accelerating deforestation in Brazilian Amazonia:
towards answering open questions. Environmental Conservation 31, 7-10.
Girão, L.C., Lopes, A.V., Tabarelli, M., Bruna, E.M., 2007. Changes in tree
reproductive traits reduce functional diversity in a fragmented Atlantic Forest
landscape. Plos One 2, e908.

67
Grillo, A.S., Oliveira, M.A., Tabarelli, M., 2005. Árvores, In Diversidade biológica e
conservação da floresta Atlântica ao norte do rio São Francisco. eds K. Pôrto,
J.S. Almeida-Cortez, M. Tabarelli, pp. 191-216. Ministério do Meio Ambiente,
Brasília.
Grime, J.P., Hunt, R., 1975. Relative growth-rate: its range and adaptive significance in
a local flora. Journal of Ecology 63, 393-422.
Harms, K.E., Wright, S.J., Calderon, O., Hernandez, A., Herre, E.A., 2000. Pervasive
density-dependent recruitment enhances seedling diversity in a tropical forest.
Nature 404, 493-495.
Hartshorn, G.S., 1978. Treefalls and tropical forest dynamics, In Tropical trees as living
systems. eds P.B. Tomlinson, M.H. Zimmermann, pp. 617–638. Cambridge
University Press, New York.
Kapos, V., 1989. Effects of isolation on the water status of forest patches in the
Brazilian Amazon. Journal of Tropical Ecology 5, 173-185.
Laurance, W.F., 2005. When bigger is better: the need for Amazonian mega-reserves.
Trends in ecology & evolution 20, 645-648.
Laurance, W.F., Camargo, J.L.C., Luizao, R.C.C., Laurance, S.G., Pimm, S.L., Bruna,
E.M., Stouffer, P.C., Williamson, G.B., Benitez-Malvido, J., Vasconcelos,
H.L., Van Houtan, K.S., Zartman, C.E., Boyle, S.A., Didham, R.K., Andrade,
A., Lovejoy, T.E., 2011. The fate of Amazonian forest fragments: A 32-year
investigation. Biological Conservation 144, 56-67.
Laurance, W.F., Curran, T.J., 2008. Impacts of wind disturbance on fragmented tropical
forests: A review and synthesis. Austral Ecology 33, 399-408.
68
Laurance, W.F., Delamonica, P., Laurance, S.G., Vasconcelos, H.L., Lovejoy, T.E.,
2000. Conservation - Rainforest fragmentation kills big trees. Nature 404, 836-
836.
Laurance, W.F., Ferreira, L.V., Rankin-De Merona, J.M., Laurance, S.G., Hutchings,
R.W., Lovejoy, T.E., 1998. Effects of forest fragmentation on recruitment
patterns in Amazonian tree communities. Conservation Biology 12, 460-464.
Laurance, W.F., Nascimento, H.E.M., Laurance, S.G., Andrade, A.C., Fearnside, P.M.,
Ribeiro, J.E.L., Capretz, R.L., 2006. Rain forest fragmentation and the
proliferation of successional trees. Ecology 87, 469-482.
Lôbo, D., Leão, T., Melo, F.P.L., Santos, A.M.M., Tabarelli, M., 2011. Forest
fragmentation drives Atlantic forest of northeastern Brazil to biotic
homogenization. Diversity and Distributions 17, 287-296.
Lopes, A.V., Girao, L.C., Santos, B.A., Peres, C.A., Tabarelli, M., 2009. Long-term
erosion of tree reproductive trait diversity in edge-dominated Atlantic forest
fragments. Biological Conservation 142, 1154-1165.
Lorenzi, H., 1992. Árvores brasileiras. Plantarum, Nova Odessa.
Magurran, A.E., 1988. Ecological diversity and its measurement. Cambridge University
Press, Cambridge.
Melo, F.P.L., Arroyo-Rodriguez, V., Fahrig, L., Martinez-Ramos, M., Tabarelli, M.,
2013. On the hope for biodiversity-friendly tropical landscapes. Trends in
ecology & evolution 28, 462-468.
Melo, F.P.L., Dirzo, R., Tabarelli, M., 2006. Biased seed rain in forest edges: Evidence
from the Brazilian Atlantic forest. Biological Conservation 132, 50-60.

69
Melo, F.P.L., Lemire, D., Tabarelli, M., 2007. Extirpation of large-seeded seedlings
from the edge of a large Brazilian Atlantic forest fragment. Ecoscience 14,
124-129.
Melo, F.P.L., Martinez-Salas, E., Benitez-Malvido, J., Ceballos, G., 2010. Forest
fragmentation reduces recruitment of large-seeded tree species in a semi-
deciduous tropical forest of southern Mexico. Journal of Tropical Ecology 26,
35-43.
Michalski, F., Nishi, I., Peres, C.A., 2007. Disturbance-mediated drift in tree functional
groups in Amazonian forest fragments. Biotropica 39, 691-701.
Norghauer, J.M., Malcolm, J.R., Zimmerman, B.L., 2006a. Juvenile mortality and
attacks by a specialist herbivore increase with conspecific adult basal area of
Amazonian Swietenia macrophylla (Meliaceae). Journal of Tropical Ecology
22, 451-460.
Norghauer, J.M., Malcolm, J.R., Zimmerman, B.L., Felfili, J.M., 2006b. An
experimental test of density- and distant-dependent recruitment of mahogany
(Swietenia macrophylla) in southeastern Amazonia. Oecologia 148, 437-446.
Oliveira, M.A., 2007. Fragmentação e riqueza de árvores em escala local e regional na
floresta Atlântica nordestina: implicações para a conservação, In Departamento
de Botânica. Universidade Federal de Pernambuco, Recife.
Oliveira, M.A., Grillo, A.S., Tabarelli, M., 2004. Forest edge in the Brazilian Atlantic
forest: drastic changes in tree species assemblages. Oryx 38, 389-394.
Oliveira, M.A., Santos, A.M.M., Tabarelli, M., 2008. Profound impoverishment of the
large-tree stand in a hyper-fragmented landscape of the Atlantic forest. Forest
Ecology and Management 256, 1910-1917.

70
Peres, C.A., 2005. Why we need megareserves in Amazonia. Conservation Biology 19,
728-733.
Peres, C.A., Palacios, E., 2007. Basin-wide effects of game harvest on vertebrate
population densities in Amazonian forests: Implications for animal-mediated
seed dispersal. Biotropica 39, 304-315.
Portes, P.V.A., 2012. Chuva de sementes em uma paisagem de floresta Atlântica:
graves falhas no processo de dispersão de sementes, In Departament of Botany.
Universidade Federal de Pernambuco, Recife.
Pütz, S., Groeneveld, J., Alves, L.F., Metzger, J.P., Huth, A., 2011. Fragmentation
drives tropical forest fragments to early successional states: A modelling study
for Brazilian Atlantic forests. Ecological Modelling 222, 1986-1997.
R Core Team, 2012. R: A language and environment for statistical computing. R
Foundation for Statistical Computing, Vienna, http://www.R-project.org/.
Ribeiro, M.C., Metzger, J.P., Martensen, A.C., Ponzoni, F.J., Hirota, M.M., 2009. The
Brazilian Atlantic Forest: How much is left, and how is the remaining forest
distributed? Implications for conservation. Biological Conservation 142, 1141-
1153.
Sala, O.E., Chapin, F.S., Armesto, J.J., Berlow, E., Bloomfield, J., Dirzo, R., Huber-
Sanwald, E., Huenneke, L.F., Jackson, R.B., Kinzig, A., Leemans, R., Lodge,
D.M., Mooney, H.A., Oesterheld, M., Poff, N.L., Sykes, M.T., Walker, B.H.,
Walker, M., Wall, D.H., 2000. Biodiversity - Global biodiversity scenarios for
the year 2100. Science 287, 1770-1774.
Sanchez-Gallen, I., Alvarez-Sanchez, F.J., Benitez-Malvido, J., 2010. Structure of the
advanced regeneration community in tropical rain forest fragments of Los
Tuxtlas, Mexico. Biological Conservation 143, 2111-2118.

71
Santo-Silva, E.E., Almeida, W.R., Melo, F.P.L., Zickel, C.S., Tabarelli, M., 2013. The
Nature of Seedling Assemblages in a Fragmented Tropical Landscape:
Implications for Forest Regeneration. Biotropica 45, 386-394.
Santos, B.A., Arroyo-Rodriguez, V., Moreno, C.E., Tabarelli, M., 2010. Edge-Related
Loss of Tree Phylogenetic Diversity in the Severely Fragmented Brazilian
Atlantic Forest. Plos One 5.
Santos, B.A., Peres, C.A., Oliveira, M.A., Grillo, A., Alves-Costa, C.P., Tabarelli, M.,
2008. Drastic erosion in functional attributes of tree assemblages in Atlantic
forest fragments of northeastern Brazil. Biological Conservation 141, 249-260.
Santos, G.G.A., Santos, B.A., Nascimento, H.E.M., Tabarelli, M., 2012. Contrasting
Demographic Structure of Short- and Long-lived Pioneer Tree Species on
Amazonian Forest Edges. Biotropica 44, 771-778.
Silva, J.M.C., Tabarelli, M., 2000. Tree species impoverishment and the future flora of
the Atlantic forest of northeast Brazil. Nature 404, 72-74.
Tabarelli, M., Aguiar, A.V., Girao, L.C., Peres, C.A., Lopes, A.V., 2010. Effects of
Pioneer Tree Species Hyperabundance on Forest Fragments in Northeastern
Brazil. Conservation Biology 24, 1654-1663.
Tabarelli, M., Lopes, A.V., Peres, C.A., 2008. Edge-effects Drive Tropical Forest
Fragments Towards an Early-Successional System. Biotropica 40, 657-661.
Tabarelli, M., Mantovani, W., Peres, C.A., 1999. Effects of habitat fragmentation on
plant guild structure in the montane Atlantic forest of southeastern Brazil.
Biological Conservation 91, 119-127.
Tabarelli, M., Peres, C.A., 2002. Abiotic and vertebrate seed dispersal in the Brazilian
Atlantic forest: implications for forest regeneration. Biological Conservation
106, 165-176.
72
Tabarelli, M., Peres, C.A., Melo, F.P.L., 2012. The 'few winners and many losers'
paradigm revisited: Emerging prospects for tropical forest biodiversity.
Biological Conservation 155, 136-140.
van Roosmalen, M.G.M., 1985. Fruits of the Guianan flora. Institute of Systematic
Botany, Utrecht.
Veloso, H.P., Rangel-Filho, A.L.R., Lima, J.C.A., 1991. Classificação da vegetação
brasileira adaptada a um sistema universal. IBGE, Rio de Janeiro.
Wright, S.J., 2002. Plant diversity in tropical forests: a review of mechanisms of species
coexistence. Oecologia 130, 1-14.
Zanne, A.E., Lopez-Gonzalez, G., Coomes, D.A., Ilic, J., Jansen, S., Lewis, S.L.,
Miller, R.B., Swenson, N.G., Wiemann, M.C., Chave, J., 2009. Global wood
density database, In Data from: Towards a worldwide wood economics
spectrum. Dryad Digital Repository. doi:10.5061/dryad.234.
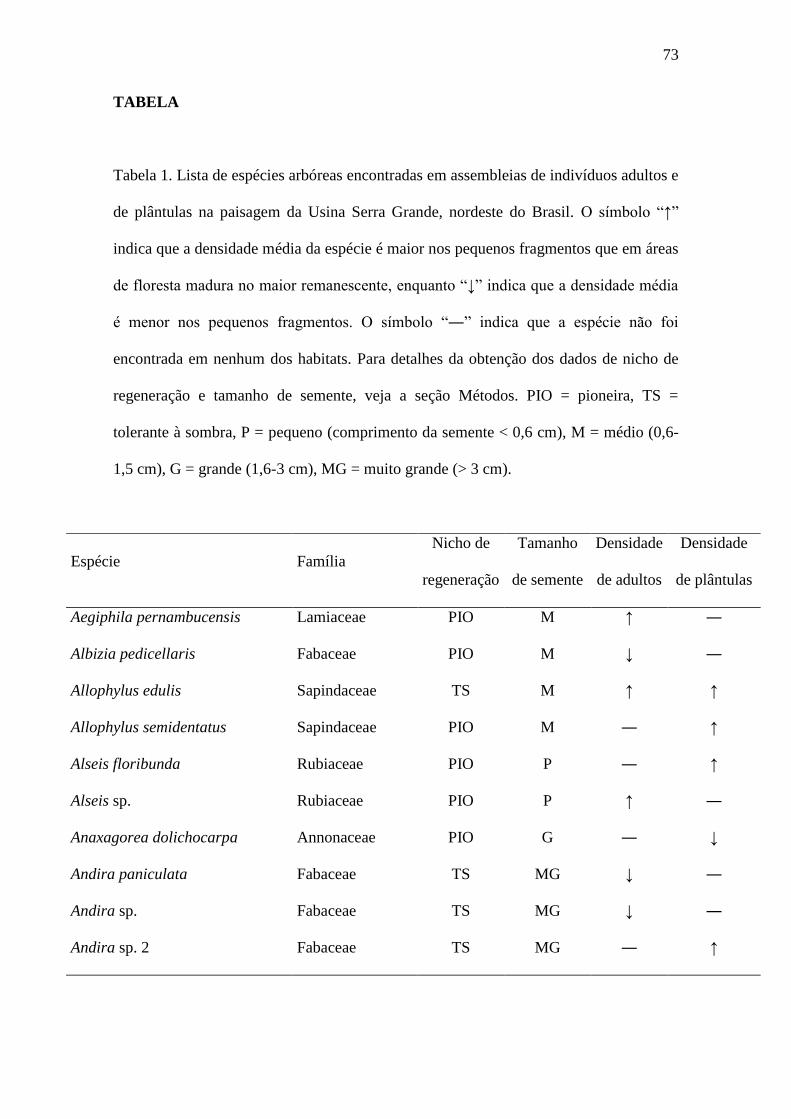
73
TABELA
Tabela 1. Lista de espécies arbóreas encontradas em assembleias de indivíduos adultos e
de plântulas na paisagem da Usina Serra Grande, nordeste do Brasil. O símbolo “↑”
indica que a densidade média da espécie é maior nos pequenos fragmentos que em áreas
de floresta madura no maior remanescente, enquanto “↓” indica que a densidade média
é menor nos pequenos fragmentos. O símbolo “―” indica que a espécie não foi
encontrada em nenhum dos habitats. Para detalhes da obtenção dos dados de nicho de
regeneração e tamanho de semente, veja a seção Métodos. PIO = pioneira, TS =
tolerante à sombra, P = pequeno (comprimento da semente < 0,6 cm), M = médio (0,6-
1,5 cm), G = grande (1,6-3 cm), MG = muito grande (> 3 cm).
Espécie Família
Nicho de
regeneração
Tamanho
de semente
Densidade
de adultos
Densidade
de plântulas
Aegiphila pernambucensis Lamiaceae PIO M ↑ ―
Albizia pedicellaris Fabaceae PIO M ↓ ―
Allophylus edulis Sapindaceae TS M ↑ ↑
Allophylus semidentatus Sapindaceae PIO M ― ↑
Alseis floribunda Rubiaceae PIO P ― ↑
Alseis sp. Rubiaceae PIO P ↑ ―
Anaxagorea dolichocarpa Annonaceae PIO G ― ↓
Andira paniculata Fabaceae TS MG ↓ ―
Andira sp. Fabaceae TS MG ↓ ―
Andira sp. 2 Fabaceae TS MG ― ↑
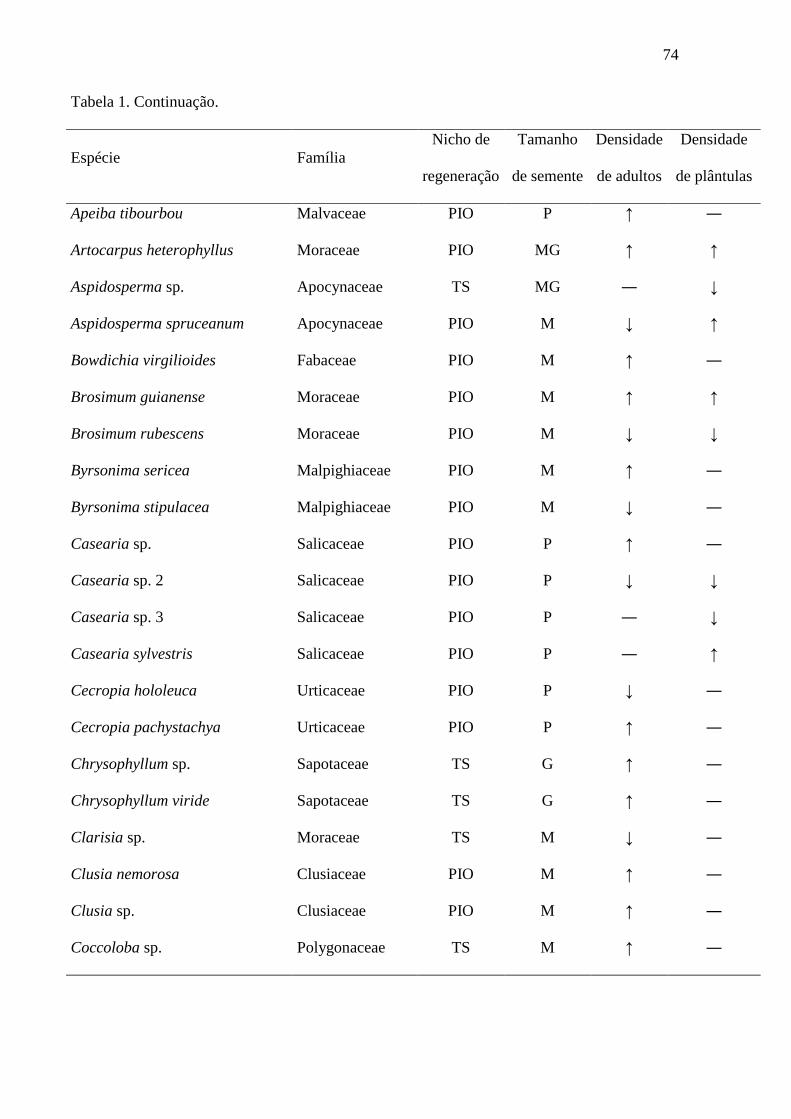
74
Tabela 1. Continuação.
Espécie Família
Nicho de
regeneração
Tamanho
de semente
Densidade
de adultos
Densidade
de plântulas
Apeiba tibourbou Malvaceae PIO P ↑ ―
Artocarpus heterophyllus Moraceae PIO MG ↑ ↑
Aspidosperma sp. Apocynaceae TS MG ― ↓
Aspidosperma spruceanum Apocynaceae PIO M ↓ ↑
Bowdichia virgilioides Fabaceae PIO M ↑ ―
Brosimum guianense Moraceae PIO M ↑ ↑
Brosimum rubescens Moraceae PIO M ↓ ↓
Byrsonima sericea Malpighiaceae PIO M ↑ ―
Byrsonima stipulacea Malpighiaceae PIO M ↓ ―
Casearia sp. Salicaceae PIO P ↑ ―
Casearia sp. 2 Salicaceae PIO P ↓ ↓
Casearia sp. 3 Salicaceae PIO P ― ↓
Casearia sylvestris Salicaceae PIO P ― ↑
Cecropia hololeuca Urticaceae PIO P ↓ ―
Cecropia pachystachya Urticaceae PIO P ↑ ―
Chrysophyllum sp. Sapotaceae TS G ↑ ―
Chrysophyllum viride Sapotaceae TS G ↑ ―
Clarisia sp. Moraceae TS M ↓ ―
Clusia nemorosa Clusiaceae PIO M ↑ ―
Clusia sp. Clusiaceae PIO M ↑ ―
Coccoloba sp. Polygonaceae TS M ↑ ―
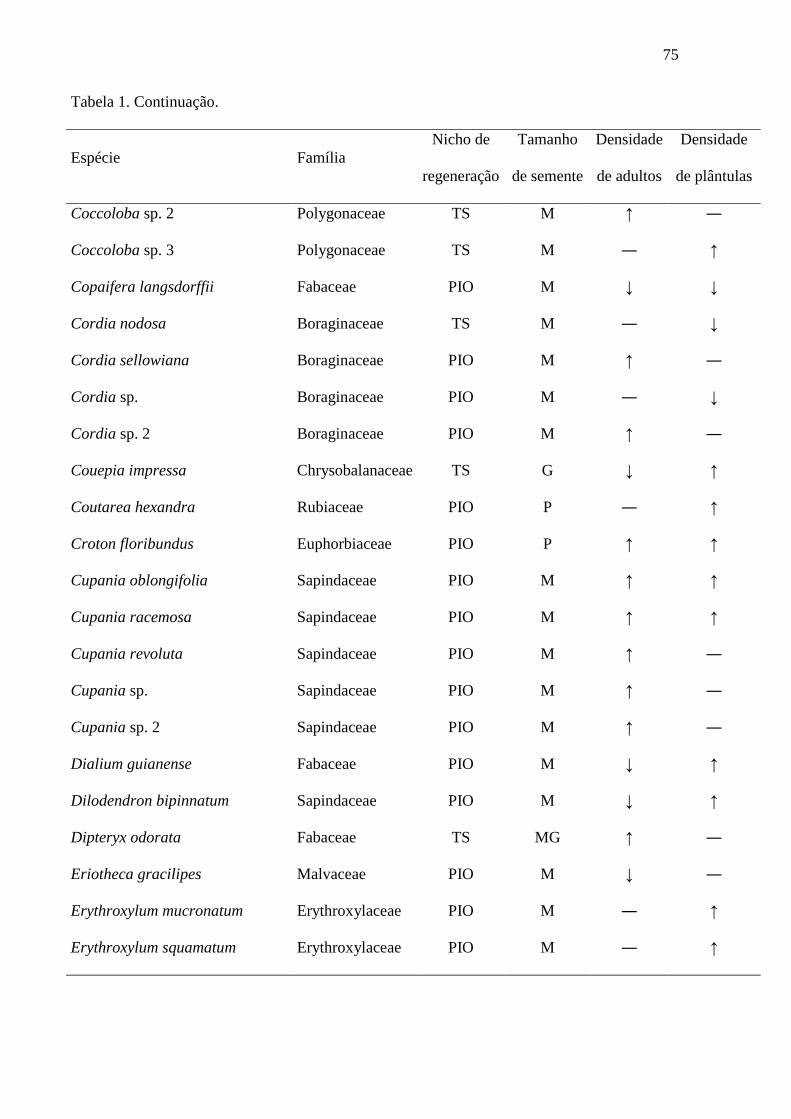
75
Tabela 1. Continuação.
Espécie Família
Nicho de
regeneração
Tamanho
de semente
Densidade
de adultos
Densidade
de plântulas
Coccoloba sp. 2 Polygonaceae TS M ↑ ―
Coccoloba sp. 3 Polygonaceae TS M ― ↑
Copaifera langsdorffii Fabaceae PIO M ↓ ↓
Cordia nodosa Boraginaceae TS M ― ↓
Cordia sellowiana Boraginaceae PIO M ↑ ―
Cordia sp. Boraginaceae PIO M ― ↓
Cordia sp. 2 Boraginaceae PIO M ↑ ―
Couepia impressa Chrysobalanaceae TS G ↓ ↑
Coutarea hexandra Rubiaceae PIO P ― ↑
Croton floribundus Euphorbiaceae PIO P ↑ ↑
Cupania oblongifolia Sapindaceae PIO M ↑ ↑
Cupania racemosa Sapindaceae PIO M ↑ ↑
Cupania revoluta Sapindaceae PIO M ↑ ―
Cupania sp. Sapindaceae PIO M ↑ ―
Cupania sp. 2 Sapindaceae PIO M ↑ ―
Dialium guianense Fabaceae PIO M ↓ ↑
Dilodendron bipinnatum Sapindaceae PIO M ↓ ↑
Dipteryx odorata Fabaceae TS MG ↑ ―
Eriotheca gracilipes Malvaceae PIO M ↓ ―
Erythroxylum mucronatum Erythroxylaceae PIO M ― ↑
Erythroxylum squamatum Erythroxylaceae PIO M ― ↑
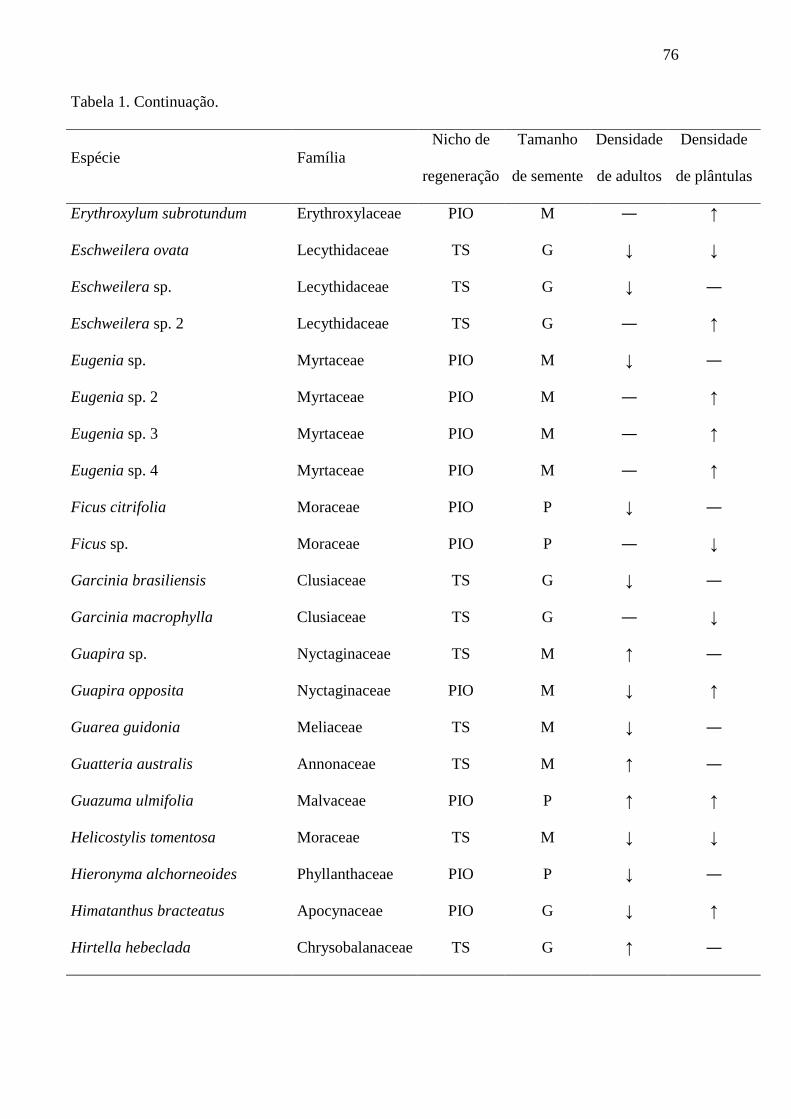
76
Tabela 1. Continuação.
Espécie Família
Nicho de
regeneração
Tamanho
de semente
Densidade
de adultos
Densidade
de plântulas
Erythroxylum subrotundum Erythroxylaceae PIO M ― ↑
Eschweilera ovata Lecythidaceae TS G ↓ ↓
Eschweilera sp. Lecythidaceae TS G ↓ ―
Eschweilera sp. 2 Lecythidaceae TS G ― ↑
Eugenia sp. Myrtaceae PIO M ↓ ―
Eugenia sp. 2 Myrtaceae PIO M ― ↑
Eugenia sp. 3 Myrtaceae PIO M ― ↑
Eugenia sp. 4 Myrtaceae PIO M ― ↑
Ficus citrifolia Moraceae PIO P ↓ ―
Ficus sp. Moraceae PIO P ― ↓
Garcinia brasiliensis Clusiaceae TS G ↓ ―
Garcinia macrophylla Clusiaceae TS G ― ↓
Guapira sp. Nyctaginaceae TS M ↑ ―
Guapira opposita Nyctaginaceae PIO M ↓ ↑
Guarea guidonia Meliaceae TS M ↓ ―
Guatteria australis Annonaceae TS M ↑ ―
Guazuma ulmifolia Malvaceae PIO P ↑ ↑
Helicostylis tomentosa Moraceae TS M ↓ ↓
Hieronyma alchorneoides Phyllanthaceae PIO P ↓ ―
Himatanthus bracteatus Apocynaceae PIO G ↓ ↑
Hirtella hebeclada Chrysobalanaceae TS G ↑ ―
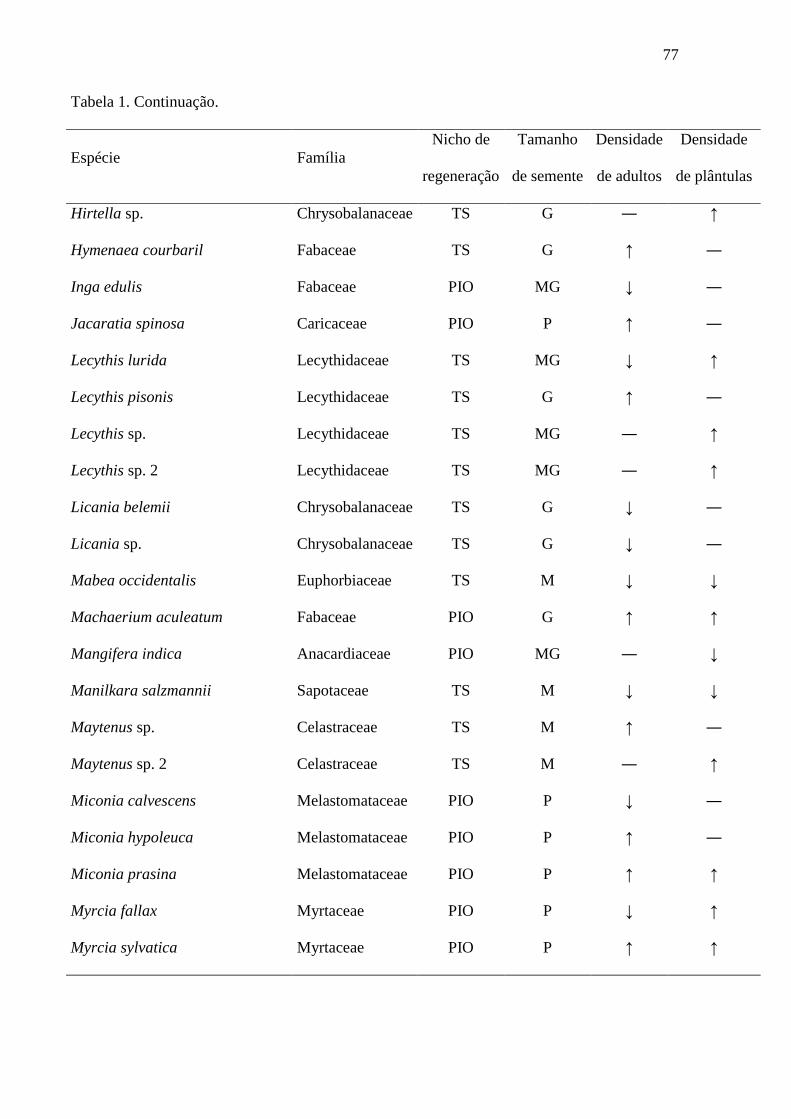
77
Tabela 1. Continuação.
Espécie Família
Nicho de
regeneração
Tamanho
de semente
Densidade
de adultos
Densidade
de plântulas
Hirtella sp. Chrysobalanaceae TS G ― ↑
Hymenaea courbaril Fabaceae TS G ↑ ―
Inga edulis Fabaceae PIO MG ↓ ―
Jacaratia spinosa Caricaceae PIO P ↑ ―
Lecythis lurida Lecythidaceae TS MG ↓ ↑
Lecythis pisonis Lecythidaceae TS G ↑ ―
Lecythis sp. Lecythidaceae TS MG ― ↑
Lecythis sp. 2 Lecythidaceae TS MG ― ↑
Licania belemii Chrysobalanaceae TS G ↓ ―
Licania sp. Chrysobalanaceae TS G ↓ ―
Mabea occidentalis Euphorbiaceae TS M ↓ ↓
Machaerium aculeatum Fabaceae PIO G ↑ ↑
Mangifera indica Anacardiaceae PIO MG ― ↓
Manilkara salzmannii Sapotaceae TS M ↓ ↓
Maytenus sp. Celastraceae TS M ↑ ―
Maytenus sp. 2 Celastraceae TS M ― ↑
Miconia calvescens Melastomataceae PIO P ↓ ―
Miconia hypoleuca Melastomataceae PIO P ↑ ―
Miconia prasina Melastomataceae PIO P ↑ ↑
Myrcia fallax Myrtaceae PIO P ↓ ↑
Myrcia sylvatica Myrtaceae PIO P ↑ ↑

78
Tabela 1. Continuação.
Espécie Família
Nicho de
regeneração
Tamanho
de semente
Densidade
de adultos
Densidade
de plântulas
Ocotea glomerata Lauraceae PIO M ↑ ―
Ocotea sp. Lauraceae TS M ↑ ―
Ocotea sp. 2 Lauraceae TS M ↑ ―
Ocotea sp. 3 Lauraceae TS M ↑ ―
Ouratea castaneifolia Ochnaceae PIO P ↓ ↑
Ouratea sp. Ochnaceae PIO P ― ↑
Paypayrola blanchetiana Violaceae PIO M ― ↓
Paypayrola sp. Violaceae TS M ↑ ―
Plathymenia foliolosa Fabaceae PIO M ↑ ↑
Posoqueria latifolia Rubiaceae PIO M ― ↑
Pourouma guianensis Urticaceae PIO G ↓ ↓
Protium giganteum Burseraceae TS M ↓ ―
Protium heptaphyllum Burseraceae TS M ↓ ↑
Protium sp. Burseraceae TS M ↑ ―
Protium sp. 2 Burseraceae TS M ― ↓
Protium sp. 3 Burseraceae TS M ↑ ―
Psychotria carthagenensis Rubiaceae PIO P ― ↑
Psychotria vellosiana Rubiaceae TS P ↑ ―
Pterocarpus violaceus Fabaceae PIO M ↓ ↓
Quararibea turbinata Malvaceae PIO G ↓ ↓
Quiina sp. Ochnaceae TS G ― ↓
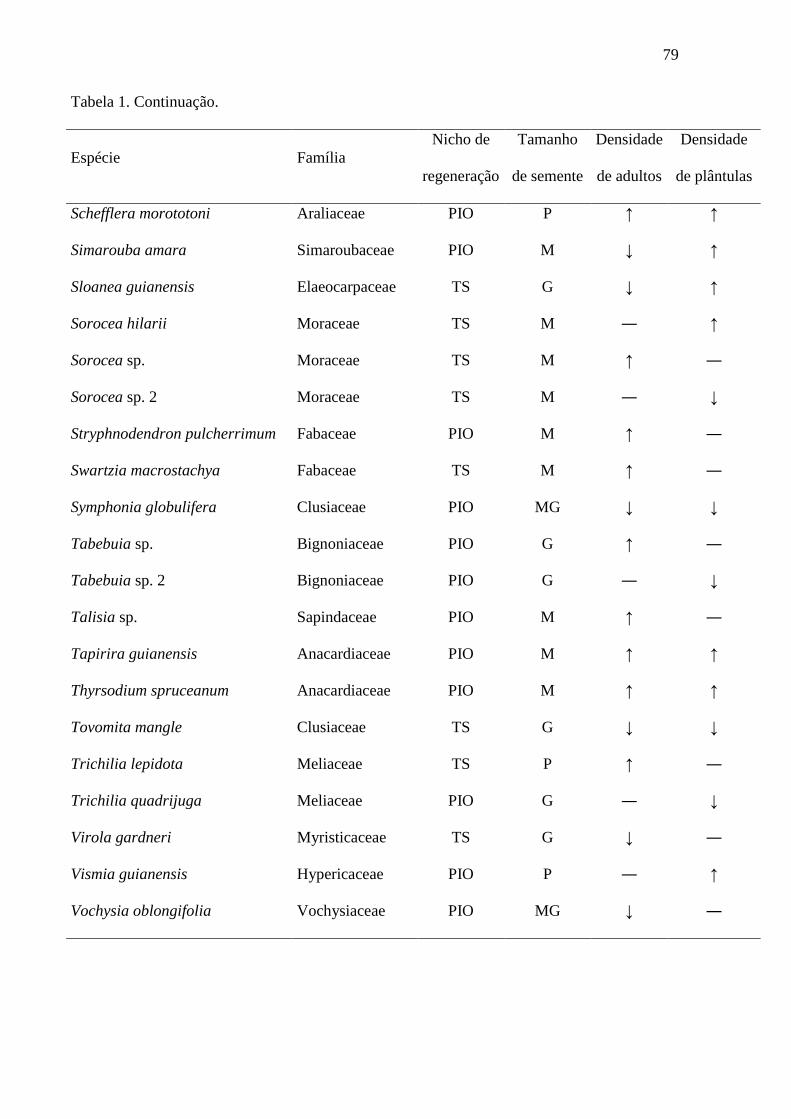
79
Tabela 1. Continuação.
Espécie Família
Nicho de
regeneração
Tamanho
de semente
Densidade
de adultos
Densidade
de plântulas
Schefflera morototoni Araliaceae PIO P ↑ ↑
Simarouba amara Simaroubaceae PIO M ↓ ↑
Sloanea guianensis Elaeocarpaceae TS G ↓ ↑
Sorocea hilarii Moraceae TS M ― ↑
Sorocea sp. Moraceae TS M ↑ ―
Sorocea sp. 2 Moraceae TS M ― ↓
Stryphnodendron pulcherrimum Fabaceae PIO M ↑ ―
Swartzia macrostachya Fabaceae TS M ↑ ―
Symphonia globulifera Clusiaceae PIO MG ↓ ↓
Tabebuia sp. Bignoniaceae PIO G ↑ ―
Tabebuia sp. 2 Bignoniaceae PIO G ― ↓
Talisia sp. Sapindaceae PIO M ↑ ―
Tapirira guianensis Anacardiaceae PIO M ↑ ↑
Thyrsodium spruceanum Anacardiaceae PIO M ↑ ↑
Tovomita mangle Clusiaceae TS G ↓ ↓
Trichilia lepidota Meliaceae TS P ↑ ―
Trichilia quadrijuga Meliaceae PIO G ― ↓
Virola gardneri Myristicaceae TS G ↓ ―
Vismia guianensis Hypericaceae PIO P ― ↑
Vochysia oblongifolia Vochysiaceae PIO MG ↓ ―
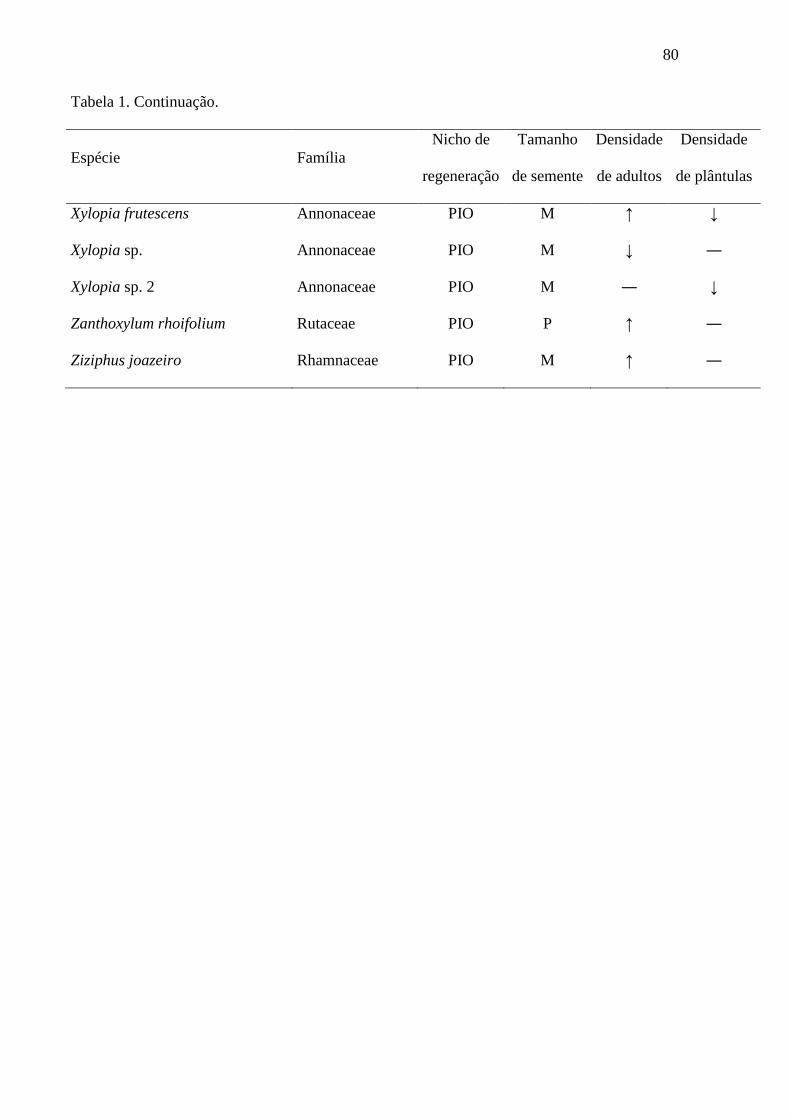
80
Tabela 1. Continuação.
Espécie Família
Nicho de
regeneração
Tamanho
de semente
Densidade
de adultos
Densidade
de plântulas
Xylopia frutescens Annonaceae PIO M ↑ ↓
Xylopia sp. Annonaceae PIO M ↓ ―
Xylopia sp. 2 Annonaceae PIO M ― ↓
Zanthoxylum rhoifolium Rutaceae PIO P ↑ ―
Ziziphus joazeiro Rhamnaceae PIO M ↑ ―

81
LEGENDAS DAS FIGURAS
Figura 1. Localização da paisagem da Usina Serra Grande, nordeste do Brasil. O
desenho esquemático mostra a distribuição dos 19 pequenos fragmentos florestais
estudados (< 100 ha) e do maior remanescente florestal da paisagem, o fragmento de
Coimbra (3500 ha).
Figura 2. Em A e B, relação entre a densidade média das espécies arbóreas em floresta
madura e pequenos fragmentos na paisagem da Usina Serra Grande, nordeste do Brasil.
Note que os eixos x e y apresentam a mesma amplitude de valores, logo, pontos acima
da linha tracejada representam espécies com densidades maiores nos fragmentos
florestais. Em C e D, relação entre a razão da densidade das espécies em pequenos
fragmentos pela densidade na floresta madura e o nicho de regeneração (em ambas, P <
0.05). A e C são referentes à assembleia de adultos, enquanto B e D demonstram os
resultados para a assembleia de plântulas. Em C e D, as caixas representam o 25º e 75º
percentil, as barras de erro indicam o 10º e 90º percentil, enquanto os pontos
representam os valores extremos. As linhas sólidas e tracejadas indicam a mediana e a
média, respectivamente. PFF = pequenos fragmentos florestais; FM = floresta madura.
Figura 3. Comparação entre a densidade média das espécies nas assembleias de adultos
e plântulas na paisagem da usina Serra Grande, nordeste do Brasil. Em A, espécies
tolerantes à sombra. Em B, espécies pioneiras. Cada seta descreve uma espécie, onde a
base da seta representa a densidade na assembleia de adultos e a ponta da seta indica a
densidade na assembleia de plântulas. Devido ao grande número de espécies, aquelas
espécies em que apenas os adultos foram encontrados foram colocadas em cinza claro.

82
Note que os eixos x e y apresentam a mesma amplitude de valores, logo, pontos acima
da linha tracejada representam espécies com densidades maiores nos fragmentos
florestais. PFF = pequenos fragmentos florestais; FM = floresta madura.
Figura 4. Ranking de espécies em função da abundância relativa (A e B) e do número de
parcelas em que foram encontradas (C e D). A e C descrevem a floresta madura,
enquanto B e D representam os pequenos fragmentos florestais na paisagem da usina
Serra Grande, nordeste do Brasil.
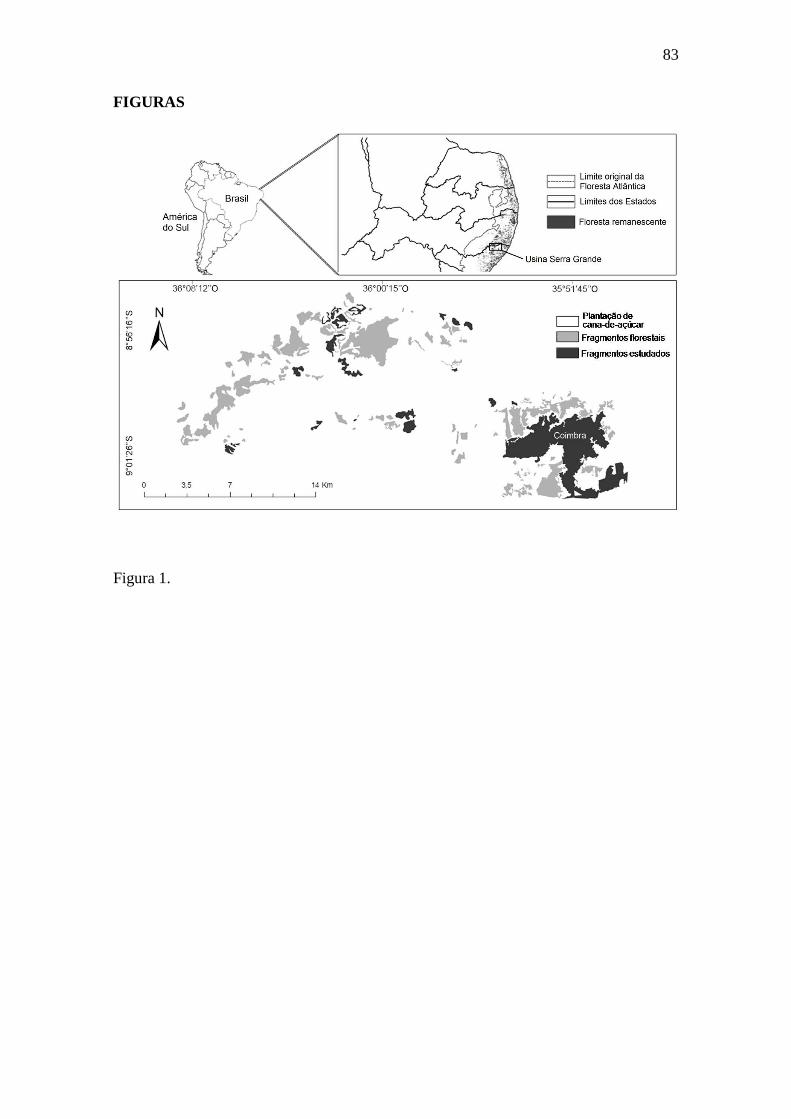
83
FIGURAS
Figura 1.
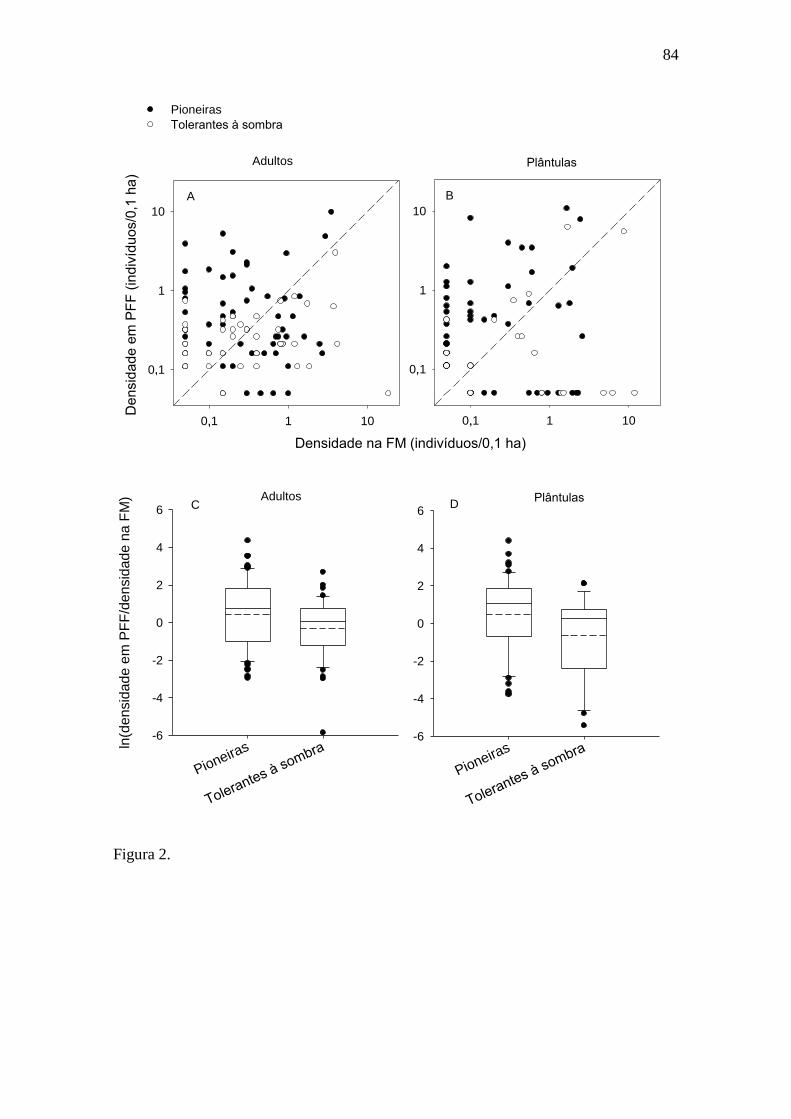
84
Figura 2.
Densidade na FM (indivíduos/0,1 ha)
0.1 1 10
De
nsid
ad
e e
m P
FF
(in
div
ídu
os/0
,1 h
a)
0.1
1
10
Pioneiras
Tolerantes à sombra
0.1 1 10
0.1
1
10
A B
Pioneiras
Tolerantes à sombraln(d
en
sid
ad
e e
m P
FF
/de
nsid
ad
e n
a F
M)
-6
-4
-2
0
2
4
6
Pioneiras
Tolerantes à sombra-6
-4
-2
0
2
4
6C D
Adultos Plântulas
Adultos Plântulas
,
,
,
,
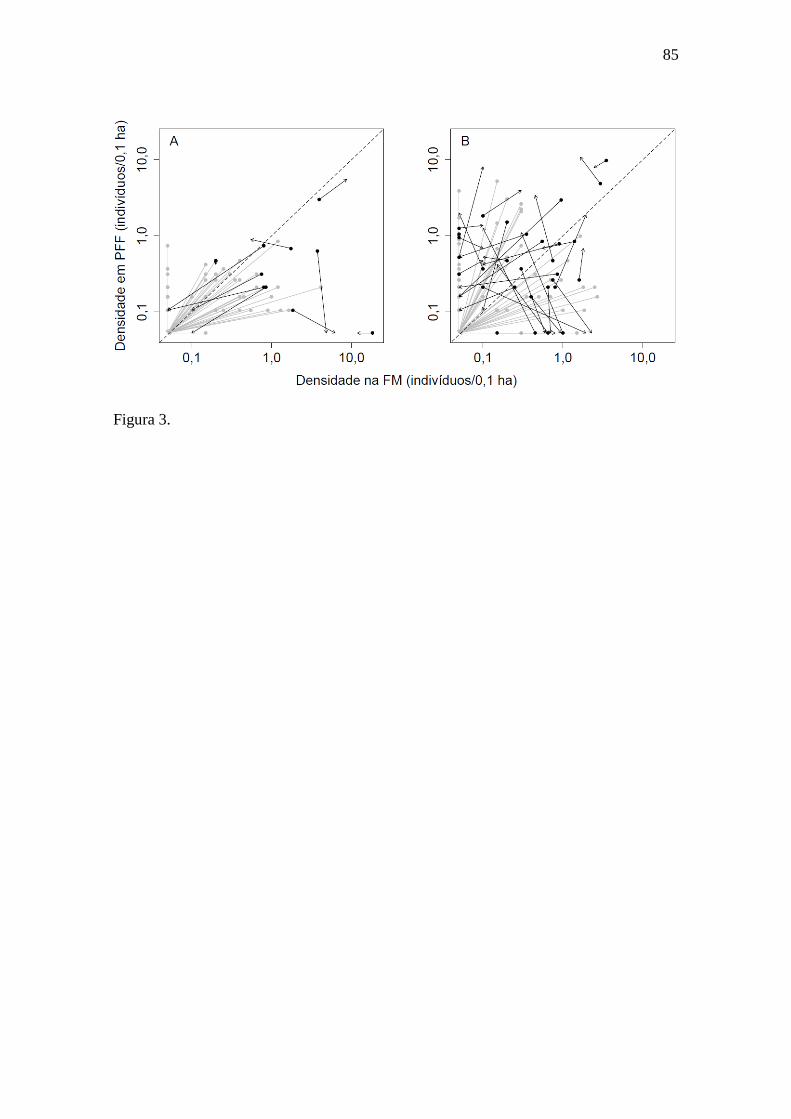
85
Figura 3.
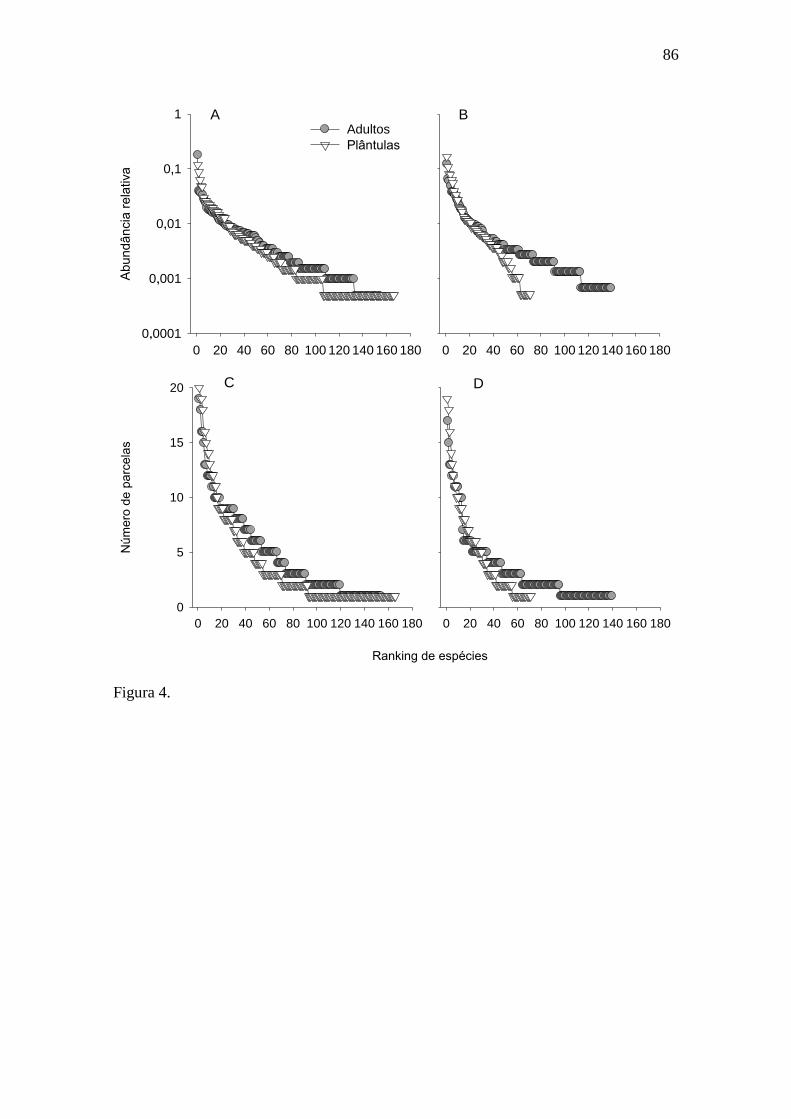
86
Figura 4.
0 20 40 60 80 100 120 140 160 180
Ab
un
dâ
ncia
re
lativa
0.0001
0.001
0.01
0.1
1
Adultos
Plântulas
0 20 40 60 80 100 120 140 160 180
A B
Ranking de espécies
0 20 40 60 80 100 120 140 160 180
Núm
ero
de
pa
rcela
s
0
5
10
15
20
0 20 40 60 80 100 120 140 160 180
C D
,
,
,
,
87
5. CAPÍTULO 2
DISTRIBUIÇÃO ESPACIAL DE ÁRVORES: INFERÊNCIAS DO PAPEL DA
MORTALIDADE DEPENDENTE DA DENSIDADE E DISTÂNCIA EM UMA
PAISAGEM FRAGMENTADA
Edgar E. Santo-Silva1,3
, Michael Kröencke2, Marcelo Tabarelli
1
1 Universidade Federal de Pernambuco, Departamento de Botânica, Av. Prof. Moraes
Rego, S/N, Cidade Universitária, 50670-901, Recife-PE, Brasil.
2 Bremen University of Applied Sciences, Bremen, Alemanha.
3 e-mail: [email protected]
Manuscrito a ser submetido ao periódico Biotropica.

88
RESUMO
Embora os mecanismos de mortalidade dependente da densidade e distância propostos
no modelo de Janzen-Connell sejam considerados os principais responsáveis pela alta
coexistência de espécies arbóreas em florestas tropicais, o funcionamento desses
mecanismos em florestas fragmentadas tem sido pouco explorado. Neste estudo, nós
analisamos a distribuição espacial de árvores adultas e jovens para inferir se existe uma
redução na distância de recrutamento e uma agregação nas populações em pequenos
fragmentos florestais. Em uma paisagem fragmentada de floresta Atlântica, nós
amostramos assembleias de árvores jovens e adultas em sete pequenos fragmentos
florestais (10,2-79,6 ha) e em áreas de floresta madura no interior do maior
remanescente (ca. 3500 ha). Quando analisadas todas as espécies, pequenos fragmentos
e áreas de floresta madura não diferiram com relação à distância entre os jovens e os
adultos coespecíficos mais próximos, estando a maioria dos jovens localizada a 8-10 m
do adulto. Entretanto, ao analisar apenas as espécies pioneiras, nós observamos que a
maioria (26,3 %) dos indivíduos jovens nos pequenos fragmentos se localizava a apenas
2-4 m do adulto, enquanto nas áreas de floresta madura a maioria (23,9 %) estava a 8-10
m. Além disso, exceto pela pequena redução na distância média entre adultos
coespecíficos (2 m), não encontramos evidências que demonstrem uma agregação das
populações nos pequenos fragmentos florestais, inclusive ao analisar apenas as espécies
pioneiras. Assim, é provável que ocorra um relaxamento na mortalidade dependente da
densidade e distância nas fases iniciais ao menos para plantas pioneiras, porém, esse
possível relaxamento parece não refletir na estruturação de assembleias de árvores
adultas.

89
Palavras-chave: espécies pioneiras, manutenção de biodiversidade, modelo de Janzen-
Connell, florestas tropicais, fragmentação florestal.
90
HÁ MAIS DE 40 ANOS, JANZEN (1970) E CONNELL (1971) PROPUSERAM SEPARADAMENTE
um dos mecanismos mais aceitos para explicar a alta coexistência de espécies em escala
local nas florestas tropicais. O modelo de Janzen-Connell (de agora em diante, modelo
de J-C) propõe que sementes e plântulas próximas à planta parental e/ou adensadas
apresentam menor probabilidade de sobrevivência devido ao maior ataque por inimigos
naturais, como predadores de sementes, herbívoros e patógenos (Augspurger &
Wilkinson 2007, Li et al. 2009, Hautier et al. 2010, Swamy & Terborgh 2010,
Matthesius et al. 2011). Dado que a quantidade de sementes dispersas é maior sob a
copa e diminui com a distância para o adulto parental, a alta mortalidade nas áreas
próximas ao adulto resulta em um pico de recrutamento em distâncias intermediárias
(veja Terborgh et al. 2002, Terborgh & Nuñes-Iturri 2006). Além disso, é importante
ressaltar que a especificidade dos inimigos naturais é fundamental para o modelo de J-
C, pois se esses inimigos não apresentam alvos específicos, qualquer semente ou
plântula pode ser atacada, independentemente se está ou não sob a copa do adulto
parental (Janzen 1970, Hammond & Brown 1998, Wright 2002). Essa mortalidade
dependente da densidade ou distância (MDDD) tem sido amplamente testada, e embora
ainda exista muita discussão a respeito da validade do modelo de J-C, vários trabalhos
reuniram evidências empíricas que comprovam uma maior mortalidade de sementes e
plântulas próximas à planta parental (para uma revisão veja Hammond & Brown 1998,
Carson et al. 2008). De fato, o modelo de J-C propõe uma explicação simples e robusta
para a grande coexistência de espécies, uma vez que o baixo recrutamento de indivíduos
próximos à planta mãe fornece espaço livre para o recrutamento de indivíduos
heteroespecíficos.
Dado o papel desempenhado pelos inimigos naturais em florestas tropicais, é
provável que perturbações que alterem a composição da fauna possam influenciar o

91
padrão de recrutamento e distribuição das espécies (Terborgh 2013). Em paisagens
fragmentadas, por exemplo, assembleias arbóreas têm apresentado além de uma baixa
riqueza de espécies (Benítez-Malvido & Martínez-Ramos 2003, Santos et al. 2008), um
incremento de até 52 vezes na densidade de algumas espécies, principalmente espécies
pioneiras (E. E. Santo-Silva, dados não publicados – Cap. 1). Provavelmente, as
alterações na paisagem e as perturbações decorrentes destas podem minimizar os efeitos
dos mecanismos de MDDD, permitindo uma rápida proliferação das espécies mais
comuns. Por exemplo, a redução do habitat e a caça reduzem populações de vertebrados
em pequenos fragmentos (Chiarello 1999, Farwig et al. 2008), o que pode resultar em
uma menor mortalidade de sementes e plântulas. Além disso, áreas próximas à borda
florestal apresentam uma redução na fauna de herbívoros especialistas e um aumento na
fauna de herbívoros generalistas (Barbosa et al. 2005, Wirth et al. 2008). Herbívoros
generalistas não apresentam alvos específicos e, por isso, podem ocasionar mortalidade
independente da distância para planta parental (Janzen 1970). Dessa forma, é plausível
que algumas espécies nessas paisagens fragmentadas possam estar apresentando um
recrutamento elevado próximo a adultos coespecíficos, resultando em populações mais
agregadas.
Nas últimas décadas, várias abordagens foram criadas para testar a validade do
modelo de J-C (veja Carson et al. 2008). A maioria dos estudos analisou a
sobrevivência de sementes e plântulas em função da distância para o adulto coespecífico
mais próximo (e.g., Wyatt & Silman 2004, Swamy & Terborgh 2010), da densidade de
adultos coespecíficos ao redor (e.g., Norghauer et al. 2006a, Norghauer et al. 2006b) ou
da densidade de sementes e plântulas coespecíficas (e.g., Bell et al. 2006). Todavia, a
análise da distribuição de indivíduos jovens pequenos (i.e., indivíduos que saíram
recentemente do estágio de plântula; de agora em diante apenas jovens) pode fornecer
92
subsídios para inferir o padrão de sobrevivência de sementes e plântulas, uma vez que a
maioria dos indivíduos em florestas tropicais se origina a partir de sementes. Terborgh e
colaboradores (Terborgh et al. 2002, Terborgh & Nuñes-Iturri 2006), avaliando a
distância de indivíduos jovens para o coespecífico mais próximo em várias espécies,
observaram um maior recrutamento fora da área da copa e que diminuía com o aumento
na distância para o indivíduo adulto, assim como proposto pelo modelo de J-C. Essa
abordagem conjunta da distribuição espacial de jovens de todas as espécies nas
assembleias pode ser útil em paisagens fragmentadas, uma vez que pequenos e grandes
fragmentos florestais podem apresentar comunidades com composições taxonômicas
distintas (Santos et al. 2008, Santo-Silva et al. 2013), dificultando a comparação do
recrutamento de uma mesma espécie nesses dois habitats.
Em uma paisagem fragmentada na Floresta Atlântica brasileira, foi demonstrado
que algumas espécies arbóreas apresentam densidades elevadas em pequenos
fragmentos florestais, principalmente espécies pioneiras (E. E. Santo-Silva, dados não
publicados – Cap. 1). Considerando o longo histórico de perturbação dessa floresta, tais
como a forte pressão de caça (Silva & Tabarelli 2000), a perda de habitat (Ranta et al.
1998, Ribeiro et al. 2009) e, consequentemente, os constantes efeitos bordas (Oliveira et
al. 2004, Tabarelli et al. 2008), é provável que a alta densidade de espécies seja
resultado de um relaxamento na MDDD. Assim, nós avaliamos se existe uma redução
na distância de recrutamento e uma agregação nas populações em pequenos fragmentos
florestais. Nós estudamos o padrão de distribuição de árvores em escala local em
fragmentos florestais menores que 80 ha e em áreas de floresta madura em um grande
remanescente e testamos se: (1) indivíduos jovens se estabelecem mais próximos ao
adulto coespecífico em pequenos fragmentos florestais que em áreas de floresta madura;
(2) indivíduos coespecíficos apresentam menor distância entre si nos pequenos
93
fragmentos, tanto no estágio juvenil como adulto. Por último, uma vez que espécies
pioneiras têm apresentado maior incremento em suas densidades nos pequenos
fragmentos dessa paisagem, nós analisamos se os jovens dessas espécies recrutam mais
próximas do adulto coespecífico e se as populações são mais agregadas nos pequenos
fragmentos que nas áreas de floresta madura.
MÉTODOS
ÁREA DE ESTUDO.— O estudo foi realizado em uma paisagem fragmentada de floresta
Atlântica localizada na propriedade da Usina Serra Grande, nordeste do Brasil (8º30’ S,
35º50’ O). A paisagem estudada apresenta 667 km² e consiste de aproximadamente
9000 ha de floresta distribuídos em 109 fragmentos. Esses fragmentos apresentam
tamanhos variando entre 1,67 e 3500 ha e são completamente circundados por uma
matriz homogênea de cana-de-açúcar. O clima é tropical, com precipitação média anual
de 2000 mm e temperatura variando entre 22 e 24 ºC. Para uma caracterização mais
detalhada da floresta Atlântica nordestina e da paisagem de Serra Grande veja Santos et
al. (2008).
Serra Grande representa uma paisagem antiga com aproximadamente 200 anos
de fragmentação, onde a forma e o tamanho dos fragmentos são mantidos estáveis para
garantir o suprimento de água para a irrigação da cana-de-açúcar. Além disso, essa
paisagem possui o maior fragmento da região, o fragmento de Coimbra (3500 ha), que
embora não represente uma floresta contínua, apresenta áreas de floresta madura com
espécies de plantas e animais típicos de áreas não perturbadas de floresta (Santos et al.
2008). Assim como realizado em estudos prévios (e.g., Oliveira et al. 2008, Lopes et al.
2009), essas áreas de floresta madura foram utilizadas como áreas controle.

94
LEVANTAMENTO DA FLORA.— Para o levantamento da flora, nós selecionamos oito
fragmentos florestais: sete pequenos fragmentos com tamanhos variando entre 10,2 e
79,6 ha (média = 44,7 ha; mediana = 43,7 ha); e o fragmento de Coimbra. Para analisar
as assembleias de árvores adultas, nós amostramos todos os indivíduos com DAP ≥ 10
cm em 14 parcelas de 40 m × 40 m, sete nas áreas de floresta madura em Coimbra e sete
nos pequenos fragmentos florestais, sendo uma no centro de cada fragmento. No centro
de cada parcela, nós montamos uma parcela de 20 × 20 m onde foram amostrados todos
os indivíduos jovens entre 1 e 2,5 m de altura. Por fim, as espécies identificadas foram
classificadas de acordo com o nicho de regeneração em: (1) pioneiras – espécies que
regeneram apenas em ambientes com altas taxas de luminosidade como clareiras e áreas
de borda; e (2) tolerantes à sombra – espécies capazes de regenerar em ambientes
sombreados (Hartshorn 1978). Esse critério de classificação foi utilizado anteriormente
em estudos realizados na floresta Atlântica (Oliveira et al. 2004, Santos et al. 2008,
Santo-Silva et al. 2013).
MAPEAMENTO DOS INDIVÍDUOS.— Todos os indivíduos adultos e jovens foram
mapeados dentro das parcelas com o auxílio de trenas. Posteriormente, nós mensuramos
a distância entre os indivíduos jovens e os adultos coespecíficos mais próximo para
todas as espécies cujo jovem e adulto se encontravam na mesma parcela. Como a
distância entre a borda da parcela de jovens e de adultos foi apenas 10 m, é provável que
em alguns casos os indivíduos adultos mais próximos estivessem fora da parcela de 40
× 40 m, não sendo detectado pela nossa amostragem. Nesses casos, nós poderíamos
cometer um erro ao afirmar que um adulto coespecífico dentro da parcela seria o mais
próximo. Para evitar esse erro, nós mensuramos a distância de cada indivíduo jovem
95
para a borda mais próxima da parcela de 40 × 40 m e excluímos da análise todos
aqueles jovens que estavam mais próximos da borda da parcela que do adulto
coespecífico mais próximo. Além disso, para inferir se as populações são mais
agregadas nos pequenos fragmentos que na floresta madura, nós mensuramos em cada
parcela a distância média entre indivíduos jovens coespecíficos e entre adultos
coespecíficos. A distância entre os indivíduos foi calculada como o auxílio do programa
Geographic Distance Matrix Generator (Ersts 2013).
ANÁLISE DOS DADOS.— Para testar se existe uma redução na distância entre jovens e os
adultos coespecíficos nos fragmentos florestais, foram realizadas duas abordagens.
Primeiro, nós realizamos o teste de Komolgorov-Smirnov para testar se jovens em áreas
de floresta madura e pequenos fragmentos florestais apresentam diferentes frequências
de distribuição para o adulto coespecífico mais próximo. Segundo, nós realizamos
modelos lineares gerais mistos (GLMM), considerando o tipo de habitat (pequenos
fragmentos vs. floresta madura) e a parcela como fatores fixos e aleatórios,
respectivamente, e a distância de cada jovem para o adulto coespecífico mais próximo
como variável resposta. Nessas análises, nós consideramos cada indivíduo jovem como
uma unidade amostral. Todos os jovens cujo adulto coespecífico não se encontrava na
mesma parcela foram ignorados nessa análise.
Adicionalmente, nós realizamos GLMMs para avaliar se em pequenos
fragmentos florestais a distância média entre indivíduos coespecíficos é menor que nas
áreas de floresta madura. Nessa análise, o tipo de habitat e a parcela foram considerados
fatores fixos e aleatórios, respectivamente, enquanto a distância média entre os
indivíduos coespecíficos foi considerada a variável resposta. Nesse caso, as análises
foram realizadas separadamente para as assembleias de jovens e adultos, sendo
96
consideradas apenas as espécies com pelo menos dois indivíduos na mesma parcela.
Nós consideramos cada espécie em cada parcela como uma unidade amostral. Em todas
as análises, nós utilizamos dois conjuntos de dados, um considerando toda a
comunidade e outro levando em consideração apenas as espécies pioneiras. No caso dos
GLMMs, nós comparamos o modelo cujo tipo de habitat foi considerado um fator fixo
com um modelo aleatório para saber se o efeito do tipo de habitat difere daquele
esperado ao acaso. Para estas análises, nós usamos o pacote “lme4” no programa R
(Bates et al. 2013).
RESULTADOS
Nós identificamos 302 indivíduos jovens cujo adulto coespecífico mais próximo se
encontrava na mesma parcela. Esses indivíduos pertenciam a 21 espécies, sendo 11
tolerantes à sombra e dez pioneiras. Analisando os jovens de todas as espécies de forma
conjunta, nós observamos um número baixo de jovens próximos ao adulto coespecífico,
estando a maioria dos jovens entre 8-10 m do adulto (Fig. 1A). As áreas de floresta
madura e os fragmentos florestais não diferiram em relação à distância entre os jovens e
o adulto coespecífico mais próximo, tanto analisando a frequência de distribuição das
espécies (D = 0,128, P = 0,375; Fig. 1A), como analisando a distância média (² =
0,002, gl = 1, P = 0,966; Fig. 1B). Ao analisar a frequência de distribuição apenas das
espécies pioneiras, nós observamos que a maioria dos indivíduos jovens estava mais
próxima ao adulto coespecífico nos fragmentos florestais que nas áreas de floresta
madura (D = 0,462, P = 0,009; Fig. 1C). Na floresta madura, a maioria dos jovens de
espécies pioneiras se estabeleceu entre 8 e 10 m do adulto coespecífico, enquanto nos
fragmentos florestais a maioria se estabeleceu entre 2 e 4 m. Entretanto, essa diferença
97
não foi observada ao analisar a distância média entre jovens e adultos coespecíficos de
espécies pioneiras (² = 2,107, gl = 1, P = 0,147; Fig. 1D).
Com relação à distância média entre adultos coespecíficos, nós analisamos um
total de 1154 indivíduos pertencentes a 86 espécies. A distância média entre os
indivíduos adultos coespecíficos foi maior nas áreas de floresta madura que nos
fragmentos florestais (² = 3,992, gl = 1, P = 0,046; Fig. 2A). Em média, os adultos
coespecíficos na floresta madura se distanciavam 21,3 ± 8,1 m entre si, enquanto nos
fragmentos a distância foi 19 ± 8,2 m. Todavia, ao avaliar apenas as espécies pioneiras,
não observamos diferença significativa entre os tipos de habitat (² = 1,81, gl = 1, P =
0,179; Fig. 2B). A distância média entre adultos coespecíficos de espécies pioneiras na
floresta madura e fragmentos florestais foi 20,8 ± 8,4 m e 18,5 ± 8,0 m,
respectivamente.
Com relação à distância média entre jovens, nós analisamos 1292 indivíduos
pertencentes a 131 espécies. Os dois habitat não diferiram significativamente com
relação à distância média entre jovens coespecíficos, tanto quando analisado todas as
espécies (² = 0,685, gl = 1, P = 0,408; Fig. 2C), quando analisado apenas as espécies
pioneiras (² = 2,543, gl = 1, P = 0,111; Fig. 2D). Ao analisar todas as espécies, nós
observamos uma distância média de aproximadamente 8 m nos dois habitats, enquanto
na análise incluindo apenas as espécies pioneiras a distância média foi 9,5 ± 4,7 m e 7,7
± 3,5 m na floresta madura e nos fragmentos florestais, respectivamente.
DISCUSSÃO
Embora a MDDD em árvores tenha sido estudada por mais de 40 anos, como esse
processo funciona em paisagens fragmentadas ainda é pouco explorado. Nos pequenos
98
fragmentos florestais, bem como nas áreas de floresta madura nós observamos uma
distribuição espacial dos indivíduos jovens compatível com o modelo de J-C, onde
existe um baixo número de indivíduos próximo ao adulto coespecífico. Além disso, o
pico de recrutamento nas áreas de floresta madura (8-10 m) é similar ao observado em
áreas não perturbadas na Floresta Amazônica (Terborgh et al. 2002, Terborgh & Nuñes-
Iturri 2006). Embora ao analisar a frequência de distribuição de indivíduos jovens em
relação ao adulto coespecífico de todas as espécies não tenha sido observada diferença
entre a floresta madura e os pequenos fragmentos, quando analisadas apenas as espécies
pioneiras, nós observamos um maior número de indivíduos jovens próximo ao adulto
coespecífico nos pequenos fragmentos florestais. Provavelmente, muitas sementes não
dispersadas de espécies pioneiras estão obtendo sucesso no recrutamento nos pequenos
fragmentos, dado que o maior número de indivíduos foi entre 2 e 4 m do adulto
coespecífico. Apesar disso, exceto pela pequena redução na distância média entre
adultos coespecíficos (2 m), não encontramos evidências que demonstrem uma
agregação das populações nos pequenos fragmentos florestais.
O maior número de jovens de espécies pioneiras próximos aos adultos
coespecíficos pode estar relacionando a um relaxamento nos mecanismos de MDDD. É
importante ressaltar que esses mecanismos de mortalidade afetam principalmente as
espécies comuns, devido as suas altas densidades, o que garante uma vantagem para as
espécies raras (Connell et al. 1984). Assim, é razoável pensar que, espécies pioneiras,
que geralmente recrutam em grande abundância, podem ser favorecidas em ambientes
com redução de inimigos naturais. É fato que a proliferação de espécies pioneiras em
pequenos fragmentos florestais resulta inicialmente das alterações microclimáticas
resultantes da criação de bordas (Laurance et al. 1998, Sizer & Tanner 1999, Tabarelli
et al. 2008). Todavia, a redução na abundância de inimigos naturais pode acentuar ainda
99
mais esse incremento na abundância de espécies pioneiras. Evidências obtidas em
florestas tropicais no Panamá e na Austrália demonstram que a exclusão de vertebrados
pode promover maior sobrevivência de plântulas do que mudanças nas condições
ambientais, como a abertura de clareiras (Wright 2002), demonstrando a importância de
inimigos naturais para o controle de populações vegetais.
O efeito de perturbações como a defaunação sobre o modelo de J-C ainda é uma
questão em aberto. Por um lado, a redução na fauna pode reduzir tanto a curva de
dispersão como a curva de sobrevivência, permitindo que espécies recrutem próximas
aos adultos coespecíficos (Wyatt & Silman 2004), assim como demonstrado neste
trabalho com relação às espécies pioneiras. Por outro lado, tem sido sugerido que em
áreas defaunadas haveria uma redução apenas na curva de dispersão e que a curva de
sobrevivência permaneceria inalterada, devido a uma compensação criada pelo aumento
na abundancia de pequenos vertebrados (Terborgh et al. 2008, Terborgh 2013), que
geralmente não são alvos de caçadores (Corlett 2007, Peres & Palacios 2007).
Evidências que suportam essa hipótese foram observadas no Panamá, onde locais com
diferentes níveis de defaunação apresentaram as mesmas taxas de remoção de sementes
(Asquith et al. 1997). De fato, estudos têm demonstrado que em áreas onde a pressão de
caça reduz a abundância de grandes vertebrados, pequenos vertebrados podem aumentar
suas abundâncias devido à ausência dos grandes carnívoros (Wright 2003, Dirzo et al.
2007). Entretanto, a nossa área de estudo representa uma paisagem com um longo
histórico de perturbação, onde a defaunação é severa e não é o único fator que pode
influenciar na sobrevivência de sementes e plântulas. Devido a uma miríade de fatores,
pequenos fragmentos podem apresentar uma redução tanto de grandes como de
pequenos vertebrados (Chiarello 1999). Além disso, como mencionado anteriormente

100
(veja introdução), é plausível esperar uma menor MDDD ocasionada por insetos em
pequenos fragmentos florestais.
Entretanto, mesmo com o pico de recrutamento mais próximo aos adultos
coespecíficos, não parece que relaxamentos na MDDD expliquem as mudanças
observadas na estrutura de assembleias de árvores adultas nos fragmentos. Embora
algumas espécies apresentem maiores densidades nos fragmentos (E. E. Santo-Silva,
dados não publicados – Cap. 1), nós observamos que tanto as assembleias de jovens
como de adultos de espécies pioneiras não demonstraram uma redução na distância
média entre indivíduos coespecíficos, o que seria esperado na ausência de MDDD. É
provável que essa maior sobrevivência nas fases iniciais seja compensada por uma
mortalidade na fase juvenil.
Em síntese, nossos resultados indicam que pode haver relaxamento na MDDD
nas fases iniciais de plantas pioneiras, porém, esse possível relaxamento parece não
refletir na estruturação de assembleias de árvores adultas. É importante salientar que
este estudo avaliou todas as espécies de forma conjunta e que estudos que avaliem o
recrutamento e a distribuição espacial de espécies separadamente em pequenos e
grandes fragmentos (ou em uma floresta contínua) podem identificar a existência de
alguns casos isolados de maior recrutamento próximo ao adulto coespecífico. Uma vez
que muitas das florestas tropicais no mundo estão fragmentadas e imersas em matrizes
não florestadas (Skole & Tucker 1993, Ribeiro et al. 2009), apresentando baixa
diversidade taxonômica (Santos et al. 2008), funcional (Girão et al. 2007, Michalski et
al. 2007, Santos et al. 2008, Lopes et al. 2009, Tabarelli et al. 2010) e filogenética
(Santos et al. 2010), é importante compreender como atuam os diferentes mecanismos
de manutenção de diversidade em face das perturbações antrópicas para entender qual o
real destino dessas paisagens.

101
LITERATURA CITADA
ASQUITH, N. M., S. J. WRIGHT, & M. J. CLAUSS. 1997. Does mammal community
composition control recruitment in neotropical forests? Evidence from Panama.
Ecology 78: 941-946.
AUGSPURGER, C. K., & H. T. WILKINSON. 2007. Host specificity of pathogenic Pythium
species: Implications for tree species diversity. Biotropica 39: 702-708.
BARBOSA, V. S., I. R. LEAL, L. IANNUZZI, & J. ALMEIDA-CORTEZ. 2005. Distribution
pattern of herbivorous insects in a remnant of Brazilian Atlantic forest.
Neotropical Entomology 34: 701-711.
BATES, D., M. MAECHLER, B. BOLKER, & S. WALKER. 2013. lme4: Linear mixed-effects
models using Eigen and S4. R package version 1.0-4. http://CRAN.R-
project.org/package=lme4.
BELL, T., R. P. FRECKLETON, & O. T. LEWIS. 2006. Plant pathogens drive density-
dependent seedling mortality in a tropical tree. Ecology Letters 9: 569-574.
BENÍTEZ-MALVIDO, J., & M. MARTÍNEZ-RAMOS. 2003. Impact of forest fragmentation
on understory plant species richness in Amazonia. Conserv Biol 17: 389-400.
CARSON, W. P., J. T. ANDERSON, E. G. LEIGH, & S. A. SCHNITZER. 2008. Challenges
associated with testing and falsifying the Janzen-Connell hypothesis: a review
and critique. In W. P. Carson and S. A. Schnitzer (Eds.). Tropical forest
community ecology, pp. 210-241. Wiley-Blackwell, Oxford.
CHIARELLO, A. G. 1999. Effects of fragmentation of the Atlantic forest on mammal
communities in south-eastern Brazil. Biol. Conserv. 89: 71-82.
CONNELL, J. H. 1971. On the role of natural enemies in preventing competitive
exclusion in some marine animals and in rain forest trees. In d. B. P. J. and G.
102
R. Gradwell (Eds.). Dynamics of populations, pp. 298-313. Centre for
Agricultural Publishing and Documentation, Wageningen.
CONNELL, J. H., J. G. TRACEY, & L. J. WEBB. 1984. Compensatory recruitment, growth,
and mortality as factors maintaining rain-forest tree diversity. Ecological
Monographs 54: 141-164.
CORLETT, R. T. 2007. The impact of hunting on the mammalian fauna of tropical Asian
forests. Biotropica 39: 292-303.
DIRZO, R., E. MENDOZA, & P. ORTIZ. 2007. Size-related differential seed predation in a
heavily defaunated neotropical rain forest. Biotropica 39: 355-362.
ERSTS, P. J. 2013. Geographic Distance Matrix Generator. American Museum of
Natural History, Center for Biodiversity and Conservation. Available from
http://biodiversityinformatics.amnh.org/open_source/gdmg: accessed on 15-10-
2013.
FARWIG, N., B. BLEHER, S. VON DER GONNA, & K. BOHNING-GAESE. 2008. Does forest
fragmentation and selective logging affect seed predators and seed predation
rates of Prunus africana (Rosaceae)? Biotropica 40: 218-224.
GIRÃO, L. C., A. V. LOPES, M. TABARELLI, & E. M. BRUNA. 2007. Changes in tree
reproductive traits reduce functional diversity in a fragmented Atlantic Forest
landscape. Plos One 2: e908.
HAMMOND, D. S., & V. K. BROWN. 1998. Disturbance, phenology and lifehistory
characteristics: factors influencing distance/density dependent attack on
tropical seeds and seedlings. In N. D. M., P. H. H. T. and B. N. D. (Eds.).
Dynamics of tropical communities, pp. 51-78. Blackwell, Oxford.
103
HARTSHORN, G. S. 1978. Treefalls and tropical forest dynamics. In P. B. Tomlinson and
M. H. Zimmermann (Eds.). Tropical trees as living systems, pp. 617–638.
Cambridge University Press, New York.
HAUTIER, Y., P. SANER, C. PHILIPSON, R. BAGCHI, R. C. ONG, & A. HECTOR. 2010.
Effects of Seed Predators of Different Body Size on Seed Mortality in Bornean
Logged Forest. Plos One 5.
JANZEN, D. H. 1970. Herbivores and number of tree species in tropical forests.
American Naturalist 104: 501-&.
LAURANCE, W. F., L. V. FERREIRA, J. M. RANKIN-DE MERONA, S. G. LAURANCE, R. W.
HUTCHINGS, & T. E. LOVEJOY. 1998. Effects of forest fragmentation on
recruitment patterns in Amazonian tree communities. Conserv Biol 12: 460-
464.
LI, R., S. YU, Y. WANG, C. STAEHELIN, & R. ZANG. 2009. Distance-dependent effects of
soil-derived biota on seedling survival of the tropical tree legume Ormosia
semicastrata. Journal of Vegetation Science 20: 527-534.
LOPES, A. V., L. C. GIRAO, B. A. SANTOS, C. A. PERES, & M. TABARELLI. 2009. Long-
term erosion of tree reproductive trait diversity in edge-dominated Atlantic
forest fragments. Biol. Conserv. 142: 1154-1165.
MATTHESIUS, A., H. CHAPMAN, & D. KELLY. 2011. Testing for Janzen-Connell Effects
in a West African Montane Forest. Biotropica 43: 77-83.
MICHALSKI, F., I. NISHI, & C. A. PERES. 2007. Disturbance-mediated drift in tree
functional groups in Amazonian forest fragments. Biotropica 39: 691-701.
NORGHAUER, J. M., J. R. MALCOLM, & B. L. ZIMMERMAN. 2006a. Juvenile mortality
and attacks by a specialist herbivore increase with conspecific adult basal area

104
of Amazonian Swietenia macrophylla (Meliaceae). Journal of Tropical
Ecology 22: 451-460.
NORGHAUER, J. M., J. R. MALCOLM, B. L. ZIMMERMAN, & J. M. FELFILI. 2006b. An
experimental test of density- and distant-dependent recruitment of mahogany
(Swietenia macrophylla) in southeastern Amazonia. Oecologia 148: 437-446.
OLIVEIRA, M. A., A. S. GRILLO, & M. TABARELLI. 2004. Forest edge in the Brazilian
Atlantic forest: drastic changes in tree species assemblages. Oryx 38: 389-394.
OLIVEIRA, M. A., A. M. M. SANTOS, & M. TABARELLI. 2008. Profound impoverishment
of the large-tree stand in a hyper-fragmented landscape of the Atlantic forest.
Forest Ecology and Management 256: 1910-1917.
PERES, C. A., & E. PALACIOS. 2007. Basin-wide effects of game harvest on vertebrate
population densities in Amazonian forests: Implications for animal-mediated
seed dispersal. Biotropica 39: 304-315.
RANTA, P., T. BLOM, J. NIEMELA, E. JOENSUU, & M. SIITONEN. 1998. The fragmented
Atlantic rain forest of Brazil: size, shape and distribution of forest fragments.
Biodivers Conserv 7: 385-403.
RIBEIRO, M. C., J. P. METZGER, A. C. MARTENSEN, F. J. PONZONI, & M. M. HIROTA.
2009. The Brazilian Atlantic Forest: How much is left, and how is the
remaining forest distributed? Implications for conservation. Biol. Conserv.
142: 1141-1153.
SANTO-SILVA, E. E., W. R. ALMEIDA, F. P. L. MELO, C. S. ZICKEL, & M. TABARELLI.
2013. The Nature of Seedling Assemblages in a Fragmented Tropical
Landscape: Implications for Forest Regeneration. Biotropica 45: 386-394.
105
SANTOS, B. A., V. ARROYO-RODRIGUEZ, C. E. MORENO, & M. TABARELLI. 2010. Edge-
Related Loss of Tree Phylogenetic Diversity in the Severely Fragmented
Brazilian Atlantic Forest. Plos One 5.
SANTOS, B. A., C. A. PERES, M. A. OLIVEIRA, A. GRILLO, C. P. ALVES-COSTA, & M.
TABARELLI. 2008. Drastic erosion in functional attributes of tree assemblages
in Atlantic forest fragments of northeastern Brazil. Biol. Conserv. 141: 249-
260.
SILVA, J. M. C., & M. TABARELLI. 2000. Tree species impoverishment and the future
flora of the Atlantic forest of northeast Brazil. Nature 404: 72-74.
SIZER, N., & E. V. J. TANNER. 1999. Responses of woody plant seedlings to edge
formation in a lowland tropical rainforest, Amazonia. Biol. Conserv. 91: 135-
142.
SKOLE, D., & C. TUCKER. 1993. Tropical deforestation and habitat fragmentation in the
amazon - satellite data from 1978 to 1988. Science 260: 1905-1910.
SWAMY, V., & J. W. TERBORGH. 2010. Distance-responsive natural enemies strongly
influence seedling establishment patterns of multiple species in an Amazonian
rain forest. Journal of Ecology 98: 1096-1107.
TABARELLI, M., A. V. AGUIAR, L. C. GIRAO, C. A. PERES, & A. V. LOPES. 2010. Effects
of Pioneer Tree Species Hyperabundance on Forest Fragments in Northeastern
Brazil. Conserv Biol 24: 1654-1663.
TABARELLI, M., A. V. LOPES, & C. A. PERES. 2008. Edge-effects Drive Tropical Forest
Fragments Towards an Early-Successional System. Biotropica 40: 657-661.
TERBORGH, J. 2013. Using Janzen-Connell to predict the consequences of defaunation
and other disturbances of tropical forests. Biol. Conserv. 163: 7-12.
106
TERBORGH, J., & G. NUÑES-ITURRI. 2006. Disperser-free tropical forests await an
unhappy fate. In W. F. Laurance and C. A. Peres (Eds.). Emerging threats to
tropical forests, pp. 241-252. The University of Chicago Press, Chicago.
TERBORGH, J., G. NUNEZ-ITURRI, N. C. A. PITMAN, F. H. C. VALVERDE, P. ALVAREZ, V.
SWAMY, E. G. PRINGLE, & C. E. T. PAINE. 2008. Tree recruitment in an empty
forest. Ecology 89: 1757-1768.
TERBORGH, J., N. PITMAN, M. SILMAN, H. SCHICHTER, & P. NÚÑEZ. 2002. Maintenance
of tree diversity in tropical forests. In D. J. Levey (Ed.). Seed dispersal and
frugivory: ecology, evolution and conservation, pp. 1-17. CABI Publishing,
Wallingford.
WIRTH, R., S. T. MEYER, I. R. LEAL, & M. TABARELLI. 2008. Plant herbivore
interactions at the forest edge. In U. Luttge, W. Beyschlag and J. Murata
(Eds.). Progress in Botany, pp. 423-448.
WRIGHT, S. J. 2002. Plant diversity in tropical forests: a review of mechanisms of
species coexistence. Oecologia 130: 1-14.
WRIGHT, S. J. 2003. The myriad consequences of hunting for vertebrates and plants in
tropical forests. Perspectives in Plant Ecology Evolution and Systematics 6:
73-86.
WYATT, J. L., & M. R. SILMAN. 2004. Distance-dependence in two Amazonian palms:
effects of spatial and temporal variation in seed predator communities.
Oecologia 140: 26-35.
107
LEGENDA DAS FIGURAS
Figura 1. Frequência de distribuição (A, C) e distância média (B, D) de indivíduos
arbóreos jovens em relação ao adulto coespecífico mais próximo em áreas de floresta
madura (FM) e pequenos fragmentos florestais (FF) na paisagem de Serra Grande,
nordeste do Brasil. Em A e B, foram analisadas todas as espécies, enquanto em C e D,
foram analisadas apenas as espécies pioneiras. Em B e D, as caixas representam o 25º e
75º percentil, as barras de erro indicam o 10º e 90º percentil, enquanto os pontos
representam os valores extremos. As linhas sólidas e tracejadas indicam a mediana e a
média, respectivamente.
Figura 2. Distância média entre adultos (A, B) e jovens (C, D) coespecíficos em áreas
de floresta madura (FM) e pequenos fragmentos florestais (FF) na paisagem de Serra
Grande, nordeste do Brasil. Em A e C, foram analisadas todas as espécies, enquanto em
B e D, foram analisadas apenas as espécies pioneiras. As caixas representam o 25º e 75º
percentil, as barras de erro indicam o 10º e 90º percentil, enquanto os pontos
representam os valores extremos. As linhas sólidas e tracejadas indicam a mediana e a
média, respectivamente. * P < 0,05.

108
FIGURAS
Figura 1.
Distância para o adulto coespecífico (m)
0 2 4 6 8 10 12 14 16 18 20
Ind
ivíd
uo
s (
%)
0
5
10
15
20
25
30
Tipo de habitat
FM FF
Dis
tân
cia
pa
ra o
ad
ulto
co
esp
ecífic
o (
m)
0
5
10
15
20
0 2 4 6 8 10 12 14 16 18 20
Ind
ivíd
uo
s (
%)
0
5
10
15
20
25
Floresta madura
Pequenos fragmentos
FM FF
Dis
tân
cia
pa
ra o
ad
ulto
co
esp
ecífic
o (
m)
0
5
10
15
20A
C
B
D
Todas as espécies
Espécies pioneiras
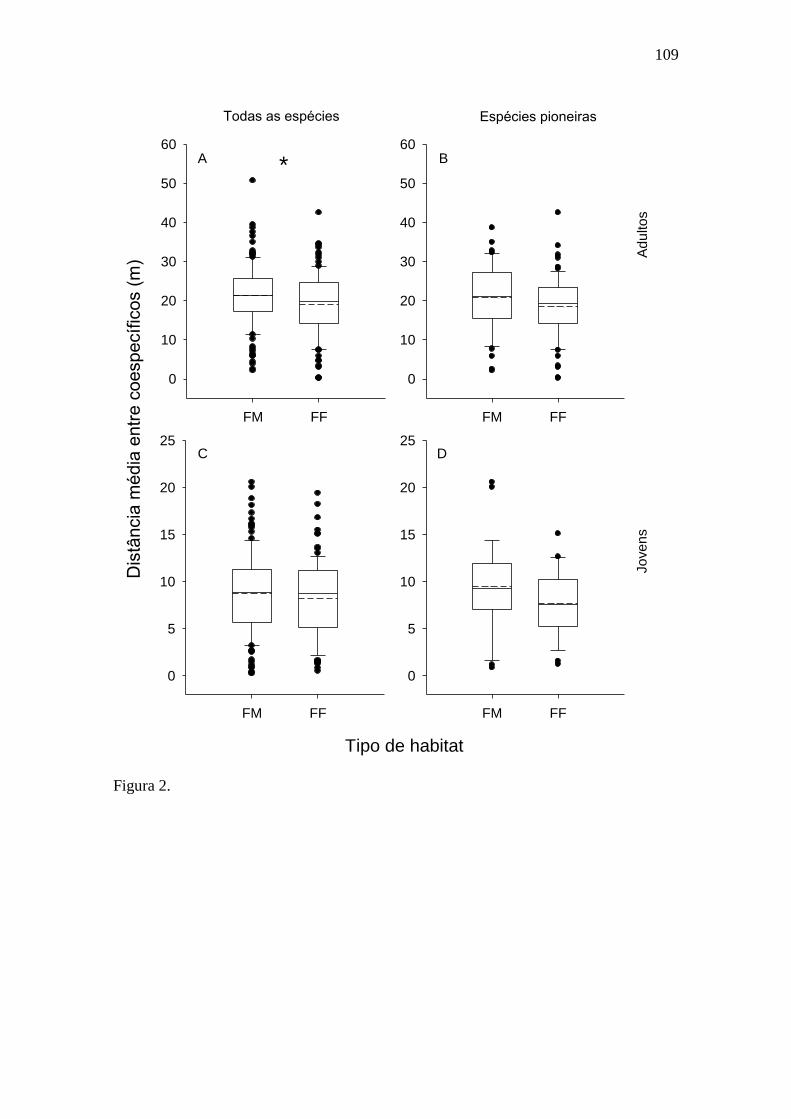
109
Figura 2.
FM FF
Dis
tância
média
entr
e c
oespecíf
icos (
m)
0
10
20
30
40
50
60
FM FF
0
10
20
30
40
50
60
FM FF
0
5
10
15
20
25
FM FF
0
5
10
15
20
25
BA
C D
Tipo de habitat
*
Todas as espécies Espécies pioneiras
Ad
ulto
sJo
ve
ns

110
6. CAPÍTULO 3
SEED PREDATION IN A FRAGMENTED TROPICAL FOREST: IS THERE A
RELAXATION IN DISTANCE-DEPENDENT SEED MORTALITY IN SMALL
FOREST FRAGMENTS?
Edgar E. Santo-Silvaa,b
; Felipe P. L Meloa; Marcelo Tabarelli
a
a Federal University of Pernambuco, Department of Botany, Av. Prof. Moraes Rego,
S/N, Cidade Universitária, 50670-901, Recife-PE, Brazil.
b Corresponding author; e-mail: [email protected]
Manuscrito submetido ao periódico Acta Oecologica.
111
ABSTRACT
The high mortality of seeds near conspecific adult trees is considered an important
mechanism for the maintenance of tree diversity in tropical forests. However, this
mechanism may be weaker in small forest fragments, where some tree species such as
Tapirira guianensis present abundances three times higher than in adjacent mature
forest areas. We conducted a field experiment with T. guianensis in a fragmented
landscape of Brazilian Atlantic forest to evaluate if the distance to nearest conspecific
tree has a weak or no effect on seed predation in small forest fragments. We placed
seeds of T. guianensis near (1 m) and far (15 m) from conspecific trees with different
types of exclosures for vertebrates and insects in mature forest areas inside a large
remnant and small forest fragments and observed the seed fate monthly during a four
month period. We detected no influence of distance to nearest conspecific tree on seed
predation in both habitats, as approximately 73% and 83% were predated at both
distances in mature forest and small fragments, respectively. Seed predation was faster
in free access plots, achieving almost 100% in the first month; however, when insects
and vertebrates were excluded predation became slower. In addition, seeds in plots with
access only for insects were predated faster in small fragments, reaching 78% in the first
month, while in mature forest only 49% were predated in the same period of time. We
concluded that the higher abundance of T. guianensis in small fragments is not a result
of a relaxation in distance-dependent seed predation. Indeed, vertebrates and insects that
predate seeds of T. guianensis apparently are present in both habitats and our results
indicate a higher seed predation by insects in small fragments.

112
Keywords: Forest fragmentation, Janzen-Connell model, seed survival, Tapirira
guianensis, tropical forest.
113
1. INTRODUCTION
Tropical forests in human-modified landscapes have suffered from a severe
rearrangement of their biological communities (Karp et al. 2012; Tabarelli et al. 2012).
The most common scenario in tropical regions (except in the Amazonian and Congo
basins) is that of fragmented landscapes where small forest fragments, scattered in an
inhospitable matrix, are suffering a strong modification in species relative abundances
(FAO 2011). We know that the physical conditions of the these “new” landscapes
impose edge effects, microclimate alterations and lack of connectivity among forest
patches, which by its self may cause drastic alterations in tree communities (see
Laurance et al. 2011 for a review). However, little is known about the ecological
triggers of changes in biological communities, especially for trees that depend on
animals to complete their life cycles, and more specifically those that depend on seed
dispersal to escape from distance-dependent mortality of early life stages (Paine et al.
2012; Webb and Peart 2001; Wotton and Kelly 2011). In short, we do not fully
understand how habitat modification alters mechanisms of species coexistence or what
the role is of distance-dependent mortality on the proliferation of certain species in
human-disturbed tropical landscapes (Liu et al. 2012; Norden et al. 2009).
Empirical data of both plants and animals support the idea that the
rearrangement of biological communities in human-modified landscapes can result from
releases in top-down ecological processes (Almeida et al. 2008; Wyatt and Silman
2004). In terms of plant communities, the decreased abundance or the absence of natural
enemies, such as seed predators, in disturbed areas can result in an increase in the
recruitment of some species, mainly near parental trees (Wyatt and Silman 2004).
Proliferating tree species may therefore be favoured by a relaxation of the distance-
114
dependent mortality that allows them to recruit near parental trees, thus compensating
for a lack of seed dispersal due to the elimination of most seed dispersers from highly
disturbed tropical forests (Melo et al. 2010; Melo et al. 2009).
Despite the fact that these mechanisms of distance-dependent mortality have
been studied for more than 40 years, little is known about their functioning in human-
modified landscapes. These landscapes consists of patches of natural areas surrounded
by human-created matrices (Melo et al. 2013), where ecological processes have been
severely modified due to local extinctions and disruption of plant-animal interactions
(both antagonistic and mutualistic). Theoretically, it is reasonable to expect that human-
modified landscapes may experience a relaxation in distance-dependent seed predation,
at least for two reasons. First, due to impacts such as deforestation and hunting, many
tropical forests around the world have experienced severe changes in faunal
composition (Chiarello 1999; Farwig et al. 2008; Wright et al. 2007), which may
decrease the rates of seed predation. Second, the fauna of disturbed habitats tend to be
dominated by generalists (Tscharntke et al. 2002), which usually consume seeds
independently of distance to parental tree (Janzen 1970). As a result, human-modified
landscapes may exhibit an increase in seedling recruitment near parental trees,
consequently reducing the number of coexisting species and compromising the
maintenance of biodiversity.
This may be the case for some fragmented tropical forest landscapes. Large
areas of tropical forest have been converted into sets of small and isolated fragments
with large amounts of edge-affected areas (Ranta et al. 1998; Tabarelli et al. 2004), that
are severely defaunated (da Silva and Mendes Pontes 2008; Silva and Tabarelli 2000).
In fact, much empirical evidence demonstrate that fragmented forests have reduced
abundances of vertebrates (e.g., Canale et al. 2012; Michalski and Peres 2007),
115
including rodents, an important group of seed predators (Chiarello 1999). In the
Brazilian Atlantic forest, for example, approximately 83% of the remaining forest
fragments are smaller than 50 ha (Ribeiro et al. 2009). Moreover, the proliferation of
pioneer trees caused by the creation of edges apparently creates favourable conditions
for the increment of generalist invertebrate fauna (Barbosa et al. 2005; Wirth et al.
2008). Finally, some tree species found in seedling assemblages of Brazilian Atlantic
forest show elevated densities in small forest fragments compared with those in the
interior of a large remnant (E. E. Santo-Silva, unpublished data). Therefore, it is
reasonable to expect that these fragmented landscapes are experiencing a relaxation in
seed mortality caused by vertebrates and insects.
Here, we reported a field experiment with Tapirira guianensis Aubl.
(Anacardiaceae), a pioneer tree species that presents elevated density in small forest
fragments of the northeast Brazilian Atlantic forest. Our aim was to evaluate the
hypothesis that there is a relaxation in distance-dependent seed predation in small forest
fragments. We expected that seed predation of T. guianensis by vertebrates and insects
would be either not influenced or influenced to a lesser extent by the distance to the
nearest adult tree in small fragments than in mature forest areas in a large remnant. We
built a multi factorial experiment and evaluated, during four months, seed
predation/removal by vertebrates and insects near and far from the nearest conspecific
tree in small forest fragments (6.6-91.2 ha) and in a large remnant (3500 ha). Finally,
we discussed the processes that affect seed predation in severely fragmented landscapes.

116
2. MATERIAL AND METHODS
2.1. Study area
The study was carried out at Usina Serra Grande, a private landholding located
in the Atlantic forest in the Brazilian northeast (8º30’ S, 35º50’ W). This landscape
retains approximately 9000 ha of forest, which represents ca. 40% of the original area.
This remaining vegetation consists of 109 forest fragments ranging between 1.67 and
3500 ha and is surrounded by a sugarcane matrix. This configuration dates back to the
19th
century and the shape and size of fragments remain stable because these remnants
are protect against wildfire and logging to ensure the water supply for sugarcane
irrigation (Santos et al. 2008). Moreover, Serra Grande landscape retains the biggest and
best preserved remnant of the northeast Brazilian Atlantic forest – Coimbra forest (3500
ha), which retains areas of mature forest with old-growth tree assemblages (Santos et al.
2008). The climate is tropical, with average annual rainfall of 2000 mm (IBGE 1985).
The vegetation is low montane rain forest, a type of Brazilian Atlantic forest that occurs
at 100 to 600 m above sea level (Veloso et al. 1991). The most common families are
Lauraceae, Sapotaceae, Moraceae, and Fabaceae (Grillo et al. 2005).
2.2. Study species
To conduct the experiment we selected the tree species Tapirira guianensis
Aubl. (Anacardiaceae), a pioneer species that is typical of the forest canopy. This native
species is widely distributed, being found in all Brazilian ecosystems (Silva-Luz and
Pirani 2014). T. guianensis is a zoochorous species that produces many drupe fruits

117
approximately 1.7 cm in length and seeds that are 1.1 cm. It fruits annually in the period
between December and July (Santos and Ferreira 2013), but fruits of this species can be
found in the study area almost throughout the whole year (Portes 2012). This species is
very abundant in the study area, mainly in small forest fragments, where it presents a
density nearly three times higher than in mature forest areas in the interior of Coimbra
forest (E. E. Santo-Silva, unpublished data).
2.3. Seed predation experiment and data analysis
We placed seeds of T. guianensis in exclosure treatments at two different
distances around 39 conspecific adult trees (DBH > 10 cm) in two habitat types: (1)
mature forest areas – 20 trees in stands of old-growth forest inside Coimbra forest; and
(2) small forest fragments – 19 trees in 10 forest fragments ranging between 6.6 and
91.2 ha that are completely surrounded by a sugarcane matrix. Around each tree we
placed six plots (25 × 25 cm) in two distance treatments, three plots 1 m from the trunk
and under the crown (near), and three 15 m from the trunk (far), which is approximately
four-times the crown radius of T. guianensis in the study area (3.8 ± 1.0 m, N = 20). At
both distances, the plots were placed 1 m from each other. Even though other studies
addressing effects of distance to parental trees on seed predation adopted greater
distances than we use here (e.g. Blendinger and Diaz-Velez 2010; Norghauer et al.
2006; Sugiyama and Peterson 2013), a distance of 15 m to the nearest conspecific tree
represents the best scenario of isolation from the crown area due to the high density of
T. guianensis in our study area (mean distance to the nearest conspecific tree = 11.2 ±
7.5 m, N = 17). We placed 15 seeds of T. guianensis in each plot, totalling 3510 seeds in
the whole experiment. Seeds were collected from different individuals of T. guianensis

118
located in the northeast Brazilian Atlantic forest. At each distance from the trunk we
used three exclosure treatments, one for each plot: (1) free access – plots with no
exclosures, where vertebrates and insects could access seeds freely; (2) partial-access –
plots covered by a wire mesh (1.5 by 2.5 cm mesh) that permitted the entry of only
insects and excluded vertebrates, such as the rodent Oryzomys oniscus, which is present
in the study area (Pinto et al. 2009); and (3) no access – plots with a wire mesh and
covered by a voile textile that excluded vertebrates and insects.
Seeds were placed in September of 2011 and we inspected their fate for the
following four months. We removed the pulp from all seeds for two reasons: (1) to
decrease the likelihood of infection by microorganisms between the period of collection
and the beginning of the experiment; and (2) to verify the state of the seeds and discard
those with signs of rot. We considered all seeds that were destroyed or removed as
predated, except those seeds that were apparently decomposed by microorganisms. We
considered seed removal as predation because once the seeds had no pulp, the only
attraction was the seed itself. Finally, we performed a repeated measures ANOVA,
adopting the percentage of predated seeds in each month as the response variable and
(1) habitat type, (2) distance to nearest conspecific tree, (3) exclosure treatment, and (4)
time as factors. The Greenhouse-Geisser correction was applied due to the violation of
the assumption of sphericity. We analyzed only those trees that retained all six plots
intact at the end of the experiment; the analysis was performed in Statistica 7.

119
3. RESULTS
All plots around 30 out of the 39 trees initially included in the experiment
remained intact after four months, 16 in mature forest areas and 14 in nine small
fragments. Of the seeds placed around these 30 trees (2700 seeds), at the end of
experiment 83% (1050) of the seeds placed in small forest fragments were predated,
while in mature forest areas 73% (1055) were predated.
There was no evidence of distance-dependent seed predation for both mature
forest and small fragments as seeds placed near and far from conspecific trees presented
the same likelihood of being predated (Table 1; Fig. 1). Although 64% ± 4.3 (mean ±
SE) of seeds were predated in small fragments and 51% ± 4.3 in mature forest in the
first month, there was no difference between habitats in the speed of seed predation
when we considered all the exclosure treatments (Table 1; fig. 1).
However, we detected an interaction between exclosure treatment and habitat
type (Table 1; Fig. 2). In both habitats, plots that allowed more access to seed predators
presented the highest seed predation. Seed predation in free access plots did not differed
between habitats, reaching almost 100% in the first month. However, in partial-access
plots, seed predation was faster in small fragments, reaching 78% ± 3.9 in the first
month, while in mature forest only 49% ± 5 were predated in the same period of time.
Although at the end of the experiment seeds in free and partial-access plots presented
almost the same seed predation (100% and 98% ± 1.3, respectively), the speed of seed
predation in free access plots was much higher than in partial-access plots. Finally, the
number of missing seeds in no access plots at the end of the experiment was two times
higher in small fragments than in mature forest.
120
4. DISCUSSION
The hypothesis that there is a relaxation in distance-dependent seed predation in
small forest fragments was refuted. In fact, seeds placed in small forest fragments were
removed faster than in mature forest, suggesting that this type of habitat is less suitable
for further recruitment of the studied species. Although T. guianensis presents a
population density three-fold higher in small forest fragments in comparison to areas in
the interior of Coimbra forest, we did not observe any influence of distance to nearest
conspecific tree on seed predation in either of the habitats. In addition, the differences in
seed predation between the three exclosure treatments provided evidence that both
vertebrates and insects predate seeds of T. guianensis, but only insects were influenced
by habitat type, since they effected a high speed of seed predation in small fragments.
Therefore, seeds of T. guianensis have a lower probability of survival in small forest
fragments than in mature forest inside a large remnant.
The absence of distance-dependent seed predation by vertebrates may be
explained by the fact that many animals in this group exhibit low species specificity and
large foraging areas, which is characteristic of animals with no specific targets (Wright
2002). In a review made by Hammond and Brown (1998), from 24 studies investigating
seed mortality by vertebrates, only one supported the Janzen-Connell model. However,
although many insects present specific targets, we did not observe any influence of
distance to nearest conspecific tree in seed predation by insects either. This absence of
distance-dependent seed predation was also observed for the congeneric Tapirira
mexicana in a highly deforested region in Costa Rica (Sugiyama and Peterson 2013). It
is likely that T. guianensis does not present a species-specific interaction with either
vertebrate or insect seed predators.

121
The most surprising result was the faster seed predation in small fragments
observed in partial-access plots, i.e. plots without access for vertebrates. Although we
did not sample insect communities, we believe that this faster seed predation in small
fragments can be attributed to an increased abundance of insects, as observed for some
groups in edge-affected areas in Amazonian and Atlantic forest (Barbosa et al. 2005;
Fowler et al. 1993). In edge areas, some groups of insects can be favoured due to the
disappearance of insectivorous birds (Laurance et al. 2002), i.e. a relaxation in top-down
regulation. We acknowledge that our study did not investigate the effects of edge
distance on seed predation, nevertheless small fragments have large amounts of edge
areas and even the central areas of these fragments appear to face the same impacts
faced by edge areas in a large remnant (Lopes et al. 2009; Santos et al. 2008; Tabarelli
et al. 2010). Moreover, it is reasonable to expect that the proliferation of T. guianensis
in small fragments may promote an increased abundance of insect seed predators.
Two points need to be clarified about our experiment. First, although we did not
monitor the fate of the removed seeds, we do not believe that these seeds were
secondarily dispersed instead of predated. Given that we used only seeds without pulp,
there was no attraction for seed dispersers. However, the removal of the seed pulp
appears to have no influence on the searching capabilities of predators, since ~100% of
the seeds in free access plots and ~63% in partial-access plots were predated in the first
month. Second, even with total exclusion of seed predators, the no-access plots
presented a high number of missing seeds, which was higher in small fragments than in
the interior of Coimbra forest. It is likely that these seeds were quickly decomposed by
microorganisms, making their observation impossible.
If seeds of T. guianensis have a low probability of survival in small fragments,
why does T. guianensis exhibit an increased density in these habitats? On the one hand,
122
although we did not find distance-dependent mortality on seeds, this is not the only
stage that can suffer mortality according the Janzen-Connell model. Soil pathogens and
insects can also cause distance-dependent mortality on seedlings (Li et al. 2009; Swamy
and Terborgh 2010). Therefore, we suggest that the increased density of T. guianensis
in small fragments could result from a relaxation in distance dependent seedling
mortality. On the other hand, some authors report that T. guianensis is favoured in
fragmented habitats due to its being a pioneer species (Santos et al. 2008; Tabarelli et al.
2008). Pioneer species would initially be favoured in these habitats by the increased
entrance of light due to the creation of edge habitat, and after reaching the canopy, the
increased abundance in seed rain and the constant disturbance occasioned by the
proximity with the edge would create favourable conditions for the maintenance of the
high abundance of these species (Tabarelli et al. 2008). Moreover, the depletion of
shade-tolerant trees in small fragments could liberate space for the recruitment of
pioneer species (see Santo-Silva et al. 2013). However, regeneration strategy does not
appear to be the only explanation for the proliferation of species such as T. guianensis,
since the majority of pioneer species found in the Serra Grande landscape do not
proliferate in small fragments (E. E. Santo-Silva, unpublished data). Thus, given the
hotter and drier microclimate in edge-affected habitats (Kapos 1989), we also suggest
that the increased density of T. guianensis and other proliferating trees could be a result
of a high tolerance to hydric stress.
In synthesis, reduced seed predation by vertebrates and insects does not explain
the increased density of T. guianensis in small forests fragments. In fact, seed predation
represents a stronger bottleneck in small fragments than in the interior of Coimbra
forest. What are the mechanisms responsible for the hyper-abundance of some species
in human-modified landscapes remains as an open question. In order to answer it, we
123
suggest that further researches investigate if there is a relaxation in distance-dependent
mortality in other stages of life, as young seedlings. Also, we suggest evaluating the role
played by ecophysiological attributes, which is poorly understood in human-modified
landscapes.
ACKNOWLEDGEMENTS
We thank Paulo Portes for help with fieldwork, and Maria P. Silva for help with
the manufacturing of exclosures. Usina Serra Grande and Centro de Pesquisas
Ambientais do Nordeste (CEPAN) provided logistical support during the fieldwork. We
are grateful to Conselho Nacional de Ciência e Tecnologia (CNPq) and Coordenação de
Aperfeiçoamento de Pessoal de Nível Superior (CAPES) for research grant to MT, and
Fundação de Amparo a Ciência e Tecnologia de Pernambuco (FACEPE) for doctorate
fellowship to EESS (process 0455-2.05/09). We also thank CAPES for a doctorate
“sandwich” scholarship to EESS (process 17547/12-1).
124
REFERENCES
Almeida, W.R., Wirth, R., Leal, I.R., 2008. Edge-mediated reduction of phorid
parasitism on leaf-cutting ants in a Brazilian Atlantic forest. Entomologia
Experimentalis et Applicata 129, 251-257.
Barbosa, V.S., Leal, I.R., Iannuzzi, L., Almeida-Cortez, J., 2005. Distribution pattern of
herbivorous insects in a remnant of Brazilian Atlantic forest. Neotropical
Entomology 34, 701-711.
Blendinger, P.G., Diaz-Velez, M.C., 2010. Experimental field test of spatial variation in
rodent predation of nuts relative to distance and seed density. Oecologia 163, 415-
423.
Canale, G.R., Peres, C.A., Guidorizzi, C.E., Gatto, C.A.F., Kierulff, M.C.M., 2012.
Pervasive Defaunation of Forest Remnants in a Tropical Biodiversity Hotspot.
Plos One 7.
Chiarello, A.G., 1999. Effects of fragmentation of the Atlantic forest on mammal
communities in south-eastern Brazil. Biological Conservation 89, 71-82.
da Silva, A.P., Jr., Mendes Pontes, A.R., 2008. The effect of a mega-fragmentation
process on large mammal assemblages in the highly-threatened Pernambuco
Endemism Centre, north-eastern Brazil. Biodiversity and Conservation 17, 1455-
1464.
FAO, 2011. Satate of the world's forests, 9th edn. Food and Agriculture Organization of
the United States, Rome.
Farwig, N., Bleher, B., von der Gonna, S., Bohning-Gaese, K., 2008. Does forest
fragmentation and selective logging affect seed predators and seed predation rates
of Prunus africana (Rosaceae)? Biotropica 40, 218-224.

125
Fowler, H.G., Silva, C.A., Venticinque, E., 1993. Size, taxonomic and biomass
distributions of flying insects in Central Amazonia - forest edge vs understory.
Revista De Biologia Tropical 41, 755-760.
Grillo, A.S., Oliveira, M.A., Tabarelli, M., 2005. Árvores, In Diversidade biológica e
conservação da floresta Atlântica ao norte do rio São Francisco. eds K. Pôrto, J.S.
Almeida-Cortez, M. Tabarelli, pp. 191-216. Ministério do Meio Ambiente,
Brasília.
Hammond, D.S., Brown, V.K., 1998. Disturbance, phenology and lifehistory
characteristics: factors influencing distance/density dependent attack on tropical
seeds and seedlings, In Dynamics of tropical communities. eds N.D. M., P.H.H.
T., B.N. D., pp. 51-78. Blackwell, Oxford.
IBGE, 1985. Atlas Nacional do Brasil: Região Nordeste. IBGE, Rio de Janeiro.
Janzen, D.H., 1970. Herbivores and number of tree species in tropical forests. American
Naturalist 104, 501-&.
Kapos, V., 1989. Effects of isolation on the water status of forest patches in the
Brazilian Amazon. Journal of Tropical Ecology 5, 173-185.
Karp, D.S., Rominger, A.J., Zook, J., Ranganathan, J., Ehrlich, P.R., Daily, G.C., 2012.
Intensive agriculture erodes β-diversity at large scales. Ecology Letters 15, 963-
970.
Laurance, W.F., Camargo, J.L.C., Luizao, R.C.C., Laurance, S.G., Pimm, S.L., Bruna,
E.M., Stouffer, P.C., Williamson, G.B., Benitez-Malvido, J., Vasconcelos, H.L.,
Van Houtan, K.S., Zartman, C.E., Boyle, S.A., Didham, R.K., Andrade, A.,
Lovejoy, T.E., 2011. The fate of Amazonian forest fragments: A 32-year
investigation. Biological Conservation 144, 56-67.

126
Laurance, W.F., Lovejoy, T.E., Vasconcelos, H.L., Bruna, E.M., Didham, R.K.,
Stouffer, P.C., Gascon, C., Bierregaard, R.O., Laurance, S.G., Sampaio, E., 2002.
Ecosystem decay of Amazonian forest fragments: A 22-year investigation.
Conservation Biology 16, 605-618.
Li, R., Yu, S., Wang, Y., Staehelin, C., Zang, R., 2009. Distance-dependent effects of
soil-derived biota on seedling survival of the tropical tree legume Ormosia
semicastrata. Journal of Vegetation Science 20, 527-534.
Liu, X., Liang, M., Etienne, R.S., Wang, Y., Staehelin, C., Yu, S., 2012. Experimental
evidence for a phylogenetic Janzen–Connell effect in a subtropical forest. Ecology
Letters 15, 111-118.
Lopes, A.V., Girao, L.C., Santos, B.A., Peres, C.A., Tabarelli, M., 2009. Long-term
erosion of tree reproductive trait diversity in edge-dominated Atlantic forest
fragments. Biological Conservation 142, 1154-1165.
Melo, F.P.L., Arroyo-Rodríguez, V., Fahrig, L., Martínez-Ramos, M., Tabarelli, M.,
2013. On the hope for biodiversity-friendly tropical landscapes. Trends in ecology
& evolution 28, 462-468.
Melo, F.P.L., Martinez-Salas, E., Benitez-Malvido, J., Ceballos, G., 2010. Forest
fragmentation reduces recruitment of large-seeded tree species in a semi-
deciduous tropical forest of southern Mexico. Journal of Tropical Ecology 26, 35-
43.
Melo, F.P.L., Rodriguez-Herrera, B., Chazdon, R.L., Medellin, R.A., Ceballos, G.,
2009. Small tent-roosting bats promote dispersal of large-seeded plants in a
Neotropical forest. Biotropica 41, 737-743.

127
Michalski, F., Peres, C.A., 2007. Disturbance-mediated mammal persistence and
abundance-area relationships in Amazonian forest fragments. Conservation
Biology 21, 1626-1640.
Norden, N., Chave, J., Belbenoit, P., Caubere, A., Chatelet, P., Forget, P.M., Riera, B.,
Viers, J., Thebaud, C., 2009. Interspecific variation in seedling responses to seed
limitation and habitat conditions for 14 Neotropical woody species. Journal of
Ecology 97, 186-197.
Norghauer, J.M., Malcolm, J.R., Zimmerman, B.L., Felfili, J.M., 2006. An experimental
test of density- and distant-dependent recruitment of mahogany (Swietenia
macrophylla) in southeastern Amazonia. Oecologia 148, 437-446.
Paine, C.E.T., Norden, N., Chave, J., Forget, P.-M., Fortunel, C., Dexter, K.G.,
Baraloto, C., 2012. Phylogenetic density dependence and environmental filtering
predict seedling mortality in a tropical forest. Ecology Letters 15, 34-41.
Pinto, S.R.R., Santos, A.M.M., Tabarelli, M., 2009. Seed predation by rodents and safe
sites for large-seeded trees in a fragment of the Brazilian Atlantic forest. Brazilian
Journal of Biology 69, 765-773.
Portes, P.V.A., 2012. Chuva de sementes em uma paisagem de floresta Atlântica:
graves falhas no processo de dispersão de sementes, In Departament of Botany.
Universidade Federal de Pernambuco, Recife.
Ranta, P., Blom, T., Niemela, J., Joensuu, E., Siitonen, M., 1998. The fragmented
Atlantic rain forest of Brazil: size, shape and distribution of forest fragments.
Biodiversity and Conservation 7, 385-403.
Ribeiro, M.C., Metzger, J.P., Martensen, A.C., Ponzoni, F.J., Hirota, M.M., 2009. The
Brazilian Atlantic Forest: How much is left, and how is the remaining forest

128
distributed? Implications for conservation. Biological Conservation 142, 1141-
1153.
Santo-Silva, E.E., Almeida, W.R., Melo, F.P.L., Zickel, C.S., Tabarelli, M., 2013. The
Nature of Seedling Assemblages in a Fragmented Tropical Landscape:
Implications for Forest Regeneration. Biotropica 45, 386-394.
Santos, B.A., Peres, C.A., Oliveira, M.A., Grillo, A., Alves-Costa, C.P., Tabarelli, M.,
2008. Drastic erosion in functional attributes of tree assemblages in Atlantic forest
fragments of northeastern Brazil. Biological Conservation 141, 249-260.
Santos, P.L., Ferreira, R.A., 2013. Fenologia de Tapirira guianensis AUBL.
(Anacardiaceae) no município de São Cristóvão, Sergipe. Revista Árvore 37, 129-
136.
Silva-Luz, C.L., Pirani, J.R., 2014. Anacardiaceae in Lista de Espécies da Flora do
Brasil. Jardim Botânico do Rio de Janeiro. Available in:
<http://floradobrasil.jbrj.gov.br/jabot/floradobrasil/FB4408>. Access in: 30 Jan.
2014.
Silva, J.M.C., Tabarelli, M., 2000. Tree species impoverishment and the future flora of
the Atlantic forest of northeast Brazil. Nature 404, 72-74.
Sugiyama, A., Peterson, C.J., 2013. Edge Effects Act Differentially on Multiple Early
Regeneration Stages of a Shade-tolerant Tree Tapirira mexicana. Biotropica 45,
37-44.
Swamy, V., Terborgh, J.W., 2010. Distance-responsive natural enemies strongly
influence seedling establishment patterns of multiple species in an Amazonian
rain forest. Journal of Ecology 98, 1096-1107.
129
Tabarelli, M., Aguiar, A.V., Girao, L.C., Peres, C.A., Lopes, A.V., 2010. Effects of
pioneer tree species hyperabundance on forest fragments in Northeastern Brazil.
Conservation Biology 24, 1654-1663.
Tabarelli, M., Da Silva, M.J.C., Gascon, C., 2004. Forest fragmentation, synergisms and
the impoverishment of neotropical forests. Biodiversity and Conservation 13,
1419-1425.
Tabarelli, M., Lopes, A.V., Peres, C.A., 2008. Edge-effects Drive Tropical Forest
Fragments Towards an Early-Successional System. Biotropica 40, 657-661.
Tabarelli, M., Peres, C.A., Melo, F.P.L., 2012. The ‘few winners and many losers’
paradigm revisited: Emerging prospects for tropical forest biodiversity. Biological
Conservation 155, 136-140.
Tscharntke, T., Steffan-Dewenter, I., Kruess, A., Thies, C., 2002. Characteristics of
insect populations on habitat fragments: A mini review. Ecological Research 17,
229-239.
Veloso, H.P., Rangel-Filho, A.L.R., Lima, J.C.A., 1991. Classificação da vegetação
brasileira adaptada a um sistema universal. IBGE, Rio de Janeiro.
Webb, C.O., Peart, D.R., 2001. High seed dispersal rates in faunally intact tropical rain
forest: theoretical and conservation implications. Ecology Letters 4, 491-499.
Wirth, R., Meyer, S.T., Leal, I.R., Tabarelli, M., 2008. Plant herbivore interactions at
the forest edge, In Progress in Botany. eds U. Luttge, W. Beyschlag, J. Murata,
pp. 423-448.
Wotton, D.M., Kelly, D., 2011. Frugivore loss limits recruitment of large-seeded trees.
Proceedings of the Royal Society B: Biological Sciences.
Wright, S.J., 2002. Plant diversity in tropical forests: a review of mechanisms of species
coexistence. Oecologia 130, 1-14.

130
Wright, S.J., Stoner, K.E., Beckman, N., Corlett, R.T., Dirzo, R., Muller-Landau, H.C.,
Nunez-Iturri, G., Peres, C.A., Wang, B.C., 2007. The plight of large animals in
tropical forests and the consequences for plant regeneration. Biotropica 39, 289-
291.
Wyatt, J.L., Silman, M.R., 2004. Distance-dependence in two Amazonian palms: effects
of spatial and temporal variation in seed predator communities. Oecologia 140,
26-35.

131
TABLE
Table 1. Results of repeated measures ANOVA. We tested the effect of habitat type
(small forest fragments vs. mature forest), distance to conspecific tree and exclosure
treatment on the percentage of predated/removed seeds of Tapirira guianensis.
F df P
Between-subject effects
Habitat type 24.257 1 <0.0001
Distance 0.036 1 0.850
Exclosure treatment 468.778 2 <0.0001
Habitat type × Distance 1.037 1 0.310
Habitat type × Exclosure treatment 7.176 2 0.001
Distance × Exclosure treatment 0.078 2 0.925
Habitat type × Distance × Exclosure treatment 0.342 2 0.711
Within-subject effects*
Time 140.870 1.770 <0.0001
Time × Habitat type 0.766 1.770 0.451
Time × Distance 0.148 1.770 0.837
Time × Exclosure treatment 36.716 3.539 <0.0001
Time × Habitat type × Distance 0.413 1.770 0.637
Time × Habitat type × Exclosure treatment 12.833 3.539 <0.0001
Time × Distance × Exclosure treatment 0.940 3.539 0.433
Time × Habitat type × Distance × Exclosure treatment 0.952 3.539 0.427
*Greenhouse-Geisser probabilities are reported for within-subject effects because the
sphericity assumption was violated. Greenhouse-Geisser = 0.59.
132
FIGURE LEGENDS
Fig. 1. Percentage of seeds of Tapirira guianensis predated/removed near and far from
nearest conspecific adult in small fragments and mature forest areas in the Serra Grande
landscape, northeast Brazil. Error bars indicates standard error.
Fig. 2. Percentage of seeds of Tapirira guianensis predated/removed in different
exclosure treatments in small fragments and mature forest areas in the Serra Grande
landscape, northeast Brazil. Error bars indicates standard error.

133
FIGURES
Fig. 1
Days
0 30 60 90 120
Seeds p
redate
d/r
em
oved (
%)
0
20
40
60
80
100
Mature forest - near
Mature forest - far
Small fragments - near
Small fragments - far
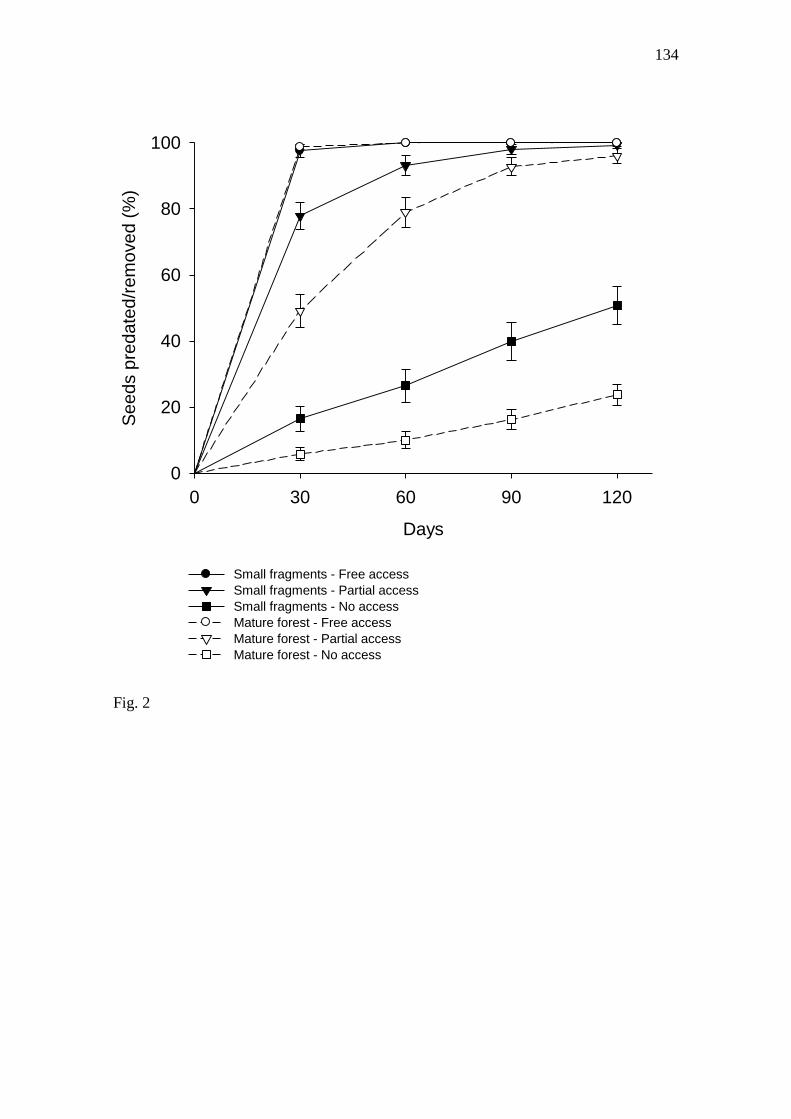
134
Fig. 2
Days
0 30 60 90 120
Seeds p
redate
d/r
em
oved (
%)
0
20
40
60
80
100
Small fragments - Free access
Small fragments - Partial access
Small fragments - No access
Mature forest - Free access
Mature forest - Partial access
Mature forest - No access

135
7. CONCLUSÕES
Nesta tese busquei evidências que indicassem a existência de relaxamento na
mortalidade de árvores dependente da densidade e distância em uma paisagem
fragmentada de Floresta Atlântica, uma vez que nos pequenos fragmentos florestais
dessa paisagem existe uma baixa diversidade de árvores e já havia sido diagnosticado
um incremento de até três vezes na densidade de algumas espécies. Em síntese, meus
resultados demonstram que: (1) um pequeno grupo de espécies pioneiras apresenta um
aumento na densidade populacional em pequenos fragmentos florestais, sendo esse
aumento de até 52 vezes; (2) não existe uma redução na distância de recrutamento
(distância entre jovens e adultos coespecíficos) nos pequenos fragmentos ao analisar
todas as espécies, apenas quando analisadas somente as espécies pioneiras; (3) exceto
pela pequena redução na distância média (2 m) entre adultos coespecíficos, não há
evidências que demonstrem uma agregação nas populações nos pequenos fragmentos
florestais; (4) não existe um relaxamento na predação de sementes dependente da
distância em Tapirira guianensis, uma espécie pioneira que apresenta densidades
elevadas nesses fragmentos.
Embora eu tenha observado um maior adensamento e uma redução na distância
do pico de recrutamento de espécies pioneiras, os resultados indicam que a estrutura das
assembleias arbóreas nos pequenos fragmentos não é resultado de relaxamentos na
mortalidade dependente da densidade e distância (MDDD), uma vez que tanto nas
assembleias de jovens como de adultos não foi observada uma agregação significativa
entre os indivíduos coespecíficos. O modelo de Janzen-Connell propõe que os inimigos
naturais diminuem a probabilidade de recrutamento próximo ao adulto parental, o que
resultaria em populações cujos indivíduos manteriam uma distância mínima uns dos
136
outros. Assim, um relaxamento na MDDD nos pequenos fragmentos criaria populações
cujos indivíduos se estabeleceriam mais próximos uns dos outros. Ainda, os pequenos
fragmentos apresentaram altos níveis de predação de sementes de T. guianensis (quase
100% das sementes desprotegidas foram predadas em um mês), sendo mais rápida que
em áreas de floresta madura no maior remanescente da paisagem – Mata de Coimbra
(3500 ha).
É importante salientar que nessa tese testei apenas um mecanismo de MDDD, a
predação de sementes. Além deste, a mortalidade de plântulas por herbívoros ou
patógenos também são mecanismos que podem ocasionar MDDD. É plausível que
ocorra um relaxamento na MDDD de plântulas por insetos herbívoros nesses pequenos
fragmentos uma vez que insetos especialistas parecem ser raros nesse ambiente
perturbado. Todavia, é difícil gerar hipóteses a respeito da MDDD por patógenos, pois
pouco se sabe sobre como a perda e fragmentação de habitat podem influenciar esses
micro-organismos, principalmente patógenos de solo, cuja atividade como agente de
MDDD tem sido amplamente documentada.
Entretanto, devemos também considerar o fato que as interações biológicas
talvez não representem a grande força estruturadora das assembleias arbóreas em
pequenos fragmentos e que esse papel possa ser exercido pelos filtros ambientais. As
alterações no ambiente físico resultantes da criação de áreas de borda transformaram
alguns fragmentos florestais em locais inóspitos para muitas espécies. Mesmo espécies
pioneiras estão apresentado reduções em sua densidade nos pequenos fragmentos. Dessa
forma, é provável que esse filtro ambiental esteja selecionando apenas espécies com
atributos ecofisiológicos que confiram uma maior tolerância a esse ambiente (e.g.,
maior tolerância ao déficit hídrico).
137
Em conclusão, os resultados obtidos não indicam que as mudanças observadas
na estrutura das assembleias arbóreas nos pequenos fragmentos resultam de
relaxamentos na MDDD. Entretanto, mesmo após 200 anos, os pequenos fragmentos
florestais ainda apresentam respostas negativas à fragmentação e perda de habitat. A
flora futura desses fragmentos provavelmente será composta por um subgrupo de
espécies pioneiras hiperabundantes e conterá um número reduzido de espécies raras.
Assim, os estudos oriundos desta tese trazem contribuições tanto para um melhor
entendimento do mecanismo proposto por Janzen-Connell como para o funcionamento
de processos ecológicos em florestas fragmentadas.
138
8. RESUMO
Dentre as hipóteses criadas para explicar a manutenção da diversidade de árvores em
florestas tropicais, uma das mais aceitas é a hipótese de Janzen-Connell. Essa hipótese
propõe que inimigos naturais diminuem a probabilidade de sobrevivência de sementes
e plântulas quando estas estão adensadas ou próximas ao adulto parental. Entretanto, é
provável que esse mecanismo proposto por Janzen-Connell seja menos intenso em
florestas fragmentadas. Esta tese teve como objetivo avaliar se a alta densidade de
determinadas espécies arbóreas em paisagens fragmentadas é resultado de um
relaxamento na mortalidade dependente da densidade e distância. Foram realizados
três estudos em uma paisagem fragmentada de Floresta Atlântica, comparando
pequenos fragmentos florestais com áreas de floresta madura no interior de um grande
remanescente. No primeiro, foram analisados os padrões de mudança nas densidades
de populações arbóreas no estágio de plântula e adulto para investigar quais espécies
tendem a predominar em pequenos fragmentos florestais. No segundo, foi analisada a
distribuição espacial de árvores adultas e jovens para inferir se a distância entre
indivíduos coespecíficos é menor nos pequenos fragmentos. No terceiro, foi realizado
um experimento de predação de sementes com a espécie Tapirira guianensis para
avaliar se existe uma redução na predação de sementes em pequenos fragmentos
florestais. Em síntese, os resultados demonstram que: (1) apenas um pequeno grupo de
espécies pioneiras apresenta um aumento na densidade populacional em pequenos
fragmentos florestais, enquanto muitas espécies tendem a se extinguir localmente ou
apresentar abundâncias extremamente baixas nesses fragmentos; (2) não existe uma
redução na distância entre jovens e adultos coespecíficos nos pequenos fragmentos ao
analisar todas as espécies, apenas quando analisadas somente as espécies pioneiras; (3)
139
exceto pela pequena redução na distância média (2 m) entre adultos coespecíficos, não
foi observada uma agregação nas populações nos pequenos fragmentos florestais; (4)
não existe um relaxamento na predação de sementes dependente da distância em
Tapirira guianensis. Os resultados obtidos não indicam que as mudanças observadas na
estrutura das assembleias arbóreas nos pequenos fragmentos resultam de relaxamentos
na mortalidade dependente da densidade e distância. Entretanto, mesmo após 200 anos,
esses fragmentos ainda apresentam uma redução na diversidade de árvores.
Palavras-chave: Comunidades vegetais, diversidade de árvores, espécies pioneiras,
florestas tropicais, fragmentação florestal, Janzen-Connell, predação de sementes.
140
9. ABSTRACT
The Janzen-Connell hypothesis is one of the most accept explanations for the high tree
diversity in tropical forests. This hypothesis proposes that natural enemies reduce the
survivorship of seeds and seedlings when they occur at high density or close to
parental trees. However, this mechanism may be weaker in fragmented forests. The
aim of this thesis was to evaluate if the high density of some tree species in
fragmented forests is a result of a relaxation in density- and distance-dependent
mortality. Three studies were carried out in a fragmented landscape of Atlantic Forest,
in which I compared small forest fragments with mature forest areas inside a large
remnant. In the first study, the densities of tree populations in the seedling and adult
phases were analyzed in order to investigate what species tend to predominate in small
forest fragments. In the second, the spatial distribution of saplings and adult trees was
analyzed to infer if the distance between conspecific individuals is smaller in small
fragments. In the third, a field experiment of seed predation with Tapirira guianensis
was realized to evaluate if there is a reduction in seed predation in small fragments. In
synthesis, the results demonstrate that: (1) only a small group of pioneer species is
increasing their density in small fragments, while many species tend to be locally
extinct or to present very low abundances in these fragments; (2) there is no reduction
in the distance between saplings and conspecific adults when considering all species,
but this reduction was observed when pioneer species were analyzed in isolation; (3)
except for the small reduction in the average distance (2 m) between conspecific
adults, there is no aggregation in populations in small fragments; (4) there is no
relaxation in distance-dependent seed predation for Tapirira guianensis. The results
do not indicate that the changes observed in the structure of tree assemblages in small

141
fragments are a result of a relaxation in density- and distance-dependent mortality.
However, even after 200 years, tree diversity loss persists in these small fragments.
Key words: forest fragmentation, Janzen-Connell, pioneer species, plant communities,
seed predation, tree diversity, tropical forests.
142
10. ANEXOS
GUIA PARA FORMATAÇÃO DE MANUSCRITOS PARA SUBMISSÃO AO
PERIÓDICO BIOLOGICAL CONSERVATION
NEW SUBMISSIONS
Submission to this journal proceeds totally online and you will be guided stepwise
through the creation and uploading of your files. The system automatically converts
your files to a single PDF file, which is used in the peer-review process.
As part of the Your Paper Your Way service, you may choose to submit your
manuscript as a single file to be used in the refereeing process. This can be a PDF file or
a Word document, in any format or lay-out that can be used by referees to evaluate your
manuscript. It should contain high enough quality figures for refereeing. If you prefer to
do so, you may still provide all or some of the source files at the initial submission.
Please note that individual figure files larger than 10 MB must be uploaded separately.
Please use correct, continuous line numbering and page numbering throughout the
document.
References
There are no strict requirements on reference formatting at submission. References can
be in any style or format as long as the style is consistent. Where applicable, author(s)
name(s), journal title/book title, chapter title/article title, year of publication, volume
number/book chapter and the pagination must be present. Use of DOI is highly
encouraged. The reference style used by the journal will be applied to the accepted
article by Elsevier at the proof stage. Note that missing data will be highlighted at proof
stage for the author to correct.
Formatting requirements
There are no strict formatting requirements but all manuscripts must contain the
essential elements needed to convey your manuscript, for example Abstract, Keywords,
Introduction, Materials and Methods, Results, Conclusions, Artwork and Tables with
Captions.
If your article includes any Videos and/or other Supplementary material, this should be
included in your initial submission for peer review purposes.
Divide the article into clearly defined sections.
Tables and Figures
Please place legends above Tables and below Figures. They should follow the
References at the end of the manuscript.
143
REVISED SUBMISSIONS
Use of word processing software
Please use correct, continuous line numbering and page numbering throughout the
document. It is important that the file be saved in the native format of the word processor used. The
text should be in single-column format. Keep the layout of the text as simple as
possible. Most formatting codes will be removed and replaced on processing the article.
In particular, do not use the word processor's options to justify text or to hyphenate
words. However, do use bold face, italics, subscripts, superscripts etc. When preparing
tables, if you are using a table grid, use only one grid for each individual table and not a
grid for each row. If no grid is used, use tabs, not spaces, to align columns. The
electronic text should be prepared in a way very similar to that of conventional
manuscripts (see also the Guide to Publishing with
Elsevier: http://www.elsevier.com/guidepublication). Note that source files of figures,
tables and text graphics will be required whether or not you embed your figures in the
text. See also the section on Electronic artwork.
To avoid unnecessary errors you are strongly advised to use the 'spell-check' and
'grammar-check' functions of your word processor.
Please use single spacing throughout the document. Use continuous line numbering
throughout the document. Avoid full justification, i.e., do not use a constant right-hand
margin. Ensure that each new paragraph is clearly indicated. Number every page of the
manuscript, including the title page, references tables, etc. Present tables and figure
legends on separate pages at the end of the manuscript. Layout and conventions must
conform with those given in this guide to authors. Journal style has changed over
time so do not use old issues as a guide. Number all pages consecutively. Italics are
not to be used for expressions of Latin origin, for example, in vivo, et al., per se. Use
decimal points (not commas); use a space for thousands (10 000 and above).
Use of word processing software
Regardless of the file format of the original submission, at revision you must provide us
with an editable file of the entire article. Keep the layout of the text as simple as
possible. Most formatting codes will be removed and replaced on processing the article.
The electronic text should be prepared in a way very similar to that of conventional
manuscripts (see also the Guide to Publishing with
Elsevier: http://www.elsevier.com/guidepublication). See also the section on Electronic
artwork.
To avoid unnecessary errors you are strongly advised to use the 'spell-check' and
'grammar-check' functions of your word processor.
Cover letter
Submission of a manuscript must be accompanied by a cover letter that includes the
following statements or acknowledgements:
The work is all original research carried out by the authors.
All authors agree with the contents of the manuscript and its submission to the
journal.
No part of the research has been published in any form elsewhere, unless it is fully
acknowledged in the manuscript. Authors should disclose how the research featured
in the manuscript relates to any other manuscript of a similar nature that they have

144
published, in press, submitted or will soon submit to Biological Conservation or
elsewhere.
The manuscript is not being considered for publication elsewhere while it is being
considered for publication in this journal.
Any research in the paper not carried out by the authors is fully acknowledged in the
manuscript.
All sources of funding are acknowledged in the manuscript, and authors have declared
any direct financial benefits that could result from publication.
All appropriate ethics and other approvals were obtained for the research. Where
appropriate, authors should state that their research protocols have been approved by
an authorized animal care or ethics committee, and include a reference to the code of
practice adopted for the reported experimentation or methodology. The Editor will
take account of animal welfare issues and reserves the right not to publish, especially
if the research involves protocols that are inconsistent with commonly accepted norms
of animal research.
Please include a short paragraph that describes the main finding of your paper, and its
significance to the field of conservation biology.
The authors should state in the cover letter if the paper in any form has previously
been submitted to Biological Conservation. In that case the authors should specify the
original manuscript number.
Article structure
Subdivision - numbered sections
Divide your article into clearly defined and numbered sections. Subsections should be
numbered 1.1 (then 1.1.1, 1.1.2, ...), 1.2, etc. (the abstract is not included in section
numbering). Use this numbering also for internal cross-referencing: do not just refer to
'the text'. Any subsection may be given a brief heading. Each heading should appear on
its own separate line.
Introduction
State the objectives of the work and provide an adequate background, avoiding a
detailed literature survey or a summary of the results.
Material and methods
Provide sufficient detail to allow the work to be reproduced. Methods already published
should be indicated by a reference: only relevant modifications should be described.
Theory/calculation
A Theory section should extend, not repeat, the background to the article already dealt
with in the Introduction and lay the foundation for further work. In contrast, a
Calculation section represents a practical development from a theoretical basis.
Results
Results should be clear and concise.
Discussion
This should explore the significance of the results of the work, not repeat them. A
combined Results and Discussion section is often appropriate. Avoid extensive citations
and discussion of published literature.
145
Conclusions
The main conclusions of the study may be presented in a short Conclusions section,
which may stand alone or form a subsection of a Discussion or Results and Discussion
section.
Glossary
Please supply, as a separate list, the definitions of field-specific terms used in your
article.
Appendices
If there is more than one appendix, they should be identified as A, B, etc. Formulae and
equations in appendices should be given separate numbering: Eq. (A.1), Eq. (A.2), etc.;
in a subsequent appendix, Eq. (B.1) and so on. Similarly for tables and figures: Table
A.1; Fig. A.1, etc.
Essential title page information
• Title. Concise and informative, yet not overly general. If appropriate, include the
species or ecosystem that was the subject of the study, or the location where the study
was done. Titles are often used in information-retrieval systems. Avoid abbreviations
and formulae where possible.
• Author names and affiliations. Where the family name may be ambiguous (e.g., a
double name), please indicate this clearly. Present the authors' affiliation addresses
(where the actual work was done) below the names. Indicate all affiliations with a
lower-case superscript letter immediately after the author's name and in front of the
appropriate address. Provide the full postal address of each affiliation, including the
country name and, if available, the e-mail address of each author.
• Corresponding author. Clearly indicate who will handle correspondence at all stages
of refereeing and publication, also post-publication. Ensure that phone numbers (with
country and area code) are provided in addition to the e-mail address and the
complete postal address. Contact details must be kept up to date by the
corresponding author.
• Present/permanent address. If an author has moved since the work described in the
article was done, or was visiting at the time, a 'Present address' (or 'Permanent address')
may be indicated as a footnote to that author's name. The address at which the author
actually did the work must be retained as the main, affiliation address. Superscript
Arabic numerals are used for such footnotes.
Abstract
A concise and factual abstract is required (maximum length of 250 words). The abstract
should state briefly the purpose of the research, the methods used, the principal results
and major conclusions. Please try to keep each sentence as specific as possible, and
avoid such general statements as "The management implications of the results are
discussed". An abstract is often presented separately from the article, so it must be able
to stand alone. For this reason, References should be avoided, but if essential, they must
be cited in full, without reference to the reference list. Also, non-standard or uncommon
abbreviations should be avoided, but if essential they must be defined at their first
mention in the abstract itself.

146
Graphical abstract
Although a graphical abstract is optional, its use is encouraged as it draws more
attention to the online article. The graphical abstract should summarize the contents of
the article in a concise, pictorial form designed to capture the attention of a wide
readership. Graphical abstracts should be submitted as a separate file in the online
submission system. Image size: Please provide an image with a minimum of 531 × 1328
pixels (h × w) or proportionally more. The image should be readable at a size of 5 × 13
cm using a regular screen resolution of 96 dpi. Preferred file types: TIFF, EPS, PDF or
MS Office files. See http://www.elsevier.com/graphicalabstracts for examples.
Authors can make use of Elsevier's Illustration and Enhancement service to ensure the
best presentation of their images and in accordance with all technical
requirements: Illustration Service.
Highlights
Highlights are mandatory for this journal. They consist of a short collection of bullet
points that convey the core findings of the article and should be submitted in a separate
file in the online submission system. Please use 'Highlights' in the file name and include
3 to 5 bullet points (maximum 85 characters, including spaces, per bullet point).
See http://www.elsevier.com/highlights for examples.
Stereochemistry abstract
For each important chiral compound you are requested to supply a stereochemistry
abstract detailing structure, name, formula and all available stereochemical information
for eventual incorporation into a database. An abstract for only one enantiomer per
compound is required.
Keywords
Immediately after the abstract, provide a maximum of 6 keywords, using American
spelling and avoiding general and plural terms and multiple concepts (avoid, for
example, 'and', 'of'). Be sparing with abbreviations: only abbreviations firmly
established in the field may be eligible. These keywords will be used for indexing
purposes.
Abbreviations
Define abbreviations that are not standard in this field in a footnote to be placed on the
first page of the article. Such abbreviations that are unavoidable in the abstract must be
defined at their first mention there, as well as in the footnote. Ensure consistency of
abbreviations throughout the article.
Acknowledgements
Collate acknowledgements in a separate section at the end of the article before the
references and do not, therefore, include them on the title page, as a footnote to the title
or otherwise. List here those individuals who provided help during the research (e.g.,
providing language help, writing assistance or proof reading the article, etc.).
Nomenclature and Units
Follow internationally accepted rules and conventions: use the international system of
units (SI) for all scientific and laboratory data. If other quantities are mentioned, give
their equivalent in SI.
147
Common names must be in lower-case except proper nouns. All common names must
be followed by a scientific name in parentheses in italics. For example, bottlenose
dolphin (Tursiops aduncus). Where scientific names are used in preference to common
names they should be in italics and the genus should be reduced to the first letter after
the first mention. For example, the first mention is given as Tursiops aduncus and
subsequent mentions are given as T. aduncus.
Math formulae
Present simple formulae in the line of normal text where possible and use the solidus (/)
instead of a horizontal line for small fractional terms, e.g., X/Y. In principle, variables
are to be presented in italics. Powers of e are often more conveniently denoted by exp.
Number consecutively any equations that have to be displayed separately from the text
(if referred to explicitly in the text).
Footnotes
Footnotes should be used sparingly. Number them consecutively throughout the article.
Many wordprocessors build footnotes into the text, and this feature may be used. Should
this not be the case, indicate the position of footnotes in the text and present the
footnotes themselves separately at the end of the article. Do not include footnotes in the
Reference list.
Table footnotes
Indicate each footnote in a table with a superscript lowercase letter.
Artwork
Electronic artwork
General points
• Make sure you use uniform lettering and sizing of your original artwork.
• Preferred fonts: Arial (or Helvetica), Times New Roman (or Times), Symbol, Courier.
• Number the illustrations according to their sequence in the text.
• Use a logical naming convention for your artwork files.
• Indicate per figure if it is a single, 1.5 or 2-column fitting image.
• For Word submissions only, you may still provide figures and their captions, and
tables within a single file at the revision stage.
• Please note that individual figure files larger than 10 MB must be provided in separate
source files.
A detailed guide on electronic artwork is available on our website:
http://www.elsevier.com/artworkinstructions.
You are urged to visit this site; some excerpts from the detailed information are
given here.
Formats
Regardless of the application used, when your electronic artwork is finalized, please
'save as' or convert the images to one of the following formats (note the resolution
requirements for line drawings, halftones, and line/halftone combinations given below):
EPS (or PDF): Vector drawings. Embed the font or save the text as 'graphics'.
148
TIFF (or JPG): Color or grayscale photographs (halftones): always use a minimum of
300 dpi.
TIFF (or JPG): Bitmapped line drawings: use a minimum of 1000 dpi.
TIFF (or JPG): Combinations bitmapped line/half-tone (color or grayscale): a minimum
of 500 dpi is required.
Please do not:
• Supply files that are optimized for screen use (e.g., GIF, BMP, PICT, WPG); the
resolution is too low.
• Supply files that are too low in resolution.
• Submit graphics that are disproportionately large for the content.
Color artwork
Please make sure that artwork files are in an acceptable format (TIFF (or JPEG), EPS
(or PDF), or MS Office files) and with the correct resolution. If, together with your
accepted article, you submit usable color figures then Elsevier will ensure, at no
additional charge, that these figures will appear in color on the Web (e.g., ScienceDirect
and other sites) regardless of whether or not these illustrations are reproduced in color in
the printed version. For color reproduction in print, you will receive information
regarding the costs from Elsevier after receipt of your accepted article. Please
indicate your preference for color: in print or on the Web only. For further information
on the preparation of electronic artwork, please
see http://www.elsevier.com/artworkinstructions.
Please note: Because of technical complications that can arise by converting color
figures to 'gray scale' (for the printed version should you not opt for color in print)
please submit in addition usable black and white versions of all the color illustrations.
Figure captions
Ensure that each illustration has a caption. A caption should comprise a brief title
(not on the figure itself) and a description of the illustration. Keep text in the
illustrations themselves to a minimum but explain all symbols and abbreviations used.
Tables
Number tables consecutively in accordance with their appearance in the text. Place
footnotes to tables below the table body and indicate them with superscript lowercase
letters. Avoid vertical rules. Be sparing in the use of tables and ensure that the data
presented in tables do not duplicate results described elsewhere in the article.
References Citation in text
Please ensure that every reference cited in the text is also present in the reference list
(and vice versa). Any references cited in the abstract must be given in full. Unpublished
results and personal communications are not recommended in the reference list, but may
be mentioned in the text. If these references are included in the reference list they
should follow the standard reference style of the journal and should include a
substitution of the publication date with either 'Unpublished results' or 'Personal
communication'. Citation of a reference as 'in press' implies that the item has been
accepted for publication.

149
Reference links
Increased discoverability of research and high quality peer review are ensured by online
links to the sources cited. In order to allow us to create links to abstracting and indexing
services, such as Scopus, CrossRef and PubMed, please ensure that data provided in the
references are correct. Please note that incorrect surnames, journal/book titles,
publication year and pagination may prevent link creation. When copying references,
please be careful as they may already contain errors. Use of the DOI is encouraged.
Web references
As a minimum, the full URL should be given and the date when the reference was last
accessed. Any further information, if known (DOI, author names, dates, reference to a
source publication, etc.), should also be given. Web references can be listed separately
(e.g., after the reference list) under a different heading if desired, or can be included in
the reference list.
References in a special issue
Please ensure that the words 'this issue' are added to any references in the list (and any
citations in the text) to other articles in the same Special Issue.
Reference management software
This journal has standard templates available in key reference management packages
EndNote (http://www.endnote.com/support/enstyles.asp) and Reference Manager
(http://refman.com/support/rmstyles.asp). Using plug-ins to wordprocessing packages,
authors only need to select the appropriate journal template when preparing their article
and the list of references and citations to these will be formatted according to the journal
style which is described below.
Reference formatting
There are no strict requirements on reference formatting at submission. References can
be in any style or format as long as the style is consistent. Where applicable, author(s)
name(s), journal title/book title, chapter title/article title, year of publication, volume
number/book chapter and the pagination must be present. Use of DOI is highly
encouraged. The reference style used by the journal will be applied to the accepted
article by Elsevier at the proof stage. Note that missing data will be highlighted at proof
stage for the author to correct. If you do wish to format the references yourself they
should be arranged according to the following examples:
Reference style
Text: All citations in the text should refer to:
1. Single author: the author's name (without initials, unless there is ambiguity) and the
year of publication;
2. Two authors: both authors' names and the year of publication;
3. Three or more authors: first author's name followed by 'et al.' and the year of
publication.
Citations may be made directly (or parenthetically). Groups of references should be
listed first alphabetically, then chronologically.
Examples: 'as demonstrated (Allan, 2000a, 2000b, 1999; Allan and Jones, 1999).
Kramer et al. (2010) have recently shown ....'
150
List: References should be arranged first alphabetically and then further sorted
chronologically if necessary. More than one reference from the same author(s) in the
same year must be identified by the letters 'a', 'b', 'c', etc., placed after the year of
publication.
Examples:
Reference to a journal publication:
Van der Geer, J., Hanraads, J.A.J., Lupton, R.A., 2010. The art of writing a scientific
article. J. Sci. Commun. 163, 51–59.
Reference to a book:
Strunk Jr., W., White, E.B., 2000. The Elements of Style, fourth ed. Longman, New
York.
Reference to a chapter in an edited book:
Mettam, G.R., Adams, L.B., 2009. How to prepare an electronic version of your article,
in: Jones, B.S., Smith , R.Z. (Eds.), Introduction to the Electronic Age. E-Publishing
Inc., New York, pp. 281–304.
Video data
Elsevier accepts video material and animation sequences to support and enhance your
scientific research. Authors who have video or animation files that they wish to submit
with their article are strongly encouraged to include links to these within the body of the
article. This can be done in the same way as a figure or table by referring to the video or
animation content and noting in the body text where it should be placed. All submitted
files should be properly labeled so that they directly relate to the video file's content. In
order to ensure that your video or animation material is directly usable, please provide
the files in one of our recommended file formats with a preferred maximum size of 50
MB. Video and animation files supplied will be published online in the electronic
version of your article in Elsevier Web products, including
ScienceDirect: http://www.sciencedirect.com. Please supply 'stills' with your files: you
can choose any frame from the video or animation or make a separate image. These will
be used instead of standard icons and will personalize the link to your video data. For
more detailed instructions please visit our video instruction pages
at http://www.elsevier.com/artworkinstructions. Note: since video and animation cannot
be embedded in the print version of the journal, please provide text for both the
electronic and the print version for the portions of the article that refer to this content.
Audio Slides
The journal encourages authors to create an AudioSlides presentation with their
published article. AudioSlides are brief, webinar-style presentations that are shown next
to the online article on ScienceDirect. This gives authors the opportunity to summarize
their research in their own words and to help readers understand what the paper is about.
More information and examples are available at http://www.elsevier.com/audioslides.
Authors of this journal will automatically receive an invitation e-mail to create an
AudioSlides presentation after acceptance of their paper.
Supplementary data
Elsevier accepts electronic supplementary material to support and enhance your
scientific research. Supplementary files offer the author additional possibilities to
publish supporting applications, high-resolution images, background datasets, sound
clips and more. Supplementary files supplied will be published online alongside the

151
electronic version of your article in Elsevier Web products, including
ScienceDirect: http://www.sciencedirect.com. In order to ensure that your submitted
material is directly usable, please provide the data in one of our recommended file
formats. Authors should submit the material in electronic format together with the
article and supply a concise and descriptive caption for each file. For more detailed
instructions please visit our artwork instruction pages at
http://www.elsevier.com/artworkinstructions.
The supplementary material should be cited as an online Appendix to the paper, usually
in the Methods. If it contains several tables, images and/or figures, these should be cited
as Table A1, Figure A1 and so on.
Authors are strongly encouraged to make the data supporting their paper available to
readers through an open-access data repository and/or as an Appendix to the paper. For
more details on journal data policy see the paragraphs on Data Depositing and Linking
to and depositing data at PANGAEA.
Data Depositing Ideally, data should be freely available online through a specialist data centre that
provides a permanent archive (repository) for the dataset, and may integrate the data
with other datasets using international standards. Examples include PANGAEA, and
GBIF and its major contributors such as OBIS and VertNet. Some Ocean Data Centres
may also provide this service. Where such a data centre does not exist, we ask that the
data be made freely available online from a permanent archive (repository). Where
possible, it should follow international data standards. This may be an institutional
repository for its staff. The data should be accompanied by sufficient information
(metadata) for the reader to understand its composition and origins, and determine if it
is fit for their purpose. In particular, the data should allow the results of the publication
to be reproduced. Data being downloadable from departmental or personal websites is
not regarded as permanently archived.
Open data
This journal supports Open Data, enabling authors to submit any raw (unprocessed)
research data with their article for open access publication on ScienceDirect under the
CC BY license. For more information, please visit
http://www.elsevier.com/about/research-data/open-data.
Data at PANGAEA
Electronic archiving of supplementary data enables readers to replicate, verify and build
upon the conclusions published in your paper. We recommend that data should be
deposited in the data library PANGAEA (http://www.pangaea.de). Data are quality
controlled and archived by an editor in standard machine-readable formats and are
available via Open Access. After processing, the author receives an identifier (DOI)
linking to the supplements for checking. As your data sets will be citable you might
want to refer to them in your article. In any case, data supplements and the article will
be automatically linked as in the following example: doi:10.1016/0016-7037(95)00105-
9. Please use PANGAEA's web interface to submit your data
(http://www.pangaea.de/submit/).
152
Google Maps and KML files
KML (Keyhole Markup Language) files (optional): You can enrich your online articles
by providing KML or KMZ files which will be visualized using Google maps. The
KML or KMZ files can be uploaded in our online submission system. KML is an XML
schema for expressing geographic annotation and visualization within Internet-based
Earth browsers. Elsevier will generate Google Maps from the submitted KML files and
include these in the article when published online. Submitted KML files will also be
available for downloading from your online article on ScienceDirect. For more
information see http://www.elsevier.com/googlemaps.
Interactive Phylogenetic Trees
You can enrich your online articles by providing phylogenetic tree data files (optional)
in Newick or NeXML format, which will be visualized using the interactive tree viewer
embedded within the online article. Using the viewer it will be possible to zoom into
certain tree areas, change the tree layout, search within the tree, and collapse/expand
tree nodes and branches. Submitted tree files will also be available for downloading
from your online article on ScienceDirect. Each tree must be contained in an individual
data file before being uploaded separately to the online submission system, via the
'phylogenetic tree data' submission category. Newick files must have the extension .new
or .nwk (note that a semicolon is needed to end the tree). Please do not enclose
comments in Newick files and also delete any artificial line breaks within the tree data
because these will stop the tree from showing. For NeXML, the file extension should be
.xml. Please do not enclose comments in the file. Tree data submitted with other file
extensions will not be processed. Please make sure that you validate your
Newick/NeXML files prior to submission. For more information please
see http://www.elsevier.com/phylogenetictrees.
Interactive plots
This journal encourages you to include data and quantitative results as interactive plots
with your publication. To make use of this feature, please include your data as a CSV
(comma-separated values) file when you submit your manuscript. Please refer
to http://www.elsevier.com/interactiveplots for further details and formatting
instructions.
Submission checklist
The following list will be useful during the final checking of an article prior to sending
it to the journal for review. Please consult this Guide for Authors for further details of
any item.
Ensure that the following items are present:
One author has been designated as the corresponding author with contact details:
• E-mail address
• Full postal address
• Telephone
All necessary files have been uploaded, and contain:
• Keywords
• All figure captions
• All tables (including title, description, footnotes)
Further considerations
• Manuscript has been 'spell-checked' and 'grammar-checked'

153
• All references mentioned in the Reference list are cited in the text, and vice versa
• Permission has been obtained for use of copyrighted material from other sources
(including the Web)
• Color figures are clearly marked as being intended for color reproduction on the Web
(free of charge) and in print, or to be reproduced in color on the Web (free of charge)
and in black-and-white in print
• If only color on the Web is required, black-and-white versions of the figures are also
supplied for printing purposes
For any further information please visit our customer support site
at http://support.elsevier.com.
154
GUIA PARA FORMATAÇÃO DE MANUSCRITOS PARA SUBMISSÃO AO
PERIÓDICO BIOTROPICA
BIOTROPICA – JOURNAL OF THE ASSOCIATION FOR TROPICAL BIOLOGY
AND CONSERVATION
CHECKLIST FOR PREPARATION OF MANUSCRIPTS AND ILLUSTRATIONS (updated February
2010)
Online submission and review of manuscripts is mandatory effective 01 January 2005. Please format your paper according to these instructions and then go to the following
website to submit your manuscript (http://mc.manuscriptcentral.com/bitr). Contact the
BIOTROPICA Office for assistance if you are unable to submit your manuscript via
Manuscript Central ([email protected]).
Authors are requested to provide a cover letter that details the novelty, relevance and
implications of their work, and a brief explanation of the suitability of the work for
BIOTROPICA. The number of words in the manuscript should also be given in the cover
letter.
Owing to limited space within Biotropica we ask authors to place figures and tables that do
not have central relevance to the manuscript as online Supporting Information (SI). SI
accompanies the online version of a manuscript and will be fully accessible to everyone
with electronic access to Biotropica. Authors are welcome to submit supplementary
information, including photographs, for inclusion as SI, although all such material must be
cited in the text of the printed manuscript. The Editor reserves the right to make decisions
regarding tables, figures and other materials in SI. If authors disagree with the Editor’s
decision, they could ask for such tables and figures to be included in the printed article on
the condition that the authors cover the additional page charges incurred at the rate of US
$60 per page.
I. General Instructions Publication must be in English, but second abstract in other languages (such as
Spanish, French, Portuguese, Hindi, Arabic, Chinese etc.) may be published as online
Supporting Information. BIOTROPICA offers assistance in editing manuscripts if this
is required (see English Editorial Assistance below). Second abstracts will not be
copy-edited and the author(s) must take full responsibility for content and quality.
Manuscripts may be submitted in the following categories, based on these suggested
word limits:
Paper (up to 5000 words)
Insights (up to 2000 words)
Review (up to 8000 words)
Commentary (up to 2000 words)
Word counts exclude title page, abstract(s), literature cited, tables, figures, or
appendices.
Use 8.5" x 11" page size (letter size). Double space everything, including tables, figure
legends, abstract, and literature cited.
Use a 1" margin on all sides. Align left. Avoid hyphens or dashes at ends of lines; do
not divide a word at the end of a line.
Use standard 12 point type (Times New Roman).
Indent all but the first paragraph of each section.

155
Use italics instead of underline throughout. Italicize non-English words such as e.g.,
i.e., et al., cf., ca, n.b., post-hoc, and sensu (the exceptions being ‘vs.’ and ‘etc.’).
Include page number in the centre of all pages. Do use line numbering starting on each
page.
Cite each figure and table in the text. Tables and figures must be numbered in the order
in which they are cited in the text.
Use these abbreviations: yr (singular & plural), mo, wk, d, h, min, sec, diam, km, cm,
mm, ha, kg, g, L, g/m2
For units, avoid use of negative numbers as superscripts: use the notation /m2
rather
than m-2
.
Write out other abbreviations the first time they are used in the text; abbreviate
thereafter: "El Niño Southern Oscillation (ENSO) . . ."
Numbers: Write out one to ten unless a measurement (e.g., four trees, 6 mm, 35 sites, 7
yr, 10 × 5 m, > 7 m, ± SE) or in combination with other numbers (e.g., 5 bees and 12
wasps). Use a comma as a separator in numbers with more than four digits (i.e.,
1000, but 10,000); use decimal points as in 0.13; 21°C (no spaces); use dashes to
indicate a set location of a given size (e.g., 1-ha plot).
Spell out ‘percent’ except when used in parentheses (20%) and for 95% CI.
Statistical abbreviations: Use italics for P, N, t, F, R2
, r, G, U, N, χ2
(italics, superscripts
non-italics); but use roman for: df, SD, SE, SEM, CI, two-way ANOVA, ns
Dates: 10 December 1997; Times: 0930 h, 2130 h
Latitude and Longitude are expressed as: 10°34′21″ N, 14°26′12″ W
Above sea level is expressed as: asl
Regions: SE Asia, UK (no periods), but note that U.S.A. includes periods.
Geographical place names should use the English spelling in the text (Zurich, Florence,
Brazil), but authors may use their preferred spelling when listing their affiliation
(Zürich, Firenze, Brasil).
Lists in the text should follow the style: … : (1)… ; (2)…; and (3)…, as in, “The aims
of the study were to: (1) evaluate pollination success in Medusagyne oppositifolia; (2)
quantify gene flow between populations; and (3) score seed set.”
Each reference cited in text must be listed in the Literature Cited section, and vice
versa. Double check for consistency, spelling and details of publication, including
city and country of publisher.
For manuscripts ACCEPTED for publication but not yet published, cite as Yaz (in
press) or (Yaz, in press). Materials already published online can be cited using the
digital object identifier (doi)
Literature citations in the text are as follows:
One author: Yaz (1992) or (Yaz 1992)
Two authors: Yaz and Ramirez (1992); (Yaz & Ramirez 1992)
Three or more authors: Yaz et al. (1992), but include ALL authors in the
literature cited section.
Cite unpublished materials or papers not in press as (J. Yaz, pers. obs.) or (J. Yaz,
unpubl. data). Initials and last name must be provided. ‘In prep’ or ‘submitted’ are
NOT acceptable, and we encourage authors not to use ‘pers. obs.’ or ‘unpubl. data’
unless absolutely necessary. Personal communications are cited as (K. A. Liston,
pers. comm.).
Use commas (Yaz & Taz 1981, Ramirez 1983) to separate citations, BUT use
semicolon for different types of citations (Fig. 4; Table 2) or with multiple dates per
author (Yaz et al. 1982a, b; Taz 1990, 1991). Order references by year, then
alphabetical (Azy 1980, Yaz 1980, Azy 1985).
Assemble manuscripts in this order:
156
Title page
Abstract (s)
Key words
Text
Acknowledgments (spelled like this)
Literature cited
Tables
Appendix (when applicable)
Figure legends (one page)
Figures
For the review purpose, submit the entire manuscript, with Tables, Figure legends and
Figures embedded at the end of the manuscript text, as a Microsoft Word for
Windows document (*.doc), or equivalent for Mac or Linux. Do NOT submit papers
as pdf files.
II. Title Page (Do not number the title page)
Running heads two lines below top of page.
LRH: Yaz, Pirozki, and Peigh (may not exceed 50 characters or six author names; use Yaz
et al.)
RRH: Seed Dispersal by Primates (use capitals; may not exceed 50 characters or six
words)
Complete title, flush left, near middle of page, Bold Type and Initial Caps, usually no
more than 12 words.
Where species names are given in the title it should be clear to general readers what
type(s) of organism(s) are being referred to, either by using Family appellation or
common name. For example: ‘Invasion of African Savanna Woodlands by the
Jellyfish tree Medusagyne oppositifolia’, or ‘Invasion of African Savanna Woodlands
by Medusagyne oppositifolia (Medusagynaceae)’
Titles that include a geographic locality should make sure that this is clear to the
general reader. For example: ‘New Species of Hummingbird Discovered on Flores,
Indonesia’, and NOT ‘New Species of Hummingbird Discovered on Flores’.
Below title, include author(s) name(s), affiliation(s), and unabbreviated complete
address(es). Use superscript number(s) following author(s) name(s) to indicate
current location(s) if different than above. In multi-authored papers, additional
footnote superscripts may be used to indicate the corresponding author and e-mail
address. Please refer to a current issue.
At the bottom of the title page every article must include: Received ____; revision
accepted ___ . (BIOTROPICA will fill in dates.)
III. Abstract Page (Page 1)
Abstracts should be concise (maximum of 250 words for papers and reviews; 50 words
for Insights; no abstract for Commentary). Include brief statements about the intent,
materials and methods, results, and significance of findings. The abstract of Insights
should emphasise the novelty and impact of the paper.
Do not use abbreviations in the abstract.
Authors are strongly encouraged to provide a second abstract in the language
relevant to the country in which the research was conducted, and which will be
published as online Supporting Information. This second abstract should be
embedded in the manuscript text following the first abstract.

157
Provide up to eight key words after the abstract, separated by a semi-colon (;). Key
words should be listed alphabetically. Include location, if not already mentioned in
the title. See style below. Key words should NOT repeat words used in the title.
Authors should aim to provide informative key words—avoid words that are too
broad or too specific.
Key words: Melastomataceae; Miconia argentea; seed dispersal; Panama; tropical wet
forest.—Alphabetized and key words in English only.
IV. Text (Page 2, etc) See General Instructions above, or recent issue of BIOTROPICA (Section I).
No heading for Introduction. First line or phrase of Introduction should be SMALL
CAPS.
Main headings are METHODS, RESULTS, and DISCUSSION: All CAPITALS and
Bold. Flush left, one line.
One line space between main heading and text
Second level headings: SMALL CAPS, flush left, Capitalize first letter, begin sentence
with em-dash, same line (e.g., INVENTORY TECHNIQUE.—The ant inventory…).
Use no more than second level headings.
Do not use footnotes in this section.
References to figures are in the form of ‘Fig. 1’, and tables as ‘Table 1’. Reference to
online Supporting Information is as ‘Fig. S1’ or ‘Table S1’.
V. Literature Cited (Continue page numbering and double spacing)
No ‘in prep.’ or ‘submitted’ titles are acceptable; cite only articles published or ‘in
press’. ‘In press’ citations must be accepted for publication. Include journal or
publisher.
Verify all entries against original sources, especially journal titles, accents, diacritical
marks, and spelling in languages other than English.
Cite references in alphabetical order by first author's surname. References by a single
author precede multi-authored works by the same senior author, regardless of date.
List works by the same author chronologically, beginning with the earliest date of
publication.
Insert a period and space after each initial of an author's name; example: YAZ, A. B.,
AND B. AZY. 1980.
Authors Names: use SMALL CAPS.
Every reference should spell out author names as described above. BIOTROPICA no
longer uses ‘em-dashes’ (—) to substitute previously mentioned authors.
Use journal name abbreviations (see
http://www.bioscience.org/atlases/jourabbr/list.htm). If in doubt provide full journal
name.
Double-space. Hanging indent of 0.5 inch.
Leave a space between volume and page numbers and do not include issue numbers.
27: 3–12
Article in books, use: AZY, B. 1982. Title of book chapter. In G. Yaz (Ed.). Book title,
pp. 24–36. Blackwell Publications, Oxford, UK.
Dissertations, use: ‘PhD Dissertation’ and ‘MSc Dissertation’.
VI. Tables (Continue page numbering)
Each table must start on a separate page, double-spaced. The Table number should be
in Arabic numerals followed by a period. Capitalize first word of title, double space

158
the table caption. Caption should be italicized, except for words and species names
that are normally in italics.
Indicate footnotes by lowercase superscript letters (a
, b
, c
, etc.).
Do not use vertical lines in tables.
Ensure correct alignment of numbers and headings in the table (see current issues)
Tables must be inserted as a Word table or copy and pasted from Excel in HTML
format.
VII. Figure Legends
(Continue page numbering)
Double-space legends. All legends on one page.
Type figure legends in paragraph form, starting with ‘FIGURE’ (uppercase) and
number.
Do not include ‘exotic symbols’ (lines, dots, triangles, etc.) in figure legends; either
label them in the figure or refer to them by name in the legend.
Label multiple plots/images within one figure as A, B, C etc, as in ‘FIGURE 1. Fitness
of Medusagyne oppositifolia as indicated by (A) seed set and (B) seed viability’,
making sure to include the labels in the relevant plot.
VIII. Preparation of Illustrations or Graphs
Please consult http://www.blackwellpublishing.com/bauthor/illustration.asp for
detailed information on submitting electronic artwork. We urge authors to make
use of online Supporting Information, particularly for tables and figures that do
not have central importance to the manuscript. If the editorial office decides to
move tables or figures to SI, a delay in publication of the paper will necessarily
result. We therefore advise authors to identify material for SI on submission of
the manuscript. Black-and-white or half-tone (photographs), drawings, or graphs are all referred to as
‘Figures’ in the text. Consult editor about color figures. Reproduction is virtually
identical to what is submitted; flaws will not be corrected. Consult a recent issue of
BIOTROPICA for examples.
If it is not possible to submit figures embedded within the text file, then submission as
*.pdf, *.tif or *.eps files is permissible.
Native file formats (Excel, DeltaGraph, SigmaPlot, etc.) cannot be used in production.
When your manuscript is accepted for publication, for production purposes, authors
will be asked upon acceptance of their papers to submit:
– Line artwork (vector graphics) as *.eps, with a resolution of > 300 dpi at final size
– Bitmap files (halftones or photographs) as *.tif or *.eps, with a resolution of >300
dpi at final size
Final figures will be reduced. Be sure that all text will be legible when reduced to the
appropriate size. Use large legends and font sizes. We recommend using Arial font
(and NOT Bold) for labels within figures.
Do not use negative exponents in figures, including axis labels.
Each plot/image grouped in a figure or plate requires a label (e.g., A, B). Use upper
case letters on grouped figures, and in text references.
Use high contrast for bar graphs. Solid black or white is preferred.
IX. Insights (up to 2000 words) Title page should be formatted as with Papers (see above)
No section headings.

159
Up to two figures or tables (additional material can be published as online Supporting
Information).
X. Appendices We do NOT encourage the use of Appendices unless absolutely necessary. Appendices
will be published as online Supporting Information in almost all cases.
Appendices are appropriate for species lists, detailed technical methods, mathematical
equations and models, or additional references from which data for figures or tables
have been derived (e.g., in a review paper). If in doubt, contact the editor.
Appendices must be referred to in the text, as Appendix S1. Additional figures and
tables may be published as SI (as described above), but these should be referred to as
Fig. S1, Table S1.
Appendices should be submitted as a separate file.
The editor reserves the right to move figures, tables and appendices to SI from the
printed text, but will discuss this with the corresponding author in each case.
English Editorial Assistance Authors for whom English is a second language may choose to have their manuscript
professionally edited before submission to improve the English and to prepare the
manuscript in accordance with the journal style. Biotropica provides this service as the cost
of US$ 25, - per hour. Please contact the Biotropica office at [email protected] if you
wish to make use of this service. The service is paid for by the author and use of a service
does not guarantee acceptance or preference for publication.
Manuscripts that are scientifically acceptable but require rewriting to improve clarity and to
conform to the Biotropica style will be returned to authors with a provisional acceptance
subject to rewriting. Authors of such papers may use the Biotropica editing service at the
cost of US$ 25, - per hour for this purpose.
Most papers require between two to four hours, but this is dependent on the work required.
Authors will always be contacted should there be any uncertainty about scientific meaning,
and the edited version will be sent to authors for final approval before proceeding with
publication.
160
GUIA PARA FORMATAÇÃO DE MANUSCRITOS PARA SUBMISSÃO AO
PERIÓDICO ACTA OECOLOGICA
NEW SUBMISSIONS
Submission to this journal proceeds totally online and you will be guided stepwise
through the creation and uploading of your files. The system automatically converts
your files to a single PDF file, which is used in the peer-review process.
As part of the Your Paper Your Way service, you may choose to submit your
manuscript as a single file to be used in the refereeing process. This can be a PDF file or
a Word document, in any format or lay-out that can be used by referees to evaluate your
manuscript. It should contain high enough quality figures for refereeing. If you prefer to
do so, you may still provide all or some of the source files at the initial submission.
Please note that individual figure files larger than 10 MB must be uploaded separately.
References
There are no strict requirements on reference formatting at submission. References can
be in any style or format as long as the style is consistent. Where applicable, author(s)
name(s), journal title/book title, chapter title/article title, year of publication, volume
number/book chapter and the pagination must be present. Use of DOI is highly
encouraged. The reference style used by the journal will be applied to the accepted
article by Elsevier at the proof stage. Note that missing data will be highlighted at proof
stage for the author to correct.
Formatting requirements
There are no strict formatting requirements but all manuscripts must contain the
essential elements needed to convey your manuscript, for example Abstract, Keywords,
Introduction, Materials and Methods, Results, Conclusions, Artwork and Tables with
Captions.
If your article includes any Videos and/or other Supplementary material, this should be
included in your initial submission for peer review purposes.
Divide the article into clearly defined sections.
Please ensure your paper has consecutive line numbering - this is an essential peer
review requirement.
Figures and tables embedded in text
Please ensure the figures and the tables included in the single file are placed next to the
relevant text in the manuscript, rather than at the bottom or the top of the file.
REVISED SUBMISSIONS
Use the word processor's features to number automatically the pages and the lines.
Use of word processing software
Regardless of the file format of the original submission, at revision you must provide us
with an editable file of the entire article. Keep the layout of the text as simple as

161
possible. Most formatting codes will be removed and replaced on processing the article.
The electronic text should be prepared in a way very similar to that of conventional
manuscripts (see also the Guide to Publishing with
Elsevier: http://www.elsevier.com/guidepublication). See also the section on Electronic
artwork.
To avoid unnecessary errors you are strongly advised to use the 'spell-check' and
'grammar-check' functions of your word processor.
Articles should be divided into sections in the following sequence: title page, abstract,
keywords, introduction, materials and methods, results, discussion, conclusion,
acknowledgements, references, tables, legends of figures and figures.
Subdivision - numbered sections
Divide your article into clearly defined and numbered sections. Subsections should be
numbered 1.1 (then 1.1.1, 1.1.2, ...), 1.2, etc. (the abstract is not included in section
numbering). Use this numbering also for internal cross-referencing: do not just refer to
'the text'. Any subsection may be given a brief heading. Each heading should appear on
its own separate line.
Introduction
State the objectives of the work and provide an adequate background, avoiding a
detailed literature survey or a summary of the results.
Material and methods
Provide sufficient detail to allow the work to be reproduced. Methods already published
should be indicated by a reference: only relevant modifications should be described.
Theory/calculation
A Theory section should extend, not repeat, the background to the article already dealt
with in the Introduction and lay the foundation for further work. In contrast, a
Calculation section represents a practical development from a theoretical basis.
Results
Results should be clear and concise.
Discussion
This should explore the significance of the results of the work, not repeat them. A
combined Results and Discussion section is often appropriate. Avoid extensive citations
and discussion of published literature.
Conclusions
The main conclusions of the study may be presented in a short Conclusions section,
which may stand alone or form a subsection of a Discussion or Results and Discussion
section.
Appendices
If there is more than one appendix, they should be identified as A, B, etc. Formulae and
equations in appendices should be given separate numbering: Eq. (A.1), Eq. (A.2), etc.;
in a subsequent appendix, Eq. (B.1) and so on. Similarly for tables and figures: Table
A.1; Fig. A.1, etc.
162
Essential title page information
• Title. Concise and informative. Titles are often used in information-retrieval systems.
Avoid abbreviations and formulae where possible.
• Author names and affiliations. Where the family name may be ambiguous (e.g., a
double name), please indicate this clearly. Present the authors' affiliation addresses
(where the actual work was done) below the names. Indicate all affiliations with a
lower-case superscript letter immediately after the author's name and in front of the
appropriate address. Provide the full postal address of each affiliation, including the
country name and, if available, the e-mail address of each author.
• Corresponding author. Clearly indicate who will handle correspondence at all stages
of refereeing and publication, also post-publication. Ensure that phone numbers (with
country and area code) are provided in addition to the e-mail address and the
complete postal address. Contact details must be kept up to date by the
corresponding author.
• Present/permanent address. If an author has moved since the work described in the
article was done, or was visiting at the time, a 'Present address' (or 'Permanent address')
may be indicated as a footnote to that author's name. The address at which the author
actually did the work must be retained as the main, affiliation address. Superscript
Arabic numerals are used for such footnotes.
Graphical abstract Although a graphical abstract is optional, its use is encouraged as it draws more
attention to the online article. The graphical abstract should summarize the contents of
the article in a concise, pictorial form designed to capture the attention of a wide
readership. Graphical abstracts should be submitted as a separate file in the online
submission system. Image size: Please provide an image with a minimum of 531 × 1328
pixels (h × w) or proportionally more. The image should be readable at a size of 5 × 13
cm using a regular screen resolution of 96 dpi. Preferred file types: TIFF, EPS, PDF or
MS Office files. See http://www.elsevier.com/graphicalabstracts for examples.
Authors can make use of Elsevier's Illustration and Enhancement service to ensure the
best presentation of their images and in accordance with all technical
requirements: Illustration Service.
Highlights
Highlights are a short collection of bullet points that convey the core findings of the
article. Highlights are optional and should be submitted in a separate file in the online
submission system. Please use 'Highlights' in the file name and include 3 to 5 bullet
points (maximum 85 characters, including spaces, per bullet point).
Seehttp://www.elsevier.com/highlights for examples.
Keywords
Immediately after the abstract, provide a maximum of 6 keywords, using American
spelling and avoiding general and plural terms and multiple concepts (avoid, for
example, 'and', 'of'). Be sparing with abbreviations: only abbreviations firmly
established in the field may be eligible. These keywords will be used for indexing
purposes.

163
Abbreviations
Define abbreviations that are not standard in this field in a footnote to be placed on the
first page of the article. Such abbreviations that are unavoidable in the abstract must be
defined at their first mention there, as well as in the footnote. Ensure consistency of
abbreviations throughout the article.
Acknowledgements
Collate acknowledgements in a separate section at the end of the article before the
references and do not, therefore, include them on the title page, as a footnote to the title
or otherwise. List here those individuals who provided help during the research (e.g.,
providing language help, writing assistance or proof reading the article, etc.).
Math formulae
Present simple formulae in the line of normal text where possible and use the solidus (/)
instead of a horizontal line for small fractional terms, e.g., X/Y. In principle, variables
are to be presented in italics. Powers of e are often more conveniently denoted by exp.
Number consecutively any equations that have to be displayed separately from the text
(if referred to explicitly in the text).
Footnotes
Footnotes should be used sparingly. Number them consecutively throughout the article.
Many wordprocessors build footnotes into the text, and this feature may be used. Should
this not be the case, indicate the position of footnotes in the text and present the
footnotes themselves separately at the end of the article. Do not include footnotes in the
Reference list.
Table footnotes
Indicate each footnote in a table with a superscript lowercase letter.
Artwork
Electronic artwork
General points
• Make sure you use uniform lettering and sizing of your original artwork.
• Preferred fonts: Arial (or Helvetica), Times New Roman (or Times), Symbol, Courier.
• Number the illustrations according to their sequence in the text.
• Use a logical naming convention for your artwork files.
• Indicate per figure if it is a single, 1.5 or 2-column fitting image.
• For Word submissions only, you may still provide figures and their captions, and
tables within a single file at the revision stage.
• Please note that individual figure files larger than 10 MB must be provided in separate
source files.
A detailed guide on electronic artwork is available on our website:
http://www.elsevier.com/artworkinstructions.
You are urged to visit this site; some excerpts from the detailed information are
given here.
164
Formats
Regardless of the application used, when your electronic artwork is finalized, please
'save as' or convert the images to one of the following formats (note the resolution
requirements for line drawings, halftones, and line/halftone combinations given below):
EPS (or PDF): Vector drawings. Embed the font or save the text as 'graphics'.
TIFF (or JPG): Color or grayscale photographs (halftones): always use a minimum of
300 dpi.
TIFF (or JPG): Bitmapped line drawings: use a minimum of 1000 dpi.
TIFF (or JPG): Combinations bitmapped line/half-tone (color or grayscale): a minimum
of 500 dpi is required.
Please do not:
• Supply files that are optimized for screen use (e.g., GIF, BMP, PICT, WPG); the
resolution is too low
• Supply files that are too low in resolution.
• Submit graphics that are disproportionately large for the content.
Color artwork
Please make sure that artwork files are in an acceptable format (TIFF (or JPEG), EPS
(or PDF), or MS Office files) and with the correct resolution. If, together with your
accepted article, you submit usable color figures then Elsevier will ensure, at no
additional charge, that these figures will appear in color on the Web (e.g., ScienceDirect
and other sites) regardless of whether or not these illustrations are reproduced in color in
the printed version. For color reproduction in print, you will receive information
regarding the costs from Elsevier after receipt of your accepted article. Please
indicate your preference for color: in print or on the Web only. For further information
on the preparation of electronic artwork, please
see http://www.elsevier.com/artworkinstructions.
Please note: Because of technical complications that can arise by converting color
figures to 'gray scale' (for the printed version should you not opt for color in print)
please submit in addition usable black and white versions of all the color illustrations.
Figure captions
Ensure that each illustration has a caption. A caption should comprise a brief title
(not on the figure itself) and a description of the illustration. Keep text in the
illustrations themselves to a minimum but explain all symbols and abbreviations used.
Tables
Number tables consecutively in accordance with their appearance in the text. Place
footnotes to tables below the table body and indicate them with superscript lowercase
letters. Avoid vertical rules. Be sparing in the use of tables and ensure that the data
presented in tables do not duplicate results described elsewhere in the article.
References
Citation in text
Please ensure that every reference cited in the text is also present in the reference list
(and vice versa). Any references cited in the abstract must be given in full. Unpublished
results and personal communications are not recommended in the reference list, but may
be mentioned in the text. If these references are included in the reference list they

165
should follow the standard reference style of the journal and should include a
substitution of the publication date with either 'Unpublished results' or 'Personal
communication'. Citation of a reference as 'in press' implies that the item has been
accepted for publication.
Reference links
Increased discoverability of research and high quality peer review are ensured by online
links to the sources cited. In order to allow us to create links to abstracting and indexing
services, such as Scopus, CrossRef and PubMed, please ensure that data provided in the
references are correct. Please note that incorrect surnames, journal/book titles,
publication year and pagination may prevent link creation. When copying references,
please be careful as they may already contain errors. Use of the DOI is encouraged.
Web references
As a minimum, the full URL should be given and the date when the reference was last
accessed. Any further information, if known (DOI, author names, dates, reference to a
source publication, etc.), should also be given. Web references can be listed separately
(e.g., after the reference list) under a different heading if desired, or can be included in
the reference list.
References in a special issue
Please ensure that the words 'this issue' are added to any references in the list (and any
citations in the text) to other articles in the same Special Issue.
Reference management software
This journal has standard templates available in key reference management packages
EndNote (http://www.endnote.com/support/enstyles.asp) and Reference Manager
(http://refman.com/support/rmstyles.asp). Using plug-ins to wordprocessing packages,
authors only need to select the appropriate journal template when preparing their article
and the list of references and citations to these will be formatted according to the journal
style which is described below.
Reference formatting
There are no strict requirements on reference formatting at submission. References can
be in any style or format as long as the style is consistent. Where applicable, author(s)
name(s), journal title/book title, chapter title/article title, year of publication, volume
number/book chapter and the pagination must be present. Use of DOI is highly
encouraged. The reference style used by the journal will be applied to the accepted
article by Elsevier at the proof stage. Note that missing data will be highlighted at proof
stage for the author to correct. If you do wish to format the references yourself they
should be arranged according to the following examples:
Reference style
Text: All citations in the text should refer to:
1. Single author: the author's name (without initials, unless there is ambiguity) and the
year of publication;
2. Two authors: both authors' names and the year of publication;
3. Three or more authors: first author's name followed by 'et al.' and the year of
publication.
166
Citations may be made directly (or parenthetically). Groups of references should be
listed first alphabetically, then chronologically.
Examples: 'as demonstrated (Allan, 2000a, 2000b, 1999; Allan and Jones, 1999).
Kramer et al. (2010) have recently shown ....'
List: References should be arranged first alphabetically and then further sorted
chronologically if necessary. More than one reference from the same author(s) in the
same year must be identified by the letters 'a', 'b', 'c', etc., placed after the year of
publication.
Examples:
Reference to a journal publication:
Van der Geer, J., Hanraads, J.A.J., Lupton, R.A., 2010. The art of writing a scientific
article. J. Sci. Commun. 163, 51–59.
Reference to a book:
Strunk Jr., W., White, E.B., 2000. The Elements of Style, fourth ed. Longman, New
York.
Reference to a chapter in an edited book:
Mettam, G.R., Adams, L.B., 2009. How to prepare an electronic version of your article,
in: Jones, B.S., Smith , R.Z. (Eds.), Introduction to the Electronic Age. E-Publishing
Inc., New York, pp. 281–304.
Journal abbreviations source
Journal names should be abbreviated according to the List of Title Word
Abbreviations:http://www.issn.org/services/online-services/access-to-the-ltwa/.
Video data
Elsevier accepts video material and animation sequences to support and enhance your
scientific research. Authors who have video or animation files that they wish to submit
with their article are strongly encouraged to include links to these within the body of the
article. This can be done in the same way as a figure or table by referring to the video or
animation content and noting in the body text where it should be placed. All submitted
files should be properly labeled so that they directly relate to the video file's content. In
order to ensure that your video or animation material is directly usable, please provide
the files in one of our recommended file formats with a preferred maximum size of 50
MB. Video and animation files supplied will be published online in the electronic
version of your article in Elsevier Web products, including
ScienceDirect: http://www.sciencedirect.com. Please supply 'stills' with your files: you
can choose any frame from the video or animation or make a separate image. These will
be used instead of standard icons and will personalize the link to your video data. For
more detailed instructions please visit our video instruction pages
at http://www.elsevier.com/artworkinstructions. Note: since video and animation cannot
be embedded in the print version of the journal, please provide text for both the
electronic and the print version for the portions of the article that refer to this content.
Audio Slides
The journal encourages authors to create an AudioSlides presentation with their
published article. AudioSlides are brief, webinar-style presentations that are shown next
to the online article on ScienceDirect. This gives authors the opportunity to summarize
their research in their own words and to help readers understand what the paper is about.

167
More information and examples are available at http://www.elsevier.com/audioslides.
Authors of this journal will automatically receive an invitation e-mail to create an
AudioSlides presentation after acceptance of their paper.
Supplementary data
Elsevier accepts electronic supplementary material to support and enhance your
scientific research. Supplementary files offer the author additional possibilities to
publish supporting applications, high-resolution images, background datasets, sound
clips and more. Supplementary files supplied will be published online alongside the
electronic version of your article in Elsevier Web products, including
ScienceDirect: http://www.sciencedirect.com. In order to ensure that your submitted
material is directly usable, please provide the data in one of our recommended file
formats. Authors should submit the material in electronic format together with the
article and supply a concise and descriptive caption for each file. For more detailed
instructions please visit our artwork instruction pages at
http://www.elsevier.com/artworkinstructions.
Data at PANGAEA
Electronic archiving of supplementary data enables readers to replicate, verify and build
upon the conclusions published in your paper. We recommend that data should be
deposited in the data library PANGAEA (http://www.pangaea.de). Data are quality
controlled and archived by an editor in standard machine-readable formats and are
available via Open Access. After processing, the author receives an identifier (DOI)
linking to the supplements for checking. As your data sets will be citable you might
want to refer to them in your article. In any case, data supplements and the article will
be automatically linked as in the following example: doi:10.1016/0016-7037(95)00105-
9. Please use PANGAEA's web interface to submit your data
(http://www.pangaea.de/submit/).
Google Maps and KML files
KML (Keyhole Markup Language) files (optional): You can enrich your online articles
by providing KML or KMZ files which will be visualized using Google maps. The
KML or KMZ files can be uploaded in our online submission system. KML is an XML
schema for expressing geographic annotation and visualization within Internet-based
Earth browsers. Elsevier will generate Google Maps from the submitted KML files and
include these in the article when published online. Submitted KML files will also be
available for downloading from your online article on ScienceDirect. For more
information see http://www.elsevier.com/googlemaps.
Interactive plots
This journal encourages you to include data and quantitative results as interactive plots
with your publication. To make use of this feature, please include your data as a CSV
(comma-separated values) file when you submit your manuscript. Please refer
to http://www.elsevier.com/interactiveplots for further details and formatting
instructions.
Submission checklist
The following list will be useful during the final checking of an article prior to sending
it to the journal for review. Please consult this Guide for Authors for further details of
any item.

168
Ensure that the following items are present:
One author has been designated as the corresponding author with contact details:
• E-mail address
• Full postal address
• Telephone
All necessary files have been uploaded, and contain:
• Keywords
• All figure captions
• All tables (including title, description, footnotes)
Further considerations
• Manuscript has been 'spell-checked' and 'grammar-checked'
• All references mentioned in the Reference list are cited in the text, and vice versa
• Permission has been obtained for use of copyrighted material from other sources
(including the Web)
• Color figures are clearly marked as being intended for color reproduction on the Web
(free of charge) and in print, or to be reproduced in color on the Web (free of charge)
and in black-and-white in print
• If only color on the Web is required, black-and-white versions of the figures are also
supplied for printing purposes
For any further information please visit our customer support site
at http://support.elsevier.com.