Embed Size (px)
Citation preview
UNIVERSIDADE FEDERAL DE GOIÁS
PRÓ-REITORIA DE PESQUISA E PÓS-GRADUAÇÃO
INSTITUTO DE CIÊNCIAS BIOLÓGICAS
PROGRAMA DE PÓS-GRADUAÇÃO EM ECOLOGIA E EVOLUÇÃO
Leandro Maracahipes dos Santos
ESTRATÉGIAS ECOLÓGICAS DE PLANTAS EM
FLORESTAS ESTACIONAIS E SAVANAS DO CERRADO
Orientador: Dr. Marcus Vinicius Cianciaruso
Coorientador: Dr. Marcos Bergmann Carlucci
GOIÂNIA - GO
ABRIL – 2017

UNIVERSIDADE FEDERAL DE GOIÁS
PRÓ-REITORIA DE PESQUISA E PÓS-GRADUAÇÃO
INSTITUTO DE CIÊNCIAS BIOLÓGICAS
PROGRAMA DE PÓS-GRADUAÇÃO EM ECOLOGIA E EVOLUÇÃO
Leandro Maracahipes dos Santos
ESTRATÉGIAS ECOLÓGICAS DE PLANTAS EM
FLORESTAS ESTACIONAIS E SAVANAS DO CERRADO
Orientador: Dr. Marcus Vinicius Cianciaruso
Coorientador: Dr. Marcos Bergmann Carlucci
Tese apresentada à Universidade Federal de
Goiás, como parte das exigências do
Programa de Pós-graduação em Ecologia e
Evolução para obtenção do título de doutor
em Ecologia e Evolução.
GOIÂNIA - GO
ABRIL – 2017

ii
iii

iv

v
Aos meus pais, Luiz, e Helena
pelo amparo e incentivo

vi
Agradecimentos
Agradeço à Universidade Federal de Goiás através do Programa de Pós-
Graduação em Ecologia e Evolução pelo suporte estrutural e de aprendizado
disponibilizado para a formação dos discentes.
Agradeço à Capes pela concessão de bolsa de estudo durantes estes quatro anos
de doutoramento. Bem como ao CNPq e Fapeg que financiaram o desenvolvimento
deste projeto de pesquisa.
Ao prestativo orientador Marcus Cianciaruso pelo grande apoio e suporte para
desenvolvimento deste trabalho, e principalmente pela correções, sugestões, paciência e
dedicação de tempo para discutir a direção de cada trabalho. Também, gostaria de
agradecer a excelente co-orientação que obtive por parte do Marcos Carlucci, pelas
sugestões e correções que certamente enriqueceram o trabalho.
Ao corpo docente do programa que direta ou indiretamente contribuíram para
com a minha formação através de disciplinas cursadas, palestras, cursos e conversas
específicas. Estendo meus agradecimentos também ao corpo discente que contribuíram
bastante com minha formação durante o processo de doutoramento, por meio de
palestras e defesas assistidas, e principalmente discussões individuais diversos temas,
bem como temas relacionadas ao meu projeto de pesquisa. Especialmente aos colegas
Fernando Sobral, Walter Araújo, Leonardo Bergamini, Advaldo Neto e Claudinei (San).
À todos os amigos e colegas que auxiliaram durante a realização das coletas de
dados, com excelente trabalho e elevada contribuição para a construção da base de
dados que resultou no desenvolvimento desta tese: Edmar Oliveira, Leonardo
Maracahipes, Letícia Gomes, Livia Laureto, Danira Padilha, Mônica Forsthofer,
Mariângela Abreu, Josias Santos e Fernando Ribeiro. Agradeço também aos
taxonomistas Geraldo Franco, Osnir Aguiar, João Baitelo, Natália Ivanauskas e Renato
Mello-Silva pela identificação de algumas espécies.
Agradeço à todas as pessoas do antigo (especialmente Priscila, Geisiane e
Nathália) e do atual laboratório de comunidades, especialmente ao Fernando, Ana,
Cibele, Daniel, Fábio, Fabiane, Francielle, Gabriela, Jaqueline, J. Hidasi, Joyce, Livia,
Ingrid, Nubia, Paula, Paulo, Rhayane e Verônica, com os quais compartilhei muitos
momentos de alegria, aprendizado, trabalho e especialmente amizade.

vii
Aos queridos “Pragas”, vocês são demais e foram ótimos os momentos que
passamos juntos durante boa parte deste doutorado. À “praga mor” Vanessa, Karina,
Renata e Letícia, e aos brothers Paulinho, Thiago e L. Brasil.
Ao Leandro Juen pela indicação em 2011 para uma bolsa de pesquisa dentro de
um projeto, que se tornou meu projeto de tese. Muito obrigado pela indicação, confiança
e amizade adquirida.
Ao pessoal do “futebol de quinta”, que apesar do sugestivo nome jogam um
futebol de primeira qualidade. Sentirei muita falta destes dias, e claro vocês terão que
conseguir um outro “camisa 10” para o time.
À minha família, meus pais, Luiz Maracahipes e Helena Maria, e irmãos e
cunhada, Leonardo, Eliabe e Ângela. E aos sobrinhos, Daniel e Davi, que com os quais
convivi pouco em razão da distância, mas que sempre se fizeram presentes em minha
vida. Obrigado família, e Parabéns, meus pais por sempre incentivarem e investirem na
educação de todos os seus filhos.
viii
Sumário
Resumo .....................................................................................................1
Introdução geral ......................................................................................3
Capítulo I
Plant ecological strategies in seasonal forests and savannas species ……16
Capítulo II
Edaphic properties drive functional trait patterns in savannas and seasonal
forests plant communities of the Cerrado ……………………………...…53
Capítulo III
Insect herbivore damage is not related with host plant ecological and
evolutionary distances ……………………………………………………95
Conclusão geral .......................................................................................122
1
Resumo – A adoção de diferentes estratégias ecológicas é um fator importante para
determinar o estabelecimento e a persistência de espécies em comunidades locais. De
maneira geral, o cerrado é caracterizado por uma alta frequência de fogo e solos pobres
em nutrientes. Geralmente em condições de baixa fertilidade e alta frequência de fogo
as espécies filtradas tendem a possuir características que representam adaptações a estes
estresses ambientais. Considerando que as espécies de Cerrado se desenvolvem sob a
atuação destes filtros ambientais, nosso objetivo foi avaliar como a adoção de diferentes
estratégias ecológicas podem determinar a performance dos atributos funcionais, a
estrutura das comunidades e a relação entre uma planta focal e sua vizinhança. Neste
trabalho de tese, que está dividido em três capítulos, nós utilizamos três diferentes
escalas para avaliar como estratégias ecológicas das espécies podem determinar seu
desempenho e estabelecimento em comunidades locais. No primeiro capítulo que está
baseado em uma escala de habitat, nós avaliamos como as estratégias ecológicas de
espécies generalistas e especialistas de floresta estacional e cerrado sentido restrito são
fundamentais para o estabelecimento e a persistência das espécies nestes habitats com
diferenças marcantes em relação à frequência de fogo e disponibilidade de nutrientes.
Neste capítulo, nós discutimos que as diferentes estratégias adotadas pelas espécies
estão de acordo com os fatores limitantes da ocorrência de espécies em cada um destes
ambientes. No segundo capítulo, que está baseado em escala de comunidades, nós
buscamos compreender como os gradientes ambientais podem determinar diferentes
estratégias ecológicas relacionadas aos atributos funcionais e a densidade de espécies.
Nós demonstramos que as mudanças nos valores de atributos e densidade de espécies
foram mais claras no gradiente de fertilidade do que toxicidade, e que comunidades de
floresta estacional foram mais sensíveis a mudanças do que comunidades de cerrado
sentido restrito em ambos os gradientes. Nós observamos também que espécies com

2
atributos conservativos foram associados à solos pobres e espécies com atributos
aquisitivos associado à solos mais férteis. Já no terceiro capítulo, que foi desenvolvido
na escala de indivíduo, nós discutimos se as características e relação filogenética das
plantas vizinhas influenciam o dano foliar em árvores e arbustos do cerrado. Neste
capítulo, demonstramos que a distância ecológica e evolutiva entre plantas individuais e
as plantas vizinhas não determina o nível de consumo foliar por herbívoros. Nós
discutimos que a dominância de herbívoros generalistas, a co-evolução entre plantas e
herbívoros especialistas, e o consumo preferencial de folhas jovens podem ser mais
importante para determinar o nível de dano foliar do que o contexto de vizinhança em
que uma dada planta está inserida.
Palavras-chave: preferência de habitats, plasticidade fenotípica, gradiente edáfico,
estratégia aquisitiva e conservativa, dano foliar, distâncias ecológicas e evolutivas,
contexto de vizinhança

3
Introdução Geral
A diversidade do reino vegetal vem fascinando o homem há muito tempo, desde
os celebres naturalistas aos renomados ecólogos contemporâneos, proponentes de
teorias que buscam compreender quais são os mecanismos estruturadores da riqueza e
composição de espécies. A teoria do nicho e todos os seus princípios tem sido aquela
mais frequentemente testada ao longo do desenvolvimento da ecologia, essencialmente
no que diz respeito às interações competitivas entre espécies e à atuação de filtros
ambientais (tais como fogo em savanas do Cerrado). Assim, em função da atuação de
filtros ambientes, a adoção de diferentes estratégias ecológicas é um fator importante
para determinar o estabelecimento e a persistência de espécies, bem como os valores
dos atributos funcionais das espécies capazes de se estabelecer em uma comunidade
local.
Breve histórico
Comunidade ecológica é definida como um grupo de espécies que co-ocorre em
um dado tempo e lugar (McGill et al. 2006). Entender os padrões e os mecanismos
reguladores da composição e diversidade das comunidades naturais é um dos principais
objetivos da ciência ecológica. Já nos séculos XVIII e XIX, os trabalhos dos naturalistas
Alexander von Humboldt e Eugenius Warming buscaram compreender a relação entre
plantas, animais e clima, bem como inferir os padrões de diversidade de cada localidade
(Hawkins 2001). Os trabalhos de Warming e Humboldt influenciaram notáveis
naturalistas do passado, tais como Karl Philipp von Martius, Alfred Wallace e Charles
Darwin. Neste sentido, em “A origem das espécies” Darwin postula que indivíduos com
alto grau de parentesco tendem a apresentar fortes relações competitivas, introduzindo o
4
conceito de “competição ecológica” como um dos principais mecanismos reguladores
da diversidade e composição de comunidades naturais (Mayfield & Levine 2010).
Na década de 20 e 30, Vito Volterra, Alfred Lotka e Georgii Gause avançaram
no entendimento dos mecanismos reguladores da riqueza e composição de espécies ao
propor o conceito de nicho ecológico. Estes autores postularam o “princípio da exclusão
competitiva” ao afirmarem que duas espécies competindo pelo mesmo recurso não
podem coexistir ao longo do tempo em uma mesma comunidade (Volterra 1926; Lotka
1932; Gause 1934). Em meados do século XX, George Hutchinson redefiniu nicho
ecológico como um espaço multidimensional composto pelos requerimentos bióticos e
abióticos necessários à sobrevivência e reprodução das espécies (Hutchinson 1957). Na
década de 60, Robert MacArthur e Edward O. Wilson formularam a “teoria do
equilíbrio da biogeografia de ilhas”, a qual exerceu um papel primordial no
desenvolvimento do “princípio da partição de nicho”. Na mesma década, MacArthur e
Levins formularam a hipótese da similaridade limitante (MacArthur & Levins 1967),
que prevê um limite máximo de semelhança morfológica para duas espécies coexistirem
numa mesma comunidade. Em hipótese, a coexistência de duas ou mais espécies com
diferentes características morfológicas seria possibilitada pela exploração de recursos
distintos, resultando numa baixa sobreposição de nicho entre essas espécies.
Atualmente, os cientistas buscam compreender como os diferentes mecanismos
reguladores da diversidade e composição de espécies atuam nas diferentes escalas
espaciais. Neste sentido, se destacam os trabalhos de David Tilman e Peter Chesson
(Tilman 1982, 1990, Chesson 2000), os quais buscam entender como atuam os
principais mecanismos reguladores da composição e diversidade de espécies. Mais
recentemente, uma nova abordagem baseada na “teoria de biogeografia de ilhas”,
denominada “Teoria Neutra da Biodiversidade”, tem sido utilizada para explicar os

5
padrões de diversidade e composição de espécies nos mais variados grupos de
organismos (Hubbell 2001). A teoria neutra assume que as espécies dentro de uma
comunidade são ecologicamente equivalentes e que as extinções são balanceadas pelas
especiações, e por processos estocásticos de nascimento e imigração.
Teoria de Nicho
A teoria de nicho teve suas bases lançadas por Eugenius Warming ao observar
que as plantas possuíam diferentes habilidades fisiológicas e que algumas espécies eram
capazes de se estabelecer em determinados locais e incapazes de obter o mesmo sucesso
em outros locais (Cavender-Bares et al. 2009). Partindo destas observações, Grinell e
Elton foram os primeiros ecólogos a desenvolverem o conceito de nicho ecológico de
espécie (Grinnell 1917; Elton 1927). Posteriormente, Hutchinson redefiniu o conceito
de nicho (Hutchinson 1957), assumindo que espécies com elevada similaridade
ecológica não poderiam coexistir, assim criou-se um paradigma onde processos
evolutivos não possuíam qualquer influência na estruturação das comunidades
(Cavender-Bares et al. 2009). No entanto, atualmente diversos estudos vêm
demostrando à relevância da história evolutiva e das interações interespecíficas como
processos fundamentais para compreender a coexistência das espécies (Webb et al.
2002; Cahill et al. 2008; Cavender-Bares et al. 2009; Vamosi et al. 2009; Mayfield &
Levine 2010).
A teoria do nicho Hutchinsoniano basicamente é constituída de um conjunto de
condições (abióticas - também chamado de nicho Grinnelliano) e de recursos (bióticos -
nicho Eltoniano) que determinam a capacidade de uma espécie em se estabelecer e
manter populações viáveis ao longo do tempo (Hutchinson 1957; Soberón 2007). A
premissa básica desta teoria encontra-se fundamentada no Princípio da Exclusão

6
Competitiva proposto por Gause (Gause 1934). Dentro da teoria do nicho, a atuação de
filtros ambientais também pode ser um importante processo regulador do nicho das
espécies (Gómez et al. 2010). O filtro ambiental determina quais espécies são aptas a se
estabelecer em cada local, e é provável que atue sobre escalas espaciais maiores (escala
regional), o que resultaria na seleção de espécies mais semelhantes em atributos (Gómez
et al. 2010; Sobral & Cianciaruso 2012). Enquanto que, após a seleção de determinado
conjunto de espécies pelo filtro ambiental, em escala local a similaridade limitante entre
as espécies é quem irá atuar e determinar quais espécies deverão coexistir (Gómez et al.
2010; Sobral & Cianciaruso 2012).
Entretanto, dentro da teoria de nicho outros processos importantes são a
sobreposição e a diferenciação dos nichos (Gilbert 2012). Quando espécies possuem
elevado grau de sobreposição de nicho (ou seja, alto compartilhamento de consumo de
recursos) isso resulta em fortes interações competitivas que muitas vezes podem levar a
exclusão competitiva, ou forçar as espécies a explorarem diferentes recursos
(diferenciação de nicho) (Webb et al. 2002). A diferenciação de nicho pode ainda levar
ao deslocamento de caracteres, caracterizado por uma alta similaridade morfológica
quando duas espécies são distribuídas alopatricamente, mas há uma diferenciação em
uma ou mais dessas características quando ocorrem simpatricamente (Connell 1980;
Schmidt et al. 2000). Outra possibilidade é a divisão do recurso disponível entre os
competidores (partição de nicho), que consiste em cada competidor ocupar uma porção
do recurso disponível, evitando a competição e consequente exclusão de um dos
competidores (Webb et al. 2002).

7
Estratégias ecológicas de plantas
Em ecologia funcional, diversos atributos funcionais têm sido utilizados para
compreender a estruturação e a funcionalidade das comunidades naturais (atributos
foliares, da madeira e regenerativos). Dentre estes, o sistema LHS (leaf-height-seed;
folha-altura-semente) descreve o nicho funcional das plantas, usando estes três eixos
fundamentais e independentes, resumindo todas as principais dimensões de variação na
estrutura e funcionamento (Westoby 1998). A representação deste sistema, que consiste
em um modelo de classificação tridimensional, é importante por representar demandas
conflitantes fundamentais controlando as estratégias vegetais e pelo fato de que cada
uma dessas características se correlaciona com outros atributos relevantes (Westoby
1998; Laughlin et al. 2010). A área foliar específica é o principal atributo envolvendo o
espectro econômico foliar (Wright et al. 2004) e representa a demanda conflitante entre
aquisição e a estratégia no uso de recurso pelas plantas. A altura máxima da planta
indica a habilidade competitiva da planta por luz e, portanto, sua estratégia de
assimilação de carbono (Westoby et al. 2002). Enquanto que a massa da semente indica
a estratégia de regeneração das espécies por meio da demanda conflitante entre massa
da semente, habilidade de dispersão e estabelecimento de plântulas (Westoby et al.
2002). O sistema LHS vem sendo testado em diversos ambientes e demonstrando ser
capaz de prever a funcionalidade das comunidades (Lavergne, Garnier & Debussche
2003; Carly, Marcelo & Jaime 2009).
Em ambientes florestais, em que o acesso à luz é um fator limitante, o
investimento de árvores em crescimento vertical é vantajoso, pois árvores que
apresentam alturas maiores do que seus vizinhos possuem maior vantagem competitiva
devido ao melhor acesso à luz. Ainda, a altura em que as flores e sementes são
produzidas também pode influenciar o sucesso reprodutivo dos indivíduos, bem como a

8
dispersão de sementes (Garnier & Navas 2012), uma vez que a altura da árvore possui
uma relação positiva com a distância em que as sementes são dispersas. Por outro lado,
plantas que produzem poucas sementes grandes são caracterizadas como espécies com
alta habilidade competitiva, enquanto que espécies que produzem elevado número de
pequenas sementes são vistas como espécies pioneiras devido à sua alta capacidade de
dispersão (Garnier & Navas 2012). Outro importante mecanismo utilizado por plantas é
o sistema de rebrota. Diversas plantas do Cerrado apresentam esta característica de
resiliência, que permite com que o indivíduo possa rebrotar após um distúrbio (como
fogo) a partir de estruturas basais ou subterrâneas (Medeiros & Miranda 2005).
Fogo, consumo foliar e propriedades do solo no Cerrado
O Cerrado é composto por um complexo mosaico vegetacional, com a
ocorrência de vários tipos de vegetação (Eiten 1972), variando de savanas abertas a
florestas de galeria, florestas secas e semideciduais. Muitas das espécies são capazes de
se estabelecer em diferentes fisionomias (Ratnam et al. 2011; Hoffmann et al. 2012).
No entanto, estratégias relacionadas principalmente a proteção contra o fogo (grande
espessura da casca) podem ser cruciais para determinar o estabelecimento e
permanência de espécies nos diferentes ambientes savânicos do Cerrado. Além disso,
estratégias relacionadas a proteção contra herbívoros (folhas grossas, espinhos e
tricomas) e perda de água (folhas grossas, e fechamento de estômatos e esporos) (Silva
& Batalha 2011; Dantas, Batalha & Pausas 2013a).
Uma vez que os processos de dispersão e eventos estocásticos determinam o
banco regional de espécies, este é composto pelo conjunto de espécies que possuem
agentes dispersores que as tornem capazes de chegar a uma área (Lortie et al. 2004),
possibilitando que um conjunto de espécies melhor adaptado as condições locais seja

9
selecionado a partir do banco regional de espécies. Inicialmente, em maior escala
poderá ser filtrado um conjunto de espécies com atributos funcionais mais similares
(por exemplo, pelo clima), e posteriormente por fatores ambientais em menores escalas
(por exemplo, características edáficas) e, por último as interações bióticas entre as
espécies (tais como relação entre planta-planta e planta-herbívoros) irão determinar a
abundância relativa e quais espécies poderão estabelecer e persistir em cada
comunidade local (Cain, Milligran & Strand 2000; Dufour et al. 2006; Lessard et al.
2012; Bello et al. 2013).
O fogo é um dos principais fatores estruturadores de comunidades vegetais no
cerrado (Hoffmann et al. 2012; Dantas et al. 2013b, 2016). Os focos de incêndio no
cerrado ocorrem com elevada frequência e intensidade, principalmente em localidades
em que ocorre grande acumulo de biomassa durante alguns anos sem fogo. No Cerrado,
áreas de savanas possuem grande abundância de gramíneas, com arbustos e árvores
coexistindo sobre a camada de herbácea. No momento da passagem do fogo as
gramíneas atuam como uma grande fonte de combustível, promovendo um maior
avanço do fogo em áreas com maior quantidade (Dantas et al. 2013a). Enquanto que,
em áreas florestais a maior umidade relativa e a baixa quantidade de gramíneas
dificultam a propagação do fogo nestes ambientes (Hoffmann et al. 2012).
O fogo atua como um filtro selecionando espécies com caraterísticas que
confiram resistência contra os efeitos das queimadas ou que possuem estruturas de
reserva que permita rebrotar após a passagem do fogo (Dantas et al. 2013a; Pausas,
Keeley & Schwilk 2016). As espécies evoluíram com a presença constante de fogo,
sendo assim diversas adaptações de resistência e resiliência ao fogo foram
desenvolvidas ao longo do tempo evolutivo (Simon et al. 2009; Pausas et al. 2016). A
espessura da casca é um dos principais atributos de resistência ao fogo em plantas

10
(Rosell et al. 2014). Hoffmann et al. (2012) propuseram um limiar de que espécies com
espessura de casca superior à 5,9 mm tem alta probabilidade resistir a queimadas de
baixa intensidade. Muitas das espécies exclusivas de savanas possuem espessura de
casca igual ou superior a este limiar, no entanto espécies com habito florestal que
ocorrem em áreas de savanas não possuem tais características, e muitas vezes são
excluídas das comunidades locais após a passagem do fogo.
Considerando que habitats de florestas estacionais e savanas são contrastantes, e
que ocorrem lado a lado em paisagens de Cerrado. Isto torna possível encontrar espécies
com ocorrência em ambos habitats ou com ocorrência restrita à somente um destes
habitas (floresta estacional ou savana). Sendo assim, avaliar como diferentes
estratégicas ecológicas de espécies generalistas e especialistas de florestas estacional e
cerrado sentido restrito é fundamental para compreender o estabelecimento e a
persistência de espécies nestes habitats com diferenças marcantes em relação à
frequência de fogo e disponibilidade de nutrientes. Nesse primeiro capítulo, nós
discutimos como as diferentes estratégias adotadas pelas espécies estão de acordo com
os fatores limitantes da ocorrência de espécies em cada um destes ambientes.
De maneira geral, os solos do cerrado são pobres em nutrientes e bem drenados
(Furley & Ratter 1988). Desta forma, para que a coexistência de espécies torne-se
possível, frequentemente as espécies adotam diferentes estratégias relacionadas ao
crescimento e reprodução (Oliveras & Malhi 2016), que podem resultar em estratégias
de rápida aquisição ou conservação de recursos. As propriedades edáficas influenciam
fortemente a estrutura de comunidade de plantas. Assim, visto que mudanças ao longo
de gradientes ambientais são capazes de alterar a composição funcional das
comunidades, nós buscamos compreender neste segundo capítulo como o gradiente de
fertilidade e toxicidade do solo dentro de cada um dos habitats (floresta estacional e

11
savana) podem determinar a performance dos atributos funcionais e densidade de
espécies. Logo, nós fomos hábeis em discutir se espécies com atributos conservativos
foram associados à solos pobres e espécies com atributos aquisitivos associado à solos
mais férteis.
Estas condições de baixa fertilidade dos em solos savanas e a alta frequência de
fogo, fazem com que as espécies filtradas tenham características adaptativas à estresse
ambiental, que também estão relacionadas a proteção contra o ataque por herbívoros. As
plantas de savanas desenvolveram diversas estratégias que inibe ou acaba por reduzir o
efeito dos herbívoros sobre as plantas (Silva & Batalha 2011). Entretanto, o nível de
consumo foliar por herbívoros varia muitas entre as plantas coexistentes em um dado
local. Diversos fatores podem explicar esta variação, aqui neste Capítulo 3 nós
buscamos compreender se as características das plantas vizinhas poderiam determinar a
taxa de consumo foliar de um indivíduo focal. Desta forma, nós buscamos entender
como a distância ecológica e evolutiva entre uma planta individual e suas plantas
vizinhas podem mediar a nível de consumo foliar.
Em suma, nesta tese nós usamos três diferentes escalas para avaliar como
estratégias ecológicas de plantas podem determinar a performance dos atributos
funcionais, a estrutura das comunidades e a relação entre uma planta focal e sua
vizinhança. O Capítulo 1 está baseado em uma escala de habitat e busca compreender
como a preferência de habitat pode determinar a performance dos atributos funcionais
em diferentes habitats. Já o Capítulo 2 foi analisado em uma escala de comunidades e
busca entender como gradientes ambientais podem determinar diferentes estratégias
ecológicas relacionadas aos atributos funcionais e a densidade de espécies. E por fim, o
Capítulo 3 foi desenvolvido em uma escala de indivíduo e nós buscamos compreender
12
como as características e relação filogenética das plantas vizinhas poderiam influenciar
na taxa de dano foliar de uma planta focal.
Referências
Bello, F. de, Lavorel, S., Lavergne, S., Albert, C.H., Boulangeat, I., Mazel, F. &
Thuiller, W. (2013) Hierarchical effects of environmental filters on the functional
structure of plant communities: a case study in the French Alps. Ecography, 36,
393–402.
Cahill, J.F., Kembel, S.W., Lamb, E.G. & Keddy, P.A. (2008) Does phylogenetic
relatedness influence the strength of competition among vascular plants?
Perspectives in Plant Ecology, Evolution and Systematics, 10, 41–50.
Cain, M.L., Milligran, B.G. & Strand, A.E. (2000) Long-distance seed dispersal in plant
populations. American Journal of Botany, 87, 1217–1227.
Carly, G., Marcelo, S. & Jaime, K. (2009) A community-level test of the leaf-height-
seed ecology strategy scheme in relation to grazing conditions. Journal of
Vegetation Science, 20, 392–402.
Cavender-Bares, J., Kozak, K.H., Fine, P.V.A. & Kembel, S.W. (2009) The merging of
community ecology and phylogenetic biology. Ecology Letters, 12, 693–715.
Chesson, P. (2000) Mechanisms of maintenance of species diversity. Annual Review of
Ecology and Systematics, 31, 343–366.
Connell, J.H. (1980) Diversity and the Coevolution of Competitors, or the Ghost of
Competition Past. Oikos, 35, 131–138.
Dantas, V.L., Batalha, M.A. & Pausas, J.G. (2013a) Fire drives functional thresholds on
the savanna–forest transition. Ecology, 94, 2454–2463.
Dantas, V. de L., Hirota, M., Oliveira, R.S. & Pausas, J.G. (2016) Disturbance
maintains alternative biome states (ed M Rejmanek). Ecology Letters, 19, 12–19.
Dantas, V. de L., Pausas, J.G., Batalha, M.A., Loiola, P. de P. & Cianciaruso, M.V.
(2013b) The role of fire in structuring trait variability in Neotropical savannas.
Oecologia, 171, 487–494.
Dufour, A., Gadallah, F., Wagner, H.H., Guisan, A. & Buttler, A. (2006) Plant species
richness and environmental heterogeneity in a mountain landscape: Effects of
variability and spatial configuration. Ecography, 29, 573–584.

13
Eiten, G. (1972) The cerrado vegetation of Brazil. Botanical Reviews, 38, 201–341.
Elton, C. (1927) Animal Ecology (ed JS Huxley). Macmillan Co., New York.
Furley, P.A. & Ratter, J.A. (1988) Soil resources and plant communities of the central
Brazilian Cerrado and their development. Journal of Biogeography, 15, 97–108.
Garnier, E. & Navas, M.L. (2012) A trait-based approach to comparative functional
plant ecology: Concepts, methods and applications for agroecology. A review.
Agronomy for Sustainable Development, 32, 365–399.
Gause, G.F. (1934) The Struggle for Existence. Willians and Wilkins, Baltimore.
Gilbert, B. (2012) Joint consequences of dispersal and niche overlap on local diversity
and resource use. Journal of Ecology, 100, 287–296.
Gómez, J.P., Bravo, G.A., Brumfield, R.T., Tello, J.G. & Cadena, C.D. (2010) A
phylogenetic approach to disentangling the role of competition and habitat filtering
in community assembly of Neotropical forest birds. Journal of Animal Ecology,
79, 1181–1192.
Grinnell, J. (1917) The niche-relationships of the California thrasher. Auk, 34, 427–433.
Hawkins, B.A. (2001) Ecology’s oldest pattern? Trends in Ecology & Evolution, 16,
470.
Hoffmann, W. a, Geiger, E.L., Gotsch, S.G., Rossatto, D.R., Silva, L.C.R., Lau, O.L.,
Haridasan, M. & Franco, A.C. (2012) Ecological thresholds at the savanna-forest
boundary: how plant traits, resources and fire govern the distribution of tropical
biomes (ed F Lloret). Ecology Letters, 15, 759–768.
Hubbell, S.P. (2001) A Unified Neutral Theory of Biodiversity and Biogeography.
Princeton University Press, Princeton.
Hutchinson, G.E. (1957) Concluding Remarks. Cold Spring Harbor Symposia on
Quantitative Biology, 22, 415–427.
Laughlin, D.C., Leppert, J.J., Moore, M.M. & Sieg, C.H. (2010) A multi-trait test of the
leaf-height-seed plant strategy scheme with 133 species from a pine forest flora.
Functional Ecology, 24, 493–501.
Lavergne, S., Garnier, E. & Debussche, M. (2003) Do rock endemic and widespread
plant species differ under the Leaf-Height-Seed plant ecology strategy scheme?
Ecology Letters, 6, 398–404.
Lessard, J.P., Belmaker, J., Myers, J.A., Chase, J.M. & Rahbek, C. (2012) Inferring
local ecological processes amid species pool influences. Trends in Ecology and
14
Evolution, 27, 600–607.
Lortie, C.J., Brooker, R.W., Choler, P., Kikvidze, Z., Michalet, R., Pugnaire, F.I. &
Callaway, R.M. (2004) Rethinking plant community theory. Oikos, 107, 433–438.
Lotka, A.J. (1932) The growth of mixed populations: two species competing for a
common food supply. Journal of the Washington Academy of Sciences, 22, 461–
469.
MacArthur, R. & Levins, R. (1967) The limiting similarity, convergence, and
divergence of coexisting species. The American Naturalist, 101, 377–385.
Mayfield, M.M. & Levine, J.M. (2010) Opposing effects of competitive exclusion on
the phylogenetic structure of communities. Ecology Letters, 13, 1085–1093.
McGill, B.J., Enquist, B.J., Weiher, E. & Westoby, M. (2006) Rebuilding community
ecology from functional traits. Trends in ecology & evolution, 21, 178–85.
Medeiros, M.B. De & Miranda, H.S. (2005) Mortalidade pós-fogo em espécies lenhosas
de campo sujo submetido a três queimadas prescritas anuais. Acta Botanica
Brasilica, 19, 493–500.
Oliveras, I. & Malhi, Y. (2016) Many shades of green: the dynamic tropical forest–
savannah transition zones. Philosophical Transactions of the Royal Society B:
Biological Sciences, 371, 20150308.
Pausas, J.G., Keeley, J.E. & Schwilk, D.W. (2016) Flammability as an ecological and
evolutionary driver (ed M Rees). Journal of Ecology.
Ratnam, J., Bond, W.J., Fensham, R.J., Hoffmann, W. a., Archibald, S., Lehmann,
C.E.R., Anderson, M.T., Higgins, S.I. & Sankaran, M. (2011) When is a “forest” a
savanna, and why does it matter? Global Ecology and Biogeography, 20, 653–660.
Rosell, J.A., Gleason, S., Méndez-Alonzo, R., Chang, Y. & Westoby, M. (2014) Bark
functional ecology: evidence for tradeoffs, functional coordination, and
environment producing bark diversity. New Phytologist, 201, 486–497.
Schmidt, K.A., Earnhardt, J.M., Brown, J.S. & Holt, R.D. (2000) Habitat selection
under temporal heterogeneity: Exorcizing the Ghost of Competition Past. Ecology,
81, 2622–2630.
Silva, D.M. da & Batalha, M.A. (2011) Defense syndromes against herbivory in a
cerrado plant community. Plant Ecology, 212, 181–193.
Simon, M.F., Grether, R., de Queiroz, L.P., Skema, C., Pennington, R.T. & Hughes,
C.E. (2009) Recent assembly of the Cerrado, a neotropical plant diversity hotspot,

15
by in situ evolution of adaptations to fire. Proceedings of the National Academy of
Sciences of the United States of America, 106, 20359–64.
Soberón, J. (2007) Grinnellian and Eltonian niches and geographic distributions of
species. Ecology Letters, 10, 1115–1123.
Sobral, F.L. & Cianciaruso, M.V. (2012) Estrutura filogenética e funcional de
assembléias: (re)montando a ecologia de comunidades em diferentes escalas
espaciais. Bioscience Journal, 28, 617–631.
Tilman, D. (1982) Resource Competition and Community Structure. Princeton
University Press, Princeton.
Tilman, D. (1990) Constraints and tradeoffs: toward a predictive theory of competition
and succession. Oikos, 58, 3–15.
Tilman, D. (1993) The maintenance of species richness in plant communities. Species
diversity in ecological communities: historical and geographical perspectives (eds
R.E. Ricklefs & D. Schluter), pp. 13–25. University Chicago Press, Chicago.
Tilman, D. & Pacala, S. (1993) The maintenance of species richness in plant
communities. Species diversity in ecological communities (eds R.E. Ricklefs & D.
Schluter), pp. 13–25. University Chicago Press, Chicago.
Vamosi, S.M., Heard, S.B., Vamosi, J.C. & Webb, C.O. (2009) Emerging patterns in
the comparative analysis of phylogenetic community structure. Molecular Ecology,
18, 572–592.
Volterra, V. (1926) Fluctuations in the abundance of species considered mathematically.
Nature, 118, 558–560.
Webb, C.O., Ackerly, D.D., McPeek, M.A. & Donoghue, M.J. (2002) Phylogenies and
community ecology. Annual Review of Ecology and Systematics, 33, 475–505.
Westoby, M. (1998) A leaf-height-seed (LHS) plant ecology strategy scheme. Plant and
Soil, 199, 213–227.
Westoby, M., Falster, D.S., Moles, A.T., Vesk, P.A. & Wright, I.J. (2002) Plant
ecological strategies: some leading dimensions of variation between species.
Annual Review of Ecology and Systematics, 33, 125–159.
Wright, I.J., Reich, P.B., Westoby, M., Ackerly, D.D., Baruch, Z., Bongers, F.,
Cavender-bares, J., Chapin, T., Cornelissen, J.H.C., Diemer, M., Flexas, J.,
Garnier, E., Groom, P.K. & Gulias, J. (2004) The worldwide leaf economics
spectrum. Nature, 12, 821–827.

16
CAPÍTULO I
Formatado nas normas da revista:
New Phytologist
17
Plant ecological strategies in seasonal forests and savannas species
Leandro Maracahipes1, Marcos B. Carlucci
1,2 and Marcus V. Cianciaruso
1
1Departamento de Ecologia, Instituto de Ciências Biológicas, Universidade Federal de
Goiás, Goiânia, Goiás, CP 131, 74001-970, Brazil.
2Departamento de Botânica, Setor de Ciências Biológicas, Universidade Federal do
Paraná, CP 19031, Curitiba, PR 81531-980, Brazil.
18
Summary
• Seasonal forests and savannas are contrasting habitats that occur side by side in
Neotropical savanna landscapes. Thus, it is possible to either find plant species common
to both forests and savannas (generalists) or exclusive to one of these habitats
(specialists). In this study, we aimed to unravel the ecological strategies that determine
the occurrence of species in forests, savannas or in both habitats.
• We used data on habitat preference of 284 woody species of seasonal forest and
savanna communities in six sites throughout the Brazilian Cerrado. We evaluated the
ecological strategies of generalist and specialist species of forests and savannas using
data on ecological traits at inter- and intraspecific level.
• We found that acquisitive traits were associated to forest habitat (forest specialist and
forest generalist species), while conservative traits were related to savanna habitat
(savanna specialist and savanna generalist species).
• Our results demonstrate how functional traits mediate species habitat preference in
contrasting habitats. The different strategies adopted by species are in accordance with
the limiting factors of species occurrence in each habitat. While acquisitive traits
represent competitive ability and fast resource acquisition for forest-specialist species in
an environment where light is a limiting resource, conservative traits promote resistance
against fire and other environmental stresses for savanna specialists. Furthermore,
phenotypic plasticity appears to underlie the ability of species to persist in the
contrasting habitats of seasonal forests and savannas.
Key words: habitat preference, specialist species, generalist species; functional
diversity; ecological strategies, phenotypic plasticity
19
Introduction
Understanding the role of species traits on how species are sorted across habitats is an
important question in community ecology (Hoffmann et al., 2005, 2012; Ratnam et al.,
2011; Pellegrini et al., 2015; Pellegrini, 2016). Habitats with low soil fertility or hard
access to nutrients by plants low soil fertility [as African savannas (Wigley et al.,
2016)], high elevation [as French Alps, (de Bello et al. (2013)], and high fire frequency
[as Australian savannas (Murphy et al., 2010)] represent habitats with strong
environmental filters to plants (see de Bello et al. (2013) for more details). Thus, plants
with a conservation resource strategy are more likely to occur in such environments
(Wigley et al., 2016; Pellegrini, 2016). On the other hand, in environments with high
resource availability plants with acquisition resource strategy are more likely to prevail
(Pellegrini, 2016).
In savannas, recurrent fires and edaphic properties, such as low soil fertility and
moisture deficits (Murphy & Bowman, 2012; Dantas et al., 2013a,b), should favour
species with conservative strategies (Pausas et al., 2016). Indeed, the predominant
strategies of savanna species are related to protection against fire (e.g., thick bark,
Hoffmann et al., 2009, 2012; Dantas et al., 2013a) and drought (e.g., water storage in
stem and root tissues, thick leaves with trichomes and high leaf carbon-nitrogen ratio,
Scholz et al., 2007; Schymanski et al., 2013; Dantas et al., 2013a). On the other hand,
the predominant strategies of seasonal forest species are related to competition for light
(taller plants, large leaves, and high specific leaf area), nutrient usage (high leaf nutrient
content) and structural vigor (high wood density) (Hoffmann & Franco, 2003; Dantas et
al., 2013a; Pellegrini, 2016). Light is a limiting resource in forest interior, especially
during the phase when tree juveniles grows toward the canopy (Hoffmann & Franco,
2003). These two strategies, rapid acquisition or conservation of resources, can be

20
assessed through trade-offs in functional traits, thereby helping explain why a given
species is able to occur in forests or in savannas (Table 1, Westoby, 1998; Lusk et al.,
2008; Ratnam et al., 2011; Dantas et al., 2013a).
Forest and savanna habitats occur intermingle, distributed as patches across
Neotropical landscapes with savanna predominance. Given this close co-occurrence of
habitats, the regional pool of these savanna-dominated landscapes should have species
with traits that allow them to establish and persist in one of these environments
(Hoffmann et al., 2012; Pausas & Dantas, 2016) or in both of them (Ratnam et al.,
2011; Hoffmann et al., 2012; Pausas & Dantas, 2016). Exclusive forest species are
unable to establish in savanna habitats because they are not adapted to survive to
frequent and intense fires, low soil water availability and low soil fertility (Goodland &
Pollard, 1973; Hoffmann et al., 2003; Dantas et al., 2013a). On the other hand,
exclusive savannas species are unable to establish in forest, especially due to shade
intolerance and little invest in height growth (Hoffmann & Franco, 2003; Poorter, 2009;
Rossatto et al., 2013; Silva et al., 2013). Thus, the establishment of forest species in
savanna habitats require long intervals without fire, while disturbance and edge effects,
like those caused by fire, may enable the persistence of savanna species in forest
habitats (Hoffmann & Franco, 2003).
The boundary between forest and savanna is normally abrupt (Hoffmann et al.,
2003; Rossatto et al., 2009) and few species are able to occur in both habitats
(Hoffmann et al., 2009, 2012). The capacity of some species occur in both habitats can
be related to plastic responses of species to different biotic and abiotic factors (Turcotte
& Levine, 2016), or because they have strategies that permit colonizing different habitat
types (Hoffmann et al., 2012; Silva et al., 2013; Bowman et al., 2015). The ability of
species to exhibit different strategies according to the conditions imposed by the

21
environment is defined as phenotypic plasticity (Miner et al., 2005). Phenotypic
plasticity plays a fundamental role on species interactions and coexistence (Violle et al.,
2012; Cianciaruso et al., 2012). Many plant species are highly plastic and are able to
establish and persist in various environments (Hoffmann et al., 2009, 2012).
Intraspecific variability can determine species persistence in environments with strong
differences to plant establishment, as forest and savannas. We highlight that considering
species habitat preference (habitat generalist versus specialist) and phenotypic plasticity
is a new perspective in the quest to understand the distinct ecological strategies of
species in seasonal forest and savannas. Several studies have sought to identify which
mechanisms determine the species occurrence in forest and savanna habitats (Hoffmann
et al., 2003, 2005; Ratnam et al., 2011; Rossatto et al., 2013; Charles-Dominique et al.,
2015; Pellegrini et al., 2015). However, information about how different ecological
strategies relate to edaphic proprieties and fire disturbance determine the occurrence of
species in forests or savannas is still missing, because the few existing studies evaluated
a low number of species and just a few traits (Hoffmann et al., 2003, 2004, 2005, 2012;
Hao et al., 2008; Rossatto et al., 2009; Ratnam et al., 2011; Silva et al., 2013;
Pellegrini, 2016)
Here we evaluated whether forest-specialist, savanna-specialist and generalist
woody species (i.e., occurring in both seasonal forest and savannas) have distinct
ecological strategies (Table 1). We aimed to answer the following questions: (i) Do trait
values differ between habitat-specialist and habitat-generalist species (i.e. species
restricted to either seasonal forest or savanna, and species common to seasonal forest
and savanna, respectively)? (ii) Do generalist species exhibit intermediate functional
traits values between forest- and savanna-specialist species? (iii) Do the same species
occurring in forests and savannas show different functional traits values in each

22
environment? We hypothesized that savanna-specialist woody species would have trait
values more related to a conservative use of resource whereas forest-specialist woody
species will have functional traits associated to competitive ability and resource
acquisition (Table 1). Generalist species would present intermediate values of functional
traits between forest- and savanna-specialist species. Additionally, using site-specific
data we expect that when a species occurs at both habitats, its traits values will be
plastic and respond to the general strategy of each environment, with acquisitive
strategy in seasonal forest and conservative strategy in savanna.

23
Table 1 Functional significance of traits and basis of trait-based patterns predicted in relation to forest and savanna habitats.
Trait Abbrev
iations Unit Functional significance
Prediction Rationale
Forest Savanna
Bark thickness BT mm Protection of vital tissue against damage, like that caused
by fire 1
Low High Savannas are fire-prone environments and present many species
with fire resistance characteristics
Stem-specific
density
SSD mg mm-3
Resistance to physical damage, and consequent structural
vigor 1,2,3
Medium High Higher wood density in the savanna because stress tolerant plants
have greater construction costs in poor soils, and need protection
from fires or herbivores. Forest species have medium wood density
due to the mixture of species with high wood density (climax
species) and low (pioneer species)
Leaf thickness LT mm Related to species strategies of resource acquisition and
use, and resistance to physical damage. Every time is
correlated with leaf toughness 4,5
Low High Savanna species live under severe environmental stress and nutrient
scarcity, so that they invest in leaf thickness to assure greater
protection against herbivores and water loss
Leaf
carbon/nitrogen
ratio
C/N (%) / g/kg
(%)
Low values of the ratio indicate higher nutritional quality
and palatability of leaves. Nitrogen is the major limiting
macronutrient in plants 1,8
Low High C/N ratio would be higher among savanna species because the
assimilation of N would be lower in the savanna, leading to a higher
C/N ratio. Higher C/N ratio can promote greater leaf toughness and
protection against abiotic and biotic stress11
Maximum plant
height
Hmax m Competitive plant fitness, plant fecundity, tolerance or
resistance to disturbances 1
High Low Forest species are taller due to the greater investment in vertical
growth resulting from the strong competition for light in the forest
canopy
Leaf area LA cm2 Ecological strategy related to resource acquisition and
use, responsible to environmental stress and disturbances.
High stress tends to select small leaves 1
High Low Forest species have higher leaf area because light is a limiting
resource in forest interiors, and higher leaf laminas enable higher
absorption of light per leaf
Specific leaf
area
SLA cm2 g
-1 Related to structural defense, resource uptake, resource
use efficiency, and growth strategies. It is negatively
correlated with leaf lifespan 1
High Low Species from forest environments rich in nutrients can invest in a
larger leaf surface per unit of leaf mass, which would improve their
competitive ability in forest interiors
Leaf phosphorus
content
LPC g/kg (%) Related to growth and productivity of plants 6 High Low Forest environments have higher concentrations of these nutrients
available in the soil than savanna environments and more efficient
nutrient cycling processes arising from the litter
Leaf potassium
content
LKC g/kg (%) Plays a critical role in plant growth and metabolism, and
contributes to survival of plants that are under various
biotic and abiotic stresses 7
High Low Same rationale of leaf phosphorous content
Leaf calcium
content
LCaC g/kg (%) Unique macronutrient with diverse but fundamental
physiological roles in plant structure and signaling. Plays
an important role in structure and increasing resistance of
plants, and helps the leaves to grow strong and health 8,9
High Low Same rationale of leaf phosphorous content
Leaf magnesium
content
LMgC g/kg (%) Involved in photosynthetic processes, related with growth
and health of plants 10
High Low Same rationale of leaf phosphorous content
1 Pérez-Harguindeguy et al. (2013);
2 Chave et al. (2009);
3 Larjavaara & Muller-Landau (2010);
4 Cianciaruso et al. (2012);
5 Vile et al. (2005);
6 Schachtman et al. (1998);
7 Tripler et al.
(2006); 8 Chapin et al. (2011);
9 Gilliham et al. (2011);
10 Shaul (2002);
11 Silva & Batalha (2011).

24
Methods
Study region
The Cerrado domain (Savannas) is a region of approximately 2 x 10⁶ km
2. The study
region ranged from 12°S to 22°S. The soils are predominantly characterized as red-
yellow latosol, with oxisols and dystrophic soils (Marimon Junior & Haridasan, 2005;
Ruggiero et al., 2006; Silva & Batalha, 2008; Pinheiro & Durigan, 2009). These soils
show high water permeability and their water available capacity varies in accordance to
texture and clay concentrations (Reatto et al., 2008). For a better characterization of the
climate and edaphic proprieties of the studied sites sampled see Table S1. The Cerrado
is composed of several vegetation mosaics that are the result of the occurrence of
various physiognomies (Eiten, 1972), ranging from open savannas to evergreen gallery
forests along streams and upland forests of deciduous and evergreen species (Hoffmann
et al., 2012).
Sampling design
We selected six study sites throughout the Brazilian Cerrado phytogeographic domain
(Fig. 1). The mean distance between pairs of sites was 12 km. The shortest distance
between sites was 150 km (Emas National Park and City of Jataí). We adopted a paired
sampling design, which consisted in one block of plots placed in savanna (cerrado
stricto sensu) and another block of plots placed in seasonally dry forests. The shortest
distance within site between a forest and a savanna block was 1 km (in Emas National
Park). In each locality we sampled woody communities in 10 100-m2 plots in each
block. We recorded all individuals with diameter at breast ground height (DGH) ≥ 5 cm
in all savanna plots, and all individuals with a diameter breast height (DBH) ≥ 10 cm in

25
all forest plots. All individuals were identified to the species level. Nomenclature
follows the Brazilian Flora (Forzza et al., 2012).
Figure 1. Location of six study sites of seasonal forests and savannas sampled in the
Brazilian Cerrado. 1. Assis Ecological Station – SP, 2. Vassununga State Park – SP, 3.
Emas National Park – GO, 4. Jataí – GO, 5. Bacaba Park – MT, 6. Ribeirão Cascalheira
– MT.
Trait sampling
We sampled 11 functional traits of 284 species belonging to 57 families distributed in
forest and savannas in six sites throughout the Cerrado (Table S2). The species richness
ranged from 21 to 52 species in the forest blocks, and from 43 to 89 in the savanna
blocks.

26
Following Pérez-Harguindeguy et al. (2013), we measured the following traits:
bark thickness (BT), stem-specific density (SSD), leaf thickness (LT), leaf
carbon/nitrogen ratio (C/N), maximum plant height (Hmax), leaf area (LA), specific leaf
area (SLA), leaf phosphorous content (LPC), leaf potassium content (LKC) leaf calcium
content (LCaC), and leaf magnesium content (LMgC) (see Table 1 for their ecological
significance). Whenever possible we measured 10 individuals for each species in each
site. When a given species had less than 10 individuals in our plots, we sampled
individuals that were nearby the plot (see Table S3). Leaf nutrient concentration
(phosphorous, potassium, calcium, magnesium) and leaf carbon/nitrogen ratio were
measured for three individuals of each species in each site. Leaf nutrient concentrations
were determined in the Laboratory of Soils of the University of Viçosa. All other traits
were quantified in each site for all species by sampling individuals whenever possible.
We did not measure stem-specific density for palm species because is impossible to
collect it without injuring the whole plant.
To obtain leaf trait values, we scanned three to five leaves of each individual.
We measured scanned leaf area through of a script that we build using the “EBImage”
package (Pau et al., 2014) with R 3.2.1 (http://www.R-project.org). Then, we dried
leaves at 70 °C for 48 h, and measured leaf dry mass. Leaf thickness of fresh leaves and
bark thickness were measured using a digital micrometer. All traits were collected
during the rainy season (December to March), which represents the peak of growth and
is also the period of maximum leaf expansion and maturity for the studied species.
We classified species according to their habitat of occurrence according to
Mendonça et al., (2008) and the Brazilian Flora database
(http://floradobrasil.jbrj.gov.br/). We considered as savanna specialists or forest
specialists all species with restrict occurrence to savanna or forest, respectively. Species

27
that occur in both habitats according to the literature, but that were sampled only in
forest plots were considered “forest-generalist species”. Following the same rationale
species that occurred only in savannas plots, but can also occur in forests according to
the literature, were considered “savanna-generalist species”. In order to avoid
misinterpretations due to potential sample bias we classified the species as “forest-
generalist species” and “savanna-generalist species”, and not only like generalists,
because we only found them in only one habitat at the field (Table S2). Only 19 species
were sampled in both forest and savanna habitats. These species were analysed
separately in order to evaluate the potential intraspecific variation in their ecological
strategies (see below).
Statistical analyses
We performed ANOVA to test for differences in functional traits between habitat
preferences of species (forest specialists, savanna specialists, forest generalist and
savanna generalist) with Tukey’s post hoc comparisons, when appropriate. In order to
control for type I error, P-values were based on Bonferroni’s correction. The ANOVAs
were conducted using “aov” function in R (R Core Team, 2015).
Considering that different sources of variation can act on habitat preferences of
species, we evaluated the role of variability among habitat preferences, within habitats
and among species. This approach enabled us to assess whether the possible differences
related to habitat preference in the ANOVA are a result of variation among different
sites or changes in species composition. We fitted a general linear mixed model
(GLMM) using site, habitat preference and species as nested random factor in the “lme”
function in the “nlme” R package (Pinheiro et al., 2016). We adopted this order, for the
nested random factors for considering sites as the coarser and species as the finer factor.

28
To partition the variation among these three components we used the “varcomp”
function in the “ape” R package (Paradis et al., 2004).
For the 19 species sampled in both forest and savanna habitats we performed
paired t test to evaluate how functional trait of these species respond to forest and
savanna habitats.
Results
In general, forest specialists and forest generalists presented traits values representative
of an acquisitive strategy, whereas savannas specialists and generalists had trait values
more related to a conservative strategy. Forest species had higher maximum height,
specific leaf area and leaf nutrient content than savanna species (Table 2; Fig. 2).
Conversely, savanna species had ticker barks and leaves and higher leaf carbon/nitrogen
ratio (Table 2; Fig. 2). Moreover, the traits of forest specialist and forest generalist
species did not differed (Table 2; Fig. 2). However, savanna specialist species presented
higher values of bark thickness and leaf thickness than savanna generalist species (Table
2; Fig. 2). We did not find any differences for stem-specific density and leaf area in
relation to habitat type (Table 2; Fig. 2).
For all traits, the variation among species and habitats explained trait variability
(Table 2). In general, the variability among sites was low, with only carbon/nitrogen,
phosphorous and calcium presenting intermediate values of variability (Table 2; Fig.
S1).

29
Table 2 Mean values of functional traits (± SD) and results of variance component analysis comparing the variability among sites, habitats and
species for traits of seasonal forests and savannas in the Brazilian Cerrado. Tukey’s post hoc comparisons with Bonferroni corrections (α = 0.05
to 0.0045) reveals significant differences between functional traits of forest and savanna. Different letters indicate significant differences between
habitat preferences (Tukey test, p < 0.05).
Trait Forest Generalist Savanna Variability
Sampled only
in forest
Sampled only
in savanna
F P Among
sites
Among
habitats
Among
species
Residuals
Bark thickness (mm) 1.73 ± 1.77 a 2.37 ± 2.23
a 6.26 ± 5.33
b 8.19 ± 4.62
c 54.35 <0.001 0.00 0.35 0.65 0.00
Stem-specific density (mg mm-3
) 0.54 ± 0.12 0.53 ± 0.14 0.54 ± 0.09 0.51 ± 0.08 1.95 0.121 0.12 0.12 0.66 0.10
Leaf thickness (mm) 0.17 ± 0.04 a 0.18 ± 0.05
a 0.22 ± 0.08
b 0.27 ± 0.08
c 37.78 <0.001 0.07 0.37 0.48 0.08
Leaf C/N ratio (g/kg(%)) 2.55 ± 0.80 a 2.65 ± 0.79
a 3.18 ± 0.86
b 3.47 ± 0.84
b 22.34 <0.001 0.10 0.15 0.65 0.10
Maximum plant height (m) 15.8 ± 5.5 a 15.8 ± 5.5
a 6.7 ± 2.2
b 5.6 ± 1.8
b 134.6 <0.001 0.00 0.73 0.27 0.00
Leaf area (cm2) 175 ± 281 181 ± 360 111 ± 173 90 ± 120 2.50 0.059 0.01 0.04 0.84 0.11
Specific leaf area (cm2 g
-1) 117 ± 39.0
a 119 ± 43.3
a 88 ± 26.55
b 81.3 ± 22.4
b 24.91 <0.001 0.00 0.46 0.53 0.01
Leaf phosphorous content (g/kg(%)) 1.25 ± 0.53 a 1.30 ± 0.48
a 1.11 ± 0.34
a,b 1.01 ± 0.26
b 7.28 <0.001 0.29 0.22 0.42 0.07
Leaf potassium content (g/kg(%)) 9.25 ± 6.23 a 9.10 ± 5.14
a 6.19 ± 3.57
b 5.48 ± 2.72
b 12.98 <0.001 0.00 0.49 0.47 0.04
Leaf calcium content (g/kg(%)) 12.5 ± 11.7 a 9.57 ± 9.31
a 3.99 ± 2.86
b 3.44 ± 1.74
b 24.72 <0.001 0.26 0.48 0.21 0.05
Leaf magnesium content (g/kg(%)) 3.05 ± 1.90 a,b
3.29 ± 1.93 a 2.43 ± 1.29
b,c 2.17 ± 1.02
c 7.69 <0.001 0.06 0.32 0.53 0.09

30
Figure 2 Mean value and confidence interval to species habitat preference - specialist of
forest (F) and savanna (S), and generalist sampled only in forest (FG) and sampled only
in savanna (SG) - for traits of seasonal forests and savannas in the Brazilian Cerrado.
Different letters indicate significant differences between habitat preferences (Tukey test,
p < 0.05).
For the 19 species that occurred in both forest and savanna habitats, we found
intraspecific differences for only three traits (Fig. 3). Individuals occurring in forests
presented higher values of maximum plant height, specific leaf area, while those
occurring in savannas had higher carbon/nitrogen ratio (Fig. 3).

31
Figure 3 Ecological strategies of 19 species common to seasonal forests and savannas
environments in the Brazilian Cerrado. Paired t test with Bonferroni corrections (α =
0.05 to 0.0045) reveals significant differences between functional traits of forest and
savanna.

32
Discussion
In general, our results were in accordance to our predictions (see Table 1) and
demonstrate that forest and savanna species have different ecological strategies. Forest
species had higher values for traits related to competitive ability and fast resource
acquisition, and savannas species had higher values for traits associated with physical
and biological stress damage. We found evidence for fundamental trade-offs involving
major plant traits in contrasting tropical habitats, in which a set of species invests in
traits related to rapid acquisition of resources, while another group of species allocates
more energy in traits that represent conservation of resources and protection against
physical and biological damage (Diaz et al., 2004; Wigley et al., 2016). For example,
plants with a resource acquisition strategy have leaves with high nutritional quality and
fast growth, with higher plant height and specific leaf area, which represents better
capture and use of light (Westoby, 1998; Diaz et al., 2004; Hoffmann et al., 2012;
Pellegrini, 2016). Because light is a limited resource in the understory species that
invest more in acquisitive strategies tend to be more successful in seasonal forests
(Hoffmann et al., 2012). On the other hand, species with traits related to conservative
strategy tend to persist in savannas, under poor soils and higher effect of strong
environmental filters (Westoby, 1998; Dantas et al., 2013a; Pausas et al., 2016).
The distinction between functional traits of forest and savanna species occurs
because the species with different growth strategies respond differently to environments
so contrasting as forests and savannas and adopt different strategies for persisting in an
environment that is either light limiting or fire-prone (Hoffmann & Franco, 2003;
Dantas et al., 2016; Pausas et al., 2016). The adoption of these different ecological
strategies by species living in habitats drive by different limiting factors often determine
their persistence or exclusion (Hoffmann & Franco, 2003; Laureto & Cianciaruso,

33
2015). Species that do not have fire-adaptive traits may be excluded from fire-prone
habitats like savannas (Simon et al., 2009; Pausas et al., 2016). Likewise, species that
not have fast growth or shade tolerance may not persist in light limiting habitats
(Hoffmann & Franco, 2003; Ratnam et al., 2011). For instance, savanna species
presented higher values for traits related to defense against herbivores and water loss
(leaf thickness and carbon/nitrogen ratio) and fire protection (bark thickness) (Silva &
Batalha, 2011; Dantas et al., 2013b,a; Pausas et al., 2016), representing strategies of
stress tolerance in savanna environments (Hoffmann et al., 2012; Pellegrini et al.,
2015). On the other hand, forest species have strategies associated with competitive
vigor (taller plants), efficiency in capture and use of the light resource (high specific
leaf area), and fertility (high leaf concentrations of P, K, Mg, Ca). Thus, forest specialist
species cannot establish in savannas because of the effects of environmental filters, and
savanna specialist species are unable to establish in forests due to low competitive
ability for light (Silva et al., 2013).
We expected that stem-specific density and leaf area would be different between
forest and savannas species (see Table 1). However, these traits did not differ between
forest and savanna species. A similar wood density to forest and savanna species can be
explained because forest species need a high wood density to support taller trees in an
environment where height means competitive ability (Chave et al., 2009; Pérez-
Harguindeguy et al., 2013). On their turn, savanna species slow growth in a stressful
environment have high construction costs (Larjavaara & Muller-Landau, 2010), which
leads to high wood density, that also confers higher advantage in persisting in under
strong environmental stress, poor soils and high fire frequency [Dantas et al. (2013a);
but see Hoffmann et al. (2009) and Brando et al. (2012)]. Even if some studies showed
that leaf area is two times greater for forest than savanna species (Hoffmann et al.,
34
2012; Silva et al., 2013), these studies were conducted with a restricted number of
species. Savannas species have large root systems (Oliveira et al., 2005) and lead
habitat ranging from evergreens to deciduous species (Cianciaruso et al., 2013). The
deep roots make the savanna species able to have access to soil water and, therefore, to
survive and grow even during the dry season (Oliveira et al., 2005). Yet, many savannas
species concentrate the loss of leaves during dry season whereas forest species generally
produce and lose leaves throughout the year (Franco et al., 2005; Lenza & Klink, 2006).
However, for Neotropical savanna species, Cianciaruso et al. (2013) found a lack of
differences in leaf traits (SLA and N) among species with distinct leaf habits. In fact,
they found that even evergreens and deciduous have similar leaf life spans. This
reinforces the idea that the more relevant trade-offs are in the root systems. Also, the
similar leaf area between forest and savannas species (but distinct SLA) indicate that
leaf dry mass content is main factor determining acquisitive strategy for forest (high
SLA and low carbon/nitrogen rate) and conservative strategy for savannas (low SLA
and high carbon/nitrogen rate).
When we evaluate the individuals of the same species inhabiting in seasonal
forests and savannas, three out of the 11 functional traits differed between species of
forest and savanna. Carbon/nitrogen that represent conservative strategy presented
higher values in savanna habitat, while maximum plant height and specific leaf area that
indicate acquisitive strategy were higher in forest habitat. These opposite responses of
the same species in different environments show that the habitat has a strong influence
on intraspecific trait variability of generalist species. Intraspecific variability is evident
when a given species occurs in different environments expressing distinct trait values
(Miner et al., 2005), because non-plastic species can be removed from communities
through environmental filters (as fire) and competition by light (Hoffmann & Franco,

35
2003; Jung et al., 2010). Leaf traits and plant height are traits that have greater
phenotypic plasticity and that can shift according to light and resource availability or
environmental stress (Hoffmann & Franco, 2003; Hoffmann et al., 2005, 2012; Nicotra
et al., 2010). Assuming that some “dominant plants tend to monopolize light and
mineral nutrient capture by the development of extensive leaf canopies and root
systems” (Campbell et al., 1991), thus species ability to perform shifts in morphological
and physiological leaf traits is key to determine the permanence of generalist species
(Schlichting, 1986; Callaway et al., 2003). Usually, savanna species have thicker barks
than forest species, because bark promote protection of stem in fire-prone habitat
(Hoffmann et al., 2003). However, our results showed that the same species in savanna
and forest had similar bark thickness.
Savanna species have thick barks as a fire resistance strategy (Dantas et al.,
2013a; Rosell et al., 2014; Pausas et al., 2016). Hoffmann et al. (2012) calculated a
threshold bark thickness of 5.9 mm needed to survive in a low-intensity fire of forest
and savanna species. In our study system, the species with individuals inhabiting in
seasonal forests and savannas showed mean values below of threshold bar thickness in
both habitats (see Table S4). These values below of threshold bark thickness can be
explained by the fact that the most of the 19 species occurring in forest and savanna
have the forest habitat as preferential habitat (see list of species in Table S4). Moreover,
these 19 species present low percentage of occurrence in 376 areas analysed by Ratter et
al. (2003) that also can be justified by forest preferential habitat these species, because
no included forest areas in analyses. We highlight that the same species with individuals
occurring in forest and savannas are not proper generalists, which would promote an
adaptive advantage in a phytogeographic region with forests and savannas, and with
distinct levels of fire. We verified that some traits respond to habitat preference at

36
interspecific level, but such differences are lost when intraspecific variation is included.
However, changes in SLA, plant height and leaf carbon/nitrogen ratio were similar at
both inter and intraspecific levels. Therefore, these are likely to be key traits for
adaptation of individuals in forest and savannas.
Concluding remarks
We showed that habitat preference determines the value of functional traits. Traits
related to an acquisitive strategy were associated to and higher in the forest habitat,
while traits with conservative strategy were related to and higher in the savanna habitat
(Diaz et al., 2004). We highlight that these different strategies are related to competitive
ability and resource acquisition of forest-specialist species in an environment in which
light is a limiting resource as forests, and related to defense against fire and physical and
biological stress of savanna-specialist species in an environment with high fire
frequency and poor-soils as savannas (Pellegrini, 2016; Pausas et al., 2016). Generalist
species with occurrence restrict to forest or savanna in our study generally presented
values of functional traits intermediary between forest- and savanna-specialist species.
However, generalist species of forests and savannas were more similar to specialist
species of each habitat than each other. This indicates that the habitat play an important
role on functional traits, determining values according to limiting factors of each
environment. This pattern was also observed when we evaluated the same species
occurring in forest and savanna, demonstrating that the habitat has also a strong
influence on intraspecific trait variability of generalist species. Thus, the phenotypic
plasticity of the species may confer ability to persistence in a habitat with stronger
competition for light (forest) or in a habitat with strong environmental filters and stress
(savanna).
37
Acknowledgements
This research was by CNPq-Brazil (#563621/2010-9, #478747/2009-8, and PELD -
SITE 13), FAPEG-GO (#201110267000130/31-10), and CAPES-Brazil via scholarships
to L.M. and a postdoctoral fellowship to M.B.C. (PNPD #1454013). MVC has a
productivity grant awarded by CNPq (307796/2015-9). We thank to all field team
responsible for sampling data: Edmar Oliveira, Leonardo Maracahipes, Letícia Gomes,
Livia Laureto, Danira Padilha, Mônica Forsthofer, Mariângela Abreu, Josias Santos,
Fernando Ribeiro. Thank for Vinicius Dantas by help in design of mixed model. We
also thank to taxonomists Geraldo Franco, Osnir Aguiar, João Baitelo, Natália
Ivanauskas and Renato Mello-Silva for the identification of some species.
References
Bello F de, Lavorel S, Lavergne S, Albert CH, Boulangeat I, Mazel F, Thuiller W.
2013. Hierarchical effects of environmental filters on the functional structure of plant
communities: a case study in the French Alps. Ecography 36: 393–402.
Bowman DMJS, Perry GLW, Marston JB. 2015. Feedbacks and landscape-level
vegetation dynamics. Trends in Ecology & Evolution 30: 255–260.
Brando PM, Nepstad DC, Balch JK, Bolker B, Christman MC, Coe M, Putz FE.
2012. Fire-induced tree mortality in a neotropical forest: the roles of bark traits, tree
size, wood density and fire behavior. Global Change Biology 18: 630–641.
Callaway RM, Pennings SC, Richards CL. 2003. Phenotypic plasticity and
interactions among plants. Ecology 84: 1115–1128.
Campbell BD, Grime JP, Mackey JML. 1991. A trade-off between scale and
precision in resource foraging. Oecologia 87: 532–538.
Chapin FS, Matson PA, Vitousek PM. 2011. Plant Nutrient Use. Principles of
terrestrial ecosystem ecology. New York, NY: Springer New York, 229–258.
Charles-Dominique T, Beckett H, Midgley GF, Bond WJ. 2015. Bud protection: a
key trait for species sorting in a forest-savanna mosaic. New Phytologist 207: 1052–
1060.
Chave J, Coomes D, Jansen S, Lewis SL, Swenson NG, Zanne AE. 2009. Towards a
worldwide wood economics spectrum. Ecology Letters 12: 351–366.
Cianciaruso M V., Silva IA, Batalha MA, Gaston KJ, Petchey OL. 2012. The
influence of fire on phylogenetic and functional structure of woody savannas: moving

38
from species to individuals. Perspectives in Plant Ecology, Evolution and Systematics
14: 205–216.
Cianciaruso M V., Silva IA, Manica LT, Souza JP. 2013. Leaf habit does not predict
leaf functional traits in cerrado woody species. Basic and Applied Ecology 14: 404–412.
Dantas VL, Batalha MA, Pausas JG. 2013a. Fire drives functional thresholds on the
savanna–forest transition. Ecology 94: 2454–2463.
Dantas V de L, Hirota M, Oliveira RS, Pausas JG. 2016. Disturbance maintains
alternative biome states (M Rejmanek, Ed.). Ecology Letters 19: 12–19.
Dantas V de L, Pausas JG, Batalha MA, Loiola P de P, Cianciaruso MV. 2013b.
The role of fire in structuring trait variability in Neotropical savannas. Oecologia 171:
487–494.
Diaz S, Hodgson JG, Thompson K, Cabido M, Cornelissen JHC, Jalili A,
Montserrat-Martí G, Grime JP, Zarrinkamar F, Asri Y, et al. 2004. The plant traits
that drive ecosystems: evidence from three continents. Journal of Vegetation Science
15: 295–304.
Eiten G. 1972. The cerrado vegetation of Brazil. Botanical Reviews 38: 201–341.
Forzza RC, Baumgratz JFA, Bicudo CEM, Canhos DAL, Carvalho AA, Coelho
MAN, Costa AF, Costa DP, Hopkins MG, Leitman PM, et al. 2012. New Brazilian
floristic list highlights conservation challenges. BioScience 62: 39–45.
Franco AC, Bustamante M, Caldas LS, Goldstein G, Meinzer FC, Kozovits AR,
Rundel P, Coradin VTR. 2005. Leaf functional traits of Neotropical savanna trees in
relation to seasonal water deficit. Trees 19: 326–335.
Gilliham M, Dayod M, Hocking BJ, Xu B, Conn SJ, Kaiser BN, Leigh RA,
Tyerman SD. 2011. Calcium delivery and storage in plant leaves: exploring the link
with water flow. Journal of Experimental Botany 62: 2233–2250.
Goodland R, Pollard R. 1973. The Brazilian cerrado vegetation: a fertility gradient.
Journal of Ecology 61: 219–224.
Hao G-Y, Hoffmann WA, Scholz FG, Bucci SJ, Meinzer FC, Franco AC, Cao K-F,
Goldstein G. 2008. Stem and leaf hydraulics of congeneric tree species from adjacent
tropical savanna and forest ecosystems. Oecologia 155: 405–415.
Hoffmann WA, Adasme R, Haridasan M, Carvalho MT, Geiger EL, Pereira M a
B, Gotsch SG, Franco AC. 2009. Tree topkill, not mortality, governs the dynamics of
savanna-forest boundaries under frequent fire in central Brazil. Ecology 90: 1326–37.
Hoffmann WA, Franco AC. 2003. Comparative growth analysis of tropical forest and
savanna woody plants using phylogenetically independent contrasts. Journal of Ecology
91: 475–484.
Hoffmann WA, Franco AC, Moreira MZ, Haridasan M. 2005. Specific leaf area
explains differences in leaf traits between congeneric savanna and forest trees.
Functional Ecology 19: 932–940.
Hoffmann W a, Geiger EL, Gotsch SG, Rossatto DR, Silva LCR, Lau OL,
Haridasan M, Franco AC. 2012. Ecological thresholds at the savanna-forest boundary:
how plant traits, resources and fire govern the distribution of tropical biomes (F Lloret,

39
Ed.). Ecology Letters 15: 759–768.
Hoffmann WA, Orthen B, Franco AC. 2004. Constraints to seedling success of
savanna and forest trees across the savanna-forest boundary. Oecologia 140: 252–260.
Hoffmann WA, Orthen B, Nascimento PKV Do. 2003. Comparative fire ecology of
tropical savanna and forest trees. Functional Ecology 17: 720–726.
Jung V, Violle C, Mondy C, Hoffmann L, Muller S. 2010. Intraspecific variability
and trait-based community assembly. Journal of Ecology 98: 1134–1140.
Larjavaara M, Muller-Landau HC. 2010. Rethinking the value of high wood density.
Functional Ecology 24: 701–705.
Laureto LMO, Cianciaruso M V. 2015. Trait distribution patterns in savanna and
forest plant assemblages and their relationship with soil features. Plant Ecology 216:
629–639.
Lenza E, Klink CA. 2006. Comportamento fenológico de espécies lenhosas em um
cerrado sentido restrito de Brasília, DF. Revista Brasileira de Botânica 29: 627–638.
Lusk C, Reich P, Montgomery R, Ackerly D, Cavender-Bares J. 2008. Why are
evergreen leaves so contrary about shade? Trends in Ecology & Evolution 23: 299–303.
Marimon Junior BH, Haridasan M. 2005. Comparação da vegetação arbórea e
características edáficas de um cerradão e um cerrado sensu stricto em áreas adjacentes
sobre solo distrófico no leste de Mato Grosso , Brasil. Acta Botanica Brasilica 19: 913–
926.
Mendonça RC, Felfili JM, Walter BMT, Silva Junior MC, Rezende A V.,
Filgueiras TS, Nogueira PE, Fagg CW. 2008. Cerrado: ecologia e flora (SM Sano,
SP Almeida, and JF Ribeiro, Eds.). Brasília-DF: Embrapa Cerrados.
Miner BG, Sultan SE, Morgan SG, Padilla DK, Relyea RA. 2005. Ecological
consequences of phenotypic plasticity. Trends in Ecology & Evolution 20: 685–692.
Murphy BP, Bowman DMJS. 2012. What controls the distribution of tropical forest
and savanna? Ecology Letters 15: 748–758.
Murphy BP, Russell-Smith J, Prior LD. 2010. Frequent fires reduce tree growth in
northern Australian savannas: implications for tree demography and carbon
sequestration. Global Change Biology 16: 331–343.
Nicotra AB, Atkin OK, Bonser SP, Davidson AM, Finnegan EJ, Mathesius U, Poot
P, Purugganan MD, Richards CL, Valladares F, et al. 2010. Plant phenotypic
plasticity in a changing climate. Trends in Plant Science 15: 684–692.
Oliveira RS, Bezerra L, Davidson EA, Pinto F, Klink CA, Nepstad DC, Moreira A.
2005. Deep root function in soil water dynamics in cerrado savannas of central Brazil.
Functional Ecology 19: 574–581.
Paradis E, Claude J, Strimmer K. 2004. APE: analyses of phylogenetics and
evolution in R language. : 289–290.
Pausas JG, Dantas V de L. 2016. Scale matters: fire-vegetation feedbacks are needed
to explain tropical tree cover at the local scale. Global Ecology and Biogeography.
Pausas JG, Keeley JE, Schwilk DW. 2016. Flammability as an ecological and

40
evolutionary driver (M Rees, Ed.). Journal of Ecology.
Pellegrini AFA. 2016. Nutrient limitation in tropical savannas across multiple scales
and mechanisms. Ecology 97: 313–324.
Pellegrini AFA, Franco AC, Hoffmann WA. 2015. Shifts in functional traits elevate
risk of fire-driven tree dieback in tropical savanna and forest biomes. Global Change
Biology: n/a-n/a.
Pérez-Harguindeguy N, Díaz S, Garnier E, Lavorel S, Poorter H, Jaureguiberry P,
Bret-Harte MS, Cornwell WK, Craine JM, Gurvich DE, et al. 2013. New handbook
for standardised measurement of plant functional traits worldwide. Australian Journal
of Botany 61: 167–234.
Pinheiro J, Bates D, DebRoy D, Team C. 2016. nlme: Linear and Nonlinear Mixed
Effects Models.
Pinheiro EDS, Durigan G. 2009. Dinâmica espaço-temporal (1962-2006) das
fitofisionomias em unidade de conservação do Cerrado no sudeste do Brasil. Revista
Brasileira de Botânica 32: 441–454.
Poorter L. 2009. Leaf traits show different relationships with shade tolerance in moist
versus dry tropical forests. New Phytologist 181: 890–900.
Ratnam J, Bond WJ, Fensham RJ, Hoffmann W a., Archibald S, Lehmann CER,
Anderson MT, Higgins SI, Sankaran M. 2011. When is a ‘forest’ a savanna, and why
does it matter? Global Ecology and Biogeography 20: 653–660.
Ratter JA, Bridgewater S, Ribeiro JF. 2003. Analysis of the floristic composition of
the Brazilian cerrado vegetation III: comparison of the woody vegetation of 376 areas.
Edinburgh Journal of Botany 60: 57–109.
Reatto A, Correia JR, Spera ST, Martins É de S. 2008. Solos do bioma Cerrado:
aspectos pedológicos. In: Sano SM,, In: Almeida SP,, In: Ribeiro JF, eds. Cerrado:
ecologia e flora. Brasília-DF: Embrapa Cerrados, 107–149.
Rosell JA, Gleason S, Méndez-Alonzo R, Chang Y, Westoby M. 2014. Bark
functional ecology: evidence for tradeoffs, functional coordination, and environment
producing bark diversity. New Phytologist 201: 486–497.
Rossatto DR, Hoffmann WA, de Carvalho Ramos Silva L, Haridasan M, Sternberg
LSL, Franco AC. 2013. Seasonal variation in leaf traits between congeneric savanna
and forest trees in Central Brazil: implications for forest expansion into savanna. Trees
27: 1139–1150.
Rossatto DR, Hoffmann WA, Franco AC. 2009. Differences in growth patterns
between co-occurring forest and savanna trees affect the forest-savanna boundary.
Functional Ecology 23: 689–698.
Ruggiero PGC, Pivello VR, Sparovek G, Teramoto E, Pires Neto AG. 2006.
Relação entre solo, vegetação e topografia em área de cerrado (Parque Estadual de
Vassununga, SP): como se expressa em mapeamentos? Acta Botanica Brasilica 20:
383–394.
Schachtman D, Reid RJ, Ayling SM. 1998. Phosphorus uptake by plants: from soil to
cell. Plant Physiology 116: 447–453.
41
Schlichting CD. 1986. The evolution of phenotypic plasticity in plants. Annual Review
of Ecology and Systematics 17: 667–693.
Scholz FG, Bucci SJ, Goldstein G, Meinzer FC, Franco AC, Miralles-Wilhelm F.
2007. Biophysical properties and functional significance of stem water storage tissues in
Neotropical savanna trees. Plant, Cell & Environment 30: 236–248.
Schymanski SJ, Or D, Zwieniecki M. 2013. Stomatal Control and Leaf Thermal and
Hydraulic Capacitances under Rapid Environmental Fluctuations (W Bauerle, Ed.).
PLoS ONE 8: e54231.
Shaul O. 2002. Magnesium transport and function in plants: the tip of the iceberg.
BioMetals 15: 307–321.
Silva DM da, Batalha MA. 2008. Soil–vegetation relationships in cerrados under
different fire frequencies. Plant and Soil 311: 87–96.
Silva DM da, Batalha MA. 2011. Defense syndromes against herbivory in a cerrado
plant community. Plant Ecology 212: 181–193.
Silva LCR, Hoffmann WA, Rossatto DR, Haridasan M, Franco AC, Horwath WR.
2013. Can savannas become forests? A coupled analysis of nutrient stocks and fire
thresholds in central Brazil. Plant and Soil 373: 829–842.
Simon MF, Grether R, de Queiroz LP, Skema C, Pennington RT, Hughes CE.
2009. Recent assembly of the Cerrado, a neotropical plant diversity hotspot, by in situ
evolution of adaptations to fire. Proceedings of the National Academy of Sciences of the
United States of America 106: 20359–64.
Tripler CE, Kaushal SS, Likens GE, Todd Walter M. 2006. Patterns in potassium
dynamics in forest ecosystems. Ecology Letters 9: 451–466.
Turcotte MM, Levine JM. 2016. Phenotypic plasticity and species coexistence. Trends
in Ecology & Evolution 31: 803–813.
Vile D. 2005. Specific leaf area and dry matter content estimate thickness in laminar
leaves. Annals of Botany 96: 1129–1136.
Violle C, Enquist BJ, McGill BJ, Jiang L, Albert CH, Hulshof C, Jung V, Messier
J. 2012. The return of the variance: intraspecific variability in community ecology.
Trends in Ecology & Evolution 27: 244–252.
Westoby M. 1998. A leaf-height-seed (LHS) plant ecology strategy scheme. Plant and
Soil 199: 213–227.
Wigley BJ, Slingsby JA, Díaz S, Bond WJ, Fritz H, Coetsee C. 2016. Leaf traits of
African woody savanna species across climate and soil fertility gradients: evidence for
conservative vs . acquisitive resource use strategies. Journal of Ecology.
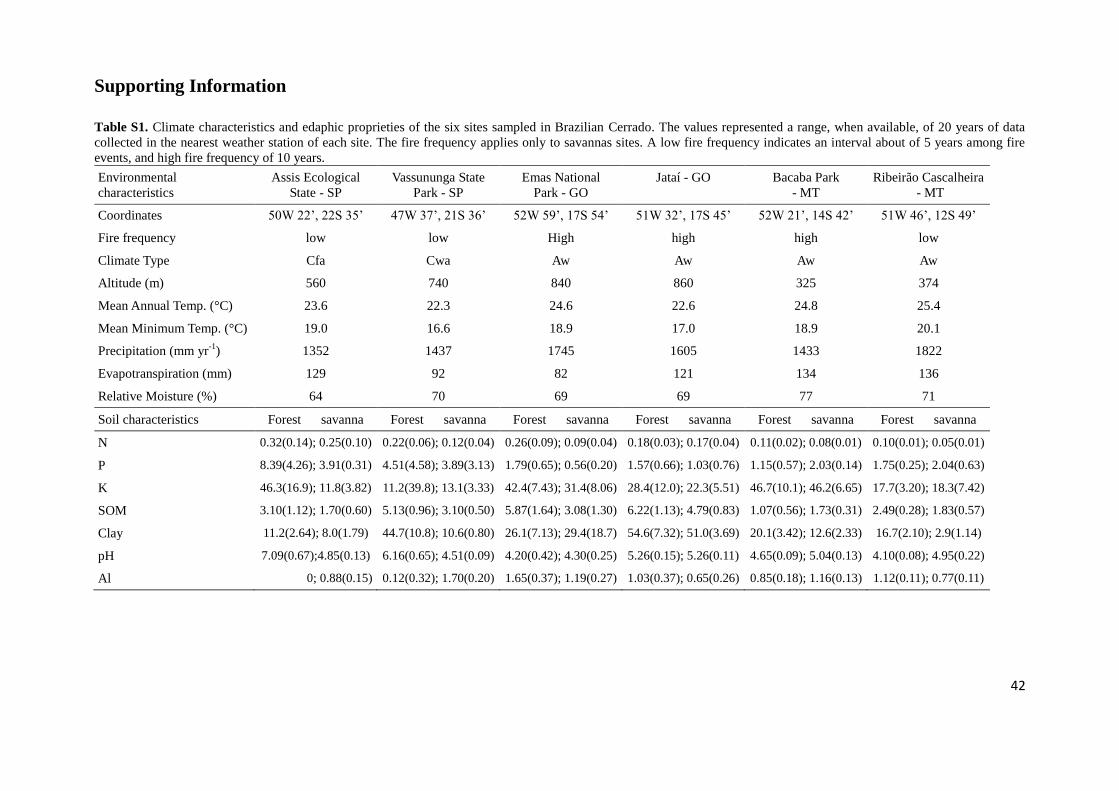
42
Supporting Information
Table S1. Climate characteristics and edaphic proprieties of the six sites sampled in Brazilian Cerrado. The values represented a range, when available, of 20 years of data
collected in the nearest weather station of each site. The fire frequency applies only to savannas sites. A low fire frequency indicates an interval about of 5 years among fire
events, and high fire frequency of 10 years.
Environmental
characteristics
Assis Ecological
State - SP
Vassununga State
Park - SP
Emas National
Park - GO
Jataí - GO Bacaba Park
- MT
Ribeirão Cascalheira
- MT
Coordinates 50W 22’, 22S 35’ 47W 37’, 21S 36’ 52W 59’, 17S 54’ 51W 32’, 17S 45’ 52W 21’, 14S 42’ 51W 46’, 12S 49’
Fire frequency low low High high high low
Climate Type Cfa Cwa Aw Aw Aw Aw
Altitude (m) 560 740 840 860 325 374
Mean Annual Temp. (°C) 23.6 22.3 24.6 22.6 24.8 25.4
Mean Minimum Temp. (°C) 19.0 16.6 18.9 17.0 18.9 20.1
Precipitation (mm yr-1
) 1352 1437 1745 1605 1433 1822
Evapotranspiration (mm) 129 92 82 121 134 136
Relative Moisture (%) 64 70 69 69 77 71
Soil characteristics Forest savanna Forest savanna Forest savanna Forest savanna Forest savanna Forest savanna
N 0.32(0.14); 0.25(0.10) 0.22(0.06); 0.12(0.04) 0.26(0.09); 0.09(0.04) 0.18(0.03); 0.17(0.04) 0.11(0.02); 0.08(0.01) 0.10(0.01); 0.05(0.01)
P 8.39(4.26); 3.91(0.31) 4.51(4.58); 3.89(3.13) 1.79(0.65); 0.56(0.20) 1.57(0.66); 1.03(0.76) 1.15(0.57); 2.03(0.14) 1.75(0.25); 2.04(0.63)
K 46.3(16.9); 11.8(3.82) 11.2(39.8); 13.1(3.33) 42.4(7.43); 31.4(8.06) 28.4(12.0); 22.3(5.51) 46.7(10.1); 46.2(6.65) 17.7(3.20); 18.3(7.42)
SOM 3.10(1.12); 1.70(0.60) 5.13(0.96); 3.10(0.50) 5.87(1.64); 3.08(1.30) 6.22(1.13); 4.79(0.83) 1.07(0.56); 1.73(0.31) 2.49(0.28); 1.83(0.57)
Clay 11.2(2.64); 8.0(1.79) 44.7(10.8); 10.6(0.80) 26.1(7.13); 29.4(18.7) 54.6(7.32); 51.0(3.69) 20.1(3.42); 12.6(2.33) 16.7(2.10); 2.9(1.14)
pH 7.09(0.67);4.85(0.13) 6.16(0.65); 4.51(0.09) 4.20(0.42); 4.30(0.25) 5.26(0.15); 5.26(0.11) 4.65(0.09); 5.04(0.13) 4.10(0.08); 4.95(0.22)
Al 0; 0.88(0.15) 0.12(0.32); 1.70(0.20) 1.65(0.37); 1.19(0.27) 1.03(0.37); 0.65(0.26) 0.85(0.18); 1.16(0.13) 1.12(0.11); 0.77(0.11)

43
Table S2 List of species and families classified according to habitat preference. The
species are ordered according to family. In bold the 19 species that occurred in both
forest and savanna habitats in our study and for which we have intraspecific trait
variability.
Species Family Habitat preference
Anacardium occidentale L. Anacardiaceae Generalist savanna
Astronium fraxinifolium Schott Anacardiaceae Generalist
Astronium graveolens Jacq. Anacardiaceae Generalist forest
Myracrodruon urundeuva Allemão Anacardiaceae Generalist forest
Tapirira guianensis Aubl. Anacardiaceae Generalist
Tapirira obtusa (Benth.) J.D.Mitch. Anacardiaceae Generalist forest
Tapirira sp. Anacardiaceae Forest
Annona cacans Warm. Annonaceae Generalist forest
Annona coriacea Mart. Annonaceae Savanna
Annona crassiflora Mart. Annonaceae Generalist savanna
Annona sylvatica A. St.-Hil. Annonaceae Generalist forest
Bocageopsis mattogrossensis (R.E.Fr.) R.E.Fr. Annonaceae Generalist forest
Duguetia marcgraviana Mart. Annonaceae Generalist forest
Ephedranthus parviflorus S.Moore Annonaceae Generalist forest
Guatteria blepharophylla Mart. Annonaceae Forest
Xylopia amazonica R.E.Fr. Annonaceae Forest
Xylopia aromatica (Lam.) Mart. Annonaceae Generalist
Xylopia frutescens Aubl. Annonaceae Forest
Xylopia sericea A.St.-Hil. Annonaceae Generalist savanna
Aspidosperma desmanthum Benth. ex Müll.Arg. Apocynaceae Forest
Aspidosperma discolor A.DC. Apocynaceae Forest
Aspidosperma macrocarpon Mart. Apocynaceae Generalist savanna
Aspidosperma multiflorum A.DC. Apocynaceae Savanna
Aspidosperma nobile Müll.Arg. Apocynaceae Generalist savanna
Aspidosperma polyneuron Müll.Arg. Apocynaceae Generalist forest
Aspidosperma ramiflorum Müll.Arg. Apocynaceae Forest
Aspidosperma tomentosum Mart. Apocynaceae Generalist savanna
Hancornia speciosa Gomes Apocynaceae Savanna
Himatanthus obovatus (Müll.Arg.) Woodson Apocynaceae Savanna
Himatanthus sucuuba (Spruce ex Müll.Arg.)
Woodson Apocynaceae Forest
Schefflera macrocarpa (Cham. & Schltdl.) Frodin Araliaceae Generalist savanna
Schefflera morototoni (Aubl.) Maguire, Steyerm. &
Frodin Araliaceae Generalist forest
Schefflera vinosa (Cham. & Schltdl.) Frodin & Fiaschi Araliaceae Savanna
Euterpe edulis Mart. Arecaceae Forest
Oenocarpus distichus Mart. Arecaceae Generalist forest
Syagrus comosa (Mart.) Mart. Arecaceae Savanna
Syagrus flexuosa (Mart.) Becc. Arecaceae Savanna

44
Species Family Habitat preference
Moquiniastrum polymorphum (Less.) G. Sancho Asteraceae Generalist savanna
Piptocarpha rotundifolia (Less.) Baker Asteraceae Savanna
Vernonia sp. Asteraceae Savanna
Handroanthus heptaphyllus (Vell.) Mattos Bignoniaceae Forest
Handroanthus ochraceus (Cham.) Mattos Bignoniaceae Savanna
Handroanthus serratifolius (Vahl) S.O.Grose Bignoniaceae Generalist forest
Jacaranda copaia (Aubl.) D.Don Bignoniaceae Forest
Jacaranda micrantha Cham. Bignoniaceae Forest
Tabebuia aurea (Silva Manso) Benth. & Hook.f. ex
S.Moore Bignoniaceae Savanna
Zeyheria tuberculosa (Vell.) Bureau ex Verl. Bignoniaceae Forest
Cordia sellowiana Cham. Boraginaceae Generalist forest
Cordia trichotoma (Vell.) Arráb. ex Steud. Boraginaceae Generalist forest
Protium pilosissimum Engl. Burseraceae Forest
Protium spruceanum (Benth.) Engl. Burseraceae Forest
Protium unifoliolatum Engl. Burseraceae Forest
Tetragastris altissima (Aubl.) Swart Burseraceae Forest
Trattinnickia glaziovii Swart Burseraceae Forest
Trattinnickia sp. Burseraceae Forest
Kielmeyera coriacea Mart. Calophyllaceae Savanna
Kielmeyera rubriflora Cambess. Calophyllaceae Savanna
Jacaratia spinosa (Aubl.) A.DC. Caricaceae Forest
Caryocar brasiliense A.St.-Hil. Caryocaraceae Savanna
Cheiloclinium cognatum (Miers) A.C.Sm. Celastraceae Forest
Plenckia populnea Reissek Celastraceae Savanna
Salacia crassifolia (Mart. ex Schult.) G. Don Celastraceae Savanna
Couepia grandiflora (Mart. & Zucc.) Benth. ex
Hook.f. Chrysobalanaceae Generalist savanna
Hirtella glandulosa Spreng. Chrysobalanaceae Generalist
Hirtella racemosa Lam. Chrysobalanaceae Generalist forest
Licania apetala (E.Mey.) Fritsch Chrysobalanaceae Forest
Licania blackii Prance Chrysobalanaceae Forest
Licania gardneri (Hook.f.) Fritsch. Chrysobalanaceae Forest
Licania humilis Cham. & Schltdl. Chrysobalanaceae Savanna
Licania kunthiana Hook.f. Chrysobalanaceae Generalist forest
Licania minutiflora (Sagot) Fritsch Chrysobalanaceae Forest
Buchenavia tetraphylla (Aubl.) R.A.Howard Combretaceae Generalist forest
Buchenavia tomentosa Eichler Combretaceae Generalist
Terminalia argentea Mart. Combretaceae Generalist savanna
Connarus perrottetii (DC.) Planch. Connaraceae Forest
Connarus suberosus Planch. Connaraceae Savanna
Rourea induta Planch. Connaraceae Savanna
Curatella americana L. Dilleniaceae Savanna
Davilla elliptica A.St.-Hil. Dilleniaceae Savanna
Diospyros hispida A.DC. Ebenaceae Generalist savanna

45
Species Family Habitat preference
Sloanea monosperma Vell. Elaeocarpaceae Forest
Sloanea pubescens Benth. Elaeocarpaceae Forest
Sloanea sinemariensis Aubl. Elaeocarpaceae Forest
Erythroxylum engleri O.E.Schulz Erythroxylaceae Savanna
Erythroxylum suberosum A.St.-Hil. Erythroxylaceae Savanna
Erythroxylum testaceum Peyr. Erythroxylaceae Savanna
Erythroxylum tortuosum Mart. Erythroxylaceae Savanna
Alchornea glandulosa Poepp. Euphorbiaceae Generalist forest
Chaetocarpus echinocarpus (Baill.) Ducke Euphorbiaceae Generalist
Croton floribundus Spreng. Euphorbiaceae Generalist forest
Croton piptocalyx Müll.Arg. Euphorbiaceae Forest
Mabea fistulifera Mart. Euphorbiaceae Generalist forest
Mabea paniculata Spruce ex Benth. Euphorbiaceae Forest
Maprounea guianensis Aubl. Euphorbiaceae Generalist savanna
Micrandra elata (Didr.) Müll.Arg. Euphorbiaceae Forest
Pera coccinea (Benth.) Müll.Arg. Euphorbiaceae Forest
Pera glabrata (Schott) Poepp. ex Baill. Euphorbiaceae Generalist savanna
Pera bicolor (Klotzsch) Müll.Arg. Euphorbiaceae Forest
Albizia niopoides (Spruce ex Benth.) Burkart Fabaceae Forest
Anadenanthera peregrina (L.) Speg. Fabaceae Generalist savanna
Andira cujabensis Benth. Fabaceae Generalist savanna
Andira vermifuga Benth. Fabaceae Generalist savanna
Apuleia leiocarpa (Vogel) J.F.Macbr. Fabaceae Forest
Bowdichia virgilioides Kunth Fabaceae Generalist savanna
Copaifera langsdorffii Desf. Fabaceae Generalist
Dalbergia miscolobium Benth. Fabaceae Savanna
Dimorphandra mollis Benth. Fabaceae Savanna
Diplotropis purpurea (Rich.) Amshoff Fabaceae Forest
Dipteryx alata Vogel Fabaceae Generalist savanna
Diptychandra aurantiaca Tul. Fabaceae Generalist savanna
Enterolobium gummiferum (Mart.) J.F.Macbr. Fabaceae Savanna
Holocalyx balansae Micheli Fabaceae Forest
Hymenaea courbaril L. Fabaceae Forest
Hymenaea stigonocarpa Hayne Fabaceae Savanna
Inga heterophylla Willd. Fabaceae Forest
Inga striata Benth. Fabaceae Forest
Inga thibaudiana DC. Fabaceae Forest
Leptolobium dasycarpum Vogel Fabaceae Savanna
Leptolobium elegans Vogel Fabaceae Savanna
Luetzelburgia praecox (Harms) Harms Fabaceae Generalist savanna
Machaerium acutifolium Vogel Fabaceae Generalist savanna
Machaerium brasiliense Vogel Fabaceae Generalist savanna
Mimosa laticifera Rizzini & A.Mattos Fabaceae Savanna
Myroxylon peruiferum L.f. Fabaceae Forest

46
Species Family Habitat preference
Ormosia arborea (Vell.) Harms Fabaceae Forest
Ormosia fastigiata Tul. Fabaceae Forest
Ormosia paraensis Ducke Fabaceae Forest
Peltogyne confertiflora (Hayne) Benth. Fabaceae Generalist savanna
Piptadenia gonoacantha (Mart.) J.F.Macbr. Fabaceae Forest
Plathymenia reticulata Benth. Fabaceae Savanna
Platypodium elegans Vogel Fabaceae Generalist savanna
Pterodon emarginatus Vogel Fabaceae Generalist savanna
Pterodon pubescens (Benth.) Benth. Fabaceae Generalist savanna
Senegalia polyphylla (DC.) Britton Fabaceae Generalist forest
Stryphnodendron adstringens (Mart.) Coville Fabaceae Savanna
Stryphnodendron rotundifolium Mart. Fabaceae Savanna
Tachigali aurea Tul. Fabaceae Savanna
Tachigali vulgaris L.F. Gomes da Silva & H.C.
Lima Fabaceae Generalist
Vatairea macrocarpa (Benth.) Ducke Fabaceae Savanna
Sacoglottis guianensis Benth. Humiriaceae Generalist forest
Emmotum nitens (Benth.) Miers Icacinaceae Generalist savanna
Aegiphila sellowiana Cham. Lamiaceae Forest
Cryptocarya moschata Nees & Mart. Lauraceae Forest
Endlicheria paniculata (Spreng.) J.F.Macbr. Lauraceae Forest
Mezilaurus crassiramea (Meisn.) Taub. ex Mez Lauraceae Generalist savanna
Nectandra cuspidata Nees & Mart. Lauraceae Generalist forest
Nectandra megapotamica (Spreng.) Mez Lauraceae Forest
Ocotea corymbosa (Meisn.) Mez Lauraceae Generalist savanna
Ocotea dispersa (Nees & Mart.) Mez Lauraceae Forest
Ocotea guianensis Aubl. Lauraceae Forest
Ocotea indecora (Schott) Mez Lauraceae Forest
Ocotea leucoxylon (Sw.) Laness. Lauraceae Forest
Cariniana legalis (Mart.) Kuntze Lecythidaceae Forest
Antonia ovata Pohl Loganiaceae Savanna
Strychnos pseudoquina A. St.-Hil. Loganiaceae Savanna
Lafoensia pacari A. St.-Hil. Lythraceae Savanna
Byrsonima basiloba A.Juss. Malpighiaceae Savanna
Byrsonima coccolobifolia Kunth Malpighiaceae Savanna
Byrsonima intermedia A.Juss. Malpighiaceae Generalist forest
Byrsonima pachyphylla A.Juss. Malpighiaceae Savanna
Byrsonima verbascifolia (L.) DC. Malpighiaceae Generalist savanna
Heteropterys byrsonimifolia A.Juss. Malpighiaceae Generalist savanna
Ceiba speciosa (A.St.-Hil.) Ravenna Malvaceae Forest
Eriotheca candolleana (K.Schum.) A.Robyns Malvaceae Forest
Eriotheca globosa (Aubl.) A.Robyns Malvaceae Generalist forest
Eriotheca gracilipes (K.Schum.) A.Robyns Malvaceae Savanna
Eriotheca pubescens (Mart. & Zucc.) Schott & Endl. Malvaceae Generalist savanna

47
Species Family Habitat preference
Guazuma ulmifolia Lam. Malvaceae Forest
Luehea grandiflora Mart. Malvaceae Generalist savanna
Mollia lepidota Spruce ex Benth. Malvaceae Forest
Pseudobombax longiflorum (Mart. & Zucc.)
A.Robyns Malvaceae Generalist
Bellucia grossularioides (L.) Triana Melastomataceae Forest
Miconia albicans (Sw.) Steud. Melastomataceae Savanna
Miconia latecrenata (DC.) Naudin Melastomataceae Forest
Miconia ligustroides (DC.) Naudin Melastomataceae Generalist savanna
Miconia pyrifolia Naudin Melastomataceae Forest
Miconia rubiginosa (Bonpl.) DC. Melastomataceae Savanna
Miconia sp. Melastomataceae Forest
Mouriri apiranga Spruce ex Triana Melastomataceae Forest
Mouriri elliptica Mart. Melastomataceae Savanna
Mouriri pusa Gardner ex Gardner Melastomataceae Savanna
Cabralea canjerana (Vell.) Mart. Meliaceae Forest
Cedrela fissilis Vell. Meliaceae Forest
Guarea guidonia (L.) Sleumer Meliaceae Forest
Guarea kunthiana A.Juss. Meliaceae Forest
Trichilia casaretti C.DC. Meliaceae Forest
Trichilia catigua A.Juss. Meliaceae Forest
Trichilia claussenii C.DC. Meliaceae Forest
Trichilia elegans A.Juss. Meliaceae Forest
Trichilia micrantha Benth. Meliaceae Forest
Trichilia pallida Sw. Meliaceae Forest
Mollinedia widgrenii A.DC. Monimiaceae Forest
Brosimum gaudichaudii Trécul Moraceae Savanna
Brosimum rubescens Taub. Moraceae Forest
Ficus eximia Schott Moraceae Forest
Pseudolmedia laevigata Trécul Moraceae Forest
Virola sebifera Aubl. Myristicaceae Generalist
Campomanesia adamantium (Cambess.) O.Berg Myrtaceae Savanna
Campomanesia xanthocarpa (Mart.) O.Berg Myrtaceae Generalist forest
Eugenia aurata O.Berg Myrtaceae Savanna
Eugenia blastantha (O.Berg) D.Legrand Myrtaceae Forest
Eugenia dysenterica DC. Myrtaceae Generalist savanna
Eugenia florida DC. Myrtaceae Generalist forest
Eugenia gemmiflora O.Berg Myrtaceae Savanna
Eugenia livida O.Berg Myrtaceae Savanna
Eugenia punicifolia (Kunth) DC. Myrtaceae Generalist savanna
Eugenia ternatifolia Cambess. Myrtaceae Savanna
Eugenia uniflora L. Myrtaceae Generalist forest
Myrcia bella Cambess. Myrtaceae Savanna
Myrcia camapuanensis N.Silveira Myrtaceae Savanna

48
Species Family Habitat preference
Myrcia guianensis (Aubl.) DC. Myrtaceae Savanna
Myrcia lanuginosa O.Berg Myrtaceae Savanna
Myrcia multiflora (Lam.) DC. Myrtaceae Generalist savanna
Myrcia rimosa Cambess. Myrtaceae Savanna
Myrcia sp. Myrtaceae Savanna
Myrcia splendens (Sw.) DC. Myrtaceae Generalist savanna
Myrcia tomentosa (Aubl.) DC. Myrtaceae Generalist forest
Myrcia uberavensis O.Berg Myrtaceae Savanna
Myrcia variabilis Mart. ex DC. Myrtaceae Savanna
Myrcia venulosa DC. Myrtaceae Generalist savanna
Myrciaria delicatula (DC.) O.Berg Myrtaceae Savanna
Myrciaria floribunda (H.West ex Willd.) O.Berg Myrtaceae Generalist forest
Neomitranthes glomerata (D.Legrand) Govaerts Myrtaceae Forest
Plinia cauliflora (Mart.) Kausel Myrtaceae Forest
Psidium firmum O.Berg Myrtaceae Savanna
Psidium laruotteanum Cambess. Myrtaceae Savanna
Psidium sp. Myrtaceae Forest
Guapira graciliflora (Mart. ex J.A.Schmidt) Lundell Nyctaginaceae Generalist savanna
Guapira noxia (Netto) Lundell Nyctaginaceae Savanna
Neea theifera Oerst. Nyctaginaceae Savanna
Ouratea discophora Ducke Ochnaceae Forest
Ouratea hexasperma (A. St.-Hil.) Baill. Ochnaceae Savanna
Ouratea spectabilis (Mart. ex Engl.) Engl. Ochnaceae Savanna
Quiina florida Tul. Ochnaceae Forest
Heisteria ovata Benth. Olacaceae Generalist savanna
Minquartia guianensis Aubl. Olacaceae Forest
Agonandra brasiliensis Miers ex Benth. Opiliaceae Generalist savanna
Savia dictyocarpa Müll.Arg. Phyllanthaceae Generalist forest
Gallesia integrifolia (Spreng.) Harms Phytolaccaceae Forest
Cybianthus sp. Primulaceae Forest
Myrsine guianensis (Aubl.) Kuntze Primulaceae Generalist forest
Myrsine umbellata Mart. Primulaceae Generalist
Euplassa inaequalis (Pohl) Engl. Proteaceae Generalist savanna
Roupala montana Aubl. Proteaceae Generalist
Colubrina glandulosa G.Perkins Rhamnaceae Forest
Prunus myrtifolia (L.) Urb. Rosaceae Generalist
Amaioua guianensis Aubl. Rubiaceae Generalist forest
Cordiera sessilis (Vell.) Kuntze Rubiaceae Generalist
Ferdinandusa rudgeoides (Benth.) Wedd. Rubiaceae Forest
Genipa americana L. Rubiaceae Forest
Tocoyena formosa (Cham. & Schltdl.) K.Schum. Rubiaceae Savanna
Metrodorea nigra A. St.-Hil. Rutaceae Forest
Zanthoxylum monogynum A. St.-Hil. Rutaceae Forest
Casearia gossypiosperma Briq. Salicaceae Generalist forest

49
Species Family Habitat preference
Casearia grandiflora Cambess. Salicaceae Generalist forest
Casearia lasiophylla Eichler Salicaceae Generalist savanna
Casearia sylvestris Sw. Salicaceae Generalist
Prockia crucis P.Browne ex L. Salicaceae Forest
Xylosma pseudosalzmanii Sleumer Salicaceae Forest
Cupania vernalis Cambess. Sapindaceae Generalist forest
Magonia pubescens A. St.-Hil. Sapindaceae Generalist savanna
Matayba guianensis Aubl. Sapindaceae Generalist
Matayba sp. Sapindaceae Forest
Chrysophyllum gonocarpum (Mart. & Eichler ex
Miq.) Engl. Sapotaceae Forest
Micropholis venulosa (Mart. & Eichler ex Miq.)
Pierre Sapotaceae Generalist forest
Pouteria ramiflora (Mart.) Radlk. Sapotaceae Generalist
Pouteria sp. Sapotaceae Forest
Pouteria torta (Mart.) Radlk. Sapotaceae Generalist
Schoepfia brasiliensis A.DC. Schoepfiaceae Generalist
Simarouba versicolor A. St.-Hil. Simaroubaceae Generalist savanna
Styrax ferrugineus Nees & Mart. Styracaceae Savanna
Styrax sp. Styracaceae Forest
Cecropia pachystachya Trécul Urticaceae Generalist forest
Urera baccifera (L.) Gaudich. ex Wedd. Urticaceae Generalist forest
Callisthene fasciculata Mart. Vochysiaceae Generalist savanna
Qualea cordata Spreng. Vochysiaceae Generalist savanna
Qualea grandiflora Mart. Vochysiaceae Savanna
Qualea multiflora Mart. Vochysiaceae Savanna
Qualea parviflora Mart. Vochysiaceae Savanna
Salvertia convallariodora A. St.-Hil. Vochysiaceae Savanna
Vochysia cinnamomea Pohl Vochysiaceae Savanna
Vochysia rufa Mart. Vochysiaceae Savanna
Vochysia tucanorum Mart. Vochysiaceae Savanna
Vochysia vismiifolia Spruce ex Warm. Vochysiaceae Forest

50
Table S3 Number of species sampled to each site of seasonal forests and savannas
environments in the Brazilian Cerrado. Density ≤ 3 represents the number and
percentage of species with individual density equal or less that three individuals in each
site, and density ≥ 4 denotes the number and percentage (in parentheses) of species with
individual density equal or greater that four individuals in each site.
Site Number of species density ≤ 3 density ≥ 4
Forest
Assis Ecological State - SP 39 31 (79) 8 (21)
Vassununga State Park - SP 31 18 (58) 13 (42)
Emas National Park - GO 21 15 (71) 6 (29)
Jataí – GO 29 12 (41) 17 (59)
Bacaba Park - MT 28 16 (57) 12 (43)
Ribeirão Cascalheira - MT 52 20 (38) 32 (62)
Savanna
Assis Ecological State - SP 44 16 (36) 28 (64)
Vassununga State Park - SP 47 16 (34) 31 (66)
Emas National Park - GO 51 34 (67) 17 (33)
Jataí – GO 43 7 (16) 36 (84)
Bacaba Park - MT 90 15 (17) 74 (83)
Ribeirão Cascalheira - MT 66 24 (36) 42 (64)
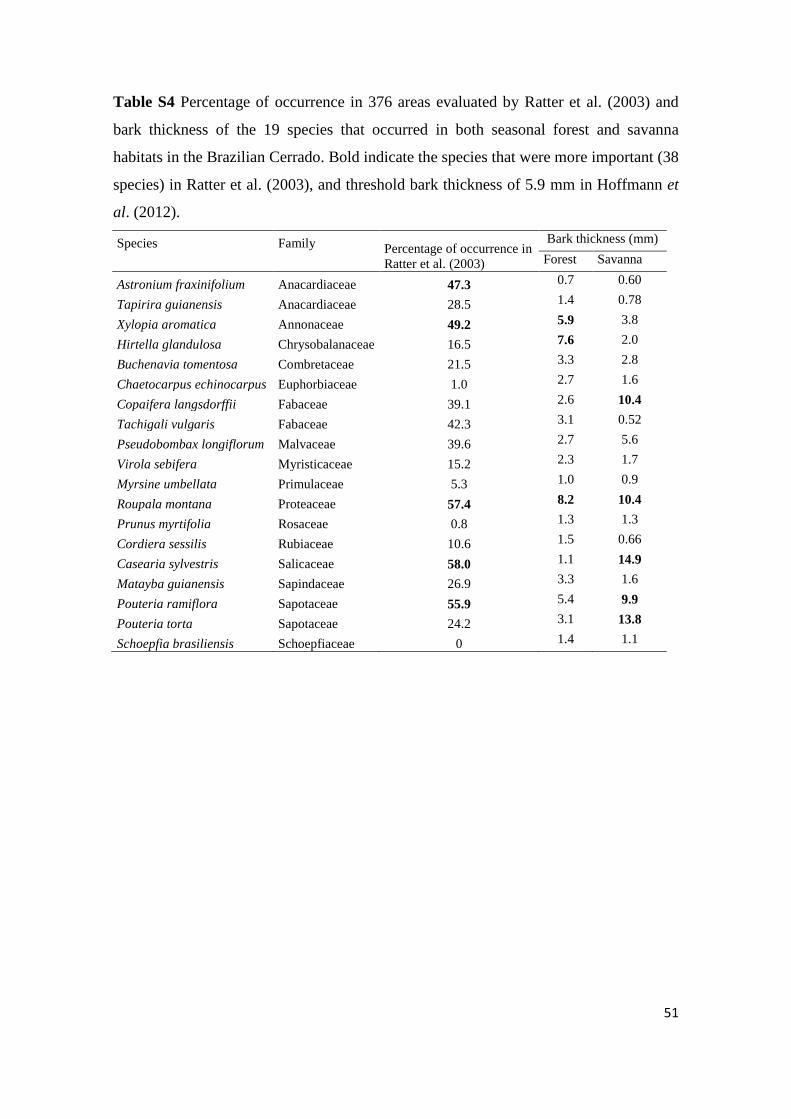
51
Table S4 Percentage of occurrence in 376 areas evaluated by Ratter et al. (2003) and
bark thickness of the 19 species that occurred in both seasonal forest and savanna
habitats in the Brazilian Cerrado. Bold indicate the species that were more important (38
species) in Ratter et al. (2003), and threshold bark thickness of 5.9 mm in Hoffmann et
al. (2012).
Species Family Percentage of occurrence in
Ratter et al. (2003)
Bark thickness (mm)
Forest Savanna
Astronium fraxinifolium Anacardiaceae 47.3 0.7 0.60
Tapirira guianensis Anacardiaceae 28.5 1.4 0.78
Xylopia aromatica Annonaceae 49.2 5.9 3.8
Hirtella glandulosa Chrysobalanaceae 16.5 7.6 2.0
Buchenavia tomentosa Combretaceae 21.5 3.3 2.8
Chaetocarpus echinocarpus Euphorbiaceae 1.0 2.7 1.6
Copaifera langsdorffii Fabaceae 39.1 2.6 10.4
Tachigali vulgaris Fabaceae 42.3 3.1 0.52
Pseudobombax longiflorum Malvaceae 39.6 2.7 5.6
Virola sebifera Myristicaceae 15.2 2.3 1.7
Myrsine umbellata Primulaceae 5.3 1.0 0.9
Roupala montana Proteaceae 57.4 8.2 10.4
Prunus myrtifolia Rosaceae 0.8 1.3 1.3
Cordiera sessilis Rubiaceae 10.6 1.5 0.66
Casearia sylvestris Salicaceae 58.0 1.1 14.9
Matayba guianensis Sapindaceae 26.9 3.3 1.6
Pouteria ramiflora Sapotaceae 55.9 5.4 9.9
Pouteria torta Sapotaceae 24.2 3.1 13.8
Schoepfia brasiliensis Schoepfiaceae 0 1.4 1.1
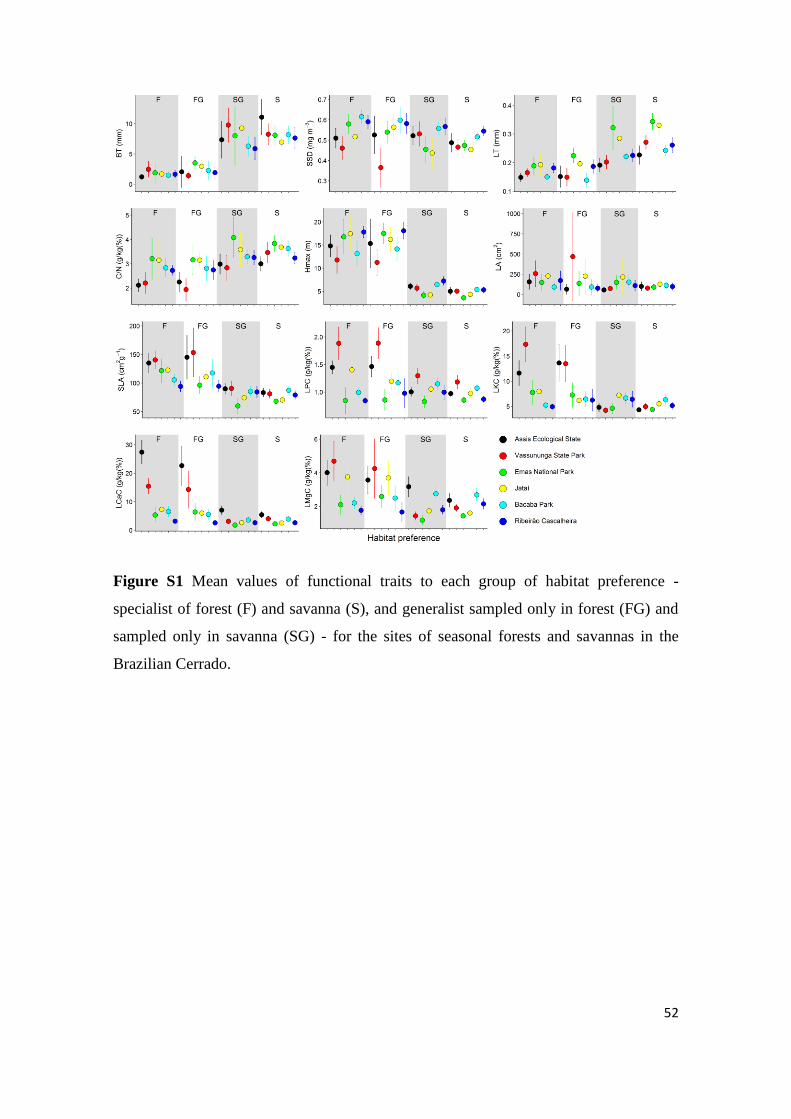
52
Figure S1 Mean values of functional traits to each group of habitat preference -
specialist of forest (F) and savanna (S), and generalist sampled only in forest (FG) and
sampled only in savanna (SG) - for the sites of seasonal forests and savannas in the
Brazilian Cerrado.

53
CAPÍTULO II
Formatado nas normas da revista:
Journal of Vegetation Science

54
Edaphic properties drive functional trait patterns in savannas and
seasonal forests plant communities of the Cerrado
Leandro Maracahipes, Marcos B. Carlucci & Marcus V. Cianciaruso
Key-words
acquisitive strategies, conservative strategies, soil nutrients, edaphic gradients, leaf
nutrient content
Maracahipes, L. ([email protected])1
Cianciaruso, M.V. (corresponding author, [email protected])1
Carlucci, M.B. ([email protected])1,2
1Departamento de Ecologia, Instituto de Ciências Biológicas, Universidade Federal de
Goiás, Goiânia, Goiás, CP 131, 74001-970, Brazil.
2Departamento de Botânica, Setor de Ciências Biológicas, Universidade Federal do
Paraná, CP 19031, Curitiba, PR 81531-980, Brazil.

55
Abstract
Question: Do gradients in soil fertility and toxicity drive shifts in density of individuals
and community trait means in savannas and seasonal forests? Are communities with
conservative traits associated with poor soils and communities with acquisitive traits
associated with more fertile soils?
Location: Savannas and seasonal forests plant communities in the Cerrado
phytogeographic domain, in Brazil.
Methods: We measured seven functional traits from 286 species occurring in 120 plots
distributed in six forest and savanna sites throughout the Cerrado. In each vegetation,
we recorded tree and shrub species and collected surface soil samples in 10 200-m2
plots. We measured maximum plant height (Hmax), leaf area (LA), specific leaf area
(SLA), leaf phosphorous content (LPC), stem-specific density (SSD), leaf thickness
(LT), and leaf carbon-nitrogen ratio (C/N) to compute community-weighted means for
each trait. We used linear regressions to model community trait means and density of
individuals by edaphic gradients.
Results: We found lower density of individuals in more fertile soils in forests and
savannas. In forests communities, our results suggest that an acquisitive strategy is
related to toxicity (lower LA, SLA and PLC in more toxic soils) and fertility (high
Hmax and LA in richer soils) gradients, and that a conservative strategy is related to
toxicity gradient (high SSD and C/N in more toxic soils). In savanna communities, the
patterns were less evident, with fewer traits indicating a strategy of resource acquisition
(high LA in richer soils) or a strategy of resource conservation (high LT in toxic soil).
Conclusions: We brought evidence that forest and savanna species indeed adopt
different strategies related to resource use in contrasting communities of the Cerrado

56
domain. We highlighted that density of individuals and community trait means shift
along edaphic gradients in savannas and seasonal forest plant communities in the
Cerrado domain. We show a stronger negative relationship of density of individuals
with fertility and toxicity gradient, that could be result of dominance of some species
with high competitive ability. For community trait mean, we demonstrate that in plots
with fertile soils and less toxic have species with traits related to fast acquisitive
strategy of resources, while in soil more toxic and with low fertility have species with
traits related to conservative strategy.
Introduction
Understanding what are the processes and factors determining ecological strategies
plants use to respond to abiotic and biotic factors and their consequences to community
composition, structure and functioning is a fundamental goal in vegetation science
(McGill et al. 2006; Vellend 2010). In order to coexist, species often adopt different
strategies of growth and reproduction (Oliveras & Malhi 2016) leading to a trade-off
between rapid acquisition and resource conservation strategies (Diaz et al. 2004; Poorter
2009). Such a trade-off may be assessed by evaluating the distribution of traits along
environmental gradients at the community scale (Goodland & Pollard 1973; Furley &
Ratter 1988; Ordoñez et al. 2009; Baxendale et al. 2014). Therefore, exploring the role
of environmental gradients on different traits (Lavorel & Garnier 2002; Carvalho &
Batalha 2013; Wigley et al. 2016) is key to understanding vegetation dynamics in
contrasting environments such as forests and savannas.
Several studies have highlighted that edaphic properties strongly influence plant
community structure (Wright et al. 2004; de Bello et al. 2006; Dantas & Batalha 2011;
Zava & Cianciaruso 2014; Laureto & Cianciaruso 2015; Barros et al. 2015; Moraes et
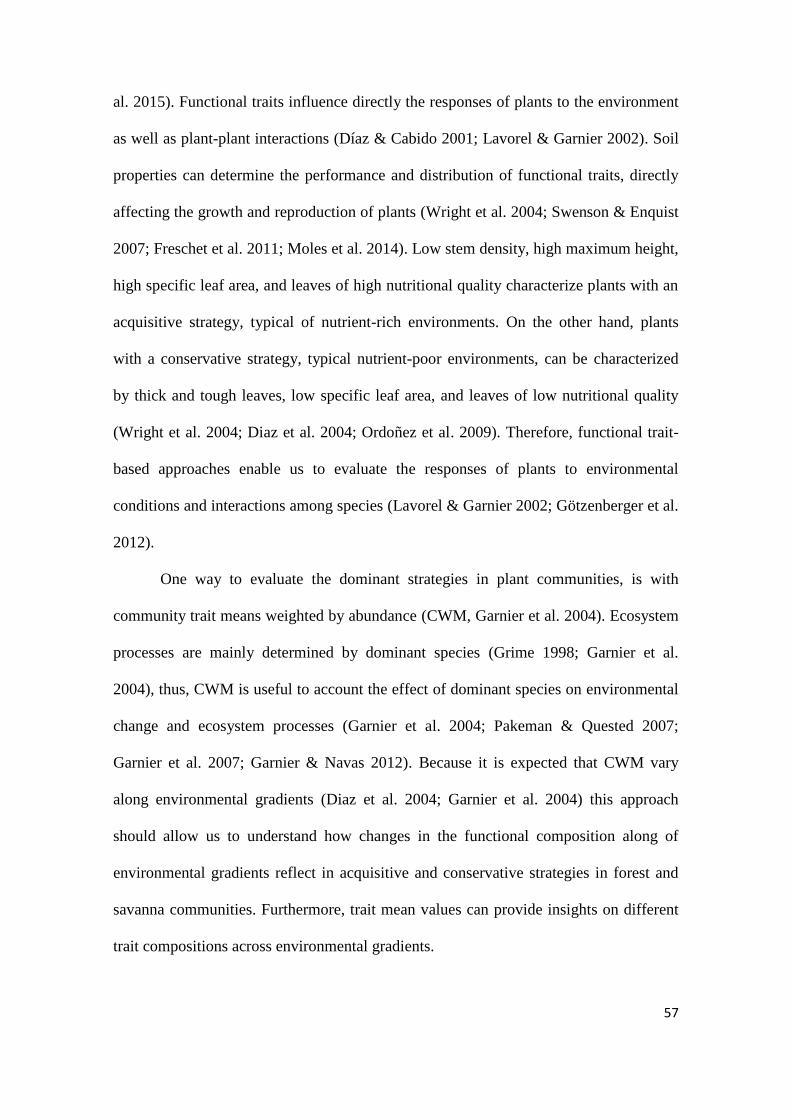
57
al. 2015). Functional traits influence directly the responses of plants to the environment
as well as plant-plant interactions (Díaz & Cabido 2001; Lavorel & Garnier 2002). Soil
properties can determine the performance and distribution of functional traits, directly
affecting the growth and reproduction of plants (Wright et al. 2004; Swenson & Enquist
2007; Freschet et al. 2011; Moles et al. 2014). Low stem density, high maximum height,
high specific leaf area, and leaves of high nutritional quality characterize plants with an
acquisitive strategy, typical of nutrient-rich environments. On the other hand, plants
with a conservative strategy, typical nutrient-poor environments, can be characterized
by thick and tough leaves, low specific leaf area, and leaves of low nutritional quality
(Wright et al. 2004; Diaz et al. 2004; Ordoñez et al. 2009). Therefore, functional trait-
based approaches enable us to evaluate the responses of plants to environmental
conditions and interactions among species (Lavorel & Garnier 2002; Götzenberger et al.
2012).
One way to evaluate the dominant strategies in plant communities, is with
community trait means weighted by abundance (CWM, Garnier et al. 2004). Ecosystem
processes are mainly determined by dominant species (Grime 1998; Garnier et al.
2004), thus, CWM is useful to account the effect of dominant species on environmental
change and ecosystem processes (Garnier et al. 2004; Pakeman & Quested 2007;
Garnier et al. 2007; Garnier & Navas 2012). Because it is expected that CWM vary
along environmental gradients (Diaz et al. 2004; Garnier et al. 2004) this approach
should allow us to understand how changes in the functional composition along of
environmental gradients reflect in acquisitive and conservative strategies in forest and
savanna communities. Furthermore, trait mean values can provide insights on different
trait compositions across environmental gradients.

58
In Neotropical savannas different habitats, such as savannas and seasonal
forests, occur side by side under the same climate (Oliveras & Malhi 2016). The
occurrence of such contrasting environments under the same climatic conditions has
been identified as an effect of spatial variation in soil nutrient availability (Ruggiero et
al. 2002). Several nutrients play important roles in the structure and composition of
these communities (Furley & Ratter 1988; Ruggiero et al. 2002; Dantas & Batalha
2011; Pellegrini 2016). In savannas, an important determinant of the structure and
composition of communities is related to the ability of acquisition of soil nutrients and
water by plants (Oliveira et al. 2005). Many savanna species have a root system that
enable them to extract nutrients and water from great depths (Goedert 1983). While high
soil aluminum concentration may inhibit nutrients absorption by plants, being toxic for
many forest species, savanna species are usually adapted to high levels of aluminum
and some are even aluminum accumulators (Furley & Ratter 1988). Soil moisture, fire,
and competition for nutrients determine plant density in savannas (Furley & Ratter
1988; Marimon Junior & Haridasan 2005). High frequency of fire can turn savannas
into grasslands, while fire exclusion may lead to the development of seasonal forests
(Hoffmann et al. 2012). On the other hand, forest habitats often have higher soil nutrient
availability that favours tree growth, because plants with strategy of fast growth can
avoid light limitation in the understory (Ruggiero et al. 2002; Hoffmann et al. 2012;
Oliveras & Malhi 2016). Moreover, resource availability together with disturbance
regimes have been appointed as a determining factor for the occurrence of forest and
savanna habitats under same climate (Dantas et al. 2016).
We answered the following questions to each study habitat (forest and savanna):
(i) Do gradients in soil fertility and toxicity reduce the number of individuals in
seasonal forests and savannas? (ii) Do gradients in soil fertility and toxicity drive shifts

59
in community trait means? Our expectation is that communities with higher soil fertility
and lower toxicity will have higher mean values of maximum plant height (Hmax), leaf
area (LA), specific leaf area (SLA), leaf phosphorous content (LPC), but lower mean
values of stem-specific density (SSD), leaf thickness (LT) and leaf carbon-nitrogen ratio
(C/N), reflecting a dominance of species with rapid acquisition strategy (Westoby 1998;
Pérez-Harguindeguy et al. 2013; Wigley et al. 2016). On the other hand, communities in
soils with low fertility and high toxicity, we expect to observe lower mean values of
Hmax, LA, SLA and LPC, but high mean values of SSD, LT and C/N, reflecting a
conservative strategy (Table 1). Furthermore, forest environments with high fertility and
low toxicity may promote the establishment of species with fast growth and better
competitive ability, reducing the number of individuals by competitive exclusion
(Mayfield & Levine 2010; Dantas & Batalha 2011; Carvalho & Batalha 2013).

60
Table 1. Functional significance of traits and trait-based patterns predicted in relation to edaphic gradients in forests and savannas of the Cerrado.
Trait
Acronym Functional significance Prediction
References
Maximum
plant height
Hmax Competitive plant fitness, plant
fecundity, tolerance or resistance to
disturbances.
We expected that trees in more fertile soil will be taller. Considering
that soils richer in nutrients support higher plant biomass, the variation
of Hmax along soil gradients may be related to a trade-off between
resource conservation and competitive ability.
(Westoby 1998; Pérez-
Harguindeguy et al. 2013;
Laureto & Cianciaruso 2015)
Leaf area LA Strategies of resource acquisition and
use. Ecological strategy adopted with
respect to environmental nutrients stress
and disturbances.
Leaf area has consequences for the leaf energy and water balance. We
expected that plants present high leaf area in more fertile habitats than
infertile habitats. The slower growth of plants on infertile soils can
favor a smaller investment in leaf area, which minimizes water loss.
(McDonald et al. 2003; Pérez-
Harguindeguy et al. 2013)
Specific leaf
area
SLA Related to structural defense, resource
uptake and use efficiency and growth
strategies; negatively correlated with
leaf lifespan.
We expected that communities in resource-rich environments have
higher SLA than in poor habitats. This reflects the trade-off between
fast growth and nutrient conservation, and is related with leaf nitrogen
concentration. This indicate that environments with fertile soils provide
rapid resource capture and high relative growth, while the opposite is
expected for a conservative strategy.
(Wright et al. 2004; Pérez-
Harguindeguy et al. 2013)
Leaf
phosphorus
content
LPC Phosphorous is a limiting resource
related to growth and productivity in
plants.
We expected that plants in more fertile soils show higher nutrients
concentrations in their leaves. Fertile soils are generally associated
with high nutritional quality and plant growth due to higher soil
phosphorous availability.
(Schachtman et al. 1998;
Lloyd et al. 2009; Ordoñez et
al. 2009; Pérez-Harguindeguy
et al. 2013)
Stem-specific
density
SSD Structural vigor, and consequent
resistance to physical damage.
We expected to find a negative relationship between SSD and soil
fertility. This relation is associated to the growth-survival trade-off, in
which low stem density (with large vessels) leads to a fast growth,
because of large hydraulic capacity and conductive tissue is less
expensive to construct, whereas a high stem density (with small
vessels) leads to a high survival by providing a stronger defense against
physical and biological damage.
(Baker et al. 2004; Chave et
al. 2006; Lloyd et al. 2009;
Chave et al. 2009; Pérez-
Harguindeguy et al. 2013)
Leaf
thickness
LT Related to species strategies of resource
acquisition and use, and with resistance
to physical damage, correlated with leaf
toughness.
LT is one of the key components of SLA and photosynthetic capacity,
and predict that LT should be higher in less fertile habitats, because
balancing photosynthetic benefits against C costs of respiration and
transpiration. Besides, LT indicates the largest relative carbon
investment in structural protection of photosynthetic tissues.
(Vile 2005; Pérez-
Harguindeguy et al. 2013)
Leaf carbon-
nitrogen ratio
C/N Nutritional quality and palatability of
plant, leaf decomposition rate, N is the
major limiting macronutrient in plants.
We expected a negative relationship between C/N ratio and soil
fertility. In less-fertile soils high values of this ratio suggest a resource
conservation strategy. Moreover, more fertile soils tend to present soil
organic matter, and this might enhance the nitrogen absorption by
plants, thereby increasing the nitrogen content in the leaves of plants in
more fertile soils.
(Ordoñez et al. 2009; Pérez-
Harguindeguy et al. 2013;
Apaza-Quevedo et al. 2015)

61
Material and Methods
Study region
The Cerrado is a phytogeographical domain characterized by complex vegetational
mosaics (Ribeiro & Walter 2008) composed by savannas, seasonal forests and tropical
grasslands (Batalha 2011; Dantas et al. 2016). The Cerrado receives strong floristic
influence of the neighboring phytogeographical domains of Amazônia, Mata Atlântica
and Caatinga (Méio et al. 2003; Souza-Neto et al. 2016). The great variety of habitats,
ranging from grasslands to forests, can result from the diverse climatic conditions,
edaphic properties and fire frequency registered throughout the phytogeographical
domains (Oliveira-Filho & Ratter 2002; Dantas et al. 2013).
Sampling design
We surveyed six regions located throughout the Cerrado domain in order to capture a
great range of phytogeographical variation. We adopt a paired design sampling one
savanna (cerrado stricto sensu) and one forest (seasonally dry forest) site in each region
(Fig. 1). Average distance between sites was 12 km, and the latitudinal range varied
from 12°S to 22°S (Fig. 1 and Table S1). The smallest distance between regions was
150 km (between Emas National Park and Jataí), while the smallest distance within
pairs of forest and savanna blocks was 1 km (in Emas National Park). In general, the
mean values and coefficient of variation of the edaphic characteristics varied little
between the plots of either forests or savannas at each site (Table S2).

62
Figure 1. Location of six study regions with seasonal forest and savanna sites in the
Brazilian Cerrado. 1. Assis Ecological Station (lat/long: 22°35’S/50°22’W), 2.
Vassununga State Park (21°36’S/47°37’W), 3. Emas National Park (17°54’S/52°59’W),
4. Jataí (17°45’S/51°32’W), 5. Bacaba Park (14°42’S/52°21’W), 6. Ribeirão
Cascalheira (12°49’S/51°46’W).
In each savanna and forest site we sampled all tree- and shrubs in 10 100-m2
plots. In savanna plots we recorded all individuals with diameter at ground height ≥ 5
cm, whereas in forest plots all individuals with diameter at breast height ≥ 10 cm were
sampled. All individuals were identified following the Angiosperm Phylogeny Group

63
classification (APG-IV 2016). Additionally, we revisited the species names in the
Brazilian Flora (Forzza et al. 2012).
Trait sampling
We measured the following traits at species-level according to Pérez-Harguindeguy et
al. (2013): maximum plant height (Hmax), leaf area (LA), specific leaf area (SLA), leaf
nutrient content of phosphorous (LPC), leaf thickness (LT), stem specific density (SSD)
and carbon/nitrogen ratio (C/N) (see Table 1 for their ecological significance).
Whenever possible we measured 10 individuals for each species in each site. When a
given species had less than 10 individuals in our plots, we sampled individuals that were
nearby the plot. When that was not possible we included all individuals that were
available (see Table S3). LPC and C/N were measured for three individuals of each
species in each site. To obtain the values of leaf traits, first we scanned five leaves of
each individual, and posteriorly calculated area leaf through of a script that we build
using the “EBImage” package (Pau et al., 2014) with R 3.2.1 (http://www.R-
project.org). After scanning, the leaves were dried at 80 °C for 48 h to acquire leaf dry
mass. Other five leaves were utilized to calculate the leaf thickness values using a
digital micrometer. All traits were collected during the rainy season (December to
March 2011-2012), which represents the period of maximum leaf expansion and
maturity and growth and reproductive peak for most of the studied plants (Lenza &
Klink 2006).
Edaphic variables
Composite soil samples (0-10 cm depth) were collected in all forest and savanna plots
(three samples per plot). We obtained the following soil variables (Embrapa 1999): clay

64
concentration, pH, soil organic matter (SOM), phosphorus concentration (P), nitrogen
concentration (N), exchangeable contents of K+ and Al
3+.
Spatial autocorrelation
Our aim was to evaluate the role of fertility gradient on community trait means of plant
communities. Communities at short distances from one another tend to be more similar
than distant communities (Hawkins 2012) due to shared historical processes and
spatially-structured biological processes such as dispersal and species interactions
(Peres-Neto & Legendre 2010). Therefore, response variables such as community trait
means may be structured in the space, which affect statistical assumptions such as
independence of residuals (Legendre 1993).
In order to take the spatial autocorrelation into account in our analysis we used
the method of principal coordinates of neighbourhood matrices (PCNM) (Borcard &
Legendre 2002). The PCNM is based on a PCoA of geographical coordinates truncated
by distance in order to generate axes (spatial filters) representing vectors of spatial
variation at increasing scales. Here, we used the spatial filters as explanatory variables
together with the environmental predictors to minimize the residual autocorrelation
(Rangel et al. 2006). These analyses were conducted at the plot level and the truncation
distance that represent the maximum distance connecting all communities, which
defines the neighbourhood boundaries (Rangel et al. 2006), was 5.5 km for forest plots
and 2.5 km for savanna plots. We conducted the PCNM analyses in software SAM 4.0
(Rangel et al. 2006).

65
Statistical analyses
All analyses were performed separately at the plot level for each of communities of
forests (60 plots) and savannas (60 plots). To reduce the dimensionality of edaphic
parameters we computed principal component analysis (PCA). The number of
components retained for further analyses was determined on the basis of the broken
stick criteria, in which the eigenvalue must be greater than the values of broken stick
eigenvalue (Frontier 1976). Moreover, we evaluated the effect of each variable on each
principal component (PC) through bootstrap randomization in the software Past
(Hammer et al. 2001). These analyses were conducted separately for forest (Fig. S1) and
savanna plots (Fig. S2).
Initially, we seek to understand if the fertility and toxicity gradients determine
the density of individuals of the communities of forest and savannas. We related the
density of individuals with edaphic gradients controlling the spatial autocorrelation of
predictors variables through spatial filters.
In order to evaluate shifts of trait means at the community level along the
gradient, we computed community-weighted trait means (CWM), defined as the mean
traits values present in the community weighted by the relative abundance of species
(Garnier et al. 2004).
To investigate the shifts of community trait means along the edaphic gradient,
we fitted a linear regression analysis (ordinary least squares - OLS) with PC1, PC2 and
PCNM (spatial filters) as predictors variables (Rangel et al. 2006; Peres-Neto &
Legendre 2010). Spatial filters were used as predictor variables to account for spatial
autocorrelation in residuals. When necessary, we used an algorithm that added the
spatial filter that accounted for the most of the spatial autocorrelation in the residuals
remaining in the model, repeating this process until the autocorrelation in the residuals
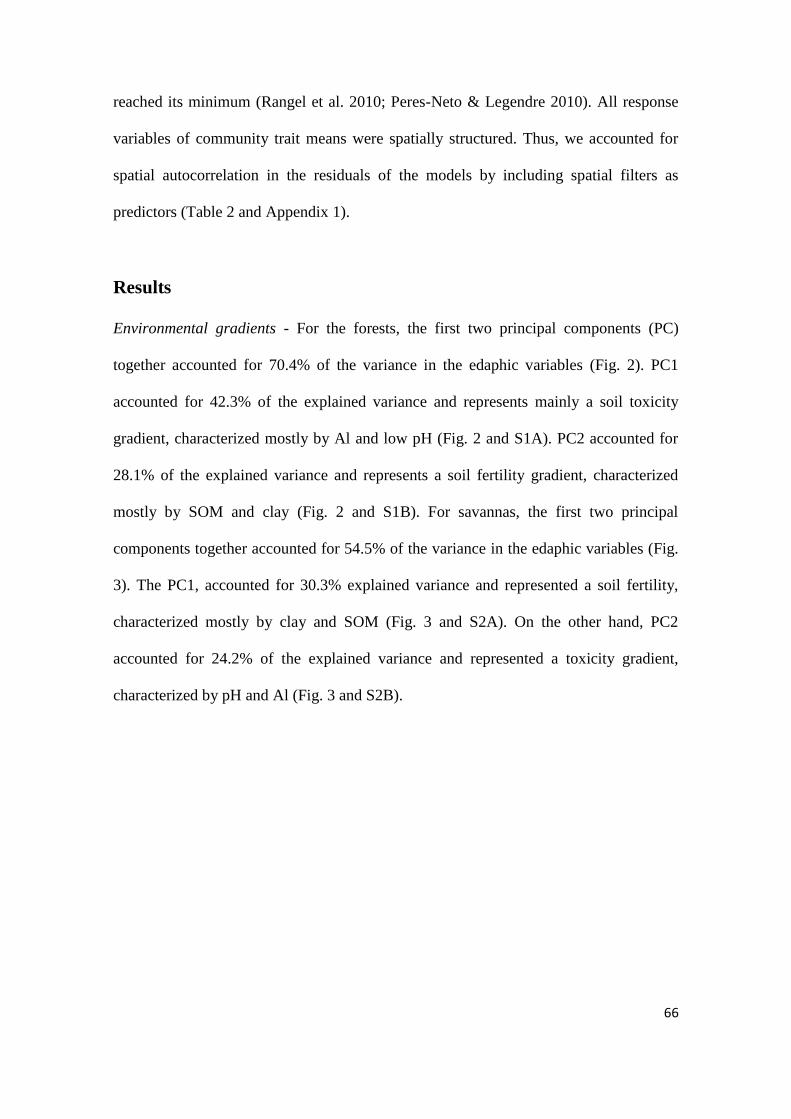
66
reached its minimum (Rangel et al. 2010; Peres-Neto & Legendre 2010). All response
variables of community trait means were spatially structured. Thus, we accounted for
spatial autocorrelation in the residuals of the models by including spatial filters as
predictors (Table 2 and Appendix 1).
Results
Environmental gradients - For the forests, the first two principal components (PC)
together accounted for 70.4% of the variance in the edaphic variables (Fig. 2). PC1
accounted for 42.3% of the explained variance and represents mainly a soil toxicity
gradient, characterized mostly by Al and low pH (Fig. 2 and S1A). PC2 accounted for
28.1% of the explained variance and represents a soil fertility gradient, characterized
mostly by SOM and clay (Fig. 2 and S1B). For savannas, the first two principal
components together accounted for 54.5% of the variance in the edaphic variables (Fig.
3). The PC1, accounted for 30.3% explained variance and represented a soil fertility,
characterized mostly by clay and SOM (Fig. 3 and S2A). On the other hand, PC2
accounted for 24.2% of the explained variance and represented a toxicity gradient,
characterized by pH and Al (Fig. 3 and S2B).

67
PC1 (42.3% explained variance)
-5 -4 -3 -2 -1 0 1 2 3
PC
1 (
28.1
% e
xpla
ined
var
iance
)
-3
-2
-1
0
1
2
3Vassununga State Park - SP
Assis Ecological Station - SP
Emas National Park - GO
Jataí - GO
Bacaba Park - MT
Ribeirão Cascalheira - MT
P
pH
K
SMO
Clay
Al
Toxicity gradient
Fer
tili
ty gra
die
nt
N
Figure 2. Distribution of the plots and sites of seasonal forests along the two axes of a
principal component analysis (PCA) based on ten edaphic properties. Each principal
component represents a soil gradient: PC1, toxicity gradient, and PC2, fertility gradient.
Different symbols and colors represent different sites.
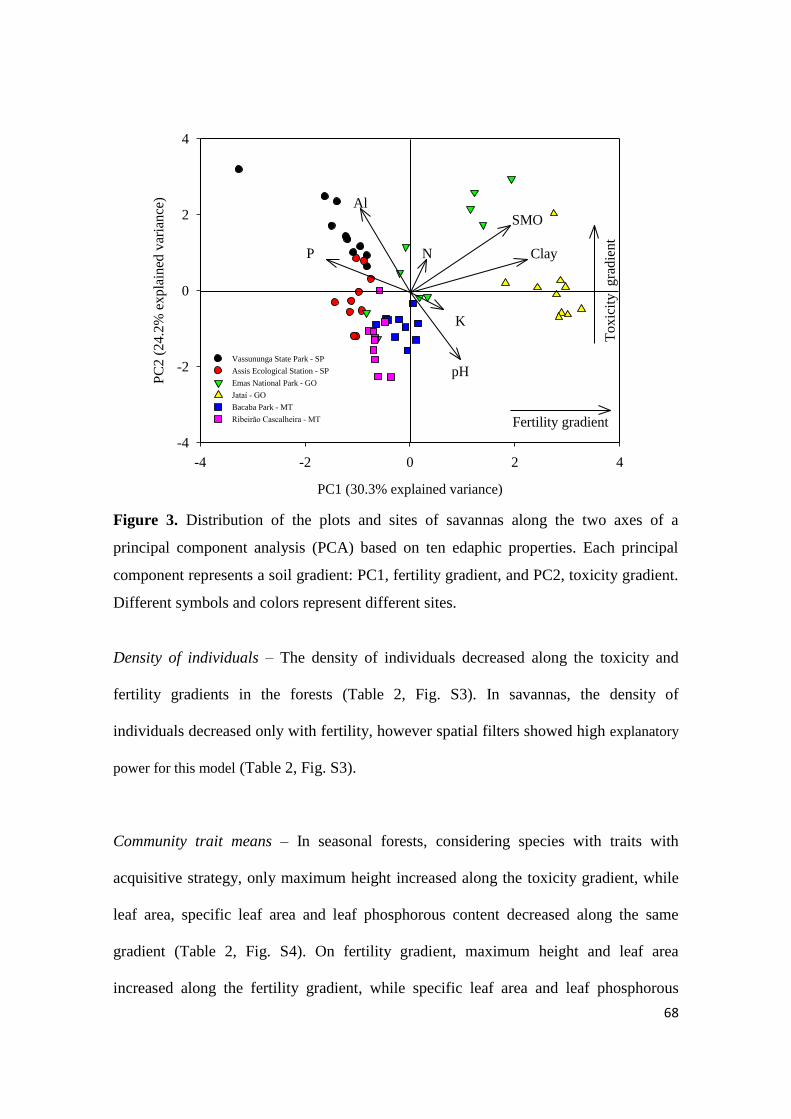
68
PC1 (30.3% explained variance)
-4 -2 0 2 4
PC
2 (
24.2
% e
xpla
ined
var
iance
)
-4
-2
0
2
4
Vassununga State Park - SP
Assis Ecological Station - SP
Emas National Park - GO
Jataí - GO
Bacaba Park - MT
Ribeirão Cascalheira - MT
pH
K
ClayN
Al
P
Fertility gradient
Toxic
ity gra
die
nt
SMO
Figure 3. Distribution of the plots and sites of savannas along the two axes of a
principal component analysis (PCA) based on ten edaphic properties. Each principal
component represents a soil gradient: PC1, fertility gradient, and PC2, toxicity gradient.
Different symbols and colors represent different sites.
Density of individuals – The density of individuals decreased along the toxicity and
fertility gradients in the forests (Table 2, Fig. S3). In savannas, the density of
individuals decreased only with fertility, however spatial filters showed high explanatory
power for this model (Table 2, Fig. S3).
Community trait means – In seasonal forests, considering species with traits with
acquisitive strategy, only maximum height increased along the toxicity gradient, while
leaf area, specific leaf area and leaf phosphorous content decreased along the same
gradient (Table 2, Fig. S4). On fertility gradient, maximum height and leaf area
increased along the fertility gradient, while specific leaf area and leaf phosphorous

69
content decreased along the same gradient (Table 2, Fig. S4). Considering species with
traits with conservative strategy, stem-specific density and carbon/nitrogen ratio
increased along the toxicity gradient (Table 2, Fig. S4). While, stem-specific density,
leaf thickness and carbon/nitrogen ratio also increased along the fertility gradient (Table
2, Fig. S4).
In savannas, the fertility gradient was more important than toxicity to
community trait mean. Only leaf thickness increased along the toxicity gradients
considering conservative strategy (Table 2, Fig. S5). Considering traits with acquisitive
strategy, maximum height increased along the fertility gradient, while leaf area
decreased along the same gradient (Table 2, Fig. S5). While considering conservative
strategy, only leaf thickness increased along the fertility gradient (Table 2, Fig. S5). The
others traits were significant with edaphic gradient (Table 2, Fig. S5).

70
Table 2. Models of linear regression analysis for toxicity and fertility gradients in seasonal forests and savannas in the Brazilian Cerrado. Spatial filters (F) were
computed using principal coordinates of neighbourhood matrices (PCNM; Peres-Neto & Legendre 2010) and were included in each model as predictors to account
for spatial autocorrelation in the residuals. The variables toxicity and fertility are principal component from PCA computed separately for seasonal forest and
savannas. Numbers stressed in bold indicate significant regression coefficients (β) with p < 0.05 and with explanatory power of predictors ≥ 0.19.
Model toxicity - β fertility - β R2 P model predictors shared filters
Density of individuals
Forest density ~ toxicity + fertility + F1 + F5 -0.31 -0.73 0.52 0.001 0.45 -0.09 0.18
Savanna density ~ fertility + toxicity + F2 + F3 + F4 + F5 + F6 0.11 -0.69 0.80 0.001 0.27 0.16 0.40
Community-weighted means
Forest - acquisitive strategy Hmax ~ toxicity + fertility + F1 + F2 0.60 0.34 0.36 0.001 0.23 -0.07 0.23
LA ~ toxicity + fertility + F1 -0.35 0.33 0.38 0.001 0.23 -0.04 0.21
SLA ~ toxicity + fertility + F3 -0.48 -0.25 0.64 0.001 0.29 0.20 0.16
LPC ~ toxicity + fertility + F3 + F4 + F5 -0.58 -0.21 0.91 0.001 0.27 0.44 0.21
Forest - conservative strategy SSD ~ toxicity + fertility + F3 0.44 0.15 0.82 0.001 0.21 0.36 0.26
LT ~ toxicity + fertility + F1 + F2 + F3 0.27 0.73 0.52 0.001 0.43 -0.17 0.29
C/N ~ toxicity + fertility + F2 + F3 0.71 0.59 0.75 0.001 0.48 0.16 0.11
Savanna - acquisitive strategy Hmax ~ fertility + toxicity + F2 + F3 + F5 -0.16 -0.71 0.84 0.001 0.45 0.19 0.21
LA ~ fertility + toxicity + F2 + F4 -0.15 0.43 0.51 0.001 0.19 0.06 0.29
SLA ~ fertility + toxicity + F2 + F4 + F5 -0.05 -0.38 0.81 0.001 0.13 0.18 0.51
LPC ~ fertility + toxicity + F2 + F3 + F5 -0.04 0.16 0.90 0.001 0.02 0.16 0.74
Savanna - conservative strategy SSD ~ fertility + toxicity + F1 -0.29 0.14 0.74 0.001 0.10 0.40 0.25
LT ~ fertility + toxicity + F2 + F4 + F5 0.22 0.53 0.86 0.001 0.28 0.30 0.29
C/N ~ fertility + toxicity + F2 + F3 -0.01 0.02 0.86 0.001 0.01 0.25 0.63

71
Discussion
In general, our results support that forest and savanna plants have different strategies
related to rapid acquisition and conservative strategy of resources. We showed that
communities with more toxic soil determined lower density of individuals in forest. In
contrast, more fertile soils determined lower density of individuals in forest and savanna
environments. For community trait mean, traits values were more sensible to shift in
fertility gradient than toxicity gradient, mainly in forest environments. These different
strategies (rapid acquisitive and conservative) observed are responses of traits in
relation to resources acquisition for establish and develop in environments with
different light and soil resources availability as seasonal forest and savanna (Reich et al.
1999; Diaz et al. 2004; Svenning et al. 2004; Apaza-Quevedo et al. 2015; Wigley et al.
2016).
Density of individuals
Density of individuals decreased with the increasing in soil fertility and toxicity in
forest communities. This could be related to high competitive ability of some species,
that on fertile soils become dominant producing a larger canopy cover, avoiding the
establishment or excluding others species (Carvalho & Batalha 2013; Martorell et al.
2015). In theory, a greater resource available in the soil tend to promote species
coexistence through resources partitioning (Barot 2004; Dantas & Batalha 2011), as
even forest species are adapted to experience habitats with certain nutrient limitation
conditions (Furley & Ratter 1988), which would lead sites with more richer soils for
have high competitive effect resulting in low density of individuals. Neri et al. (2012)
also showed a negative relationship between density of individuals and aluminium in
the soil from savanna-woodland. Al is the main element indicator of toxicity in our

72
study system (Goodland & Pollard 1973) because it compete with other essential
elements for absorption sites (Wagatsuma 1983). Thus, even with many Al-tolerant
species, in general the aluminium toxicity may act on establishment of species,
determining a lower density of plants.
Community-level trait shifts
Generally, higher values of leaf nutrient content, SLA, large leaves (Ruggiero et al.
2002; Carvalho & Batalha 2013; Wigley et al. 2016), and tall plants (Westoby 1998;
Schamp & Aarssen 2009) grow fast and have a great competitive ability, thus being
related to rapid acquisition of resources. On the other hand, large values of wood
density, leaf thickness and C/N ratio are related to conservative strategy, protection
against fire and water loss (Table 1) (Baker et al. 2004; Hoffmann et al. 2005; Chave et
al. 2006; Wigley et al. 2016). Based on such strategies, our expectations were that the
soil fertility and toxicity would influence the trait mean values along these gradients
(Ruggiero et al. 2002; Silva et al. 2010; Carvalho & Batalha 2013; Baxendale et al.
2014; Wigley et al. 2016). However, our results showed that trait related to acquisitive
strategies tended to have larger values in more benign environments (high fertility and
low toxic soil), while trait related for conservative strategies tended to have larger
values in more stressful environments (low fertility and high toxic soil). Additionally,
our results showed that these strategies were more evident in the seasonal forests than
on the savannas of Cerrado.
In general, we demonstrate that seasonal forest in richer soils have higher leaf
phosphorous content and tall plants, while that low leaf area, specific leaf area and leaf
phosphorous content, high woody density, carbon/nitrogen ratio and leaf thickness in
soils with higher toxicity. Likewise, the savanna plots with richer soils have higher leaf

73
area, while that high leaf thickness in toxic soils. These findings are according for the
fast acquisitive strategy of resources adopted by plants in conditions of large resource
available and lesser environmental stress (Diaz et al. 2004; Wigley et al. 2016;
Pellegrini 2016). This is possible because more fertile soils support higher plant
biomass due to higher resource available, making possible that species with strategy of
fast growing, that consequently have larger nutrient demand, may have an investment in
traits related to fast growth (Chapin III et al. 1993; Westoby 1998; Pellegrini 2016), and
produce litter with high-quality, that is quickly recycled (Baxendale et al. 2014).
In fact, the nutrient available is an important environmental driver involving the
rapid acquisition of nutrients and conservation of resources in plant, determining
functional traits and community composition (Wright et al. 2004; Lloyd et al. 2009;
Ordoñez et al. 2009; Baxendale et al. 2014; Wigley et al. 2016; Oliveras & Malhi 2016).
Plants that explore water- and nutrient stress tend to have convergent traits that indicate
better use and conservation of resources, promoting defences and long leaf lifespans
(Chapin III et al. 1993; Diaz et al. 2004), and are represented by small, thick and tough
leaves, low SLA and leaf nutrient content, and lower plant (Diaz et al. 2004; Pérez-
Harguindeguy et al. 2013), and high woody density, leaf thickness and carbon/nitrogen
ratio (Table 1). Strikingly, for some leaf traits and wood density the results were
opposite to our predictions. We registered low SLA and LPC and high SSD, LT and
C/N (in forest), and lower plants and high LT (in savannas) on more fertility soils.
These results appoint to conservative strategy on fertile soils, in which normally is
expected strategy related to rapid acquisition of resources (Diaz et al. 2004; Liu et al.
2012; Jager et al. 2015; Wigley et al. 2016). We expected that communities in resource-
rich environments would have higher SLA than in poor habitats (Knops & Reinhart
2000; Wright et al. 2004). However, our results were the opposite and can be related to

74
access to light in forests because there is evidence that plants decrease SLA as they
increase in height (in order to reach the canopy where light is fully available) (Fahey et
al. 1998; Klooster et al. 2007). Thus, more richer soils promoting higher growth of
plants, as seen in maximum height in forest, leading to greater light available in taller
plants. Like the solar radiation is intense during most of the year (Miranda et al. 1997),
when plants reaches the top of the canopy they adopt strategies that prevents water loss
altering yours morphological characteristics (low SLA, high LT and C/N). Some studies
have showed that SLA generally increase with increasing foil fertility in response to soil
nutrient availability and related to rapid acquisition strategy (Ordoñez et al. 2009; Wang
et al. 2012; Li et al. 2015).
Plant height is related with the nutrient transport capacity, and maximum plant
height is limited by hydraulic and mechanical constraints (Koch et al. 2004; Niklas
2007), moreover the costs with nutrients transports in taller trees can resulting reduction
in leaf photosynthesis (Ryan & Yoder 1997). Thus, we expected that plants in less
productive and more toxic environment tend to be smaller (Laureto & Cianciaruso
2015; Sfair et al. 2016). Our results indicate that soil more fertile and less toxic
promotes in taller plants in forest and savanna, which can reflect in high competitive
vigor and tolerance or avoidance of environmental stress (as fire) (Westoby 1998).
However, in this study the poor soil supported tall trees on savannas, this may be related
to disturbance regime (fire) in savannas (Jager et al. 2015). In savanna communities, the
grass are often tall, but in richer soils can accumulate large herbaceous layer increasing
the frequency and intensity of fires and decreasing the plant height (Dantas, Pausas, et
al. 2013; Dantas, Batalha, et al. 2013), because fertile soils can result in more
heterogeneous canopy height (Jager et al. 2015). On the other hand, poor soils can result
in more varied plant height, thus fire events often cause damage mainly on herbaceous
75
layer, favoring the taller plants (Dantas, Pausas, et al. 2013; Jager et al. 2015). Likewise,
seasonal forest registered taller plant on more toxicity soil, and its can be negatives
effects from fragmentation, because the sites of seasonal forest from São Paulo State
showed smaller toxicity and presented small plants, since that fragmentation makes the
forest more susceptible to falling trees (Ferreira & Laurance 1997).
Conclusion
We highlighted that density of individuals and community trait means shift along
edaphic gradients in savannas and seasonal forest plant communities in the Cerrado
domain. We show a stronger negative relationship of density of individuals with fertility
and toxicity gradient, that could be result of dominance of some species with high
competitive ability. For community trait mean, we showed that the changes were more
clear on fertility gradient than toxicity gradient, and that forest environments was more
sensible to shift in both gradients than savannas. We demonstrate that in plots with
fertile soils and less toxic have traits related to fast acquisitive strategy of resources
reflecting in traits related to fast growth competitive ability, and that the plants adopt
this strategy in conditions of large resource available and lesser environmental stress
(Diaz et al. 2004; Wigley et al. 2016; Pellegrini 2016). On the other hand, soil more
toxic and with low fertility have species with traits related to conservative strategy,
indicating better use and conservation of resources and promoting defences and long
leaf lifespans (Diaz et al. 2004; Pérez-Harguindeguy et al. 2013). However, the relation
of some traits with the edaphic gradient were contrary to our expeditions, mainly on
fertility gradient.

76
Acknowledgments
This research was supported by CNPq-Brazil (#563621/2010-9, #478747/2009-8 and
PELD - SITE 13) and FAPEG-GO (#201110267000130/31-10). L.M. was supported by
scholarships from Capes-Brazil, M.V.C. received PQ fellowships from CNPq
(#999999/999-9) and M.B.C received a postdoctoral fellowship from Capes-Brazil
(PNPD ##1454013). We thank to all field team responsible for sampling data: Edmar
Oliveira, Leonardo Maracahipes, Letícia Gomes, Livia Laureto, Danira Padilha, Mônica
Forsthofer, Mariângela Abreu, Josias Santos and Fernando Ribeiro. We also thank to
taxonomists Geraldo Franco, Osnir Aguiar, João Baitelo, Natália Ivanauskas and Renato
Mello-Silva for the identification of some species.
References
Apaza-Quevedo, A., Lippok, D., Hensen, I., Schleuning, M., & Both, S. 2015.
Elevation, topography, and edge effects drive functional composition of woody
plant species in tropical montane forests. Biotropica 47: 449–458.
APG-IV. 2016. An update of the Angiosperm Phylogeny Group classification for the
orders and families of flowering plants: APG IV. Botanical Journal of the Linnean
Society 181: 1–20.
Baker, T.R., Phillips, O.L., Malhi, Y., Almeida, S., Arroyo, L., Di Fiore, A., Erwin, T.,
Killeen, T.J., Laurance, S.G., Laurance, W.F., Lewis, S.L., Lloyd, J., Monteagudo,
A., Neill, D.A., Patino, S., Pitman, N.C.A., M. Silva, J.N., & Vasquez Martinez, R.
2004. Variation in wood density determines spatial patterns inAmazonian forest
biomass. Global Change Biology 10: 545–562.
Barot, S. 2004. Mechanisms promoting plant coexistence: can all the proposed
processes be reconciled? Oikos 106: 185–192.
Barros, M.J.F., Silva-Arias, G.A., Fregonezi, J.N., Turchetto-Zolet, A.C., Iganci, J.R.V.,
Diniz-Filho, J.A.F., & Freitas, L.B. 2015. Environmental drivers of diversity in
Subtropical Highland Grasslands. Perspectives in Plant Ecology, Evolution and
Systematics. doi: 10.1016/j.ppees.2015.08.001
Batalha, M.A. 2011. O cerrado não é um bioma. Biota Neotropica 11: 21–24.
Baxendale, C., Orwin, K.H., Poly, F., Pommier, T., & Bardgett, R.D. 2014. Are plant-
soil feedback responses explained by plant traits? New Phytologist 204: 408–423.
de Bello, F., Lepš, J., & Sebastià, M.-T. 2006. Variations in species and functional plant
diversity along climatic and grazing gradients. Ecography 29: 801–810.

77
Borcard, D., & Legendre, P. 2002. All-scale spatial analysis of ecological data by means
of principal coordinates of neighbour matrices. Ecological Modelling 153: 51–68.
Carvalho, G.H., & Batalha, M.A. 2013. The drivers of woody species richness and
density in a Neotropical savannah. Biology Letters 9: 1–4.
Chapin III, F.S., Autumn, K., & Pugnaire, F. 1993. Evolution of suites of traits in
response to environmental stress. The American Naturalist 142: S78–S92.
Chave, J., Coomes, D., Jansen, S., Lewis, S.L., Swenson, N.G., & Zanne, A.E. 2009.
Towards a worldwide wood economics spectrum. Ecology Letters 12: 351–366.
Chave, J., Muller-Landau, H.C., Baker, T.R., Easdale, T. a, ter Steege, H., & Webb,
C.O. 2006. Regional and phylogenetic variation of wood density across 2456
Neotropical tree species. Ecological applications : a publication of the Ecological
Society of America 16: 2356–67.
Dantas, V.D.L., & Batalha, M.A. 2011. Vegetation structure: Fine scale relationships
with soil in a cerrado site. Flora - Morphology, Distribution, Functional Ecology
of Plants 206: 341–346.
Dantas, V.L., Batalha, M.A., & Pausas, J.G. 2013. Fire drives functional thresholds on
the savanna–forest transition. Ecology 94: 2454–2463.
Dantas, V. de L., Hirota, M., Oliveira, R.S., & Pausas, J.G. 2016. Disturbance maintains
alternative biome states (M. Rejmanek, Ed.). Ecology Letters 19: 12–19.
Dantas, V. de L., Pausas, J.G., Batalha, M.A., Loiola, P. de P., & Cianciaruso, M.V.
2013. The role of fire in structuring trait variability in Neotropical savannas.
Oecologia 171: 487–494.
Díaz, S., & Cabido, M. 2001. Vive la différence : plant functional diversity matters to
ecosystem processes. 16: 646–655.
Diaz, S., Hodgson, J.G., Thompson, K., Cabido, M., Cornelissen, J.H.C., Jalili, A.,
Montserrat-Martí, G., Grime, J.P., Zarrinkamar, F., Asri, Y., Band, S.R.,
Basconcelo, S., Castro-Díez, P., Funes, G., Hamzehee, B., Khoshnevi, M., Pérez-
Harguindeguy, N., Pérez-Rontomé, M.C., Shirvany, F.A., Vendramini, F.,
Yazdani, S., Abbas-Azimi, R., Bogaard, A., Boustani, S., Charles, M., Dehghan,
M., de Torres-Espuny, L., Falczuk, V., Guerrero-Campo, J., Hynd, A., Jones, G.,
Kowsary, E., Kazemi-Saeed, F., Maestro-Martínez, M., Romo-Díez, A., Shaw, S.,
Siavash, B., Villar-Salvador, P., & Zak, M.R. 2004. The plant traits that drive
ecosystems: evidence from three continents. Journal of Vegetation Science 15:
295–304.
Embrapa. 1999. Sistema brasileiro de classificação de solos. Embrapa Produção de
Informação, Rio de Janeiro.
Fahey, T.J., Battles, J.J., & Wilson, G.F. 1998. Responses of early successional northern
hardwood forests to changes in nutrient availability. Ecological Monographs 68:
183–212.
Ferreira, L. V., & Laurance, W.F. 1997. Effects of Forest Fragmentation on Mortality
and Damage of Selected Trees in Central Amazonia. Conservation Biology 11:
797–801.
Forzza, R.C., Baumgratz, J.F.A., Bicudo, C.E.M., Canhos, D.A.L., Carvalho, A.A.,
Coelho, M.A.N., Costa, A.F., Costa, D.P., Hopkins, M.G., Leitman, P.M.,

78
Lohmann, L.G., Lughadha, E.N., Maia, L.C., Martinelli, G., Menezes, M., Morim,
M.P., Peixoto, A.L., Pirani, J.R., Prado, J., Queiroz, L.P., Souza, S., Souza, V.C.,
Stehmann, J.R., Sylvestre, L.S., Walter, B.M.T., & Zappi, D.C. 2012. New
Brazilian floristic list highlights conservation challenges. BioScience 62: 39–45.
Freschet, G.T., Dias, A.T.C., Ackerly, D.D., Aerts, R., van Bodegom, P.M., Cornwell,
W.K., Dong, M., Kurokawa, H., Liu, G., Onipchenko, V.G., Ordoñez, J.C., Peltzer,
D.A., Richardson, S.J., Shidakov, I.I., Soudzilovskaia, N.A., Tao, J., &
Cornelissen, J.H.C. 2011. Global to community scale differences in the prevalence
of convergent over divergent leaf trait distributions in plant assemblages. Global
Ecology and Biogeography 20: 755–765.
Frontier, S. 1976. Étude de la decroissance des valeurs propers dans une analyze en
composantes principales: comparison avec le modèle de baton brisé. Journal of
Experimental Marine Biology and Ecology 25: 1–26.
Furley, P.A., & Ratter, J.A. 1988. Soil resources and plant communities of the central
Brazilian Cerrado and their development. Journal of Biogeography 15: 97–108.
Garnier, E., Cortez, J., Billès, G., Navas, M.-L., Roumet, C., Debussche, M., Laurent,
G., Blanchard, A., Aubry, D., Bellmann, A., Neill, C., & Toussaint, J.-P. 2004.
Plant functional markers capture ecosystem properties during secondary
succession. Ecology 85: 2630–2637.
Garnier, E., Lavorel, S., Ansquer, P., Castro, H., Cruz, P., Dolezal, J., Eriksson, O.,
Fortunel, C., Freitas, H., Golodets, C., Grigulis, K., Jouany, C., Kazakou, E., Kigel,
J., Kleyer, M., Lehsten, V., Leps, J., Meier, T., Pakeman, R., Papadimitriou, M.,
Papanastasis, V.P., Quested, H., Quetier, F., Robson, M., Roumet, C., Rusch, G.,
Skarpe, C., Sternberg, M., Theau, J.-P., Thebault, A., Vile, D., & Zarovali, M.P.
2007. Assessing the effects of land-use change on plant traits, communities and
ecosystem functioning in grasslands: a standardized methodology and lessons from
an application to 11 European sites. Annals of Botany 99: 967–985.
Garnier, E., & Navas, M.L. 2012. A trait-based approach to comparative functional
plant ecology: Concepts, methods and applications for agroecology. A review.
Agronomy for Sustainable Development 32: 365–399.
Goedert, W.J. 1983. Management of the Cerrado soils of Brazil: a review. Journal of
Soil Science 34: 405–428.
Goodland, R., & Pollard, R. 1973. The Brazilian cerrado vegetation: a fertility gradient.
Journal of Ecology 61: 219–224.
Götzenberger, L., de Bello, F., Bråthen, K.A., Davison, J., Dubuis, A., Guisan, A., Lepš,
J., Lindborg, R., Moora, M., Pärtel, M., Pellissier, L., Pottier, J., Vittoz, P., Zobel,
K., & Zobel, M. 2012. Ecological assembly rules in plant communities-
approaches, patterns and prospects. Biological Reviews 87: 111–127.
Grime, J.P. 1998. Benefits of plant diversity to ecosystems: immediate, filter and
founder effects. Journal of Ecology 86: 902–910.
Hammer, O., Harper, D.A.T., & Ryan, P.D. 2001. PAST: paleontological statistics
software package for education and data analysis. 9.
Hawkins, B.A. 2012. Eight (and a half) deadly sins of spatial analysis. Journal of
Biogeography 39: 1–9.

79
Hoffmann, W.A., Franco, A.C., Moreira, M.Z., & Haridasan, M. 2005. Specific leaf
area explains differences in leaf traits between congeneric savanna and forest trees.
Functional Ecology 19: 932–940.
Hoffmann, W. a, Geiger, E.L., Gotsch, S.G., Rossatto, D.R., Silva, L.C.R., Lau, O.L.,
Haridasan, M., & Franco, A.C. 2012. Ecological thresholds at the savanna-forest
boundary: how plant traits, resources and fire govern the distribution of tropical
biomes (F. Lloret, Ed.). Ecology Letters 15: 759–768.
Jager, M.M., Richardson, S.J., Bellingham, P.J., Clearwater, M.J., & Laughlin, D.C.
2015. Soil fertility induces coordinated responses of multiple independent
functional traits (G. De Deyn, Ed.). Journal of Ecology 103: 374–385.
Klooster, S.H.J.-T., Thomas, E.J.P., & Sterck, F.J. 2007. Explaining interspecific
differences in sapling growth and shade tolerance in temperate forests. Journal of
Ecology 95: 1250–1260.
Knops, J.M.H., & Reinhart, K. 2000. Specific leaf area along a nitrogen fertilization
gradient. The American Midland Naturalist 144: 265–272.
Koch, G.W., Sillett, S.C., Jennings, G.M., & Davis, S.D. 2004. The limits to tree height.
Nature 428: 851–854.
Laureto, L.M.O., & Cianciaruso, M. V. 2015. Trait distribution patterns in savanna and
forest plant assemblages and their relationship with soil features. Plant Ecology
216: 629–639.
Lavorel, S., & Garnier, E. 2002. Predicting changes in community composition and
ecosystem functioning from plant traits: revisiting the Holy Grail. Functional
Ecology 16: 545–556.
Legendre, P. 1993. Spatial autocorrelation: trouble or new paradigm? Ecology 74:
1659–1673.
Lenza, E., & Klink, C.A. 2006. Comportamento fenológico de espécies lenhosas em um
cerrado sentido restrito de Brasília, DF. Revista Brasileira de Botânica 29: 627–
638.
Li, W., Cheng, J.-M., Yu, K.-L., Epstein, H.E., & Du, G.-Z. 2015. Niche and neutral
processes together determine diversity loss in response to fertilization in an Alpine
Meadow community (S. Hu, Ed.). PLOS ONE 10: e0134560.
Liu, X., Swenson, N.G., Wright, S.J., Zhang, L., Song, K., Du, Y., Zhang, J., Mi, X.,
Ren, H., & Ma, K. 2012. Covariation in plant functional traits and soil fertility
within two species-rich forests (K. O. Reinhart, Ed.). PLoS ONE 7: e34767.
Lloyd, J., Goulden, M.L., Ometto, J.P., Patiño, S., Fyllas, N.M., & Quesada, C.A. 2009.
Ecophysiology of forest and savanna vegetation. In Keller, M., Bustamante, M.,
Gash, J., & Dias, P.S. (eds.), Amazonia and global change, pp. 463–484. American
Geophysical Union, Washington, DC.
Marimon Junior, B.H., & Haridasan, M. 2005. Comparação da vegetação arbórea e
características edáficas de um cerradão e um cerrado sensu stricto em áreas
adjacentes sobre solo distrófico no leste de Mato Grosso , Brasil. Acta Botanica
Brasilica 19: 913–926.
Martorell, C., Almanza-Celis, C.A.I., Pérez-García, E.A., & Sánchez-Ken, J.G. 2015.
Co-existence in a species-rich grassland: competition, facilitation and niche

80
structure over a soil depth gradient (M. De Cáceres, Ed.). Journal of Vegetation
Science 26: 674–685.
Mayfield, M.M., & Levine, J.M. 2010. Opposing effects of competitive exclusion on
the phylogenetic structure of communities. Ecology Letters 13: 1085–1093.
McDonald, P.G., Fonseca, C.R., Overton, J.M., & Westoby, M. 2003. Leaf-size
divergence along rainfall and soil-nutrient gradients: is the method of size
reduction common among clades? Functional Ecology 17: 50–57.
McGill, B.J., Enquist, B.J., Weiher, E., & Westoby, M. 2006. Rebuilding community
ecology from functional traits. Trends in ecology & evolution 21: 178–85.
Méio, B.B., Freitas, C. V, Jatobá, L., Silva, M.E.F., & Ribeiro, J.F. 2003. Influência da
flora das florestas Amazônica e Atlântica na vegetação do cerrado sensu stricto.
Atlantic
Miranda, A.C., Miranda, H.S., Lloyd, J., Grace, J., Francey, R.J., McIntyre, J.A., Meir,
P., Riggan, P., Lockwood, R., & Brass, J. 1997. Fluxes of carbon, water and
energy over Brazilian cerrado: an analysis using eddy covariance and stable
isotopes. Plant, Cell and Environment 20: 315–328.
Moles, A.T., Perkins, S.E., Laffan, S.W., Flores-Moreno, H., Awasthy, M., Tindall,
M.L., Sack, L., Pitman, A., Kattge, J., Aarssen, L.W., Anand, M., Bahn, M.,
Blonder, B., Cavender-Bares, J., Cornelissen, J.H.C., Cornwell, W.K., Díaz, S.,
Dickie, J.B., Freschet, G.T., Griffiths, J.G., Gutierrez, A.G., Hemmings, F.A.,
Hickler, T., Hitchcock, T.D., Keighery, M., Kleyer, M., Kurokawa, H., Leishman,
M.R., Liu, K., Niinemets, Ü., Onipchenko, V., Onoda, Y., Penuelas, J., Pillar,
V.D., Reich, P.B., Shiodera, S., Siefert, A., Sosinski, E.E., Soudzilovskaia, N.A.,
Swaine, E.K., Swenson, N.G., van Bodegom, P.M., Warman, L., Weiher, E.,
Wright, I.J., Zhang, H., Zobel, M., & Bonser, S.P. 2014. Which is a better
predictor of plant traits: temperature or precipitation? (A. Helm, Ed.). Journal of
Vegetation Science 25: 1167–1180.
Moraes, D.A., Cavalin, P.O., Moro, R.S., Oliveira, R.A.C., Carmo, M.R.B., & Marques,
M.C.M. 2015. Edaphic filters and the functional structure of plant assemblages in
grasslands in southern Brazil (L. Duarte, Ed.). Journal of Vegetation Science. doi:
10.1111/jvs.12331
Neri, A. V., Schaefer, C.E.G.R., Silva, A.F., Souza, A.L., Ferreira-Junior, W.G., &
Meira-Neto, J.A.A. 2012. The influence of soils on the floristic composition and
community structure of an area of Brazilian Cerrado vegetation. Edinburgh
Journal of Botany 69: 1–27.
Niklas, K.J. 2007. Maximum plant height and the biophysical factors that limit it. Tree
Physiology 27: 433–440.
Oliveira-Filho, A.T., & Ratter, J.A. 2002. Vegetation physiognomies and woody flora
of the Cerrado biome. In Oliveira, P.S. & Marquis, R.J. (eds.), The Cerrados of
Brazil: ecology amd natural history of a Neotropical Savanna, pp. 91–120.
Columbia University Press, New York.
Oliveira, R.S., Bezerra, L., Davidson, E.A., Pinto, F., Klink, C.A., Nepstad, D.C., &
Moreira, A. 2005. Deep root function in soil water dynamics in cerrado savannas
of central Brazil. Functional Ecology 19: 574–581.
Oliveras, I., & Malhi, Y. 2016. Many shades of green: the dynamic tropical forest–
81
savannah transition zones. Philosophical Transactions of the Royal Society B:
Biological Sciences 371: 20150308.
Ordoñez, J.C., van Bodegom, P.M., Witte, J.-P.M., Wright, I.J., Reich, P.B., & Aerts, R.
2009. A global study of relationships between leaf traits, climate and soil measures
of nutrient fertility. Global Ecology and Biogeography 18: 137–149.
Pakeman, R.J., & Quested, H.M. 2007. Sampling plant functional traits: What
proportion of the species need to be measured? Applied Vegetation Science 10: 91–
96.
Pellegrini, A.F.A. 2016. Nutrient limitation in tropical savannas across multiple scales
and mechanisms. Ecology 97: 313–324.
Peres-Neto, P.R., & Legendre, P. 2010. Estimating and controlling for spatial structure
in the study of ecological communities. Global Ecology and Biogeography 19:
174–184.
Pérez-Harguindeguy, N., Díaz, S., Garnier, E., Lavorel, S., Poorter, H., Jaureguiberry,
P., Bret-Harte, M.S., Cornwell, W.K., Craine, J.M., Gurvich, D.E., Urcelay, C.,
Veneklaas, E.J., Reich, P.B., Poorter, L., Wright, I.J., Ray, P., Enrico, L., Pausas,
J.G., de Vos, A.C., Buchmann, N., Funes, G., Quétier, F., Hodgson, J.G.,
Thompson, K., Morgan, H.D., ter Steege, H., Sack, L., Blonder, B., Poschlod, P.,
Vaieretti, M. V., Conti, G., Staver, A.C., Aquino, S., & Cornelissen, J.H.C. 2013.
New handbook for standardised measurement of plant functional traits worldwide.
Australian Journal of Botany 61: 167–234.
Poorter, L. 2009. Leaf traits show different relationships with shade tolerance in moist
versus dry tropical forests. New Phytologist 181: 890–900.
Rangel, T.F., Diniz-filho, J.A.F., & Bini, L.M. 2010. SAM : a comprehensive
application for Spatial Analysis in Macroecology. Ecography.
Rangel, T.F.L.V.B., Diniz-Filho, J.A.F., & Bini, L.M. 2006. Towards an integrated
computational tool for spatial analysis in macroecology and biogeography. Global
Ecology and Biogeography 15: 321–327.
Reich, P.B., Ellsworth, D.S., Walters, M.B., Vose, J.M., Gresham, C., Volin, J.C., &
Bowman, W.D. 1999. Generality of leaf trait relationships: a test across six
biomes. Ecology 80: 1955–1969.
Ribeiro, J.F., & Walter, B.M.T. 2008. As principais fitofisionomias do bioma Cerrado.
In Sano, S.M., Almeida, S.P., & Ribeiro, J.F. (eds.), Cerrado: ecologia e flora, pp.
151–212. Embrapa Cerrados, Brasília.
Ruggiero, P.G.C., Batalha, M.A., Pivello, V.R., & Meirelles, S.T. 2002. Soil-vegetation
relationships in cerrado (Brazilian savanna) and semideciduous forest,
Southeastern Brazil. Plant Ecology 160: 1–16.
Ryan, M.G., & Yoder, B.J. 1997. Hydraulic Limits to Tree Height and Tree Growth.
BioScience 47: 235–242.
Schachtman, D., Reid, R.J., & Ayling, S.M. 1998. Phosphorus uptake by plants: from
soil to cell. Plant Physiology 116: 447–453.
Schamp, B.S., & Aarssen, L.W. 2009. The assembly of forest communities according to
maximum species height along resource and disturbance gradients. Oikos 118:
564–572.

82
Sfair, J.C., Rosado, B.H.P., & Tabarelli, M. 2016. The effects of environmental
constraints on plant community organization depend on which traits are measured
(N. Mason, Ed.). Journal of Vegetation Science. doi: 10.1111/jvs.12453
Silva, L.C.R., Haridasan, M., Sternberg, L.S.L., Franco, A.C., & Hoffmann, W.A. 2010.
Not all forests are expanding over central Brazilian savannas. Plant and Soil 333:
431–442.
Souza-Neto, A.C., Cianciaruso, M. V., & Collevatti, R.G. 2016. Habitat shifts shaping
the diversity of a biodiversity hotspot through time: insights from the phylogenetic
structure of Caesalpinioideae in the Brazilian Cerrado. Journal of Biogeography
43: 340–350.
Svenning, J.-C., Kinner, D. a., Stallard, R.F., Engelbrecht, B.M.J., & Wright, S.J. 2004.
Ecological Determinism in Plant Community Structure Across a Tropical Forest
Landscape. Ecology 85: 2526–2538.
Swenson, N.G., & Enquist, B.J. 2007. Ecological and evolutionary determinants of a
key plant functional trait: wood density and its community-wide variation across
latitude and elevation. American Journal of Botany 94: 451–459.
Vellend, M. 2010. Conceptual synthesis in community ecology. The Quarterly review of
biology 85: 183–206.
Vile, D. 2005. Specific leaf area and dry matter content estimate thickness in laminar
leaves. Annals of Botany 96: 1129–1136.
Wagatsuma, T. 1983. Characterization of absorption sites for aluminum in the roots.
Soil Science and Plant Nutrition 29: 499–515.
Wang, D., Maughan, M.W., Sun, J., Feng, X., Miguez, F., Lee, D., & Dietze, M.C.
2012. Impact of nitrogen allocation on growth and photosynthesis of Miscanthus
(Miscanthus × giganteus). GCB Bioenergy 4: 688–697.
Westoby, M. 1998. A leaf-height-seed (LHS) plant ecology strategy scheme. Plant and
Soil 199: 213–227.
Wigley, B.J., Slingsby, J.A., Díaz, S., Bond, W.J., Fritz, H., & Coetsee, C. 2016. Leaf
traits of African woody savanna species across climate and soil fertility gradients:
evidence for conservative vs . acquisitive resource use strategies. Journal of
Ecology. doi: 10.1111/1365-2745.12598
Wright, I.J., Reich, P.B., Westoby, M., Ackerly, D.D., Baruch, Z., Bongers, F.,
Cavender-bares, J., Chapin, T., Cornelissen, J.H.C., Diemer, M., Flexas, J.,
Garnier, E., Groom, P.K., & Gulias, J. 2004. The worldwide leaf economics
spectrum. Nature 12: 821–827.
Zava, P.C., & Cianciaruso, M. V. 2014. Can we use plant traits and soil characteristics
to predict leaf damage in savanna woody species? Plant Ecology 215: 625–637.

83
Supplementary Material
Supplementary table 1. Climate characteristics of the six sites sampled in Brazilian Savanna. The values represented a range, when available, of
20 years of data collected in the nearest weather station of each site. The fire frequency is related only to savannas sites. A low fire frequency
indicates an interval about of five years among fire events, and high fire frequency of 10 years.
Environmental characteristics Assis Ecological State -
SP
Vassununga State Park
- SP
Emas National Park -
GO
Jataí - GO Bacaba Park - MT Ribeirão Cascalheira - MT
Coordinates 50W 22’, 22S 35’ 47W 37’, 21S 36’ 52W 59’, 17S 54’ 51W 32’, 17S 45’ 52W 21’, 14S 42’ 51W 46’, 12S 49’
Fire frequency low low high high high low
Climate Type Cfa Cwa Aw Aw Aw Aw
Altitude (m) 560 740 840 860 325 374
Mean Annual Temp. (°C) 23.6 22.3 24.6 22.6 24.8 25.4
Mean Minimum Temp. (°C) 19.0 16.6 18.9 17.0 18.9 20.1
Precipitation (mm yr-1
) 1352 1437 1745 1605 1433 1822
Evapotranspiration (mm) 129 92 82 121 134 136
Mean Monthly Relative
Humidity (%)
64 70 69 69 77 71

84
Supplementary table 2. Mean values and coefficient of variation (in parentheses) of the soil variables to sites of seasonal forests and savannas
environments in the Brazilian Cerrado. These values were calculated based in values of parameters in ten plots each site.
Soil
characteristics
Assis Ecological State -
SP
Vassununga State Park -
SP
Emas National Park -
GO
Jataí - GO Bacaba Park - MT Ribeirão Cascalheira -
MT
Forest Savanna Forest Savanna Forest Savanna Forest Savanna Forest Savanna Forest Savanna
N 0.32 (0.46) 0.25 (0.40) 0.22 (0.29) 0.12 (0.36) 0.26 (0.36) 0.09 (0.45) 0.18 (0.15) 0.17 (0.25) 0.11 (0.23) 0.08 (0.18) 0.10 (0.14) 0.05 (0.31)
P 8.39 (0.54) 3.91 (0.83) 4.51 (1.07) 3.89 (0.85) 1.79 (0.38) 0.56 (0.37) 1.57 (0.44) 1.03 (0.78) 1.15 (0.53) 2.03 (0.07) 1.75 (0.15) 2.04 (0.33)
K 46.3 (0.38) 11.8 (0.34) 11.2 (0.37) 13.1 (0.27) 42.4 (0.18) 31.4 (0.27) 28.4 (0.44) 22.3 (0.26) 46.7 (0.23) 46.2 (0.15) 17.7 (0.19) 18.3 (0.43)
SMO 3.10 (0.38) 1.70 (0.37) 5.13 (0.20) 3.10 (0.17) 5.87 (0.29) 3.08 (0.44) 6.22 (0.19) 4.79 (0.18) 1.07 (0.55) 1.73 (0.19) 2.49 (0.12) 1.83 (0.33)
pH 7.09 (0.10) 4.85 (0.03) 6.16 (0.11) 4.51 (0.02) 4.20 (0.11) 4.30 (0.06) 5.26 (0.03) 5.26 (0.02) 4.65 (0.02) 5.04 (0.03) 4.10 (0.02) 4.95 (0.05)
Al 0 0.88 (0.18) 0.12 (2.87) 1.70 (0.12) 1.65 (0.24) 1.19 (0.24) 1.03 (0.38) 0.65 (0.42) 0.85 (0.22) 1.16 (0.12) 1.12 (0.10) 0.77 (0.15)
Clay 11.2 (0.25) 8.0 (0.24) 44.7 (0.25) 10.6 (0.08) 26.1 (0.29) 29.4 (0.67) 54.6 (0.14) 51.0 (0.08) 20.1 (0.18) 12.6 (0.20) 16.7 (0.13) 2.9 (0.41)

85
Supplementary table 3. Mean traits and number of species sampled to each sites of the soil variables to sites of seasonal forests and savannas
environments in the Brazilian Cerrado. Density ≤ 3 represents the number and percentage of species with individual density equal or less that
three individuals in each site, and density ≥ 4 denotes the number and percentage (in parentheses) of species with individual density equal or less
that four individuals in each site.
Site Number of species density ≤ 3 density ≥ 4 Height LA SLA LPC SSD LT C/N
Forest
Assis Ecological State - SP 39 31 (79) 8 (21) 13.0 132.2 133.8 1.48 0.51 0.16 2.13
Vassununga State Park - SP 31 18 (58) 13 (42) 9.5 276.1 159.3 1.99 0.42 0.15 2.07
Emas National Park - GO 21 15 (71) 6 (29) 15.7 128.9 105.8 0.84 0.57 0.20 3.36
Jataí - GO 29 12 (41) 17 (59) 13.1 200.6 113.6 1.28 0.59 0.19 3.07
Bacaba Park - MT 28 16 (57) 12 (43) 11.6 78.1 110.8 1.06 0.62 0.15 2.78
Ribeirão Cascalheira - MT 52 20 (38) 32 (62) 14.6 138.7 95.6 0.86 0.59 0.18 2.73
Savanna
Assis Ecological State - SP 44 16 (36) 28 (64) 4.5 76.8 85.3 0.98 0.51 0.21 2.83
Vassununga State Park - SP 47 16 (34) 31 (66) 4.3 71.2 80.9 1.22 0.48 0.25 3.30
Emas National Park - GO 51 34 (67) 17 (33) 2.7 70.0 68.4 0.83 0.48 0.34 3.92
Jataí - GO 43 7 (16) 36 (84) 3.1 125.2 71.0 0.99 0.46 0.32 3.73
Bacaba Park - MT 90 15 (17) 74 (83) 4.3 139.3 84.7 1.10 0.53 0.23 3.55
Ribeirão Cascalheira - MT 66 24 (36) 42 (64) 5.0 81.8 78.0 0.91 0.56 0.24 3.32

86
Supplementary figure 1. Contribution of edaphic parameters for the toxicity (PC1) and
fertility (PC2) gradients in seasonal forest in the Brazilian Cerrado. Bootstrap
confidence intervals when do not overlap zero indicates significant relationship
(positive or negative) with the component principal. The numbers on the bars indicates
the correlation values of each variable with the PCs.
Supplementary figure 2. Contribution of edaphic parameters for the fertility (PC1) and
toxicity (PC2) gradients in savannas in the Brazilian Cerrado. Bootstrap confidence
intervals when do not overlap zero indicates significant relationship (positive or
negative) with the component principal. The numbers on the bars indicates the
correlation values of each variable with the PCs.

87
Supplementary figure 3. Relationship between individual density and soil proprieties
of seasonal and savanna in Brazilian Savanna. Positive values in the PCs indicates
greater levels of toxicity or fertility on the gradient.

88
Supplementary figure 4. Shifts in community-weighted trait means along soil toxicity
(PC1) and fertility (PC2) gradients in seasonal forests in the Brazilian Cerrado. Beta
regression coefficient (β) indicates the intensity and direction of each regression with
the gradients. The β coefficients were derived from linear regression analyses. Hmax =
maximum plant height (m); LA = leaf area (cm2); SLA = specific leaf area (cm
2); LPC
= leaf phosphorous content (g/kg(%)); SSD = Stem-specific density (mg mm-3
); LT =
leaf thickness (mm); C/N = leaf carbon-nitrogen ratio. * P < 0.05, ** P < 0,01, *** P <
0,001, NS non-significant. Positive values in the PCs indicates greater levels of toxicity
or fertility on the gradient.
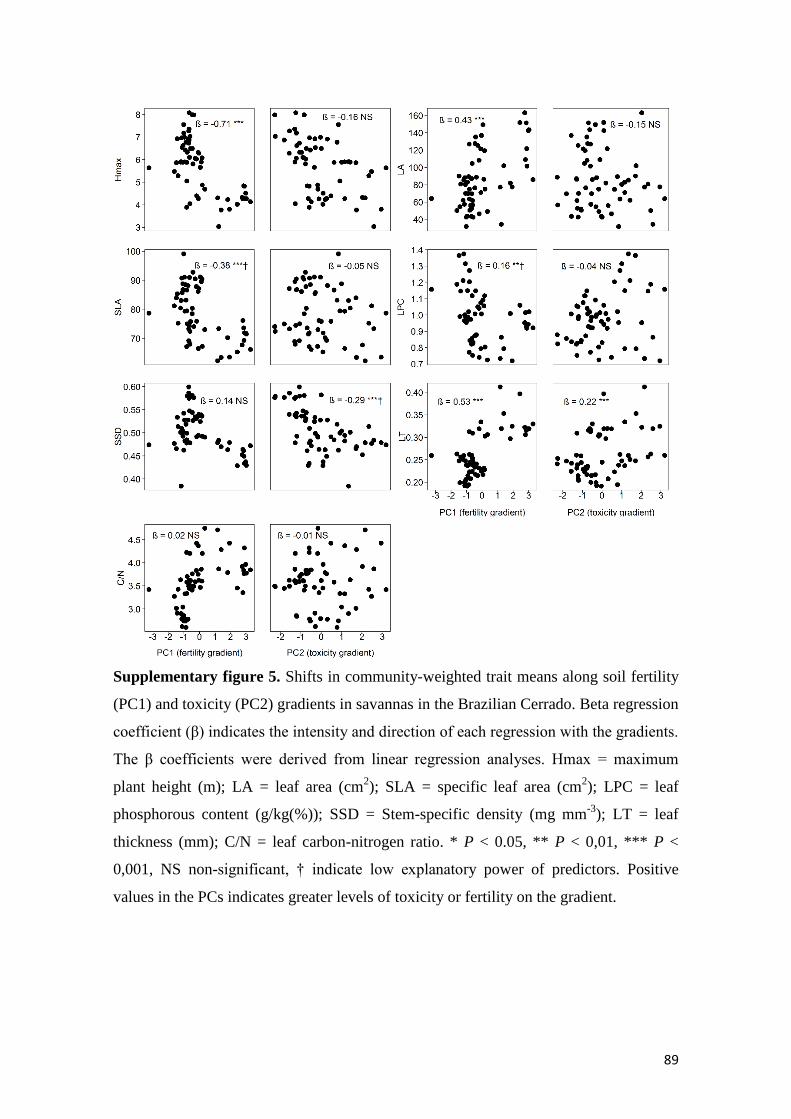
89
Supplementary figure 5. Shifts in community-weighted trait means along soil fertility
(PC1) and toxicity (PC2) gradients in savannas in the Brazilian Cerrado. Beta regression
coefficient (β) indicates the intensity and direction of each regression with the gradients.
The β coefficients were derived from linear regression analyses. Hmax = maximum
plant height (m); LA = leaf area (cm2); SLA = specific leaf area (cm
2); LPC = leaf
phosphorous content (g/kg(%)); SSD = Stem-specific density (mg mm-3
); LT = leaf
thickness (mm); C/N = leaf carbon-nitrogen ratio. * P < 0.05, ** P < 0,01, *** P <
0,001, NS non-significant, † indicate low explanatory power of predictors. Positive
values in the PCs indicates greater levels of toxicity or fertility on the gradient.

90
Appendix 1. Set of graphics representing the spatial patterns of all the predictor
variables sampled in savanna and seasonal forests environments, displayed according to
acquisitive or conservative strategy of resources. Spatial autocorrelogram of the patterns
in the observed (red lines), expected (blue lines), and residuals (green lines).
Community-weighted means
Forest – acquisitive strategy
Hmax – maximum plant height
L.CWM.Height
Estimated
Residuals
Distance Class
1,1001,0009008007006005004003002001000
Mora
n`s
I
1
0.5
0
-0.5
-1
LA – leaf area
L.CWM.LA
Estimated
Residuals
Distance Class
1,1001,0009008007006005004003002001000
Mora
n`s
I
1
0.5
0
-0.5
-1
SLA – specific leaf area
L.CWM.SLA
Estimated
Residuals
Distance Class
1,1001,0009008007006005004003002001000
Mora
n`s
I
0.5
0
-0.5
-1

91
LPC – leaf phosphorous content
L.CWM.P_Leaf
Estimated
Residuals
Distance Class
1,1001,0009008007006005004003002001000
Mora
n`s
I1
0.5
0
-0.5
-1
Forest – conservative strategy
SSD – stem-specific density
L.CWM.SSD
Estimated
Residuals
Distance Class
1,1001,0009008007006005004003002001000
Mora
n`s
I
0.5
0
-0.5
-1
-1.5
LT – leaf thickness
L.CWM.LT
Estimated
Residuals
Distance Class
1,1001,0009008007006005004003002001000
Mora
n`s
I
1
0.5
0
-0.5
-1
C/N – leaf carbon-nitrogen ratio
L.CWM.CN_Leaf
Estimated
Residuals
Distance Class
1,1001,0009008007006005004003002001000
Mora
n`s
I
1
0.5
0
-0.5
-1

92
Savanna – acquisitive strategy
Hmax – Maximum plant height
L.CWM.Height
Estimated
Residuals
Distance Class
1,0009008007006005004003002001000
Mora
n`s
I
1
0.5
0
-0.5
-1
-1.5
LA – leaf area
L.CWM.LA
Estimated
Residuals
Distance Class
1,0009008007006005004003002001000
Mora
n`s
I
1
0.5
0
-0.5
-1
SLA – specific leaf area
L.CWM.SLA
Estimated
Residuals
Distance Class
1,0009008007006005004003002001000
Mora
n`s
I
1
0.5
0
-0.5
-1
LPC – leaf phosphorous content
L.CWM.P_Leaf
Estimated
Residuals
Distance Class
1,0009008007006005004003002001000
Mora
n`s
I
1
0.5
0
-0.5

93
Savanna – conservative strategy
SSD – stem-specific density
L.CWM.SSD
Estimated
Residuals
Distance Class
1,0009008007006005004003002001000
Mora
n`s
I
1.5
1
0.5
0
-0.5
-1
-1.5
LT – leaf thickness
L.CWM.LT
Estimated
Residuals
Distance Class
1,0009008007006005004003002001000
Mora
n`s
I
1
0.5
0
-0.5
-1
C/N – leaf carbon-nitrogen ratio
L.CWM.CN_Leaf
Estimated
Residuals
Distance Class
1,0009008007006005004003002001000
Mora
n`s
I
1.5
1
0.5
0
-0.5
-1
-1.5
Density forest
Density
Estimated
Residuals
Distance Class
1,1001,0009008007006005004003002001000
Mora
n`s
I
0.5
0
-0.5
-1
-1.5

94
Density savanna
Density
Estimated
Residuals
Distance Class
1,0009008007006005004003002001000
Mora
n`s
I1
0.5
0
-0.5
-1
95
CAPÍTULO III
Formatado nas normas da revista:
Journal of Ecology

96
Insect herbivore damage is not related with host plant ecological and
evolutionary distances
Leandro Maracahipes1*
, Fernando Landa Sobral1, Leonardo Lima Bergamini
1,
Marcus Vinicius Cianciaruso1, Mário Almeida-Neto
1, Walter Santos de Araújo
1,2
1Departamento de Ecologia, Instituto de Ciências Biológicas, Universidade Federal de
Goiás, Goiânia, GO, 74001-970, Brazil; 2Departamento de Biologia Geral, Centro de
Ciências Biológicas, Universidade Estadual de Montes Claros, Montes Claros, MG,
39401-089, Brazil
*Correspondence author ([email protected])

97
Summary
1. The spatial distribution and the identity of co-existing plants individuals should play
an important role to herbivory levels. There is a growing interest in understand how the
variation on functional traits and phylogenetic relationship in the neighboring affects the
herbivory on focal plants.
2. To investigate whether ecological and evolutionary distances between individual
plants and their neighbouring plants mediates leaf herbivory levels, we sampled 815
individuals belonging to 27 woody plant species in 49 savanna plots. For each
individual, we quantified data on leaf damage (%), specific leaf area (cm2 g
-1), leaf
toughness (mm), plant height (cm), and abundance. To evaluate the herbivory effects at
the individual level, we quantified relative trait values for each individual and the
phylogenetic isolation of each individual in relation to the neighboring plants.
3. Contrary to our predictions, we found that ecological and evolutionary distances
between focal plants and their neighbouring plants did not mediate leaf herbivory levels
in the studied plants.
4. We showed that that the phylogenetic isolation, specific leaf area, leaf toughness,
plant height and plant abundance did not influence the herbivore damage on the woody
plants of Neotropical savannas, both in the individual context as at neighboring plants.
Our results suggest that dominance of herbivore generalists, coevolution between plant
and specialist herbivores and preferential consume of young leaves can be more
important for determine the leaf damage level of the focal plant in savanna woody
species, than the neighboring context.
5. Synthesis. We demonstrated that ecological and evolutionary distances between
individual plants and their neighbouring plants did not mediates leaf herbivory levels in
savanna woody species. These findings suggest that dominance of herbivore generalists,
98
coevolution between plant and specialist herbivores and preferential consume of young
leaves can be more important than the neighboring context for determine the leaf
damage by herbivores in savanna woody species. Furthermore, we suggest that this
approach be replicated to other plant groups and environments.
Key-words: neighboring plants, herbivory damage, plant functional trait, phylogenetic
and ecological isolation, Janzen-Connell hypothesis, Neotropical savanna, cerrado
Introduction
Variation in leaf herbivory levels is a common phenomenon among co-occurring plant
species (Cornelissen, Wilson Fernandes & Vasconcellos-Neto 2008; Carmona,
Lajeunesse & Johnson 2011; Schuldt et al. 2012; Cárdenas et al. 2014). Potential
explanations to such variation include differences in plant defensive traits, such as type
and amount of secondary metabolites and leaf toughness, as well as differences in leaf
nutritional content (Agrawal 2007; Carmona et al. 2011; Ali & Agrawal 2012; Loranger
et al. 2012; Cárdenas et al. 2014). For example, leaves with high nitrogen concentration
and high specific leaf area are more palatable to herbivores (Hanley et al. 2007) than
leaves with high carbon-nitrogen ratio (Coley & Barone 1996). At the individual scale
height influences the accessibility and localization of the plant by herbivores (Loranger
et al. 2012) whereas at the assemblage level plant density is a signal of resource
concentration (Hambäck & Englund 2005). Yet several studies investigated the direct
effect of these factors on herbivory (Janzen 1970; Twigg & Socha 1996; Coley &
Barone 1996; Agrawal 2007; Hanley et al. 2007) there is a growing interest in

99
understand how the variation of these factors in the neighboring affects the herbivory on
focal plants (Barbosa et al. 2009; Underwood et al. 2014; Kim & Underwood 2015).
Because plants are sessile organisms their spatial distribution and the identity of
co-existing individuals should play an important role to herbivory levels. Neighboring
plants can attract, retain or repulse herbivores (Root 1973; Hambäck & Englund 2005;
Hakes & Cronin 2011) affecting the damage that a focal plant may experience. Damage
to neighboring plants can also promote volatile emissions that elicit the induction of
defenses in a given focal plant, leading to a reduction in herbivory (Barbosa et al.
2009). On the other hand, neighboring proprieties, such as plant abundance and identity
may facilitate the survival of a focal plant by altering its conspicuity (Barbosa et al.
2009; Kim & Underwood 2015; Champagne, Tremblay & Côté 2016; Murphy, Xu &
Comita 2016). The Janzen-Connell hypothesis predict that herbivore pressure should be
positively correlated with conspecific neighbor abundance because specialist insect
herbivores can be attract to high-density patches with preferred resource (Janzen 1970;
Comita et al. 2014; Murphy et al. 2016). Palatable plants in an assemblage of
unpalatable plants can remain undetected by herbivores and thereby escape from
consumption (Callaway, Kikvidze & Kikodze 2000; Baraza, Zamora & Hódar 2006).
Thus, studies of this nature are important because the neighboring effects on focal plant
may influences their growth and survival, and determine species coexistence and
diversity patterns in the local communities (Queenborough et al. 2007; Kim &
Underwood 2015; Champagne et al. 2016).
The phylogenetic relationship between a given plant individual and its neighbors
can act as an important mediator of plant–herbivore interactions (Gilbert et al. 2012;
Lebrija-Trejos et al. 2014). This is because key plant functional traits can be
phylogenetically conserved (Lebrija-Trejos et al. 2014) and closely related plant species
100
often share more coevolutionary relationships with herbivore consumers and other
natural enemies (Cavender-Bares et al. 2009; Futuyma & Agrawal 2009; Pearse & Hipp
2009; Gilbert et al. 2012). Thus, herbivores may limit the co-existence of closely related
plants (Becerra 2007; Futuyma & Agrawal 2009). In this context, focal plants co-
occurring with phylogenetically distant neighbors are expected to show lower herbivory
levels than those co-occurring with closely related plants (Gilbert & Webb 2007; Chen
et al. 2016).
In this study, we investigated whether ecological and evolutionary distances
between individual plants and their neighbouring plants mediates leaf herbivory levels.
We hypothesized that functionally and phylogenetically more similar neighbouring
plants will show higher herbivore damage than functionally and phylogenetically less
similar neighbouring focal plants. Specifically, we answered the following questions:
(1) Does herbivory damage level in a focal plant is mediate by specific neighbour plant
functional traits? (2) Do focal plants with leaf traits similar to neighbors plants (specific
leaf area and leaf toughness) have higher herbivory damage levels than focal plants with
distinct leaf traits to neighbouring? (3) Do focal plants larger than their neighbor plants
have higher herbivory damage levels than focal plants smaller than neighborhood
plants? (4) Do focal plants closely related to neighbouring plants have higher herbivory
damage levels than focal plant distantly related to neighbouring plants?
Material and methods
STUDY SITE
The Cerrado is the largest savanna region of South America (Ratter, Ribeiro &
Bridgewater 1997), and one of the richest savanna in the world, with a high habitat
diversity and a large number of endemic plants and animals species (Klink & Machado

101
2005). The predominant vegetation of the Cerrado is a Neotropical savanna (cerrado
stricto sensu) that is composed by shrubs, tree and grasses coexisting with the
herbaceous layer (Ratter et al. 1997). The soils of the savannas of the Cerrado are
nutrient-poor and well-drained and act as an environmental filter on species
establishment (Furley & Ratter 1988). Another important filter is fire, that through time
has selected species with traits of resistance or resilience to stresses caused by burning
(Simon et al. 2009). The low soil fertility and high fire frequency filters species with
adaptive traits to environmental stress and with anti-herbivore characteristics (Silva &
Batalha 2011). Environments with high environmental stress, as the Cerrado, offer an
under explored opportunity to understand how ecological and evolutionary relationships
between neighboring species may determine the damage level caused by herbivores.
We conducted this study in the Emas National Park (ENP; 17°54’S, 52°59’W) in
central Brazilian plateau, a region included predominantly in the Cerrado domain. The
ENP occupies an area of 133,000 ha of mixed formations of savannas, and with
elevations ranging between 720 to 890 m. The climate of the region is defined as Aw of
Köppen (Peel et al. 2007), characbterized by a mean annual temperature of 24.6 °C and
a mean annual precipitation ranging from 1,200 to 2,000 mm (Ramos-Neto & Pivello
2000). The soils are predominantly characterized as oxisols and dystrophic (Silva &
Batalha 2008). The vegetation in the park comprises forest formations (e.g.,
semidecidual and riparian forest) and savannic formations (e.g., dense and open
savannas) (Ribeiro & Walter 2008), wherein the last occupy 78.5% of the area of the
park (Ramos-Neto & Pivello 2000).

102
ECOLOGICAL DISTANCES AND PHYLOGENETIC ISOLATION
We used data from 49 plots of 10 x 10 m where all woody plant individuals with a stem
circumference larger than 10 cm at soil level were sampled (Zava & Cianciaruso 2014).
These plots were randomly distributed in a gradient of open to dense savannas (39 plots
in open savannas and 10 plots in dense savannas). We used only those species with at
least ten individuals and that occurred in at least five plots. Overall, we analyzed 815
individuals of the 27 most abundant plant species (Table S1). Anadenanthera peregrina
(Fabaceae) was excluded from the analysis due to its tiny folioles, which makes
virtually impossible to measure leaf damage for this species. For each individual we
sampled data on leaf damage (%), specific leaf area (cm2
g-1
), leaf toughness (mm), and
plant height (cm). Additionally, we calculated plant abundance per plot. For each
individual we collected 10 mature leaves, of which five leaves were used to calculate
leaf toughness, and the other five to calculate leaf damage, leaf area and specific leaf
area. All trait measurements followed the protocols presented in Pérez-Harguindeguy et
al. (2013).
To evaluate the herbivory effects at the level of individual, we quantified relative
trait values for each individual (Table S2). Thus, for example, positive values for height
indicate a higher-than-average individual and probably should be more attacked by
herbivores, whereas negative values indicate lower-than-average ones and less attacked.
To estimate phylogenetic isolation that is, the phylogenetic distance between each focal
individual and the other co-occurring individuals, we used a dated phylogeny recently
constructed by Zanne et al. (2014). From this phylogeny, we extracted the phylogenetic
relationships of all 27 plants species analyzed (Fig. 1). However, 20 species were absent
of the original phylogeny, we included these species in the phylogeny as polytomies at
the genus (18 species) and family (2 species) level.

103
We quantified the phylogenetic isolation of each individual in relation to the
neighboring plants as the sum of the branch lengths in the phylogeny connecting the
focal individual and all the others plant individuals co-occurring in the same plot.
Conspecific individuals had their phylogenetic distance set to zero. Therefore, this
measure included the abundance of the neighboring plants at each plot, given that every
single individual contributed to the sum. Individuals inserted in a local community
comprising distantly-related plants will have high values of phylogenetic isolation.
STATISTICAL ANALYSIS
To investigate the factors that influence the leaf herbivore damage in each individual we
built a model including SLA, relative SLA, LT, relative LT, conspecific abundance,
height, relative height and phylogenetic isolation (Table 1). We build a random intercept
linear mixed model relating the percentual herbivory of each individual and its trait
values, as well as various measures of neighborhood context (Supporting Information
Table S2), with plant species nested by plot identity as a random effect. Random effects
structure was tested by likelihood ratio tests. We then computed the standardized
coefficients with ±1.96*SE confidence intervals to assess the relative contribution of
each variable to the differences in herbivory. Degrees of freedom for the t-values p
computations were computed using the Satterthwaite’s approximation (Satterthwaite
1946). The models were fit with the “lmer” function in the “lme4 package in R (R Core
Team 2016).

104
Results
Leaf damage per plant individual ranged from 0.005% to 29.6%, with 95% of plant
individuals having up to 10% of their leaf surface consumed by herbivores (Fig. 1). We
found that the leaf toughness and relative leaf toughness were related to differences in
leaf herbivory (Table 1, Fig. S1). However, the explanatory power of the global mixed
effects model was very low. The marginal R2 that are associated with fixed effects was
of 0.07, while the conditional R2 that considers both fixed and random effects was 0.42.
Due to the low explanatory power of the fixed variables, we consider that all the
predictor variables were not related to leaf damage (Table 1, Fig. 2).

105
Fig. 1. The phylogenetic tree assembled for 27 cerrado species, with respective abundance and mean leaf damage for each species, utilized in the
analyzes in Emas National Park, Brazil. Abundance is presented in log (for original values see Table 2S). The relationship among species was
based on dated phylogeny constructed by Zanne et al. (2014). The scale is in million years and the values of abundance are logarithmic.
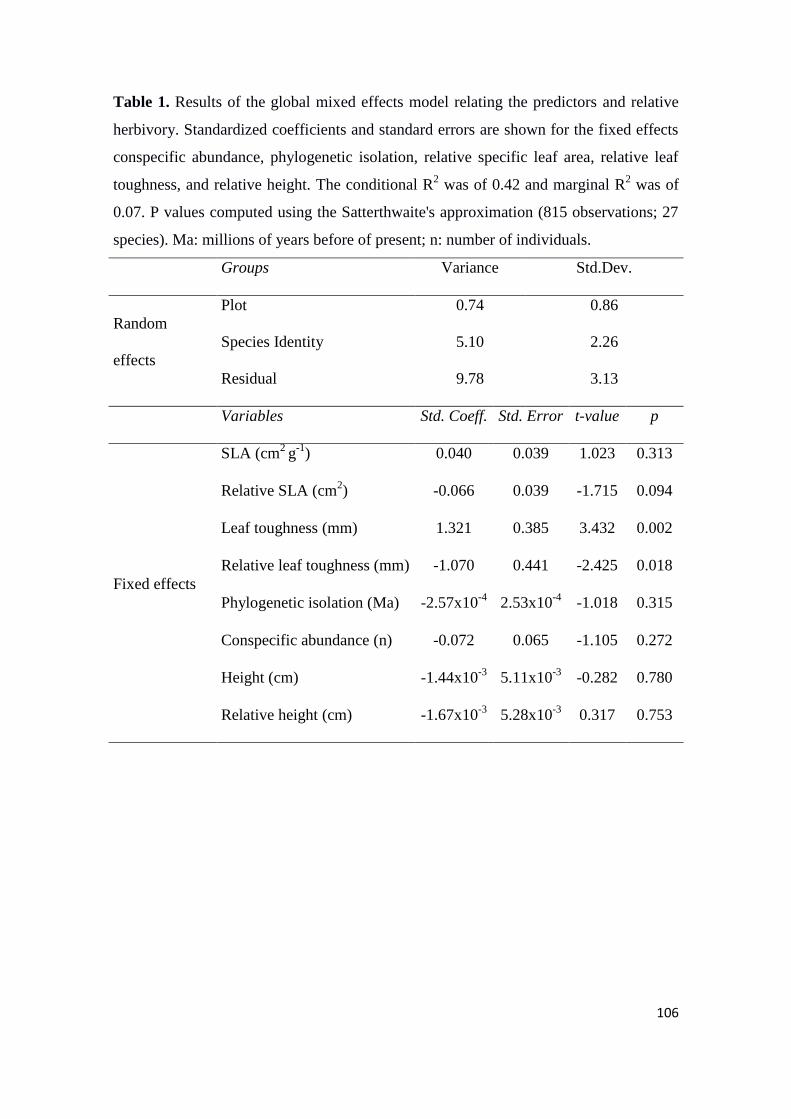
106
Table 1. Results of the global mixed effects model relating the predictors and relative
herbivory. Standardized coefficients and standard errors are shown for the fixed effects
conspecific abundance, phylogenetic isolation, relative specific leaf area, relative leaf
toughness, and relative height. The conditional R2 was of 0.42 and marginal R
2 was of
0.07. P values computed using the Satterthwaite's approximation (815 observations; 27
species). Ma: millions of years before of present; n: number of individuals.
Groups Variance Std.Dev.
Random
effects
Plot 0.74 0.86
Species Identity 5.10 2.26
Residual 9.78 3.13
Variables Std. Coeff. Std. Error t-value p
Fixed effects
SLA (cm2
g-1
) 0.040 0.039 1.023 0.313
Relative SLA (cm2) -0.066 0.039 -1.715 0.094
Leaf toughness (mm) 1.321 0.385 3.432 0.002
Relative leaf toughness (mm) -1.070 0.441 -2.425 0.018
Phylogenetic isolation (Ma) -2.57x10⁻⁴
2.53x10⁻⁴
-1.018 0.315
Conspecific abundance (n) -0.072 0.065 -1.105 0.272
Height (cm) -1.44x10⁻³
5.11x10⁻³
-0.282 0.780
Relative height (cm) -1.67x10⁻³
5.28x10⁻³
0.317 0.753

107
Fig. 2. Standardized effect size (mean ± 95% confidence intervals) computed under a
global mixed effects model relating the predictors and relative herbivory for 27 cerrado
species in Emas National Park, Brazil. Black line represents predictors related to effects
at the level of individual, while white line indicates effects at the level of plots.
Confidence intervals when do not overlap zero indicates significant relationship
(positive or negative), but the marginal R2 of the model was very low (0.07).

108
Discussion
Neighboring plants can affect the herbivore damage levels, attracting, retaining or
repulsing herbivores (Root 1973; Hambäck & Englund 2005; Hakes & Cronin 2011).
We hypothesized that focal plants more similar to neighboring plants will show higher
herbivory damage than focal plants less similar to neighbouring plants. However, our
results did not corroborate this expectation, because we found that the herbivory level of
focal plants were not affected by traits of neighboring plants. This result can be
explained by three principal factors: (1) dominance of generalist herbivores in savannas,
(2) coevolution of plants and specialist herbivores, and (3) preferential consume of
immature leaves by herbivores.
The herbivorous fauna in Neotropical savannas is composed predominantly by
generalist insects, such as leaf-cutter ants, grasshoppers and caterpillars (Diniz &
Morais 1997; Ribeiro, Carneiro & Fernandes 1998; Mundim, Costa & Vasconcelos
2009). These generalist herbivores can consume indiscriminately different plant types
(Meijden 1996; Diniz & Morais 1997; Ali & Agrawal 2012), and range seasonally in
the their diet breadth (Scherrer et al. 2016). The indiscriminate consume of savanna
plants by generalist herbivores can explain the lack of effect of neighbor plants on leaf
damage of focal plants.
Several herbivores insects coevolved with their host plants (Coley & Barone
1996) and this represent evolutionary and ecological consequences for plant-herbivore
interactions (Becerra 2003, 2007; Futuyma & Agrawal 2009). These species of
herbivores usually are specialized in their host plants, consuming their leaves
independently of the traits from neighbor individuals. Another potential explanation
may be related to the preferential consume of young leaves by herbivore insects. When
young, savanna species leaves have high nutritional quality and are vulnerable to

109
herbivores, contrary to mature leaves that have low nutrient concentrations and high
protection against herbivores (Coley & Barone 1996; Awmack & Leather 2002;
Lewinsohn, Freitas & Prado 2005; Mundim et al. 2009). Mature leaves of savanna plant
species have strategy of protection against herbivores, such as thick leaves with
trichomes and high leaf carbon-nitrogen ratio (Dantas & Batalha 2012; Dantas, Batalha
& Pausas 2013). Moreover, savanna plants synchronize the leaf production at the end of
dry season (Marquis, Diniz & Morais 2001; Mundim et al. 2009), which can affect the
seasonal supply of resources for herbivores (Scherrer et al. 2016). Thus, insect
herbivores in Neotropical savannas tend to consume indiscriminately immature leaves
independent of neighbouring context, mainly in stage of high leaf production.
Our results also showed that phylogenetic isolation, leaf toughness, plant height
and conspecific abundance do not influence the herbivore damage on the plants of this
Neotropical savanna. The non-effect of phylogenetic isolation on the herbivory can be
explained that, even for important traits in the determination of leaf damage by
herbivore, the leaf damage level did not have relationship with the kinship between
species (Agrawal 2007; Pearse & Hipp 2009; Uriarte et al. 2010; Gilbert et al. 2012),
because same species phylogenetically more related or distant are consumed by
herbivores. Pearse and Hipp (2009) argument that leaf volatile chemicals can be more
phylogenetically informative than structural defence traits.
A negative effect of conspecific abundance via shared enemies is the main
mechanism behind the well-tested Janzen-Connell hypothesis (Janzen 1970; Comita et
al. 2014; Kim & Underwood 2015). However, we did not find effects of conspecific
abundance at the plot on the levels of herbivory. The relationship between plant patch
size and insect abundance is highly variable and dependent on the group specificities
(Bukovinszky et al. 2005; Hambäck & Englund 2005). Therefore, this lack of effect

110
may be a reflection of the response pattern of visual and olfactory searchers of the most
important chewing groups in our study system, that can be able to reduce differences
between small and large patches, such as orthopteran and larval lepidopteran (Hambäck
& Englund 2005).
This is the first study that investigate the leaf damage caused by insect
herbivores in a neighboring context in Neotropical savannas. In conclusion, we
highlight that the phylogenetic isolation, specific leaf area, leaf toughness, plant height
and plant abundance not influenced the herbivore damage on the woody plants of
Neotropical savannas, both in the individual context as at neighboring plants. Overall,
our results suggest that dominance of herbivore generalists, coevolution between plant
and specialist herbivores and preferential consume of young leaves can be more
important than the neighboring context for determine the leaf damage by herbivores in
savanna woody species studied. As savanna plant species have leaves with low quality
nutritional, herbivores compensate increasing the consumption rates to obtain more
nitrogen from leaves. Furthermore, generalist herbivores consume immature leaves
because they are vulnerable and present high-quality nutrients (Marquis et al. 2001).
Future studies may improve these investigations, adding more species and develop this
approach with other plant groups, including herbaceous and grasses, and species from
other Neotropical vegetation types adjacent to savannas, such as forests and grassland
environments.
Acknowledgements
The authors are thankful to the Coordenação de Aperfeiçoamento de Pessoal de Nível
Superior (CAPES) for the grant to LM, FLS, LLB and WSA and to the Brazilian
Research Council (CNPq) for a productivity grant to MVC and MAN. We thank the

111
CNPq/Fapeg-Brasil by supported to search by PELD (Sites 13) and GENPAC program
(306573/2009-1).
References
Agrawal, A.A. (2007) Macroevolution of plant defense strategies. Trends in Ecology &
Evolution, 22, 103–109.
Ali, J.G. & Agrawal, A.A. (2012) Specialist versus generalist insect herbivores and
plant defense. Trends in Plant Science, 17, 293–302.
APG-IV. (2016) An update of the Angiosperm Phylogeny Group classification for the
orders and families of flowering plants: APG IV. Botanical Journal of the Linnean
Society, 181, 1–20.
Awmack, C.S. & Leather, S.R. (2002) Host plant quality and fecundity in herbivorous
insects. Annual Review of Entomology, 47, 817–844.
Baraza, E., Zamora, R. & Hódar, J.A. (2006) Conditional outcomes in plant-herbivore
interactions: neighbours matter. Oikos, 113, 148–156.
Barbosa, P., Hines, J., Kaplan, I., Martinson, H., Szczepaniec, A. & Szendrei, Z. (2009)
Associational resistance and associational susceptibility: having right or wrong
neighbors. Annual Review of Ecology, Evolution, and Systematics, 40, 1–20.
Becerra, J.X. (2003) Synchronous coadaptation in an ancient case of herbivory.
Proceedings of the National Academy of Sciences, 100, 12804–12807.
Becerra, J.X. (2007) The impact of herbivore-plant coevolution on plant community
structure. Proceedings of the National Academy of Sciences, 104, 7483–7488.
Bukovinszky, T., Potting, R.P.J., Clough, Y., van Lenteren, J.C. & Vet, L.E.M. (2005)
The role of pre- and post- alighting detection mechanisms in the responses to patch
size by specialist herbivores. Oikos, 109, 435–446.

112
Callaway, R.M., Kikvidze, Z. & Kikodze, D. (2000) Facilitation by unpalatable weeds
may conserve plant diversity in overgrazed meadows in the Caucasus Mountains.
Oikos, 89, 275–282.
Cárdenas, R.E., Valencia, R., Kraft, N.J.B., Argoti, A. & Dangles, O. (2014) Plant traits
predict inter- and intraspecific variation in susceptibility to herbivory in a
hyperdiverse Neotropical rain forest tree community (ed N Swenson). Journal of
Ecology, 102, 939–952.
Carmona, D., Lajeunesse, M.J. & Johnson, M.T.J. (2011) Plant traits that predict
resistance to herbivores. Functional Ecology, 25, 358–367.
Cavender-Bares, J., Kozak, K.H., Fine, P.V.A. & Kembel, S.W. (2009) The merging of
community ecology and phylogenetic biology. Ecology Letters, 12, 693–715.
Champagne, E., Tremblay, J.-P. & Côté, S.D. (2016) Spatial extent of neighboring
plants influences the strength of associational effects on mammal herbivory.
Ecosphere, 7, e01371.
Chen, Y., Wright, S.J., Muller-Landau, H.C., Hubbell, S.P., Wang, Y. & Yu, S. (2016)
Positive effects of neighborhood complementarity on tree growth in a Neotropical
forest. Ecology, 97, 776–785.
Coley, P.D. & Barone, J.A. (1996) Herbivory and plant defenses in tropical forests.
Annual Review of Ecology and Systematics, 27, 305–335.
Comita, L.S., Queenborough, S.A., Murphy, S.J., Eck, J.L., Xu, K., Krishnadas, M.,
Beckman, N. & Zhu, Y. (2014) Testing predictions of the Janzen-Connell
hypothesis: a meta-analysis of experimental evidence for distance- and density-
dependent seed and seedling survival (ed L Gómez-Aparicio). Journal of Ecology,
102, 845–856.
Cornelissen, T., Wilson Fernandes, G. & Vasconcellos-Neto, J. (2008) Size does matter:

113
variation in herbivory between and within plants and the plant vigor hypothesis.
Oikos, 117, 1121–1130.
Dantas, V. de L. & Batalha, M.A. (2012) Can antiherbivory resistance explain the
abundance of woody species in a Neotropical savanna? Botany, 90, 93–99.
Dantas, V.L., Batalha, M.A. & Pausas, J.G. (2013) Fire drives functional thresholds on
the savanna–forest transition. Ecology, 94, 2454–2463.
Diniz, I.R. & Morais, H.C. (1997) Lepidopteran caterpillar fauna of cerrado host plants.
Biodiversity and Conservation, 6, 817–836.
Furley, P.A. & Ratter, J.A. (1988) Soil resources and plant communities of the central
Brazilian Cerrado and their development. Journal of Biogeography, 15, 97–108.
Futuyma, D.J. & Agrawal, A.A. (2009) Macroevolution and the biological diversity of
plants and herbivores. Proceedings of the National Academy of Sciences, 106,
18054–18061.
Gilbert, G.S., Magarey, R., Suiter, K. & Webb, C.O. (2012) Evolutionary tools for
phytosanitary risk analysis: phylogenetic signal as a predictor of host range of
plant pests and pathogens. Evolutionary Applications, 5, 869–878.
Gilbert, G.S. & Webb, C.O. (2007) Phylogenetic signal in plant pathogen-host range.
Proceedings of the National Academy of Sciences, 104, 4979–4983.
Hakes, A.S. & Cronin, J.T. (2011) Environmental heterogeneity and spatiotemporal
variability in plant defense traits. Oikos, 120, 452–462.
Hambäck, P.A. & Englund, G. (2005) Patch area, population density and the scaling of
migration rates: the resource concentration hypothesis revisited. Ecology Letters, 8,
1057–1065.
Hanley, M.E., Lamont, B.B., Fairbanks, M.M. & Rafferty, C.M. (2007) Plant structural
traits and their role in anti-herbivore defence. Perspectives in Plant Ecology,

114
Evolution and Systematics, 8, 157–178.
Janzen, D.H. (1970) Herbivores and the Number of Tree Species in Tropical Forests.
The American Naturalist, 104, 501–528.
Kim, T.N. & Underwood, N. (2015) Plant neighborhood effects on herbivory: damage
is both density and frequency dependent. Ecology, 96, 1431–1437.
Klink, C.A. & Machado, R.B. (2005) Conservation of the Brazilian Cerrado.
Conservation Biology, 19, 707–713.
Lebrija-Trejos, E., Wright, S.J., Hernández, A. & Reich, P.B. (2014) Does relatedness
matter? Phylogenetic density-dependent survival of seedlings in a tropical forest.
Ecology, 95, 940–951.
Lewinsohn, T.M., Freitas, A.V.L. & Prado, P.I. (2005) Conservation of terrestrial
invertebrates and their habitats in Brazil. Conservation Biology, 19, 640–645.
Loranger, J., Meyer, S.T., Shipley, B., Kattge, J., Loranger, H., Roscher, C. & Weisser,
W.W. (2012) Predicting invertebrate herbivory from plant traits: evidence from 51
grassland species in experimental monocultures. Ecology, 93, 2674–2682.
Marquis, R.J., Diniz, I.R. & Morais, H.C. (2001) Patterns and correlates of interspecific
variation in foliar insect herbivory and pathogen attack in Brazilian cerrado.
Journal of Tropical Ecology, 17, 127–148.
Meijden, E. (1996) Plant defence, an evolutionary dilemma: contrasting effects of
(specialist and generalist) herbivores and natural enemies. Entomologia
Experimentalis et Applicata, 80, 307–310.
Mundim, F.M., Costa, A.N. & Vasconcelos, H.L. (2009) Leaf nutrient content and host
plant selection by leaf-cutter ants, Atta laevigata , in a Neotropical savanna.
Entomologia Experimentalis et Applicata, 130, 47–54.
Murphy, S.J., Xu, K. & Comita, L.S. (2016) Tree seedling richness, but not

115
neighborhood composition, influences insect herbivory in a temperate deciduous
forest community. Ecology and Evolution, 6, 6310–6319.
Pearse, I.S. & Hipp, A.L. (2009) Phylogenetic and trait similarity to a native species
predict herbivory on non-native oaks. Proceedings of the National Academy of
Sciences, 106, 18097–18102.
Peel, M.C., Finlayson, B.L. & McMahon, T.A. (2007) Updated world map of the
Köppen-Geiger climate classification. Hydrology and Earth System Sciences, 11,
1633–1644.
Pérez-Harguindeguy, N., Díaz, S., Garnier, E., Lavorel, S., Poorter, H., Jaureguiberry,
P., Bret-Harte, M.S., Cornwell, W.K., Craine, J.M., Gurvich, D.E., Urcelay, C.,
Veneklaas, E.J., Reich, P.B., Poorter, L., Wright, I.J., Ray, P., Enrico, L., Pausas,
J.G., de Vos, A.C., Buchmann, N., Funes, G., Quétier, F., Hodgson, J.G.,
Thompson, K., Morgan, H.D., ter Steege, H., Sack, L., Blonder, B., Poschlod, P.,
Vaieretti, M. V., Conti, G., Staver, A.C., Aquino, S. & Cornelissen, J.H.C. (2013)
New handbook. Australian Journal of Botany, 61, 167.
Queenborough, S.A., Burslem, D.F.R.P., Garwood, N.C. & Valencia, R. (2007)
Neighborhood and community interactions determine the spatial patterns of
tropical tree seedling survival. Ecology, 88, 2248–2258.
R Core Team, R. (2016) R: A language and environment for statistical computing. R
foundation for statistical computing.
Ramos-Neto, M.B. & Pivello, V.R. (2000) Lightning fires in a Brazilian savanna
national park: rethinking management strategies. Environmental Management, 26,
675–684.
Ratter, J.A., Ribeiro, J.F. & Bridgewater, S. (1997) The Brazilian Cerrado vegetation
and threats to its biodiversity. Annals of Botany, 80, 223–230.

116
Ribeiro, S.P., Carneiro, M.A.A. & Fernandes, G.W. (1998) Free-feeding insect
herbivores along environmental gradients in Serra do Cipó: basis for a
management plan. Journal of Insect Conservation, 2, 107–118.
Ribeiro, J.F. & Walter, B.M.T. (2008) As principais fitofisionomias do bioma Cerrado.
Cerrado: ecologia e flora (eds S.M. Sano, S.P. Almeida & J.F. Ribeiro), pp. 151–
212. Embrapa Cerrados, Brasília.
Root, R.B. (1973) Organization of a plant-arthropod association in simple and diverse
habitats: the fauna of Collards (Brassica oleracea). Ecological Monographs, 43,
95–124.
Satterthwaite, F.E. (1946) An approximate distribution of estimates of variance
components. Biometrics Bulletin, 2, 110.
Scherrer, S., Lepesqueur, C., Vieira, M.C., Almeida-Neto, M., Dyer, L., Forister, M. &
Diniz, I.R. (2016) Seasonal variation in diet breadth of folivorous Lepidoptera in
the Brazilian cerrado. Biotropica, 48, 491–498.
Schuldt, A., Bruelheide, H., Durka, W., Eichenberg, D., Fischer, M., Kröber, W.,
Härdtle, W., Ma, K., Michalski, S.G., Palm, W.-U., Schmid, B., Welk, E., Zhou, H.
& Assmann, T. (2012) Plant traits affecting herbivory on tree recruits in highly
diverse subtropical forests (ed V Novotny). Ecology Letters, 15, 732–739.
Silva, D.M. da & Batalha, M.A. (2008) Soil-vegetation relationships in cerrados under
different fire frequencies. Plant and Soil, 311, 87–96.
Silva, D.M. da & Batalha, M.A. (2011) Defense syndromes against herbivory in a
cerrado plant community. Plant Ecology, 212, 181–193.
Simon, M.F., Grether, R., de Queiroz, L.P., Skema, C., Pennington, R.T. & Hughes,
C.E. (2009) Recent assembly of the Cerrado, a neotropical plant diversity hotspot,
by in situ evolution of adaptations to fire. Proceedings of the National Academy of

117
Sciences of the United States of America, 106, 20359–64.
Twigg, L.E. & Socha, L. V. (1996) Physical versus chemical defence mechanisms in
toxic Gastrolobium. Oecologia, 108, 21–28.
Underwood, N., Inouye, B.D. & Hambäck, P.A. (2014) A conceptual framework for
associational effects: when do neighbors matter and how would we know? The
Quarterly Review of Biology, 89, 1–19.
Uriarte, M., Swenson, N.G., Chazdon, R.L., Comita, L.S., John Kress, W., Erickson, D.,
Forero-Montaña, J., Zimmerman, J.K. & Thompson, J. (2010) Trait similarity,
shared ancestry and the structure of neighbourhood interactions in a subtropical
wet forest: implications for community assembly. Ecology Letters, 13, 1503–1514.
Zanne, A.E., Tank, D.C., Cornwell, W.K., Eastman, J.M., Smith, S.A., FitzJohn, R.G.,
McGlinn, D.J., O’Meara, B.C., Moles, A.T., Reich, P.B., Royer, D.L., Soltis, D.E.,
Stevens, P.F., Westoby, M., Wright, I.J., Aarssen, L., Bertin, R.I., Calaminus, A.,
Govaerts, R., Hemmings, F., Leishman, M.R., Oleksyn, J., Soltis, P.S., Swenson,
N.G., Warman, L. & Beaulieu, J.M. (2014) Three keys to the radiation of
angiosperms into freezing environments. Nature, 506, 89–92.
Zava, P.C. & Cianciaruso, M. V. (2014) Can we use plant traits and soil characteristics
to predict leaf damage in savanna woody species? Plant Ecology, 215, 625–637.

118
Supporting information
Table S1. List of families, species and number of individuals recorded in this study.
The species were identified and organized following the last Angiosperm Phylogeny
Group classification (APG-IV 2016). Bold type indicates the 27 cerrado most abundant
and frequent species utilized in the analyzes
Family Species Individuals
Annonaceae Annona crassifolia Mart. 4
Annona coriacea Mart. 1
Bocageopsis mattogrossensis (R.E.Fr.) R.R.Fr. 1
Apocynaceae Aspidosperma macrocarpon Mart. 1
Aspidosperma nobile Müll.Arg 1
Hancornia speciosa Gomes 1
Araliaceae Schefflera macrocarpa (Cham. & Schltdl.) Frodin 11
Schefflera vinosa (Cham. & Schltdl.) Frodin & Fiaschi 13
Eremanthus erythropappus (DC.) MacLeish 24
Piptocarpha rotundifolia (Less.) Baker 25
Bignoniaceae Handroanthus ochraceus (Cham.) Mattos 16
Tabebuia aurea (Silva Manso) Benth. & Hook.f. ex
S.Moore
2
Calophyllaceae Kielmeyera coriacea Mart. & Zucc. 6
Kielmeyera grandiflora (Wawra) Saddi 7
Kielmeyera rubriflora Cambess. 3
Caryocaraceae Caryocar brasiliense Cambess. 14
Celastraceae Plenckia populnea Reissek 1
Chrysobalanaceae Licania humilis Cham. & Schltdl. 5
Connaraceae Connarus suberosus Planch. 22
Rourea induta Planch. 5
Dilleniaceae Davilla elliptica A.St.-Hil. 13
Ebenaceae Diospyros hispida A.DC. 35
Erythroxylaceae Erythroxylum engleri O.E.Schulz 23
Erythroxylum suberosum A.St.-Hil. 27
Fabaceae Anadenanthera peregrina (L.) Spe.g., 10
Andira cujabensis Benth. 6
Bowdichia virgilioides Kunth 7

119
Family Species Individuals
Dimorphandra mollis Benth. 10
Hymenaea stigonocarpa Mart. ex Hayne 9
Leptolobium dasycarpum Vogel 11
Mimosa amnis-atri Barneby 1
Tachigali aurea Tul. 2
Tachigali vulgaris L.G.Silva & H.C.Lima 2
Stryphnodendron adstringens (Mart.) Coville 22
Stryphnodendron rotundifolium Mart. 3
Malpighiaceae Byrsonima basiloba A.Juss. 3
Byrsonima coccolobifolia Kunth 26
Byrsonima pachyphylla A.Juss. 4
Byrsonima verbascifolia (L.) DC. 4
Malvaceae Eriotheca gracilipes (K.Schum.) A.Robyns 6
Eriotheca pubescens (Mart. & Zucc.) Schott & Endl. 13
Melastomataceae Miconia albicans (Sw.) Triana 91
Miconia ferruginata DC. 2
Miconia ligustroides (DC.) Naudin 4
Mouriri elliptica Mart. 1
Myrtaceae Campomanesia adamantium (Cambess.) O.Berg 2
Eugenia aurata O.Berg 2
Eugenia punicifolia (Kunth) DC. 7
Eugenia ternatifolia Cambess. 2
Eugenia sp. 1
Myrcia bella Cambess. 73
Myrcia camapuanensis N.Silveira 11
Myrcia guianensis (Aubl.) DC. 15
Myrcia multiflora (Lam.) DC. 1
Myrcia variabilis DC. 1
Myrcia vestita DC. 3
Myrcia sp. 2
Psidium laruotteanum Cambess. 54
Nyctaginaceae Guapira noxia (Netto) Lundell 6
Ochnaceae Ouratea hexasperma (A.St.-Hil.) Baill. 65
Ouratea spectabilis (Mart.) Engl. 21
Proteceae Roupala montana Aubl. 24

120
Family Species Individuals
Rubiaceae Palicourea rigida Kunth 7
Salicaceae Casearia sylvestris Sw. 9
Sapotaceae Pouteria ramiflora (Mart.) Radlk. 91
Pouteria torta (Mart.) Radlk. 51
Styracaceae Styrax ferrugineus Nees & Mart. 4
Vochysiaceae Qualea grandiflora Mart. 12
Qualea multiflora Mart. 1
Qualea parviflora Mart. 12
Vochysia cinnamomea Pohl 5
Table S2. Predictor variables used in the model and their definition.
Predictor variables Definition
Conspecific abundance
(AB)
The number of individuals of the same species in the
same plot.
Phylogenetic isolation (PI) The total sum of branches separating each individual and
all other heterospecific individuals in the same plot.
Relative SLA (SLA) The difference between the specific leaf area (SLA) of the
individual and the mean SLA of the other individuals in
the plot.
Relative height The difference between the plant height of the individual
and the mean height of the other individuals in the plot.
Relative leaf toughness
(LT)
The difference between the leaf toughness (TO) of the
individual and the mean TO of the other individuals in the
plot.
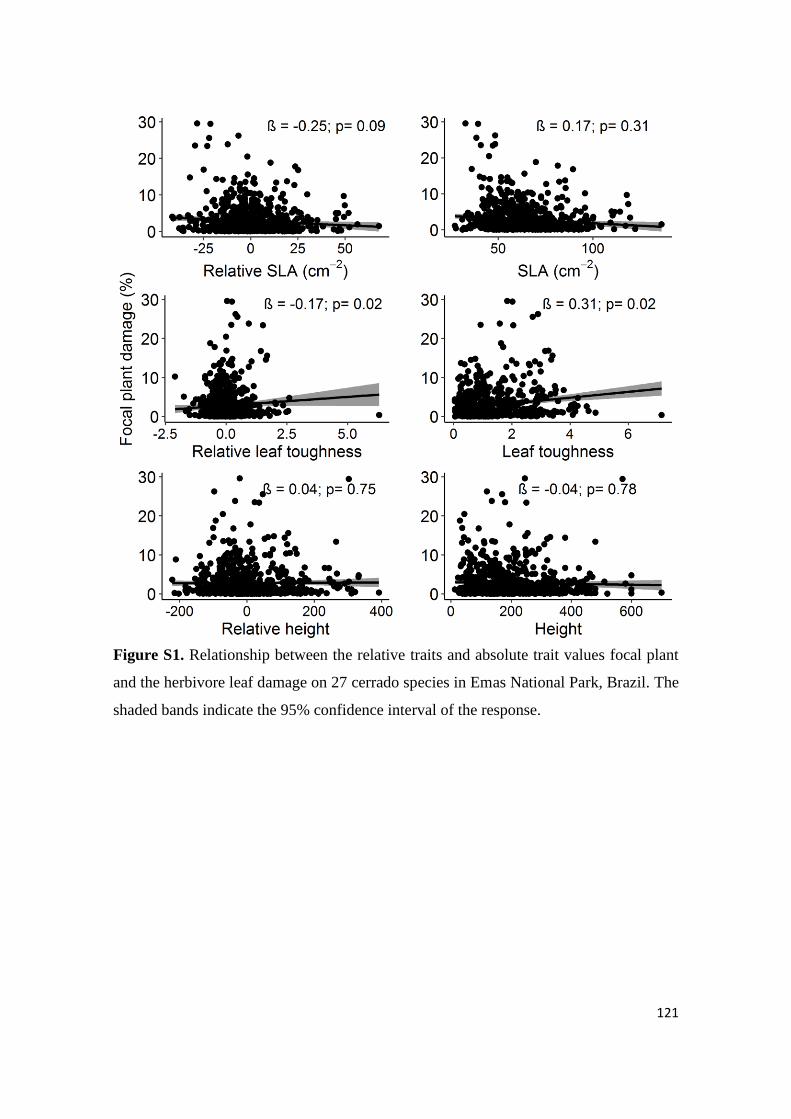
121
Figure S1. Relationship between the relative traits and absolute trait values focal plant
and the herbivore leaf damage on 27 cerrado species in Emas National Park, Brazil. The
shaded bands indicate the 95% confidence interval of the response.

122
Conclusão Geral
Neste trabalho demonstramos que:
Para ambientes contrastantes que ocorrem lado a lado como florestas estacionais e
cerrado sentido restrito, as estratégias ecológicas das espécies estão de acordo com
os fatores limitantes para a ocorrência de espécies em cada um destes habitats.
Atributos aquisitivos que representam habilidade competitiva e rápida aquisição de
recursos foram relacionados para espécies especialistas de floresta, enquanto
atributos conservativos que promove resistência contra o fogo e estresse ambiental
foram associados a espécies especialistas de savanas. Além disso, a plasticidade
fenotípica pode determinar a habilidade das espécies em habitats contrastantes
como florestas estacionais e cerrado sentido restrito.
Espécies de comunidades de florestas estacionais e cerrado sentido restrito de fato
adotam diferentes estratégias relacionada ao uso de recursos. Nós demostramos
uma forte relação negativa de densidade de indivíduos com o gradiente de
fertilidade e toxicidade do solo. Para os valores médios dos atributos, nós
registramos que em solos mais férteis e menos tóxicos tem espécies com atributos
relacionados à estratégias de aquisição de recursos, enquanto solos com baixa
fertilidade e mais tóxicos tem espécies com atributos associados à estratégias de
conservação de recursos.
Em ambientes savânicos, a distância ecológica e evolutiva de uma espécie focal
para a sua vizinhança não é fundamental para determinar o nível de dano foliar por
herbívoros. Sugerimos que outros fatores, tais como dominância de herbívoros

123
generalistas, co-evolução de plantas e herbívoros e consumo de folhas jovens são
mais importantes para determinar o dano foliar do que o contexto da vizinhança.


![Guia de Estudo - Deus - Face a Face Com Sua Majestade - John MacArthur[1]](https://img.document.onl/doc/110x75/577ce11d1a28ab9e78b4c52e/guia-de-estudo-deus-face-a-face-com-sua-majestade-john-macarthur1.jpg)