Embed Size (px)
Citation preview
UNIVERSIDADE FEDERAL DE PERNAMBUCO
CENTRO DE CIÊNCIAS BIOLÓGICAS
DOUTORADO EM CIÊNCIAS BIOLÓGICAS
APLICAÇÃO DE POLÍMEROS COMO MATRIZES NO
DESENVOLVIMENTO DE BIOSSENSORES E NA PURIFICAÇÃO DE
PROTEÍNAS
ROSÂNGELA FERREIRA FRADE DE ARAÚJO
RECIFE - 2006

APLICAÇÃO DE POLÍMEROS COMO MATRIZES NO
DESENVOLVIMENTO DE BIOSSENSORES E NA PURIFICAÇÃO DE
PROTEÍNAS
ROSÂNGELA FERREIRA FRADE DE ARAÚJO
Tese apresentada ao Curso de Doutorado em Ciências
Biológicas da Universidade Federal de Pernambuco, como
parte dos requisitos para obtenção do título de Doutor em
Ciências Biológicas, na área de Biotecnologia.
ORIENTADOR: PROF. DR. JOSÉ LUIZ DE LIMA FILHO
CO-ORIENTADORA: PROF. DRA. ROSA AMÁLIA FIREMAN DUTRA
RECIFE – 2006
Araújo, Rosângela Ferreira Frade de Aplicação de polímeros como matrizes no
desenvolvimento de biossensores e na purificação deproteínas / Rosângela Ferreira Frade de Araújo Recife : OAutor, 2006.
164 folhas. il., fig., tab., gráf.
Tese (doutorado) – Universidade Federal de Pernambuco. CCB. Ciências Biológicas - Biotecnologia, 2006.
Inclui bibliografia. 1. Polímeros 2. Biossensores. 3.PurificaçãoL. I. Título.
57
CDU (2.ed.) UFPE
570 CDD (22.ed.) CCB 013


Ao meu esposo e amigo Carlinhos,
aos meus filhos, Clarissa, Arthur, Aline
e Carlos Alberto III, aos meus
familiares, pelo amor, incentivo e
compreensão,
DEDICO.
AGRADECIMENTOS
A todos que, direta ou indiretamente, contribuíram para a realização deste trabalho e
em especial:
A Deus, razão de minha vida, cuja palavra me conforta e me sustenta a cada dia.
A todos que fazem parte do Programa de Pós-Graduação em Ciências Biológicas da
Universidade Federal de Pernambuco, pela oportunidade de realizar o Curso de Doutorado
Ao meu orientador, Prof. Dr. José Luiz de Lima Filho, pelo apoio, amizade,
confiança e incentivo constante.
A Profa. Dra Rosa Amália Fireman Dutra, pelas valiosas contribuições técnico-
científicas.
Ao Dr. Jorge Brito, pela paciência e colaboração.
À Profa. Dra. Ana Lúcia Figueiredo Porto, pelo apoio e pelas boas sugestões.
Ao Prof. Dr. Cosme Rafael, pela amizade e pelas contribuições nas análises
estatísticas.
Ao Prof. Dr. William Ledingham, pela paciência e dedicação na revisão dos
trabalhos.
Às Profas. Dra. Nereide, Dra. Danyelly Bruneska, Dra. Keila Moreira, Dra. Maria
Taciana, Dra. Maria da Mascena, Dra. Elizabeth Chaves, e Dra. Maria da Paz, pelo apoio e
incentivo.
Ao Prof. Dr. Romildo pelas valiosas sugestões.

Às Profas. Dra. Elizabeth Malageño e Dra. Silvana pela disponibilização de
materiais e equipamento no setor de Imunologia do LIKA.
Ao Prof. Dr. Flamarion, pelos esclarecimentos e disponibilização do Laboratório de
Eletroquímica do Departamento de Química Fundamental.
Ao Prof. Dr. Manoel Eusébio, Abner, Péricles e Victor do Centro de Informática,
pelo incentivo e colaboração.
Ao Prof. Dr. João Ricardo pela colaboração.
Aos Profs. Dra. Belmira, Dr. Reginaldo, Dr. Valdir, Dra. Bernadete, Dr. Daniel e
Dra. inês do Departamento de Fisiologia pela compreensão, apoio e incentivo,
principalmente durante meu contrato como Profa Substituta.
Aos colegas do Curso de Doutorado Profa. Neide, Prof. Cláudio Gabriel, Flaviane,
Eliana e Betânia pelo incentivo e colaboração.
Aos colegas Tatiana Porto, Dra. Maria Isaura, Paulo e Alessandro Albertini do
Laboratório de Biotecnologia, Givanildo, Sérgio e Ian do Laboratório de Bioquímica do
LIKA, pelo constante prazer em servir.
As colegas que trabalharam comigo no Laboratório de Biosensores do LIKA,
Renata Sousa, Karla Patrícia, Érica, Daiane e Cássia, aos que continuam fazendo parte do
grupo, Fernando Teles, Renata, Alessandra, Isabela, Cíntia, Flávia e Roberto, pela
paciência, amizade e parceria.
Aos funcionários do LIKA, Moisés, Sr. Otaviano, Oscar, Cláudio, Conceição, Ilma,
Isabel, Filipe, Paulina, Dona Celestina, Vera, Cleide, e Paulo pelos inúmeros serviços
prestados.
Ao Conselho Nacional de Desenvolvimento Científico e Tecnológico-CNPq pela
bolsa concedida.
SUMÁRIO
LISTA DE FIGURAS...........................................................................................................I
LISTA DE TABELAS........................................................................................................VI
LISTA DE ABREVIATURAS........................................................................................VIII
RESUMO..............................................................................................................................X
ABSTRACT.......................................................................................................................XII
INTRODUÇÃO.....................................................................................................................1
1. Biossensores........................................................................................................................2
2. Características ideais de um biossensor..............................................................................3
3. Transdutores........................................................................................................................4
3.1. Transdutores eletroquímicos............................................................................................6
3.1.1 Transdutor potenciométrico.........................................................................................10
3.1.2 Transdutor amperométrico...........................................................................................11
3.1.3 Transdutor condutimétrico...........................................................................................14
3.1.4 Construção de eletrodos de trabalho............................................................................14
3.1.4.1 Eletrodos quimicamente modificados.......................................................................16
3.2 Transdutores eletromagnéticos........................................................................................18
3.2.1 Transdutor acústico......................................................................................................18
3.2.2 Transdutor óptico.........................................................................................................21
4. Imobilização de biomoléculas...........................................................................................24
4.1 Utilização de quitosana na composição de matrizes para imobilização..........................26
4.2 Imobilização de anticorpos em suportes metálicos.........................................................28
5. A enzima lactato desidrogenase........................................................................................30

6. Utilização de biossensores para detecção de desidrogenases e seus substratos................32
7. Purificação de lactato desidrogenase a partir de sistemas bifásicos aquosos....................33
OBJETIVOS........................................................................................................................36
CAPÍTULO I- ARTIGO CIENTÍFICO 1........................................................................38
CAPÍTULO II- ARTIGO CIENTÍFICO 2.......................................................................60
CAPÍTULO III- ARTIGO CIENTÍFICO 3.....................................................................81
CONCLUSÕES.................................................................................................................103
PERSPECTIVAS..............................................................................................................106
REFERÊNCIAS BIBLIOGRÁFICAS............................................................................108
ANEXOS............................................................................................................................125

I
LISTA DE FIGURAS
INTRODUÇÃO
Figura 1. Desenho esquemático da configuração dos biossensores mostrando os principais
modos de transdução. ............................................................................................................5
Figura 2. Representação esquemática da conversão do ferroceno (fc) a ferriceno (fc+). ....8
Figura 3. (A) eletrodo de referência (ER) de prata/cloreto de prata. (B) uma simples célula
eletroquímica para a medida do potencial da solução usando um eletrodo inerte, chamado
eletrodo de trabalho (ET) e um ER. O eletrólito consiste de uma solução de um sal
dissociado que reduz a resistência do sistema. .................................................................... 9
Figura 4. Produção de eletrodos impressos. Fonte: http://192.107.77.201/post002.htm.....16
Figura 5. A) Fotografia de um cristal de quartzo. B) Corte AT de um cristal de quartzo.
Fonte: Janshoff et al, 2000. ................................................................................................20
Figura 6. Representação esquemática de um típico biossensor RPS. 1-Desenho
experimental. Moléculas detectoras são imobilizadas na superfície metálica, em seguida o
analito é injetado e então a interação específica é medida. 2- O gráfico luz refletida versus
ângulo de incidência mostra o deslocamento do ângulo de ressonância após o
reconhecimento do analito. .................................................................................................23
II
Figura 7. Esquema demonstrativo das diferenças estruturas entre os polímeros: quitina (1),
quitosana (2) e celulose (3). Fonte: www.mdsg.umd.edu/.../ GIFs/molecules.gif. ............27
Figura 8. Diagrama ilustrando a imobilização direcionada (A) e não direcionada (B) de
anticorpos em imunoensaios. ..............................................................................................28
Figura 9. Estrutura da imunoglobulina G mostrando as zonas variáveis (Fab) e a zona não
variável (Fc). Adaptada de http//: www.cat.cc.md.us/.../5classes/u3fg9a.html. ................29
Figura 10. Representação da estrutura quaternária da lactato desidrogenase (LDH 1).
Fonte:http://www.med.unibs.it. ..........................................................................................31
Figura 11. Diagrama de fase dos sistemas bifásicos compostos de polietileno glicol 6000 e
dextran 70000. Fonte: Han et al, 1997. ..............................................................................35
CAPÍTULO I- ARTIGO CIENTÍFICO 1
Figure 1. The means (2 replicates) of the differences between the absorbances found by the
ELISA method with and without IgG (2μg/ml) immobilized on gold plates covered with
chitosan using different blocking solutions followed by same letters not differ statistically
(p<0.05) to Tukey’s HSD. The small letters make comparisons between S1 or S2 in
different blocking solutions and the capital letters comparing S1 and S2 in each blocking
solution. ...............................................................................................................................54
III
Figure 2. Comparison between the absorbances obtained by ELISA method immobilizing
IgG (2µg/ml) on gold plates without and with chitosan (prepared with 0.8% NaOH - S1 and
with 8% NaOH - S2). ..........................................................................................................55
Figure 3. Effects of the chitosan in absorbances obtained by ELISA method immobilizing
IgG (2μg/ml) on microplate using different blocking solutions. The means (6 replicates)
followed by the same letters do not differ statistically (p<0.05) to Tukey’s
HSD. ....................................................................................................................................56
Figure 4. Effects of blocking solutions in absorbances obtained by ELISA method
immobilizing IgG (2 μg/ml) on microplate without and with chitosan. The means (2
replicates) followed by the same letters do not differ statistically (p < 0.05) to Tukey’s
HSD. ...................................................................................................................................57
Figure 5. Absorbances obtained by ELISA method immobilizing IgG (2ug/ml) on gold
plates covered with chitosan at different times after the preparation of these supports. The
means (2 replicates) followed by the same letters do not differ statistically (p<0.05) to
Tukey’s HSD. The small letters make comparisons between S1 or S2 at different times and
the capital letters comparing S1 and S2 in each time. .........................................................58
Figure 6. Variation of the crystal resonant frequency after the immobilization of the IgG in
different concentrations (0.5 to 3.5 µg/ml) on gold electrode covered with chitosan
(prepared with 0.8% NaOH). ..............................................................................................59

IV
CAPÍTULO II- ARTIGO CIENTÍFICO 2
Figure1. Schematic representation of enzymatic assay format. 1- Adsorption of the NADH;
2 and 3- adsorption of the glutaraldehyde; 4- electrode on pyruvate presence and 5-
electrode on pyruvate and LDH presence. ..........................................................................75
Figure 2. Scanning electron micrograph of epoxy silver and TCNQ modified electrode.
Magnification was 700. .......................................................................................................76
Figure 3. Cyclic voltammogram of the working electrode without NADH (dotted line) and
with NADH (full line). Scan rate, 50mV/s. ........................................................................77
Figure 4. Cyclic voltammograms of the working electrodes with NADH (A) and with
NADH and glutaraldehyde on surface (B) in 1.44mM pyruvate; dotted line – without
enzyme and full line – with enzyme (200 U/l). Scan rate, 50mV/s. ...................................78
Figure 5. Cyclic voltammogram of the working electrode using 200U/l LDH on different
pyruvate concentrations: 1.92 mM (dotted line) and 2.5 mM (full line). Scan rate, 50
mV/s......................................................................................................................................79
Figure 6. Relation between enzyme activity and maximum anodic current gotten in 0.5V
by epoxy silver and TCNQ modified electrode. .................................................................80

V
CAPÍTULO III- ARTIGO CIENTÍFICO 3
Figure 1. Predicted means for variable k using different polyethylene glycol molecular
mass (MMPEG), polyethylene glycol concentration (PEG Conc.) and citrate concentration
(Citrate Conc.) in the 23 factorial design. 95% confidence intervals are shown in
parentheses. .......................................................................................................................100
Figure 2. Pareto chart of standardized effects of the factors: 1 – polyethylene glycol
molecular mass (MMPEG), 2 – polyethylene glycol concentration (PEG Conc.) and 3 -
citrate concentration (Citrate Conc.) on variable k in the 23 factorial design; pure
error=0,0905. 1 by 2, 2 by 3, 1 by 3 and 1*2*3 are the interaction effects between the
factors. ...............................................................................................................................101
VI
LISTA DE TABELAS
INTRODUÇÃO
Tabela 1. Características ideais de um biossensor. Fonte: Diamond,1998. ..........................3
Tabela 2. Exemplos de mediadores redox utilizados na reação da glicose oxidase e seus
potenciais em soluções aquosas. Adaptada de Castilho et al, 2004. ...................................18
CAPÍTULO I- ARTIGO CIENTÍFICO 1
Table 1. Crystal resonant frequency after the different steps of the assays and the variation
of this frequency after the immobilization of IgG (2μg/ml) on gold electrode without and
with chitosan (prepared with 0.8% NaOH). ........................................................................51
CAPÍTULO III- ARTIGO CIENTÍFICO 3
Table 1. Experimental design for partitioning of lactate dehydrogenase from bovine heart
crude extract by polyethylene glycol (PEG) - citrate aqueous two phase systems at pH 7.0
using a 23 factorial design. ...................................................................................................97

VII
Table 2. Effects of the factors: polyethylene glycol molecular mass (MMPEG),
polyethylene glycol concentration (PEG Conc.) and citrate concentration (Citrate Conc.) on
yield in the top phase (YieldT) and in the bottom phase (YieldB), partition coefficient (k)
and purification factor in the top phase (PFT) and in the bottom phase (PFB) obtained by 23
factorial design. ...................................................................................................................98
Table 3. Standarlized effects of polyethylene glycol mass molecular (MMPEG),
polyethylene glycol (PEG) concentration and citrate concentration on yield in the top phase
(YieldT) and in the bottom phase (YieldB), purification factor in the top phase (PFT) and in
the bottom phase (PFB). 1 by 2, 2 by 3, 1 by 3 and, 1*2*3 are the interaction effects
between the factors. The effects represented by darker numbers were statistically significant
(p < 0.05). ............................................................................................................................99

VIII
LISTA DE ABREVIATURAS
ADP-Adenosina difosfato
Ag/AgCl- Prata/cloreto de prata
ATPS- Aqueous two-phase systems
E- Potencial elétrico
ELISA- Enzyme-Linked Immunosorbent Assay
ER- Eletrodo de referência
ET- Eletrodo de trabalho
FAD- Flavina adenina dinucleotídeo
FADH-Flavina adenina dinucleotídeo reduzida
fc- Ferroceno
fc+- Ferriceno
IgG- Imunoglobulina G
LDH- Lactato desidrogenase
MCQ- Microbalança de cristal de quartzo
mg/ml- Miligramas por mililitro
MHz- Mega Hertz
mM- Milimolar
mm- Milímetro
MMPEG- Massa molecular do Polietilenoglicol
mV/s- milivolts por segundo
NAD- Nicotinamida adenina dinucleotídeo
NADH- Nicotinamida adenina dinucleotídeo reduzida

IX
NADP- Nicotinamida adenina dinucleotídeo fosfato
NADPH- Nicotinamida adenina dinucleotídeo fosfato reduzida
nm- Nanômetro
Ox- Forma oxidada
PEG- Polietilenoglicol
PO2- Pressão do oxigênio
PVA- Álcool Polivinílico
Red- Forma reduzida
RPS- Ressonância de plasmons de superfície
SCE- Saturated calomel electrode
TCNQ- Tetracianoquinodimetano
U/l- Unidades por litro
V-Volts
µA- Microampère
µl- microlitro
X
RESUMO
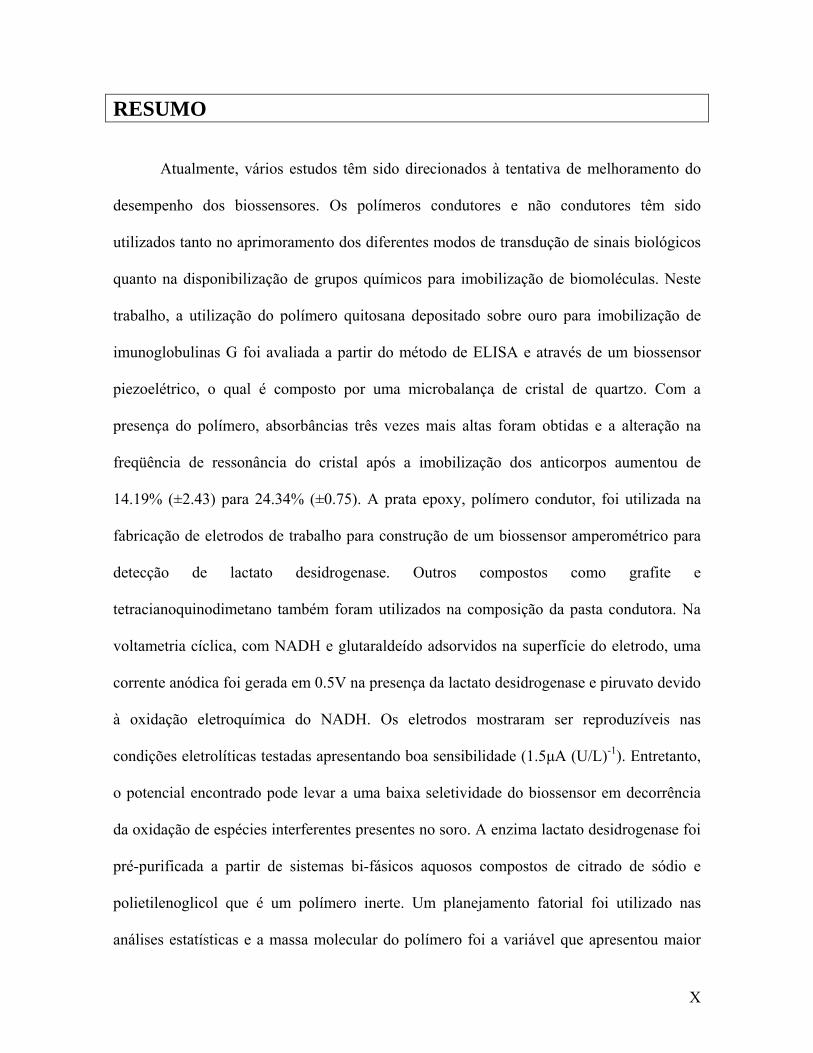
Atualmente, vários estudos têm sido direcionados à tentativa de melhoramento do
desempenho dos biossensores. Os polímeros condutores e não condutores têm sido
utilizados tanto no aprimoramento dos diferentes modos de transdução de sinais biológicos
quanto na disponibilização de grupos químicos para imobilização de biomoléculas. Neste
trabalho, a utilização do polímero quitosana depositado sobre ouro para imobilização de
imunoglobulinas G foi avaliada a partir do método de ELISA e através de um biossensor
piezoelétrico, o qual é composto por uma microbalança de cristal de quartzo. Com a
presença do polímero, absorbâncias três vezes mais altas foram obtidas e a alteração na
freqüência de ressonância do cristal após a imobilização dos anticorpos aumentou de
14.19% (±2.43) para 24.34% (±0.75). A prata epoxy, polímero condutor, foi utilizada na
fabricação de eletrodos de trabalho para construção de um biossensor amperométrico para
detecção de lactato desidrogenase. Outros compostos como grafite e
tetracianoquinodimetano também foram utilizados na composição da pasta condutora. Na
voltametria cíclica, com NADH e glutaraldeído adsorvidos na superfície do eletrodo, uma
corrente anódica foi gerada em 0.5V na presença da lactato desidrogenase e piruvato devido
à oxidação eletroquímica do NADH. Os eletrodos mostraram ser reproduzíveis nas
condições eletrolíticas testadas apresentando boa sensibilidade (1.5μA (U/L)-1). Entretanto,
o potencial encontrado pode levar a uma baixa seletividade do biossensor em decorrência
da oxidação de espécies interferentes presentes no soro. A enzima lactato desidrogenase foi
pré-purificada a partir de sistemas bi-fásicos aquosos compostos de citrado de sódio e
polietilenoglicol que é um polímero inerte. Um planejamento fatorial foi utilizado nas
análises estatísticas e a massa molecular do polímero foi a variável que apresentou maior

XI
influência sobre o fator de purificação e rendimento da lactato desidrogenase. A enzima
apresentou o maior fator de purificação de 7.9, com rendimento de 100% de sua atividade.

XII
ABSTRACT
Currently, some studies have been directed to the attempt of improvement of the
performance of the biosensors. The conducting and not conducting polymers have been
used to improve the different kinds of transduction of biological signals and also to expose
chemical groups for the immobilization of biomolecules. In this work, the use of chitosan
polymer deposited on gold for immobilization of immunoglobulins G was evaluated by the
method of ELISA and through a piezoelectric biosensor, which is composed for a crystal
quartz microbalance. With the presence of polymer, absorbances three fold higher were
found and the alteration in the crystal resonant frequency after the immobilization of the
antibodies increased of 14.19% (±2.43) for 24.34% (±0.75). The epoxy silver, conducting
polymer, was used in the manufacture of working electrodes for the construction of an
amperometric biosensor for lactate dehydrogenase detection. Other components as graphite
and tetracyanoquinodimethane also were used in the composition of the conducting paste.
In the cyclic voltammetry, with NADH and glutaraldehyde adsorbed on electrode surface,
an anodic current was generated in 0.5V in presence of the lactate dehydrogenase and
pyruvate throught the electrochemical oxidation of NADH. The electrodes were
reproducible in the tested electrolytic conditions with a good sensitivity (1.5 μA (U/L)-1).
However, the potential found can lead to a low selectivity of the biosensor due to the
oxidation of others species present in the serum. The enzyme lactate dehydrogenase was
pre-purified by aqueous two-phase systems composed by sodium citrate and polyethylene
glycol that it is an inert polymer. A factorial design was used in the statistical analyses and
polymer molecular mass was the variable that presented greater influence on the

XIII
purification factor and yield of the lactate dehydrogenase. The enzyme presented greater
purification factor of 7.9 and a yield of 100% of its activity.

INTRODUÇÃO

2
INTRODUÇÃO
1. Biossensores
Os biossensores e os sensores químicos diferem nos distintos processos de
reconhecimento do analito. Sensores químicos são dispositivos que transformam uma
informação química em um sinal analiticamente apropriado, já os biossensores
constituem um subgrupo de sensores químicos onde moléculas biológicas, tais como
anticorpos, antígenos, enzimas, receptores, organelas, células, ácidos nucléicos, lectinas
entre outros, são integrados no processo de reconhecimento químico. (Spichiger-Keller,
1998). Sensores químicos tais como eletrodos íons seletivos são utilizados, por exemplo,
para monitorar, sódio e potássio em fluidos biológicos como sangue ou urina. Estes e
outros sensores são utilizados em situações bioanalíticas, porém não são considerados
biossensores (Diamond, 1998).
O objetivo do desenvolvimento de biossensores é produzir um sinal eletrônico
digital que é proporcional à concentração de um material biológico específico ou uma
série de materiais em tempo real. A interação entre essas duas áreas de estudo distintas
combina a especificidade e a sensibilidade dos sistemas biológicos à capacidade
computacional de um microprocessador (Wang, 1999). Os biossensores constituem uma
alternativa rápida e conveniente para medidas analíticas convencionais no monitoramento
de substâncias químicas e bioquímicas aplicado em diagnóstico clínico, no controle
ambiental, em processos de fermentação e na indústria de alimentos (Yang et al, 2005).

3
2. Características ideais de um biossensor
É importante ressaltar que não existe um biossensor ideal, pois, um sensor pode
ser bem empregado para monitorar um analito em particular, em uma dada situação, e
pode não ser eficaz para monitorar o mesmo analito em uma condição diferente. Um
eletrodo de vidro, por exemplo, é um excelente dispositivo para monitorar o pH de
diversos tipos de soluções, mas não pode ser utilizado para monitoramento do sangue in
vivo devido à temperatura e à dificuldade de ser fabricado em microdimensões (Diamond,
1998).
As características ideais para um biossensor estão listadas na tabela 1 com alguns
comentários relevantes.
Tabela 1. Características ideais de um biossensor. Fonte: Diamond,1998.
Características Comentários Sinal de saída proporcional à concentração ou a atividade do analito
Isto tem ocorrido com maior facilidade devido às várias opções de processamento de sinais complexos na produção de sensores modernos.
Rápido tempo de resposta
Ensaios que apresentem um longo tempo de resposta devido a um processo cinético lento, por exemplo, podem limitar suas possíveis aplicações e impedem que as respostas sejam obtidas em tempo real. Isto pode ser aprimorado utilizando um biossensor.
Seletivo
Sem a seletividade adequada, o usuário não pode relacionar o sinal obtido à concentração do analito.
Sensível
A sensibilidade determina a habilidade do dispositivo em discriminar, com confiança e precisão, pequenas diferenças na concentração do analito.
4
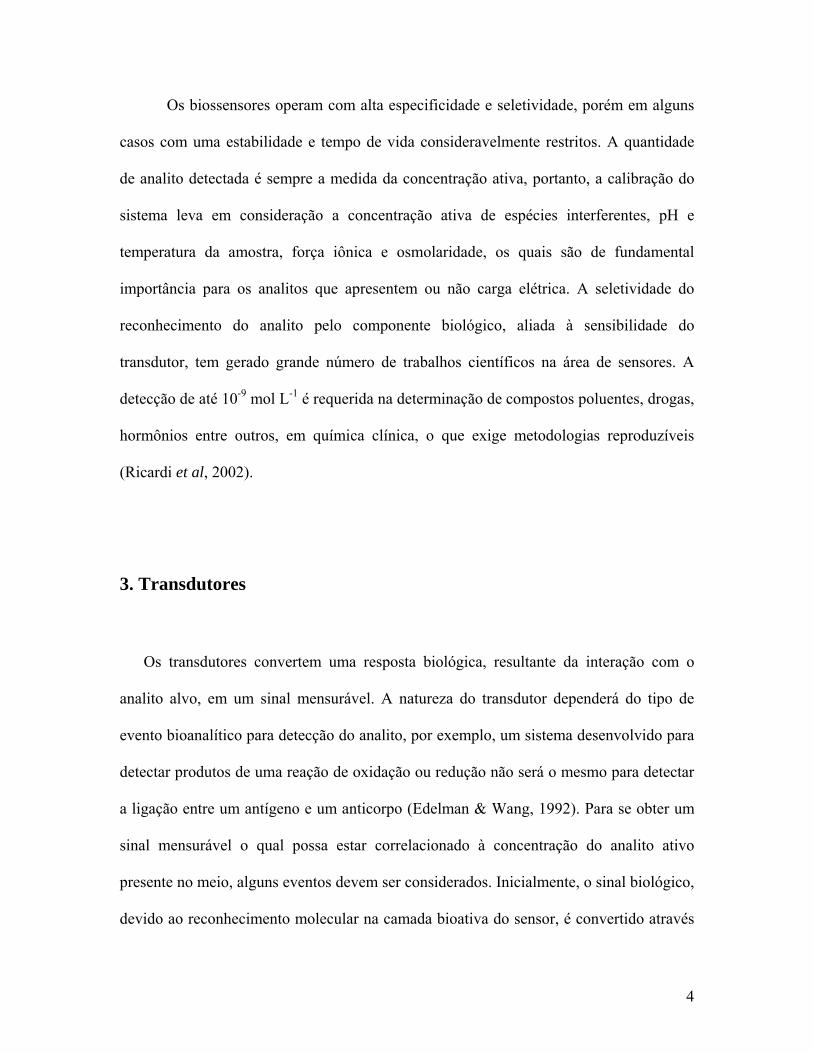
Os biossensores operam com alta especificidade e seletividade, porém em alguns
casos com uma estabilidade e tempo de vida consideravelmente restritos. A quantidade
de analito detectada é sempre a medida da concentração ativa, portanto, a calibração do
sistema leva em consideração a concentração ativa de espécies interferentes, pH e
temperatura da amostra, força iônica e osmolaridade, os quais são de fundamental
importância para os analitos que apresentem ou não carga elétrica. A seletividade do
reconhecimento do analito pelo componente biológico, aliada à sensibilidade do
transdutor, tem gerado grande número de trabalhos científicos na área de sensores. A
detecção de até 10-9 mol L-1 é requerida na determinação de compostos poluentes, drogas,
hormônios entre outros, em química clínica, o que exige metodologias reproduzíveis
(Ricardi et al, 2002).
3. Transdutores
Os transdutores convertem uma resposta biológica, resultante da interação com o
analito alvo, em um sinal mensurável. A natureza do transdutor dependerá do tipo de
evento bioanalítico para detecção do analito, por exemplo, um sistema desenvolvido para
detectar produtos de uma reação de oxidação ou redução não será o mesmo para detectar
a ligação entre um antígeno e um anticorpo (Edelman & Wang, 1992). Para se obter um
sinal mensurável o qual possa estar correlacionado à concentração do analito ativo
presente no meio, alguns eventos devem ser considerados. Inicialmente, o sinal biológico,
devido ao reconhecimento molecular na camada bioativa do sensor, é convertido através

5
de um transdutor em um segundo sinal, geralmente elétrico, com um modo de transdução
que pode ser eletroquímica, térmica, ou eletromagnética. Os parâmetros de transdução
estão resumidos na figura 1.
Figura 1. Desenho esquemático da configuração dos biossensores mostrando os principais modos de transdução.
O reconhecimento seletivo da molécula alvo pode ser encontrado através de
vários tipos de sistemas de afinidade, como exemplo, enzima e substrato, anticorpo e
antígeno, lectina e açúcar, ácido nucléico e seqüência nucleotídica complementar.
Quando a molécula é biocatalística, no caso de uma enzima, a reação ocorre na presença
do analito alvo e uma quantidade variável de produto é gerada. Este produto é detectado
pela corrente elétrica gerada a partir da reação, utilizando um transdutor eletroquímico.
Amostra
Camada ativa (reconhecimento molecular) Analito
Interface
Transdução
Processamento do sinal
▪Eletroquímica: -Amperométrica
-Condutimétrica -Potenciométrica ▪Eletromagnética: -Óptica -Acústica
0.000

6
Em contraste, o uso de anticorpos para a detecção de antígenos, não é normalmente um
fenômeno de biocatálise e diferentes tipos de transdutores eletromagnéticos podem ser
considerados. Entretanto, um bioconjugado envolvendo a ligação de uma enzima a um
anticorpo pode ser utilizado e a presença do antígeno alvo, neste caso, pode ser
determinada indiretamente através da reação enzimática (Blum & coulet,1991). A
interação entre um antígeno e um anticorpo não conjugado pôde ser detectada através da
corrente gerada a partir de uma mudança de fluxo de íons numa matriz de polipirroli
quando um antígeno poli-aniônico esteve presente (Gooding et al, 2004). Entretanto,
transdutores sensíveis à variação de massa, por exemplo, são utilizados com maior
freqüência (Park et al, 2000).
3.1. Transdutores eletroquímicos
Os biossensores baseados em transdutores eletroquímicos são os mais comumente
utilizados em análises clínicas e os mais citados na literatura. A eletroquímica é um
processo interfacial que envolve a transferência (ou impede a transferência) de um elétron
de uma espécie em solução para um eletrodo ou vice-versa. Para que a eletroquímica seja
utilizada como uma ferramenta analítica, deve haver um contato entre o eletrodo e o
analito para que ocorra a transdução. Antes de relatar o que ocorre quando um eletrodo é
colocado em uma solução eletrolítica, se faz necessário o esclarecimento de alguns
conceitos, tais como diferença de potencial elétrico e potencial de Nernst (Diamond,
1998).
7
A diferença de potencial elétrico (d.d.p.) é a diferença algébrica entre os
potenciais individuais de dois pontos, ou a tensão elétrica existente entre estes dois
pontos dada em Volt. A d.d.p., é definida como a quantidade de trabalho necessária para
conduzir uma determinada quantidade de eletricidade de um ponto a outro num campo
elétrico.
O potencial elétrico (E) de uma solução contendo a forma reduzida (Red) e
oxidada (Ox) de um analito pode ser explicado através da equação de Nernst (Equação
1):
onde R é a constante dos gases, (8.314 J mol-1 K-1), T é a temperatura em Kelvin, F é a
carga correspondente a um mol de elétrons (96487 C), n é o número de elétrons livres e
[Ox] e [Red] representam a concentração do analito em moles por decímetro cúbico. O
potencial de referência (E0´) é um parâmetro característico de uma interação (Equação 2):
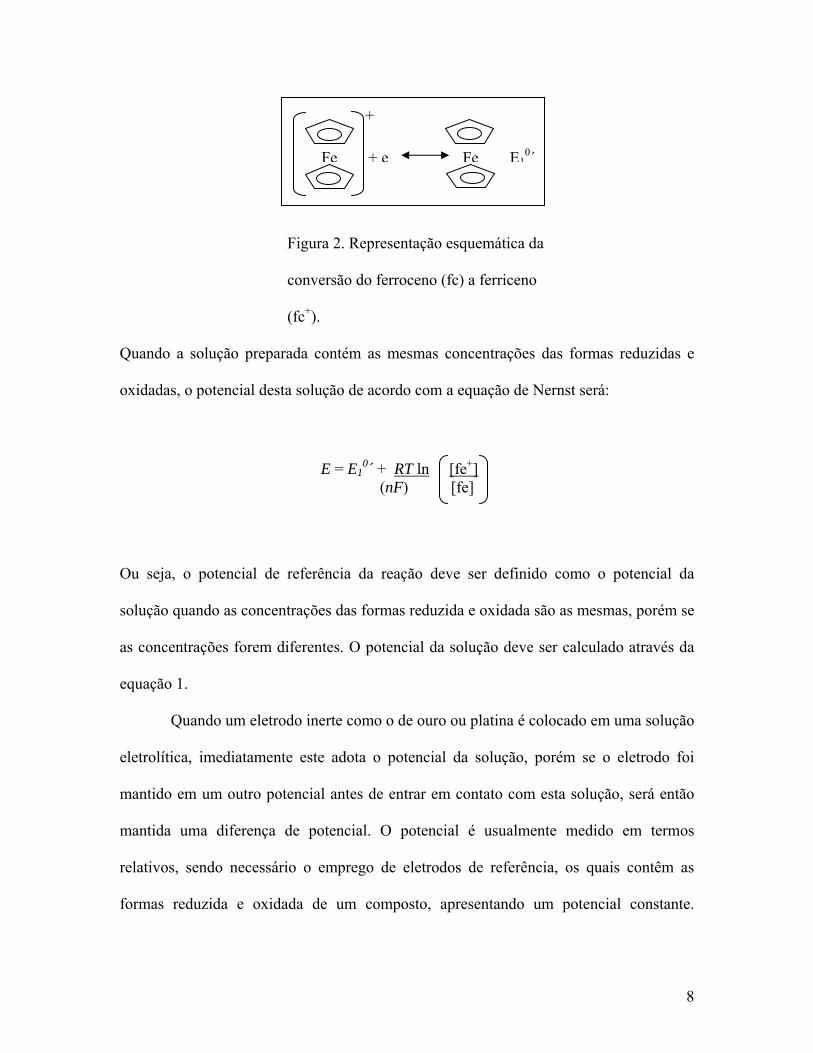
Uma reação amplamente estudada é conversão reversível do ferroceno (fc) a ferriceno
(fc+) envolvendo a transferência de um elétron (Figura 2)
E = E0´ + RT ln [Ox] (nF) [Red]
Ox + ne- = Red
Equação 1
Equação 2
8
Figura 2. Representação esquemática da
conversão do ferroceno (fc) a ferriceno
(fc+).
Quando a solução preparada contém as mesmas concentrações das formas reduzidas e
oxidadas, o potencial desta solução de acordo com a equação de Nernst será:
Ou seja, o potencial de referência da reação deve ser definido como o potencial da
solução quando as concentrações das formas reduzida e oxidada são as mesmas, porém se
as concentrações forem diferentes. O potencial da solução deve ser calculado através da
equação 1.
Quando um eletrodo inerte como o de ouro ou platina é colocado em uma solução
eletrolítica, imediatamente este adota o potencial da solução, porém se o eletrodo foi
mantido em um outro potencial antes de entrar em contato com esta solução, será então
mantida uma diferença de potencial. O potencial é usualmente medido em termos
relativos, sendo necessário o emprego de eletrodos de referência, os quais contêm as
formas reduzida e oxidada de um composto, apresentando um potencial constante.
Fe + e Fe E10´
+
E = E10´ + RT ln [fe+]
(nF) [fe]
9
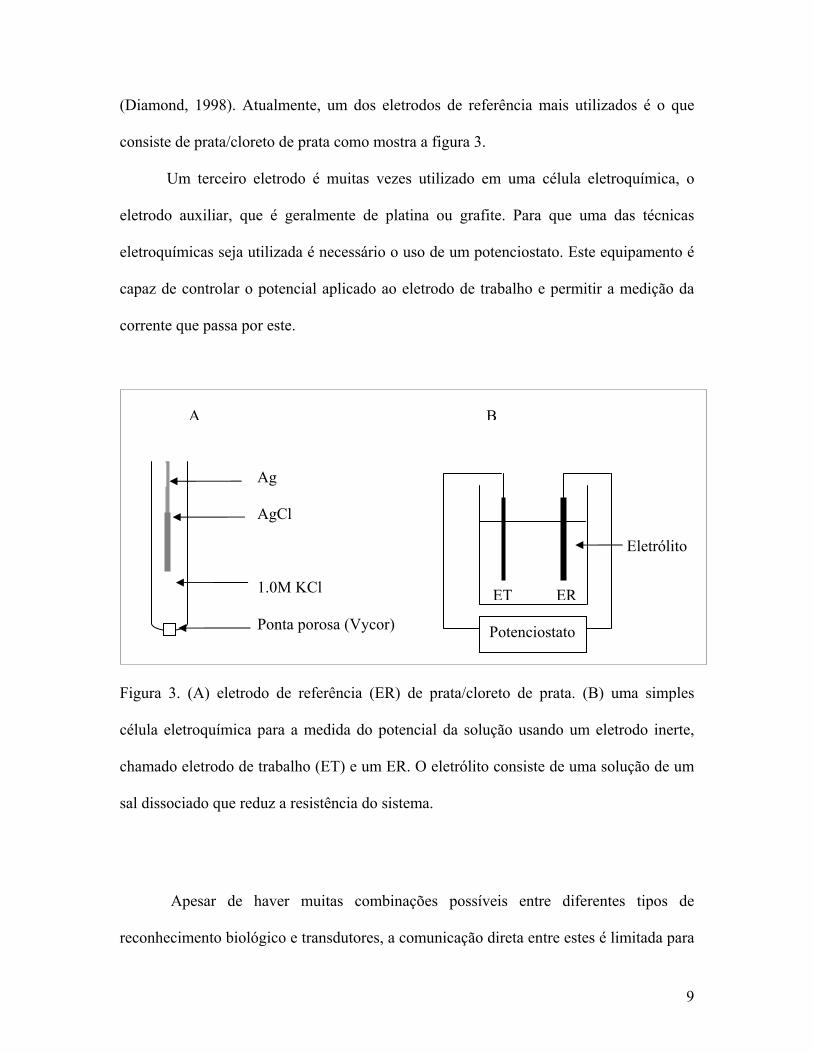
(Diamond, 1998). Atualmente, um dos eletrodos de referência mais utilizados é o que
consiste de prata/cloreto de prata como mostra a figura 3.
Um terceiro eletrodo é muitas vezes utilizado em uma célula eletroquímica, o
eletrodo auxiliar, que é geralmente de platina ou grafite. Para que uma das técnicas
eletroquímicas seja utilizada é necessário o uso de um potenciostato. Este equipamento é
capaz de controlar o potencial aplicado ao eletrodo de trabalho e permitir a medição da
corrente que passa por este.
Figura 3. (A) eletrodo de referência (ER) de prata/cloreto de prata. (B) uma simples
célula eletroquímica para a medida do potencial da solução usando um eletrodo inerte,
chamado eletrodo de trabalho (ET) e um ER. O eletrólito consiste de uma solução de um
sal dissociado que reduz a resistência do sistema.
Apesar de haver muitas combinações possíveis entre diferentes tipos de
reconhecimento biológico e transdutores, a comunicação direta entre estes é limitada para
A B
Ag AgCl 1.0M KCl Ponta porosa (Vycor)
ET ER
Eletrólito
Potenciostato

10
uma quantidade restrita de elementos biológicos. Freqüentemente, os elementos de
reconhecimento biológico são enzimas e células vivas e o funcionamento adequado do
biossensor é dependente de um componente intermediário chamado mediador químico, o
qual promove a transferência de elétrons entre a camada ativa e o transdutor (Castilho et
al, 2004).
3.1.1 Transdutor potenciométrico
Os transdutores potenciométricos são também chamados de eletrodos íons
seletivos. Estes transdutores detectam a atividade de íons na amostra e são de simples
preparação e moderada seletividade, sendo o potencial elétrico de uma célula
eletroquímica medido. A resposta potenciométrica é uma função linear do logarítimo da
atividade de elétrons livres em solução. No entanto, esta técnica não perturba
quimicamente a amostra (Bakker et al, 2005). Uma importante abordagem para os
transdutores potenciométricos é aquela baseada em membranas íons seletivas, onde a
diferença de potencial é medida em função da transferência de íons sobre a superfície da
membrana (Mulchandani, 1998).
O clássico eletrodo de pH foi o primeiro eletrodo íon seletivo utilizado em
química analítica. Quando uma membrana de vidro é imersa em uma solução contendo
íons hidrogênio, inicia-se um mecanismo de troca iônica com grupos SiO- fixados na
membrana de vidro. Um significante enfoque tem sido dado na pesquisa por carreadores
de íons que apresentam interações químicas específicas com íons de interesse. Compostos
orgânicos, aminas e outros capazes de protonar têm sido testados como possíveis

11
carreadores de hidrogênio para produzir uma resposta sensível ao pH (Wu et al, 1983;
Yuan et al, 1993; Yu et al, 2000).
A detecção potenciométrica tem sido utilizada em estudos de química
fundamental para determinação de condutância e estabilidade de íons, em processos
industriais incluindo análise farmacêutica e controle de fermentação, em análises
biomédicas para determinação das concentrações de íons dentro das células, no controle
ambiental para análise de águas, em análises clínicas para determinação de sódio,
potássio, lítio e cálcio em diversos fluidos biológicos, entre outros (Diamond, 1998).
3.1.2 Transdutor amperométrico
O transdutor amperométrico emprega a medida de intensidade de corrente de uma
célula eletroquímica a um potencial fixo, sendo a corrente gerada por reação redox na
superfície sensitiva, proporcional à concentração do analito. Até o momento, este tipo de
dispositivo eletroquímico tem sido o mais aplicado tanto em química analítica quanto na
construção de biossensores para análises clínicas disponíveis no comércio (Wang et al,
1999). O primeiro biossensor foi construído por Clark & Lyons, em 1962, quando eles
acoplaram a enzima glicose oxidase a um eletrodo amperométrico para PO2. A enzima
catalisava a oxidação da glicose diminuindo a PO2 na solução. A diminuição da PO2 foi
detectada pelo eletrodo e mostrou ser proporcional a concentração de glicose. Nos anos
seguintes, eletrodos para detecção de uma variedade de enzimas e outras substâncias com
importância clínica foram desenvolvidos (D’Orazio, 2003).

12
No biossensor catalítico, quando uma enzima adequada é imobilizada na
superfície do eletrodo, catalisa a reação dos substratos e o monitoramento da corrente
elétrica poderá ser efetuado devido à formação dos produtos. A superfície do eletrodo
pode ser modificada com um mediador que oxidará, por exemplo, um dos produtos e,
então, monitora-se a corrente elétrica devido a reoxidação eletroquímica do mediador na
superfície do eletrodo. O mediador evidentemente deve ser seletivo e diminuir o valor do
potencial a ser aplicado diminuindo assim os eventuais interferentes da reação.
No caso de imunossensores amperométricos, o monitoramento da reação de
afinidade tem sido realizado através de produtos, reagentes ou mediadores. Inicialmente
ocorre a reação entre o anticorpo e o antígeno ou hapteno (substância de baixo peso
molecular que por si não é imunogênica, mas pode se ligar ao anticorpo específico)
depois a reação de competição ou sanduíche com o conjugado (antígeno ou anticorpo
marcado com a enzima) e, finalmente, o monitoramento do ensaio pela enzima marcadora
da reação. Portanto, a revelação da reação entre antígeno e anticorpo segue o mesmo
esquema que os biossensores catalíticos, porém a determinação de dada substância com
imunossensores, tem como princípio a reação de afinidade, e não, a reação catalítica.
Algumas enzimas têm sido utilizadas como marcadoras da reação imunoquímica,
como exemplos, glicose oxidase, peroxidase, glicose-6-fosfato desidrogenase,
acetilcolinesterase e fosfatase alcalina. O substrato ideal para a enzima deve apresentar
alguns requisitos como, por exemplo, alta velocidade de conversão pela enzima
específica, o potencial redox do produto deve ser baixo para minimizar as interferências e
o potencial redox do substrato deve ser alto para que a corrente de fundo mantenha-se
baixa. Em alguns casos a substância a ser analisada é a própria enzima que é reconhecida

13
através de seu anticorpo específico imobilizado no eletrodo de trabalho. (Riccardi et al,
2002).
A voltametria cíclica é uma técnica amperométrica em que o potencial aplicado ao
eletrodo de trabalho varia, em uma faixa constante, entre dois potenciais limites e a
corrente é medida em função do potencial, ou seja, a corrente é a resposta do eletrodo
durante a varredura de potencial. Entretanto, outros parâmetros podem ser medidos, tais
como, os valores de potenciais de pico anódico e catódico e a diferença entre os
potenciais de pico. Uma ou várias varreduras podem ser feitas continuamente. A medida
da corrente tem dois componentes, um não faradaico resultando da redistribuição de
cargas e espécies polares na superfície do eletrodo e um componente faradaico resultando
da transferência de elétrons entre o eletrodo e o analito em solução. A corrente faradaica
(If) dependerá do gradiente de concentração de espécies oxidadas na superfície do
eletrodo.
Quando o potencial torna-se positivo o suficiente, ocorre oxidação da espécie em
solução e conseqüentemente haverá um aumento da corrente anódica. Como a redução
ocorre, a concentração da espécie oxidada diminui no eletrólito e o eletrodo de trabalho
não pode captá-la, conseqüentemente a corrente não é mantida através do pico no sentido
anódico e decai. Quando a direção do potencial é invertida no sentido catódico, o pico
resultante da reoxidação da espécie reduzida é observado em um outro potencial. Na
voltametria de varrimento linear, o potencial é variado em uma única direção positiva ou
negativa até alcançar um determinado potencial (Turner et al, 1989).

14
3.1.3 Transdutor condutimétrico
A condutância específica de uma solução de um eletrólito depende dos íons
presentes, variando a sua concentração de acordo com reações químicas ou bioquímicas,
onde há consumo ou liberação de íons (Eggins, 1996). Como a medida condutimétrica
requer a presença de íons, não é comumente utilizada para as análises de moléculas que
não se dissociam. A medida da condutância é o total de condutância de todos os íons da
solução e não é particularmente utilizada para a análise qualitativa, pois o método não é
seletivo. As duas maiores utilizações da condutimetria são para monitorar o total da
condutância de uma solução e para determinar o ponto final das titulações que envolvem
íons.
Alguns biossensores condutimétricos foram desenvolvidos para detecção de uréia.
A enzima urease catalisa a hidrólise da uréia gerando produtos eletricamente carregados,
o que leva a um aumento na condutividade da solução (Watson et al, 1987). Limbut et al
(2004) utilizaram um transdutor condutimétrico para detecção de uréia imobilizando a
urease em diferentes suportes sólidos (controlled pore glass, silica gel e Poraver®),
buscando uma melhor sensibilidade do sistema.
3.1.4 Construção de eletrodos de trabalho
Metais e carbono são geralmente utilizados na preparação de eletrodos sólidos. Os
metais como platina, ouro e prata têm sido por muito tempo utilizados em eletrodos

15
eletroquímicos devido às suas propriedades elétricas e mecânicas, porém, materiais a
base de carbono tais como nanotubos, fibras e grafite são também utilizados para a
construção da fase condutiva. Estes materiais são quimicamente inertes, promovem uma
ampla faixa de potencial de trabalho, baixa corrente residual e apresentam baixa
resistividade. A mistura de diferentes materiais na preparação de eletrodos de trabalho
têm sido feita devido a algumas propriedades serem inibidas quando componentes
individuais são utilizados, apesar de cada um manter suas propriedades. Como exemplo
dessas misturas (compósitos), tem-se a utilização de carbono e polímeros, tais como
epoxy, silicone, metacrilato, poliéster ou poliuretano (Zhang et al, 2000).
A produção de eletrodos impressos (Screen printed) para aplicação em
biossensores eletroquímicos (Figura 4) tem recebido muita atenção nos últimos anos. As
tintas condutoras de prata, carbono, grafite e prata/cloreto de prata têm sido impressas em
diferentes suportes tais como vinil, PVA, poliéster entre outros (Kröger & Turner, 1996;
Ohfuji et al, 2004; Shumyantseva et al, 2004; Forrow et al, 2005; Valdés-Ramírez et al,
2005; Bettazzi et al, 2006). O uso de suportes plásticos tem diminuído o custo da
produção de tais eletrodos (Kröger et al, 1997).

16
Figura 4. Desenho esquemático da produção de eletrodos impressos. Adaptada de
http://192.107.77.201/post002.htm
3.1.4.1 Eletrodos quimicamente modificados
Pesquisas relacionadas à modificação da superfície de eletrodos sólidos objetivam
estabelecer condições nas quais, a velocidade da transferência de carga para certas
espécies químicas seja aumentada. A idéia envolve a imobilização de mediadores
apropriados na superfície do eletrodo de forma que o processo eletroquímico ocorra em
menor potencial. Neste sentido, a interação química entre a espécie imobilizada e o
substrato exerce papel preponderante no mecanismo catalítico. Um eletrodo modificado é
geralmente preparado para funcionar num processo dinâmico no qual camadas
Impressão automática Imobilização da biomolécula
Tela
Rodo Tinta suporte
Impressão manual Eletrodo impresso

17
imobilizadas melhoram a seletividade e eventualmente a sensibilidade em sensores
analíticos.
Mediador químico é um composto redox de baixo peso molecular que faz a
transferência de eletróns entre o centro redox de uma enzima e a superfície do eletrodo de
trabalho. Durante o ciclo catalítico, o mediador primeiro reage com a enzima e então
transfere ou recebe elétrons a partir do eletrodo. Isto pode ser demonstrado com relação à
glicose oxidase. -Em solução: Glicose + FAD + H2O ácido glicurônico + FADH2
FADH2 + Mediador oxidado FAD + Mediador reduzido + 2H+
-No eletrodo: Mediador reduzido Mediador oxidado
A taxa de redução do mediador é medida amperometricamente através de sua
oxidação no eletrodo.
O uso de mediadores introduz uma série de vantagens, desde que o mediador não
reaja com o oxigênio, sendo a medida independente da PO2, reaja rapidamente com a
enzima, apresente uma cinética reversível, seja estável nas formas reduzida e oxidada e,
para muitas aplicações, não deve ser tóxico. O potencial do eletrodo é determinado
através do potencial formal (E0´) do mediador, o qual deve ser baixo, diminuindo a
interferência na medição. A oxidação de mediadores reduzidos, por exemplo, não
envolve prótons, o que torna o eletrodo enzimático relativamente insensível ao pH. O
mediador deve estar firmemente ligado ao eletrodo, de tal modo que o mantenha
eletroquimicamente ativo e capaz de reagir com a enzima (Turner et al, 1989). A tabela 2
mostra alguns mediadores redox utilizados para reduzir o potencial de oxidação na reação
catalisada pela glicose oxidase.

18
Tabela 2. Exemplos de mediadores redox utilizados na reação da
glicose oxidase e seus potenciais em soluções aquosas. Adaptada
de Castilho et al, 2004.
Mediador Potencial redox
(mV vs.SCE*) Um elétron Ferroceno 210 Ácido carboxílico do ferroceno 290 Dimetil amino metilferroceno 370 Promazina 530 p-Ferrocenilamina 245 Dois elétrons Tetratiofulvaleno 150 Azul de metileno 30 1,4-Benzoquinina 275 1,4-Bis(N,N-dimetil amino) benzeno 450 4,4'-Dihidroxi bifenil 320
* SCE-Saturated Calomel Electrode
3.2 Transdutores eletromagnéticos
3.2.1 Transdutor acústico
Sauerbrey em 1959 demonstrou que os cristais piezoelétricos de quartzo poderiam
ser utilizados de forma eficiente como dispositivos analíticos devido a uma relação linear
entre uma camada de massa externa depositada na superfície do cristal e a variação em

19
sua freqüência de ressonância. É por esta razão que este dispositivo é chamado de
microbalança de cristal de quartzo (MCQ). A sensibilidade à variação de massa de 5MHz
em um cristal de quartzo é aproximadamente 0.057 Hz cm2 ng-1 sendo 100 vezes mais
alta que a sensibilidade de uma balança eletrônica. Sauerbrey descreveu a seguinte
equação (Equação 3):
onde ∆F é a variação da freqüência de ressonância em Hz, ∆M é a variação de massa na
superfície do cristal, F é a freqüência de ressonância básica do cristal e A é a área
piezoeletricamente ativa do eletrodo em cm2.
Dependendo do ângulo em que o cristal é cortado, diferentes tipos de cristais
ressonantes podem ser obtidos. Geralmente cristais com corte AT (AT-cut) são utilizados
na MCQ, sendo estes cortados em um ângulo de 35º a um eixo z como mostra a figura 5.
Este corte permite a estes cristais apresentarem alta estabilidade, podendo ser utilizados
em vários dispositivos eletrônicos (Janshoff et al, 2000). A massa é depositada na
superfície dos eletrodos localizados no centro do cristal onde o valor máximo da variação
de freqüência é atingido, portanto, diminuindo á medida que se aproxima das bordas
(Hillier & Ward, 1992).
∆F = -2.3 x 10⁶ F2 ∆M A
Equação 3

20
Figura 5. A) Fotografia de um cristal de quartzo.
B) Corte AT de um cristal de quartzo. Fonte:
Janshoff et al, 2000.
O cristal de quartzo (AT-cut) é posicionado entre dois eletrodos metálicos e estes
são conectados a um circuito oscilador externo que leva o cristal a seu estado ressonante.
Um típico cristal de quartzo com espessura menor que 200μm opera em uma freqüência
de 10 MHz. A variação na freqüência medida informa as interações que ocorrem na
superfície do eletrodo entre um analito e um ligante imobilizado. Esta interação
bioespecífica pode ocorrer entre um antígeno e um anticorpo, ácidos nucléicos,

21
oligonucleotídeos, proteína ou peptídeo e vários tipos de receptores (Su et al, 2000). Os
cristais têm sido pré-tratados com material apropriado para criar uma fina camada capaz
de formar interações hidrofóbicas e ou covalentes com a molécula detectora do analito.
Entre os materiais, podem ser destacados polietilenoimina, γ- amino propil trietoxisilano,
proteína A, polietilenoimina e avidina e poliacrilamida (Suleinan et al, 1994).
A tecnologia MCQ já foi utilizada na construção de biossensores para detecção de
vários tipos de analitos, como exemplos, a proteína do sistema complemento C6 (Hu et al,
2000), Salmonella spp (Park et al, 2000), Treponema pallidum (Aizawa, 2001),
Helicobacter pilori (Su & Li, 2001), heparina (Cheng et al, 2001), Salmonella
typhimurium (Kim et al, 2003), vírus da hepatite C (Skládal et al, 2004), e antígeno
carcinoembriogênico (Shen et al, 2005).
Várias aplicações usando cristal de quartzo com uma face submergida em meio
líquido foram descritas, porém alguns resultados não estavam de acordo com a equação
de Sauerbrey (Thompson et al, 1986; Walton et al, 1990; Vaughan et al, 2001). Hiller &
Ward em 1992 concluíram que não só a variação de massa levava a alteração na
freqüência do cristal como descrito por Sauerbrey, mas também alterações na
viscosidade, densidade e condutividade da solução.
3.2.2 Transdutor óptico
Nos últimos anos, pesquisas envolvendo sensores baseados na tecnologia
de ressonância de plasmons de superfície (RPS) têm apresentado um avanço

22
significativo. RPS refere-se à excitação óptica de plasmons de superfície na interface
entre um condutor e um dielétrico, onde o condutor é um metal (ouro ou prata) que
apresenta uma grande quantidade de elétrons livres e o dielétrico pode ser um gás, um
líquido ou um sólido a ser analisado. Os plasmons de superfície são oscilações coletivas
dos elétrons livres em uma camada metálica. Esta camada é depositada sobre um dos
planos de um prisma. Quando uma luz polarizada passa através de um dos outros planos
do prisma induz os elétrons a um estado ressonante, o que resulta na absorção de energia
luminosa (Figura 6).
A onda evanescente é uma onda eletromagnética que é gerada quando a luz é
totalmente refletida dentro da superfície sensora (Kleinjung et al, 1997; Luppa et al,
2001; Qiu et al, 2003). Se um fino filme biológico é depositado sobre a camada metálica,
as ondas evanescentes são acopladas a esta camada e qualquer alteração que nela ocorra
irá modular a luz refletida (Morgan et al, 1996.)
As aplicações da RPS são diversas incluindo o estudo de propriedades ópticas em
filmes metálicos, espessura de filmes, medidas de índice de refração de camadas
orgânicas em superfícies metálicas, adsorção de proteínas em biomateriais, adsorção de
moléculas de gases e aplicações como biossensor (Green et al, 2000). Cerca de 70% dos
trabalhos científicos que envolvem a RPS são direcionados ao estudo de interações
biomoleculares.

23
Inicialmente, a RPS foi aplicada para análise de gases, líquidos e sólidos (Liu et
al, 2005). Em 1982 e 1983, Liedberg et al foram os primeiros a desenvolver um
biossensor RPS, onde moléculas de IgG eram detectadas a partir de anticorpos anti-IgG
imobilizados. Desde então, a técnica tem sido mais freqüentemente utilizada em
imunodiagnóstico devido a muitas doenças infecciosas, como por exemplo, AIDS e
Prisma
Camada de ouro Camada de moléculas detectoras
Luz incidente Foto detector
Ângulo de incidência
Luz
refle
tida
antes da detecção depois da detecção
1
2
Figura 6. Representação esquemática de um típico biossensor RPS. 1-
Desenho experimental. Moléculas detectoras são imobilizadas na
superfície metálica, em seguida o analito é injetado e então a interação
específica é medida. 2- O gráfico, luz refletida versus ângulo de
incidência, mostra o deslocamento do ângulo de ressonância após o
reconhecimento do analito.
24
hepatite, serem diagnosticadas através de interações específicas entre antígenos e
anticorpos (Chung et al, 2005). Ultimamente, têm sido desenvolvidos biossensores RPS
para detecção de toxinas de baixo peso molecular no ambiente (Nabok et al, 2005),
hepatite B (Chung et al, 2005) e transferrina (Liu et al, 2005).
4. Imobilização de biomoléculas
A imobilização de biomoléculas no eletrodo constitui uma etapa de fundamental
importância para a construção de um biossensor. A atividade e especificidade destas
moléculas devem ser preservadas e se possível, a estabilidade deve ser mantida ou
preferencialmente aumentada. Isto leva à estabilidade do sistema sensor para uso, reuso e
estocagem. O método de imobilização também deve ser reproduzível e de fácil
realização. Os principais métodos de imobilização utilizados na produção de biossensores
estão descritos a baixo:
a) Adsorção física à superfície sólida: plástico, vidro, celulose e ouro, entre
outros, têm sido utilizados para adsorção de proteínas através de ligações por
pontes de hidrogênio, forças de Van der Waals e interações hidrofóbicas.
Estas ligações não são muito estáveis e podem ser facilmente desfeitas através
de mudança de pH, temperatura e força iônica. É um método simples e
dificilmente as biomoléculas perdem suas propriedades, porém não é
reproduzível.

25
b) Ligações cruzadas: este método proporciona a estabilidade da proteína
imobilizada devido à ligação cruzada com reagentes como o glutaraldeído,
porém inevitavelmente alguma inativação pode ocorrer devido ao bloqueio de
sítios ativos de enzimas ou de reconhecimento de antígenos, no caso da
imobilização de anticorpos.
c) Aprisionamento em polímero ou gel: gel de poliacrilamida tem sido muito
utilizado principalmente para imobilização de enzimas, preservando suas
atividades. Gelatina, nylon e polímeros condutores, como o polipirrol, também
são utilizados (Cunningham, 1998). Os polímeros podem ser ligados à
superfície do eletrodo a partir de ligações cruzadas entre si, sendo necessário
que estas ligações retenham as moléculas imobilizando-as.
d) Uso de membranas para reter a biomolécula na superfície do eletrodo:
membranas com diferentes porosidades podem ser utilizadas para
imobilização de biomoléculas, sendo então acopladas ao transdutor.
Entretanto, problemas com relação à resistência difusional podem ocorrer com
a utilização deste método.
e) Ligações covalentes: tais ligações levam a uma estabilidade da superfície
sensora, sendo resistentes a variações de pH, temperatura e força iônica. A
biomolécula é ligada ao suporte por um determinado grupo funcional, mas

26
durante o processo de ligação pode ocorrer perda de sua atividade (Kennedy,
1985).
f) Outras interações biomoleculares: moléculas como avidina e biotina têm sido
amplamente utilizadas. A avidina é depositada na superfície do eletrodo e os
anticorpos biotinilados são então imobilizados. As proteínas A e G também
têm sido utilizadas para imobilização de anticorpos (Diamond, 1998).
4.1 Utilização de quitosana na composição de matrizes para imobilização
A quitosana é um copolímero constituído de 2-amino-2-deoxi-D-glicopiranose e
2-acetoamido-2-deoxi-D-glicopiranose obtido a partir da hidrólise alcalina da quitina, a
qual é o polímero mais abundante na natureza depois da celulose. A quitina está presente
na estrutura de sustentação de crustáceos, insetos, cogumelos e na parede celular de
fungos. A diferença existente entre a quitosana e a quitina (Figura 7) está apenas no
grupo funcional situado no carbono 2 da unidade monomérica (Hamdine et al, 2005; Li et
al, 2006) .A quitosana é mais utilizada que a quitina para imobilização de biomoléculas
devido à presença de grupos amina livres. Estes grupos facilitam, por exemplo, a
imobilização de enzimas através da adsorção e de reações químicas (Desai et al, 2006).
O interesse no estudo da utilização da quitosana tem crescido nos últimos anos
devido a este polímero ser biocompatível, biodegradável, hidrofóbico; apresentar
propriedades antibacterianas e antivirais, excelente habilidade para formar filmes e não
ser tóxico (Juang et al, 2001; Vikhoreva et al, 2005).

27
Figura 7. Esquema demonstrativo das diferenças
estruturas entre os polímeros: quitina (1), quitosana (2)
e celulose (3). Fonte: www.mdsg.umd.edu/.../
GIFs/molecules.gif
A quitosana ligada covalentemente ao glutaraldeído tem sido utilizada como
suporte para imobilização de fosfatase ácida (Juang et al, 2001), lipase (Hung et al, 2003)
e amoxicilina (Adriano et al, 2005), entre outros. Para a imobilização de anticorpos, têm-
se como exemplos de suportes, a utilização da proteína A imobilizada sobre um filme de
quitosana (Yang et al, 2002) e a quitosana ligada a alginato (Deng et al, 2004). As
moléculas de DNA carregadas negativamente também podem ser imobilizadas sobre a
quitosana através de interações eletrostáticas (Medberry et al, 2004; Zhang et al, 2006).

28
4.2 Imobilização de anticorpos em suportes metálicos
Muitos métodos de imobilização de anticorpos têm sido utilizados na construção
de biossensores eletromagnéticos como, por exemplo, adsorção física ou ligação química
do composto sobre o ouro e polímeros (Guilbault et al, 1989). A estabilidade dos
anticorpos imobilizados através da adsorção física não difere significativamente daqueles
imobilizados de forma covalente. Entretanto, na adsorção, a orientação de tais moléculas
na superfície do eletrodo não ocorre de forma direcionada e parte delas torna inacessível
ao analito (Figura 8).
Figura 8. Diagrama ilustrando a imobilização direcionada (A) e não direcionada
(B) de anticorpos em imunoensaios.
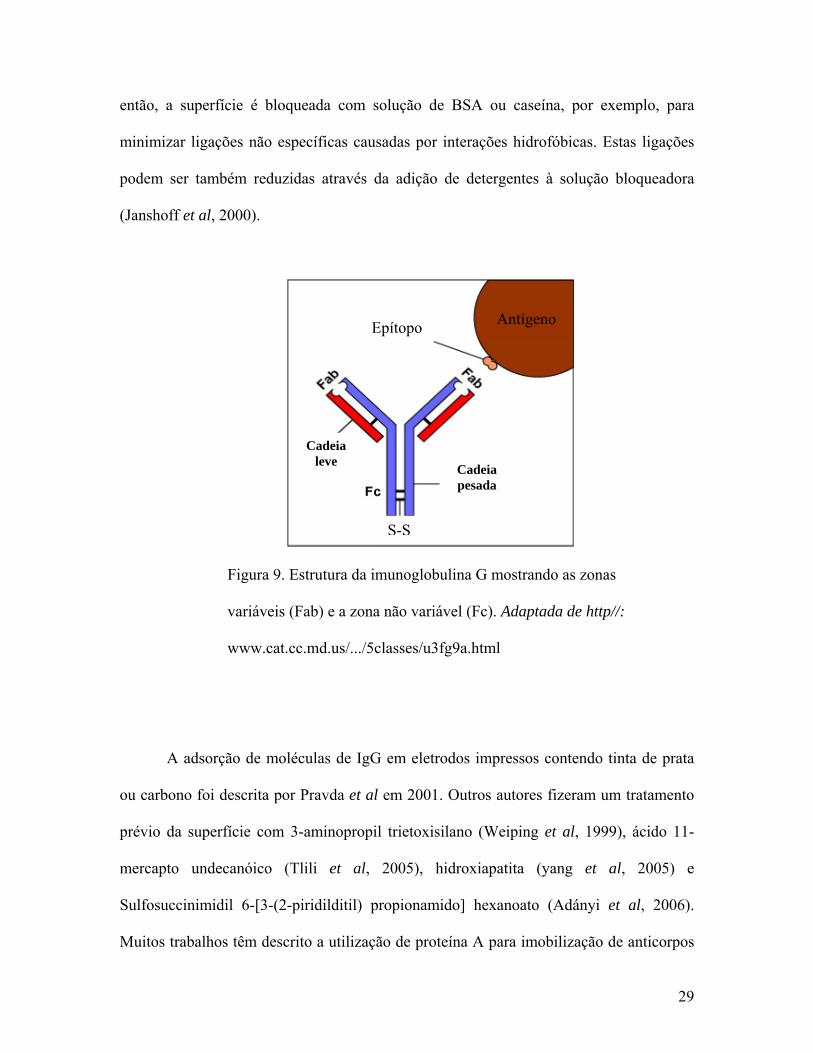
A fração Fc (crystallizable) do anticorpo deve interagir com o suporte e a Fab
(antigen binding) deve ficar livre para interagir com o antígeno específico (Figura 9)
A
B
Antígeno (analito)
Anticorpo
Molécula direcionadora
Molécula bloqueadora
Suporte
29
então, a superfície é bloqueada com solução de BSA ou caseína, por exemplo, para
minimizar ligações não específicas causadas por interações hidrofóbicas. Estas ligações
podem ser também reduzidas através da adição de detergentes à solução bloqueadora
(Janshoff et al, 2000).
Figura 9. Estrutura da imunoglobulina G mostrando as zonas
variáveis (Fab) e a zona não variável (Fc). Adaptada de http//:
www.cat.cc.md.us/.../5classes/u3fg9a.html
A adsorção de moléculas de IgG em eletrodos impressos contendo tinta de prata
ou carbono foi descrita por Pravda et al em 2001. Outros autores fizeram um tratamento
prévio da superfície com 3-aminopropil trietoxisilano (Weiping et al, 1999), ácido 11-
mercapto undecanóico (Tlili et al, 2005), hidroxiapatita (yang et al, 2005) e
Sulfosuccinimidil 6-[3-(2-piridilditil) propionamido] hexanoato (Adányi et al, 2006).
Muitos trabalhos têm descrito a utilização de proteína A para imobilização de anticorpos
Cadeia leve Cadeia
pesada
Epítopo Antígeno
S-S
30
em superfícies metálicas (Caruso et al, 1996; Gao et al, 2000; Lee et al, 2004; Wu et al,
2005; Su & Li, 2005; Schmid et al, 2005). Esta proteína é produzida pela bactéria
Staphilococcus aureus e tem a capacidade de se complexar à porção Fc da molécula de
IgG. Outras proteínas como a proteína G (Oh et al, 2003) e lectinas (Starodub et al, 2005)
também têm sido utilizadas com este propósito.
Os resíduos Fab podem ser obtidos a partir da incubação de uma solução de
anticorpos com pepsina ou papaína e em seguida, esta solução passa por uma coluna de
cromatografia contendo proteína A imobilizada. Os resíduos Fc e os anticorpos não
digeridos se ligam à proteína A e então os fragmentos Fab são isolados. Brogan et al
(2003) estudaram a adsorção dos fragmentos Fab em ouro deixando seus sítios de
reconhecimento do antígeno livres e demonstraram a partir de uma MCQ que esta ligação
foi mais eficiente que aquela envolvendo a molécula de IgG inteira. Para aumentar a
eficiência da imobilização, Lee et al, (2005) utilizaram ditrioteitol sobre o ouro para
promover a ligação dos fragmentos Fab.
5. A enzima lactato desidrogenase
A enzima lactato desidrogenase – LDH (EC 1.1.1.27) cataliza a interconversão
entre o piruvato, um produto da glicólise, e o lactato. Os cofatores NADH ou NAD+ são
necessários para a atividade catalítica da enzima na presença de piruvato ou lactato
respectivamente. Os vertebrados possuem dois tipos de subunidades desta enzima, a M,
rica em aminoácidos básicos, que predomina nos tecidos sujeitos a condições
anaeróbicas, como o músculo esquelético e o fígado, e a H, rica em aminoácidos ácidos,

31
que predomina em tecidos aeróbicos, como o músculo cardíaco. (Kopperschläger et al,
1996; Voet et al, 1999).
A LDH é um tetrâmero composto de quatro subunidades (Figura 10) com massa
molecular de aproximadamente 140 kDa e a mistura dos dois tipos de subunidades (H e
M) gerou três isoenzimas LDH 2 (H3M), LDH 3 (H2M2), LDH 4 (HM3). As outras
isoenzimas são formadas por quatro subunidades H, LDH 1 e quatro subunidades M,
LDH 5 (Rishpon & Rosen, 1989; Kelly et al, 1998). As isoenzimas se diferenciam
através da expressão em tecidos, cinética e propriedades físicoquímicas e imunoquímicas
(Mulkiewicz et al, 2001).
A medida da atividade da LDH no soro tem apresentado grande importância no
diagnóstico cardíaco junto a troponina T e a isoforma MB da creatina quinase (CK-MB)
principalmente devido ao aumento da atividade das isoenzimas 1 e 2 ser um achado quase
Figura 10. Representação da estrutura quaternária
da lactato desidrogenase (LDH 1).
Fonte:http://www.med.unibs.it

32
que específico em patologias que envolvem o coração. O aumento da atividade da LDH
também apresenta significância clínica em outras patologias que envolvem músculo
esquelético (LDH 5), fígado (LDH 4 e 5), doenças malignas (LDH 3, 4 e 5) e
hematológicas (LDH 1, 2 e 5), entre outros. (Santos-Alvarez et al, 2002).
O método ultravioleta é o mais utilizado para a medida da atividade da LDH na
presença de piruvato e NADH ou L-lactato e NAD+, sendo as absorbâncias medidas em
340 nm, porém métodos colorimétricos que utilizam carreadores de elétrons e indicadores
redox, como o azul de metileno, também foram desenvolvidos (Kopperschläger et al,
1996).
6. Utilização de biossensores para detecção de desidrogenases e seus
substratos
Um grupo de enzimas que é bem utilizado em biossensores é o das desidrogenases
dependentes de NAD+ e NADP+ ou NADH e NADPH. A oxidação eletroquímica do
NADH tem sido amplamente estudada devido a mais de 250 enzimas utilizarem este
cofator em suas funções catalíticas. Porém, um problema associado à oxidação direta do
NADH no eletrodo é que ela ocorre em potenciais altos, em torno de 1.0V (Chen et al,
2004).
Kelly et al (1998), na construção de um imunossensor amperométrico para
detecção de LDH, encontraram um potencial de 0.8V para a oxidação do NADH e no ano
seguinte, Warriner et al (1997) encontraram um potencial em torno de 0.4V imobilizando

33
a LDH em superfície de platina modificada com poli (vermelho de fenol) para detecção
de piruvato. Hong et al em 2002 utilizaram um eletrodo impresso para detecção de LDH
onde, o NAD+ e o lactato foram misturados à tinta condutora juntamente com o mediador
(3,4-dihidroxibenzaldeído) levando a um potencial de 0.15V devido à oxidação do
NADH formado na reação. Um potencial de 0.0V foi observado quando ADP foi
utilizada como mediador na construção de um eletrodo para detecção de LDH (Santos-
Álvarez et al, 2002).
Outros compostos utilizados como mediadores para a oxidação do NADH são as
diaminas aromáticas (Kitani et al, 1981), quinonas (Carlson & Miller, 1985),
oxametalatos (Essaadi et al, 1994) e derivados de adenina (Santos Alvarez et al, 2001). O
uso de mediadores tem levado à diminuição do potencial, aumentando a seletividade
destes biossensores (Gao et al, 2003, Anchiochia et al, 2004).
7. Purificação da enzima lactato desidrogenase a partir de sistemas
bifásicos aquosos
A lactato desidrogenase está localizada principalmente no citoplasma e pode ser
liberada em soluções através da ruptura da membrana plasmática a partir de um estresse
mecânico ou osmótico. Os corações de boi e de porco são fontes comumente utilizadas
para se obter grande quantidade das isoenzimas 1 e 2. Os métodos tradicionais para
isolamento e purificação da enzima envolvem algumas etapas, tais como a precipitação
em sulfato de amônia, cromatografia de troca iônica ou de afinidade, diálise e então a
34
concentração final do produto é obtida. Isto requer um maior tempo e alto custo. Durante
estas etapas, a enzima também pode perder sua atividade levando a um baixo rendimento.
(Kopperschläger et al, 1996).
Os sistemas bifásicos aquosos são muito utilizados na separação e purificação de
macromoléculas. O método promove a remoção de contaminantes na amostra em um
processo simples e econômico porque os materiais que formam os sistemas bifásicos não
são caros e podem ser reciclados (Spelzini, et al, 2005). Entretanto, a purificação da
lactato desidrogenase tem sido pouco explorada a partir destes sistemas (Shibusawa et al,
1997; Mulkiewicz et al, 2001; Lin et al, 2003). O método consiste na partição da
macromolécula entre duas fases aquosas de um sistema formado de misturas de dois
polímeros de cadeias flexíveis solúveis em água ou, um polímero com as mesmas
características e um sal em alta concentração. O polímero polietileno glicol e fosfato de
potássio têm sido muito utilizados (Farrugia et al, 2003; Balasubramaniam et al, 2003).
A formação das duas fases aquosas imiscíveis ocorre em concentrações dos
componentes determinadas a partir de uma linha binodal (Figura 11). Acima da linha
binodal, os componentes são separados nas fases superior e inferior, enquanto que abaixo
da linha binodal, não há formação de fases (Han et al, 1997). Geralmente, o polietileno
glicol fica na fase superior e o sal ou dextran na fase inferior que apresenta maior
densidade e é mais eletronegativa.

35
Figura 11. Diagrama de fase dos sistemas bifásicos
compostos de polietileno glicol 6000 e dextran 70000. Fonte:
Han et al, 1997.
O coeficiente de partição (k) determina para qual das fases a proteína migrou e é
calculado dividindo a concentração ou atividade, no caso de enzimas, medida na fase
superior pela concentração ou atividade medida na fase inferior. Se o coeficiente de
partição for maior que 1, por exemplo, significa que a proteína migrou para a fase
superior. Entretanto, partição da proteína é influenciada por sua carga elétrica, massa
molecular e hidrofobicidade. (Han et al, 1997; Fexby et al, 2004).

36
OBJETIVOS

37
OBJETIVOS
Objetivo geral
Utilizar diferentes polímeros na construção de biossensores imunológico e
enzimático visando tanto o melhoramento do desempenho de tais dispositivos quanto à
diminuição do custo experimental a partir da pré-purificação de proteínas.
Objetivos específicos
1. Desenvolver métodos de imobilização de anticorpos com aplicação em biossensores;
2. Construir eletrodos de trabalho a partir de novos materiais que facilitem o processo de
transdução de sinais biológicos;
3. Desenvolver um biossensor amperométrico capaz de detectar a oxidação do cofator
NADH em um baixo potencial elétrico;
4. Utilizar uma técnica alternativa para pré-purificação de proteínas visando à diminuição
do custo no desenvolvimento do biossensor enzimático.

38
CAPÍTULO I - ARTIGO CIENTÍFICO 1
Título: Chitosan polymer as support to IgG immobilization for
piezoelectric applications
Enviado para a revista: Colloids and Surfaces B
Autores: Rosângela Ferreira Frade de Araújo, Cosme Rafael Martinez
Salinas, Karla Patrícia de Oliveira Luna, Renata Maria Costa Souza, Rosa
Fireman Dutra, José Luiz de Lima Filho

39
Chitosan polymer as support to IgG immobilization for piezoelectric applications
Rosângela Ferreira Frade de Araújo1, Cosme Rafael Martínez2, Karla Patrícia de
Oliveira Luna1, Renata Maria Costa Souza1, Rosa Fireman Dutra3, José Luiz de Lima
Filho1,4*
1Laboratório de Imunopatologia Keizo Asami – LIKA, Universidade Federal de
Pernambuco – Recife – PE, Brazil
2Departamento de Biologia Molecular, Universidade Federal da Paraíba – João Pessoa –
PB, Brazil
3Departamento de Patologia, Universidade de Pernambuco - Recife – PE, Brazil
4Departamento de Bioquímica, Universidade Federal de Pernambuco – Recife – PE, Brazil
*Corresponding author - Av. Moraes Rego, s/n – Cidade Universitária – Recife – PE –
Brazil. CEP: 50670-901. Tel: +55 81 21268484; fax: +55 81 21268485. E-mail address:

40
Abstract
Immunoenzymatic assays using gold plates and QCM (Quartz Crystal microbalance)
analysis were carried out in order to evaluate chitosan/IgG interaction. Two chitosan
solutions were prepared with different concentrations of NaOH (0.8% - S1 and 8% - S2).
Absorbance 3 fold higher were obtained when chitosan (S2) was used as support when
compared with direct IgG adsorption on gold. S1 on gold showed a better stability (at 22ºC,
for 72 hours) for IgG immobilization when compared with S2. However, S1 was used on
QCM analysis and the IgG adsorption increased the mass on the electrode surface thus
promoting a proportional increase in the crystal resonant frequency. Direct IgG adsorption
on gold electrode led to a 14.19% (± 2.43) enhancement in crystal frequency. When S1 was
used as a support for IgG, a better immobilization occurred, causing a 24.34% (± 0.75)
enhancement in crystal frequency. The structure of chitosan was shown to be efficient for
IgG immobilization both in the immunoenzymatic method and in the QCM system.
Keywords: antibody, chitosan, gold, immobilization, QCM.

41
Introduction
During the past few decades, there has been an increasing interest in using natural
polymers as immobilization matrixes for cell carriers, living organisms and enzymes [1].
Chitosan is an ideal support for immobilization because it shows favourable characteristics
such as biocompatibility, hydrophicity, biodegradability, non-toxicity, excellent film-forming
ability, antibacterial and antiviral properties [2;3]. The polymer is used in drug development,
obesity control, tissue engineering, e.g. bone repair [4], paper production, photographic
products, heavy metal chelation and waste water treatment [5].
Chitosan is a partially acetylated glycosamine biomolecule derived from
deacetylation of chitin, which is present on shells of crustaceans, insects, mushrrons and the
cell wall of fungi [6-8]. However, the term ‘chitosan’ usually is related to copolymers of 2-
amino 2-deoxy-D-glucopyranose and 2-acetamido-2-deoxy-D-glucopyranose where the
degree of deacetylation is usually greater than 60% [9]. Chitin, a linear polymer composed of
nearly straight chains of β (1-4) 2-acetoamido-2-deoxy-D-glucopyranose, kept together by
strong interchain hydrogen bonding, is the second most abundant natural polysaccharide,
after cellulose [10]. The greater potential applications of chitosan are related to its
polycationic structure [11] and high percentage of nitrogen, present in the form of amino
groups that are responsible for metal ion binding through chelation mechanisms [12]
Chitosan cross-linking with different chemicals has been used for immobilization of
protein. The surfaces have been prepared with aminopropyltriethoxysilane [13],
glutaraldehyde [6,12] and carbodiimide [14]). The QCM biosensor for biological analyses
has been reported increasingly in immunoassays. A linear relation occurs between a layer of

42
external mass deposited in the surface of the crystal and the variation in its frequency of
resonance [15,16]. In this paper, we tested the IgG immobilization directly on a chitosan film
deposited on a gold surface by ELISA method and a QCM device.
Materials and methods
Preparation of chitosan solution
2mg/ml chitosan solutions were prepared by dissolving about 4mg chitosan (Sigma)
from crab shells (minimum 85% deacetylated) in 2ml of 0.8% (v/v) acetic acid (Vetec), in
which it is soluble [17]. 500μl of this solution were added to 375μl of 95% (v/v) ethanol
(Merck) and 125μl of 0.8% (w/v) NaOH (Merck) to S1 and 125μl of 8% (w/v) NaOH to S2.
The NaOH solution was used to neutralize the acidic residues [5].
Preparation of the supports
Gold plates (2mm x 3mm) were washed on corrosive solution [sulphuric acid (Vetec),
hydrogen peroxide (Labsynth), 7:3 (v/v)] and distilled water before chitosan application.
Afterwards, they were placed into 2ml eppendorf tubes and 50μl of chitosan solution (S1 or
S2) was applied in order to completely cover the plates. After 15 minutes, the chitosan
solution was drawn from the eppendorf tubes. The plates were dried in nitrogen air, washed
in PBS buffer pH 7.2 and dried again.
ELISA
Gold plates were covered with 2μg/mL human IgG solution (Sigma), kept at 22°C for
2 hours. In order to block nonspecific linking sites to anti-IgG in chitosan, it was incubated

43
overnight in 1.5% and 3% (w/v) casein, 1.5% and 3.0% (w/v) albumin, 0.37% and 0.75%
(w/v) glycine, 0.37% (w/v) glycine + 1% (w/v) NaOH and 0.75% (w/v) glycine + 1% (w/v)
NaOH all prepared with PBS buffer pH 7.2. 50μl (0, 1 and 5μg/ml) of anti-human IgG
peroxidase linked (Sigma) were used within 2 hours of incubation at 22°C. Plates were
washed in PBS buffer, being 200μl OPD (ortofenilenodiazina - Sigma) the reaction substrate.
2M sulphuric acid solution was used as stop solution and absorbances were recorded at
492nm. The final absorbances were determined by the difference between readings with and
without IgG immobilized.
As a comparative analysis, the IgG immobilization directly on gold without chitosan
was performed with the plates previously washed with 0.1 M HCl (Sigma) using 2μg/ml
human IgG, the more efficient blocking solution and 5μg/ml anti-human IgG peroxidase
linked. The IgG immobilization also was performed directly on micro plates (Nunk) without
and with chitosan (S1 and S2) using 2μg/ml human IgG, the different blocking solutions and
5μg/ml anti-human IgG peroxidase linked.
The stability of chitosan (S1 and S2) on gold was determined at 22°C after drying the
plates in nitrogen air. The immobilization procedure was performed as described using
2μg/ml human IgG, the more efficient blocking solution and 5μg/ml anti-human IgG
peroxidase linked at different times (0-72 hours) after preparing the supports.
QCM analysis
In order to obtain results by different methods to evaluate the chitosan/IgG
interaction, a QCM device also was used. An AT-cut quartz crystal of 10 MHz coated with
two identical Au electrodes (diameter 8mm) was used and only one side of the quartz crystal
44
was used for immobilization. The variation in the crystal resonant frequency was measured at
22ºC by a Frequency Analyzer GFC 8131 from GW intelligent counter.
Two different procedures of immobilization to attach IgG on gold electrodes were
tested. In the first, a frequency change was observed: a) after washing the electrode with
corrosive solution and water, and drying in air nitrogen; b) after two applications of chitosan
solution (20μl-dry-20μl-dry). With this approach, after washing the crystals with distilled
water and drying, a constant frequency was obtained; c) after incubation with 20μl of 0.5 to
3.5 μg/ml IgG where changes in frequency were also observed after washing with PBS buffer
and drying. In the second procedure, a frequency change was observed in the following
condictions: a) after incubation with 20μl of 0,1M HCl for 10 minutes, washing the electrode
with distilled water and drying, and b) after incubation with 20μl of IgG solution
(concentration chosen in the previous assay), in this case, changes in frequency were also
observed after washing the electrode with PBS buffer and drying.
Statistical analysis
All the assays were performed as two replicates and analysis of variance (ANOVA)
and Tukey’s HSD were performed to determine the statistical significance of the differences
between the average values using Statistica (version 6.1) software for statistics (statsoft Inc.,
2002).

45
Results and Discussion.
ELISA
The highest absorbances were obtained by using gold plates/chitosan solution
prepared with 8% (w/v) NaOH (S2) and 3% (w/v) casein as blocking solution (Figure 1).
Despite this, comparing the absorbances gotten using the other block solutions, it was not
statistically different. Only 1.5% (w/v) casein used as blocking solution on S2 was not
efficient when all the anti human IgG peroxidase linked concentrations had been led in
account in the statistical analyses.
By comparing between IgG immobilization on gold and on gold/chitosan (Figure2)
using 3% (w/v) casein as blocking solution, it was observed that with S1 and S2 occurred an
increase of 63.52% and 71.13% in the absorbances respectively. The higher absorbance
obtained by using S2 indicate that the increase in the concentration of NaOH in the
preparation of the chitosan solutions contributed significantly for a better IgG
immobilization. The chitosan (85% deacetylation) in an acidic environment (S1) is
protonated due its isoelectric point at pH 6.3 [1]. However, in S2, the chitosan backbone did
not present positive charges. The IgG immobilization occurred either on S1 or on S2, so it is
possible that the interaction between the molecules of IgG and chitosan has been of the
hydrophobic type.
Yang et al [18] observed the binding capacity of IgG to protein A immobilized on the
chitosan/cellulose membrane and concluded that the binding capacity of human IgG on this
support was four-fold higher than that using only cellulose for protein A immobilization. In
this work, absorbances three-fold higher were found when only a chitosan solution (S2) was
deposited on gold for IgG immobilization.
46
The absorbances obtained with and without application of chitosan directly on
microplates (Figure 3) were compared and the highest values were obtained without chitosan
and with S2 considering all the used blocking solutions. One more time the absorbances
obtained using S2 were higher than that using S1. The increase in the concentration of NaOH
caused a better tack of the chitosan on microplates. The figure 4 shows the highest
absorbances found using 0.75% (w/v) glycine + 1% (w/v) NaOH, 1.5% (w/v) BSA and 3%
(w/v) BSA blocking solutions considering the immobilization on S1 and S2. S1 can have
attached stronger on gold than on microplates. This can be possible due to the ability of
chitosan to bind metals in acidic pH [9].
In the figure 5, the chitosan (S1 and S2) stability to IgG immobilization at
22ºC can be observed and S1 showed to be more stable then S2. In the different times after
support preparation, the absorbances obtained by using S1 were not significantly different. A
decrease in the absorbance occurred after 24 hours when S2 was used as support but after this
time, the apparent decrease in the absorbances was not significant. Comparing absorbances
gotten with S1 and S2 after 24 hours is clear to note highest absorbances using S1. However,
this difference is more evident after 48 hours. With the time, its possible have occurred loss
of water on structure of chitosan. The dehydration of the structure and the highest
concentration of NaOH in S2 can have contributed to become it more compact which led to a
lesser interaction between chitosan and IgG. These results led to use S1 as the support on the
QCM system due to necessary steps of drying in the IgG immobilization on electrode surface.
QCM analysis
The mass increase on the surface of the electrode (Table 1) occurred due the
interaction between IgG and the supports thus leading to a proportional increase of the

47
crystal resonant frequency. Gao et al [19] also found this relationship between resonant
frequency and mass when they used a crystal immunosensor for detection of staphylococcal
enterotoxin. When the chitosan film was deposited on the clean crystals, the crystals
resonance frequency showed an average variation of 42.5% (± 0.59) being necessary two
washes on electrode surface to keep its resonant frequency.
The direct IgG adsorption on gold electrode led to a 14.19% (± 2.43) enhancement
on the crystal frequency and a 24.34% (± 0.75) enhancement on it frequency occurred when
S1 was used as the support for IgG. The direct IgG adsorption on gold for piezoelectric
detection was less efficient than that using chitosan due the force to guide a bigger amount of
IgG to interact with chitosan to have been kept resisting the washing steps. The intrinsic
washing steps in the IgG adsorption lead to a subsequent partial remotion of these molecules.
When the molecules of IgG were immobilized in different concentrations (Figure 6) on
electrodes surface covered with chitosan (S1), a significant increase in the crystal frequency
occurred by using 2μg/ml IgG. The higher concentrations of IgG led to a decrease in it
frequency. These high concentrations of IgG can have compromised its directed
immobilization probably due to a steric impediment.
Conclusions
The chitosan backbone showed to be efficient for IgG immobilization using a gold
support, either through the immunoenzymatic method or through the QCM system in
relation to immobilization without chitosan. All the blocking solutions tested were efficient
in ELISA method except when 1.5% (w/v) casein was used to block S2. The increase in the
concentration of NaOH in chitosan solution promoted a better IgG immobilization either on

48
ELISA microplate or on gold. A possible hydrophobic interaction occurred between
chitosan and molecules of IgG. The dehydration of the structure of chitosan with the time
kept at 22°C and the higher concentration of NaOH in S2 became its lesser favorable to
IgG immobilization than S1. In QCM analyses, the bigger increase in crystal resonant
frequency occurred when IgG was immobilized on chitosan and this support presented a
bigger interaction force with IgG than that not using chitosan on surface.
Acknowledgments
This work was supported by CNPq, FINEP and JICA.
References
[1] H. Huang, N. Hu, Y. Zeng and G. Zhou, Analytical Biochemistry, 308 (2002) 141.
[2] R. S. Juang, F. C. Wu and R. L. Tseng, Bioresource Technology, 80 (2001) 187.
[3] G. Vikhoreva, G. Bannikova, P. Stolbushkina, A. Panov, N. Drozd, V. Makarov, V.
Varlamov and L. Gal’braikh, Carbohydrate Polymers, 62 (2005) 327.
[4] X. Wang, J. Ma, Y. Wang and B. He, Biomaterials, 23 (2002) 4167.
[5] Y. Wan, K. A. M. Creber, B. Peppley and V. T. Bui, Polymer, 44 (2003) 1057.

49
[6] R. S. Juang, F. C. Wu and R. L. Tseng, Advances in Environmental Research, 6 (2002)
171.
[7] M. Hamdine, M.-C. Heuzey and A. Bégin, Biological Macromolecules, 37 (2005) 134.
[8] Q. Li, B. Song, Z. Yang and H. Fan, Carbohydrate Polymers, 63 (2006) 272.
[9] A. J. Varma, S. V. Deshpande and J. F. Kennedy, Carbohydrate Polymers, 55 (2004) 77.
[10] J. M. C. S. Magalhães and A. A. S. C. Machado, Talanta, 47 (1998) 183.
[11] I. M. N. Vold, K. M. Varum, E. Guibal and O. Smidsrod, Carbohydrate Polymers, 54
(2003) 471.
[12] M. L. Arrascue, H. M. Garcia, O. Horna and E. Guibal, Hydrometallurgy, 71 (2003)
191.
[13] J. Benesch and P. Tengvall, Biomaterials, 23 (2002) 2561.
[14] J. K. Kim, D. S. Shin, W. J. Chung, K. H. Jang, K. N. Lee, Y. K. Kim and Y. S. Lee,
Colloids and Surfaces B, 33 (2004) 67.
[15] X. Su and J. Zhang, Sensors and Actuators, 100 (2004) 309.

50
[16] G.-Y. Shen, I. Wang, T. Deng, G.-L. Shen and R.-Q. Yu, Talanta, 67 (2005) 217.
[17] C. Muzzarelli, G. Tosi, O. Francescangeli and R. A. A. Muzzarelli, Carbohydrate
Research, 338 (2003) 2247.
[18] L. Yang, W. W. Hsiao and P. Chen, Journal of Membrane Science, 197 (2002) 185.
[19] Z. Gao, F. Chao, Z. Chao and G. Li, Sensors and Actuators, 66 (2000) 193.

51
Table 1. Crystal resonant frequency after the different steps of the assays and the variation
of this frequency after the immobilization of IgG (2μg/ml) on gold electrode without and
with chitosan (prepared with 0.8% NaOH).
Frequency (KHz) Variation of the frequency (%)
No. Assay Initial clean After chitosan After IgG After chitosan film After IgG Averages variation
electrode Film
application
immobilization application immobilizationafter IgG
immobilization
1 20.47 _ 24.34 _ 15.91 14.19 (± 2.43)
2 49.64 _ 56.71 _ 12.47
3 45.26 79.28 105.53 42.91 24.87 24.34 (± 0.75)
4 46.67 80.58 105.76 42.08 23.81

52
Figure 1. The means (2 replicates) of the differences between the absorbances found by the
ELISA method with and without IgG (2μg/ml) immobilized on gold plates covered with
chitosan using different blocking solutions followed by same letters not differ statistically
(p<0.05) to Tukey’s HSD. The small letters make comparisons between S1 or S2 in
different blocking solutions and the capital letters comparing S1 and S2 in each blocking
solution.
Figure 2. Comparison between the absorbances obtained by ELISA method immobilizing
IgG (2µg/ml) on gold plates without and with chitosan (prepared with 0.8% NaOH - S1 and
with 8% NaOH - S2).
Figure 3. Effects of the chitosan in absorbances obtained by ELISA method immobilizing
IgG (2μg/ml) on microplate using different blocking solutions. The means (6 replicates)
followed by the same letters do not differ statistically (p<0.05) to Tukey’s HSD.
Figure 4. Effects of blocking solutions in absorbances obtained by ELISA method
immobilizing IgG (2μg/ml) on microplate without and with chitosan. The means (2
replicates) follwed by the same letters do not differ statistically (p<0.05) to Tukey’s HSD.
Figure 5. Absorbances obtained by ELISA method immobilizing IgG (2ug/ml) on gold
plates covered with chitosan at different times after the preparation of these supports. The
means (2 replicates) follwed by the same letters do not differ statistically (p<0.05) to
Tukey’s HSD. The small letters make comparisons between S1 or S2 at different times and
the capital letters comparing S1 and S2 in each time.

53
Figure 6. Variation of the crystal resonant frequency after the immobilization of the IgG in
different concentrations (0.5 to 3.5 µg/ml) on gold electrode covered with chitosan
(prepared with 0.8% NaOH).

54
Figure 1

55
0,00
0,10
0,20
0,30
0,40
0,50
Without c hitosan With S1 With S2
Gold plates
Abs
orba
nce
(492
nm
)
Figure 2

56
Figure 3
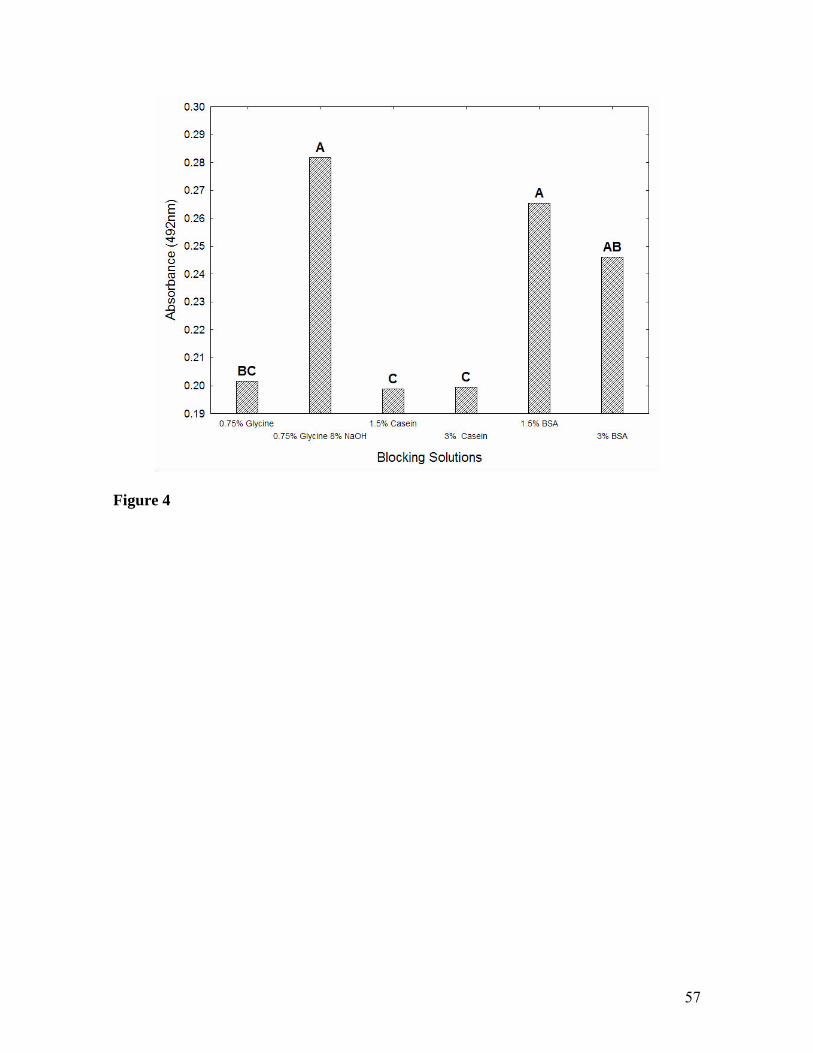
57
Figure 4

58
Figure 5

59
Figure 6
0 5
10 15 20
25
30
0,5 1,0 1,5 2,0 2,5 3,0 3,5
IgG (μg/ml)
Var
iatio
n of
the
frequ
ency
(%)

60
CAPÍTULO II- ARTIGO CIENTÍFICO 2
Título: Development of Lactate dehydrogenase biosensor based on
epoxy silver and TCNQ modified electrode
Enviado para a revista: Sensors and Actuators B
Autores: Rosângela Ferreira Frade de Araújo, Rosa Fireman Dutra, José
Luiz de Lima Filho

61
Development of Lactate dehydrogenase biosensor based on epoxy silver and TCNQ
modified electrode
Rosângela Ferreira Frade de Araújo1, Rosa Fireman Dutra1,2 , José Luiz de Lima Filho1,3
1Laboratório de Imunopatologia Keizo Asami – LIKA, Universidade Federal de Pernambuco
– Recife – PE, Brazil.
2Departamento de Patologia, ICB, Universidade de Pernambuco - Recife – PE, Brazil.
3Departamento de Bioquímica, CCB, Universidade Federal de Pernambuco – Recife – PE,
Brazil.
*Corresponding author - Av. Moraes Rego, s/n – Cidade Universitária – Recife – PE –
Brazil. CEP: 50670-901. Tel: +55 81 21268484; fax: +55 81 21268485. E-mail address:

62
Abstract
The electrocatalytic response of epoxy silver and 7,7,8,8- tetracyanoquinodimethane
(TCNQ) modified electrodes due to the presence of lactate dehydrogenase (LDH) was
observed and anodic peaks were obtained in a potential around 0.5V. In the presence of
LDH (200 U/l), the highest catalytic current was obtained by the electrodes without
glutaraldehyde and with this polymer at 0.5% (w/v) to keep nicotinamide adenine
dinucleotide reduced form (NADH) on the electrode surface, an anodic current around
300μA was generated. A linear relation between enzyme activity and current produced due
to oxidation of NADH was obtained and the biosensor presents a sensitivity of 1.5μA
(U/L)-1 using LDH with activity between 30 and 394U/l.
Keywords: biosensor, epoxy silver, lactate dehydrogenase, NADH, TCNQ.
63
Introduction
The human lactate dehydrogenase - LDH (EC 1.1.1.27) in serum appear in the form
of a tetramer made up of two different types of subunits: H (heart – derived) and M
(skeletal muscle – derived). The mixture of these subunits forms the three isoenzymes,
LDH 2 – H3M, LDH 3 – H2M2, LDH 4 – HM3 and the two others are formed of four
subunits H, LDH 1 and four subunits M, LDH 5 [1,2]. The measurement of LDH activity
levels in serum has been an important tool in cardiac diagnosis due the increase in activity
of the isoenzymes 1 and 2 to be a relatively specific symptom of heart involvement.
However, this enzyme has clinical significance in much pathology such as liver,
hematological, skeletal muscle, renal and malignant disease where high values has been
found [3].
The biosensor technology applied to determination of LDH has advanced by studies
based on a reversible reaction (pyruvate + NADH ↔ L-lactate + NAD+) where the
electrochemical oxidation of NADH or reduction of NAD+ can be measured by electron
transfer between an electrode and this cofactor [4,5]. However, the problem associated with
the oxidation of NADH at unmodified electrode is the high potential required as large as
1.0V [6-8]. The overpotentials lead to the oxidation of other electroactive species present in
the media generating a current that would interfere with the analysis, therefore lowering the
biosensor selectivity [9].
Some works already were developed with the use of mediators to diminish the
potential of oxidation of NADH. Screen-printed technology using 3, 4 – DHB
dihydroxybenzaldehyde [10] and poly(thionine) [4] as electron transferring mediators led to

64
a decrease of this potential. Santos-Alvarez et al [3] measured the oxidation of NADH in
low potential at graphite electrodes modified by adsorbed ADP oxidation products. Other
mediators such as quinones [11], oxametalates [12] and phenol red [13] also were used with
this intention. These studies on electrochemical biosensors has been developed due to their
advantages such as high sensitivity, rapid response, relatively simple instrumentation,
operational convenience and the possibility of portability and miniaturization [14].
The goal of this work was to develop a biosensor for LDH activity measurements
using an epoxy silver and TCNQ modified electrode able to do the direct electro transfer
between NADH used in reaction and the others compounds of the electrode.
Materials and methods
Reagents and materials
The LDH activity was determined using nicotinamide adenine dinucleotide reduced
form (NADH), lactate dehydrogenase from rabbit muscle and potassium phosphate all
purchased from Sigma (USA) and pyruvate purchased from LAB TEST kit for LDH
determination in serum (Brazil). For the electrode preparation, epoxy silver, Epo-Tek H20E
(part A and part B) purchased from World Precision Instruments (USA), graphite powder
from Fisher Scientific (USA) and glutaraldehyde and 7,7,8,8- tetracyanoquinodimethane-
TCNQ from Sigma (USA) were used. All the reagents were used as received and the
solutions were prepared in purified water using a NANOpure-ultrapure water system
(Barnstead).

65
Apparatus
The electrochemical measurements were carried out with a conventional three electrode
electrochemical cell composed of an Ag/AgCl reference electrode, a platinum electrode
acted as counter electrode which were positioned vertically with relation to a working
epoxy silver and TCNQ modified electrode. Cyclic voltammetry and time based
amperometry were performed in a reaction cell of 0.1ml at 22°C in batch conditions and
monitored by a computer-controlled MQPG-01 potentiostat (Micro-Química, Brazil).
Preparation of modified electrode
The working electrodes (5mm∅) were made using 43.03% silver epoxy hardener,
43.03% silver epoxy resin, 12.2% graphite powder, 0.96% TCNQ and 0.78% potassium
phosphate buffer 0,1M, pH 7.4 and drying for six hours at 65°C. The electrode surface was
achieved by polishing on fine sandpaper and washing with purified water. Finally, it was
dried in air nitrogen.
Two types of electrodes were prepared, in the first one, 50 μl of 36 mM NADH
solution was used to cover the electrodes surfaces for one hour. This solution was displaced
and the electrodes were dried in air nitrogen. In the second type, after NADH adsorption, a
small volume (20 μl) of 0.5%, 1.5% or 2.5% (v/v) glutaraldehyde solution were placed on
the electrodes surfaces for twenty minutes in order to keep the NADH adsorbed on
electrode surface and so it was displaced. Then, the electrodes were dried in air nitrogen.
The schematic representation of the assay can be observed by Figure 1. The electron

66
micrograph of the electrodes was performed to observe the distribution of the components
on its surface.
Measurements
When the NADH or NADH and glutaraldehyde were immobilized in the electrodes,
three cyclic voltammograms were recorded in 0.1M phosphate buffer pH 7.4 at potential
sweep changing from – 0.8 to 0.8V at 50 mV/s scan rate. After that, 1.44mM, 1.92mM and
2.4mM pyruvate solution prepared in the same buffer were added in the electrochemistry
cell and news cyclic voltammograms were performed, so the LDH (200U/l) was also added
and the anodic peak heights were observed.
The amperometric data were obtained on a potential which was found on by
voltammetric studies for NADH oxidation. The LDH activity was varied from 30U/l to
394U/l in a pyruvate solution and the current generated by reaction were measure.
Results and discussion
The figure 2 shows the electron micrograph of the working electrode in low
magnification (700-fold), where can be observed particles randomly distributed. Initially,
the electrochemical oxidation of NADH at the epoxy silver and TCNQ modified electrode
was evaluated (Figure 3). When the NADH was absorbed on electrode surface, the anodic
current increase significantly from potential of 0.3V and reached a catalytic saturation
around 0.5V. This result suggests that the electrocatalytic oxidation of NADH was efficient
at the epoxy silver and TCNQ modified electrode. The potential found to this
67
electrocatalysis was the same that Raj et al [5] had found using a self-assembled monolayer
of thiocytosine on gold electrode.
The electrocatalytic oxidation of NADH on electrode surface also was evaluated by
voltammetric tests in presence of pyruvate and LDH. The voltammetric data (Figures 4 and
5) showed an anodic current generated through the electrochemical oxidation of NADH
which is an indicative of a kinetic process. The amount of NADH present on the electrode
surface was sufficient to obtain an enzymatic response. Comparing the results obtained
without and with glutaraldehyde to keep the NADH on electrode surface, the highest anodic
current was produced without glutaraldehyde (Figure 4). However, in presence of
glutaraldehyde a slightly higher current was found using 0.5% (v/v) glutaraldehyde solution
on the electrode surface. In 1.5% (v/v) glutaraldehyde solution, occurred a decrease of 80%
in the current generated by the reaction and no catalytic current was found when the
solution concentration was 2.5% (data not showed). The reaction on the surface of the
electrode occurs when LDH molecules diffuse into the glutaraldehyde layer or react with
NADH available on surface.The increase in the concentration of glutaraldehyde solution
became difficult the interaction between NADH and LDH due to an impediment caused for
the excess of aldehyde groups.
Santos-Alvarez et al [3] also observed a lower catalytic current but a better
operational stability for NADH oxidation when they used 0.7% (w/v) polyethyleneimine
layer to cover the adenosine diphosphate adsorbed on graphite electrode.
The Figure 4 shows the voltammograms of the two types of electrodes described
before where anodic peaks formed around 0.5V and cathodic peaks formed around 0.1V
can be observed, which suggest that the reaction was reversible in the system developed
and indicate that the regeneration of the reduced mediator occur. NADH reacts with the

68
pyruvate to give lactate and the mediator (TCNQ) is reduced on the electrode. Then, an
electron goes out from the electrode side converting NAD+ to NADH.
An increase of 1.44 to 1.96mM in pyruvate concentration led to an increase in
catalytic current in 0.5V due to oxidation of NADH but when the pyruvate concentration
increase of 1.92 to 2.5mM (Figure 5), no alteration occurred in the generated current. It can
be occurred due to the fact of the LDH to be inhibited in high substrate concentrations [15].
Pyruvate at 1.44mM was used in the amperometric measurements.
On the basis of the votammetric results, the amperometric experiments were
performed in the same buffer with an applied potential of 0.5V. After injection of LDH in
electrolyte, was observed an enhancement in the anodic current as a function of LDH
activity, which is typical for electrocatalytic oxidation of NADH. The maximum value of
the generated anodic current was gotten in the initial time and decayed after that, which is
presumably due to the local insufficiency of NADH adsorbed on working electrode.
The figure 6 shows the linear relation between enzyme activity and current
produced due to the oxidation of NADH in the developed LDH biosensor with a correlation
coefficient (R) = 0.9756. The biosensor showed good sensitivity which was of 1.5μA
(U/L)-1 and reproducibility in the assays performed but it can not present good selectivity
because, at a potential of 0.5V still is possible that easily oxidable compounds can interfere
in the measurements [16].
Conclusion
The immobilization strategy of the NADH and glutaraldehyde by adsorption on
electrode surfaces compounded by epoxy silver, graphite and TCNQ did not reduce

69
significantly the working potential for oxidation of NADH , which can not contribute to a
good selectivity of these electrodes but despite this, they showed be reproducible and
presented a good sensitivity (1.5μA (U/L)-1).
Acknowledgements
The financial support of CNPq and FINEP-Brazil is greatly acknowledged.
70
References
[1] J. Rishpon, I. Rosen, The development of an immunosensor for the electrochemical
determination of the isoenzyme LDH5, Biosensors, 4 (1989) 61-74.
[2] S. Kelly, D. Compagnone, G. Guilbault, Amperometric immunosensor for lactate
dehydrogenase LD-1, Biosensors & Bioelectronics, 13 (1998) 173-179.
[3] N. Santos-Álvarez, M. J. Lobo-Castañón, A. J. Miranda-Ordieres, P. Tuñón-Blanco,
Amperometric determination of serum lactate dehydrogenase activity using an ADP-
modified graphite electrode, Analytica Chimica Acta, 457 (2002) 275-284.
[4] Q. Gao, X. Cui, F. Yang, Y. Ma, X. Yang, Preparation of poly(thionine) modified
screen-printed carbon electrode and its application to determine NADH in flow injection
analysis system, Biosensors & Bioelectronics, 19 (2003) 277-282.
[5] C. R. Raj, S. Behera, Mediatorsless voltammetric oxidation of NADH and sensing of
ethanol, Biosensors & Bioelectronics, 21 (2005) 949-956.
[6] C. O. Schmaakel, K. S. V. Santhanam, P. J. Elning, Nicotinamide adenine dinucleotide
(NAD+) and related compounds.Electrochemical redox pattern and allied chemical
behavior, Journal of the American Chemical Society, 97 (1975) 5083-5092.

71
[7] K. Warriner, S. Higson, P. Vadgama, A lactate dehydrogenase amperometric pyruvate
electrode exploiting direct detection of NAD+ at a poly(3-methylthiophene): poly(phenol
red) modified platinum surface, Materials Science & Engineering C, 5 (1997) 91-99.
[8] M. Musameh, J. Wang, A. Merkoci, Y. Lin, Low potential stable NADH detection at
carbon-nanotube-modified glassy carbon electrodes, Electrochemistry Communication, 4
(2002) 743-746.
[9] B. Prieto-Simón, E. Fábregas, Comparative study of electron mediators used in the
electrochemical oxidation of NADH, Biosensors and Bioelectronics, 19 (2004) 1131-1138.
[10] M. Y. Hong, J. Y. Chang, H. C. Yoon, H. S. Kim, Development of a screen-printed
amperometric biosensor for the determination of L-lactate dehydrogenase level, Biosensors
& Bioelectronics, 17 (2001) 13-18.
[11] B.W. Carlson, L. Miller, Mechanism of the oxidation of NADH by quinines.
Energetics of one-electron and hydride routes, Journal of the American Chemical Society,
107 (1985) 479-485.
[12] K. Essaadi, B. Keita, L. Nadjo, R. Contant, Oxidation of NADH by oxometalates,
Journal of Electroanalytical Chemistry, 367 (1994) 275-278.

72
[13] K. Warriner, S. Higson, P. Vadgama, A lactate dehydrogenase amperometric pyruvate
electrode exploiting direct detection of NAD+ at a poly(3-methylthiophene):poly(phenol
red) modified platinum surface, Materials Science & Engineering C, 5 (1997) 91-99.
[14] M. C. Rodríguez, M. R. Monti, C. E. Argaranã, G. A. Rivas, Enzymatic biosensor for
the electrochemical detection of 2, 4 – dinitrotoluene biodegradation derivatives, Talanta,68
(2006) 1671-1676.
[15] G. Kopperschläger, J. Kirchberger, Methods for the separation of lactate
dehydrogenases and clinical significance of the enzyme, Journal of Chromatography B, 684
(1996) 25-49.
[16] C. Calas-Blanchard, T. Noguer, M. Comtat, S. Mauran, J. L. Marty, Potencialities of
expanded natural graphite as a new transducer for NAD+ -dependent dehydrogenase
amperometric biosensors, Analytica Chimica Acta, 484 (2003) 25 - 31.
73
Biographies
Rosângela Ferreira Frade de Araújo obtained her Master degree in Biochemistry from
Federal University of Pernambuco, Brazil in 2001. Presently, she is a Ph.D. student in the
biotechnology area.
Dr. Mrs. Rosa Fireman Dutra obtained her Ph.D. from the Federal University of
Pernambuco, Brazil in 1999. She is Pathology professor from University of Pernambuco,
Brazil. Her current activities include development of immunological and biomolecular
biosensors.
Dr. José Luiz de Lima Filho obtained his Ph.D. from University of Saint Andrews,
Scotland, UK in 1987. He is Biochemistry and Microbiology professor and director of
Keizo Asami Laboratory of Immunopathology -LIKA from Federal University of
Pernambuco, Brazil. He has published more than 100 research papers within last 20 years.
He research interests include biosensors, downstream and medical instrumentation.

74
Figure1. Schematic representation of enzymatic assay format. 1- Adsorption of the NADH;
2 and 3- adsorption of the glutaraldehyde; 4- electrode on pyruvate presence and 5-
electrode on pyruvate and LDH presence.
Figure 2. Scanning electron micrograph of epoxy silver and TCNQ modified electrode.
Magnification was 700.
Figure 3. Cyclic voltammogram of the working electrode without NADH (dotted line) and
with NADH (full line). Scan rate, 50mV/s.
Figure 4. Cyclic voltammograms of the working electrodes with NADH (A) and with
NADH and glutaraldehyde on surface (B) in 1.44mM pyruvate; dotted line – without
enzyme and full line – with enzyme (200 U/l). Scan rate, 50mV/s.
Figure 5. Cyclic voltammogram of the working electrode using 200U/l LDH on different
pyruvate concentrations: 1.92 mM (dotted line) and 2.5 mM (full line). Scan rate, 50mV/s.
Figure 6. Relation between enzyme activity and maximum anodic current gotten in 0.5V
by epoxy silver and TCNQ modified electrode.
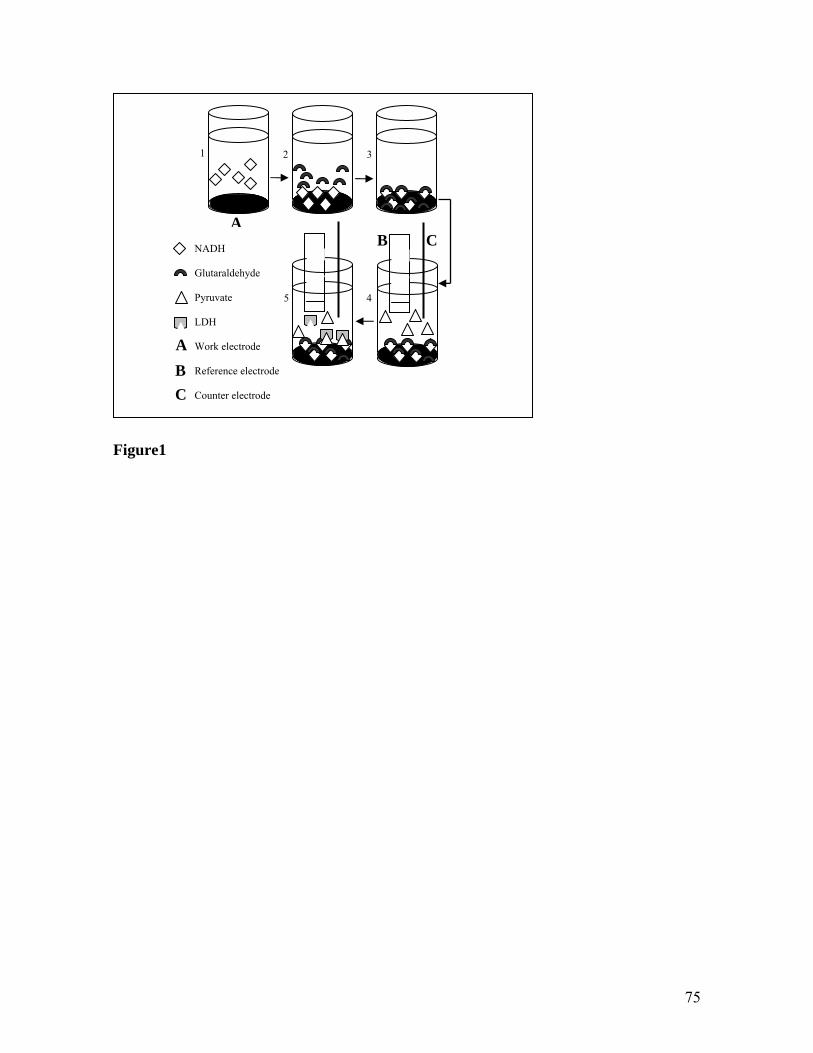
75
Figure1
NADH Glutaraldehyde Pyruvate LDH Work electrode Reference electrode Counter electrode
AB C
A B C
1 2 3
5 4

76
Figure 2

77
-1.0 -0.8 -0.6 -0.4 -0.2 0.0 0.2 0.4 0.6 0.8 1.0-0.005
-0.004
-0.003
-0.002
-0.001
0.000
0.001
0.002
0.003C
urre
nt/A
E (V vs Ag/AgCl)
Figure 3

78
-1.0 -0.8 -0.6 -0.4 -0.2 0.0 0.2 0.4 0.6 0.8 1.0
-0.006
-0.005
-0.004
-0.003
-0.002
-0.001
0.000
0.001
0.002
0.003
0.004
I (A)
E (V vs Ag/AgCl)
-1.0 -0.8 -0.6 -0.4 -0.2 0.0 0.2 0.4 0.6 0.8 1.0
-0.006
-0.005
-0.004
-0.003
-0.002
-0.001
0.000
0.001
0.002
0.003
0.004
I (A
)
E (V vs Ag/AgCl)
Figure 4
A
B

79
-1.0 -0.8 -0.6 -0.4 -0.2 0.0 0.2 0.4 0.6 0.8 1.0
-0.0025
-0.0020
-0.0015
-0.0010
-0.0005
0.0000
0.0005
0.0010
0.0015
I (A)
E (V vs Ag/AgCl)
Figure 5

80
Figure 6
0
100
200
300
400
500
600
700
0 100 200 300 400 500
Enzyme activity (U/l)
Cur
rent
(µA
)
81
CAPÍTULO III- ARTIGO CIENTÍFICO 3
Título: Partitioning of LDH from bovine heart crude extract by PEG-
citrate ATPSs
Enviado para a revista: Process Biochemistry
Autores: Rosângela Ferreira Frade de Araújo, Tatiana Souza Porto, Keila
Aparecida Moreira, Ana Lúcia Figueiredo Porto, Rosa Fireman Dutra, José
Luiz de Lima Filho

82
Partitioning of LDH from bovine heart crude extract by PEG-citrate ATPSs
Rosângela Ferreira Frade de Araújo1, Tatiana Souza Porto2, Keila Aparecida Moreira3, Ana
Lúcia Figueiredo Porto3, Rosa Fireman Dutra4, José Luiz de Lima Filho1,5*.
1Laboratório de Imunopatologia Keizo Asami - LIKA, Universidade Federal de Pernambuco
- Recife - PE, Brazil
2Departamento de Tecnologia Bioquímico-Farmacêutica, Universidade de São Paulo - São
Paulo - SP, Brazil
3Departamento de Mofologia e Fisiologia Animal, Universidade Federal Rural de
Pernambuco - PE, Brazil
4Departamento de Patologia, Universidade de Pernambuco - Recife - PE, Brazil
5Departamento de Bioquímica, Universidade Federal de Pernambuco - Recife - PE, Brazil
* Corresponding author - Av. Moraes Rego, s/n – Cidade Universitária – Recife – PE –
Brazil. CEP: 50670-901. Tel: +55 81 21268484; fax: +55 81 21268485. E-mail address:

83
Abstract
In this work, aqueous two-phase systems (ATPSs) composed of polyethylene glycol
(PEG)-citrate were used for partition of lactate dehydrogenase (LDH) from bovine heart
crude extract. The two-level factorial design was used and in analyze of the results a
particular attention was paid to the influence of the PEG molecular mass in the purification
factor of LDH. The lesser PEG molecular mass (400) in higher concentrations led to a
better interaction between PEG and LDH. However, in the system performed by 42%
(w/w) PEG 400 and 12.5% (w/w) citrate, the highest purification factor in the top phase
(7.9) was obtained with an enzyme yield around 100%.
Keywords: aqueous two-phase system, lactate dehydrogenase, partition, polyethylene glycol,
citrate.
84
Introduction
The enzyme lactate dehydrogenase – LDH (E.C.1.1.1.27) catalyses the final
reaction of glycolysis, the interconversion of pyruvate and lactate using the nicotinamide
adenine dinucleotide (NAD) as a coenzyme, being widely distributed among bacteria,
plants and animals [1]. The determination of this enzyme in serum has received much
attention because is useful in the diagnosis of diseases involving damage to tissues. Five
LDH isoenzymes and their relative properties change significantly in certain pathological
conditions [2].
The purified enzyme can be useful to biomedical analysis performing the calibration
curves to measurements of the enzyme activity, kinetic and stability studies and structural
analyses. Some methods have been used for the purification of LDH and separation of its
isoenzymes such as anion-exchange chromatography, affinity chromatography, affinity
precipitation and affinity partitioning in aqueous two-phase systems (ATPSs) [3].
The ATPSs allow enzyme separations based on molecular mass, conformation,
charge and / or hydrophobicity [4]. Extraction in this system is a suitable technology for the
first step of separation procedure and also to partially replace chromatographic steps [5].
This method has the advantages , such as high water content in two phases, hight
biocompatibility, low biomolecules degradation, hight resolution [6] and advisable for large
scale purification of proteins due to achieve selective partitioning with high yields to as
well as the capability to scale-up and a good cost-benefit ratio [7]. The ATPS is based on
water-soluble polymers and salts and / or two different water-soluble polymers [8].
The aim of this research is the utilization of an ATPS compounded of PEG and
citrate for partial purification of LDH from bovine heart crude extract using a factorial

85
design. This is a convenient method to observe the effects of the factors (parameters) and to
determine the more significant effects.
Experimental
Reagents
Polyethylene glycol (PEG) 400, 550, 1000, bovine serum albumin, were obtained
from Sigma (St. Louis, USA), sodium citrate and citric acid were purchased from Merk
(Darmstadt, Germany) and sodium pyruvate and nicotinamide adenine dinucleotide reduced
form - NADH were from Labtest kit for lactate dehydrogenase determination (Minas
Gerais, Brazil).
Preparation of crude bovine heart extract
The crude bovine extract was prepared with method described by Shibusawa et al
[9].
Preparation of aqueous two-phase systems
For PEG-sodium citrate systems, stock solution of 30% (w/w) sodium citrate pH 7.0
was used. The sodium citrate solutions were prepared dissolving calculated amounts of
sodium citrate (dihydrated) in deionized water. A 30% (w/w) citric acid (monohydrated)
solution also in deionized water was used to adjust the pH of citrate solution. Systems of 5g
mass containing the required amounts of PEG, salt solution, extract and deionized water to
86
balance the total weight were prepared. The level for the factors were chosen based on
phase diagrams [10,11] for the systems studied and table 1 shows the experimental design.
The ATPSs were thorough mixed by vortex for 20s to allow redistribution of the
components and then, were centrifuged at 3000 rpm at 4°C for ten minutes to expedite the
phase separation and the volumes of the phases were measured.
Enzyme assay
Assays of LDH activity of crude bovine heart extract were performed in Buffer 0,25M
pH 7.5 containing 15mM/l sodium azide, 6mM/l sodium pyruvate and 0.36 mM/l NADH.
One unit of enzyme reduces 1μMol pyruvate per minute at room temperature, and the
decrease in absorbance was recorded spectrophotometrically at 340nm [12]. This procedure
was done using the samples obtained on a two-phase system with and without the extract
(blank system) to observe a possible polymer or salt interference in enzyme assay.
Protein determination
Protein concentration was measured by the method of Bradford using bovine serum
albumin as standard.
Statistical analysis
A 23 factorial design method was used and the experiments were analyzed using
Statistica (version 6.1) software for statistics (statsoft Inc., 2002). This statistical design of
experiment procedures was used in ATPS by Balasubramaniam et al [13], Mayerhoff et al
[14] and Zhang et al [15]. In the experiments using factorial design some factors were

87
studied such as: PEG molecular mass and PEG and salt concentrations. An investigation
was done of the effect of these factors on enzyme partition coefficient - k (the ratio of the
enzyme activity in the top phase to that in the bottom phase), purification factor in the top
phase-PFT and in the bottom phase - PFB, enzyme yield in the top phase - yieldT and in the
bottom phase – yieldB which were calculated through the described equations below:
Results
23 factorial design
In table 2 can be observed that in the PEG-citrate ATPSs, except in the system
composed by 46% (w/w) PEG 1000 and 7.5% (w/w) citrate, the enzyme was partitioned to
the top phase. The decrease in PEG molecular mass (MMPEG) led to an increase in the k
value. This result is according with the general tendency expected in partitioning assays due
k = EAT EAB
YieldT = EAT (vT) x 100 EAI (vI) YieldB = EAB (vB) x 100 EAI (vI)
EAT = Enzyme activity in the top phase (U/ml); EAB = Enzyme activity in the bottom phase
(U/l); PT = Proteins in the top phase (mg/ml); PB = Proteins in the bottom phase (mg/ml);
EAI = Enzyme activity of the extract (U/ml); PI = Proteins of the extract (mg/ml); vT =
volume of the top phase (ml); vB = volume of the bottom phase (ml); vI = volume of the
extract in the systems.
PFT = EAT x PI PT EAI PFB = EAB x PI PB EAI
(1) (2)
(3)
(4)
(5)
88
to an excluded volume effect that occur with the increase in MMPEG [16]. LDH has
molecular weight of 140kDa and when the proteins have a molecular weight greater than
50kDa, the partitioning behavior is influenced by PEG molecular mass [17]. The highest k
value was found in the ATPS composed by 42% (w/w) PEG 400 and 7.5% (w/w) citrate
and the predicted means for this variable can be observed in figure 1. The Pareto chart
(Figure 2) shows the effects of the factors on the k. The length of the bars indicates the
relative importance of the factors and any factor with significance (p < 0.05) will extend
beyond the line passing through the chart. It is evident that the effect of MMPEG was
statistically more important on k. Despite this, PEG and citrate concentrations also
contributed to increase the k value.
These results are according to that obtained by Capezio et al [18] when they studied the
partition of whey milk proteins and Farruggia et al [19] and Lebreton et al [20] when they
studied the albumin-PEG interaction because they noted that a increase in MMPEG lead to
a decrease in partition coefficient due to induce a significant transfer of this proteins to the
salt phase. However, Balasubramaniam et al [13] found that the lower PEG molecular mass
and lower PEG concentration lead to lower partition coefficient for tobacco protein and
higher partition coefficient for lysosyme. This dependence relationship between MMPEG
and partition coefficient also was found by Lin et al [21] when they observed the LDH
partition in PEG / hidroxypropyl starches (PESs). However, the k values obtained were less
then 1 (0.05 – 0.84) using PEG 2000 and PEG 6000 in the isoelectric point of the enzyme.
The isoelectric point of LDH is pI 6.3, so this enzyme is negatively charged at pH 7.0
which facilitates the migration of this protein for top phase [8] but this displacement also
depends on other parameters, such as: molecular mass of polymer and the polymer and salt

89
concentrations. It clears to note that the relationships between MMPEG and partition
coefficient depends of the protein studied and separation conditions.
The interaction effect (the effect of one factor on partitioning depends on the presence
of another factor) between all the factors was more critical then others interactions effects
(Figure 2). To obtain higher k values will be necessary to decrease the MMPEG, PEG and
citrate concentrations simultaneously. It is probable that the over PEGs concentrations, due
the PEG 400 concentrations indicated by phase diagram to form two - phase systems with
citrate, favored the migration of the enzyme to the top phase where a possible interaction
between PEG and LDH happened.
Shibusawa et al [9] had gotten k values lower than 1 in two-phase systems (PEG 1000-
salt and PEG 8000-dextran) performed in pH 7.0 using the same described extract in this
work while that Fexby et al [22] found k values higher than 1 using the system polymer
E030PO70 (molecular mass 3300)-dextran in partition experiments (pH 7.0) using N-
terminal tagged LDH.
In PEG-citrate ATPSs, the protein determination had been revealed significantly low
(data not shown). A thick interphase was formed between the top and bottom phases and it
is probable that a lot of proteins have been concentrated in this space. It can be together
with the saturation generated for the highest PEG 1000 and salt concentrations, the cause of
the not appearance of the aqueous two phases in the assay 8.
In the PEG-citrate systems (Table 2) is possible to observe that the enzyme showed best
yield and purification factor in the top phase. Yields above of 100% were found when PEG
400 was used in the systems, except in the system performed with the highest PEG
concentration and lowest salt concentration. The highest purification factor (7.9) was

90
obtained in ATPS composed by 42% (w/w) PEG 400 and 12.5% (w/w) citrate. The high
yields are probably explained by the elimination of inhibitors during the purification
process and by the composition of the systems, which favors the enzymatic activity [14]. In
the systems performed with higher PEG molecular mass, a significant decrease in the
enzyme activity was observed.
In table 3 is possible to note that MMPEG presented bigger effect on yield in the top
phase. To increase the yield in this phase will be necessary to decrease MMPEG and PEG
concentration because the interaction effect between these factors was statistically
significant. The effect of PEG concentration on yield in the bottom phase also was
significant but in this case, an increase in its concentration would lead to an increase of the
yield in this phase. The MMPEG caused the bigger effect on the purification factor in the
top and bottom phases but in the top phase this effect was more significant. To increase the
purification factor in the top phase will be necessary to decrease the MMPEG and to
increase citrate concentration.
The relationship between MMPEG and yield and purification factor also was described
by Spelzini et al [23] in theirs experiments with PEG and phosphate, where they comments
the nonspecific nature for the interaction PEG and a great number of protein by
hydrophobic regions.

91
Conclusion
The PEG-citrate ATPSs were used for purification of LDH from bovine heart crude
extract and was observed that MMPEG was the more important variable to increase the
purification factor in the top phase. The PEG-enzyme interaction was more significant
using the lesser MMPEG in higher concentrations. The system performed by 42% (w/w)
PEG 400 and 12.5% (w/w) citrate showed the highest purification factor (top phase) with
an enzyme yield higher than 100%.
Acknowledgement
The authors thank the financial support received from CNPq and FAPESP, Brazil.

92
References
[1] Mulkiewicz, E., Zietara, M.S., Strömberg, J.O. and Skorkowski, E.F., Lactate
dehydrogenase from the northern krill Meganyctiphanes norvegica: comparison with LDH
from the Antartic krill Euphausia superba. Comparative Biochemistry and Physiology Part
B, 2001, 128 233-245.
[2] Rishpon, J. and Rosen, I., The development of an immunosensor for the electrochemical
determination of the isoenzyme LDH5. Biosensors, 1989, 4 61-74.
[3] Kopperschläger, G. and Kirchberger, J., Methods for the separation of lactate
dehydrogenases and clinical significance of the enzyme. Journal of Chromatography B,
1996, 684 25-49.
[4] Sebastião, M.J., Cabral, J.M.S. and Aires-Barros, M.R., Partitioning of recombinant
Fusarium solani pisi cutinase in polyethylene glycol-aqueous salt solution two-phase
systems. Journal of Chromatography A, 1994, 668 139-144.
[5] Ansejo, J.A., Turner, R.E., Mistry, S.L. and Kaul, A., Separation and purification of
recombinant proteins from Escherichia coli with aqueous two-phase systems. Journal of
Chromatography A, 1994, 668 129-137.

93
[6] Zhi, W., Song, J., Ouyang, F., and Bi, J., Application of response surface methodology
to the modeling of α-amylase purification by aqueous two-phase systems. Journal of
Biotechnology, 2005, 118 57-165.
[7] Lahore, H.M.F., Miranda, M.V., Fraile, E.R., Bonino, M.J.B.J. and Cascone, O.,
Partition Behavior and Purification of a Mucor bacilliformis acid protease in aqueous two-
phase systems. Process Biochemistry, 1995, 30 615-621.
[8] Han, J.H. and Lee, C.H., Effects of salts and poly(ethylene glycol)-palmitate on the
partitioning of proteins and Bacillus subtilis neutral protease in aqueous two-phase systems.
Colloids and Surfaces B: Biointerfaces, 1997, 9 109-116.
[9] Shibusawa, Y., Eriguchi, Y. and Ito, Y., Purification of lactic acid dehydrogenase from
bovine heart crude extract by counter-current chromatography. Journal of Chromatography
B, 1997, 696 25-31.
[10] Vernau, J. and Kula, M. R., Extraction of proteins from biological raw material using
aqueous polyethylene glycol-citrate phase systems. Biotechnology and Applied
Biochemistry, 1990, 12 397-404.

94
[11] Oliveira, G.G.G., Silva, D.P., Roberto, I.C., Vitolo, M. and Pessoa jr., A., Partition
behaviour and partial purification of hexokinase in aqueous two-phase polyethylene
glycol/citrate systems. Applied Biochemistry and Biotechnology, 2003, 105-108 787-797.
[12] Bergmeyer, H.U., Methods of Enzymatic Analysis. 3rd ed, Weinheim, Verlag Chemie,
1983.
[13] Balasubramaniam, D., Wilkinson, C., Cott, K.V. and Zhang, C., Tobacco protein
separation by aqueous two-phase extraction. Journal of Chromatography A, 2003, 989 119-
129.
[14] Mayerhoff, Z.D.V.L., Roberto, I.C. and Franco, T.T., Purification of xylose reductase
from Candida mogii in aqueos two-phase systems. Biochemical Engineering Journal, 2004,
18 217-223.
[15] Zhang, C., Medina-Bolivar, F., Buswell, S. and Cramer, C.L., Purification and
stabilization of ricin B from tobacco hairy root culture medium by aqueous two-phase
extraction. Journal of Biotechnology, 2005, 117 39-48.
[16] Su, C.-K. and Chiang, B.H., Partitioning and purification of lysozyme from chicken
egg white using aqueous two-phase system. Process Biochemistry, 2006, 41 257-263.
95
[17] Vaidya, B.K., Suthar, H.K., Kasture, S. and Nene, S., Purification of potato
polyphenol oxidase (PPO) by partitioning in aqueous two-phase system. Biochemical
Engineering Journal, 2006, 28 161-166.
[18] Capezio, L., Romanini, D., Picó, G.A. and Nerli, B., Partition of whey milk proteins in
aqueous two-phase systems of polyethylene glycol-phosphate as a starting point to isolate
proteins expressed in transgenic milk. Journal of Chromatography B, 2005, 819 25-31.
[19] Farruggia, B., Nerli, B. and Picó, G., Study of the serum albumin-polyethyleneglycol
interaction to predict the protein partitioning in aqueous two-phase systems. Journal of
Chromatography B, 2003, 798 25-33.
[20] Lebreton, B., Huddleston, J. and Lyddiatt, A., Polymer-protein interactions in aqueous
two phase systems: fluorescent studies of the partition behaviour of human serum albumin.
Journal of Chromatography B, 1998, 711 69-79.
[21] Lin, D., Wu, Y., Mei, L., Zhu, Z. and Yao, S., Modeling protein partitioning in
aqueous polymer two-phase systems: influence of polymer concentration and molecular
weight. Chemical Engineering Science, 2003, 58 2963-2972.

96
[22] Fexby, S., Ihre, H., Alstine, J.V. and Bülow, L., N-Terminal tagged lactate
dehydrogenase proteins: evaluation of relative hydrophobicity by hydrophobic interaction
chromatography and aqueous two-phase system partition. Journal of Chromatography B,
2004, 807 25-31.
[23] Spelzini, D., Farruggia, B. and Picó, G., Features of the acid protease partition in
aqueous two-phase systems of polyethylene glycol-phosphate: chymosin and pepsin.
Journal of Chromatography B, 2005, 821 60-66.
97
Figure 1. Predicted means for variable k using different polyethylene glycol molecular
mass (MMPEG), polyethylene glycol concentration (PEG Conc.) and citrate concentration
(Citrate Conc.) in the 23 factorial design. 95% confidence intervals are shown in
parentheses.
Figure 2. Pareto chart of standardized effects of the factors: 1 – polyethylene glycol
molecular mass (MMPEG), 2 – polyethylene glycol concentration (PEG Conc.) and 3 -
citrate concentration (Citrate Conc.) on variable k in the 23 factorial design; pure
error=0,0905. 1 by 2, 2 by 3, 1 by 3 and 1*2*3 are the interaction effects between the
factors.

98
Table 1. Experimental design for partitioning of lactate dehydrogenase from bovine heart
crude extract by polyethylene glycol (PEG) - citrate aqueous two phase systems at pH 7.0
using a 23 factorial design.
Factors Low level High level PEG molecular mass 400 1000 PEG concentration (wt%) 42 46 Sodium citrate concentration (wt%) 7.5 12.5

99
Table 2. Effects of the factors: polyethylene glycol molecular mass (MMPEG),
polyethylene glycol concentration (PEG Conc.) and citrate concentration (Citrate Conc.) on
yield in the top phase (YieldT) and in the bottom phase (YieldB), partition coefficient (k)
and purification factor in the top phase (PFT) and in the bottom phase (PFB) obtained by 23
factorial design.
Assay MMPEG PEG conc. (%w/w)
Citrate conc. (%w/w)
YieldT (%)
YieldB (%)
k PFT PFB
1 400 42 7,5 163,02 0,15 1067,81 3,20 0,12 2 1000 42 7,5 4,14 3,09 1,34 0,09 0,15 3 400 46 7,5 31,79 5,61 5,66 5,02 0,69 4 1000 46 7,5 0,668 1,83 0,36 0,31 0,61 5 400 42 12,5 101,79 0,76 133,35 7,9 0,64 6 1000 42 12,5 2,57 1,33 1,92 1,09 0,77 7 400 46 12,5 105,00 1,56 67,09 4,76 2,67 8 1000 46 12,5 - - - - -
9 550 44 10 13,02 0,38 34,12 0,29 0,53 10 550 44 10 10,79 0,26 40,39 0,20 0,44

100
Table 3. Standarlized effects of polyethylene glycol mass molecular (MMPEG),
polyethylene glycol (PEG) concentration and citrate concentration on yield in the top phase
(YieldT) and in the bottom phase (YieldB), purification factor in the top phase (PFT) and in
the bottom phase (PFB). 1 by 2, 2 by 3, 1 by 3 and, 1*2*3 are the interaction effects
between the factors. The effects represented by darker numbers were statistically significant
(p < 0.05).
Independent variablesand its interactions YieldT YieldB PTT PFB
MMPEG (1) -88,39 -7,62 -107,7 -14,39PEG concentration (2) -30,06 15,29 -12,17 12,72
Citrate concentration (3) 2,18 -29,29 28,5 13,941 by 2 27,35 -36,87 2,5 -16,172 by 3 30,34 -19,7 -34,83 1,281 by 3 -3,19 -0,62 -20,83 -13,831*2*3 -29,94 19,12 20,28 -14,94
Standarlized effects on dependent variables
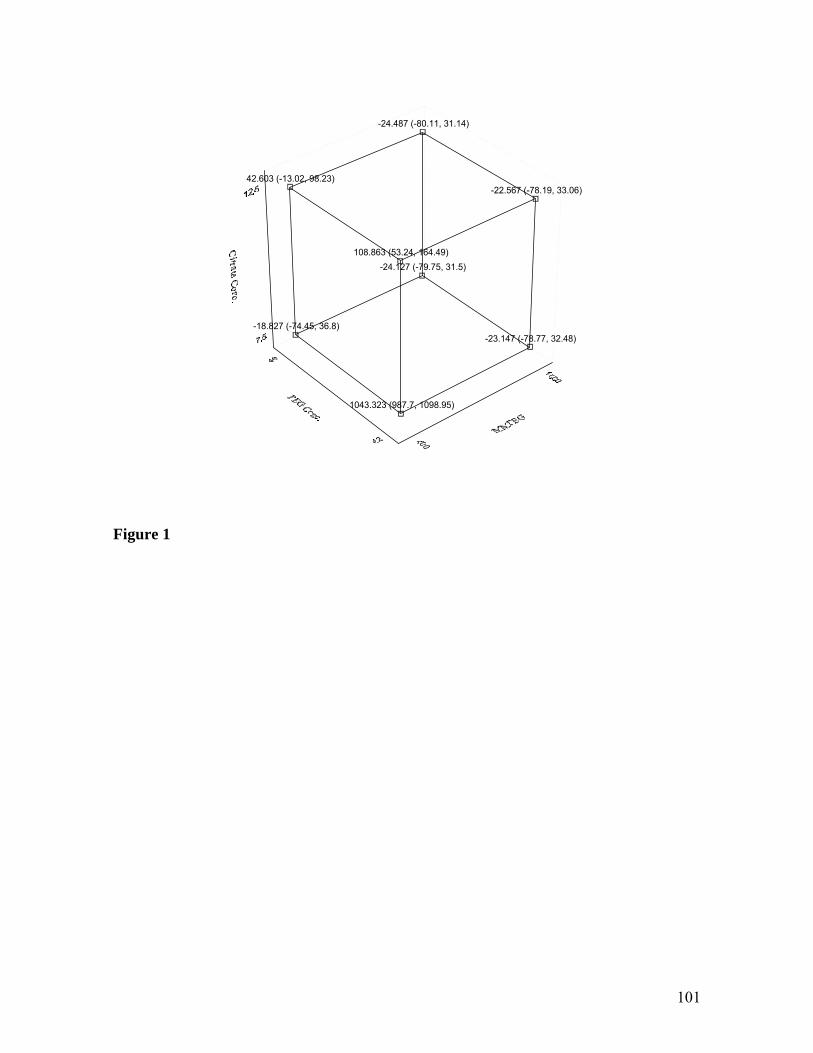
101
-24.127 (-79.75, 31.5)
-24.487 (-80.11, 31.14)
-23.147 (-78.77, 32.48)
-22.567 (-78.19, 33.06)
-18.827 (-74.45, 36.8)
42.603 (-13.02, 98.23)
1043.323 (987.7, 1098.95)
108.863 (53.24, 164.49)
Figure 1

102
-69.60
69.64
79.34
-79.49
89.75
-90.22
-101.30
p=0.05Effect Estimate (Absolute Value)
(3)Citrate Conc.
1by3
2by3
1*2*3
1by2
(2)PEG Conc.
(1)MMPEG
Figure 2

103
CONCLUSÕES

104
CONCLUSÕES
• A imobilização de IgG sobre o filme de quitosana foi mais eficiente que aquela
realizada diretamente sobre o ouro. O imunoensaio mostrou absorbâncias até 3 vezes mais
altas com o uso deste polímero.
• O aumento na concentração de NaOH no filme de quitosana promoveu uma melhor
imobilização de IgG porém, este filme se mostrou menos estável ao longo do tempo.
• O maior aumento na frequência de ressonância do cristal e maior força de interação
entre IgG e o suporte foram obtidos quando o filme de quitosana foi utilizado sobre o
eletrodo.
• Na voltametria cíclica, com NADH e glutartaldeído adsorvidos na superfície do
eletrodo composto de polímero condutor (prata epoxy), grafite e TCNQ, uma corrente
anódica foi gerada na presença da LDH e piruvato devido à oxidação eletrolítica do NADH,
o que é um indicativo do processo cinético.
• Os picos anódicos formados no potencial de 0.5V e os picos catódicos formados em
0.1V sugerem que a reação de oxidação do NADH na superfície do eletrodo foi reversível,
mas o eletrodo de trabalho não reduziu significativamente o potencial de trabalho, o que
pode contribuir para uma baixa seletividade do biossensor.

105
• Na amperometria, o biossensor mostrou uma relação linear entre atividade
enzimática e corrente anódica gerada através da oxidação do NADH apresentando uma boa
sensibilidade (1.5μA (UI/L)-1).
• Nos sistemas bifásicos compostos de PEG e citrato de sódio, a LDH migrou para a
fase superior, exceto no sistema formado com maior massa molecular e maior concentração
de PEG e menor concentração de sal.
• A massa molecular do polímero foi a variável que apresentou maior influência sobre
o fator de purificação e rendimento da LDH.
• A interação PEG-LDH foi mais significativa com o PEG de menor massa molecular
(400) e em maior concentração.

106
PERSPECTIVAS

107
PERSPECTIVAS
As técnicas desenvolvidas neste trabalho apresentam uma ampla aplicação para o
desenvolvimento de diferentes sistemas biossensores. A partir do imunosensor e sensor
enzimático descritos, várias doenças de impacto social e econômico podem ser
investigadas, como por exemplo, diabetes e comprometimento cardíaco. Entretanto, no caso
da detecção da oxidação do NADH, novos mediadores podem ser investigados e testados
para que haja uma diminuição significativa do potencial de trabalho.
A utilização do APAD+, análogo sintético do NAD+, têm sido utilizado no
diagnóstico de malária devido a lactato desidrogenase do Plasmodium falciparum
apresentar alta atividade na presença de tal cofactor. Entretanto, a atividade da enzima tem
sido avaliada a partir de métodos espectrofotométricos, colorimétricos, cromatografia e
outras técnicas imunológicas tradicionais. Tais técnicas exigem pessoal especializado,
maior tempo de execução e alto custo quando comparados aos biossensores disponíveis no
mercado para detecção de outras doenças. A utilização de eletrodos impressos em suportes
plásticos para construção do biossensor para malária a partir do APAD+, por exemplo,
levaria a diminuição do custo da produção e facilitaria a posterior miniaturização do
sistema.
Os sistemas bifásicos aquosos, utilizados para a separação da lactato desidrogenase
do extrato de coração bovino, constituem um método de pré-purificação, sendo necessária a
utilização de técnicas complementares, como por exemplo, cromatografia, onde a
purificação seja concluída. A enzima purificada poderia ser testada no biossensor
amperométrico desenvolvido, visando sua utilização na continuidade dos estudos para
detecção de lactato desidrogenase, o que diminuiria o custo dos experimentos.

108
REFERÊNCIAS BIBLIOGRÁFICAS

109
REFERÊNCIAS BIBLIOGRÁFICAS
Adányi, N.; Váradi, M.; Kim, N.; Szendrö, I. 2006. Development of new immunosensors
for determination of contaminants in food. Current Applied Physics. 6: 279-286.
Adriano, W.S.; Veredas, V.; Santana, C.C.; Gonçalves, L.R.B. 2005. Adsorption of
amoxicillin on chitosan beads: Kinetics, equilibrium and validation of finite bath models.
Biochemical Engineering Journal. 27: 132-137.
Aizawa, H.; Kurosawa, S.; Tanaka, M.; Yoshimoto, M.; Miyake, J.; Tanaka, H. 2001.
Rapid diagnosis of Treponema pallidum in serum using latex piezoelectric immunoassay.
Analytica Chimica Acta. 437: 167-169.
Antiochia, R.; Lavagnini, I.; Pastore, P.; Magno, F. 2004. A comparison between the use of
a redox mediator in solution and of surface modified electrodes in the electrocatalytic
oxidation of nicotinamide adenine dinucleotide. Bioelectrochemistry. 64: 157-163.
Bakker, E.; Pretsch, E. 2005. Potentiometric sensors for trace-level analysis. Trends in
Analytical Chemistry. 24: 199-207.
Balasubramaniam, D.; Wilkinson, C.; Cott, K.V.; Zhang, C. 2003. Tobacco protein
separation by aqueous two-phase extraction. Journal of Chromatography A. 989:119-129.

110
Bettazzi, F.; Palchetti, I.; Sisalli, S.; Mascini, M. 2006. A disposable electrochemical sensor
for vanillin detection. Analytica Chimica Acta. 555: 134-138.
Blum, L.J.; Coulet, P.R. 1991. Biosensors principles and applications. Marcel Dekker, Inc.
New York, USA. P. 2-3.
Brogan, K.L.; Wolfe, K.N.; Jones, P.A.; Schoenfisch, M.H. 2003. Direct oriented
immobilization of F(ab`) antibody fragments on gold. Analytica Chimica Acta. 496: 73-80.
Carlson, B.W.; Miller, L. 1985. Mechanism of the oxidation of NADH by quinines.
Energetics of one-electron and hydride routes. Journal of the American Chemical Society.
107: 479-485.
Caruso, F.; Rodda, E.; Furlong, N. 1996. Orientational aspects of antibody immobilization
and immunological activity on quartz crystal microbalance electrodes. Journal of Colloid
and Interface Science. 178: 104-115.
Castilho, J.; Gáspar, S.; Leth, S.; Niculescu, M.; Mortari, A.; Bontidean, I.; Soukhared, V.;
Dorneanu, S.A.; Ryabov, A.D.; Csöregi, E. 2004. Biosensors for life quality. Design,
development and applications. Sensors and Actuators B. 102: 179-194.
Chen, J.; Bao, J.; Cai, C.; Lu, T. 2004. Electrocatalytic oxidation of NADH at an ordered
carbon nanotubes modified glassy carbon electrode. Analytica Chimica Acta. 516: 29-34.

111
Cheng, T.-J.; Lin, T.-M.; Wu, T.-H.; Chang, H.-C. 2001. Determination of heparin levels in
blood with activated partial thromboplastin time by a piezoelectric quartz crystal sensor.
Analytica Chimica Acta. 432: 101-111.
Chung, J.W.; Kim S.D.; Bernhardi, R.; Pyun, J.C.2005. Application of SPR biosensor for
medical diagnostics of human hepatitis B virus (hHBV). Sensors and Actuators B. 112:
416-422.
Clarck, L.C.Jr.; Lyons, C. 1962. Electrode systems for continuous monitoring in
cardiovascular surgery. Annals of New York Academy of Sciences. 102: 29-45.
Cunningham, A. 1998. Introduction to Bioanalytical Sensors. John Willey & Sons. New
York, USA. p.418.
D`Orazio, P. 2003. Biosensors in clinical chemistry. Clinica Chimica Acta. 334: 41-69.
Deng, T.; Wang, H.; Li, J.S.; Hu, S.Q.; Shen. G.L. 2004. A novel immunosensor based on
self-assembled chitosan/alginate multilayers for detection of factor B. Sensors and Actuators
B. Chemical. 99: 123-129.
Desai, P.D.; Dave, A.M.; Devi, S. 2006. Alcoholysis of salicornia oil using free and
covalently bound lipase onto chitosan beads. Food Chemistry. 95: 193-199.

112
Diamond, D. 1998.1 Principles of chemical and biological sensors. John Wiley & Sons,
Inc. New YorK, USA. p. 3-166.
Edelman, P.G.; Wang, J. 1992. Biosensors and chemical sensors: optimizing performance
through polymeric materials. ACS Symposium Series. Atlanta, USA. p.2.
Eggins, B. R. 1996. Biosensors, an introduction. John Wiley & Sons. England.
Essaadi, K.; Keita, B.; Nadjo, L.; Contant, R. 1994. Oxidation of NADH by oxometalates.
Journal of Electroanalytical Chemistry. 367: 275-278.
Farruggia, B.; Nerli, B.; Picó, G. 2003. Study of the serum albumin-polyethyleneglycol
interaction to predict the protein partitioning in aqueous two-phase systems. Journal of
chromatography B. 798:25-33.
Fexby, S.; Ihre, H.; Alstine, J.V.; Bülow, L. 2004. N-Terminal tagged lactate
dehydrogenase proteins: evaluation of relative hydrophobicity by hydrophobic interaction
chromatography and aqueous two-phase system partition. Journal of Chromatography B.
807:25-31.
Forrow, N.J.; Saughera, G.S.; Walters, S.J.; Watkin, J.L. 2005. Development of a
commercial amperometric biosensor electrode for the ketone D-3-hydroxybutyrate.
Biosensors & Bioelectronics. 20: 1617-1625.

113
Gao, Q.; Cui, X.; Yang, F.; Ma, Y.; Yang, X. 2003. Preparation of poly(thionine) modified
screen printed carbon electrode and its application to determine NADH in flow injection
analysis system. Biosensors & Bioelectronics. 19: 277-282.
Gao, Z.; Chao, F.; Chao, Z.; Li, G. 2000. Detection of staphylococcal enterotoxin C2
employing a piezoelectric crystal immunosensor. Sensors and Actuators B. 66: 193-196.
Gooding, J.J.; Wasiowych, C.; Barnett, D.; Hibbert, D.B.; Barisci, J.N.; Wallace, G.G.
2004. Electrochemical modulation of antigen-antibody binding. Biosensors &
Bioelectronics. 20: 260-268.
Green, R.J.; Frazier, R.A.; Shakesheff, K.M.; Davies, M.C.; Roberts, C.J.; Tendler, S.J.B.
2000. Surface plasmon resonance analysis of dynamic biological interactions with
biomaterials. Biomaterials. 21: 1823-1835.
Guilbault, G.G.; Luong, J.H.T.; Sochaczewski, E.P. 1989. Immobilization methods for
piezoelectric biosensors. Biotechnology. 7: 349-351.
Hamdine, M.; Heuzey, M.-C.; Bégin,A. 2005. Effect of organic and inorganic acids on
concentrated chitosan solutions and gels. Biological Macromolecules. 37: 134-142.
Han, J.H. and Lee, C.H. 1997. Effects of salts and poly(ethylene glycol)-palmitate on the
partitioning of proteins and Bacillus subtilis neutral protease in aqueous two-phase systems.
Colloids and Surfaces B: Biointerfaces. 9:109-116.

114
Hillier, A.C.; Ward, M.D. 1992. Scanning electrochemical mass sensitivity mapping of the
quartz crystal microbalance in liquid media. Analytical Chemistry. 64: 2539-2554.
Hong, M.-Y.; Chang, J.-Y.; Yoon, H.C.; Kim, H.-S. 2002. Development of a screen printed
amperometric biosensor for the determination of L-lactate dehydrogenase level. Biosensors
& Bioelectronics. 17: 13-18.
Hu, J.; Liu, L.; Danielsson, B.; Zhou, X.; wang, L. 2000. Piezoelectric immunosensor for
detection of complement C6. Analytica Chimica Acta. 423: 215-219.
Hung, T.-C.; Giridhar, R.; Chiou, S-H.; Wu, W.-T. 2003. Binary immobilization of
Candida rugosa lipase on chitosan. Journal of molecular catalysis. 26: 69-78.
Janshoff, A.; Galla, H.-J.; Steinem, C. 2000. Piezoelectric mass-sensing devices as
biosensors – An alternative to optical biosensors? Angewandte Chemie International
Edition. 39: 4004-4032.
Juang R.S.; Wu, F.C.; Tseng, R.L. 2001. Solute adsorption and enzyme immobilization on
chitosan beads prepared from shrimp shell wastes. Bioresource Technology. 80: 187-193.
Kelly, S.; Compagnone, D.; Guilbault. 1998. Amperometric immunosensor for lactate
dehydrogenase LD-1. Biosensors & Bioelectronics. 13: 173-179.
115
Kennedy, J.F. 1985. Handbook of Enzyme Biotechnology. John Wiley & Sons. New York,
USA. p. 147-207.
Kim, G.-H.; Rand, A.G.; Letcher, S.V. 2003. Impedance characterization of a piezoelectric
immunosensor: Part II: Salmonella typhimurium detection using magnetic enhancement.
Biosensors & Bioelectronics. 18: 91-99.
Kitani, A.; So, Y.H.; Miller, L.L. 1981. Electrochemical study of the kinetics of NADH
being oxidized by diimines derived from diaminobenzenes and diaminopyrimidines.
Journal of the American Chemical Society. 103: 7636-7641.
Kleinjung, F.; Bier, F.F.; Warsinke, A.; Scheller, F.W. 1997. Fibre-optic genosensor for
specific determination of fentomolar DNA oligomers. Analytica Chimica Acta. 350: 51-58.
Kopperschläger, G.; Kirchberger, J. 1996. Methods for the separation of lactate
dehydrogenases and clinical significance of the enzyme. Journal of Chromatography B.
684:25-49.
Kröger, S.; Turner, A.P.F. 1997. Solvent-resistant carbon electrodes screen printed onto
plastic for use in biosensors. Analytica Chimica Acta. 347: 9-18.
Lee, W.; Lee, D.-B.; Oh, B.-K.; Lee, W.H.; Choi, J.-W. 2004. Nanoscale fabrication of
protein A on self-assembled monolayer and its application to surface plasmon resonance
immunosensor. Enzyme and Microbial Technology. 35: 678-682.
116
Lee, W.; Oh, B.-K.; Lee, W.H.; Choi, J.-W. 2005. Immobilization of antibody fragment for
immunosensor application based on surface plasmon resonance. Colloids and Surfaces B.
40: 143-148.
Li, Q.; Song, B.; Yang, Z.; Fan, H. 2006. Electrolytic conductivity behaviors and solution
conformations of chitosan in different acid solutions. Carbohydrate Polymers. 63: 272-282.
Liedberg, B.; Nylander, C.; Lundström, I. 1983. Surface plasmon resonance for gas
detection and biosensing. Sensors and Actuators. 4: 299-304
Limbut, W.; Thavarungkul, P.; Kanatharana, P.; Asawatreratanakul, P.; Limsakul, C.;
Wongkittisuksa, B. 2004. Comparative study of controlled pore glass, silica gel and
poraver® for the immobilization of urease to determine urea in a flow injection
conductimetric biosensor system. Biosensors & Bioelectronics. 19: 813-821.
Lin, D.; Wu, Y., Mei, L., Zhu, Z.; Yao, S. 2003. Modeling protein partitioning in aqueous
polymer two-phase systems: influence of polymer concentration and molecular weight.
Chemical Engineering Science. 58:2963-2972.
Liu, Y.; Sun, Y.; Song, D.; Zhang, Q.; Tian, Y.; Zhang, H. 2005. Enhanced optical
immunosensor based on surface plasmon resonance for determination of transferrin.
Talanta. 68: 1026-1031.

117
Luppa, P.B.; Sokoll, L.J.; Chan, D.W. 2001. Immunosensors-principles and applications to
clinical chemistry. Clinica Chimica Acta. 314: 1-26.
Medberry, P.; Dennis, S.; Hecke, T.V.; DeLong, R.K. 2004. pDNA bioparticles:
comparative heterogeneity, surface, binding, and activity analyses. BBRC. 319: 426-432.
Morgan, C.L.; Newman, D.J.; Price, C.P. 1996. Immunosensors: technology and
opportunities in laboratory medicine. Clinical Chemistry. 42: 193-209.
Mulchandani, A. 1998. Enz. Microbiol. Biosensors. Human press. Totowa, New Jersey. p.
3-14.
Mulkiewicz, E.; Zietara, M.S.; Strömberg, J.O.; Skorkowski., E.F. 2001. Lactate
dehydrogenase from the northern krill Meganyctiphanes norvegica: comparison with LDH
from the Antartic krill Euphausia superba. Comparative Biochemistry and Physiology Part
B. 128:233-245.
NaboK, A.V.; Tsargorodskaya, A.; Hassan, A.K.; Starodub, N.F. 2005. Total internal
reflection ellipsometry and SPR detection of low molecular weight environmental toxins.
Applied Surface Science. 246: 381-386.
Nylander, C.; Liedberg, B.; Lind, T. 1982-1983. Gas detection by means of surface
plasmon resonance. Sensors and Actuators. 3: 79-88.

118
Oh, B.-K.; Kim, Y.-K.; Lee, W.; Bae, Y.M.; Lee, W.H.; Choi, J.-W. 2003. Immunosensor
for detection of Legionella pneumophila using surface plasmon resonance. Biosensors &
Bioelectronics. 18: 605-611.
Ohfuji, K.; Sato, N.; Hamada-Sato, N.; Kobayashi, T.; Imada, C.; Okuma, H.; Watanabe, E.
2004. Construction of a glucose sensor based on a screen-printed electrode and a novel
mediator pyocyanin from Pseudomonas aeruginosa. Biosensors & Bioelectronics. 19:
1237-1244.
Park, I.-S.; Kim, W.-Y.; Kim, N. 2000. Operational characteristics of an antibody-
immobilized QCM system detecting Salmonella spp. Biosensors & Bioelectronics. 15: 167-
172.
Pravda, M.; O`Meara, C.; Guilbault, G.G. 2001. Polishing of screen-printed electrodes
improves IgG adsorption. Talanta. 54: 887-892.
Qiu, W.; Parzuchowski, P.; Zhang, W.; Meyerhoff, M.E. 2003. Optical sensor for amine
vapors based on dimer-monomer equilibrium of indium octaethylporphyrin in a polymeric
film. Analytical Chemistry. 75: 332-340.
Riccardi, C.S.; Costa, P.I.; Yamanaka, H. 2002. Imunossensor amperométrico. Química
Nova. 25: 316-320.

119
Rishpon, J.; Rosen, I. 1989. The development of an immunosensor for the electrochemical
determination of the isoenzyme LDH5. Biosensors. 4: 61-74.
Santos-Álvarez, N.; Lobo-Castañón, M.J.; Miranda-Ordieres, A.J.; Tuñón-Blanco, P. 2002.
Amperometric determination of serum lactate dehydrogenase activity using an ADP-
modified graphite electrode. Analytica Chimica Acta. 457: 275-284.
Santos-álvarez, N.; Ortea, P.M.; Pañeda, A.M.; Lobo-Castañón, M.J.; Ordieres, A.J.M.;
Tuñón-Blanco, P. 2001. A comparative study of different adenine derivatives for the
electrocatalytic oxidation of ß-niconinamide adenine dinucleotide. Journal of
Electroanalytical Chemistry. 502: 109-117.
Schmid, A.H.; Stanca, S.E.; Thakur, M.S.; Thampi, K.R.; Suri, C.R. 2005. Site-directed
antibody immobilization on gold substrate for surface plasmon resonance sensors. Sensors
and Actuators B. 113: 297-303.
Shen, G.-Y.; Wang, I.; Deng, T.; Shen, G-.L.; Yu, R.-Q. 2005. A novel piezoelectric
immunosensor for detection of carcinoembryonic antigen. Talanta. 67: 217-220.
Shibusawa, Y.; Eriguchi, Y.; Ito, Y. 1997. Purification of lactic acid dehydrogenase from
bovine heart crude extract by counter-current chromatography. Journal of Chromatography
B. 696:25-31.

120
Shumyantseva, V.; Deluca, G.; Bulko, T.; Carrara, S.; Nicolini, C.; Usanov, S.A.;
Archakov, A. 2004. Cholesterol amperometric biosensor based on cytochrome P450scc.
Biosensors & Bioelectronics. 19: 971-976.
Skládal, P., Riccardi, C.S.; Yamanaka, H.; Costa, P.I. 2004. Piezoelectric biosensors for
real-time monitoring of hybridization and detection of hepatitis C virus. Journal of
Virological Methods. 117: 145-151.
Spelzini, D.; Farruggia, B.; Picó, G. 2005. Features of the acid protease partition in aqueous
two-phase systems of polyethylene glycol-phosphate: chymosin and pepsin. 2005. Journal
of chromatography B. 821:60-66.
Spichiger-Keller, U.E. 1998. Chemical sensors and biosensors for medical and biological
applications. Wiley-VCH. Weinheim, Federal Republic of Germany. p.8.
Starodub, N.F.; Pirogova, L.V.; Demchenko, A.; Nabok, A.V. 2005. Antibody
immobilization on the metal and silicon surfaces. The use of self-assembled layers and
specific receptors. Bioelectrochemistry. 66: 111-115.
Su, X.; Li, S.F.Y. 2001. Serological determination of Helicobacter pylori infection using
sandwiched and enzymatically amplified piezoelectric biosensor. Analytica Chimica Acta.
429: 27-36.

121
Su, X.; Ng, H.T.; Daí, C.-C.; O`shea, S.J.; Li, S.F.Y. 2000. Disposable, low cost, silver-
coated, piezoelectric quartz crystal biosensor and electrode protection. Analyst. 125: 2268-
2273.
Su, X.-L.; Li, Y. 2005. A QCM immunosensor for Samonella detection with simultaneous
measurements of resonant frequency and motional resistence. Biosensors & Bioelectronics.
21: 840-848.
Suleiman, A.A.; Guilbault, G.G. 1994. Recent developments in piezoelectric
immunosensors. Analyst. 119: 2279-2282.
Thompson, M.; Arthur, C.L.; Dhaliwal, G.K. 1986. Liquid-phase piezoelectric and acoustic
transmission studies of interfacial immunochemistry. Analalytical Chemistry. 58: 1206-
1209.
Tlili, A.; Abdelghani, A.; Ameur, S.; Jaffrezic-Renault, N. 2005. Impedance spectroscopy
and affinity measurement of specific antibody-antigen interaction. Materials Science &
Engineering C.
Turner, A.P.F.; Karube, I.; Wilson, G.S. 1989.1 Biosensors: fundamentals and
applications. St. Edmundsbury Press. Suffolk, Great Britain. p. 248-272.

122
Valdés-Ramírez, G.; Álvarez-Romero, G.A.; Galán-Vidal, C.A.; Hernández-Rodríguez,
P.R.; Ramírez-Silva, M.T. 2005. Composites: A novel alternative to construct solid state
Ag/AgCl reference electrodes. Sensors and Actuators B: Chemical. 110: 264-270.
Vaughan, R.D.; O`Sullivan, C.K.; Guilbault, G.G. 2001. Development of a quartz crystal
microbalance (QCM) immunosensor for the detection of Listeria monocytogenes. Enzyme
and Microbial Technology. 29: 635-638.
Vikhoreva, G.; Bannikova, G.; Stolbushkina, P.; Panov, A.; Drozd, N.; Makarov, V.;
Varlamov, V.; Gal’braikh, L. 2005. Preparation and anticoagulant activity of a low-molecular
–weight sulfated chitosan. Carbohydrate Polymers. 62: 327-332.
Voet, D.; Voet, J.G., Pratt, C.W. 2002. Fundamentos de Bioquímica. Artmed, Porto Alegre,
Brasil. p. 357.
Walton, P.W.; Butler, M.E.; O`Flaherty, M.R. 1990. Piezoelectric-based biosensors.
Biochemical Society Transactions. 19: 44-48.
Wang, J. 1999. Amperometric biosensors for clinical and therapeutic drug monitoring: a
review. Pharmaceutical and Biomedical Analysis. 19: 47-53.
Warriner, K.; Higson, S.; Vadgama, P. 1997. A lactate dehydrogenase amperometric
pyruvate electrode exploiting direct detection of NAD+ at a poly(3-

123
methylthiophene):poly(phenol red) modified platinum surface. Materials Science &
Engineering C. 5: 91-99.
Watson, L.; Mayand, P.; Cullen, D.; Sethi, R. 1988. Biosensors. 3: 101-105.
Weiping, Q.; Bin, X.; Danfeng, Y.; Yihua, L.; Lei, W.; Chunxiao, W.; Fang, Y.; Zhuhong,
L.; Yu, W. 1999. Site-directed immobilization of immunoglobulin G on 3-
aminopropyltriethoxysilane modified silicon wafer surfaces. Materials Science &
Engineering C. 9: 475-480.
Wu, H.-L.; Yu, R.-Q. 1983. A PVC membrane pH-sensitive electrode based on
methyldioctadecylamine as neutral carrier. Talanta. 34: 577-579.
Wu, T.-Z.; Su, C.-C.; Chen, L.-K.; Yang, H.H.; Tai, D.-F.; Peng, K.-C. 2005. Piezoelectric
immunochip for the detection of dengue fever in veremia phase. Biosensors &
Bioelectronics. 21: 689-695.
Yang, L., Hsiao, W.W.; Chen, P. 2002. Chitosan-cellulose composite membrane for affinity
purification of biopolymers and immunoadsorption. Journal of Membrane Science. 197: 185-
197.
Yang, L.; Wei, W.; Gao, X.; Xia, J.; Tao, H. 2005. A new antibody immobilization strategy
based on electrodeposition of nanometer-sized hydroxyapatite for label-free capacitive
immunosensor. Talanta. 68: 40-46.

124
Yu, R.-Q.; Zhang, Z.-R.; Shen, G.-L. 2000. Potentiometric sensors: aspects of recent
development. Sensors and Actuators B. 65: 150-153.
Yuan, R.; Wu, H.-L.; Yu, R.-Q. 1993. Membrane pH-sensitive electrodes based on new
nitrogen-containing neutral carriers. Science in China, Serie B. 36: 140-150.
Zhang, S.; Wright, G.; Yang, Y. 2000. Materials and techniques for electrochemical
biosensor design and construction. Biosensors & Bioelectronics. 15: 273-282.
Zhang, X.; Yu, C.; Shi, X.; Zhang, C.; Tang, T.; Dai, K. 2006. Direct chitosan-mediated
gene delivery to the rabbit knee joints in vitro and in vivo. BBRC. 341: 202-208.

125
ANEXOS

126
ANEXOS
Publicações durante o desenvolvimento da tese
Araújo, R.F.F.; Silveira, C.L.C.; Lima Filho, J.L. Suportes para imobilização de anticorpos
com aplicação piezoelétrica. VI Congresso de ensino, pesquisa e extensão da UFPE-CEPE.
30/11 - 01/12/2005, Recife-PE.
Araújo, R.F.F.; Araújo, F.R.B.; Lima Filho, J.L. Pré-purificação de LDH a partir de
extrato de coração bovino utilizando sistema bifásico aquoso. VI Congresso de ensino,
pesquisa e extensão da UFPE-CEPE. 30/11 - 01/12/2005, Recife-PE.
Laranjeira, J.M.G.; Oliveira, M.I.P.; Araújo, R.F.F.; Dutra, R.F.; Fernandes, K.F.; Lima
Filho, J.L.; Carvalho Jr, L.B. Porous Silicon as a Matrix for IgG immobilization. XXXIV
Reunião da Sociedade Brasileira de Bioquímica e Biologia Molecular e XXXIV Reunião da
Sociedade Brasileira de Bioquímica e Biologia Molecular, 2005, Águas de Lindóia-SP.
Araújo, R.F.F.; Silva, P.F.C.E.; Luna, K.P.O.; Souza, R.M.C.; Felberg, D.A.; Dutra, R.A.
F.; Lima Filho, J.L. Lactate dehydrogenase biosensor based in voltammetric silver paste
electrodes. XXXIII Reunião Anual da Sociedade Brasileira de Bioquímica e Biologia
Molecular-SBBq, 2004, Caxambu-MG.

127
Araújo, R.F.F.; Silva, E.P.F.C.; Souza, R.M.C.; Luna, K.P.O.; Felberg, D.A.; Dutra, R.F.;
Lima Filho, J.L. Piezoeletric Biosensor using Chitosan Film for Antibody Imobilization.
The Eighth World Congress on Biosensors, 2004, Granada-Spain

128
Instruções para submissão de trabalhos
Revista: Colloids and Surfaces B
Colloids and Surfaces B: Biointerfaces publishes full length research articles,
reviews, short communications and 'Interface' reviews. Short communications should be
sub-divided according to the guidelines for full manuscripts. Interface reviews provide
established researchers the opportunity to review their own work, highlighting their
contribution to the field of biointerfaces and may only be submitted upon invitation by the
editors.
Manuscript submission
Submission to this journal proceeds entirely on-line. Please use the following
guidelines to prepare your article. Via the "Author Gateway" page of this journal
http://authors.elsevier.com/ you will be guided stepwise through the creation and uploading
of the various files. The system automatically converts source files to a single Adobe
Acrobat PDF version of the article, which is used in the peer-review process. Please note
that even though manuscript source files are converted to PDF at submission for the review
process, these source files are needed for further processing after acceptance. All
correspondence, including notification of the Editor's decision and requests for revision,
takes place by e-mail and via the author's homepage, removing the need for a hard-copy
paper trail.

129
On-line submission is required. Authors can upload their complete article as a single
file, including figures, tables, and references as a LaTeX, Microsoft® (MS) Word®,
WordPerfect®, PostScript or Adobe®Acrobat®PDF document.
During the online submission process, authors are requested to select a handling editor:
Prof. J.L. Brash, McMaster University, Canada.
Dr. Prof. H.J. Busscher, University of Groningen, The Netherlands.
Prof. Dr. R.M. Leblanc, University of Miami, Florida, USA.
Prof. H. Ohshima, Science University Of Tokyo, Japan.
Submission of an article implies that the work described has not been published
previously (except in the form of an abstract or as part of a published lecture or academic
thesis), that it is not under consideration for publication elsewhere, that its publication is
approved by all authors and tacitly or explicitly by the responsible authorities where the
work was carried out, and that, if accepted, it will not be published elsewhere in the same
form, in English or in any other language, without the written consent of the Publisher.
On submission authors are required to suggest four referees for their manuscript.
For more information on the review process, please see the peer review policy statement on
the Journal homepage http://www.elsevier.com/locate/colsub
Should authors be required to revise their manuscript, they are requested to submit
the revised version within a period of 2 months. Unless an extension has been agreed with
the responsible editor, manuscripts not revised within 2 months will be considered
withdrawn.

130
Manuscript
1. Manuscripts should be written in English.
2. The use of nomenclature and symbols adopted by IUPAC is recommended (Quantities,
Units and Symbols in Physical Chemistry, Blackwell Scientific, Oxford, 1988).
3. Manuscripts should be organized in the following order:
a. Title
b. Name of author and affiliation (the corresponding author should be indicated together
with the appropriate fax, telephone and e-mail numbers)
c. Abstract
d. Five keywords for indexing
e. Contents of paper
f. Introduction
g. Text
h. Acknowledgements
i. Appendices
j. References
k. Tables
l. Figure captions
m. Figures
Elsevier reserves the privilege of returning to the author for revision accepted
manuscripts and illustrations which are not in the proper form given in this guide. Upon
acceptance of an article by the journal, the author(s) will be asked to transfer the copyright

131
of the article to the publisher. This transfer will ensure the widest possible dissemination of
information.
Language
At the editor's discretion submitted articles may be rejected without review on the
basis of language. Articles of suitable technical content may be accepted subject to
language correction to be arranged by the author at the author's expense.
Please visit http://authors.elsevier.com/LanguageEditing.html for details of companies that
can provide English language and copyediting services to authors who want to publish in
scientific, technical and medical journals and need assistance before they submit their
article or, before it is accepted for publication.
Abstract
1. The abstract should be no longer than 500 words.
2. The abstract should be a concise and factual description of the contents and conclusions
as well as an indication of any new findings.
Tables
Number tables consecutively in accordance with their appearance in the text. The text
should include references to all tables. Each table should have a brief and self-explanatory
title. Place footnotes to tables below the table body and indicate them with superscript
lowercase letters. Avoid vertical rules. Be sparing in the use of tables and ensure that the
data presented in tables do not duplicate results described elsewhere in the article.
Illustrations
Preparation of electronic illustrations

132
General points:
Make sure you use uniform lettering and sizing of your original artwork.
Save text in illustrations as "graphics" or enclose the font.
Only use the following fonts in your illustrations: Arial, Courier, Helvetica, Times,
Symbol.
Number the illustrations according to their sequence in the text.
Use a logical naming convention for your artwork files.
Provide all illustrations as separate files and as hardcopy printouts on separate sheets.
Provide captions to illustrations separately.
Produce images near to the desired size of the printed version.
A detailed guide on electronic artwork is available on our website:
http://authors.elsevier.com/artwork
You are urged to visit this site; some excerpts from the detailed information are given here.
Formats
Regardless of the application used, when your electronic artwork is finalised, please
"save as" or convert the images to one of the following formats (Note the resolution
requirements for line drawings, halftones, and line/halftone combinations given below.):
EPS: Vector drawings. Embed the font or save the text as "graphics".
TIFF: Colour or greyscale photographs (halftones): always use a minimum of 300 dpi.
TIFF: Bitmapped line drawings: use a minimum of 1000 dpi.
TIFF: Combinations bitmapped line/half-tone (colour or greyscale): a minimum of 500 dpi

133
is required. DOC, XLS or PPT: If your electronic artwork is created in any of these
Microsoft Office applications please supply "as is".
Please do not:
Supply embedded graphics in your wordprocessor (spreadsheet, presentation)
document;
Supply files that are optimised for screen use (like GIF, BMP, PICT, WPG); the
resolution is too low;
Supply files that are too low in resolution;
Submit graphics that are disproportionately large for the content
Colour illustrations
Please make sure that artwork files are in an acceptable format (TIFF, EPS or MS
Office files) and with the correct resolution. If, together with your accepted article, you
submit usable colour figures then Elsevier will ensure, at no additional charge, that these
figures will appear in colour on the Web (e.g., ScienceDirect and other sites) regardless of
whether or not these illustrations are reproduced in colour in the printed version. For colour
reproduction in print, you will receive information regarding the costs from Elsevier after
receipt of your accepted article. Please indicate your preference for colour in print or on the
Web only.
Please note: Because of technical complications which can arise by converting
colour figures to "grey scale" (for the printed version should you not opt for colour in print)
please submit in addition usable black and white versions of all the colour illustrations.
134
References
1. All references made to publications in the text should be presented in a list of references
following the text of the manuscript. The manuscript should be carefully checked to ensure
that the information given in the text is exactly the same as that given in the reference list.
References to the literature should be made according to the numerical system described
below.
2. In the text refer to the subject or to the author's name (without initial), followed by the
reference number in square brackets.
3. If reference is made in the text to publications written by more than two authors, the
name of the first author should be used, followed by "et al.". Note that in the reference list
the names of authors and co-authors should be given in full.
4. References should be arranged in the order in which they appear in the text.
5. Use the following system for arranging the references:
(i) For journals
N. Levy, N. Garti and S. Margdassi, Colloids Surfaces A: Physicochem. Eng. Aspects, 97
(1995) 91.
(ii) For monographs
B.E. Conway, Ionic Hydration in Chemistry and Biophysics, Elsevier, Amsterdam, 1981.
(iii) For edited books
R.D. Thomas, in E. Buncel and J.R. Jones (Eds.), Isotopes in the Physical and Biomedical
Sciences, Vol. 2, Elsevier, Amsterdam, 1991, Chapter 7.
For conference proceedings, symposia etc.

135
A.G. Marshall, in P.G. Kistemaker and N.M.M. Nibbering (Eds.), Advances in Mass
Spectrometry, Proc. 12th International Mass Spectrometry Conference, Amsterdam, 26-30
August 1991, Elsevier, Amsterdam, 1992, p. 37.
6. Abbreviations of journal titles should conform to those adopted by the Chemical
Abstract Service (Bibliographic Guide for Editors and Authors, The American Chemical
Society, Washington, DC, 1974). If the correct abbreviation is not known, the title should
be given in full.
7. Reference to a personal communication should be followed by the year, e.g. A.N. Other,
personal communication, 1989.
Use of the Digital Object Identifier (DOI)
The digital object identifier (DOI) may be used to cite and link to electronic
documents. The DOI consists of a unique alpha-numeric character string which is assigned
to a document by the publisher upon the initial electronic publication. The assigned DOI
never changes. Therefore, it is an ideal medium for citing a document, particularly 'Articles
in press' because they have not yet received their full bibliographic information. The correct
format for citing a DOI is shown as follows (example taken from a document in the journal
Physics Letters B):
doi:10.1016/j.physletb.2003.10.071
Formulae
Present simple formulae in the line of normal text where possible. In principle,
variables are to be presented in italics. Use the solidus (/) instead of a horizontal line,
e.g., Xp/Ym
136
Powers of e are often more conveniently denoted by exp.
Number consecutively any equations that have to be displayed separate from the text (if
referred to explicitly in the text).
Footnotes
Footnotes should be used sparingly. Number them consecutively throughout the
article, using superscript Arabic numbers. Many wordprocessors build footnotes into the
text, and this feature may be used. Should this not be the case, indicate the position of
footnotes in the text and present the footnotes themselves on a separate sheet at the end of
the article. Do not include footnotes in the Reference list.
Supplementary data
Elsevier accepts supplementary material to support and enhance your scientific
research. Supplementary files offer the author additional possibilities to publish supporting
applications, movies, animation sequences, high-resolution images, background datasets,
sound clips and more. Supplementary files supplied will be published online alongside the
electronic version of your article in Elsevier Web products, including ScienceDirect:
http://www.sciencedirect.com . In order to ensure that your submitted material is directly
usable, please ensure that data is provided in one of our recommended file formats. Authors
should submit the material in electronic format together with the article and supply a
concise and descriptive caption for each file. For more detailed instructions please visit our
artwork instruction pages at the Author Gateway at http://authors.elsevier.com/artwork.
137
Revista: Sensors and Actuators B
Sensors & Actuators, B: Chemical is an interdisciplinary journal dedicated to covering
research and development in the field of chemical sensors, actuators, micro- and
nanosystems.
The scope of the journal encompasses, but is not restricted to, the following areas:
Sensing principles and mechanisms
New materials development (transducers and sensitive/recognition components)
Fabrication technology including nanotechnology
Actuators
Optical devices
Electrochemical devices
Mass-sensitive devices
Gas sensors
Biosensors
Bio-MEMS
Analytical microsystems
Environmental
Process control
Biomedical applications

138
Signal processing
Sensor and sensor-array chemometrics
TAS - Micro Total Analysis Systems Microsystems for the generation, handling and
analysis of (bio)chemical information. The special section of Sensors & Actuators, B:
Chemical on TAS is dedicated to contributions concerning miniaturised systems for (bio)
chemical synthesis and analysis, also comprising work on Bio-MEMS, Lab-on-a-chip,
biochips and microfluidics.
Topics covered by the TAS section include:
Lab-on-a-chip
Physics and chemistry of microfluidics
Microfabrication technology for TAS
Analytical chemical aspects
Detectors, sensors, arrays for TAS
TAS applications
DNA analysis
Microinstrumentation
Microsystems for combinatorial chemistry
Types of contribution
The journal publishes research papers, letters to the Editors and occasionally review
articles. Short reports on current research can be submitted as a letter to the Editors. These
should not exceed 2000 words or 4 printed pages. All papers will be reviewed by at least

139
two independent referees. For all contributions the acceptance criteria are quality,
originality, and scientific and technological relevance to the field. An adequate referencing
to the state-of-the-art is essential. All contributions must be written in English.
Submission of Contributions
Online Submission of Papers
Authors are encouraged to submit their manuscript online to one of the editors by
using the online submission tool for Sensors and Actuators B: Chemical at
http://www.elsevier.com/locate/snb. To submit online, authors are required to go to this
website and upload their article (compuscript with figures in line) and separately its
associated artwork, an electronic (PDF) proof is generated and the reviewing process is
carried out using that PDF. Authors and editors send and receive all correspondence by
email via the website and no paper correspondence is performed. Full instructions on how
to use the online submission tool and how to prepare your manuscript for online submission
are available at: http://www.elsevier.com/locate/snb.
Submission of Papers By Mail
Authors should submit three copies of their manuscripts, one complete set of
original illustrations and two copies to the Editors. For the final version, in addition to the
original and two copies, authors should submit an electronic version of their manuscript on
disk.
Papers should be sent to the Editor-in-Chief or the appropriate Regional Editor.
Editor-in-Chief:

140
Professor Milena Koudelka-Hep
Institute of Microtechnology
University of Neuchatel
Rue Jaquet-Droz 1
CH-2007 Neuchatel
Switzerland
Tel: +41 32 7205 305
Fax: +41 32 7205 711
E-mail: [email protected]
Regional Editor for North America:
Professor Marc Madou
Mechanical and Aerospace Engineering
University of California
Herny Samueli School of Engineering
Irvine
CA 92697-3975
USA
Tel: +1-949-824-6585
Fax: +1-949-824-8585
E-mail: [email protected]
141
Regional Editor for Asia:
Professor M. Egashira
Department of Materials Science and Engineering
Faculty of Engineering
Nagasaki University
1-14 Bunkyo-machi, Nagasaki 852-8521, Japan
Tel: +81-95-819-2642
Fax: +81-95-819-2643
E-mail: [email protected]
Papers for the TAS Section
Send to Associate Editor uTAS Section:
Professor Shuichi Shoji
Department of Electrical Engineering and Bioscience
Major in Nano-science & Nano-engineering
Building 61 Room 411
Waseda University
3-4-1, Okubo
Shinjuku-ku
169-8555 Tokyo
Japan

142
Contributions are accepted on the understanding that authors have obtained the
necessary authority for publication. Submission of an article is understood to imply that the
article is original and unpublished and is not being considered for publication elsewhere.
Upon acceptance of an article by the journal, the author(s) will be asked to transfer the
copyright of the article to the publisher. This transfer will ensure the widest possible
dissemination of information. Authors are reminded that delays in publication may occur if
the instructions for submission and disk and manuscript preparation are not strictly
followed. Authors are strongly recommended to submit disks to aid rapid processing. To
facilitate communication, authors are requested to provide their current e-mail address,
telephone and fax number.
Manuscript Preparation
General
All papers should be concisely written. Papers should be written in English
(American or British spelling but with use of only one form in the same paper). The author
should remember that the journal is international and read widely by those whose first
language may be other than that in which the paper is written. Clarity and precision are best
achieved by the use of short words and simple sentences. Papers which do not satisfy the
English language requirements will not be accepted.
Authors in Japan kindly note that, upon request, Elsevier Japan will provide a list of
people who can check and improve the English of an article before submission. For further
information please contact our Tokyo office: Elsevier Japan K.K., 1-9-15 Higashi Azabu,
143
Minato-ku, Tokyo 106-0044, Japan; tel.: +81-3-5561-5032; fax: +81-3-5561-5045; e-mail:
When submitting their paper authors are requested to provide names and addresses
of three competent referees, although the choice of referees used will be made by the editor.
Formats
The typescript should be in double-spaced typing on pages of uniform size with a
wide margin on the left. This applies also to tables, legends for illustrations, references and
footnotes. The margin and double spacing greatly facilitate editorial processing. Each table
should be typed on a separate page, and the legends to illustrations should be typed in
sequence on a separate page, widely spaced. Typescripts should be preceded by a page
bearing the name and address of the person to whom proofs are to be sent and indicating
the number of pages in the typescript.
Some flexibility of presentation will be allowed, but authors are urged to arrange the
subject matter clearly and logically under such headings as Introduction, Experimental,
Results, Discussion, etc.
Title
Papers should be headed by a concise but informative title. This should be followed
by the names of the authors and by the name and address of the laboratory in which the
work was performed. If the address of the author at the time when the paper will appear
will be other than that where the work was carried out, this may be stated in a footnote.
Acknowledgements for financial support should not be made by a footnote to the title or
name of the author but should be included in Acknowledgements at the end of the paper.

144
Abstract
All papers should have an Abstract on a separate sheet. The abstract (preferably 50-
200 words) should comprise a brief and factual account of the contents and conclusions of
the paper as well as an indication of any new information presented and its relevance.
Complete sentences should be used, without unfamiliar abbreviations or jargon. The use of
the present tense is customary.
Keywords
Authors are requested to provide 4 to 6 keywords. These should follow the Abstract.
Introduction
All papers should have a short Introduction. This should state the reasons for the
work, with brief reference to previous work on the subject.
References
The references should be numbered consecutively throughout the text and should be
collected together in a reference list (headed References) at the end of the paper. The list of
references should be given on a separate sheet of the manuscript. Footnotes and legends
should not include bibliographic material, and reference lists should not include material
that could more appropriately appear as a footnote. When appropriate, authors may refer to
material available on the World Wide Web by citing the corresponding URL. Authors
should ensure that every reference appearing in the text is in the list of references and vice
versa. Numerals for references are enclosed in square brackets in the text, e.g., [1];
numerals referring to equations are enclosed in parentheses.

145
The abbreviated titles of periodicals should conform to standard abbreviations such
as those given in the INSPEC. Science Abstracts Lists of Journals, regularly appearing in
Electrical and Electronics Abstracts
In the reference list, periodicals [1], books [2], multi-author books [3] and
conference proceedings [4] should be cited in accordance with the following examples. [1]
C. di Natale, F.A.M. Davide, A. D'Amico,W. Göpel, U.Weimar, Sensor array calibration
with enhanced neural networks, Sens. Actuators, B, Chem 18-19 (1994) 654-657.
[2] A. Nadai, Theory of Flow and Fracture of Solids, vol. 1, 2nd ed., McGraw-Hill, New
York, 1950, p. 350. [3] B. Danielsson and K. Mosbach, in: K. Mosbach (Ed.), Methods in
Enzymology, vol. 137, Academic Press, New York, 1988, pp. 181-197 (Chapter 16). [4]
K.E. Petersen, Silicon sensor technologies, Tech. Digest, IEEE Int. Electron Devices Meet.,
Washington, DC, USA, Dec. 2-7, 1985. A reference to "to be published in [title of
periodical]" or "in press" implies that the paper has already been accepted for publication.
A name appearing in the text which refers to a person as originator of an unpublished idea
is listed in the References as a "personal communication". In the text an author's name is
given without initials except where it is wished to avoid confusion with namesakes. When
reference is made to a publication written by more than two authors it is preferable to give
only the first author's name in the text followed by et al or the name of one of the authors
followed by 'and coworkers'. In the list of references the names and initials of all authors
must be given. This journal should be cited as Sensors and Actuators B, Chemical.
Tables
Careful thought should be given to the layout of tables (and figures) so that the
significance of the results may be quickly grasped by the busy reader. It should also be
146
remembered that the length of a printed page is always greater than its width. Tables with
only two or three headings are best printed horizontally.
Tables are to be numbered serially with arabic numerals, and should have headings
which make their general meaning understandable without reference to the text. The units
in which results are expressed should be given in parentheses at the top of each column and
should not be repeated on each line of the table. Footnotes should be indicated by the use of
lower case letters (a, b, c, etc.) as superscripts without parentheses.
Illustrations
Original line drawings and cyclic or aromatic chemical formulae should be in a
form suitable for direct reproduction, prepared with a good contrast (i.e. black on a white
background). Photographs and electronmicrographs should be black and white glossy prints
and as rich in contrast as possible. Where magnifications are concerned, it is preferable to
indicate the scale by means of a ruled line on the photograph. There is no need to specify
reductions for figures; however, figures will generally be reduced in size before printing
and authors are urged to ensure that any lettering is sufficiently large (minimum height 3-5
mm) to remain legible. Care should be taken when submitting computer graphics to ensure
that labelling is of sufficient size and quality. All illustrations should preferably require the
same degree of reduction and be submitted on paper of the same size, or smaller than the
main text to prevent damage in transit. Legends to illustrations should be typed in sequence
on a separate page or pages and be understandable without reference to the text. All
illustrations should be clearly referred to in the text using arabic numerals.
147
Colour Illustrations
Colour in print - please submit colour illustrations as original photographs, high-
quality computer prints, transparencies or high resolution electronic files close to the size
expected in publication, or as 35mm slides. Polaroid colour prints are not suitable. For
colour reproduction in print, you will receive information regarding the costs from Elsevier
after receipt of your accepted article. For further information on the preparation of
electronic artwork, please see http://authors.elsevier.com/artwork
Free colour on the web - if, together with your accepted article, you submit usable
colour figures then Elsevier will ensure, at no additional charge, that these figures will
appear in colour on the web (e.g., ScienceDirect and other sites) regardless of whether or
not these illustrations are reproduced in colour in the printed version. Please note that if you
do not opt for colour in print, you should submit relevant figures in both colour (for the
web) and black and white (for print).
Supplementary data
Sensors and Actuators B: Chemical now accepts electronic supplementary material
to support and enhance your scientific research. Supplementary files offer the author
additional possibilities to publish supporting applications, movies, animation sequences,
high-resolution images, background datasets, sound clips and more. Supplementary files
supplied will, subject to peer review, be published online alongside the electronic version
of your article in Elsevier web products, including ScienceDirect: www.sciencedirect.com.
The presence of these files will be signified by a footnote to the article title, and by a
description included in a 'Supplementary Data' section at the end of the paper. In order to
ensure that your submitted material is directly usable, please ensure that data is provided in

148
one of our recommended file formats and supply a concise and descriptive caption for each
file. Please also clearly indicate whether data files are either i) for publication online or ii)
only to be used as an aid for the refereeing of the paper. For more detailed instructions
please visit our Author Gateway at http://authors.elsevier.com.
Biography
A short biography of the author(s) should follow the References. It should cover
such information as the author(s) degree(s), where and in what year they were obtained,
present employment, and current fields of interest. Photographs are optional.
Submission of electronic text
Preparation of manuscripts on disk
Articles prepared using any of the more popular word-processing packages are
acceptable but please note the following points:
Submissions should be made on a double-density or high-density 3.5" disk.
The disk format, word-processor format, file name(s) and the title and authors of the
article should be indicated on the disk.
The disk should always be accompanied by a hard-copy version of the article, and the
content of the two should be identical.
The disk text must be the same as that of the final refereed, revised manuscript.
Disks formatted for either IBM PC compatibles or Apple Macintosh are preferred. If
you can provide either of these, our preference is for the former.

149
The article should be saved in the native format of the word processor used, e.g.
WordPerfect, Microsoft Word, etc.
Although most popular word processor file formats are acceptable, we cannot guarantee
the usability of all formats. If the disk you send us proves to be unusable, we will
publish your article from the hard copy.
Please do not send ASCII files as relevant data may be lost.
There is no need to spend time formatting your article so that the printout is visually
attractive (e.g. by making headings bold), as most formatting instructions will be
removed upon processing.
Leave a blank line between each paragraph and between each entry in the list of
bibliographic references.
Tables should preferably be placed in the same electronic file as the text.
Graphics. We are processing graphic files in a growing number of cases. Both scanned
and computer-generated illustrations, either in colour or black and white are
acceptable. Graphics in electronic format must be TIFF (Tagged Image File Format)
or JPEG; charts and graphs (line art) should be 1000 dpi, photographs 300 dpi,
minimum. For more information please see http://authors.elsevier.com.
Symbols, formulae and equations
Symbols, formulae and equations should be written with great care, capitals and
lower case letters being distinguished where necessary. Also a clear distinction in
typewritten text should be made between the figure 1 (one) and the lower case l (ell), the

150
letters "o" and zero, "k" and kappa, "u" and mu, "v" and nu, and "n" and eta. Particular care
should be taken in writing mathematical expressions containing superscripts and subscripts.
Greek letters and unusual symbols employed for the first time should be defined by name in
the left-hand margin. The solidus / may be used in equations to economize vertical space
but its use should be consistent.
For example:
A/b = x2 / (u + v) 1/2
It is recommended that natural logarithms should be denoted by ln while decade logarithms
should be denoted by lg.
Exponentials are better written as exp(a) than ea. The multiplication sign should be used in
floating point numbers to
avoid confusion, i.e., 4.25 x 10⁵, not 4.25.105. The decimal point should always be denoted
by a full stop.
Abstracting Services
This journal is cited by the following Abstracting Services: Analytical Abstracts,
Cambridge Scientific Abstracts, Chemical Abstracts, Compendex, Computer and Control
Abstracts, Current Contents, EIC/Intelligence, Electrical and Electronic Abstracts,
Engineered Materials Abstracts, FIZ Karlsruhe, Metals Abstracts, PASCAL/CNRS,
Physics Abstracts, Science Citation Index, The Engineering Index Annual, The Engineering
Index Monthly.

151
Spellings used for some common words
Aging
Antireflection
Artifact
bandbending
bandgap
bandwidth
co-evaporate
cross section
cross-sectional
crosstalk
feedback (adj.)
flat-band (adj.)
Gaussian
Kirchhoff
Lifetime
Linewidth
Microelectronics
micromechanics
midpoint
multilayer
multi-target
152
non-crystalline
n-type (adj.)
open-circuit (adj.)
photoemission
photogenerate
photoresist
p-type (adj.)
printout
readout
reverse-bias (adj.)
rod-like (adj.)
semicontinuous
short-circuit (adj.)
single-crystal (adj.)
stepwise
submicron
thermoelectric
ultrahigh
waveband
waveform
wavelength
wavenumber

153
Proofs and Articles in Press
Proofs will be despatched via e-mail to the corresponding author, by the Publisher
and should be returned with corrections as quickly as possible, normally within 48 hours of
receipt. Proofreading is solely the author's responsibility. Authors should ensure that
corrections are returned in one communication and are complete, as subsequent corrections
will not be possible. Any amendments will be incorporated and the final article will then be
published online as an Article in Press on ScienceDirect www.sciencedirect.com. For more
information on proofreading please visit our proofreading page on
http://authors.elsevier.com/
Articles in Press take full advantage of the enhanced ScienceDirect functionality, including
the ability to be cited. This is possible due the innovative use of the DOI article identifier,
which enables the citation of a paper before volume, issue and page numbers are allocated.
The Article in Press will be removed once the paper has been assigned to an issue and the
issue has been compiled.
Reprints
A total of 25 reprints of each paper will be supplied free of charge to the author(s).
Additional reprints can be ordered at prices shown on the reprint order form which will
accompany the proofs.
Copyright
Upon acceptance of an article, Authors will be asked to transfer copyright (for more
information on copyright see http://authors.elsevier.com). This transfer will ensure the

154
widest possible dissemination of information. A letter will be sent to the corresponding
Author confirming receipt of the manuscript. A form facilitating transfer of copyright will
be provided.
If excerpts from other copyrighted works are included, the Author(s) must obtain written
permission from the copyright owners and credit the source(s) in the article. Elsevier has
preprinted forms for use by Authors in these cases: contact Elsevier's Rights Department,
Oxford, UK: phone (+44) 1865 843830, fax (+44) 1865 853333, e-mail
[email protected]. Requests may also be completed on-line via the Elsevier
homepage (http://www.elsevier.com/locate/permissions).
Author enquiries
For enquiries relating to the submission of articles (including electronic submission)
please visit Elsevier's Author Gateway at http://authors.elsevier.com. The Author Gateway
also provides the facility to track accepted articles and set up e-mail alerts to inform you of
when an article's status has changed, as well as detailed artwork guidelines, copyright
information, frequently asked questions and more. Contact details for questions arising
after acceptance of an article, especially those relating to proofs, are provided after
registration of an article for publication. Additional information on the journal, including a
detailed Guide for Authors may be found on the Elsevier web site
http://www.elsevier.com/locate/snb. For specific enquiries on the preparation of electronic
artwork, Author Frequently Asked questions and any other enquiries relating to Elsevier,
please consult the Author Gateway at http://authors.elsevier.com.

155
Revista: Process Biochemistry
Process Biochemistry is an application-orientated research journal devoted to reporting
advances with originality and novelty, in the science and technology of the processes
involving bioactive molecules or elements, and living organisms ("Cell factory" concept).
These processes concern the production of useful metabolites or materials, or the removal
of toxic compounds. Within the segment "from the raw material(s) to the product(s)", it
integrates tools and methods of current biology and engineering. Its main areas of interest
are the food, drink, healthcare, energy and environmental industries and their underlying
biological and engineering principles. Main topics covered include, with most of possible
aspects and domains of application:
• fermentation
• biochemical and bioreactor engineering
• biotechnology processes and their life science aspects
• biocatalysis, enzyme engineering and biotransformation
• downstream processing
• modeling, optimization and control techniques
Particular aspects related to the processes, raw materials and products, also include:
• uantitative microbial physiology, stress response, signal transduction
• Genetic engineering and metabolic engineering
• Proteomics, functional genomics, metabolomics, and bioinformatics

156
• Chiral compounds production, cell free protein system, high-throughput screening,
in-vivo/in-vitro evolution, enzyme immobilization, enzyme reaction in non-aqueous
media
• Mass transfer, mixing, scale-up and scale-down, bioprocess monitoring, bio-
manufacturing
• Cell, tissue and antibody engineering: animal and plant cells/tissues, algae, micro-
algae, extremophile, antibody screening and production
• Environmental biotechnology: biodegradation, bioremediation, wastewater
treatment, biosorption and bioaccumulation
• Bio-commodity engineering: biomass, bio-refinery, bio-energy
• Bioseparation, purification, protein refolding
• Other new bioprocess and bioreactor related topics especially on application to
healthcare sectors.
Submission of manuscripts
Authors are requested to submit their manuscripts electronically, by using the EES
online submission tool at http://ees.elsevier.com/prbi/. After registration, authors will be
asked to upload their article, an extra copy of the abstract, and associated artwork. The
submission tool will generate a PDF file to be used for the reviewing process. The
submission tool generates an automatic reply and a manuscript number will be generated
for future correspondence.
A cover letter should be submitted on line by authors together with the manuscript,
which includes the following points: 1) all authors agree to submit the work to PRBI, 2) the

157
work has not been published/submitted or being submitted to another journal, 3) the
novelty and significant contribution of the submitted work are briefly described, 4) the
transfer of copyright from the author to the publisher.
In their on-line submission, authors are required to suggest at least two independent
referees (up to five, outside their own institution) with their email addresses. But, the
selection of the referees is up to the Editors. All submissions will be reviewed by two
referees.
Format and type of manuscripts
Process Biochemistry accepts three types of manuscripts: Full length articles, Short
communications and Reviews. The text must be as concise as possible. All manuscripts
must follow the following presentation style: Title page with indication of the
corresponding author and the contacting fax and email, Abstract and six key words,
Introduction, Materials and methods, Results, Discussion, Acknowledgement, References, a
separate page of figure legends, and finally tables and figures with a separate page for each
one. The Results & Discussion sections may be combined together, but anyway it is very
important and necessary to make thorough discussion about the submitted work including
novelty and impact. Articles without sufficient discussion will be systematically rejected. It
is also highly recommended that the legends to be as complete and concise as possible: one
figure or one table should be perfectly understandable with its own legend. Incomplete
legends could not be accepted.
158
Full length articles (FLA) should not generally exceed 25 double-spaced pages of
text (not including the references) and should not contain more than 15 figures and/or
tables.
Reviews (REV) should not generally exceed 20 double-spaced pages of text (not
including the references) and should not contain more than 10 figures and/or tables.
Short communications (SCO) will not exceed 10 double-spaced pages of text (not
including the references) and no more than 5 figures and/or tables. Accelerated publications
can sometimes be taken into consideration. The authors should then clearly motivate the
reasons of the accelerated way in the cover letter.
Each paper should be provided with an abstract of 100-150 words reporting
concisely on the purposes and results of the paper, and also six keywords.The title of the
paper should unambiguously reflect its contents. Where the title exceeds 70 characters a
suggestion for an abbreviated running title should be given.
The SI system should be used for all scientific and laboratory data: if, in certain
instances, it is necessary to quote other units, these should be added in parentheses.
Temperatures should be given in degrees Celsius. The unit 'billion' (109 in America, 1012 in
Europe) is ambiguous and should not be used.
Abbreviations for units should follow the suggestions of the British Standards
publication BS 1991. The full stop should not be included in abbreviations, e.g. m (not m.),
ppm (not p.p.m.), % and / should be used in preference to 'per cent' and 'per'. Where

159
abbreviations are likely to cause ambiguity or may not be readily understood by an
international readership, units should be put in full.
Footnotes should be avoided especially if they contain information which could
equally well be included in the text. The use of proprietary names should be avoided.
Papers essentially of an advertising nature will not be accepted.
Colour illustrations in the print version are reproduced at the author's expense. The
publisher will provide the author with a cost estimate upon receipt of the accepted paper.
Colour illustrations in the online version are always at no cost to the authors.
References
References should be cited at the appropriate point in the text by a number in square
brackets. A list of references, in numerical order, should appear at the end of the paper. All
references in this list should be indicated at some point in the text and vice versa.
Unpublished data or private communications should not appear in the list. Examples of
layout of references are given below.
1. Treshow, M., Environment and Plant Response. McGraw-Hill, New York, 1970.
2. Chang, C.W., Fluorides. In Responses of Plants to Air Pollution, ed. J.B. Mudd and T.T.
Kozlowski. Academic Press, New York, 1975, pp. 57-95.
3. MacLean, D.C. and Schneider, R.E., Effects of gaseous hydrogen fluoride on the yield of
field-grown wheat. Environmental Pollution (Series A), 1981, 24 39-44.
160
4. Mandl, R.H., Weinstein, L.H., Weiskopf, G.J. and Major, J.I., The separation and
collection of gaseous and particulate fluorides. In Proceedings of the 2nd International
Clean Air Congress, ed. H.M. Englund and W.T. Berry. Academic Press, New York, 1971,
pp. 450-458.
5. Chang, C.W., Effect of fluoride pollution on plants and cattle. PhD thesis, Banaras Hindu
University, Varanasi, India, 1975.
Proofreading
One set of proofs, as an e-mail PDF, will be sent to the corresponding author as
given on the title page of the manuscript. Only typesetter's errors may be corrected; no
changes in, or additions to, the edited manuscript will be allowed. Elsevier will do
everything possible to get your article corrected and published as quickly and accurately as
possible. Therefore, it is important to ensure that all of your corrections are sent back to us
in one communication. Subsequent corrections are not possible, so please ensure your first
sending is complete.
Offprints
Twenty-five offprints of each paper will be provided free of charge. Additional
copies may be ordered at the prices shown on the price list which will be sent by the
publisher to the author together with the offprint order form upon receipt of the accepted
manuscript.

161
Online manuscript tracking
Authors can keep a track on the progress of their accepted article, and set up e-mail
alerts informing them of changes to their manuscript's status, by using the "Track a Paper"
feature of Elsevier's Author Gateway, http://authors.elsevier.com.
162
Confirmação da submissão dos trabalhos
De: Colloids and Surfaces B [mailto:[email protected]]
Enviada em: terça-feira, 28 de fevereiro de 2006 03:03
Para: [email protected]
Assunto: A manuscript number has been assigned: COLSUB-D-06-00048
Ms. Ref. No.: COLSUB-D-06-00048
Title: Chitosan polymer as support to IgG immobilization for piezoelectric
applications
Colloids and Surfaces B: Biointerfaces
Dear Zi Luiz,
Your submission entitled "Chitosan polymer as support to IgG immobilization
for piezoelectric applications" has been been assigned the following
manuscript number: COLSUB-D-06-00048.
You may check on the progress of your paper by logging on to the Elsevier
Editorial System as an author. The URL is http://ees.elsevier.com/colsub/.
Thank you for submitting your work to this journal.
Kind regards,
H. Ohshima
Editor
Colloids and Surfaces B: Biointerfaces
163
De: [email protected] [mailto:[email protected]]
Enviada em: quarta-feira, 1 de março de 2006 10:18
Para: [email protected]
Assunto: Submission Confirmation
Dear Zi Luiz,
Your submission entitled "Development of Lactate dehydrogenase biosensor
based on epoxy silver and TCNQ modified electrode" has been received by
Sensors & Actuators: B. Chemical
You may check on the progress of your paper by logging on to the Elsevier
Editorial System as an author. The URL is http://ees.elsevier.com/snb/.
Your manuscript will be given a reference number once an Editor has been
assigned.
Thank you for submitting your work to this journal.
Kind regards,
Elsevier Editorial System
Sensors & Actuators: B. Chemical

164
De: Process Biochemistry [mailto:[email protected]]
Enviada em: quarta-feira, 1 de março de 2006 11:13
Para: [email protected]
Assunto: Submission Confirmation
Dear Zi Luiz,
Your submission entitled "Partitioning of LDH from bovine heart crude
extract by PEG-citrate ATPSs" has been received by Process Biochemistry
You may check on the progress of your paper by logging on to the Elsevier
Editorial System as an author. The URL is http://ees.elsevier.com/prbi/.
Your manuscript will be given a reference number once an Editor has been
assigned.
Thank you for submitting your work to this journal.
Kind regards,
Elsevier Editorial System
Process Biochemistry


![RADAR INTERFEROMETRY: 2D PHASE UNWRAPPING VIA GRAPH … › ~gvaladao › pdfs › ValadaoMSc.pdf · ]− π,π]2, i.e., the acquisition system wraps the phase around that interval](https://img.document.onl/doc/110x75/5f04b5dc7e708231d40f5211/radar-interferometry-2d-phase-unwrapping-via-graph-a-gvaladao-a-pdfs-a-.jpg)