Embed Size (px)
Citation preview

Universidade Federal do Rio de Janeiro – UFRJ
Centro de Ciências da Saúde
Faculdade de Odontologia
AVALIAÇÃO DAS VIAS AÉREAS EM PACIENTES SUBMETIDOS À
CIRURGIA DE AVANÇO MANDIBULAR
Lígia Vieira Claudino
CD, MO
Tese submetida ao corpo docente da Faculdade de
Odontologia da Universidade Federal do Rio de Janeiro -
UFRJ, como parte dos requisitos, para a obtenção do Título
de Doutor em Odontologia (Ortodontia).
Rio de Janeiro
2017

AVALIAÇÃO DAS VIAS AÉREAS EM PACIENTES SUBMETIDOS À CIRURGIA
DE AVANÇO MANDIBULAR
LÍGIA VIEIRA CLAUDINO, CD, MO
Orientadores: Prof. Dr. EDUARDO FRANZOTI SANT’ ANNA
Prof. Dra. CLÁUDIA TRINDADE MATTOS
Tese submetida ao corpo docente da Faculdade de
Odontologia da Universidade Federal do Rio de Janeiro -
UFRJ, como parte dos requisitos, para obtenção do Título de
Doutor em Odontologia (Ortodontia).
Comissão Examinadora
______________________________ _____________________________ Prof. Dr. Alexandre T. Simões da Motta Profa. Dra. Adriana A. Cury Saramago CD, MO, DO CD, MO, DO _____________________________ _____________________________ Prof. Dr. Lincoln Issamu Nojima Prof. Dr. Eduardo F. Sant’Anna
CD, MO, DO CD, MO, DO
_____________________________ Profa. Dra. Mônica Tirre de Souza Araújo CD, MO, DO
Rio de Janeiro
2017

ii
Ficha Catalográfica
CLAUDINO, Lígia Vieira
Avaliação das vias aéreas em pacientes submetidos à cirurgia de
avanço mandibular. Rio de Janeiro: UFRJ/Faculdade de Odontologia, 2017.
xv, 71f.
Tese: Doutorado em Odontologia (Ortodontia) – Universidade Federal
do Rio de Janeiro, Faculdade de Odontologia, 2017.
1 Faringe 2 Avanço mandibular
3 Tomografia 4 Teses
I Título
II Tese (Doutorado – UFRJ/Faculdade de Odontologia)

iii
Aos meus pais Lúcia e Manoel
Aos meus irmãos Márcio (in memoriam) e Mércio
Ao meu esposo Saullo
A minha filha Júlia
DEDICO
iv
AGRADECIMENTOS
A Deus e a Nossa Senhora por sempre guiarem meus passos e
proporcionarem mais esta conquista em minha vida.
Aos meus amados pais, Manoel Claudino e Lúcia de Fátima, por todo
amor, educação, dedicação, incentivo e confiança em mim depositados. Em meio
a tantas adversidades nunca mediram esforços para me proporcionar a melhor
educação possível.
Ao meu marido, Saullo de Oliveira, presente de Deus em minha vida.
Agradeço imensamente por todo amor, companheirismo, cumplicidade, paciência
e incentivos, por sempre está presente em todos os momentos, inclusive nos de
maior dificuldade. Sem você ao meu lado não teria conseguido chegar até aqui, te
amo!
Aos meus irmãos, Márcio (in memoriam) e Mércio, por todo
companheirismo e incentivo, a minha cunhada Jandira e a meus amados
sobrinhos, Matheus e Anna Beatriz, por existirem e alegrarem ainda mais nossas
vidas.
Ao meu orientador, Prof. Dr. Eduardo Franzotti Sant’Anna, pelos
ensinamentos, pela orientação deste trabalho, pelo incentivo e confiança em mim
depositados desde o mestrado.
À minha querida orientadora, Profa. Dra. Cláudia Trindade Mattos, por todo
apoio, paciência, incentivo, disponibilidade e sincera amizade. Sou imensamente
grata por toda orientação dada em todas as fases desse trabalho.
v
Aos Professores do Programa de Pós-Graduação em Ortodontia da
Faculdade de Odontologia da UFRJ, Dra. Ana Maria Bolognese, Dr. Antônio
Carlos de Oliveira Ruellas, Dr. Eduardo Franzotti Sant’Anna, Dr. José
Fernando S. Brazzalle, Dr. José Vinícius Bolognesi Maciel, Dr. Lincoln Issamu
Nojima, Dra. Margareth Maria Gomes de Souza, Dra. Maria Evangelina
Monnerat, Dra. Matilde da Cunha Gonçalves Nojima e Dra. Mônica Tirre de
Souza Araújo pelos ensinamentos transmitidos durante o curso.
À amiga, Alline Birra Nolasco Fernandes, pela convivência,
companheirismo e parceria durante os anos de mestrado e doutorado.
Aos colegas de turma, Dayanne Lopes da Silva, Geórgia Wain Thi Lau,
Teresa Cristina Pereira de Oliveira e aos demais colegas de Doutorado, Adriele
Araújo, Amanda Cunha, Ana Paula Tenório, Daniel Paludo Brunetto, Hibenon
Lopes Filho, Luciana Duarte Caldas, Lúcio Maia, Rodrigo Lopes e Sânia
Ornellas, pela amizade, convivência e ensinamentos compartilhados.
Aos funcionários do Curso de Pós-Graduação em Ortodontia da Faculdade
de Odontologia da UFRJ, Diane Esteves de Souza Gomes, Fernanda Ribeiro da
Silva, Mônica Mello, Robson Antônio França (in memoriam), Vanilda
Saturnino e Waltencir da Silva, pela amizade e assistência prestadas durante o
curso.
À Coordenação de Aperfeiçoamento de Pessoal de Nível Superior
(CAPES), pelo incentivo à qualificação através da bolsa de estudos concedida.
À Fundação de Apoio à Pesquisa do Estado do Rio de Janeiro
(FAPERJ), pelo auxílio financeiro concedido a este projeto de tese.
A todos os demais amigos e familiares que contribuíram direta ou
indiretamente para a conclusão desse trabalho.

vi
RESUMO
CLAUDINO, Lígia Vieira. Avaliação das vias aéreas em pacientes submetidos
à cirurgia de avanço mandibular. Orientadores: Dr. Eduardo Franzotti
Sant’Anna; Dra. Cláudia Trindade Mattos. Rio de Janeiro: UFRJ/Faculdade de
Odontologia, 2017. Tese (Doutorado em Odontologia – Ortodontia). 71f.
Objetivou-se avaliar se existem diferenças entre os limites anatômicos
anteriores e posteriores utilizados para determinação 3D das subdivisões das vias
aéreas faríngeas (VAF) de acordo com idade; sexo; padrões esqueléticos
anteroposterior e vertical; e inclinação craniocervical, e avaliar em tomografia
computadorizada de feixe cônico (TCFC) a área de secção transversa mínima
(ASTM) e o volume das VAF de pacientes submetidos a cirurgia de avanço
mandibular em um período de acompanhamento pós-cirúrgico de no mínimo um
ano. Foram realizados dois estudos, no primeiro, a amostra incluiu 150 TCFCs de
pacientes saudáveis divididas nos seguintes grupos: por faixa etária: crianças de 6
a 11 anos, crianças de 12 a 16 anos e adultos (acima de 16 anos); por sexo:
feminino e masculino; por padrão esquelético horizontal: Classe I (1° < ANB < 5°),
Classe II (ANB > 5°), e Classe III (ANB < 1°); pelo padrão vertical: braquifacial (FMA
< 22°), mesofacial (22° < FMA < 28°) e dolicofacial (FMA > 28°); e pela inclinação
craniocervical (CCI): postura natural da cabeça (90° < CCI < 110°), flexão da

vii
cabeça (CCI < 90°), e extensão da cabeça (CCI >110°). Regiões anatômicas foram
delimitadas para determinar a correspondência entre estruturas anteriores e
posteriores das VAF. No segundo estudo, 14 pacientes com necessidade de
cirurgia de avanço mandibular foram avaliados em três tempos: (T1) pré-cirúrgico,
(T2) pós-cirúrgico, e (T3) período de acompanhamento de no mínimo 12 meses.
Um grupo controle foi constituído por 14 TCFCs de pacientes Classe I esquelética.
Foram avaliadas a ASTM e volume total da faringe (VTF), velofaringe e orofaringe.
No estudo referente aos limites anatômicos, não foram observadas diferenças
significativas entre a frequência de localização das regiões anatômicas entre
diferentes faixas etárias e padrões esqueléticos anteroposterior e vertical.
Entretanto, foram observadas diferenças estatísticas na localização da epiglote,
valécula, hioide, C2 e C3 de acordo com a CCI, e na localização da valécula, C3 e
C4 de acordo com o sexo. Quanto ao estudo que avaliou as VAF de pacientes
submetidos à cirurgia de avanço mandibular, foi observado um aumento
significativo (p<0,05) no VTF e na ASTM e esta alteração se manteve estável em
T3. Os volumes da velofaringe e orofaringe avaliados apresentaram um aumento
expressivo clínico não significativo durante o período de acompanhamento e
quando comparado ao grupo controle. Conclui-se que ambas estruturas, anteriores
ou posteriores podem ser utilizadas para delimitar as VAF independente da faixa
etária, padrões esqueléticos vertical e horizontal. No entanto, os estudos devem ser
pareados em relação ao sexo e a CCI deve ser padronizada. A cirurgia de avanço
mandibular proporcionou um aumento no VTF e na ASTM que permaneceu estável
no período de acompanhamento de no mínimo um ano.

viii
SUMMARY
CLAUDINO, Lígia Vieira. Airway evaluation in patients undergoing mandibular
advancement surgery. Orientador: Dr. Eduardo Franzotti Sant’Anna; Dra.
Cláudia Trindade Mattos. Rio de Janeiro: UFRJ/Faculdade de Odontologia,
2017. Tese (Doutorado em Odontologia – Ortodontia). 71f.
The aim of this study was to evaluate if there were differences between anterior
and posterior anatomical limits used for 3D (three-dimensional) determination of
pharyngeal airway (PA) subdivisions according to age, sex, horizontal skeletal
pattern, vertical pattern and craniocervical inclination and to evaluate in cone beam
computed tomography (CBCT) the minimum cross-sectional area (CSA) and
pharyngeal airway volume (PAV) in patients submitted to mandibular advancement
surgery with a minimum of one year post-surgical follow-up period. Two studies
were performed, in the first the sample included 150 CBCT scans from healthy
patients divided into groups according to the following: age: children aged 6 to 11
years, children aged 12 to 16 years and adults (older than 16 years); sex: female
and male; anteroposterior skeletal pattern: Class I (1° < ANB < 5°), Class II (ANB >
5°), and Class III (ANB < 1°); vertical pattern: brachyfacial (FMA < 22°), mesofacial
(22° < FMA < 28°) and dolichofacial (FMA > 28°); and cranio cervical inclination
(CCI): natural head posture (90° < CCI < 110°), head flexion (CCI < 90°), and head

ix
extension (CCI>110°). Anatomical regions were created to determine the
correspondences between structures located anteriorly and posteriorly to the
pharyngeal airway. In the prospective study that evaluated airways in patients
submitted to mandibular advancement surgery, 14 patients were evaluated in three
times: pre-surgical (T1), post-surgical (T2) and follow-up of at least 12 months (T3).
A control group was composed by 14 initial CBCT scans of skeletal Class I patients.
Linear measures were analyzed to characterize the orthognathic surgery. CSA and
total PA, velopharynx and oropharynx volumes were evaluated. In the study of
anatomical limits determination, no statistically significant differences were
observed between the frequencies of location of anterior and posterior anatomical
regions among age, different anteroposterior skeletal pattern and vertical patterns.
However, the location of epiglottis, vallecula, hyoide, C2 and C3 were statistically
different according to the CCI, and the location of vallecula, C3 e C4 were different
according to sex. Regarding the study that evaluated the airways of patients
submitted to mandibular advancement surgery, a significant (p<0.05) increase was
seen in total PAV and in CSA and these changes were stable in the follow-up period.
Oropharynx and velopharynx volumes evaluated presented an expressive clinical
and not significant increase, approaching that observed in the control group. We
concluded that anterior and posterior structures may be used to determine upper
airway limits regardless of age, vertical and anteroposterior skeletal pattern.
However, the studies must be paired according to sex and CCI must be
standardized. Mandibular advancement surgery provided an increase in total PAV
and in minimum CSA which remained stable after a minimum of 1-year of follow-up.

x
LISTA DE SIGLAS 3D Tridimensional/ 3-dimensional
A Ponto A
ASTM Área de Secção Transversa Mínima
B Ponto B
C1 Primeira vertebra cervical
C2 Segunda vértebra cervical
C3 Terceira vértebra cervical
C4 Quarta vértebra cervical
CAPES Coordenação de Aperfeiçoamento de Pessoal de Nível Superior
CBCT Cone Beam Computed Tomography
CCI Inclinação Crânio Cervical/ Craniocervical Inclination
cm2 Centímetro quadrado
CSA Cross-sectional area
DICOM Digital Imaging and Communications in Medicine
DP Desvio Padrão
ENA Espinha Nasal Anterior
ENP Espinha Nasal Posterior
et al e outros
FOV Field of View
IESC Instituto de Estudos em Saúde Coletiva

xi
KV Kilovolt
mA Miliampère
Me Ponto mento
mm Milímetro / millimeters
N Násio
OSA Obstrutive Sleep Apnea
PA Pharyngeal Airway
PAV Pharyngeal Airway Volume
PNS Posterior Nasal Spine
Pp Plano Palatino
S Segundo
SAOS Síndrome da Apneia Obstrutiva do Sono
SD Standard Deviation
T1 Período pré-cirúrgico
T2 Período pós-cirúrgico
T3 Período de acompanhamento de no mínimo 12 meses
TCFC Tomografia Computadorizada de Feixe Cônico
U Úvula/ Uvula
UA Upper Airway
UERJ Universidade Estadual do Rio de Janeiro
UFRJ Universidade Federal do Rio de Janeiro
VAF Via Aérea Faríngea
VTF Volume Total da Faringe

xii
LISTA DE FIGURAS
Página
Figura 1- Inclinação craniocervical (CCI): ângulo formado pelas linhas
OPT e NSL................................................................................................ 7
Figura 2- Regiões anatômicas A1, A2, A3 e A4 criadas para determinar
a localização das vértebras cervicais C1, C2, C3 e C4.............................. 8
Figura 3 - Regiões anatômicas B1, B2, B3 e B4 criadas para determinar
a localização da úvula, epiglote, valécula e hioide.................................... 10
Figura 4 - Medidas lineares realizadas para caracterizar mudanças
horizontais e verticais na posição da maxila e da mandíbula: ENP Vert
e Hor; A Vert e Hor, B Vert e Hor; Me Vert e Hor........................................ 14
Figura 5 - Limites utilizados nos segmentos das vias aéreas faríngeas:
A, via aérea faríngea total; B, velofaringe; C; orofaringe........................... 16
ARTIGO 1
Fig 1- Anatomical ranges A1, A2, A3 and A4 created to determine
cervical vertebrae location C1, C2, C3 and C4…………………………….. 32
Fig 2- Anatomical ranges B1, B2, B3 and B4 created to determine uvula,
epiglottis, vallecula and hyoid location……………………………………… 32
ARTIGO 2
Fig 1- Limits used in the pharyngeal airway segments: A, Total
pharyngeal airway limits; B, velopharynx limits; C, oropharynx limits……. 50

xiii
LISTA DE TABELAS
Página
ARTIGO 1
Table I – Mean and standard deviation of ANB, FMA, and CCI for
individual groups……………………………………………………………… 33
Table II - Frequencies of anterior structures in each anatomical region,
for all patients and considering, age, sex, skeletal class, vertical pattern
and cranio cervical inclination (CCI)………………………………. 34
Table III - Frequencies of posterior structures in each anatomical region,
for all patients and considering, age, sex, skeletal class, vertical pattern
and cranio cervical………………………………………………….... 35
ARTIGO 2
Table I- Sample characterization.............................................................. 51
Table II – Surgical characterization........................................................... 51
Table III – Comparison between pharyngeal airway volume and axial
area before (T1) and after orthognathic surgery in two follow-up times
(T2 and T3) and compared to the control group……………………………. 52
Table IV- correlation between changes in upper airway dimensions and
horizontal distance between B point to Nasio and Hyoid (anteroposterior)
to Nasio………………………………………………………………………… 52

xiv
ÍNDICE
Página
1 INTRODUÇÃO............................................................................... 1
2 PROPOSIÇÃO............................................................................... 4
3 DELINEAMENTO DA PESQUISA.................................................. 5
4 DESENVOLVIMENTO DA PESQUISA.......................................... 18
4.1 ARTIGO 1: WHAT LIMITS AND REFERENCES SHOULD WE
USE WHEN ASSESSING PHARYNGEAL AIRWAYS IN CBCT?
CLAUDINO LV, MATTOS CT, LUCIANA DC, SANT’ANNA EF. A
ser submetido à revista American Journal of Orthodontics and
Dentofacial Orthopedics……………………..................................... 18
4.2 ARTIGO 2: AIRWAY VOLUME AND MINIMUM CROSS-
SECTIONAL AREA CHANGES AFTER MANDIBULAR
ADVANCEMENT SURGERY: A CBCT 1-YEAR MINIMUM
FOLLOW-UP CONTROLLED STUDY. CLAUDINO, L V;
MATTOS, CT; COSER, RC; SANT’ ANNA, EF. A ser submetido à
International Jornal of Oral and Maxillofacial Surgery...................... 36
5 DISCUSSÃO.................................................................................. 53
6 CONCLUSÕES..............................................................................
...
61
xv
7 REFERÊNCIAS BIBLIOGRÁFICAS............................................... 62
8 APÊNDICE..................................................................................... 67
8.1 APÊNDICE 1................................................................................... 67
8.2 APÊNDICE 2................................................................................... 68
9 ANEXOS......................................................................................... 70
9.1 ANEXOS 1...................................................................................... 70
9.2 ANEXOS 2...................................................................................... 71
1
1 INTRODUÇÃO
Há mais de três décadas o estudo das características das vias aéreas
superiores tem despertado interesse não só da Ortodontia, como também de outras
especialidades que atuam na região de cabeça e pescoço, como
Otorrinolaringologia, Patologia e Cirurgia. Esse aspecto vem sendo amplamente
estudado, uma vez que é frequente o diagnóstico de pacientes que apresentam
sinais e sintomas de obstrução de vias aéreas e desequilíbrios craniofaciais
associados (Linder-Aronson, 1979; Mcnamara, 1981; Tso et al., 2009).
Com o advento da tomografia computadorizada de feixe cônico (TCFC),
tornou-se possível a obtenção de imagens tridimensionais do crânio e da face, ricas
em detalhes e informações, e com boa precisão e fidelidade, favorecendo a
avaliação das vias aéreas superiores. Diferentemente das teleradiografias, este
exame possibilita a avaliação da área de secção transversa e volume desta
estrutura além de apresentar menor custo e dose de radiação inferior às das
tomografias computadorizadas convencionais (Montgomery et al., 1979; Hechler,
2008; Aboudara et al., 2009; Loubele et al., 2009).
Entretanto, segundo três revisões sistemáticas publicadas recentemente,
aspectos importantes relativos à avaliação das vias aéreas superiores em TCFC
precisam ser elucidados para que os estudos apresentem boa qualidade
metodológica, tais como: validade e confiabilidade dos modelos tridimensionais

2
gerados pela TCFC, impacto da fase respiratória, influência da posição da língua e
morfologia mandibular nas dimensões das vias aéreas, estudos tridimensionais
(3D) longitudinais e transversais das vias aéreas e definição dos limites anatômicos
tridimensionais das vias aéreas superiores em TCFC (Guijarro-Martinez e
Swennen, 2011; Alsufyani et al., 2012; Chistovam et al., 2016).
Desse modo, ainda não há consenso entre os autores quanto as referências
a serem utilizadas ao se determinar os limites para avaliação das vias aéreas
superiores em TCFC. Alguns autores utilizam pontos nas vértebras cervicais
(Grauer et al., 2009; El e Palomo, 2010; Guijarro-Martinez e Swennen, 2013;
Celikoglu et al., 2014) e outros usam outras referências anatômicas, como a
valécula e a epiglote (Guijarro-Martinez e Swennen, 2011; Dalmau et al., 2015;
Feng et al., 2015).
Além disso, não está bem estabelecido na literatura se estruturas como
úvula, epiglote, valécula, hioide e vértebras cervicais, utilizadas como referência
para determinação das vias aéreas faríngeas, apresentam diferenças em sua
localização de acordo com idade e sexo e, características craniofaciais como
padrão esquelético anteroposterior, padrão vertical e posicionamento da cabeça
dos indivíduos (Shen et al., 1994; Jose et al., 2014; Tsai, 2002). Estes aspectos
devem ser estabelecidos antes de futuras avaliações e esta foi uma das
preocupações inicialmente levadas em consideração no presente estudo.
Estudos têm sugerido que as dimensões das vias aéreas faríngeas estariam
intimamente relacionadas com o padrão esquelético anteroposterior dos indivíduos
(El e Palomo, 2011; Claudino et al., 2013; Cabral et al., 2017). Desse modo,
pacientes com deficiência mandibular apresentariam vias aéreas mais constritas e

3
este aspecto poderia aumentar o risco de desenvolvimento de distúrbios
respiratórios como a SAOS (Shigeta et al., 2008; Walsh et al., 2008).
Deficiências mandibulares, em casos leves e moderados podem ser tratados
com redirecionamento no crescimento mandibular ou camuflagem ortodôntica.
Entretanto, em casos severos a realização da cirurgia de avanço mandibular torna-
se necessária (Jiang et al., 2017).
A literatura tem sugerido que a cirurgia ortognática poderia resultar em
alterações nas dimensões das vias aéreas de acordo com a direção e magnitude
do movimento esquelético. Entretanto, na maioria dos estudos publicados os
resultados são baseados em análises cefalométricas (Mattos et al., 2011; Jiang et
al., 2017).
Chistovam et al. (2016) publicaram uma revisão sistemática com o objetivo
de avaliar o efeito de diferentes tipos de cirurgia ortognática nas dimensões das
vias aéreas, utilizando imagens 3D. Em virtude do reduzido número de estudos
realizados, não há evidência científica de que a cirurgia de avanço mandibular
isolada resulte em alterações a longo prazo nas vias aéreas faríngeas.
Tendo em vista a escassez de estudos prospectivos e controlados; com
limites bem definidos das vias aéreas em imagens tridimensionais de pacientes
submetidos à cirurgia de avanço mandibular, sobretudo durante um período de
acompanhamento pós-cirúrgico a longo prazo; justifica-se a realização do presente
trabalho.
4
2 PROPOSIÇÃO
2.1. Avaliar se existem diferenças entre os limites anatômicos anteriores e
posteriores utilizados para determinação tridimensional das subdivisões das vias
aéreas faríngeas (VAF) de acordo com a idade, sexo, padrão esquelético
anteroposterior e vertical, e inclinação da cabeça.
2.2. Avaliar em TCFC a área de secção transversa mínima e o volume das
vias aéreas faríngeas de pacientes submetidos a cirurgia de avanço mandibular em
um período de acompanhamento de no mínimo um ano e comparar os resultados
com o grupo controle de Classe I esquelética.
5
3 DELINEAMENTO DA PESQUISA
3.1. ARTIGO 1: WHAT LIMITS AND REFERENCES SHOULD BE USED
WHEN ASSESSING PHARYNGEAL AIRWAYS IN CBCT?
No primeiro artigo objetivou-se avaliar se existem diferenças entre os limites
anatômicos anteriores e posteriores utilizados para determinação tridimensional
das subdivisões das vias aéreas faríngeas (VAF) de acordo com idade, sexo,
padrão esquelético anteroposterior, padrão vertical e inclinação da cabeça.
Neste trabalho, a amostra foi constituída por 150 tomografias
computadorizadas de feixe cônico (TCFC) pertencentes ao banco de dados da
clínica do programa de pós-graduação em Odontologia (Mestrado em Ortodontia)
da UFRJ, solicitadas como parte da documentação inicial necessária ao diagnóstico
e planejamento dos casos dos pacientes que iniciam o tratamento ortodôntico nesta
instituição e realizadas em clínica radiológica privada (Radiologia Odontológica
Doutor Murillo Torres), no Rio de Janeiro/RJ.
A autorização para utilização das TCFCs levou em consideração os
princípios éticos legais regulamentados pela resolução CNS 196/96, valendo-se
para tanto do termo de responsabilidade para utilização do banco de dados da
Disciplina de Ortodontia (Apêndice 1, página 64), tendo sido o presente estudo
submetido e aprovado pelo ao Comitê de Ética em Pesquisa do Instituto de Estudos
6
em Saúde Coletiva (IESC) da UFRJ sob o número: 0036.0.239.000-11 (Anexo 1,
página 67).
Como critérios de inclusão, os pacientes deveriam apresentar: boas
condições de saúde; arquivos digitais no formato DICOM de TCFC obtidos em um
mesmo equipamento (I-Cat® Imaging Sciences International, Hatfield, PA, EUA) de
acordo com o protocolo padrão (120 kV, 5 mA, 13x17cm2 de FOV, 0,4 mm3 de voxel
e tempo de 20s de escaneamento); imagens tomográficas que incluissem o limite
mais anteroinferior da quarta vértebra cervical-C4 . Os critérios de exclusão foram:
síndromes, distúrbios neoromusculares e anomalias craniofaciais.
Os dados demográficos idade e sexo foram coletados e utilizados para
caracterizar a amostra. Foram geradas reconstruções volumétricas para cada
tomografia e o posicionamento da cabeça foi padronizado (Cevidanes et al., 2009).
Foram obtidas imagens cefalométricas laterais bidimensionais a partir do software
Dolphin Imaging versão 11.5 (Dolphin Imaging, Chatsworth, California, USA).
Foram realizadas medidas angulares para caracterizar a amostra, sendo elas: os
ângulos ANB, FMA e Inclinação craniocervical CCI (OPT/SN) (Muto et al., 2002).
(Figura 1, página 7)

7
Figura 1 Inclinação craniocervical (CCI): ângulo formado pelas linhas OPT e NSL.
A amostra foi dividida nos seguintes grupos: por faixa etária: crianças com
idade entre 6 a 11 anos, adolescentes com idade entre 12 a 16 anos e adultos com
idade acima de 16 anos (Abramson et al., 2009); por sexo: feminino e masculino;
por padrão esquelético anteroposterior: Classe I (1° < ANB < 5°), Classe II (ANB >
5°), e Classe III (ANB < 1°) (Elham e Susan, 2005); pelo padrão vertical braquifacial
(FMA < 22°), mesofacial (22° < FMA < 28°) e dolicofacial (FMA > 28°) (Lione et
al.,2013); e pela inclinação craniocervical (CCI): postura natural da cabeça (90° <
CCI < 110°), flexão da cabeça (CCI < 90°), e extensão da cabeça (CCI >110°) (Muto
et al., 2002).
Regiões anatômicas foram criadas no corte do plano sagital mediano para
determinar a localização correspondente da úvula, ponta da epiglote, valécula e
osso hioide (estruturas localizadas anteriormente à via aérea faríngea) e dos pontos
mais inferior e anterior das vértebras cervicais C1, C2, C3 e C4 (estruturas
posteriores à via aérea faríngea).

8
A localização dos pontos mais inferior e anterior das vértebras cervicais (C1,
C2, C3 e C4) foi avaliada, para cada paciente, de acordo com a relação entre essas
estruturas e as seguintes regiões anatômicas:
A1- Limite superior: plano palatino (pp), limite inferior: linha paralela ao pp
passando pela úvula;
A2- Limite superior: limite inferior de A1, limite inferior: linha paralela ao pp
passando pela ponta da epiglote;
A3- Limite superior: limite inferior de A2, limite inferior: linha paralela ao pp
passando pela valécula;
A4- Limite superior: limite inferior de A3, limite inferior: término da imagem
tomográfica. (Figura 2, página 8)
Figura 2 Regiões anatômicas A1, A2, A3 e A4 criadas para determinar a localização
dos pontos mais anteroinferiores das vértebras cervicais C1, C2, C3 e C4.

9
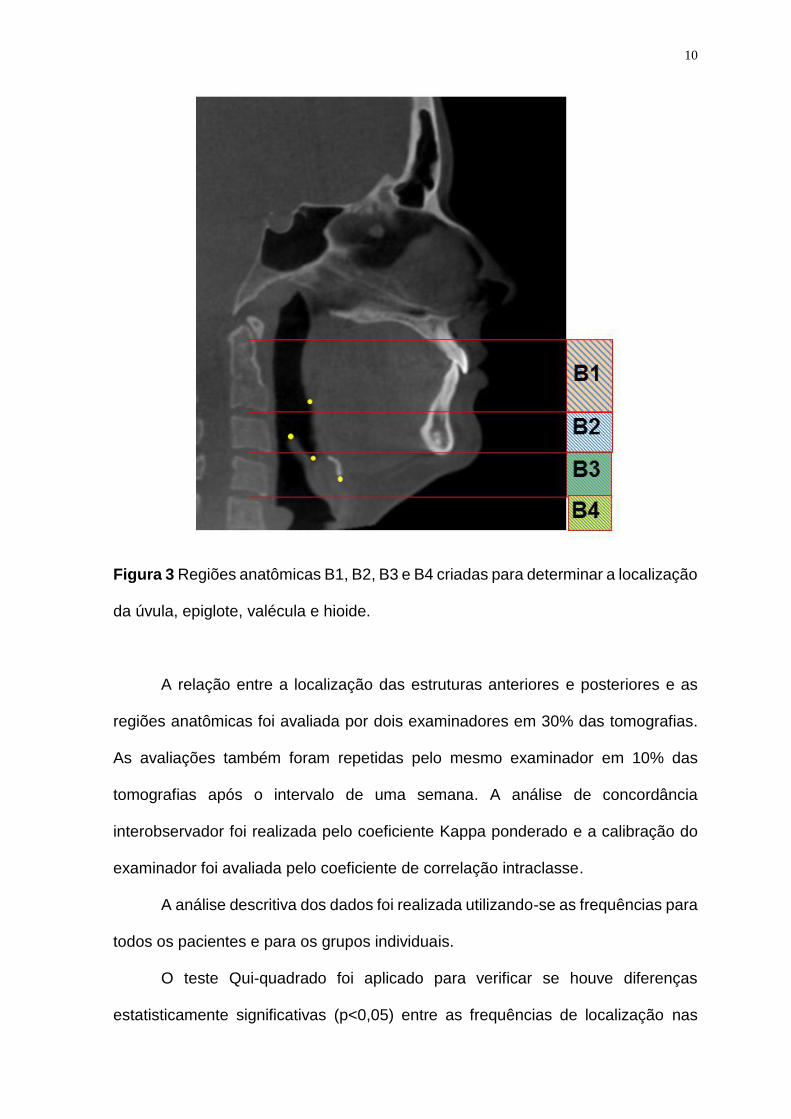
De forma semelhante, a localização da úvula, ponta da epiglote, valécula e
hioide foi avaliada, para cada paciente, de acordo com a relação entre essas
estruturas e as seguintes regiões anatômicas:
B1- Limite superior: linha paralela ao plano palatino (pp) passando pelo ponto mais
inferior e anterior de C1, limite inferior: linha paralela ao pp passando pelo ponto
mais inferior e anterior de C2;
B2- Limite superior: limite inferior de B1, limite inferior: linha paralela ao pp
passando pelo ponto mais inferior e anterior de C3;
B3- Limite superior: limite inferior de B2, limite inferior: linha paralela ao pp
passando pelo ponto mais inferior e anterior de C4;
B4- Limite superior: limite inferior de B3, limite inferior: término da imagem
tomográfica. (Figura 3, página 10).
10
Figura 3 Regiões anatômicas B1, B2, B3 e B4 criadas para determinar a localização
da úvula, epiglote, valécula e hioide.
A relação entre a localização das estruturas anteriores e posteriores e as
regiões anatômicas foi avaliada por dois examinadores em 30% das tomografias.
As avaliações também foram repetidas pelo mesmo examinador em 10% das
tomografias após o intervalo de uma semana. A análise de concordância
interobservador foi realizada pelo coeficiente Kappa ponderado e a calibração do
examinador foi avaliada pelo coeficiente de correlação intraclasse.
A análise descritiva dos dados foi realizada utilizando-se as frequências para
todos os pacientes e para os grupos individuais.
O teste Qui-quadrado foi aplicado para verificar se houve diferenças
estatisticamente significativas (p<0,05) entre as frequências de localização nas

11
estruturas das VAS, nos diferentes tipos de padrões esqueléticos anteroposteriores
e verticais, inclinação crânio-cervical, idade e sexo.
3.2 ARTIGO 2: AIRWAY VOLUME AND MINIMUM CROSS-SECTIONAL
AREA CHANGES AFTER MANDIBULAR ADVANCEMENT SURGERY: A CBCT
1-YEAR MINIMUM FOLLOW-UP CONTROLLED STUDY
Este estudo prospectivo foi aprovado pelo comitê de ética em pesquisa do
Instituto de Estudos em Saúde Coletiva (IESC) da UFRJ sob o parecer de número
0045.0.239.000.10 (Anexo 2, página 68). Todos os pacientes assinaram o termo de
consentimento livre e esclarecido.
Foi realizado o cálculo amostral baseado no desvio padrão (DP=28mm2) de
um estudo anterior (Marcussen et al., 2017). Uma amostra constituída por 14
pacientes em cada grupo seria necessária para identificar diferenças de 30mm2 na
área axial mínima, utilizando-se a formula de (Pandis, 2012) com um poder de 80%
e o valor de α=0.05.
O grupo experimental foi composto por 14 pacientes (5 homens e 9
mulheres) com média de idade de 29,03 anos (variação 17,08 - 44,42 anos) em
fase pré-cirúrgica. Os seguintes critérios de inclusão foram utilizados na seleção da
amostra para o grupo experimental: planejamento de cirurgia de avanço mandibular
para correção de discrepâncias entre as bases ósseas; fase cirúrgica no Hospital
Universitário Pedro Ernesto da UERJ e boas condições de saúde. Os critérios de
exclusão foram: fissura de lábio e palato; síndromes e desordens craniofaciais e
cirurgia craniofacial prévia. Oito pacientes além de serem submetidos a cirurgia de
avanço mandibular e/ou mentoplastia, também foram submetidos a cirurgia de

12
impação maxilar. Entretanto, não houve planejamento de movimento
anteroposterior da maxila para nenhum dos pacientes incluídos.
O grupo controle foi constituído por 14 TCFCs iniciais de pacientes de Classe
I esquelética (6 homens e 8 mulheres) com idade média de 26,28 anos (variação
19 - 40 anos), selecionados do banco de dados da clínica do programa de
pós-graduação em Odontologia (Mestrado em Ortodontia) da UFRJ. As TCFCs
utilizadas foram solicitadas, quando necessário, como parte da documentação
inicial para o diagnóstico e planejamento do tratamento ortodôntico. Nenhum
paciente deste grupo foi submetido ao exame de TCFC para esta pesquisa. Os
seguintes critérios de inclusão foram utilizados na seleção da amostra do grupo
controle: padrão esquelético anteroposterior de Classe I; arquivos no formato
DICOM; nenhum histórico de tratamento ortodôntico ou cirúrgico prévio ou outro
tratamento que pudesse interferir no curso normal do crescimento e
desenvolvimento maxilomandibular; e boas condições de saúde.
Os exames tomográficos foram solicitados para o grupo experimental em
três tempos: pré-cirúrgico (T1, n=14), pós-cirúrgico (T2, n=13) - no mínimo um mês
após a cirurgia (2,8± 1,6; 1-6 meses); e acompanhamento (T3, n=10) - no mínimo
12 meses após a cirurgia (17,1 ± 4,2; 12-24 meses). Todos os exames tomográficos
foram realizados em clínica odontológica privada (Radiologia Odontológica Doutor
Murillo Torres), no Rio de Janeiro/RJ, sendo utilizado o mesmo tomógrafo (I-CAT
3D DENTAL IMAGING SYSTEM, Pensilvania, USA), padronizando-se os exames
(120 kV, 5 mA, 13x17cm2 de FOV, 0,4 mm3 de voxel e tempo de 20s de
escaneamento). As TCFCs foram realizadas com o paciente em máxima
intercuspidação e sentado em posição vertical, e com o plano horizontal de
Frankfurt paralelo ao solo.

13
Uma reconstrução volumétrica foi obtida de cada tomografia e importada no
formato DICOM (digital imaging and communications in medicine) para o software
Dolphin imaging (versão 11.5; Dolphin Imaging, Chatsworth, California, USA) para
observações e análises. O posicionamento da cabeça foi padronizado (Cevidanes
et al., 2009).
imagens cefalométricas laterais bidimensionais foram criadas das TCFCs no
software Dolphin Imaging versão 11.5 e os ângulos craniocervical (Muto et al.,
2002) e ANB foram avaliados para caracterizar a amostra.
Medidas lineares foram realizadas no corte do plano sagital mediano (N-
ENA) para caracterizar mudanças horizontais e verticais na posição da maxila e da
mandíbula, sendo elas (Figura 4, página 14):
1) ENP Vert (mm): distância vertical em milímetros entre a espinha nasal
posterior (ENP) e a linha horizontal passando pelo ponto násio (N);
2) ENP Hor (mm): distância horizontal em milímetros entre a espinha nasal
posterior (ENP) e a linha vertical passando pelo ponto násio (N);
3) A Vert (mm): distância vertical em milímetros entre o ponto A e a linha
horizontal passando pelo ponto násio (N);
4) A Hor (mm): distância horizontal em milímetros entre o ponto A e a linha
vertical passando pelo ponto násio (N).
5) B Vert (mm): distância vertical em milímetros entre o ponto B e a linha
horizontal passando pelo ponto násio (N);
6) B Hor (mm): distância horizontal em milímetros entre o ponto B e a linha
vertical passando pelo ponto násio (N);
7) Me Vert (mm): distância vertical em milímetros entre o ponto mento (Me) e a
linha horizontal passando pelo ponto násio (N);

14
8) Me Hor (mm): distância horizontal em milímetros entre o ponto Me e a linha
vertical passando pelo ponto násio (N);
Figura 4 Medidas lineares realizadas no plano sagital mediano (N-ENA) para
caracterizar mudanças horizontais e verticais na posição da maxila e da mandíbula:
ENP Vert e Hor; A Vert e Hor; B Vert e Hor; Me Vert e Hor.
Para determinação da posição do osso hioide foram utilizadas as seguintes
coordenadas cartesianas, considerando o ponto N como origem (zero): X (latero-
lateral), Y (vertical) and Z (antero-posterior).
As seguintes regiões das vias aéreas faríngeas foram avaliadas: via aérea
faríngea total; velofaringe e orofaringe. Para a via aérea faríngea total, o limite
superior foi definido na vista sagital pelo plano paralelo ao plano horizontal de

15
Frankfurt passando pelo ponto mais anteroinferior da primeira vértebra cervical- C1,
e o limite inferior pelo plano paralelo ao plano horizontal de Frankfurt passando pelo
ponto mais anteroinferior da terceira vértebra cervical-C3. Para a velofaringe, o
limite superior foi o mesmo definido anteriormente e o limite inferior, o plano paralelo
ao plano horizontal de Frankfurt passando pela úvula. O limite superior da
orofaringe foi o limite inferior da velofaringe e o limite inferior, o plano paralelo ao
plano horizontal de Frankfurt passando pelo ponto mais anteroinferior da terceira
vértebra cervical-C3 de acordo com os dados apresentados no estudo anterior e
com a metodologia descrita por (Grauer et al., 2009; e Brasil et al., 2016) adaptada
para o presente estudo (Figura 5, página 16).
Os volumes e as áreas de secção transversa mínima foram avaliados
utilizando-se uma ferramenta específica do modo 3D do software Dolphin imaging
na qual foi acessada a ferramenta “Sinus/ Airway”, com o valor de sensibilidade de
detecção do espaço aéreo padronizado em 73%, como proposto por (Alves et al.,
2012). Os limites para cada região de interesse foram inicialmente definidos no
plano sagital. Em seguida, selecionando a opção “Add” foram inseridos um ou mais
pontos amarelos denominados “seed points” que determinam quais áreas serão
incluídas no cálculo do volume. Para garantir que toda área de interesse fosse
incluída dentro dos limites previamente estabelecidos, percorreu-se todos os cortes
nos três planos, sagital, axial e coronal adicionando “seed points” quando
necessário. Após a delimitação da estrutura nos três planos, selecionou-se a tecla
“ Update airway” e o software automaticamente calculou o volume das vias aéreas
faríngeas em mm3. Para o cálculo da área de secção transversa mínima,
selecionou-se a opção “enable Minimum Axial Area” e duas linhas horizontais

16
paralelas foram fornecidas e posicionadas nos limites superior e inferior das vias
aéreas sendo obtida a área de maior constrição em mm2.
Figura 5 Limites utilizados nos segmentos das vias aéreas faríngeas: A, via aérea
faríngea total; B, Velofaringe; C, orofaringe.

17
Todas as medidas foram repetidas em 35% das tomografias, pelo mesmo
operador, após o intervalo de uma semana. A calibração do examinador foi avaliada
pelo coeficiente de correlação intraclasse.
A análise descritiva dos dados, incluindo média e desvio padrão, foi realizada
para as variáveis quantitativas. O teste de Kolmogov-Smirnov foi aplicado para
avaliar a normalidade dos dados. O teste One-way ANOVA de medidas repetidas
com a correção de Bonferroni foi utilizado para verificar se houve diferenças
estatisticamente significativas (p<0,05) entre os exames nos diferentes períodos de
tempo (T1, T2 e T3). Adicionalmente, diferenças estatisticamente significativas
(p<0,05) entre cada período de tempo (T1, T2 e T3) e o grupo controle foram
avaliadas e a correção de Benjamini-Hochberg foi utilizada para ajustar o p valor
para comparações múltiplas.
Correlações entre as mudanças nas dimensões das vias aéreas e a distância
do ponto B até o Nasio foram avaliadas pelo coeficiente de correlação de Pearson.

18
4 DESENVOLVIMENTO DA PESQUISA
4.1 WHAT LIMITS AND REFERENCES SHOULD WE USE WHEN
ASSESSING PHARYNGEAL AIRWAYS IN CBCT? CLAUDINO LV, MATTOS CT,
LUCIANA DC, SANT’ANNA EF. A ser submetido à revista American Journal of
Orthodontics and Dentofacial Orthopedics.
INTRODUCTION
For decades, studies of upper airway (UA) characteristics have been
reported extensively in several fields of Dentistry and Medicine. The unclear
relationship between UA characteristics and craniofacial growth and development
may have been the reason for part of those articles.1-3
Recently, with the advent of cone beam computed tomography (CBCT), it is
possible to obtain 3-dimensional images of the skull and face and to assess UA with
good accuracy and reproducibility.4,5 In contrast to cephalometric radiograph, the
CBCT has the advantage of assessing soft tissues in 3 dimensions, which allows
measurements of volume, morphology, and minimum axial area of pharyngeal
airway. Additionally, CBCT has lower cost and uses a significantly reduced radiation
dose compared with medical computed tomography machines.4,6
19
However, according to three systematic reviews recently published,
although the 3-dimensional analysis of UA can be accurate and reliable, important
aspects still need to be clarified, including 3-dimensional CBCT definition of the
anatomical boundaries of this structure.7-9
There is no consensus concerning which anatomical boundaries should be
used to define UA specific regions in CBCT. Some authors have used references in
cervical vertebrae10-13 and others have used boundaries located in anatomical
structures anterior to the UA, such as uvula and epiglottis14-19 . Didactically, the
subdivision of UA is performed considering the location of the structure as follow:
nasopharynx, velopharynx, oropharynx and hypopharynx. However, the limits for
each subdivision are very variable in the literature, making it difficult to compare the
studies.20
The choice of adequate limits for airway assessment must take into account
aspects such as the kind of study. In an intervention study that evaluate changes in
UA after skeletal movement, for example, changes in soft palate, tongue and hyoid
bone position21 may indicate that these structures could be inappropriate as limits
for UA division.
In addition, it is not clear in the literature if structures like uvula, epiglottis,
vallecula, hyoid and cervical vertebrae could present differences in their location
according to confounding factors such as age and sex, and craniofacial
characteristics like skeletal malocclusion, vertical pattern and head inclination.22-24
In this sense, the goal of this cross-sectional observational study is to
evaluate if there is difference between anterior and posterior anatomical structures
used for 3-dimensional determination of pharyngeal airway (PA) subdivisions
according to age, sex, skeletal malocclusion, vertical pattern and head inclination
20
and whether these structures may be used with the same efficiency to determine 3-
dimensional definition of pharyngeal subdivision.
MATERIAL AND METHODS
This retrospective study was approved by the Ethics in Research Committee
of the Institute of Studies in Collective Health of Universidade Federal do Rio de
Janeiro.
The sample included 150 cone beam computed tomography scans (CBCT)
from the orthodontic records of the clinics of the postgraduate program in the school
of dentistry of Universidade Federal do Rio de Janeiro. No exam was requested
specifically for this research and all CBCTs had been requested when needed for
diagnosis and planning of patients starting their orthodontic treatment.
The inclusion criteria were: good health conditions, CBCT DICOM file
obtained from the same device (i-CAT; Imaging Sciences International, Hatfield, Pa,
USA) according to a standard protocol (120 kV, 5 mA, 13 x 17 cm FOV, 0.4mm3
voxel, and 20 seconds scanning time) and tomographic imaging that included the
most anteroinferior limit of the fourth cervical vertebrae-C4. Exclusion criteria were
syndrome, neuromuscular disorders, craniofacial anomalies.
A volumetric reconstruction was created for each tomography and head
position was standardized25. 2-dimensional lateral cephalometric images were
obtained from the CBCT scans in the Dolphin Imaging software version 11.5
(Dolphin Imaging, Chatsworth, California, USA). The craniocervical inclination26,
and ANB and FMA angles were measured to characterize the sample.
The subjects were divided into groups according to the following: age:
children with mixed dentition (6 to 11 years), adolescents (12 to 16 years) and adults
(older than 16 years)27; sex: female and male; horizontal pattern (ANB angle): Class

21
I (1° < ANB < 5°), Class II (ANB > 5°), and Class III (ANB < 1°)28; vertical pattern
(FMA Angle): brachyfacial (FMA < 22°), mesofacial (22° < FMA < 28°) and
dolicofacial (FMA > 28°)29; and craniocervical inclination (CCI)26: natural head
posture (90° < CCI < 110°), head flexion (CCI < 90°), and head extension (CCI
>110°).
Anatomical regions were created in the midsagittal slice to determine the
correspondent localization of uvula, tip of epiglottis, vallecula and hyoid (structures
located anterior to the pharyngeal airway), and the lower and most anterior point in
the C1, C2, C3 and C4 cervical vertebrae (structures located posterior to the
pharyngeal airway).
The lower and most anterior point in the C1, C2, C3 and C4 cervical vertebrae
location was assessed, for each patient, according to the relationship between these
structures and the following anatomical regions: A1- Upper limit: palatal plane (pp),
Lower limit: line parallel to the pp passing by the uvula; A2- Upper limit: lower limit
of A1, Lower limit: line parallel to the pp passing by the tip of epiglottis; A3- Upper
limit: lower limit of A2, Lower limit: line parallel to the pp passing by the vallecula,
and A4- Upper limit: lower limit of A3, Lower limit: lower limit of tomographic imaging.
(Fig-1).
Similarly, uvula, epiglottis, vallecula and hyoid location was assessed, for
each patient, according to the relationship between these structures and the follow
anatomical regions: B1- Upper limit: line parallel to the palatal plane (pp) passing by
the lower and most anterior point in the C1,Lower limit: line parallel to the pp passing
by the lower and most anterior point in the C2; B2- Upper limit: lower limit of B1,
Lower limit: line parallel to the pp passing by the lower and most anterior point in the
C3; B3- Upper limit: lower limit of B2, Lower limit: line parallel to the pp passing by
22
the lower and most anterior point in the C4; B4- Upper limit: lower limit of B3, lower
limit: lower limit of tomographic imaging. (Fig 2).
Statistical analysis
The relationship between anterior and posterior structures location and the
anatomical regions were performed by 2 examines in 30% of the CBCT scans.
Concordance analyses of the operator was tested with the weighted kappa
coefficient. All analyses were repeated for the same operator in 10% of the CBCT
scans after a 2-week interval. Calibration of the operator was tested with the
intraclass correlation coefficient.
A descriptive analysis was performed using frequencies for all patients and
for individual groups.
The Chi-square test was applied to verify whether there were statistically
significant differences between the frequencies of location among different skeletal
malocclusion, vertical patterns and craniocervical inclination. The level of
significance of 0.05 was adopted.
RESULTS
The weighted kappa coefficient results were Kappa=1 for all variables
assessed showed perfect agreement. The intraclass correlation coefficient results
were higher than 0.99 for all variables assessed.
Table I present the mean and standard deviation of ANB, FMA and CCI for
different skeletal class, vertical pattern and craniocervical inclination groups.
The frequencies of anterior and posterior structures in each anatomical
region, for all patients and considering age, sex, different skeletal Class, vertical
pattern and craniocervical inclination were described in Tables II and III.

23
Considering all patients, the uvula was located in B1 anatomical region for
94.7% (n=142) of the cases ranging from 90.4% to 100% in the subgroups. (Table
II).
The tip of epiglottis was located in B2 for 80.7% (n= 121) of the all patients
ranging from 70% to 88.9% in the subgroups, and was located in B3 for 13.3%
(n=20) of the all patients ranging from 2.9% to 23.8% in the subgroups except for
the head extension subgroup (CCI>110°). In this subgroup, the location of the tip of
epiglottis was more frequent in B2, but with a lower percentage than all other
subgroups (55%) and the frequency in B1 (33%) was greater than in B3 (11%)
(Table II).
For the vallecula, it was more frequently located in B3 (66%) (n=99) ranging
from 50% to 76.8% in the subgroups, followed by B2 (30.7%) (n=46), ranging from
18.4% to 46.7% in the subgroups except for the head extension subgroup
(CCI>110°). In this subgroup, the location of the vallecula was more frequent in B2
(61.1%) than in B3 (33.3%). (Table II).
The hyoid was located in B3 anatomical region for 77.3% (n=116) of the
cases ranging to 61.1% to 95.2% in the subgroups, and was located in B4 for 14.7%
(n=22) ranging from 0.9% to 26.1% in the subgroups except for the head extension
subgroup (CCI>110°). In this subgroup, the location of hyoid was more frequent in
B2 (27.7%) than in B4 (11.1%). (Table I).
For structures located posterior to the airway, in 100% of the cases (n=150),
cervical vertebrae C1 was located in A1 anatomical region (Table III).
For 90,7% (n=136) of the patients, C2 was located in A2 anatomical region,
ranging from 86.4% to 95.7% in the subgroups, except for the head extension
subgroup (CCI>110°). In this subgroup, the location of C2 was more frequent in A2,

24
but with a lower percentage than all other subgroups (66.6%), followed by a
relatively high frequency in A3 (27.7%) (Table III).
C3 was more frequently located in A3 (63,3%) (n=95), ranging from 43.3% to
70.2% in the subgroups, followed by A4 (23.4%) ranging from 9.4% to 40% in the
subgroups except for the head extension subgroup (CCI >110°). In this subgroup,
the location of C3 was more frequent in A4 (61.1%) than in A3 (27.7%) (table III).
In 95.4% (n=143) of the cases, C4 was located in A4 anatomical region
ranging from 89.7% to 100% in the subgroups (Table III).
No statistically significant differences were observed between the
frequencies of location of anterior and posterior anatomical regions among age,
different skeletal class and vertical patterns according to Chi-square test (Tables II
and III) (p>0.05).
However, the Chi-square test showed that the location of epiglottis, vallecula,
hyoide, C2 and C3 were statistically different according to craniocervical inclination
and the location of vallecula, C3 e C4 were statistically different according to sex
(Tables II and III) (p<0.05).
DISCUSSION
The anatomical regions of UA are defined in anatomical literature as
nasopharynx, velopharynx, oropharynx and hypopharynx according to it
localizations. However, there are no protocols or consensus about the limits that
should be used for this didactic division and they are chosen very subjectively20,30,31.
In scientific literature, this lack of standardization among different studies that
evaluated upper airway in CBCT can also be observed and, consequently,
comparisons among groups are extremely difficult because of this methodological
limitation7.

25
In this sense, a recent validation study was published aiming to provide
clinical 3-dimensional anatomical limits for the upper airway subregions.12 The
regions of upper airway, nasopharynx, oropharynx and hypopharynx were defined
by the authors according to clinical experience and a previous study.7 Nonetheless,
it is unknown if there are differences in anterior and posterior anatomical structures
to delimit upper airway subdivisions, according to sex, age, and craniofacial
characteristics like different skeletal class, vertical pattern and craniocervical
inclination.22-24
In view of this limitation, the present study tried to investigate if there is
difference between anterior and posterior anatomical structures used for 3-
dimensional determination of pharyngeal airway (PA) subdivisions according to age,
sex, skeletal malocclusion, vertical pattern and head inclination in CBCT.
Abramson et al. (2009)27 evaluated if size and shape UA were associated
with age and sex using 3-dimensional imaging. These authors observed that UA
size was correlated with age, predominantly during the primary and permanent
stages of dentition, corresponding to periods of significant somatic growth. In view
of these results, our study stratifies the age range similarly to evaluated if there were
differences in uvula, tip of epiglottis, vallecula, hyoid and cervical vertebrae position
in children, adolescents and adults. There was no statistically significant difference
between the frequencies of location of these anterior and posterior anatomical
regions regarding age.
However, there were a sexual dimorphism regarding the vallecula, C3 and
C4 position. In males, the vallecula was more frequently located in B3 (76.8%)
followed by B2 (18.8%) and in female, the location of vallecula was more frequent
in B3 (56.8%), but with a lower percentage than in the male group, followed by a
26
relatively high frequency in B2 (40.7%). This result indicates that vallecula is located
bellow in males than in females. Inversely, C3 and C4 is located above in males
than in females.
Ours results show that both anterior structures, such as uvula and epiglottis,
and posterior structures, such as cervical vertebrae, could be used for upper airway
analyses. Nevertheless, posterior structures are always located below and, in
consequence, the anatomical subregion defined by them will be located below too.
It is important to notice that the use of posterior structures could be more
appropriate in cases where patients are submitted to surgical procedures, since the
position of structures like soft palate, tongue and hyoid bone could be modified with
this procedure16,18,32,33. However, some studies that evaluate the effect of
orthognathic surgery on the UA did not consider this aspect.18,34,35
In this study, the evaluation of structures that delimit nasopharynx was not
performed as this structure presents a complex anatomy, difficult to be analyzed in
CBCT. 36,37
Another region difficult to evaluated is the hypopharynx, not because its
anatomy, but because its inferior location. Sometimes, depending on the size of the
patient, a larger field of view (FOV) may be necessary to include the referred
area38,39, and that could require a higher dose of radiation. For that reason, the
increase of FOV with the single purpose of evaluating the hypopharynx region is not
recommended.
In Orthodontics, the FOV of 12-in is generally used because of the need to
encompass all the craniofacial region like in cases where you want to
cephalometrically analyze the patient38. However, it is not always possible to reach

27
the hypopharynx regions in its totality, until C4. In this study, some CBCTs were
excluded because of this fact.
There was no statistically significant difference between the frequencies of
location of anterior and posterior anatomical regions among age and different
horizontal and vertical patterns (Tables II and III). This result could indicate that the
boundaries could be used for all groups of patients independent of the age and
horizontal and vertical pattern, allowing comparisons between groups.
The correct position of the patient’s head is one of the essentials aspects that
must be considered for evaluation of the craniofacial morphology and pharyngeal
airway space especially for longitudinal superimposition of the images.26,40,41
In this sense, our study evaluated that there was statistic difference between
craniocervical inclination and positions of the structures of the UA. The results
showed that the localization of epiglottis, vallecula, hyoide, C2 and C3 were
statistically different according to craniocervical inclination. The greater the angle,
there was a tendency for structures located anterior to the airway (epiglottis,
vallecula and hyoide) to be positioned more superiorly. Inversely, the smaller the
angle, there was a tendency for posterior structures (C2 and C3) to be positioned
more superiorly (Tables II and III). These results indicate that it is important to
standardize the craniocervical inclination to establish these correct limits.
In conclusion, the evaluation of difference between anterior and posterior
anatomical structures used for 3-dimensional determination of PA subdivisions
according to age, sex, horizontal and vertical pattern, and head inclination in CBCT
performed in this study indicates that both structures may be used to delimited UA
limits regardless of the age, vertical and horizontal skeletal pattern. However,

28
craniocervical inclination must be standardized and special attention must be paid
to sexual dimorphism.
REFERENCES
1. Tso HH, Lee JS, Huang JC, Maki K, Hatcher D, Miller AJ. Evaluation of the human airway using cone-beam computerized tomography. Oral Surg Oral Med Oral Pathol Oral Radiol Endod 2009;108:768-776. 2. McNamara JA. Influence of respiratory pattern on craniofacial growth. Angle Orthod 1981;51:269-300. 3. Linder-Aronson S. Respiratory function in relation to facial morphology and the dentition. Br J Orthod 1979;6:59-71. 4. Aboudara C, Nielsen I, Huang JC, Maki K, Miller AJ, Hatcher D. Comparison of airway space with conventional lateral headfilms and 3-dimensional reconstruction from cone-beam computed tomography. Am J Orthod Dentofacial Orthop 2009;135:468-479. 5. Lenza MG, Lenza MM, Dalstra M, Melsen B, Cattaneo PM. An analysis of different approaches to the assessment of upper airway morphology: a CBCT study. Orthod Craniofac Res 2010;13:96-105. 6. Loubele M, Bogaerts R, Van Dijck E, Pauwels R, Vanheusden S, Suetens P et al. Comparison between effective radiation dose of CBCT and MSCT scanners for dentomaxillofacial applications. Eur J Radiol 2009;71:461-468. 7. Guijarro-Martinez R, Swennen GR. Cone-beam computerized tomography imaging and analysis of the upper airway: a systematic review of the literature. Int J Oral Maxillofac Surg 2011;40:1227-1237. 8. Alsufyani NA, Flores-Mir C, Major PW. Three-dimensional segmentation of the upper airway using cone beam CT: a systematic review. Dentomaxillofac Radiol 2012;41:276-284. 9. Christovam IO, Lisboa CO, Ferreira DM, Cury-Saramago AA, Mattos CT. Upper airway dimensions in patients undergoing orthognathic surgery: a systematic review and meta-analysis. Int J Oral Maxillofac Surg 2016;45:460-471. 10. El H, Palomo JM. Measuring the airway in 3 dimensions: a reliability and accuracy study. Am J Orthod Dentofacial Orthop 2010;137:S50.e51-59; discussion S50-52. 11. Grauer D, Cevidanes LS, Styner MA, Ackerman JL, Proffit WR. Pharyngeal airway volume and shape from cone-beam computed tomography: relationship to facial morphology. Am J Orthod Dentofacial Orthop 2009;136:805-814.
29
12. Guijarro-Martinez R, Swennen GRJ. Three-dimensional cone beam computed tomography definition of the anatomical subregions of the upper airway: a validation study. International Journal of Oral and Maxillofacial Surgery 2013;42:1140-1149. 13. Celikoglu M, Bayram M, Sekerci AE, Buyuk SK, Toy E. Comparison of pharyngeal airway volume among different vertical skeletal patterns: a cone-beam computed tomography study. Angle Orthod 2014;84:782-787. 14. Chang Y, Koenig LJ, Pruszynski JE, Bradley TG, Bosio JA, Liu D. Dimensional changes of upper airway after rapid maxillary expansion: a prospective cone-beam computed tomography study. Am J Orthod Dentofacial Orthop 2013;143:462-470. 15. Dalmau E, Zamora N, Tarazona B, Gandia JL, Paredes V. A comparative study of the pharyngeal airway space, measured with cone beam computed tomography, between patients with different craniofacial morphologies. J Craniomaxillofac Surg 2015;43:1438-1446. 16. Efendiyeva R, Aydemir H, Karasu H, Toygar-Memikoglu U. Pharyngeal airway space, hyoid bone position, and head posture after bimaxillary orthognathic surgery in Class III patients: long-term evaluation. Angle Orthod 2014;84:773-781. 17. Feng X, Li G, Qu Z, Liu L, Nasstrom K, Shi XQ. Comparative analysis of upper airway volume with lateral cephalograms and cone-beam computed tomography. Am J Orthod Dentofacial Orthop 2015;147:197-204. 18. Kim MA, Kim BR, Choi JY, Youn JK, Kim YJ, Park YH. Three-dimensional changes of the hyoid bone and airway volumes related to its relationship with horizontal anatomic planes after bimaxillary surgery in skeletal Class III patients. Angle Orthod 2013;83:623-629. 19. Raffaini M, Pisani C. Clinical and cone-beam computed tomography evaluation of the three-dimensional increase in pharyngeal airway space following maxillo-mandibular rotation-advancement for Class II-correction in patients without sleep apnoea (OSA). Journal of Cranio-Maxillofacial Surgery 2013;41:552-557. 20. Guijarro-Martinez R, Swennen GRJ. Cone-beam computerized tomography imaging and analysis of the upper airway: a systematic review of the literature. International Journal of Oral and Maxillofacial Surgery 2011;40:1227-1237. 21. Lye KW. Effect of orthognathic surgery on the posterior airway space (PAS). Ann Acad Med Singapore 2008;37:677-682. 22. Shen GF, Samman N, Qiu WL, Tang YS, Xia J, Huang YL. Cephalometric studies on the upper airway space in normal Chinese. Int J Oral Maxillofac Surg 1994;23:243-247. 23. Jose NP, Shetty S, Mogra S, Shetty VS, Rangarajan S, Mary L. Evaluation of hyoid bone position and its correlation with pharyngeal airway space in different types of skeletal malocclusion. Contemp Clin Dent 2014;5:187-189.

30
24. Tsai HH. The positional changes of hyoid bone in children. J Clin Pediatr Dent 2002;27:29-34. 25. Cevidanes L, Oliveira AE, Motta A, Phillips C, Burke B, Tyndall D. Head orientation in CBCT-generated cephalograms. Angle Orthod 2009;79:971-977. 26. Muto T, Takeda S, Kanazawa M, Yamazaki A, Fujiwara Y, Mizoguchi I. The effect of head posture on the pharyngeal airway space (PAS). Int J Oral Maxillofac Surg 2002;31:579-583. 27. Abramson Z, Susarla S, Troulis M, Kaban L. Age-related changes of the upper airway assessed by 3-dimensional computed tomography. Journal of Craniofacial Surgery 2009;20:657-663. 28. Abu Allhaija ES, Al-Khateeb SN. Uvulo-glosso-pharyngeal dimensions in different anteroposterior skeletal patterns. Angle Orthod 2005;75:1012-1018. 29. Lione R, Franchi L, Noviello A, Bollero P, Fanucci E, Cozza P. Three-dimensional evaluation of masseter muscle in different vertical facial patterns: a cross-sectional study in growing children. Ultrason Imaging 2013;35:307-317. 30. Netter FH. Atlas de anatomia humana Atlas of Human Anatomy: 2ed. Porto Alegre: Artimed, 2000. 31. Sobotta J. Atlas de anatomia humana atlas of human anatomy: 21 ed. Rio de Janeiro: Guanabara Koogan, 2000. 32. Goncales ES, Rocha JF, Goncales AG, Yaedu RY, Sant'Ana E. Computerized cephalometric study of the pharyngeal airway space in patients submitted to orthognathic surgery. J Maxillofac Oral Surg 2014;13:253-258. 33. Li YM, Liu JL, Zhao JL, Dai J, Wang L, Chen JW. Morphological changes in the pharyngeal airway of female skeletal class III patients following bimaxillary surgery: a cone beam computed tomography evaluation. Int J Oral Maxillofac Surg 2014;43:862-867. 34. Hatab NA, Konstantinovic VS, Mudrak JKH. Pharyngeal airway changes after mono- and bimaxillary surgery in skeletal class III patients: Cone-beam computed tomography evaluation. Journal of Cranio-Maxillofacial Surgery 2015;43:491-496. 35. Kochel J, Meyer-Marcotty P, Sickel F, Lindorf H, Stellzig-Eisenhauer A. Short-term pharyngeal airway changes after mandibular advancement surgery in adult Class II-Patients-a three-dimensional retrospective study. Journal of Orofacial Orthopedics-Fortschritte Der Kieferorthopadie 2013;74:137-152. 36. Claudino LV, Mattos CT, Ruellas ACD, Anna EFS. Pharyngeal airway characterization in adolescents related to facial skeletal pattern: A preliminary study. American Journal of Orthodontics and Dentofacial Orthopedics 2013;143:799-809.

31
37. El H, Palomo JM. Airway volume for different dentofacial skeletal patterns. Am J Orthod Dentofacial Orthop 2011;139:e511-521. 38. da Silva MB, Sant'Anna EF. The evolution of cephalometric diagnosis in orthodontics. Dental Press J Orthod 2013;18:63-71. 39. Kau CH, Richmond S, Palomo JM, Hans MG. Three-dimensional cone beam computerized tomography in orthodontics. J Orthod 2005;32:282-293. 40. Cassi D, De Biase C, Tonni I, Gandolfini M, Di Blasio A, Piancino MG. Natural position of the head: review of two-dimensional and three-dimensional methods of recording. Br J Oral Maxillofac Surg 2016. 41. Muto T, Yamazaki A, Takeda S, Kawakami J, Tsuji Y, Shibata T et al. Relationship between the pharyngeal airway space and craniofacial morphology, taking into account head posture. Int J Oral Maxillofac Surg 2006;35:132-136.

32
TABLES AND FIGURES
Fig 1. Anatomical ranges A1, A2, A3 and A4 created to determine cervical vertebrae location C1, C2, C3 and C4.
Fig 2. Anatomical ranges B1, B2, B3 and B4 created to determine uvula, epiglottis, vallecula and hyoid location.
33
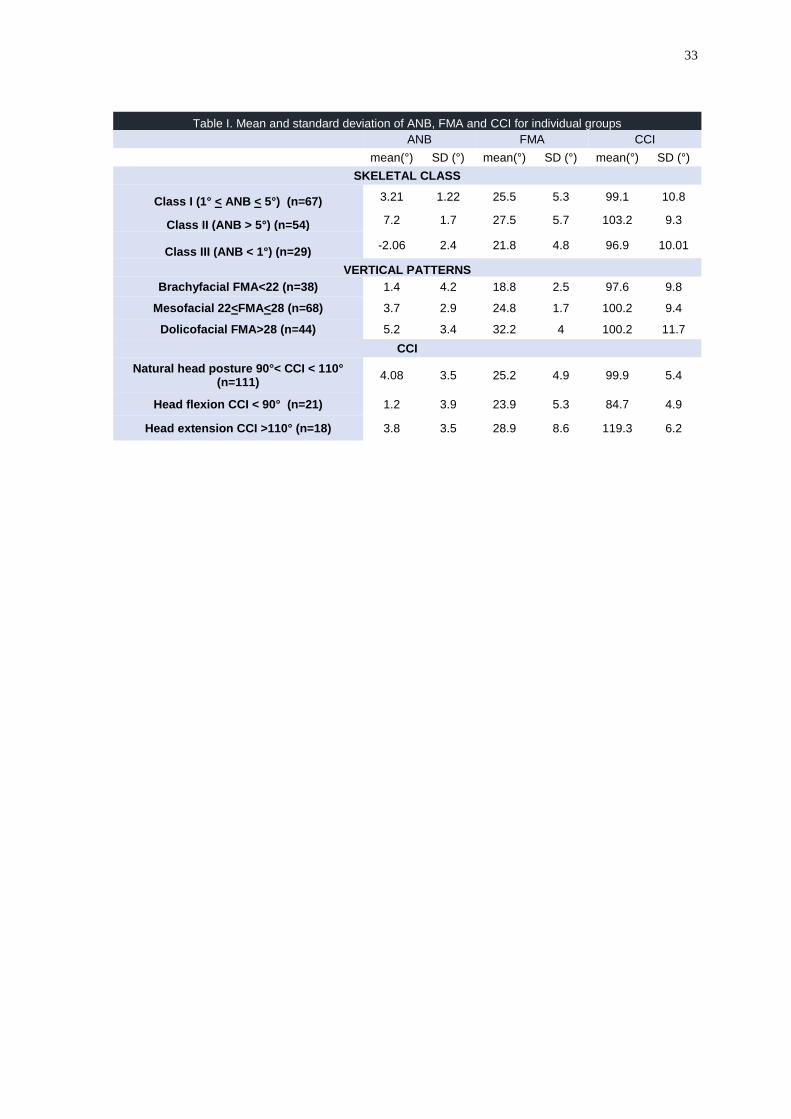
Table I. Mean and standard deviation of ANB, FMA and CCI for individual groups
ANB FMA CCI mean(°) SD (°) mean(°) SD (°) mean(°) SD (°)
SKELETAL CLASS
Class I (1° < ANB < 5°) (n=67) 3.21 1.22 25.5 5.3 99.1 10.8
Class II (ANB > 5°) (n=54) 7.2 1.7 27.5 5.7 103.2 9.3
Class III (ANB < 1°) (n=29) -2.06 2.4 21.8 4.8 96.9 10.01
VERTICAL PATTERNS
Brachyfacial FMA<22 (n=38) 1.4 4.2 18.8 2.5 97.6 9.8
Mesofacial 22<FMA<28 (n=68) 3.7 2.9 24.8 1.7 100.2 9.4
Dolicofacial FMA>28 (n=44) 5.2 3.4 32.2 4 100.2 11.7
CCI
Natural head posture 90°< CCI < 110° (n=111)
4.08 3.5 25.2 4.9 99.9 5.4
Head flexion CCI < 90° (n=21) 1.2 3.9 23.9 5.3 84.7 4.9
Head extension CCI >110° (n=18) 3.8 3.5 28.9 8.6 119.3 6.2

34
B1
n(%)
B2
n(%)
B3
n(%)
B4
n(%)
Chi-
Square
p value
B1
n(%)
B2
n(%)
B3
n(%)
B4
n(%)
Chi-
Square
p value
B1
n(%)
B2
n(%)
B3
n(%)
B4
n(%)
Chi-
Square
p value
B1
n(%)
B2
n(%)
B3
n(%)
B4
n(%)
Chi-
Square
p value
142 (94.7) 8 (5.3) 0 0 9 (6) 121 (80.7) 20 (13.3) 0 1 (0.7) 46 (30.7) 99 (66) 4 (2.7) 0 12 (8) 116 (77.3) 22 (14.7)
Children with
mixed dentition (6-
11years) (n=30)
29 (96.7) 1 (3.3) 0 0 4 (13.3) 21 (70) 5 (16.7) 0 0 14 (46.7) 15 (50) 1 (3.3) 0 3 (10) 25 (83.3) 2 (6.7)
Children with
permanet dentition
(12-16 years)
(n=74)
68 (91.9) 6 (8.1) 0 0 3 (4.1) 61 (82.4) 10 (13.5) 0 1 (1.4) 23 (31.1) 49 (66.2) 1 (1.4) 0 8 (10.8) 58 (78.4) 8 (10.8)
Adults (older than
16 years) (n=46)45 (97.8) 1 (2.2) 0 0 2 (4.3) 39 (84.8) 5 (10.9) 0 0 9 (19,6) 35 (76.1) 2 (4.3) 0 1 (2.2) 33 (71.7) 12 (26.1)
Male (n=69) 66 (95.7) 3 (4.3) 0 0 2 (2.9) 54 (78.3) 13 (18.8) 0 0 13 (18.8) 53 (76.8) 3 (4.3) 0 5 (7.2) 49 (71) 15 (21.7)
Female (n=81) 76 (93.8) 5 (6.2) 0 0 7 (8.6) 67 (82.7) 7 (8.6) 0 1 (1.2) 33 (40.7) 46 (56.8) 1 (1.2) 0 7 (8.6) 67 (82.7) 7 (8.6)
Class I
(1° < ANB < 5°)
(n=67)
64 (95.5) 3 (4.5) 0 0 4 (6) 49 (73.1) 14 (2.9) 0 0 18 (26.9) 47 (70.1) 2 (3) 0 6 (9) 47 (70.1) 10 (18.2)
Class II
(ANB > 5°) (n=54) 50 (92.6) 4 (7.4) 0 0 3 (5.6) 48 (88.9) 3 (5.6) 0 0 21 (38.9) 33 (61.1) 0 0 3 (5.6) 47 (87) 4 (7.4)
Class III
(ANB < 1°) (n=29) 28 (96.6) 1 (3.4) 0 0 2 (6.9) 24 (82.8) 3 (10.3) 0 1 (3.4) 7 (24.1) 19 (65.5) 2 (6,9) 0 3 (10.3) 22 (75.9) 4 (13.8)
Brachyfacial
FMA<22 (n=38)38 (100) 0 0 0 2 (5.3) 30 (78.9) 6 (15,8) 0 1 (2.6) 7 (18.4) 29 (76.3) 1 (2.6) 0 4 (10.5) 28 (73.7) 6 (15.8)
Mesofacial
22<FMA<28 (n=68)63 (92.6) 5 (7.4) 0 0 4 (5.9) 55 (80.9) 9 (13.2) 0 0 28 (41.2) 38 (55.9) 2 (2.9) 0 6 (8.8) 54 (79.4) 8 (11.8)
Dolicofacial
FMA>28 (n=44)41 (93.2) 3 (6.8) 0 0 3 (6.8) 36 (81.8) 5 (11.4) 0 0 11 (25) 32 (72.7) 1 (2.3) 0 2 (4.5) 34 (77.3) 8 (18.2)
Natural head
posture
90° < CCI < 110°
(n=111)
106 (95.49) 5 (4.5) 0 0 3 (2.7) 95 (85.58) 13 (11.71) 0 0 30 (27.02)77 (69.36) 4 (3.6) 0 7 (6.30) 85 (76.57)19 (17.11)
Head flexion
CCI < 90° (n=21)19 (90.47) 2 (9.5) 0 0 0 16 (76.19) 5 (23.80) 0 0 5 (23.8) 16 (76.19) 0 0 0 20 (95.23) 1 (0.90)
Head extension
CCI >110° (n=18)17 (94.44) 1 (5.55) 0 0 6 (33.33)10 (55.55) 2 (11.11) 0 1 (5.55) 11 (61.11) 6 (33.33) 0 0 5 (27.77) 11 (61.11) 2 (11.11)
All Patients
Table II Frequencies of anterior structures in each anatomical region, for all patients and considering, age, sex, different skeletal class, vertical pattern and cranio cervical inclination (CCI)
Uvula Tip of the Epiglottis Vallecula Hyoid
Age
sex
0.321 0.358 0.219 0.054
0.237 0.982 0.137 0.751
CCI
0.643
0.620 0.08 0.016* 0.078
0.000* 0.005* 0.006*
Skeletal Class
0.683 0.164 0.130 0.238
Vertical Pattern

35
A1
n(%)
A2
n(%)
A3
n(%)
A4
n(%)
Chi-
Square p
value
A1
n(%)
A2
n(%)
A3
n(%)
A4
n(%)
Chi-
Square
p value
A1
n(%)A2 n(%) A3 n(%) A4 n(%)
Chi-
Square
p value
A1
n(%)
A2
n(%)
A3
n(%)
A4
n(%)
Chi-
Square
p value
150 (100) 0 0 0 6(4) 136(90.7) 8(5.3) 0 0 20(13.3) 95(63.3) 35(23.4) 0 0 7(4.7) 143(95.4)
Children with
mixed dentition (6-
11years) (n=30)
30 (100) 0 0 0 1 (3.3) 26 (86.7) 3 (10) 0 0 5 (16.7) 13 (43.3) 12 (40) 0 0 2 (6.7) 28 (93.3)
Children with
permanet dentition
(12-16 years)
(n=74)
74 (100) 0 0 0 5 (6.8) 66 (89.2) 3 (4.1) 0 0 10 (13.5) 51 (68.9) 13 (17.6) 0 0 2 (2.7) 72 (97.3)
Adults (older than
16 years) (n=46)46 (100) 0 0 0 0 44 (95.7) 2 (4.3) 0 0 5 (10.9) 31 (67,4) 10 (21.7) 0 0 3 (6.5) 43 (93.5)
Male (69) 69 (100) 0 0 0 2 (2.9) 66 (95.7) 1 (1.4) 0 0 14 (20.3) 45 (65.2) 10 (14.5) 0 0 6 (8.7) 63 (91.3)
Female (81) 81 (100) 0 0 0 4 (4.9) 70 (86.4) 7 (8.6) 0 0 6 (7.4) 50 (61.7) 25 (30.9) 0 0 1 (1.2) 80 (98.8)
Class I
(1° < ANB < 5°)
(n=67)
67 (100) 0 0 0 2 (3) 61 (91) 4 (6) 0 0 12 (17.9) 42 (62.7) 13 (9.4) 0 0 4 (6) 63 (94)
Class II
(ANB > 5°) (n=54) 54 (100) 0 0 0 3 (5.6) 48 (88.9) 3 (5.6) 0 0 5 (9.3) 36 (66.7) 13 (24.1) 0 0 0 54 (100)
Class III
(ANB < 1°) (n=29) 29 (100) 0 0 0 1 (3.4) 27 (93,1) 1 (3.4) 0 0 3 ( 10.3) 17 (58.6) 9 (31) 0 0 3 (10.3) 26 (89.7)
Brachyfacial
FMA<22 (n=38)38 (100) 0 0 0 0 36 (94.7) 2 (5.3) 0 0 5 (13.2) 25 (65.8) 8 (21.1) 0 0 2 (5.3) 36 (94.8)
Mesofacial
22<FMA<28 (n=68)68(100) 0 0 0 3 (4.4) 61 (89.7) 4 (5.9) 0 0 8 (11.8) 42 (61.8) 18 (26.5) 0 0 4 (5.9) 64 (94.1)
Dolicofacial
FMA>28 (n=44)44 (100) 0 0 0 3 (6.8) 39 (88.6) 2 (4.5) 0 0 7 (15.9) 28 (63.6) 9 (20,5) 0 0 1 (2.3) 43 (97.7)
Natural head
posture
90° < CCI < 110°
(n=111)
111 (100) 0 0 0 4 (3.6) 104 (93.6) 3 (2.7) 0 0 14 (12.6) 78 (70.27) 19 (17.1) 0 0 6 (5.4) 105 (95.59)
Head flexion
CCI < 90° (n=21)21 (100) 0 0 0 1 (4,7) 20 (95.2) 0 0 0 4 (19.04) 12 (57.14) 5 (23.8) 0 0 0 21 (100)
Head extension
CCI >110° (n=18)18 (100) 0 0 0 1 (5.5) 12 (66.66) 5 (27.7) 0 0 2 (11.11) 5 (27.77) 11 (61.11) 0 0 1 (5.5) 17 (94.44)
C1 C2 C3 C4
Table III Frequencies of posterior structures in each anatomical region, for all patients and considering, age, sex, different skeletal class, vertical pattern and cranio cervical inclination (CCI)
All Patients
Age
sex
- 0.286 0.116 0.531
Skeletal Class
Vertical Patterns
- 0.625 0.816 0.549
- 0.937 0.507 0.082
- 0.113 0.011* 0.037*
- 0.000* 0.000* 0.183
CCI
36
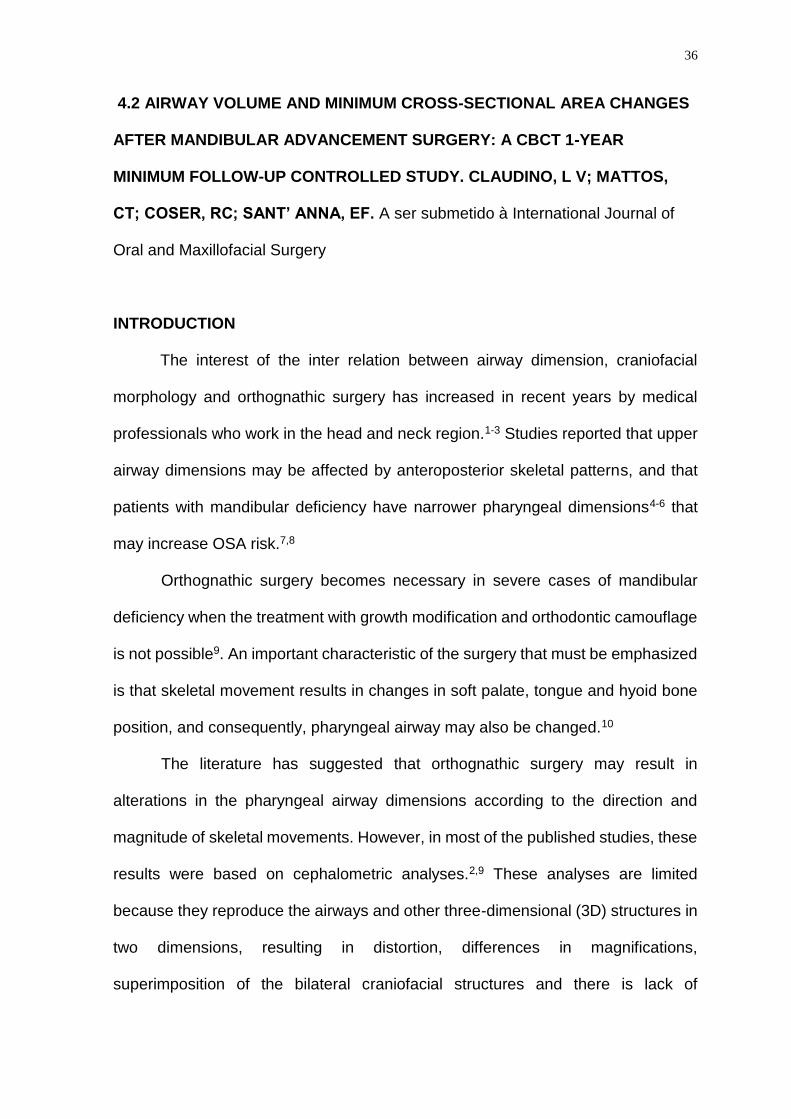
4.2 AIRWAY VOLUME AND MINIMUM CROSS-SECTIONAL AREA CHANGES
AFTER MANDIBULAR ADVANCEMENT SURGERY: A CBCT 1-YEAR
MINIMUM FOLLOW-UP CONTROLLED STUDY. CLAUDINO, L V; MATTOS,
CT; COSER, RC; SANT’ ANNA, EF. A ser submetido à International Journal of
Oral and Maxillofacial Surgery
INTRODUCTION
The interest of the inter relation between airway dimension, craniofacial
morphology and orthognathic surgery has increased in recent years by medical
professionals who work in the head and neck region.1-3 Studies reported that upper
airway dimensions may be affected by anteroposterior skeletal patterns, and that
patients with mandibular deficiency have narrower pharyngeal dimensions4-6 that
may increase OSA risk.7,8
Orthognathic surgery becomes necessary in severe cases of mandibular
deficiency when the treatment with growth modification and orthodontic camouflage
is not possible9. An important characteristic of the surgery that must be emphasized
is that skeletal movement results in changes in soft palate, tongue and hyoid bone
position, and consequently, pharyngeal airway may also be changed.10
The literature has suggested that orthognathic surgery may result in
alterations in the pharyngeal airway dimensions according to the direction and
magnitude of skeletal movements. However, in most of the published studies, these
results were based on cephalometric analyses.2,9 These analyses are limited
because they reproduce the airways and other three-dimensional (3D) structures in
two dimensions, resulting in distortion, differences in magnifications,
superimposition of the bilateral craniofacial structures and there is lack of

37
information about cross-sectional area and volume.11-13 Recently, cone-beam
computed tomography (CBCT) has been extensively studied, providing 3D
reconstruction and allowing visualization of areas of interest in various planes. It
also enables reliable linear, cross-sectional area (CSA), and volumetric assessment
of the upper airways when based on well-defined parameters4,11,14.
Christovam et al.3 published a systematic review concerning the effect of
different types of orthognathic surgery on the dimensions of the upper airways using
three-dimensional images. The results indicate that there is moderate evidence to
conclude that the upper airway minimum CSA and volume increase significantly
after maxillomandibular advancement. However, it is not well established if this
effect in airway dimensions also occurs after mandibular advancement without
maxillary advancement due to the small number of studies, and if it is permanent.
In this sense, the aim of this study is to analyze in CBCT, airway volume and
minimum cross-sectional area in a postsurgical follow up period in patients with
mandibular deficiency and to compare these results with a control group of Class I
patients.
MATERIAL AND METHODS
This prospective study was approved by the Ethics in research of the Institute
of Collective Health Studies from Universidade Federal do Rio de Janeiro in Brazil.
All patients signed a consent form.
A sample size calculation was performed based on the mean standard
deviation (SD=28mm2) from a previous study15. A sample size of least 14 patients
in each group would be necessary to detect differences of 30mm2 in the minimum

38
CSA, with a test power of 0.80 (α=0.05). The formula used was described by
Pandis16.
The experimental group was composed by 14 patients (5 man, 9 woman)
with mean age of 29.03 years (range 17.08-44.42 years) in the pre-surgical phase.
The following inclusion criteria were used in sample selection for the experimental
group: patients being submitted orthodontic treatment; planning of mandibular
advancement surgery to correct discrepancy between bone bases; in pre-surgical
phase in Pedro Ernesto University Hospital from Universidade do Estado do Rio de
Janeiro, Brazil; and good health conditions. Exclusion criteria were: cleft lip and
palate; syndrome or craniofacial disorders and previous craniofacial surgeries. Eight
patients were also submitted to maxillary surgery in addition to mandibular
advancement and/or genioplasty. Nonetheless, there were no planned
anteroposterior movement in the maxilla for any of the patients included.
The control group was composed by 14 initial CBCT scans of skeletal Class
I patients (6 man and 8 woman) with mean age of 26.28 years (range 19-40 years)
recruited from the database of pretreatment records from the orthodontic clinic of
the postgraduate program in Universidade Federal do Rio de Janeiro. The CBCTs
scans used were requested as part of the initial records when necessary for
diagnosis and planning of orthodontic treatment. No patient of this group was
submitted to CBCT exam for this research. The following inclusion criteria were used
in control sample selection: skeletal Class I pattern; DICOM file; no previous
orthodontic treatment or other treatment that might interfere with the natural course
of maxillomandibular growth and development and good health conditions.
The tomographic exams were requested for experimental groups in three
times: pre-surgical (T1, n=14), post-surgical (T2, n=13) – at least one month after
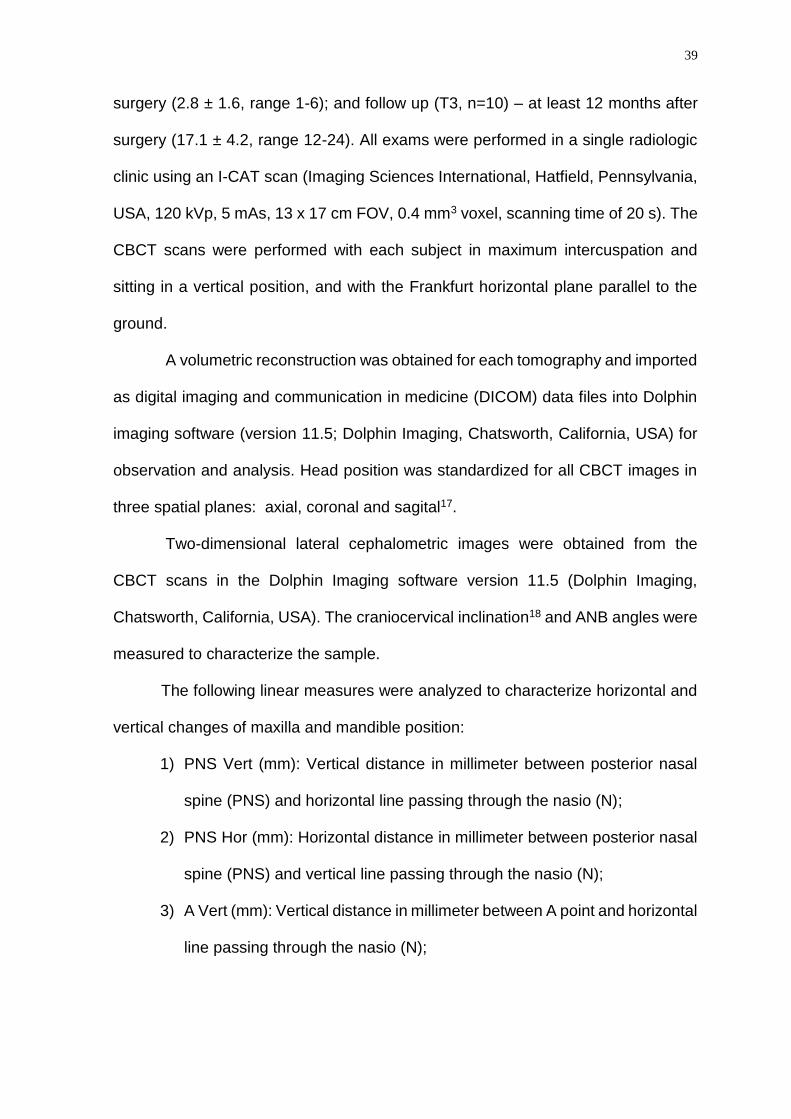
39
surgery (2.8 ± 1.6, range 1-6); and follow up (T3, n=10) – at least 12 months after
surgery (17.1 ± 4.2, range 12-24). All exams were performed in a single radiologic
clinic using an I-CAT scan (Imaging Sciences International, Hatfield, Pennsylvania,
USA, 120 kVp, 5 mAs, 13 x 17 cm FOV, 0.4 mm3 voxel, scanning time of 20 s). The
CBCT scans were performed with each subject in maximum intercuspation and
sitting in a vertical position, and with the Frankfurt horizontal plane parallel to the
ground.
A volumetric reconstruction was obtained for each tomography and imported
as digital imaging and communication in medicine (DICOM) data files into Dolphin
imaging software (version 11.5; Dolphin Imaging, Chatsworth, California, USA) for
observation and analysis. Head position was standardized for all CBCT images in
three spatial planes: axial, coronal and sagital17.
Two-dimensional lateral cephalometric images were obtained from the
CBCT scans in the Dolphin Imaging software version 11.5 (Dolphin Imaging,
Chatsworth, California, USA). The craniocervical inclination18 and ANB angles were
measured to characterize the sample.
The following linear measures were analyzed to characterize horizontal and
vertical changes of maxilla and mandible position:
1) PNS Vert (mm): Vertical distance in millimeter between posterior nasal
spine (PNS) and horizontal line passing through the nasio (N);
2) PNS Hor (mm): Horizontal distance in millimeter between posterior nasal
spine (PNS) and vertical line passing through the nasio (N);
3) A Vert (mm): Vertical distance in millimeter between A point and horizontal
line passing through the nasio (N);

40
4) A Hor (mm): Horizontal distance in millimeter between A point and vertical
line passing through the nasio (N);
5) B Vert (mm): Vertical distance in millimeter between B point and horizontal
line passing through the nasio (N);
6) B Hor (mm): Horizontal distance in millimeter between B point and vertical
line passing through the nasio (N);
7) Me Vert (mm): Vertical distance in millimeter between mento (Me) point
and horizontal line passing through the nasio (N);
8) Me Hor (mm): Horizontal distance in millimeter between mento (Me) point
and vertical line passing through the nasio (N);
To determine hyoid position, the following cartesian coordinates were used,
considering N the origin point: X (latero-lateral), Y (vertical) and Z (antero-posterior).
The following regions of the pharyngeal airway were evaluated: total
pharyngeal airways, velopharynx and oropharynx. For total pharyngeal airways, the
upper limit was defined in the sagittal view by a plane parallel to the Frankfurt plane
that intersected the lower point in the first cervical vertebra, and the lower limit was
a plane parallel to the Frankfurt plane that intersected the lower and most anterior
point in the third cervical vertebra. The velopharynx presented the same upper limit
described above and as the lower limit, a plane parallel to the Frankfurt plane that
intersected the uvula. The upper limit of the oropharynx was the lower limit of
Velopharynx and the lower limit was a plane parallel to the Frankfurt plane that
intersected the lower and most anterior point in the third cervical vertebra according
to methodology described by Grauer et al.19 and Brasil et al.20 adapted for this study.
(Figure 1).

41
The volumes and minimum cross-sectional areas were measured with the
tool for airway volume calculation in the 3-dimensional mode of the Dolphin Imaging
software in the 73 threshold values as proposed by Alves et al.21 The limits for each
portion of interest were defined in the sagittal slice, and the software automatically
calculated the total volume and the most constricted airway area (minimum cross-
sectional area-CSA) in the region previously set.
All measurements were repeated in 35% of the CBCT scans after a 2-week
interval. Calibration of the operator was tested with the intraclass correlation
coefficient.
A descriptive analysis, including mean and standard deviation, was
performed for all quantitative variables. The Kolmogorov-Smirnov test was applied
to assess the normality of the data. One-way ANOVA of repeated measures with
Bonferroni correction was used to verify whether there were statistically significant
differences (p<0.05) among the exams in the different time periods (T1, T2 and T3).
Additionally, statistically significant differences (p <0.05) between each time period
(T1, T2 and T3) and the control group values were evaluated and the Benjamini-
Hochberg correction was used to adjust the p value for multiple comparisons.
Correlation between changes in upper airway dimensions and horizontal
distance between B point to Nasio were evaluated by Pearson's correlation
coefficient.
RESULTS
The intraclass correlation coefficient results were higher than 0.95 for all
variables assessed; this confirmed the calibration of the operator.

42
Table I characterizes the sample, showing the descriptive statistics for age,
ANB angle, and CCI angle for each time period (T1, T2 and T3). Intragroup
comparison among time periods is presented and each of these values was also
compared with the same measurement in the unique time period of the control
group. Statistically significant differences (p<0.05) were observed for ANB among
all time periods and compared to the control and for initial CCI measures compared
to the other time periods and with the control group.
Table II presents linear measures that characterize the movement decorrent
of the orthognathic surgery in the maxilla, mandible and hyoid bones. There were
statistically significant horizontal anteroposterior changes in the mandible (points B
and Me) and in the hyoid bones, which was maintained or even greater after the
longest follow-up.
Table III shows the changes in PAV and minimum CSA. A significant
(p<0.05) increase was seen in total PAV and these changes were stable in the
follow-up period, however, no statistically significant changes were observed for the
velopharynx and oropharynx volume. The minimum CSA increased after surgery
and additionally after follow-up and this difference between final follow-up and pre-
surgical values was significant when the total region and the subregions were
analyzed. No area measurement between experimental and control groups
presented statistically significant differences.
Table IV shows the correlation between changes in volume and minimum
cross-sectional area of the pharyngeal airway, and the anteroposterior horizontal
distance between B point and Hyoid and a vertical line passing through Nasio. A
negative correlation was observed between the pharyngeal volume (ρ =-0.44,
p=0.01) and cross-sectional area (ρ=-0.36, p=0.04) changes and hyoid

43
anteroposterior displacement. That means that anteroposterior displacements of the
hyoid bone in the anterior direction tended to be accompanied by increases in
pharyngeal airway dimensions.
DISCUSSION
Previous studies suggest that orthognathic surgery used for dentofacial
deformity treatment may increase pharyngeal airway space with
advancements2,9,15,22-25, benefiting patients with narrow airways who are
predisposed to OSAs risk7,8. However, the stability of this gain is controversial26.
Our study aimed to analyze airway dimensional changes in a post-surgical
follow up period in patients submitted to mandibular advancement surgery.
Many studies have been performed to evaluate changes of upper airway after
orthognathic surgery in CBCT. Nevertheless, most of these studies did not assess
a post-surgical follow up period15,23,24. In our study, the post-surgical CBCT scans
were requested for experimental groups in two times as follow: T2-at least one
month after surgery, this was done to allow the subside of the initial oedema27,28 that
could have interfered in the pharyngeal airway measurement; and T3- at least 12
months after surgery to evaluate stability. Previous studies assumed stable soft
tissue volume after 6 months29. However, oedema may be clinically observed in
some patients in this period. In our study, we decided use at least 1-year
postoperative to evaluate stability, assuming no persistent swelling after 12
months.28
For characterization of the sample we measured ANB and CCI angles. The
ANB angle is a good reference used to determine the relationship between the
maxilla and the mandible and it has often been used.30,31 In this study, statistically

44
significant decrease was observed for ANB angle between T1 and T2 time period
(T1-7.5º; T2-4.1º and T3-4.6º), evidencing the anteroposterior ortho-surgical
correction and its stability. Nevertheless, the ANB angle approaches but does not
match the control group (ANB-1.7º).
For the CCI angle, statistically significant differences were observed between
T1 and other times intervals (T2 and T3), and between T1 and the control Group
(Table I). This difference could be justified by the fact that Class II patients tend to
exhibit a greater extension of the head than other groups32,33. After surgery, this
angle decreased in the experimental group and became similar to the values in the
control group. It is important to emphasize that the CCI angles values obtained for
all groups and times were not far from those defined by Muto et al18 for not interfering
in the airway volume (90º to 110º).
In this study, linear measures were performed in the sagittal plane to observe
vertical and horizontal changes in the maxilla, mandible, and hyoid promoted by
orthognathic surgery. Vertical changes were observed in the maxillary position as a
consequence of the surgery, and this movement may have favored the mandible
rotation counterclockwise. However, this difference was not statistically significant
after follow-up (T3). Additionally, no statistically significant differences were found
in PNS Hor, A vert and A Hor for the 3 times intervals. These results indicate that
the maxilla did not present significant changes after follow-up. On the other hand, a
statistically significant horizontal change was observed in the mandible, which
remained stable after a minimum of 1-year follow-up.
The hyoid bone underwent an expressive change in its anteroposterior
position (Hyoid Z), resulting in a forward movement in the follow-up. Similar results
were found by Jiang et al9, who observed that the hyoid bone moved superiorly and

45
forward after surgery in the mandibular advancement group, and the movement was
stable at a post-surgical follow up period.
The velopharynx and oropharynx volume increased and approximated those
observed in the control group. These changes were not statistically significant.
However, these results were clinically expressive as can be seen in Table III. These
results may be due to the reduced sample. Significant increase in PAV after
mandibular advancement surgery were observed in studies that used lager
samples. However, these studies did not have a control group and a long post-
surgical follow up period 15,24.
The pharyngeal airway cross-sectional area is an important parameter to
predict pharyngeal airway dimension and may be correlated with obstructive sleep
apnea syndrome and its gravity.34 In our study, a statistically significant increase of
minimum cross-sectional area was observed and that remained stable in the follow-
up period. These results corroborate with the findings of others researches.23-25
Most of these studies that assessed the pharyngeal airway changes after
mandibular advancement did not compare these results with a control group. In our
study, a control group composed by Class I patients without mandibular deficiency
was formed and used as a normality pattern. Our results showed that PAV and
minimum CSA increased and approximated those observed in the control group.
A moderate negative correlation was observed between PAV and CSA
changes and hyoid anteroposterior displacement. These results indicate that the
bigger the change in hyoid anteroposterior position, the greater the pharyngeal
airway CSA area and volume.
A limitation of this investigation was the drops outs that occurred in the
sample. One patient did not return for the post-surgical exam (only for the follow-up)

46
and four patients were lost in the follow-up period. However, it is a limitation of the
prospective studies.
In conclusion, this present study showed that there were increased in linear
dimensions in sagittal plane for the mandible after orthognathic surgery. The hyoid
bone underwent a forward movement, this movement was stable during the time
and presented a negative moderate correlation with pharyngeal cross-sectional
area and volume. Regarding pharyngeal airway evaluation, the greatest increase
was see in pharyngeal airway total volume and cross-sectional area and this change
was stable in a follow up period.
The knowledge about the influence of mandibular advancement surgery on
pharyngeal dimensions may act as a useful guide for surgeon and orthodontists to
indicate modifications in pharyngeal minimal cross-sectional area when planning
orthognathic treatment.
REFERENCES
1. Guijarro-Martinez R, Swennen GRJ. Cone-beam computerized tomography imaging and analysis of the upper airway: a systematic review of the literature. International Journal of Oral and Maxillofacial Surgery 2011;40:1227-1237. 2. Mattos CT, Vilani GN, Sant'Anna EF, Ruellas AC, Maia LC. Effects of orthognathic surgery on oropharyngeal airway: a meta-analysis. Int J Oral Maxillofac Surg 2011;40:1347-1356. 3. Christovam IO, Lisboa CO, Ferreira DM, Cury-Saramago AA, Mattos CT. Upper airway dimensions in patients undergoing orthognathic surgery: a systematic review and meta-analysis. Int J Oral Maxillofac Surg 2016;45:460-471. 4. Claudino LV, Mattos CT, Ruellas ACD, Anna EFS. Pharyngeal airway characterization in adolescents related to facial skeletal pattern: A preliminary study. American Journal of Orthodontics and Dentofacial Orthopedics 2013;143:799-809. 5. Cabral M, de Queiroz Ribeiro LR, Cardeal CM, Bittencourt MA, Crusoe-Rebello IM, Souza-Machado A. Evaluation of the oropharynx in class I and II skeletal patterns by CBCT. Oral Maxillofac Surg 2017;21:27-31.

47
6. Zheng ZH, Yamaguchi T, Kurihara A, Li HF, Maki K. Three-dimensional evaluation of upper airway in patients with different anteroposterior skeletal patterns. Orthodontics & Craniofacial Research 2014;17:38-48. 7. Shigeta Y, Enciso R, Ogawa T, Shintaku WH, Clark GT. Correlation between retroglossal airway size and body mass index in OSA and non-OSA patients using cone beam CT imaging. Sleep and Breathing 2008;12:347-352. 8. Walsh JH, Leigh MS, Paduch A, Maddison KJ, Philippe DL, Armstrong JJ et al. Evaluation of pharyngeal shape and size using anatomical optical coherence tomography in individuals with and without obstructive sleep apnoea. J Sleep Res 2008;17:230-238. 9. Jiang C, Yi Y, Fang S, Wang J. Pharyngeal Airway Space and Hyoid Bone Positioning After Different Orthognathic Surgeries in Skeletal Class II Patients. J Oral Maxillofac Surg 2017. 10. Lye KW. Effect of orthognathic surgery on the posterior airway space (PAS). Ann Acad Med Singapore 2008;37:677-682. 11. Aboudara C, Nielsen I, Huang JC, Maki K, Miller AJ, Hatcher D. Comparison of airway space with conventional lateral headfilms and 3-dimensional reconstruction from cone-beam computed tomography. Am J Orthod Dentofacial Orthop 2009;135:468-479. 12. Bronoosh P, Khojastepour L. Analysis of Pharyngeal Airway Using Lateral Cephalogram vs CBCT Images: A Cross-sectional Retrospective Study. Open Dent J 2015;9:263-266. 13. Lenza MG, Lenza MMD, Dalstra M, Melsen B, Cattaneo PM. An analysis of different approaches to the assessment of upper airway morphology: a CBCT study. Orthodontics & Craniofacial Research 2010;13:96-105. 14. Weissheimer A, Menezes LM, Sameshima GT, Enciso R, Pham J, Grauer D. Imaging software accuracy for 3-dimensional analysis of the upper airway. Am J Orthod Dentofacial Orthop 2012;142:801-813. 15. Marcussen L, Stokbro K, Aagaard E, Torkov P, Thygesen T. Changes in Upper Airway Volume Following Orthognathic Surgery. J Craniofac Surg 2017;28:66-70. 16. Pandis N. Sample calculations for comparison of 2 means. Am J Orthod Dentofacial Orthop 2012;141:519-521. 17. Cevidanes L, Oliveira AE, Motta A, Phillips C, Burke B, Tyndall D. Head orientation in CBCT-generated cephalograms. Angle Orthod 2009;79:971-977. 18. Muto T, Takeda S, Kanazawa M, Yamazaki A, Fujiwara Y, Mizoguchi I. The effect of head posture on the pharyngeal airway space (PAS). Int J Oral Maxillofac Surg 2002;31:579-583.

48
19. Grauer D, Cevidanes LSH, Styner MA, Ackerman JL, Proffit WR. Pharyngeal airway volume and shape from cone-beam computed tomography: Relationship to facial morphology. American Journal of Orthodontics and Dentofacial Orthopedics 2009;136:805-814. 20. Brasil DM, Kurita LM, Groppo FC, Haiter-Neto F. Relationship of craniofacial morphology in 3-dimensional analysis of the pharynx. American Journal of Orthodontics and Dentofacial Orthopedics 2016;149:683. 21. Alves M, Jr., Baratieri C, Mattos CT, Brunetto D, Fontes Rda C, Santos JR et al. Is the airway volume being correctly analyzed? Am J Orthod Dentofacial Orthop 2012;141:657-661. 22. Goncales ES, Duarte MA, Palmieri C, Jr., Zakhary GM, Ghali GE. Retrospective analysis of the effects of orthognathic surgery on the pharyngeal airway space. J Oral Maxillofac Surg 2014;72:2227-2240. 23. Kochar GD, Chakranarayan A, Kohli S, Kohli VS, Khanna V, Jayan B et al. Effect of surgical mandibular advancement on pharyngeal airway dimensions: a three-dimensional computed tomography study. International Journal of Oral and Maxillofacial Surgery 2016;45:553-559. 24. Kochel J, Meyer-Marcotty P, Sickel F, Lindorf H, Stellzig-Eisenhauer A. Short-term pharyngeal airway changes after mandibular advancement surgery in adult Class II-Patients-a three-dimensional retrospective study. Journal of Orofacial Orthopedics-Fortschritte Der Kieferorthopadie 2013;74:137-152. 25. Raffaini M, Pisani C. Clinical and cone-beam computed tomography evaluation of the three-dimensional increase in pharyngeal airway space following maxillo-mandibular rotation-advancement for Class II-correction in patients without sleep apnoea (OSA). J Craniomaxillofac Surg 2013;41:552-557. 26. Chang MK, Sears C, Huang JC, Miller AJ, Kushner HW, Lee JS. Correlation of Airway Volume With Orthognathic Surgical Movement Using Cone-Beam Computed Tomography. Journal of Oral and Maxillofacial Surgery 2015;73:S67-S76. 27. Yamamoto S, Miyachi H, Fujii H, Ochiai S, Watanabe S, Shimozato K. Intuitive Facial Imaging Method for Evaluation of Postoperative Swelling: A Combination of 3-Dimensional Computed Tomography and Laser Surface Scanning in Orthognathic Surgery. J Oral Maxillofac Surg 2016;74:2506.e2501-2506.e2510. 28. van der Vlis M, Dentino KM, Vervloet B, Padwa BL. Postoperative swelling after orthognathic surgery: a prospective volumetric analysis. J Oral Maxillofac Surg 2014;72:2241-2247. 29. Kau CH, Cronin A, Durning P, Zhurov AI, Sandham A, Richmond S. A new method for the 3D measurement of postoperative swelling following orthognathic surgery. Orthod Craniofac Res 2006;9:31-37.

49
30. Hart PS, McIntyre BP, Kadioglu O, Currier GF, Sullivan SM, Li J et al. Postsurgical volumetric airway changes in 2-jaw orthognathic surgery patients. Am J Orthod Dentofacial Orthop 2015;147:536-546. 31. Hong JS, Oh KM, Kim BR, Kim YJ, Park YH. Three-dimensional analysis of pharyngeal airway volume in adults with anterior position of the mandible. American Journal of Orthodontics and Dentofacial Orthopedics 2011;140:E161-E169. 32. Liu Y, Sun X, Chen Y, Hu M, Hou X, Liu C. Relationships of sagittal skeletal discrepancy, natural head position, and craniocervical posture in young Chinese children. Cranio 2016:1-8. 33. D'Attilio M, Caputi S, Epifania E, Festa F, Tecco S. Evaluation of cervical posture of children in skeletal class I, II, and III. Cranio 2005;23:219-228. 34. Enciso R, Nguyen M, Shigeta Y, Ogawa T, Clark GT. Comparison of cone-beam CT parameters and sleep questionnaires in sleep apnea patients and control subjects. Oral Surg Oral Med Oral Pathol Oral Radiol Endod 2010;109:285-293.
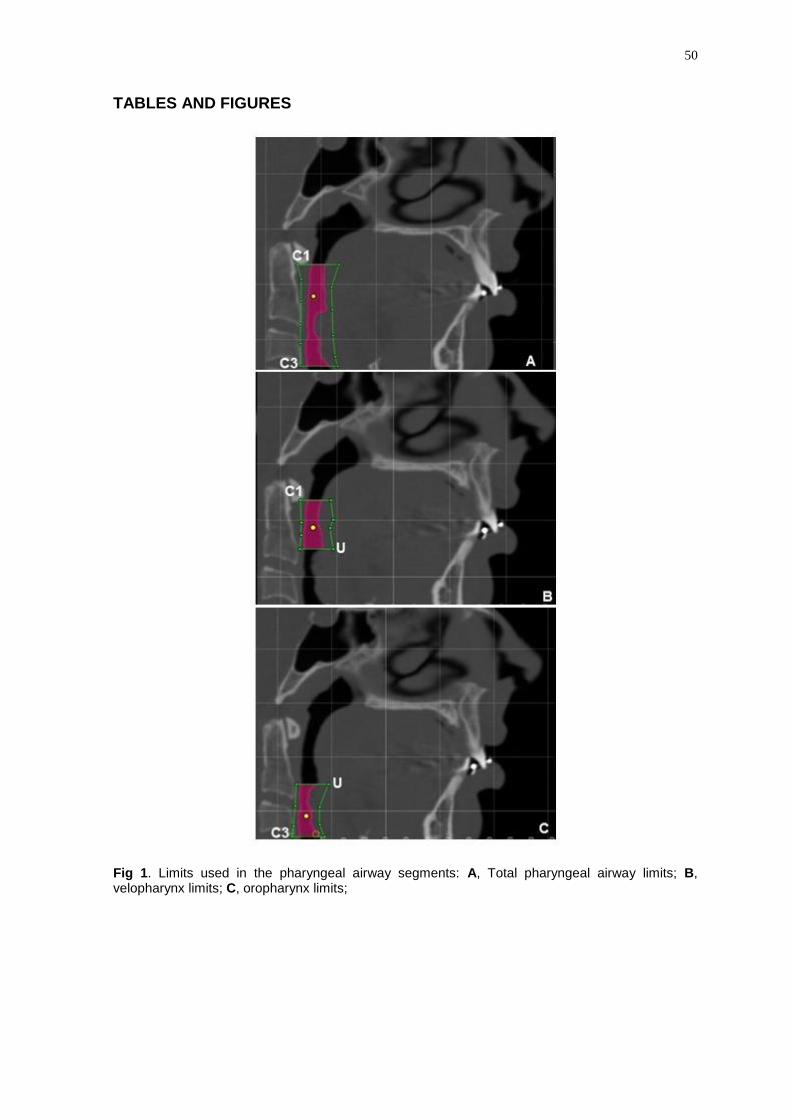
50
TABLES AND FIGURES
Fig 1. Limits used in the pharyngeal airway segments: A, Total pharyngeal airway limits; B, velopharynx limits; C, oropharynx limits;
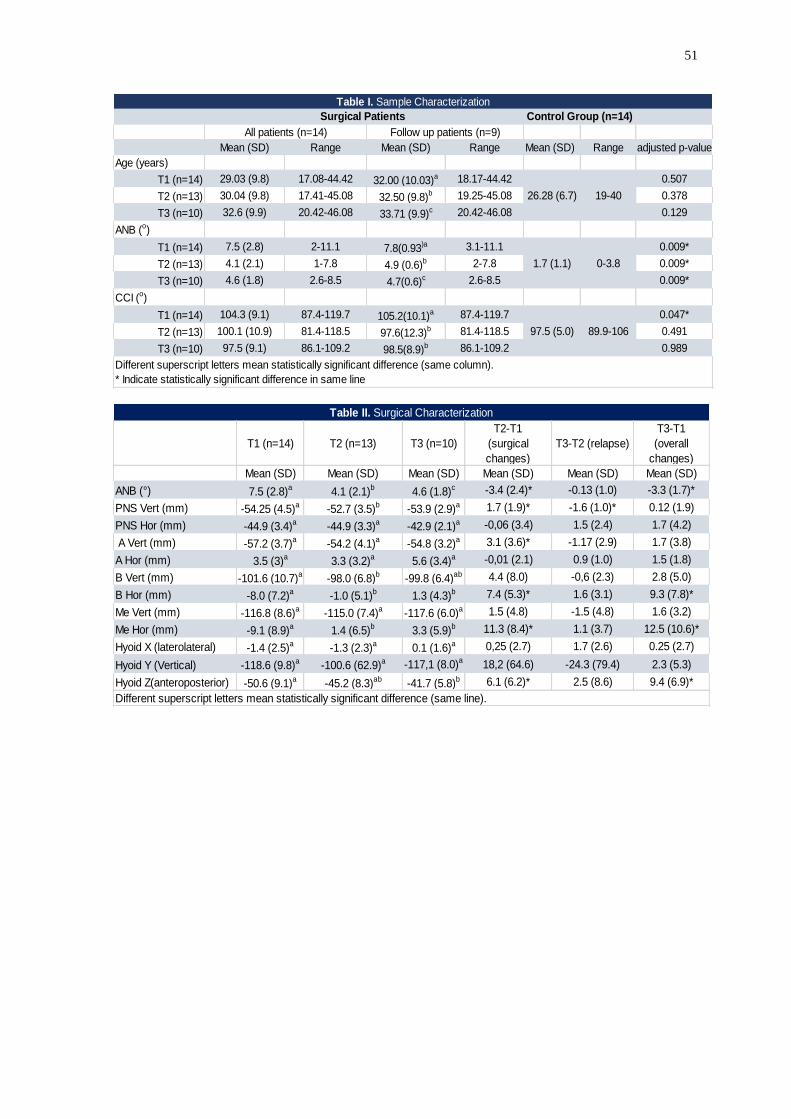
51
Mean (SD) Range Mean (SD) Range Mean (SD) Range adjusted p-value
Age (years)
T1 (n=14) 29.03 (9.8) 17.08-44.42 32.00 (10.03)a 18.17-44.42 0.507
T2 (n=13) 30.04 (9.8) 17.41-45.08 32.50 (9.8)b 19.25-45.08 0.378
T3 (n=10) 32.6 (9.9) 20.42-46.08 33.71 (9.9)c 20.42-46.08 0.129
ANB (o)
T1 (n=14) 7.5 (2.8) 2-11.1 7.8(0.93)a 3.1-11.1 0.009*
T2 (n=13) 4.1 (2.1) 1-7.8 4.9 (0.6)b 2-7.8 0.009*
T3 (n=10) 4.6 (1.8) 2.6-8.5 4.7(0.6)c 2.6-8.5 0.009*
CCI (o)
T1 (n=14) 104.3 (9.1) 87.4-119.7 105.2(10.1)a 87.4-119.7 0.047*
T2 (n=13) 100.1 (10.9) 81.4-118.5 97.6(12.3)b 81.4-118.5 0.491
T3 (n=10) 97.5 (9.1) 86.1-109.2 98.5(8.9)b 86.1-109.2 0.989
Different superscript letters mean statistically significant difference (same column).
* Indicate statistically significant difference in same line
Surgical Patients
All patients (n=14) Follow up patients (n=9)
Table I. Sample Characterization
Control Group (n=14)
26.28 (6.7) 19-40
1.7 (1.1) 0-3.8
97.5 (5.0) 89.9-106
T1 (n=14) T2 (n=13) T3 (n=10)
T2-T1
(surgical
changes)
T3-T2 (relapse)
T3-T1
(overall
changes)
Mean (SD) Mean (SD) Mean (SD) Mean (SD) Mean (SD) Mean (SD)
ANB (°) 7.5 (2.8)a 4.1 (2.1)b 4.6 (1.8)c -3.4 (2.4)* -0.13 (1.0) -3.3 (1.7)*
PNS Vert (mm) -54.25 (4.5)a -52.7 (3.5)b -53.9 (2.9)a 1.7 (1.9)* -1.6 (1.0)* 0.12 (1.9)
PNS Hor (mm) -44.9 (3.4)a -44.9 (3.3)a -42.9 (2.1)a -0,06 (3.4) 1.5 (2.4) 1.7 (4.2)
A Vert (mm) -57.2 (3.7)a -54.2 (4.1)a -54.8 (3.2)a 3.1 (3.6)* -1.17 (2.9) 1.7 (3.8)
A Hor (mm) 3.5 (3)a 3.3 (3.2)a 5.6 (3.4)a -0,01 (2.1) 0.9 (1.0) 1.5 (1.8)
B Vert (mm) -101.6 (10.7)a -98.0 (6.8)b -99.8 (6.4)ab 4.4 (8.0) -0,6 (2.3) 2.8 (5.0)
B Hor (mm) -8.0 (7.2)a -1.0 (5.1)b 1.3 (4.3)b 7.4 (5.3)* 1.6 (3.1) 9.3 (7.8)*
Me Vert (mm) -116.8 (8.6)a -115.0 (7.4)a -117.6 (6.0)a 1.5 (4.8) -1.5 (4.8) 1.6 (3.2)
Me Hor (mm) -9.1 (8.9)a 1.4 (6.5)b 3.3 (5.9)b 11.3 (8.4)* 1.1 (3.7) 12.5 (10.6)*
Hyoid X (laterolateral) -1.4 (2.5)a -1.3 (2.3)a 0.1 (1.6)a 0,25 (2.7) 1.7 (2.6) 0.25 (2.7)
Hyoid Y (Vertical) -118.6 (9.8)a -100.6 (62.9)a -117,1 (8.0)a 18,2 (64.6) -24.3 (79.4) 2.3 (5.3)
Hyoid Z(anteroposterior) -50.6 (9.1)a -45.2 (8.3)ab -41.7 (5.8)b 6.1 (6.2)* 2.5 (8.6) 9.4 (6.9)*
Table II. Surgical Characterization
Different superscript letters mean statistically significant difference (same line).

52
Control Group (n=14)
All patients Follow-up patients (n=9) Adjusted p-value
Total pharyngeal Volume Mean (SD) Increase (%) Mean (SD) Increase (%) Mean (SD)
T1 (n=14) 17546.1 (8740.8) 14945.5(5494.8)a 0.79
T2 (n=13) 19845.9(10019.7) 13.10 16447.1(6558.2)ab 10.04 0.19
T3 (n=10) 22133.8 (6509.8) 26.14 22028.3(6895.6)b 47.39 0.37
Velopharynx Volume
T1 (n=14) 10642.1(6844.7) 8751.1(5710.9)a 0.35
T2 (n=13) 11335.06 (6416.1) 6.5 10001.7(4942.0)a 14.29 0.19
T3 (n=10) 13876.4(4860.5) 30.39 13615.1(5080.2)a 55.58 0.33
Oropharynx Volume
T1 (n=14) 7197.7(3228.1) 6568.8(1852.4)a 0.17
T2 (n=13) 8913.8 (4838.2) 23.84 7040.5 (3364.2)a 7.18 0.30
T3 (n=10) 7967.2 (3341.1) 10.69 7948.9(3543.3)a 21.00 0.32
Control Group (n=14)
All patients Follow up patientes (n=9) Adjusted p-value
Total CSA Mean (SD) Increase (%) Mean (SD) Increase (%) Mean (SD)
T1 (n=14) 213.2 (144.4) 157.9 (64.4)a 0.82
T2 (n=13) 269.5 (169.5) 26.40 209.4 (85.0)ab 32.61 0.85
T3 (n=10) 263.5 (99.9) 24.5 261.2(105.7)b 65.42 0.76
velopharynx CSA
T1 (n=14) 334.5 (203.9) 268.2 (126.9)a 0.75
T2 (n=13) 394.7 (225.8) 17.99 321.7 (148.9)ab 19.94 0.86
T3 (n=10) 416.7 (133.6) 24.57 416.3 (141.7)b 55.21 0.88
Oropharynx CSA
T1 (n=14) 132.7 (136.0) 187.9(62.8)a 0.35
T2 (n=13) 294.7 (174.5) 122.07 214.5(85.8)ab 14.15 0.84
T3 (n=10) 267.5 (96.2) 101.58 264.9 (101.6)b 40.97 0.79
Different superscript letters mean statistically significant difference (same column).
Experimental Group
Pharyngeal CSA
Table III. Comparison between pharyngeal airway volume and axial area before(T1) and after orthognatic surgery in two follow-up times (T2 and T3)
and compared to control group
Experimental Group
23110.5 (6300.4)
Pharyngeal Volume
301.9 (121.5)
424.7 (121.4)
314.3 (131.6)
14157.5 (4296.4)
8714.4 (42661)
Correlation
Coefficient p value
Correlation
Coeffitient p value
Total -0.27 0.12 -0.43 0.81
Velopharynx -0,10 0.55 -0.40 0.83
Oropharynx -0.12 0.49 -0.44* 0.01
Total 0.031 0.86 -0.2 0.27
Velopharynx -0.16 0.37 -0.25 0.16
Oropharynx -0.14 0.41 -0.36* 0.04
Pharyngeal Volume
Pharyngeal CSA
B (Horizontal) Hyoid (Anteroposterior)
Table IV. Correlation between changes in upper airway dimensions and hozizontal
distance between B point to Nasio and Hyoid (anteroposterior) to Nasio

53
5 DISCUSSÃO
As vias aéreas faríngeas são uma estrutura complexa que tem sido
amplamente estudada por áreas do conhecimento como Cirurgia e Ortodontia.
Apesar da natureza dinâmica das vias aéreas, exames de imagens utilizados no
diagnóstico ortodôntico como as teleradiografias e TCFCs da cabeça são capazes
de fornecer informações relevantes sobre a morfologia desta estrutura em
determinado momento estático (Guijarro-Martinez e Swennen, 2011).
Neste sentido, a utilização da TCFC para avaliação das vias aéreas tem sido
crescente, já que esta tecnologia possibilita a avaliação da área de secção
transversa e volume desta estrutura, características que não podem ser avaliadas
em radiografias cefalométricas. Além disso, as TCFCs apresentam menor custo e
dose de radiação inferior às das tomografias computadorizadas convencionais.
Entretanto, uma das principais limitações metodológicas dos estudos que avaliam
as vias aéreas em TCFC é a falta de padronização no que se refere aos limites a
serem utilizados para definição desta complexa estrutura (Montgomery et al., 1979;
Hechler, 2008; Aboudara et al., 2009; Guijarro-Martinez e Swennen, 2011) .
Visando minimizar o erro sistemático resultante da falta de padronização
destes limites, o primeiro artigo teve como objetivo avaliar se existem diferenças
entre os limites anatômicos anteriores e posteriores utilizados para determinação

54
tridimensional das subdivisões das vias aéreas faríngeas (VAF) de acordo com a
idade, sexo , padrões esqueléticos horizontal e vertical, e inclinação da cabeça em
TCFC.
Nossos resultados mostraram que tanto as estruturas anteriores, como a
úvula e epiglote, quanto as estruturas posteriores, vertebras cervicais, poderiam ser
utilizadas como limites para avaliação das vias aéreas. Entretanto, estruturas
posteriores encontram-se sempre localizadas mais inferiormente quando
comparadas as estruturas anteriores e, em consequência, as sub-regiões
anatómicas definidas por esses pontos posteriores também apresentariam esta
característica.
Em determinados casos, sub-regiões mais inferiores como a hipofaringe são
de difícil avaliação, dependendo do tamanho do paciente, um maior campo de visão
(FOV) se faz necessário para que o ponto mais anteroinferior de C4 seja incluído
na tomografia (da Silva MB e Sant'Anna EF, 2013; Kau et al., 2005) e isso pode
requerer uma maior dose de radiação. Por esse motivo, não é recomendado o
aumento do FOV com o objetivo único de avaliar a hipofaringe. No presente estudo,
algumas tomografias foram excluídas do estudo por não englobarem toda região
da hipofaringe, até o ponto mais anteroinferior de C4.
Por outro lado, a utilização das vértebras cervicais poderia ser mais
apropriada em casos em que os pacientes tenham sido submetidos a algum tipo de
intervenção, como a cirurgia ortognática, tendo em vista que a posição de
estruturas como o palato mole, a língua e o osso hioide podem sofrer modificações
em seu posicionamento em decorrência da movimentação esquelética (Kim et al.,
2013; Efendiyeva et al., 2014; Li et al., 2014).

55
Abramson et al. (2009) objetivaram avaliar a associação entre a idade, sexo
e o tamanho e forma das vias aéreas utilizando imagens tridimensionais. Os
autores observaram uma correlação entre o tamanho das vias aéreas e a idade dos
pacientes, predominantemente durante os estágios da dentição decídua e
permanente, que correspondem aos períodos de significativo crescimento
somático. De forma semelhante, nossa amostra foi estratificada em faixas etárias
com o intuito de avaliar diferenças no posicionamento da úvula, ponta da epiglote,
valécula, hioide e vértebras cervicais em crianças em dentição mista, permanente
e em adultos. Entretanto, não foram observadas diferenças estatísticas entre as
frequências de localização das regiões anatômicas anteriores e posteriores em
relação à idade.
No presente estudo foi observado um dimorfismo sexual em relação a
posição da valécula, C3 e C4. Nos homens, a valécula esteve mais frequentemente
localizada em B3 (76,8%) seguida por B2 (18,8%). Nas mulheres, a localização da
valécula foi predominante in B3 (56,8%), mas com uma menor porcentagem que
nos homens, seguida por uma frequência relativamente alta em B2 (40,7%). Estes
resultados indicam que a valécula apresenta uma localização mais inferior nos
homens do que nas mulheres. Inversamente, C3 e C4 apresentam uma localização
mais superior nos homens do que nas mulheres.
Não foram observadas diferenças significativas entre a frequência de
localização das regiões anatômicas anteriores e posteriores nos diferentes tipos de
padrões esqueléticos, horizontal e vertical. Estes resultados sugerem que estes
limites podem ser utilizados, para todos os grupos, independentemente do tipo de
padrão esquelético, permitindo a comparação entre eles.

56
Entretanto, um dos principais aspectos que devem ser levados em
consideração para a avaliação da morfologia craniofacial e das vias aéreas
faríngeas do paciente é o correto posicionamento da cabeça durante a realização
da TCFC, principalmente em estudos longitudinais em que há análises com
sobreposição de imagens.
No presente estudo observou-se que a posição da epiglote, valécula, hioide,
C2 e C3 diferiram significativamente de acordo com a inclinação craniocervical.
Quanto maior o ângulo, maior a tendência das estruturas anteriores (epiglote,
valécula e hioide) estarem localizadas mais superiormente. Por outro lado, quanto
menor o ângulo, maior a tendência das estruturas posteriores (C2 e C3) estarem
localizadas mais superiormente. Estes resultados apontam para importância de se
padronizar o ângulo CCI para estabelecer estes limites.
O primeiro estudo justifica-se pela necessidade de determinação de limites
adequados para a avaliação do volume e área de secção transversa mínima das
vias aéreas faríngeas. Estabelecendo-se limites adequados para avaliação das vias
aéreas, o segundo estudo teve como objetivo avaliar a área de secção transversa
mínima e o volume das vias aéreas faríngeas de pacientes submetidos a cirurgia
de avanço mandibular em um período de acompanhamento de no mínimo um ano.
No segundo artigo, as vias aéreas faríngeas foram avaliadas em sua
totalidade tendo como limites as vértebras cervicais C1 e C3 e foram subdivididas
em velofaringe, tendo como limites C1 e úvula; e orofaringe, da úvula à C3. A
escolha das vértebras cervicais como referências para avaliação total das vias
aéreas faríngeas se deveu ao fato dessas estruturas (vértebras cervicais) estarem
localizadas mais inferiormente, como observado no estudo anterior, de forma que,
estando localizada mais inferiormente, a via aérea faríngea determinada por esses

57
limites poderia ser mais sensível às possíveis modificações esqueléticas da
mandíbula decorrentes da cirurgia ortognática.
A úvula foi utilizada como referência para subdividir a via aérea total em
velofaringe e orofaringe tendo em vista que não foram observadas diferenças em
relação ao posicionamento dessa estrutura no estudo anterior em relação a idade,
sexo, tipo de padrão esquelético e CCI.
Vários estudos foram realizados com o intuito de avaliar modificações nas
vias aéreas decorrentes de cirurgia de avanço mandibular, utilizando-se a TCFC.
Entretanto, a maioria desses estudos não avaliou o período de acompanhamento
pós- cirúrgico (Kochel et al., 2013; Kochar et al., 2016; Marcussen et al., 2017). No
presente estudo, TCFCs pós-cirúrgicas foram solicitadas para o grupo experimental
em dois tempos: T2 - no mínimo 1 mês após a cirurgia, para minimizar a influência
do edema inicial (Yamamoto et al., 2016; Van der Vlis et al., 2014), que poderia
interferir na avaliação das vias aéreas; e T3 - no mínimo 12 meses após a cirurgia
para que a estabilidade das possíveis modificações pudesse ser avaliada. Estudos
anteriores têm considerado que após seis meses da cirurgia ortognática, os
volumes dos tecidos moles se apresentariam estáveis (Kau et al., 2006). Entretanto,
durante este período, algum edema ainda pode ser clinicamente observado em
alguns pacientes. No presente estudo, optou-se por utilizar um período de no
mínimo 12 meses para avaliar a estabilidade pós-cirúrgica, considerando haver
pouco ou nenhum edema persistente após este período (Van der Vlis M et al.,
2014).
Para caracterização da amostra foram utilizados os ângulos ANB e CCI.
Observou-se uma redução significativa do ANB com a cirurgia (T1=7,5º; T2=4,1º e
T3=4,6º), evidenciando a correção cirúrgica anteroposterior e sua estabilidade. No
58
entanto, o ANB se aproximou, mas ainda foi estatisticamente diferente do grupo
controle (ANB=1,7º).
Para o ângulo CCI, foram observadas diferenças estatísticas entre o tempo
inicial e os demais (T2 e T3) do grupo experimental, e entre os grupos
experimentais (T1) e controle. Esta diferença pode ser justificada pelo fato de que
os pacientes Classe II tendem a exibir uma maior extensão da cabeça quando
comparados a grupos Classe I e III (D'attilio et al., 2005; Liu et al., 2016). Após a
cirurgia, houve uma diminuição do ângulo CCI no grupo experimental que se tornou
semelhante ao grupo controle. É importante enfatizar que os valores dos ângulos
CCI obtidos para todos os grupos não se distanciaram daqueles estabelecidos por
Muto et al., 2002, não interferindo nas dimensões das vias aéreas (90º a 110º).
No que se refere à caracterização do procedimento cirúrgico, no presente
estudo não foram observadas mudanças anteroposteriores significativas na maxila
após um período de acompanhamento. Por outro lado, as alterações mandibulares
e no osso hioide permaneceram estáveis após o mínimo de 12 meses de
acompanhamento. Foi observada uma mudança vertical no posicionamento da
espinha nasal posterior que pode ter favorecido a rotação da mandíbula do sentido
anti-horário.
Os volumes total e de todos os segmentos avaliados no grupo experimental,
velofaringe e orofaringe, aumentaram e se aproximaram dos valores do grupo
controle. A média de volume total das vias aéreas faríngeas, durante o período de
acompanhamento de no mínimo 12 meses (T3), apresentou um aumento
significativo quando comparado ao período pré-cirúrgico (T1). As mudanças
observadas nos volumes da velofaringe e orofaringe em T3 foram bastante
expressivas do ponto de vista clínico, a velofaringe e orofaringe apresentaram um

59
aumento de 55,58% e 21%, respectivamente, em seu volume quando comparados
ao período pré-cirurgico (T1). O aumento significativo do volume das vias aéreas
faríngeas também foi observado após a cirurgia de avanço mandibular em estudos
anteriores no entanto, estes estudos não foram controlados e nem fizeram um
acompanhamento pós-cirurgico a longo prazo (Kochel et al., 2013; Marcussen et
al., 2017).
No que se refere à ASTM das vias aéreas faríngeas, foi observado um
aumento estatisticamente significativo desta estrutura, que se manteve estável no
período de acompanhamento. Este parâmetro é um importante preditor das
dimensões das vias aéreas e pode estar correlacionado com a SAOS e a sua
gravidade (Enciso et al., 2010). Estes resultados corroboraram com aqueles
observados por outros autores (Kochel et al., 2013; Raffaini e Pisani, 2013; Kochar
et al., 2016).
Vale salientar que a grande parte dos estudos que avaliam as vias aéreas
de pacientes submetidos a cirurgia de avanço mandibular não são controlados. No
nosso estudo, um grupo controle constituído por pacientes Classe I, sem deficiência
mandibular, foi utilizado como padrão de normalidade. Nossos resultados
mostraram que o volume das vias aéreas faríngeas e a área de secção transversa
mínima aumentou e se aproximou dos valores obtidos para o grupo controle.
Uma moderada correlação negativa foi observada entre as mudanças no
volume e área de secção transversa mínima, e o deslocamento anteroposterior do
osso hioide. Esses resultados indicam que quanto maior o deslocamento
anteroposterior no osso hioide resultante da cirurgia de avanço mandibular, maiores
os volumes e área de secção transversa mínima.

60
Uma limitação do presente estudo foi as perdas ocorridas na amostra. Um
paciente não realizou o exame pós-cirúrgico (T2), apenas o exame de
acompanhamento (T3), e quatro pacientes não realizaram o exame de
acompanhamento. Entretanto, esta é uma limitação inerente aos estudos
prospectivos.
Em síntese, enfatizamos a importância do conhecimento acerca das
possíveis mudanças nas vias aéreas faríngeas de pacientes submetidos a cirurgia
de avanço mandibular. Estes dados podem servir de guia para cirurgiões e
ortodontistas no que se refere ao diagnóstico e planejamento ortocirurgico, visando
a melhoria na qualidade de vida desses pacientes.
61
6 CONCLUSÕES
6.1 Conclui-se que ambas as estruturas, anteriores e posteriores podem ser
utilizadas para delimitar as vias aéreas superiores independente da idade, padrões
esqueléticos vertical e anteroposterior. No entanto, o dimorfismo sexual deve ser
considerado e a inclinação craniocervical deve ser padronizada;
6.2 No que se refere às mudanças nas vias aéreas após a cirurgia de avanço
mandibular pode-se concluir que houve um aumento significativo do volume total e
da área de secção transversa mínima das vias aéreas faríngeas que
permaneceram estáveis durante o período de acompanhamento. Os valores da
área de secção transversa mínima e volume das vias aéreas aproximaram-se dos
valores observados no grupo controle, porém sem atingí-lo.

62
7 REFERÊNCIAS BIBLIOGRÁFICAS
ABOUDARA, C. et al. Comparison of airway space with conventional lateral headfilms and 3-dimensional reconstruction from cone-beam computed tomography. Am J Orthod Dentofacial Orthop, v. 135, n. 4, p. 468-79, Apr 2009. ISSN 0889-5406. ABRAMSON, Z. et al. Age-related changes of the upper airway assessed by 3-dimensional computed tomography. J Craniofac Surg, v. 20, Suppl. 1, p. 657-63, Mar 2009. ALSUFYANI, N. A.; FLORES-MIR, C.; MAJOR, P. W. Three-dimensional segmentation of the upper airway using cone beam CT: a. Dentomaxillofac Radiol, v. 41, n. 4, p. 276-84, May 2012. ISSN 0250-832X (Print) 0250-832x. ALVES, M., JR. et al. Is the airway volume being correctly analyzed? Am J Orthod Dentofacial Orthop, v. 141, n. 5, p. 657-61, May 2012. ISSN 0889-5406. BRASIL et al. Relationship of craniofacial morphology in 3-dimensional analysis of the pharynx. Am J Orthod Dentofacial Orthop. v. 149, n. 5, p. 683-691.e1, May 2016. doi: 10.1016/j.ajodo.2015.11.021. CABRAL, M. et al. Evaluation of the oropharynx in class I and II skeletal patterns by CBCT. Oral Maxillofac Surg, v. 21, n. 1, p. 27-31, Mar 2017. ISSN 1865-1550. CELIKOGLU, M. et al. Comparison of pharyngeal airway volume among different vertical skeletal patterns: a cone-beam computed tomography study. Angle Orthod, v. 84, n. 5, p. 782-7, Sep 2014. ISSN 0003-3219. CEVIDANES, L. et al. Head orientation in CBCT-generated cephalograms. Angle Orthod, v. 79, n. 5, p. 971-7, Sep 2009. ISSN 0003-3219 (Print) 0003-3219. CHRISTOVAM, I. O. et al. Upper airway dimensions in patients undergoing orthognathic surgery: a systematic review and meta-analysis. Int J Oral Maxillofac Surg. v. 45, n.4, p. 460-71, Apr 2016. CLAUDINO, L. V. et al. Pharyngeal airway characterization in adolescents related to facial skeletal pattern: A preliminary study. American Journal of Orthodontics

63
and Dentofacial Orthopedics, v. 143, n. 6, p. 799-809, Jun 2013. ISSN 0889-5406. Disponível em: < <Go to ISI>://WOS:000320927800010 >. DA SILVA, M. B., SANT'ANNA, E. F. The evolution of cephalometric diagnosis in orthodontics. Dental Press J Orthod 2013;18:63-71. D'ATTILIO, M. et al. Evaluation of cervical posture of children in skeletal class I, II, and III. Cranio, v. 23, n. 3, p. 219-28, Jul 2005. ISSN 0886-9634 (Print) 0886-9634. DALMAU, E. et al. A comparative study of the pharyngeal airway space, measured with cone beam computed tomography, between patients with different craniofacial morphologies. J Craniomaxillofac Surg, v. 43, n. 8, p. 1438-46, Oct 2015. ISSN 1010-5182. EFENDIYEVA, R. et al. Pharyngeal airway space, hyoid bone position, and head posture after bimaxillary orthognathic surgery in Class III patients: long-term evaluation. Angle Orthod, v. 84, n. 5, p. 773-81, Sep 2014. ISSN 0003-3219. EL, H.; PALOMO, J. M. Measuring the airway in 3 dimensions: a reliability and accuracy study. Am J Orthod Dentofacial Orthop, v. 137, n. 4 Suppl, p. S50.e1-9; discussion S50-2, Apr 2010. ISSN 0889-5406. ______. Airway volume for different dentofacial skeletal patterns. Am J Orthod Dentofacial Orthop, v. 139, n. 6, p. e511-21, Jun 2011. ISSN 0889-5406. ELHAM SALEH ABU ALLHAIJA AND SUSAN NADEEM AL-KHATEEB. Uvulo-Glosso-Pharyngeal Dimensions in Different Anteroposterior Skeletal Patterns. The Angle Orthodontist, v. 75, n. 6, p. 1012-18, nov 2005. ENCISO, R. et al. Comparison of cone-beam CT parameters and sleep questionnaires in sleep apnea patients and control subjects. Oral Surg Oral Med Oral Pathol Oral Radiol Endod, v. 109, n. 2, p. 285-93, Feb 2010. ISSN 1079-2104. FENG, X. et al. Comparative analysis of upper airway volume with lateral cephalograms and cone-beam computed tomography. American Journal of Orthodontics and Dentofacial Orthopedics, v. 147, n. 2, p. 197-204, Feb 2015. ISSN 0889-5406. Disponível em: < <Go to ISI>://WOS:000348736200010 >. GRAUER, D. et al. Pharyngeal airway volume and shape from cone-beam computed tomography: Relationship to facial morphology. American Journal of Orthodontics and Dentofacial Orthopedics, v. 136, n. 6, p. 805-814, Dec 2009. ISSN 0889-5406. Disponível em: < <Go to ISI>://WOS:000272427200019 >. GUIJARRO-MARTINEZ, R.; SWENNEN, G. R. J. Cone-beam computerized tomography imaging and analysis of the upper airway: a systematic review of the literature. International Journal of Oral and Maxillofacial Surgery, v. 40, n. 11, p. 1227-1237, Nov 2011. ISSN 0901-5027. Disponível em: < <Go to ISI>://WOS:000298726800001 >.

64
______. Three-dimensional cone beam computed tomography definition of the anatomical subregions of the upper airway: a validation study. International Journal of Oral and Maxillofacial Surgery, v. 42, n. 9, p. 1140-1149, Sep 2013. ISSN 0901-5027. Disponível em: < <Go to ISI>://WOS:000323586200016 >. HECHLER, S. L. Cone-beam CT: applications in orthodontics. In: (Ed.). Dent Clin North Am. United States, v.52, 2008. p.809-23, vii. ISBN 0011-8532 (Print) 0011-8532 (Linking). JIANG, C. et al. Pharyngeal Airway Space and Hyoid Bone Positioning After Different Orthognathic Surgeries in Skeletal Class II Patients. J Oral Maxillofac Surg, Mar 06 2017. ISSN 0278-2391. JOSE, N. P. et al. Evaluation of hyoid bone position and its correlation with pharyngeal airway space in different types of skeletal malocclusion. Contemporary Clinical Dentistry. v. 5, n. 2, p. 187-89, Apr-Jun 2014. doi:10.4103/0976-237X.132313. KAU, C.H. Richmond S, Palomo JM, Hans MG. Three-dimensional cone beam computerized tomography in orthodontics. J Orthod. v.32, n.4, p.282-293, Dez 2005. KAU, C. H., et al. A new method for the 3D measurement of postoperative swelling following orthognathic surgery. Orthod Craniofac Res. v, n.1, p. 31-7, Feb 2006. KIM, M. A. et al. Three-dimensional changes of the hyoid bone and airway volumes related to its relationship with horizontal anatomic planes after bimaxillary surgery in skeletal Class III patients. Angle Orthod, v. 83, n. 4, p. 623-9, Jul 2013. ISSN 0003-3219. KOCHAR, G. D. et al. Effect of surgical mandibular advancement on pharyngeal airway dimensions: a three-dimensional computed tomography study. International Journal of Oral and Maxillofacial Surgery, v. 45, n. 5, p. 553-559, May 2016. ISSN 0901-5027. Disponível em: < <Go to ISI>://WOS:000374798800002 >. KOCHEL, J. et al. Short-term pharyngeal airway changes after mandibular advancement surgery in adult Class II-Patients-a three-dimensional retrospective study. Journal of Orofacial Orthopedics-Fortschritte Der Kieferorthopadie, v. 74, n. 2, p. 137-152, Mar 2013. ISSN 1434-5293. Disponível em: < <Go to ISI>://WOS:000316149300007 >. LI, Y. M. et al. Morphological changes in the pharyngeal airway of female skeletal class III patients following bimaxillary surgery: a cone beam computed tomography evaluation. Int J Oral Maxillofac Surg, v. 43, n. 7, p. 862-7, Jul 2014. ISSN 0901-5027. LINDER-ARONSON, S. Respiratory function in relation to facial morphology and the dentition. Br J Orthod, v. 6, n. 2, p. 59-71, Apr 1979. ISSN 0301-228X (Print) 0301-228X (Linking).

65
LIONE, R. et al. Three-dimensional evaluation of masseter muscle in different vertical facial patterns: a cross-sectional study in growing children. Ultrason Imaging. v. 35, n. 4, p. 307-17, Oct 2013. doi: 10.1177/0161734613502468. LIU, Y. et al. Relationships of sagittal skeletal discrepancy, natural head position, and craniocervical posture in young Chinese children. Cranio, p. 1-8, Jan 07 2016. ISSN 0886-9634 (Print) 0886-9634. LOUBELE, M. et al. Comparison between effective radiation dose of CBCT and MSCT scanners for dentomaxillofacial applications. Eur J Radiol, v. 71, n. 3, p. 461-8, Sep 2009. ISSN 0720-048x. MARCUSSEN, L. et al. Changes in Upper Airway Volume Following Orthognathic Surgery. J Craniofac Surg, v. 28, n. 1, p. 66-70, Jan 2017. ISSN 1049-2275. MATTOS, C. T. et al. Effects of orthognathic surgery on oropharyngeal airway: a meta-analysis. Int J Oral Maxillofac Surg, v. 40, n. 12, p. 1347-56, Dec 2011. ISSN 0901-5027. MCNAMARA, J. A. Influence of respiratory pattern on craniofacial growth. Angle Orthod, v. 51, n. 4, p. 269-300, Oct 1981. ISSN 0003-3219 (Print) 0003-3219 (Linking). MONTGOMERY, W. M. et al. Computed tomography: a three-dimensional study of the nasal airway. Am J Orthod, v. 76, n. 4, p. 363-75, Oct 1979. ISSN 0002-9416 (Print) 0002-9416 (Linking). MUTO, T. et al. The effect of head posture on the pharyngeal airway space (PAS). Int J Oral Maxillofac Surg, v. 31, n. 6, p. 579-83, Dec 2002. ISSN 0901-5027 (Print) 0901-5027. PANDIS, N. Sample calculations for comparison of 2 means. Am J Orthod Dentofacial Orthop, v. 141, n. 4, p. 519-21, Apr 2012. ISSN 0889-5406. RAFFAINI, M.; PISANI, C. Clinical and cone-beam computed tomography evaluation of the three-dimensional increase in pharyngeal airway space following maxillo-mandibular rotation-advancement for Class II-correction in patients without sleep apnoea (OSA). J Craniomaxillofac Surg, v. 41, n. 7, p. 552-7, Oct 2013. ISSN 1010-5182. SHEN et al., Cephalometric studies on the upper airway space in normal Chinese. Int J Oral Maxillofac Surg. v. 23, n.4, p. 243-7, Aug 1994. ISSN 0901-5027. SHIGETA, Y. et al. Correlation between retroglossal airway size and body mass index in OSA and non-OSA patients using cone beam CT imaging. Sleep and Breathing, v. 12, n. 4, p. 347-52, Nov 2008. ISSN 1520-9512 (Print) 1520-9512.

66
TSAI HH. The positional changes of hyoid bone in children. J Clin Pediatr Dent v. 27, n. 1, p. 29-34. 2002. TSO, H. H. et al. Evaluation of the human airway using cone-beam computerized tomography. Oral Surg Oral Med Oral Pathol Oral Radiol Endod, v. 108, n. 5, p. 768-76, Nov 2009. ISSN 1079-2104. VAN DER VLIS, M. et al., Postoperative swelling after orthognathic surgery: a prospective volumetric analysis. J Oral Maxillofac Surg. v. 72, n. 11, p. 2241-7, Nov 2014. doi: 10.1016/j.joms.2014 WALSH, J. H. et al. Evaluation of pharyngeal shape and size using anatomical optical coherence tomography in individuals with and without obstructive sleep apnoea. J Sleep Res, v. 17, n. 2, p. 230-8, Jun 2008. ISSN 0962-1105. YAMAMOTO, S. et al. Intuitive Facial Imaging Method for Evaluation of Postoperative Swelling: A Combination of 3-Dimensional Computed Tomography and Laser Surface Scanning in Orthognathic Surgery. J Oral Maxillofac Surg, v. 74, n. 12, p. 2506.e1-2506.e10, Dec 2016. ISSN 0278-2391.
67
8 APÊNDICE
8.1 APÊNDICE 1- TERMO DE RESPONSABILIDADE PARA UTILIZAÇÃO DO
BANCO DE DADOS DA DISCIPLINA DE ORTODONTIA
68
Apêndice 2 – Termo de Consentimento Livre e Esclarecido
Título do protocolo: Avaliação tomográfica de pacientes submetidos a cirurgia de avanço
mandibular com acompanhamento a longo prazo.
Pesquisador(es) responsável(s): Prof. Dr. Eduardo Franzotti Sant’Anna; Prof. Dr.
Roberto Prado; Doutoranda Cláudia Trindade Mattos.
Você foi convidado a participar de um estudo e deve ficar à vontade para decidir se
deseja ou não participar. Leia cuidadosamente o que segue e pergunte ao profissional
responsável sobre qualquer dúvida que você possa ter.
Para a cirurgia que você vai fazer, são necessários alguns exames. Um exame que
fornece ao cirurgião muitas informações e segurança no planejamento e determinação da
cirurgia é a tomografia computadorizada. Ela fornece uma visão tridimensional de todo o
complexo craniofacial (maxila, mandíbula, crânio e dentes). Além disso, a realização de
nova tomografia após a cirurgia possibilita a visualização das mudanças obtidas com a
cirurgia. O acompanhamento a longo prazo é previsto e rotineiro para se acompanhar a
estabilidade da cirurgia.
Este estudo será conduzido pelo programa de pós-graduação em Odontologia-
Ortodontia da Universidade Federal do Rio de Janeiro e tem o objetivo de avaliar por meio
de tomografias computadorizadas as alterações decorrentes da cirurgia de avanço
mandibular.
Para este fim, será necessário que o paciente realize tomografias
computadorizadas previamente (antes da cirurgia), logo após a cirurgia e 6 meses após a
cirurgia.
Todas as tomografias serão realizadas na Radiologia Odontológica Doutor Murilo
Torres (R. Visc. Pirajá, 303, sl 510, Ipanema, RJ, 22410-001- Fone: (21) 2247-0189/ 3579-
8250/3042-4808).
Esse exame é realizado rotineiramente na prática médica e odontológica, apresenta
dose de radiação menor do que um conjunto de radiografias, e não apresenta outros riscos
para o paciente. Os benefícios para o paciente são um exame com maiores recursos e
informações para o planejamento cirúrgico e para o acompanhamento da cirurgia, além do
benefício para a sociedade por um maior conhecimento dos efeitos desse tipo de
procedimento cirúrgico.
Observações adicionais
1) Se você desejar não participar ou ser excluído do estudo a qualquer momento, o
tratamento não será prejudicado.
69
2) Assegura-se que será mantido sigilo em relação à sua identidade, sendo acessível
somente aos participantes da pesquisa.
3) Garante-se o esclarecimento de dúvidas, antes e durante o curso da pesquisa. O
profissional responsável poderá ser encontrado no endereço Av. Professor
Rodolpho Paulo Rocco, 325 – Ilha do Fundão – Departamento de Odontopediatria e
Ortodontia – Faculdade de Odontologia, no telefone (021) 25902727 e celular (21)
95311848 (Doutoranda Cláudia).
4) Este estudo poderá ser publicado em revista científica ou apresentado em reuniões
científicas. Contudo, a identidade dos participantes não será divulgada.
5) Assegura-se que os dados obtidos não serão ser usados para outros fins que os não
previstos no protocolo.
Eu, ................................................................................(paciente) acredito ter sido
suficientemente informado a respeito das informações sobre o estudo acima citado que li
ou que foram lidas para mim. Eu discuti com a Doutoranda Cláudia Mattos e o Dr. Roberto
Prado sobre minha decisão de participar desse estudo e ficaram claros os propósitos do
estudo, os procedimentos a serem realizados, seus desconfortos, riscos, as garantias de
confidencialidade e de esclarecimento permanentes. Concordo voluntariamente em
participar deste estudo e poderei retirar o meu consentimento a qualquer momento, antes
ou durante o mesmo, sem penalidades ou prejuízo ou perda de qualquer benefício que eu
possa ter adquirido, ou no meu atendimento nesta Instituição.
_____________________________ _______________________________
Assinatura do Paciente Assinatura do Pesquisador Responsável
Rio de Janeiro, ____ de_____________de 20___
Caso você tenha dificuldade em entrar em contato com o pesquisador
responsável, comunique o fato à Comissão de Ética em Pesquisa do Hospital
Universitário Pedro Ernesto pelo telefone (21) 25876353 ou pelo e-mail cep-

70
9 ANEXOS
9.1 Anexo 1: Aprovação do comitê de ética

71
Anexo 2: Aprovação do comitê de ética