Embed Size (px)
Citation preview

Núm
ero
2 | A
bril/
Junh
o 20
19 |
Volu
me
56
SOCIEDADE BRASILEIRA DEMOTILIDADE DIGESTIVA ENEUROGASTROENTEROLOGIA
Número 4 | Outubro/Dezembro 2019 | Volume 56

Untitled-3 1 31/05/12 17:57

Untitled-3 1 31/05/12 17:57
Publicação Trimestral / Quarterly Publication. A revista ARQUIVOS DE GASTROENTEROLOGIA é indexada nas seguintes Bases de Dados / The journal ARCHIVES OF GASTROENTEROLOGY is abstracted and/or indexed in: EMBASE / Excerpta Medica, Hygiene and Communicable Diseases (CAB Abstracts), LILACS, PUBMED / MEDLINE, Periódica: Índice de Revistas Latinoamericana en Ciencias, Tropical Diseases Bulletin (CAB Abstracts). On-line texto completo / Full texts: http://www.scielo.br/ag
Expediente / Editorial OfficeMariana Rodovalho
Redação e Administração / CorrespondenceRua Dr. Seng, 320 – Bela Vista – CEP 01331-020 – São Paulo, SP – Brasil – Tel.: (11) 3147-6227 – E-mail: [email protected]
Brazilian Institute for Studies and Research in Gastroenterology and Other Specialities (IBEPEGE)Alcides Felix Terrivel (Representative)
Brazilian College of Digestive Surgery (CBCD)Delta Madureira Filho (President)
Brazilian Federation of Gastroenterology (FBG)Schlioma Zaterka (President)
Brazilian Society of Digestive Endoscopy (SOBED)Jairo Silva Alves (President)
Brazilian Society of Parenteral and Enteral Nutrition (SBNPE)Diogo Oliveira Toledo (President)
Brazilian Digestive Motility & Neurogastroenterology Society (SBMDN)Ricardo Guilherme Viebig (President)Brazilian Society of Hepatology (SBH)Paulo Lisboa Bittencourt (President)
Editor Fundador / Founding Editor José Fernandes Pontes (IBEPEGE, São Paulo, SP)
Editor Científico / Scientific Editor Mounib Tacla (IBEPEGE, São Paulo, SP)
Editor Executivo / Editor-in-Chief Ricardo Guilherme Viebig (IBEPEGE, São Paulo, SP)
Editores Assistentes / Assistant Fernando Pardini (IBEPEGE)
Osvaldo Malafaia (CBCD)Maria do Carmo Friche Passos (FBG)
Marcelo Averbach (SOBED) Maria Cristina Gonzalez (SBNPE)
Gerson Ricardo de Souza Domingues (SBMDN)Mário Guimarães Pessôa (SBH)
Consultores - Brasil
Adávio de Oliveira e Silva (USP, São Paulo, SP)Angelita Habr-Gama (USP, São Paulo, SP)Arthur B. Garrido Jr. (USP, São Paulo, SP)Cervantes Caporossi (UFMT, Cuiabá, MT)
Desidério Roberto Kiss (USP, São Paulo, SP)Gaspar de Jesus Lopes Filho (UNIFESP, São Paulo, SP)
Helio Moreira (UFGO, Goiânia, GO)João Batista Marchesini (UFPR, Curitiba, PR)
Joaquim Gama Rodrigues (USP, São Paulo, SP)Lorete Maria da Silva Kotze (PUC, Curitiba, PR)
Luiz Rohde (UFRS, Porto Alegre, RS)Marcel Cerqueira César Machado (USP, São Paulo, SP)Maria Aparecida C. A. Henry (UNESP, Botucatu, SP)
Paulo Roberto (FFFCMPA, Porto Alegre, RS)Renato Bonardi (UFPR, Curitiba, PR)Samir Rasslam (USP, São Paulo, SP)Sérgio Brenner (UFPR, Curitiba, PR)
William Abrão Saad (USP, São Paulo, SP)
Consultant - International
Peter Malfertheiner, MD(Otto-von-Guericke-Universität, Magdeburg, Germany)
Francis Megraud, MD (INSERM - U853, University of Bordeaux, Bordeaux, France)
Daniel Sifrim, MD, PhD(Barts and The London School of Medicine and Dentistry, London, UK)
Steven Wexner MD, PhD (Cleveland Clinic Florida, Weston, FL, USA)
Mark Scott, MD, PhD (Royal London Hospital, London, UK)
Etsuro Yazaki , MD, PhD, (Wingate Institute of Neurogastroenterology, London, UK)
Eamonn Martin Quigley, MD(Houston Methodist Gastroenterology Associates)
IS THE OFFICIAL PUBLICATION OF:
Editores Associados / Associate Editors
• Adérson Omar Mourão Cintra Damião (USP, São Paulo, SP)• Adriana Safatle Ribeiro (FMUSP, São Paulo, SP)• Alberto Queiroz Farias (FMUSP, São Paulo, SP)• Alfredo José Afonso Barbosa (UFMG, Belo Horizonte, MG)• Aloísio Souza Felipe Silva (HU, São Paulo, SP)• Ana Claudia de Oliveira (UFSCar, Piracicaba, SP)• Ana Maria Furkim (UFSC, Florianópolis, SC)• Andrea Bottoni (Universidade de Mogi das Cruzes, SP)• Angelo Alves de Mattos (UFCSPA, Porto Alegre, RS)• Angelo Paulo Ferrari Junior (UNIFESP, São Paulo, SP)• Ângelo Zambam de Mattos (UFCSPA, Porto Alegre, RS)• Armenio Aguiar dos Santos (UFC, Fortaleza, CE)• Ary Nasi (USP, São Paulo, SP)• Avelino Luiz Rodrigues (FMUSP, São Paulo, SP)• Ben-Hur Ferraz Neto (PUC, Sorocaba, SP)• Bruno Zilberstein (USP, São Paulo, SP)• Camila Colás Sabino de Freitas (Hospital IGESP, São Paulo, SP)• Carlos Alberto Cappellanes (Hospital Sírio Libanês, São Paulo, SP)• Carlos Eduardo Jacob (FMUSP, São Paulo, SP)• Carlos Walter Sobrado (USP, São Paulo, SP)• Claudemiro Quireze Júnior (UFGO, Goiânia, GO)• Claudia P. Marques Souza de Oliveira (USP, São Paulo, SP)• Claudio Saddy Rodriguez Coy (UNICAMP, Campinas, SP)• Cristiane Valle Tovo (UFCSPA, Porto Alegre, RS)• Cyrla Zaltman (UFRJ, Rio de Janeiro, RJ)• Dalton Marques Chaves (FMUSP, São Paulo, SP)• Dan Linetzky Waitzberg (USP, São Paulo, SP)• Daniel Sifrim (Barts and The London School of Medicine and
Dentistry, London, UK)• Decio Chinzon (FMUSP, São Paulo, SP)• Denis Pajecki (FMUSP, São Paulo, SP)• Dulce Reis Guarita (USP, São Paulo, SP)• Edison Roberto Parise (UNIFESP, São Paulo, SP)• Edmundo Machado Ferraz (UFPE, Recife, PE)• Edmundo Pessoa Lopes Neto (UFPE, Recife, PE)• Edna Frasson de Souza Montero (UNIFESP, São Paulo, SP)• Edna Strauss (Hospital do Coração, São Paulo, SP)• Edson Ide (FMUSP, São Paulo, SP)• Eduardo Guimarães Hourneaux de Moura (USP, São Paulo, SP)• Eponina Maria de Oliveira Lemme (UFRJ, Rio de Janeiro, RJ)• Everson Luiz de Almeida Artifon (FMUSP, São Paulo, SP)• Fabio Guilherme Campos (USP, São Paulo, SP)• Fabio Pinatel Lopasso (USP, São Paulo, SP)• Fauze Maluf Filho (USP, São Paulo, SP)• Fernando Pardini (IBEPEGE, São Paulo, SP)• Flair José Carrilho (USP, São Paulo, SP)• Flávio Antonio Quilici (PUC, Campinas, SP)• Flávio Cesar Viani (Universidade Cruzeiro do Sul, São Paulo, SP)• Flavio Steinwurz (Hosp. Israelita Albert Einstein, São Paulo, SP)• Gabriela Perdomo Coral (UFCSPA, Porto Alegre, RS)• Gaspar de Jesus Lopes Filho (UNIFESP, São Paulo, SP)• Gerson Ricardo de Souza Domingues (UFRJ, Rio de Janeiro, RJ)• Gilda Porta (FMUSP, São Paulo, SP)• Heitor Rosa (UFGO, Goiânia, GO)• Helma Pinchemel Cotrim (UFBA, Salvador, BA)• Horus Antony Brasil (Hospital Sírio Libanês, São Paulo, SP)• Ismael Maguilnik (Moinhos de Vento, Porto Alegre, RS)• Ivan Cecconello (FMUSP, São Paulo, SP)• Jaques Waisberg (FMABC, Santo André, SP)• João Gomes Netinho (FM São José do Rio Preto, SP)• Joaquim Prado P. de Moraes Filho (USP, São Paulo, SP)• Joel Faintuch (USP, São Paulo, SP)• Joffre Rezende Filho (UFG, Goiânia, GO)• Joffre Rezende Neto (Instituto de Gastroenterologia de Goiânia, GO)
• Jorge Carim Cassab (Santa Casa, São Paulo, SP)• Jose Alejandro Piscoya Rivera (UPC, Lima, Peru)• José Celso Ardengh (USP, Ribeirão Preto, SP)• José Eduardo Monteiro da Cunha (USP, São Paulo, SP)• José Marcio Neves Jorge (USP, São Paulo, SP)• Juan Sebastian Lasa (CEMIC, Buenos Aires, Argentina)• Julio Carlos Pereira Lima (UFCSPA, Porto Alegre, RS)• Julio Cesar Bai (Hosp. Dr. Carlos Bonorino Udaondo,
Buenos Aires, Argentina)• Julio Cezar Uili Coelho (UFPR, Curitiba, PR)• Julio Yarmuch (Hosp. Clinico Universidad de Chile, Chile)• Lucia Camara de Castro Oliveira (CEPEMED, Rio de Janeiro, RJ)• Luis Fernando Corrêa Zantut (USP, São Paulo, SP)• Luis Soifer (Instituto Universitario CEMIC, Buenos Aires, Argentina)• Luiz Augusto Carneiro D’Albuquerque (USP, São Paulo, SP)• Luiz Gonzaga Vaz Coelho (UFMG, Belo Horizonte, MG)• Manoel dos Passos Galvão Neto (FMUSP, São Paulo, SP)• Marcel Autran Cesar Machado (USP, São Paulo, SP)• Marcelo Averbach (Hospital Sírio Libanês, São Paulo, SP)• Marcelo Eidi Nita (USP, São Paulo, SP)• Marcelo Gil Cliquet (PUC, Sorocaba, SP)• Marco Aurelio Santo (USP, São Paulo, SP)• Marcos Antonio Cyrillo (Hospital IGESP, São Paulo, SP)• Maria do Carmo Friche Passos (UFMG, Belo Horizonte, MG)• Mário Guimarães Pessôa (FMUSP, São Paulo, SP)• Mario Peribañez Gonzalez (Instituto de Infectologia
Emilio Ribas, São Paulo, SP)• Mauro Bafutto (Instituto Goiano de Gastroenterologia, GO)• Mauro Batista de Morais (UNIFESP, São Paulo, SP)• Mauro Sérgio Toporovski (Santa Casa, São Paulo, SP)• Milton Melciades Barbosa Costa (UFRJ, Rio de Janeiro, RJ)• Nelson Adami Andreollo (UNICAMP, Campinas, SP)• Nora Manoukian Forones (UNIFESP, São Paulo, SP)• Odery Ramos (UFPR, Curitiba, PR)• Osvaldo Malafaia (UFPR, Curitiba, PR)• Paula Bechara Poletti (Hospital do Coração, São Paulo, SP)• Paulo Gustavo Kotze (PUC, Curitiba, PR)• Paulo Herman (FMUSP, São Paulo, SP)• Paulo Lisboa Bittencourt (Hospital Português, Salvador, BA)• Paulo Sakai (USP, São Paulo, SP)• Raymundo Paraná (UFBA, Salvador, BA)• Renata Furlan Viebig (Universidade Mackenzie, São Paulo, SP)• Ricardo Correa Barbuti (HCFMUSP, São Paulo, SP)• Roberta Gonçalves da Silva (UNESP, Botucatu, SP)• Roberto Carlos Burini (UNESP, Botucatu, SP)• Roberto Oliveira Dantas (USP, Ribeirão Preto, SP)• Rodrigo Oliva Perez (USP, São Paulo, SP)• Ronaldo Mafia Cuenca (UnB, Brasília, DF)• Rosa Leonôra Salerno Soares (UFF, Niterói, RJ)• Schlioma Zaterka (USP, São Paulo, SP)• Sender Jankiel Miszputen (UNIFESP, São Paulo, SP)• Sergio Carlos Nahas (USP, São Paulo, SP)• Shirley Ramos da Rosa Utiyama (UFPR, Curitiba, PR)• Sonia Penteado (USP, São Paulo, SP)• Sthela Maria Murad Regadas (UFC, Fortaleza, CE)• Suzane Kioko Ono (USP, São Paulo, SP)• Tomás Navarro Rodrigues (FMUSP, São Paulo, SP)• Ulysses Fagundes Neto (UNIFESP, São Paulo, SP)• Ulysses Ribeiro Júnior (USP, São Paulo, SP)• Venâncio Avancini Ferreira Alves (USP, São Paulo, SP)• Vera Lucia Sdepanian (UNIFESP, São Paulo, SP)• Wallace Acioli (Hospital da Criança de Brasília, Brasília, DF)• Wellington Andraus (USP, São Paulo, SP)• Wilson Roberto Catapani (FMABC, Santo André, SP)• Yu Kar Ling Koda (Instituto da Criança, USP, São Paulo, SP)

EDITORIAL An inevitable consequence
Uma consequência inevitávelRicardo Guilherme VIEBIG ___________________________________________________________________ 331
ORIGINAL ARTICLEAG-2019-46 Hepatoprotective efficacy of methanolic extract of Indigofera suffruticosa (Mill) on
paracetamol–induced liver damage in miceEficácia hepatoprotetora do extrato metanólico de Indigofera suffruticosa (Mill) em lesão hepática induzido por paracetamol em camundongos
Izabela Rangel LIMA, Ivanise Brito SILVA, Roberta M Leite LIMA, Tainá M Santos SILVA, Maria B Sousa MAIA, Sônia Pereira LEITE ________________________________________________________________________ 333
AG-2019-58 Mental disorders and quality of life in patients awaiting liver transplantationDesordens mentais e qualidade de vida em pacientes em lista de espera para realização de transplante de fígado
Lívia N F GUERREIRO-COSTA, José Edson O ARAÚJO-FILHO, Roberta Ferrari MARBACK, Ana Paula JESUS-NUNES, Mychelle MORAIS-DE-JESUS, Lucas C QUARANTINI _____________________________ 339
AG-2019-69 Profile of HCV genotypes and HIV-subtypes among HIV-coinfected patients in Southern BrazilPerfil dos genótipos do HCV e subtipos de HIV em pacientes coinfectados no Sul do Brasil
Claudinei Mesquita da SILVA, Leyde Daiane de PEDER, Mateus Vailant THOMAZELLA, Jorge Juarez Vieira TEIXEIRA, Dennis Armando BERTOLINI _____________________________________________ 344
AG-2019-81 Physical activity in daily life, exercise capacity and quality of life in patients with Crohn’s disease on infliximab-induced remission: a preliminary studyAtividade física de vida diária, capacidade de exercício e qualidade de vida de pacientes com doença de Crohn em remissão induzida por infliximabe: um estudo preliminar
Andrea Lemos CABALZAR, Felipe Meirelles de AZEVEDO, Fernando de Azevedo LUCCA, Maycon de Moura REBOREDO, Carla MALAGUTI, Júlio Maria Fonseca CHEBLI _______________________________ 351
AG-2019-83 Sarcopenia and severity of non-alcoholic fatty liver disease Sarcopenia e gravidade da doença hepática gordurosa não-alcoólica
Josilda Ferreira CRUZ, Yasmim Anayr Costa FERRARI, Carla Perez MACHADO, Nathalia Nascimento SANTANA, Allan Victor Hora MOTA, Sonia Oliveira LIMA _______________________________________________________ 357
AG-2019-84 Antibiotic resistance surveillance of Helicobacter pylori at the Biobío region (Chile) in a decadeVigilância da resistência a antibióticos contra o Helicobacter pylori na região do Biobío (Chile) em uma década
Cristian PARRA-SEPÚLVEDA, José S MERINO, Katia SÁEZ-CARRILLO, Carlos GONZÁLEZ, Apolinaria GARCÍA-CANCINO _________________________________________________________________ 361
CONTENTS ISSN 0004-2803
ISSN 1678-4219 - on-lineCoden ARQGA
v. 56 Nº 4 Out/Dez 2019

AG-2019-90 Metallothionein-2A (rs1610216&rs28366003) gene polymorphisms and the risk of stomach adenocarcinomaPolimorfismos do gene Metallothionein-2A (rs1610216&rs28366003) e o risco de adenocarcinoma de estômago
Mohammad SHOKRZADEH, Abbas MOHAMMADPOUR, Nasrin GHASSEMI-BARGHI, Vahid HOSEINI, Saied ABEDIANKENARI, Yahya Saleh TABARI ______________________________________________________ 367
AG-2019-92 Cytotoxic effects of duloxetine on MKN45 and NIH3T3 cell lines and genotoxic effects on human peripheral blood lymphocytesEfeitos citotóxicos da duloxetina nas linhagens celulares MKN45 e NIH3T3 e efeitos genotóxicos em linfócitos sanguíneos periféricos humanos
Melika HASSANI, Nasrin GHASSEMI-BARGHI, Mona MODANLOO, Abbas MOHAMMADPOUR, Mohammad SHOKRZADEH __________________________________________________________________ 372
AG-2019-93 Lymphocyte count and platelet volume predicts postoperative complications in esophagectomy for cancer: a cohort studyLinfócitos e volume plaquetário estão associados a complicações pós-esofagectomia por câncer: um estudo de coorte
Francisco TUSTUMI, Flávio Roberto TAKEDA, Antonio Adolfo Guerra Soares BRANDÃO, Rubens Antonio Aissar SALLUM, Ulysses RIBEIRO JUNIOR, Ivan CECCONELLO _______________________________ 377
AG-2019-98 Altered esophageal motility during perception of bolus transit in healthy volunteersAlteração da motilidade do esôfago durante percepção do trânsito do bolo em voluntários saudáveis
Tarciana Vieira COSTA, Roberto Oliveira DANTAS ____________________________________________________ 386
AG-2019-102 Prospective monitoring of drug use: drug-induced liver injury in a primary healthcare centerMonitoramento prospectivo do uso de medicamentos: lesão hepática induzida por medicamentos em um centro municipal de saúde
Nília Maria de Brito Lima PRADO, Gladistone Correia MESSIAS, Genário Oliveira SANTOS JUNIOR, Vinícius Santos NUNES, Maria Isabel SCHINONNI, Raymundo PARANÁ _____________________________________________________ 390
AG-2019-109 Sustained virologic response rate in chronic hepatitis C patients through direct-acting antivirals therapyTaxa de resposta viral sustentada em pacientes de hepatite C crônica tratados com antivirais de ação direta
Andréa Delfino TORRES, Jucéli Maria Hendges SPARVOLI, Antonio Cardoso SPARVOLI, Carla Vitola GONÇALVES ________ 394
AG-2019-110 Study of lipid biomarkers of patients with polyps and colorectal cancerEstudo de biomarcadores lipídicos em pacientes portadores com pólipos e câncer colorretal
Patricia Valeria Pereira SERAFIM, Adiel Goes de FIGUEIREDO JR, Aledson Vitor FELIPE, Edson Guimaraes Lo TURCO, Ismael Dale Cotrim Guerreiro da SILVA, Nora Manoukian FORONES ________________________________________ 399
AG-2019-115 Quercetin supplementation prevents changes in the serotonin and caspase-3 immunoreactive cells of the jejunum of diabetic ratsA suplementação com quercetina previne mudanças em células imunorreativas à serotonina e caspase-3 do jejuno de ratos diabéticos
Juliana Vanessa Colombo MARTINS-PERLES, Isabela ZIGNANI, Sara Raquel Garcia de SOUZA, Flávia Cristina Vieira FREZ, Gleison Daion Piovezana BOSSOLANI, Jacqueline Nelisis ZANONI ______________________ 405
AG-2019-120 Risk factors associated with early mortality after percutaneous endoscopic gastrostomy in patients at a tertiary care center in Brazil: a retrospective single-center survival studyFatores de risco associados a mortalidade precoce após gastrostomia endoscópica percutânea em pacientes em um centro terciário no Brasil: um estudo retrospectivo de sobrevida em um único centro
Luiz Eduardo MIRANDA, Marcel Rolland Ciro da PENHA, Ana Clara Galindo MIRANDA, Diego Laurentino LIMA, Matheus Wanderly Fernandes COSTA, Alexandre de Oliveira AMORIM ______________________ 412

AG-2019-134 Helicobacter pylori infection and gastric cancer precursor lesions: prevalence and associated factors in a reference laboratory in Southeastern BrazilInfecção por Helicobacter pylori e lesões precursoras de câncer gástrico: prevalência e fatores associados em um laboratório de referência no Sudeste do Brasil
Michele Fernandes RODRIGUES, Maximiliano Ribeiro GUERRA, Angélica Vilela Rodrigues de ALVARENGA, Danillo Zeferino de Oliveira SOUZA, Rafaella Angélica Vieira e Silva COSTA, Sônia Maria Neumann CUPOLILO ____________ 419
REVIEWAG-2019-66 Definition of vitamin D deficiency in schoolchildren: systematic review with meta-analysis
Definição da deficiência de vitamina D em crianças em idade escolar: revisão sistemática com metanáliseMarcela Almeida LINDEN, Renata Germano Borges de Oliveira Nascimento FREITAS, Gabriel HESSEL, Denise Barbieri MARMO, Maria Ângela BELLOMO-BRANDÃO ___________________________________________ 425
AG-2019-74 Impact of current diet at the risk of non-alcoholic fatty liver disease (NAFLD)Impacto da dieta usual no risco de doença hepática gordurosa não alcoólica (DHGNA).
Sebastião Mauro Bezerra DUARTE, Jose Tadeu STEFANO, Denise Siqueira VANNI, Flair José CARRILHO, Claudia Pinto Marques Souza de OLIVEIRA ________________________________________________________ 431
AG-2019-106 New immunization schedule effectiveness against hepatitis B in liver transplantation patientsEficácia de um novo esquema vacinal contra hepatite B em pacientes submetidos a transplante de fígado
Isabela Cristina RODRIGUES, Rita de Cássia Martins Alves da SILVA, Helen Catharine Camarero de FELÍCIO, Renato Ferreira da SILVA ____________________________________________________________________ 440
BRIEF COMMUNICATIONAG-2019-105 Nutritional indicators of malnutrition in hospitalized patients
Indicadores nutricionais de desnutrição em pacientes hospitalizadosVânia Aparecida LEANDRO-MERHI, Caroline Lobo COSTA, Laiz SARAGIOTTO, José Luiz Braga de AQUINO ____________ 447
LETTER TO EDITORAG-2019-96 Association of TNF- α-308G>A polymorphism and celiac disease
Beuy JOOB, Viroj WIWANITKIT ________________________________________________________________ 451
AG-2019-111 Predictive parameters to identify incontinent patients amenable for rehabilitation treatment: the muscular synergies evaluation
Claudio GAMBARDELLA, Luigi BRUSCIANO, Gianmattia DEL GENIO, Salvatore TOLONE, Gianmattia TERRACCIANO, Giorgia GUALTIERI, Francesco Saverio LUCIDO, Ludovico DOCIMO ____________________ 452
AG-2019-128 GeneXpert for abdominal tuberculosisAlka SHARMA ___________________________________________________________________________ 454

INSTRUCTIONS TO AUTHORS
Scope and policyThe Archives of Gastroenterology publishes originals and unseen
contributions, from national and foreign researchers, compatible with the goals of the journal and suited to the scientific and edi-torials standards.
The submission of the manuscript implies that the work in full or part(s) it has not been published in another source or means of communication and not under review in another journal for publication.
Only original studies, from clinical or surgical nature, new tech-niques and epidemiology studies are accepted. Review article are accepted only by invitation from the Editorial Board. Case reports are not published. The Original Article sections are: Endoscopy, Surgery, Hepatology, Digestive Motility, Clinical Gastroenterology, Experimental Surgery, Pediatric Gastroenterology, Gastroentero-logical Clinical Pathology, and Nutrition.
It also publishes Editorials, Letter to the Editor, Consensus, Brief Communication and Supplements.
The assessment work is done impartially, anonymous and usu-ally peer review, omitting to the reviewers, any identification of its origin. The estimated time process is 90 days from submission. Anonymity is guaranteed throughout the trial process. The decision about acceptance for publication is taken by the Editorial Board.
No fee is required from authors for submission, evaluation and publication of articles. The Archives of Gastroenterology is available online with an open and free access. It is not necessary to ask the journal for permission for electronic copy, provided that the proper credit is given to the original source.
General rulesThe text must be in English language. The number of authors is
limited to six for Original Articles and three for Brief Communica-tion. Exceptions can be made in the case of multicentric studies.
The word limit for Brief Communication recommended is no more than 2500; it may contain a figure and a table and the refer-ences do not exceed 15.
Articles of research involving human subjects must be marked in Methods section, expressly agreed with the ethical standards and with due informed consent of the participants. Research with human must bring the title page the number of the opinion of the Committee’s approval of Research Ethics. Brazilian studies should be in accordance with Resolution 466/2012 of the National Health Council of the Ministry of Health (Brazil), which deals with the Code of Ethics for Human Research, and for studies outside Brazil, shall be in accordance with the Declaration of Helsinki.
Studies involving animals should state the agreement with international ethical principles (e.g., Committee for Research and Ethical Issues of the International Association for the Study of Pain, published in PAIN, 16: 109-110, 1983) and national instructions (Laws 6638 / 79, 9605/98, 24665/34 Decree) governing animal re-search and bring the number of the opinion approved by the Ethics Committee on Animal Research.
For clinical trials, the presentation of the clinical trial registra-tion number on the Methods is mandatory. The complete list of all clinical trials registries can be found at: http://www.who.int/ictrp/network/primary/en/index.html.
It is recommended a cover letter with the intention in publish on the Archives of Gastroenterology, highlighting the importance of this publication and research. This letter must be written in the “Author’s Cover Letter” field in the online submission.
By determination of SciELO, the adoption of ORCID as an identifier of the authors will become mandatory from January 2019.
Therefore, the journal Archives of Gastroenterology encourages authors to create their ORCID. As of July 1, 2018, the ORCID regis-tration of all authors will be mandatory during article submission.
FormatThe submitted manuscript must be sent in Microsoft Word
format and organized as follows: 1) Title; (in English and Portuguese); for foreign authors the
translation will be done. 2) Authors names; do not insert staff positions or similar
adjectives. For each author should be described his partici-pation in the study. (e.g. data collection, survey execution, writing of text, statistical analysis and so on).
3) The department and institution where the work was per-formed.
4) The name, telephone number, electronic address and postal correspondence address of author to whom galley proofs and requests for reprints should be sent.
5) Acknowledgement of grants and other financial support. Interest of conflicts must be declared or not if so. If so, sponsors must be declared.
6) Structured Abstract (Background, Objective, Methods, Results, and Conclusion) - The papers should be sent in English and Portuguese (200 – 600 words); abbreviations, footnotes and references should be avoided; for foreign authors the translation will be done.
7) Headings (3 to 10). Always use terms of Medical Subject Headings (MESH) list from MEDLINE. Available from: http://www.nlm.nih.gov/mesh/meshhome.html
8) We strongly recommend this paper division: Introduction; Methods; Results; Discussion; Conclusion; Acknowle-dgements.
9) All contributors who do not meet the criteria for author-ship may be mentioned in Acknowledgments.
10) References - Archives of Gastroenterology adopts the Van-couver format. Complete text in: https://www.nlm.nih.gov/bsd/uniform_requirements.html Cite references in the text using Arabic numerals in the order of appearance, within parentheses. Do not arrange the list alphabetically. For up to six authors, list all authors. For more than six authors, list first six authors followed by “et al.”.
11) Tables and Figures should be cited in the text in Arabic numerals. Preferably, attached separately in JPG or PNG. If they are inside the article, they should after the refe-rences. Please do not insert tables and figures in the middle of the text.
12) Tables (in Microsoft Word or Excel format) - Is called Table only when there are numeric results. Explanations and abbreviations should be placed in the footer of the table.
13) Figures - Photographs, graphics and drawings must be sent in high resolution digital format (2 mb). Photos can be colored, being left to editors to decide if the publication will be in color or not. The Figures should contain a short text on the subject.
Instructions for electronic manuscript submissionSubmissions only through the ScholarOne interface, on SciELO
Portal:http://mc04.manuscriptcentral.com/ag-scieloWe reiterate that no fee is required from authors for submission,
evaluation and publication of articles. The Archives of Gastroente-rology is available online with an open and free access.

GASTRAO.ORG.BRPARA SABER MAIS, ACESSE
FAÇA PARTE DE UM DOSMAIS TRADICIONAIS CONGRESSOS
DE SÃO PAULO E DA ESPECIALIDADE.
27 A 30 DE JUNHO DE 2020
SAVE THE DATE
CENTRO DE CONVENÇÕES REBOUÇAS - SÃO PAULO/SP
EDITORIAL
Arq Gastroenterol • 2019. v. 56 nº 4 out/dez • 331
An inevitable consequence
Viebig RG. An inevitable consequence. Arq Gastroenterol. 2019;56(4):331-2.
dx.doi.org/10.1590/S0004-2803.201900000-61
Swallowing: initial process of digestion understood by a simple word. This act performed countless times a day is ex-tremely complex and indispensable to our survival. Voluntary process, sometimes did as reflex, has its learning initiated at three months of gestation. The neural integration of several muscular complexes, supported by cartilaginous and bony structures, determines the proper physicochemical preparation to trigger a refined sequence of events that culminate with the ingestion of the bolus. This mechanism combines the pleasure of feeding, flavor and satiety, primordial facts to maintain the quality of life.
Over the past 20 years, the Archives of Gastroenterology have followed and encouraged the publications where the key words predominate: dysphagia, swallowing, videofluoroscopy of swallowing and other related. The magazine regularly receives original contributions and review articles in the area. Tradi-tionally, the journal supports and encourages physicians and speech therapists who venture into the field of Dysphagia and who today form a considerable contingent of professionals not only investigating the swallowing phenomena but putting into practice the knowledge acquired for the benefit of patients. In these last 25 years, I personally follow the evolution of these experts and through this exchange of experiences I am sure that Brazil is one of the countries with the highest degree of specialization in the treatment of patients with dysphagia, both in the hospital, outpatient and in the field of research.
As a natural consequence of the intensity of information exchange and the integration of people interested in dysphagia, an important step has been taken in our history: the founda-tion of a professional association that will seal the interests of this collectivity: the Brazilian Academy of Dysphagia (ABD).
This meeting of physicians, speech therapists, nurses, physi-otherapists, nutrologists in an association, reproduces what hap-pens in our professional daily life. The multidisciplinary activity in acting on dysphagia is the domain of all these professionals who work in consonance to refer patients to the best solution or control of their disorders.
Swallowing was legated to a second plan for many years by the scientific community but is currently no longer observed as a simple phenomenon and its field of interest for clinical research is enormous. Some researchers have stood out in the last two decades because they are pioneers and insistent to publish their results into the Archives of Gastroenterology. Their names are listed in the references section(1-24).
As associate editors, for many years our periodic have been relying on assistance from Dr. Ana Maria Furkim, Dr. Roberta Gonçalves, Dr. Milton Costa, Dr. Roberto Dantas and Dr. Evaldo Ducheaux de Melo, whose contribution is invaluable to science, to his disciples and consequently to dysphagic patients.
Crowding this interaction of many years, the Archives of Gastroenterology will be included as official organ of the Brazil-ian Academy of Dysphagia from 2020 ahead. The position of associate Editor for one of its members is opened, strengthening this partnership, making the periodical a way of disseminating and promoting the academic and scientific activity of those involved with dysphagia.
Wellcome ABD!
Ricardo Guilherme VIEBIG*
* Hospital IGESP, Motilidade Digestiva e Neurogastroenterologia (MoDiNe), São Paulo, SP, Brasil. ORCID: 0000-0002-6541-0401.
Viebig RG. Uma consequência inevitável. Arq Gastroenterol. 2019;56(4):331-2.

Viebig RG.An inevitable consequence
332 • Arq Gastroenterol • 2019. v. 56 nº 4 out/dez
REFERENCES
1. Dantas RO, Miranda AL. Sequential swallows have no influence on esopha-geal contractions of patients with iron deficiency anemia. Arq Gastroenterol. 2004;41:27-32.
2. Yamada EK, Siqueira KO, Xerez D, Koch HA, Costa MMB. [The influence of oral and pharyngeal phases on the swallowing dynamic]. [Article in Portuguese]. Arq Gastroenterol. 2004;41:18-23. ISSN 0004-2803
3. Suzuki HS, Nasi A, Ajzen S, Bilton T, Sanches EP. [Clinical and radiological study of swallowing in patients with deglutition disorders, classified into two age groups: adults and older people]. [Article in Portuguese]. Arq Gastroenterol. 2006;43:201-5.
4. Alvite MFL, Lopes RLC, Costa MMB. [Mechanical-thermal stimulation of the palatoglossus pillars]. [Article in Portuguese]. Arq Gastroenterol. 2007;44: 221-6.
5. Costa MM, Almeida JT, Sant’Anna E, Pinheiro GM. Viscosities reproductive patterns for use in videofluoroscopy and rehabilitation therapy of dysphagic patients. Arq Gastroenterol. 2007;44:297-303.
6. Simão Mde A, Alacid CA, Rodrigues KA, Albuquerque C, Furkim AM. Incidence of tracheal aspiration in tracheotomized patients in use of mechanical ventilation. Arq Gastroenterol. 2009;46:311-4.
7. Costa MM, Lemme EM. Coordination of respiration and swallowing: functional pattern and relevance of vocal folds closure. Arq Gastroenterol. 2010;47:42-8.
8. Costa MMB. Videofluoroscopy: the gold standard exam for studying swallowing and its dysfunction. Arq Gastroenterol. 2010;47:327-8.
9. Cola PC, Gatto AR, Silva RG, Spadotto AA, Schelp AO, Henry MA. The influence of sour taste and cold temperature in pharyngeal transit duration in patients with stroke. Arq Gastroenterol. 2010;47:18-21.
10. Dantas RO, Alves LM, Santos CM, Cassiani R de A. Possible interaction of gender and age on human swallowing behavior. Arq Gastroenterol. 2011;48:195-8.
11. Baroni AF, Fábio SR, Dantas RO. Risk factors for swallowing dysfunction in stroke patients. Arq Gastroenterol. 2012;49:118-24.
12. Dalmazo J, Aprile LR, Dantas RO. Esophageal contractions, bolus transit and perception of transit after swallows of liquid and solid boluses in normal subjects. Arq Gastroenterol. 2012;49:250-4.
13. Nicaretta DH, Rosso AL, Mattos JP, Maliska C, Costa MM. Dysphagia and sialorrhea: the relationship to Parkinson’s disease. Arq Gastroenterol. 2013;50:42-9.
14. Bonadiman A, Teixeira AC, Goldenberg A, Farah JF. Dysphagia after laparo-scopic total fundoplication: anterior or posterior gastric wall fundoplication? Arq Gastroenterol. 2014;51:113-7.
15. Alves LM, Secaf M, Dantas RO. Effect of a bitter bolus on oral, pharyngeal and esophageal transit of healthy subjects. Arq Gastroenterol. 2013;50:31-4.
16. Scheeren B, Maciel AC, Barros SG. Videofluoroscopic swallowing study: esophageal alterations in patients with dysphagia. Arq Gastroenterol. 2014; 51:221-5.
17. Nascimento WV, Santos CM, Cassiani RA, Dantas RO. Influence of age on swallows of a highly viscous liquid bolus. Arq Gastroenterol. 2015;52:32-6.
18. Silva AC, Aprile LR, Dantas RO. Effect of gum chewing on air swallowing, saliva swallowing and belching. Arq Gastroenterol. 2015;52:190-4.
19. Dantas RO, Santos CM, Cassiani RA, Alves LM, Nascimento WV. Postfundo-plication dysphagia causes similar water ingestion dynamics as achalasia. Arq Gastroenterol. 2016;53:98-102.
20. Santos CM, Cassiani RA, Dantas RO. Videofluoroscopic evaluation of swallows in anorexia nervosa. Arq Gastroenterol. 2016;53:136-40.
21. Pontes ÉS, Amaral AK, Rêgo FL, Azevedo EH, Silva PO. Quality of life in swal-lowing of the elderly patients affected by stroke. Arq Gastroenterol. 2017;54:27-32.
22. Moda I, Ricz HMA, Aguiar-Ricz LN, Dantas RO. Swallowing in patients with laryngitis. Arq Gastroenterol. 2018;55:50-4.
23. Costa MMB. Neural control of swallowing. Arq Gastroenterol. 2018;55 (Suppl 1):61-75.
24. Costa TV, Dantas RO. Altered esophageal motility during perception of bolus transit in healthy volunteers. Arq Gastroenterol. 2019;56:386-9.

AHEAD OF PRINTORIGINAL ARTICLE
Arq Gastroenterol • 2019. v. 56 nº 4 out/dez • 333
INTRODUCTION
The liver plays an important role in maintaining metabolic homeostasis and biotransformation of chemicals in the body(1). Hepatic diseases are a worldwide health problem, and are triggered mainly by viruses, metabolic diseases or chemical compounds(2-4).
The treatment of such diseases is carried out conventionally using synthetic pharmaceuticals, or, secondarily, by using isolated compounds or parts of medicinal plants used in popular medicine(5,6).
However, there are still few drugs used to treat liver diseases with significant effects on humans(7). Thus, medicinal plants with hepatoprotective or curative activity used for the treatment of he-patic disorders become important subjects of studies to elucidate their mechanism of action and characterize compounds that can be used for the development of new hepatoprotective drugs(8).
Some experimental models are used to demonstrate the hepatoprotective action of certain plants, especially against paracetamol-induced liver damage(9). Paracetamol may promote hepatocellular injury through three mechanisms, independently or in association. The first and most common mechanism is inges-tion of doses higher than 10 g by adults and up to 150 mg/kg by children, popularly known as “overdose”. The second mechanism is the cytochrome P450 (CYP) over activation, resulting from the use of enzyme-inducing drugs and chronic alcohol abuse. Finally,
Hepatoprotective efficacy of methanolic extract of Indigofera suffruticosa (Mill) on paracetamol–induced liver damage in miceIzabela Rangel LIMA1, Ivanise Brito SILVA1, Roberta M Leite LIMA1, Tainá M Santos SILVA1, Maria B Sousa MAIA2 and Sônia Pereira LEITE1
Received 13/3/2019Accepted 23/7/2019
ABSTRACT – Background – Indigofera suffruticosa Mill (Fabaceae) is abundant in northeastern Brazil and popularly used in the treatment of infectious and inflammatory processes. Several biological properties, such as anti-inflammatory, anticancer, antitumor, hepatoprotective and low toxicity, are reported for this plant. Objective – This study investigated hepatoprotective activity and the antioxidant effect of methanolic extract of I. suffruticosa leaves (MEIS) on Swiss albino mice submitted to experimental models of acetaminophen-induced liver injury. Methods – MEIS (50 mg/kg; p.o.) was standardized according to the LD50 and its hepatoprotective property on Swiss albino mice evaluated during a 7-day period. On the eighth day, the acetaminophen-induced hepatic injury was performed. Histomorphometric analysis of liver tissue, antioxidant activity and serum levels of alanine aminotransferase (AST), aspartate aminotransferase (ALT) and bilirubin were measured. Results – MEIS (50 mg/kg; p.o.) restored serum enzyme levels and results were close to those of positive control (silymarin) when compared to the negative control. Histopathological and histomorphometric analyzes confirmed MEIS hepatoprotective activity, showing reorganization of structural units of cells, nuclei and sinusoidal capillaries of hepatocytes, reducing the damage on liver tissue and increasing organ regeneration rate. MEIS showed high antioxidant potential at concentrations of 1000 and 500 µg/mL. Conclusion – This study suggests that MEIS has hepatoprotective activity and high antioxidant potential.
HEADINGS – Chemical and drug induced liver injury. Indigofera, drug effects. Antioxidants. Acetaminophen. Mice.
Declared conflict of interest of all authors: noneDisclosure of funding: This study was supported by the Coordinator of Improvement of Higher Level Personnel (CAPES) and National Council of Scientific and Technological Development (CNPQ) at Federal University of Pernambuco (UFPE).1 Universidade Federal de Pernambuco, Laboratório de Histomoformetria, Departamento de Histologia e Embriologia Recife, PE, Brasil. 2 Universidade Federal de Pernambuco, Laboratório de Produtos Naturais e Bioativos, Departamento de Fisiologia e Farmacologia, Brasil.Corresponding author: Sônia Pereira Leite. E-mail: [email protected]
the third mechanism occurs with glucagon depletion in hepatocytes through alcohol intake or malnutrition(10). Indigofera suffruticosa Mill (Fabaceae) is abundant in the northeastern Brazil, and has intense popular use for treatment of infections, inflammations and other processes, without reports of harmful side effects to humans. The phytochemical investigation of leaf extracts of I. suffruticosa revealed the presence of alkaloids, flavonoids, ster-oids, proteins, carbohydrate, triterpenes and indigo coumarin(11,12) and, the chemical properties of two compounds isolated from I. suffruticosa leaves (indigo and indirubin) were identified, isolated and purified by Vieira et al.(13). Later, the bis-indolic alkaloid frac-tion of leaves of I. suffruticosa was investigated and proved to be a phytotherapeutic agent of liver(14). Pharmacological studies showed aqueous extracts of leaves of I. suffuticosa have anti-inflammatory, antimicrobial and embryotoxic properties, besides being used as alternative anticancer and antitumor therapy(12,15-18). The aqueous leaf extract of I. suffruticosa has been shown to inhibit egg hatching, larval ecdyse and to have detergent effects on oviposition of Aedes aegypti mosquitoes(19). Mice carrying sarcoma 180 had positive hepatic response to subchronic treatment with methanolic extract of I. suffruticosa leaves(20). The structural organization of the renal tubules and hepatocyte nuclei of mice were preserved after treat-ment with I. suffruticosa(21,22). The aqueous extract of I. suffruticosa leaves has low toxicity, with 98% viability of larvae(19).
AG-2019-46dx.doi.org/10.1590/S0004-2803.201900000-62

Lima IR, Silva IB, Lima RML, Silva TMS, Maia MBS, Leite SP.Hepatoprotective efficacy of methanolic extract of Indigofera suffruticosa (Mill) on paracetamol–induced liver damage in mice
334 • Arq Gastroenterol • 2019. v. 56 nº 4 out/dez
Due to the anti-inflammatory, anticancer and antitumor pro-perties, and because it is a liver protective agent with previously reported low toxicity, we hypothesize the plant can be used as a hepatoprotective phytotherapic agent. This study investigated the effect of I. suffruticosa on the hepatoprotective activity as well as its antioxidant effect through an experimental model of paracetamol-induced hepatic lesion in Swiss albino mice.
METHODS
ChemicalsMethanol, distilled water, 10% formalin, sodium chloride (0.9%
NaCl), hematoxylin, eosin, silymarin and acetaminophen were supplied by Merck (Germany).
Plant material and extractionLeaves of I. suffruticosa were collected in the city of Recife, state
of Pernambuco, Brazil, in July 2014. The sample was certified by the biologist Marlene Barbosa from the Department of Botany at the Federal University of Pernambuco (UFPE) and it is deposited under the n. 43694 in the Herbarium of the Center for Biological Sciences – (UFPE). Leaves of I. suffruticosa (1.3 kg) were washed in running water, pulverized and extracted with methanol (MeOH) at room temperature for 48 hours. Then, the solvent was filtered and evaporated at 35°C under reduced pressure. The methanolic extract of I. suffruticosa leaves (MEIS) yielded 54.5 g. Fresh dilu-tion of dried extract in saline solution (0.9% NaCl) was prepared on the day of experiments.
Experimental animalsEighteen healthy male Swiss albino mice, aged 40 days,
weighing on average 35 to 45 g were acquired from the Aggeu Magalhães Research Center (Pernambuco, Brazil). Animals had free access to water and feed. They were kept under standard en-vironmental conditions of temperature, humidity 12:12 light-dark cycle. The Committee on Animal Research and Ethics of UFPE approved the experiments under opinion n. 500/12, process n. 23076.025195/2012-64 of 2012.
Experimental design and treatment arrangementSwiss albino mice were randomly divided into three groups
(n=6 animals/group) and orally pre-treated during seven days be-fore paracetamol–induced liver damage, according their respective group: G1 – treated with saline (15 mL/kg; p.o.), G2 – treated with Silymarin (25 mg/kg; v.o.) and G3 – treated with MEIS (50 mg/kg; v.o.). The I. suffuticosa extract dose was based on LD50(19). In the eighth day, after fasting for 12 h, the mice were administered with paracetamol (300 mg/kg; v.o.). Twenty four hours later, blood was gained through cardiac puncture, and serum was separated for later determination of alanine aminotransferase (ALT), aspar-tate aminotransferase (AST) and bilirubin. Following they were euthanized cervical dislocation for collection of liver samples.
Levels of transaminasesSerum enzyme levels (alanine aminotransferase (ALT), aspar-
tate aminotransferase (AST) and bilirubin of groups G1, G2 and G3 of Swiss albino mice submitted to pretreatment with IS extract prior to paracetamol-induced hepatic injury were analyzed using commercial kits according to the manufacturer’s protocols.
Histopathological and histomorphometric analysis of liverThe liver of control groups (G1 and G2) and treatment group
(G3) were fixed in 2.5% formaldehyde and stained with hematoxy-lin and eosin (HE)(23). Thirty histological sections were analyzed through four random fields. The histological sections were digitized using a digital video camera (Leica DFC 280, Wentzler, Germany) coupled to a light microscope (Leica Microscopy & Systems GmbH, Wentzler, Germany) under 40x final magnification. Morphometric evaluation, the perimeter of hepatocyte nuclei and the diameter of sinusoidal capillaries were determined using the Scion Image software (Scion Corporation, New York, USA).
In vitro antioxidant assay – DPPH radical scavenging activity
The antioxidant activity of MEIS was determined by using a 1,1-diphenyl-2-picrylhydrazyl (DPPH) assay. Briefly, different con-centrations of MEIS (1,000, 500, 250 and 125 μg/mL) and DPPH (0.4mM) were prepared in ethanol. For determination of MEIS antioxidant activity, sample were mixed with DPPH solution (1:1; v/v) for 40 minutes at room temperature. After incubation period, the absorbance of the solution was measured at 517 nm using a microplate reader and related to the negative control (DPPH and ethanol). All tests were carried out in triplicate, and the ability to eliminate DPPH (% of antioxidant activity) was calculated using the following equation:
Statistical analysisThe results for levels of transaminases, as well as histopatho-
logical and histomorphometric parameters of hepatocytes nuclei = were expressed as mean ± SEM (standard error of the mean) and analyzed by Kruskal-Wallis test at P<0.001. The antioxidant activity was analyzed by Tukey test (P≤0.05) using the Assistat software – version 7.6 beta.
RESULTS
Levels of transaminasesTABLE 1 shows the serum levels of alanine aminotransferase
(ALT), aspartate aminotransferase (AST) and bilirubin of Swiss al-bino mice treated with MEIS prior to paracetamol-induced hepatic injury (PCM). The animals of the group (G1) showed high levels of
TABLE 1. Serum levels of alanine aminotransferase (ALT), aspartate aminotransferase (AST) and bilirubin in Swiss albino mice treated with MEIS prior to paracetamol-induced hepatic injury (PCM).
Group Dose (mg/kg) ALT (IU/L) AST (IU/L) Bilirubin
(mg/L)
G1 15 mL/kg 94.48±6.89** 120.98±13.67** 7.9±3.5**
G2 25 mg/kg 31.36±4.78 36.65±5.35 1.4±0.5
G3 50 mg/kg 37.78±4.56* 39.24±5.78* 2.1±1.2*
Results are expressed as mean ± SEM. * Statistically significant compared to animals treated with saline solution (P<0.05). ** Statistically significant for animals treated with silymarin and Indigofera suffruticosa extract (P<0.05).
Elimination [DPPH] % = (Abs sample - Abs control) ________________________
X 100 Abs control
Lima IR, Silva IB, Lima RML, Silva TMS, Maia MBS, Leite SP.Hepatoprotective efficacy of methanolic extract of Indigofera suffruticosa (Mill) on paracetamol–induced liver damage in mice
Arq Gastroenterol • 2019. v. 56 nº 4 out/dez • 335
ALT (94.48±6.89), AST (120.98±13) and bilirubin (7.9±3.5) com-pared to animals treated with silymarin (G2): ALT (31.36±4.78), AST (36.65±5.35) and bilirubin (1.4±0.5), which reduced serum enzyme levels. Results of G2 were close to those treated with MEIS (G3): ALT (37.78±4.56), AST (39.24±5.78) and bilirubin (2.1±1.2). The reduction in serum levels of these important markers related to liver integrity suggests a hepatoprotective activity of MEIS against paracetamol-induced hepatic injury.
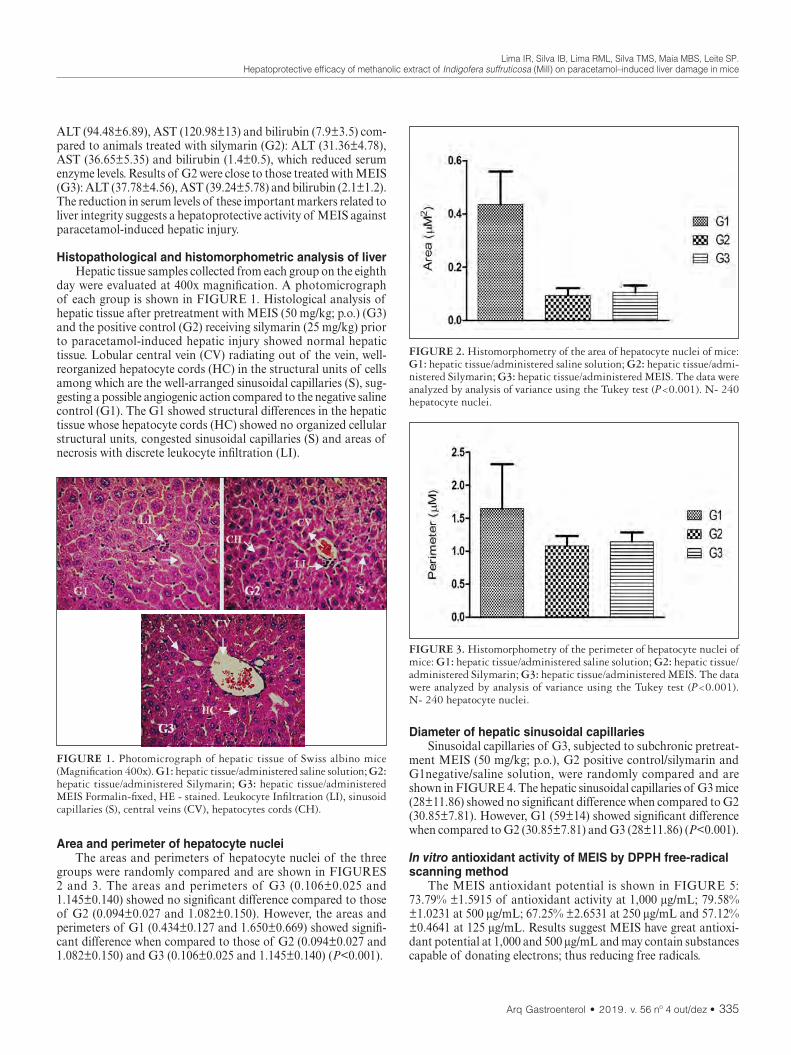
Histopathological and histomorphometric analysis of liverHepatic tissue samples collected from each group on the eighth
day were evaluated at 400x magnification. A photomicrograph of each group is shown in FIGURE 1. Histological analysis of hepatic tissue after pretreatment with MEIS (50 mg/kg; p.o.) (G3) and the positive control (G2) receiving silymarin (25 mg/kg) prior to paracetamol-induced hepatic injury showed normal hepatic tissue. Lobular central vein (CV) radiating out of the vein, well-reorganized hepatocyte cords (HC) in the structural units of cells among which are the well-arranged sinusoidal capillaries (S), sug-gesting a possible angiogenic action compared to the negative saline control (G1). The G1 showed structural differences in the hepatic tissue whose hepatocyte cords (HC) showed no organized cellular structural units, congested sinusoidal capillaries (S) and areas of necrosis with discrete leukocyte infiltration (LI).
FIGURE 1. Photomicrograph of hepatic tissue of Swiss albino mice (Magnification 400x). G1: hepatic tissue/administered saline solution; G2: hepatic tissue/administered Silymarin; G3: hepatic tissue/administered MEIS Formalin-fixed, HE - stained. Leukocyte Infiltration (LI), sinusoid capillaries (S), central veins (CV), hepatocytes cords (CH).
FIGURE 2. Histomorphometry of the area of hepatocyte nuclei of mice: G1: hepatic tissue/administered saline solution; G2: hepatic tissue/admi-nistered Silymarin; G3: hepatic tissue/administered MEIS. The data were analyzed by analysis of variance using the Tukey test (P<0.001). N- 240 hepatocyte nuclei.
FIGURE 3. Histomorphometry of the perimeter of hepatocyte nuclei of mice: G1: hepatic tissue/administered saline solution; G2: hepatic tissue/administered Silymarin; G3: hepatic tissue/administered MEIS. The data were analyzed by analysis of variance using the Tukey test (P<0.001). N- 240 hepatocyte nuclei.
Area and perimeter of hepatocyte nucleiThe areas and perimeters of hepatocyte nuclei of the three
groups were randomly compared and are shown in FIGURES 2 and 3. The areas and perimeters of G3 (0.106±0.025 and 1.145±0.140) showed no significant difference compared to those of G2 (0.094±0.027 and 1.082±0.150). However, the areas and perimeters of G1 (0.434±0.127 and 1.650±0.669) showed signifi-cant difference when compared to those of G2 (0.094±0.027 and 1.082±0.150) and G3 (0.106±0.025 and 1.145±0.140) (P<0.001).
Diameter of hepatic sinusoidal capillariesSinusoidal capillaries of G3, subjected to subchronic pretreat-
ment MEIS (50 mg/kg; p.o.), G2 positive control/silymarin and G1negative/saline solution, were randomly compared and are shown in FIGURE 4. The hepatic sinusoidal capillaries of G3 mice (28±11.86) showed no significant difference when compared to G2 (30.85±7.81). However, G1 (59±14) showed significant difference when compared to G2 (30.85±7.81) and G3 (28±11.86) (P<0.001).
In vitro antioxidant activity of MEIS by DPPH free-radical scanning method
The MEIS antioxidant potential is shown in FIGURE 5: 73.79% ±1.5915 of antioxidant activity at 1,000 μg/mL; 79.58% ±1.0231 at 500 μg/mL; 67.25% ±2.6531 at 250 μg/mL and 57.12% ±0.4641 at 125 μg/mL. Results suggest MEIS have great antioxi-dant potential at 1,000 and 500 μg/mL and may contain substances capable of donating electrons; thus reducing free radicals.

Lima IR, Silva IB, Lima RML, Silva TMS, Maia MBS, Leite SP.Hepatoprotective efficacy of methanolic extract of Indigofera suffruticosa (Mill) on paracetamol–induced liver damage in mice
336 • Arq Gastroenterol • 2019. v. 56 nº 4 out/dez
and bilirubin, reduced hepatic tissue damage and increased organ regeneration rate. MEIS (50 mg/kg; p.o.) restored serum enzyme levels and results were close to those of positive control (silymarin) when compared to the negative control. This effect was similar to the group treated with silymarin. Possibly, this effect is associated with the extract antioxidant activity. On the other hand, the negative control presented increasing ALT, AST and bilirrubine serum levels. The serum enzyme levels using Caralluma umbellate, a perennial and succulent herb, were investigated. Pretreatment with ethanolic extract followed by paracetamol administration led to reduced levels of total bilirubin, cholesterol, ALT, AST, and alkaline phosphatase. The extract showed hepatoprotective activity for restoring serum enzyme levels and preventing oxitive stress(31). Similar data were described for Melia azedarach L. (cinnamon) used for treatment of leprosy and inflammatory processes. The methanolic extract of Melia azedarach (500 mg/kg) administered in rats for seven days, followed by the par-acetamol administration on the 5th day showed a hepatoprotective activity, reducing levels of AST, ALT and alkaline phosphatase and increasing enzyme activity(27). The hepatoprotective potential in our study was due to the MEIS pretreatment at 50 mg/kg, which showed restoration of normal physiology of serum enzyme levels. These data can be corroborated by histological analysis of liver. Histological analysis is an important tool for detection of morpho-logical changes in the liver caused by bioactive compounds. The results of histological analysis showed structural organization in the hepatic tissue of mice subjected to paracetamol-induced injury after subchronic pretreatment with MEIS, similarly to the positive control/silymarin. However, hepatic tissue changes observed for the negative/saline solution control included: congested sinusoids, changes in hepatocyte cords and areas of necrosis and hemorrhage, characterizing leukocyte infiltration. Our data corroborate the results found by Silva et al.(21) who demonstrated that the aqueous extract of I. suffriticosa leaves preserved the liver architecture, suggesting its use as alternative hepatoprotective agent(21). In this study, there was reorganization of hepatocyte structural units and s inusoidal capillary cells, suggesting a possible angiogenic action in the liver of mice treated with MEIS and corroborating the pharmacological, anti-inflammatory, anticancer and antitumor properties of the extract(15,17,18).
The histomorphometric analysis of the area and perimeter of hepatocyte nuclei and diameter of sinusoidal capillaries of mice subjected to paracetamol-induced injury after subchronic treatment with MEIS were similar when compared to silymarin. The groups pretreated with MEIS or silymarin showed no significant statistical differences. These data corroborate histological and morphomet-ric analyses of experiments performed by Lima et al. (2014) who showed the absence of a structural change in the hepatic epithelium of mice carrying sarcoma 180 after treatment with Indican isolated of methanol extract from I. suffruticosa leaves. However, significant changes were observed in the control group with sarcoma 180(14).
The nuclei and sinusoidal capillaries of hepatocytes after subchronic treatment with extract and silymarin showed protec-tive effect on the hepatic tissue of mice compared to the negative control. The results of this study suggest a possible angiogenic action due to a structural reorganization of glandular epithelial tissue, cells, nuclei and sinusoidal capillaries of hepatocytes after subchronic treatment with MEIS. This may also be due to its in-terference with DNA synthesis. The same mechanisms of aqueous extract of I. suffruticosa may be involved in the embryo develop-ment in mice(16). Biological activities of compounds detected in
FIGURE 5. Comparison of the antioxidant activity of the MEIS at diffe-rent concentrations. The data were analyzed by analysis of variance using the Tukey test (P<0.001).
FIGURE 4. Histomorphometry of the diameter of hepatic sinusoids capillaries of mice: G1: hepatic tissue/administered saline solution; G2: hepatic tissue/administered silymarin; G3: hepatic tissue/administered MEIS. The data were analyzed by analysis of variance using the Tukey test (P<0.001). N- 240 hepatic capillaries.
DISCUSSION
Liver diseases are a worldwide health problem mainly trig-gered by viruses, metabolic diseases or chemical compounds(2-4). The hepatoprotective activity of plant extracts and compounds has been verified through the model of paracetamol-induced intoxication (PCM)(9,24-27). The increase in serum enzyme levels is among the evidence of PCM-induced hepatic injury(28). Serum enzymes levels act as markers reflecting both hepatocellular necrosis and their release into the blood after damage to cell membrane(29,30).
I. suffruticosa has been used in traditional medicine for the treatment of infections and inflammation without reports of side effects to humans. These data were demonstrated by its proper-ties: anti-inflammatory, embryotoxic, antimicrobial, anticancer, antitumor, hepatoprotective and low toxicity(12,15-18,20). This study investigated the effects of MEIS on paracetamol-induced liver injury and its in vitro antioxidative action on Swiss albino mice.
Mice pretreated with MEIS prior to paracetamol – induced he-patic injury showed restoration of serum enzyme levels of ALT, AST

Lima IR, Silva IB, Lima RML, Silva TMS, Maia MBS, Leite SP.Hepatoprotective efficacy of methanolic extract of Indigofera suffruticosa (Mill) on paracetamol–induced liver damage in mice
Arq Gastroenterol • 2019. v. 56 nº 4 out/dez • 337
the methanolic extract of I. suffruticosa leaves may be related to the antitumor activity found by Vieira et al.(18). Other studies have reported the preservation of structural organization of renal tubules and hepatocyte nuclei of mice following treatment with I. suffruticosa(20, 22).
Muthulingam et al., using paracetamol as acute hepatotoxicity model, reported that the treatment of animals with aqueous extract of Indigofera tinctoria showed marked reduction of necrosis and liver tissue degeneration(30). The efficacy of any hepatoprotective drug is essentially dependent on its ability to reduce harmful ef-fects or maintain the normal hepatic physiology that has been disrupted by a hepatotoxin(31,32). Silymarin extracted from seeds of Marian thistle (Silybum marianum) consists of many polyphenolic flavonoids, including silibinin (the main one), isosilybine, silycristin and silydianin(33). Silymarin has been used for centuries because of its known hepatoprotective effects and several pharmacologi-cal properties(32).
Lipid peroxidation is a chain reaction of polyunsaturated fatty acids of cell membranes generating free radicals that change their permeability, fluidity and integrity(33). Antioxidant activity provides health benefits by inhibiting lipid peroxidation(34). The percentage of antioxidant activity is proportional to the amount of DPPH consumed by the sample(35,36). Thus, the higher the DPPH consumption per sample, the lower its absorbance and the higher its antioxidant activity.
Our study on the antioxidant activity of MEIS (1,000 µg/mL and 500 µg/mL) suggests the presence of substances capable of donating electrons and thus reducing free radicals. These results suggest that MEIS have a great antioxidant potential directly related to the concentration increase. These results are similar to those found by Renukadevi et al. for methanolic extracts of Indigofera tinctoria, which showed significant antioxidant activity at the con-centrations tested(37). The hepatoprotective activity of MEIS found
in this study is probably related to chemical compounds capable of donating electrons and reducing free radicals(38); a fact confirmed by the antioxidant activity of this plant that induces the inhibition of the tissue injury according to studies reported in the pertinent literature(39). Also, other studies are recommended to evaluate the curative efficacy on hepatic tissue of mice in experimental models of paracetamol-induced hepatic injury subjected to post-treatment with MEIS. In conclusion, this study suggests that hepatic tissue of mice in experimental models of paracetamol-induced hepatic injury subjected to pretreatment with MEIS showed restoration of hepatic physiology at serum enzyme levels, reorganization of tissue structural units, hepatic sinusoidal cells and capillaries, besides antioxidant potential, indicating reduced damage to the hepatic tissue and increased organ regeneration rate. These data suggest that MEIS has hepatoprotective activity.
Authors’ contributionProfessor Leite SP: author responsible for the integrity of the
work. All authors Lima IR, Silva IB, Lima RML, Silva TMS were involved in the development of the research, collection of plant material preparation of the extract as well as histopathology and histomorphometry of hepatic tissue and the antioxidant potential. Professor Maia MBS: contributed to the experimental design and treatment schedule and to the analysis of enzymatic dosages.
OrcidIzabela Rangel Lima. Orcid: 0000-0002-3137-8415.Ivanise Brito da Silva. Orcid: 0000-0003-3605-0344.Tainá Maria dos Santos Silva. Orcid: 0000-0002-8142-1995.Roberta Maria Pereira Leite de Lima. Orcid: 0000-0002-8745-6398.Maria Bernadete de Sousa Maia. Orcid: 0000-0003-4616-2681.Sonia Pereira Leite. Orcid: 0000-0002-0634-9735.
Lima IR, Silva IB, Lima RML, Silva TMS, Maia MBS, Leite SP. Eficácia hepatoprotetora do extrato metanólico de Indigofera suffruticosa (Mill) em lesão hepática induzido por paracetamol em camundongos. Arq Gastroenterol. 2019;56(4):333-8.RESUMO – Contexto – Indigofera suffruticosa Mill (Fabaceae) é abundante no nordeste do Brasil e popularmente utilizada no tratamento de processos
infecciosos e inflamatórios. Várias propriedades biológicas, como anti-inflamatório, anticâncer, antitumoral, hepatoprotetor e baixa toxicidade, são relatadas para esta planta. Objetivo – Este estudo investigou a atividade hepatoprotetora e o efeito antioxidante do extrato metanólico de folhas de I. suffruticosa (MEIS) em camundongos albinos suíços submetidos a modelos experimentais de lesão hepática induzida por paracetamol. Métodos – O MEIS na dose de 50 mg/kg (via oral) foi padronizado de acordo com a LD50 e sua propriedade hepatoprotetora em camundongos albinos Swiss avaliados durante um período de sete dias. No oitavo dia, a lesão hepática foi induzida por paracetamol em todos grupos pre-tratados. Foram medidos os níveis sericos enzimaticos, alanina aminotransferase, aspartato aminotransferase e bilirrubina, análise histomorfométrica do tecido hepático e ati-vidade antioxidante. Resultados – O MEIS restaurou os níveis séricos de enzimas e os resultados foram próximos aos do controle positivo (silimarina) quando comparados ao controle negativo. As análises histopatológicas e histomorfométricas confirmaram a atividade hepatoprotetora do MEIS, mostrando reorganização das unidades estruturais das células, núcleos e capilares sinusoidais dos hepatócitos, reduzindo os danos no tecido hepático e aumentando a taxa de regeneração de órgãos. O MEIS apresentou alto potencial antioxidante nas concentrações de 1000 e 500 µg/mL. Conclusão – Este estudo sugere que I. suffruticosa tem atividade hepatoprotetora e alto potencial antioxidante.
DESCRITORES – Doença hepática induzida por substâncias e drogas. Indigofera, efeitos dos fármacos. Antioxidantes. Acetaminofen. Camundongos.

Lima IR, Silva IB, Lima RML, Silva TMS, Maia MBS, Leite SP.Hepatoprotective efficacy of methanolic extract of Indigofera suffruticosa (Mill) on paracetamol–induced liver damage in mice
338 • Arq Gastroenterol • 2019. v. 56 nº 4 out/dez
REFERENCES
1. Brasileiro Filho, G. Patologia. 6 eds. Rio de Janeiro: Guanabara Koogan. 2000.2. Negi AS, Kumar JK, Luqman S, Shanker K, Gupta MM, Khanuja SP Recent
advances in plant hepatoprotectives: A cheminal and biological prolife of some important leads. Medicinal Research Reviews. 2008;28:746-72.
3. Graier W, Malli R, Kostner GM. Mitochondrial protein phostorrylation instigator or target of lipotoxicity? Trends Endocrinol Metab. 2009;20:186-93.
4. Lens S, Crespo G, Carrión JA, Miquel R, Navasa MCrespo G, Carrión JA, Miquel R, Navasa M. Severe acute hepatitis in the dress syndrome: Report of two cases. Annals of Hepatology. 2010;9:198-201.
5. Aktay G, Deliorman D, Ergun E, Ergun F, Yesilada E, Cevik C. Hepatoprotective effects of Turkish folk remedies on experimental liver injury. J Ethnopharmacol. 2000;73:121-9.
6. Dhiman, Chawla D. Herbal Medicines for Liver Diseases Digestive. Dig Dis Sci. 2005;50:1807.
7. Muriel P, Rivera-Espinoza Y. Beneficial drugs for liver diseases. J Appl Toxicol. 2008;28:93-103.
8. Girish C, Koner BC, Jayanthi S, Ramachandra Rao K, Rajesh B, Pradhan SC Hepatoprotective activity of picroliv, curcumin and ellagic acid compared to silymarin on paracetamol induced liver toxicity in mice. Fundam Clin Pharmacol. 2009;23:735-45.
9. Kumar G, Banu GS, Pappa PV, Sundararajan M, Pandian MR. Hepatoprotective activity of Trianthema portulacastrum L.against paracetamol and thioacetamide intoxication in albino rats. J Ethnopharmacol. 2004;92:37-40.
10. Lopes J, Matheus ME. Risk of hepatotoxicity with Acetaminophen. Rev. Bras. Farm. 1012;93:411-4.
11. Leite SP. Indigofera Suffruticosa Mill: ensaio fitoquímico e ações biológicas. Tese (Doutorado em produtos naturais). João Pessoa: Universidade Federal da Paraíba. 2003. 01-90.
12. Leite SP, Vieira JRC, Medeiros PL, Leite RMP, Li.ma VLM, Xavier SH, Lima EO. Antimicrobial activity of Indigofera suffruticosa. Evid Based Complement Alternat Med. 2006;3:261-5.
13. Vieira JRC. Investigação farmacognóstica e biológica de folhas de Indigofera suffruticosa Mill sobre Aedes aegypti. Tese (Doutorado em Ciências Farmacêu-ticas) – Departamento de Ciências Farmacêuticas. Recife: Universidade Federal de Pernambuco, 2011.
14. Lima IR, Vieira JR, Silva IB, Leite RM, Maia MB, Leite SP. Indican from Anil (Indigofera suffruticosa Miller): An herbal protective agent in liver. Analytical and Quantitative Cytology and Histology. 2014;36:41-5.
15. Leite SP, Silva LLS, Catanho MTJA, Lima EO, Lima VLM. Anti-inflammatory Activity of Indigofera suffruticosa extract. REBRASA. 2003;7:47-52.
16. Leite SP, Medeiros PL, Silva, EC, Maia MBS, Lima VLM, Saul DE, Embryo-toxicity in vitro with extract of Indigofera suffruticosa leaves. Birth Defects Res B Dev Reprod Toxicol. 2004;701-5.
17. Vieira JRC, Souza IA, Nascimento SC, Leite SP. Indigofera suffruticosa: an alternative anticancer therapy. Evidence-Based Complementary and Alternative Medicine. 2007;1-5.
18. Vieira JRC, Souza IA, Nascimento SC, Leite SP. Antitumoral ctivity of indigofera suffruticosa. - An. Fac. Med. Univ. Fed. Pernambuco. 2007; 52:12-4.
19. Vieira JRC, Leite RMP, Lima IR. Navarro DAF, Bianco EM, Nascimento SC, Leite SP. Oviposition and Embryotoxicity of Indigofera suffruticosa on Early Developmentof Aedes aegypti (Diptera: Culicidae). Evid Based Complement Alternat Med. 2012;741638:1-6.
20. Lima IR. Investigação da Indigofera suffruticosa sobre atividade antitumoral e aspectos histológicos e morfométricos do tecido hepático de camundongos portadores de sarcoma 180. Dissertação (Mestrado - Programa de Pós-graduação
em Inovação Terapêutica. Universidade Federal de Pernambuco), Recife. 2012.21. Silva IB, Lima IR, Santana MAN, Leite RMP, Leite SP. Indigofera suffruticosa
Mill (fabaceae): hepatic responses on mice bearing Sarcoma 180. Int. J. Morphol. 2014;32:1228-33.
22. Santana MAN, Silva IB, Lima IR, Vieira JRC, Leite RMP, Leite SP. Histomor-phometric analysis in kidney tissue of mice treated with Indigofera suffruticosa Mill. J Pharm Pharm Sci. 2015;7:12-8.
23. Masson P. Tumors Humanism: Histologic. Diagnostics et Techniques. 2a ed. Paris, Libraire Maloine. 1956;106-48.
24. Singh SS, Handa. Hepatoprotective activity of Apium graveolens and Hygrophila auriculata against paracetamol and thioacetamide intoxication in rats. J Ethno-pharmacol. 195;49:119-26.
25. Ahmed MF, Rao AS, Thayyll H, Ahemad SR. Role of Melia azedarach leaf extract in Paracetamol Induced Hepatic damage in rats. Pharmacognosy Journal. 2011;3:60-4.
26. Kaplowitz N. Drug-induced liver disorders: implications for drug development and regulation. Drug Safety. 2001;24:483-90.
27. Choi JS, Yoon TJ, Kang KR, Lee KH, Kim WH, Suh YH, Song J, Jung MH. Glycoprotein Isolated from Acanthopanax senticosus Protects against Hepato-toxicity Induced by Acute and Chronic Alcohol Treatment. Biol Pharm Bull. 2006;29:306-14.
28. Janbaz KH, Gilani AH. Studies on preventive and curative effects of berberine on chemical-induced hepatotoxicity in rodents. Fitoterapia. 2000;71:25-33.
29. Shanmugam G, Ayyavu M, Rao DM, Devarajan T, Subramanim G. Hepatopro-tective effect of Caralluma umbellate against acetaminophen induced oxidative stress and liver damage in rat. J Pharm Res. 2013;6:342-5.
30. Renteria IB, Corona MRC, Rosales PC, Garza HGL, Nava DC, Mendosa FJA, Cantú EMT. Hepatoprotective effect of Leucophyllum frutescens on Wistar albino rats intoxicated with carbon tetrachloride. Ann Hepatol. 2007;4:251-4.
31. Kuppuswamy R, Govindaraju A, Velusamy G, Balasubramanian R, Balasund-arm J, Sellamuthu M. Effect of Dried Fruits of Solanum nigrum LINN against CCl4-Induced Hepatic Damage in Rats. Biol Pharm Bull. 2003;11:1618-9.
32. Muthuligam FAF, Antihepatotoxic Efficacy of Methanolic Extract of Indigofera tinctoria (Linn.) on Paracetamol – Induced Liver Damage in Rats. J Nat Prod Plant Resour. 2012;2:244-50.
33. My, G, Balasubramanian R, Balasundarm J, Sellamuthu M. Effect of Dried Fruits of Solanum nigrum LINN against CCl4-Induced Hepatic Damage in Rats. Biol Pharm Bull. 2003;11:1618-9.
34. Jia JD, Bauer M, Cho JJ, Ruehl M, Milani S, Boigk G, Riecken EO, Schuppan D. Antifibrotic effect of silymarin in rat secondary biliary fibrosis is mediated by downregulation of procollagen alpha1(I) and TIMP-1. J Hepatol. 2001;3:392-8.
35. Stahl W, Aust O, Sies H MC. Polidori Analysis of lipophilic antioxidants in human serum and tissues: Tocopherols and carotenoids. J Chromatogr. 2001;936:83-93.
36. Shobana S, Naidu KA. Antioxidant activity of selected Indian spices. Prosta-glandins Leukot Essent Fatty Acids. 2000;62:107-10.
37. Renukadevi KP, Sultana SS. Determination of antibacterial, antioxidant and cytotoxicity effect of Indigofera tinctoria on lung cancer cell line NCI- h69. Int J. Pharmacol. 2011;7:356-62.
38. Alves CQ, Brandão HN, David JM, David JP, Lima LS. Avaliação da atividade antioxidante de flavonóides. Diálogos e ciência – Revista da rede ensino FTC. 2007;5:7-8.
39. Devasagayam TPA, Devasagayam KB. Sainis. Immune system and antioxidants, especially those derived from Indian medicinal plants, Indian. J Exp Biol. 2002;6:639-55.
AHEAD OF PRINTORIGINAL ARTICLE
Arq Gastroenterol • 2019. v. 56 nº 4 out/dez • 339
INTRODUCTION
Liver transplantation is the main therapeutic alternative for patients with chronic advanced liver disease(1). The solid organ is a limited resource since the number of potential transplant recipients and the available donors are scarce, which results in a long wait. In this context, patients “most likely to succeed” must be carefully selected. The literature demonstrates high prevalence of psychiat-ric comorbidities on the waiting list for liver transplantation(2-5). It is observed that 40% or more of the individuals enrolled in the liver transplant list have comorbid psychiatric disorders, which may negatively affect the outcome of the procedure and consequently the quality of life(6). However, it is not clear in the literature if different causes of liver transplantation present distinct prevalence of mental disorder(7). Hepatitis C virus (HCV), alcoholic liver disease (ALD) and non-alcoholic steatohepatitis (NASH) are clinical conditions which are most associated with indication for liver transplantation(8). Individuals with HCV often experience a six-fold increased risk of suicide and the onset of depressive symptoms and anxiety that result in decreased quality of life compared to the general population(9).
Mental disorders and quality of life in patients awaiting liver transplantation
Lívia N F GUERREIRO-COSTA1, José Edson O ARAÚJO-FILHO2, Roberta Ferrari MARBACK1, Ana Paula JESUS-NUNES1, Mychelle MORAIS-DE-JESUS1 and Lucas C QUARANTINI1,2,3
Received 31/3/2019Accepted 14/8/2019
ABSTRACT – Background – Liver transplantation is the main therapeutic alternative for patients with advanced liver disease. These patients have high prevalence of psychiatric comorbidities that may negatively interfere in clinical outcomes and quality of life. It is not clear in the literature whether the different etiologies of hepatic disease have the same prevalence of psychiatric disorders. Objective – The aim of this study was to investigate whether patients in the liver transplant list showed differences in psychiatric characteristics, medical variables and quality of life among different etiological groups. Methods – This is a cross-sectional study that evaluates quality of life, psychiatric and clinical comorbidities through the application of vali-dated questionnaires and instruments in 248 patients who were on transplant waiting list from 2010 to 2014, assisted in a University Hospital and in a Private Hospital in Salvador/Bahia, Brazil. The patients were evaluated through the Mini International Neuropsychiatric Interview (M.I.N.I. PLUS 5.0) and Medical Outcomes Short-Form Health Survey (SF-36). Results – The etiology of the most prevalent liver disease was hepatitis C virus. A prevalence of 50.8% of at least one mental disorder was identified. When alcohol abuse/dependence was excluded, the prevalence was 25.8%. Mental health did not show a statistically significant difference in the diverse etiological groups, but a higher prevalence of psychiatric comorbidities was detected among women and younger than 40 years. No cases of psychotic disorders were detected, possibly by exclusion prior to listing. There was no difference in the quality of life domains in the different liver etiological groups. Conclusion – A high-prevalence of psychiatric disorders was found among all clinical conditions most associated with indication for liver transplantation. Attention is drawn to the absence of patients with psychotic disorders, which suggests that transplantation may not have been indicated for this group of patients. For these reasons, professionals caring for liver transplant candidates should be highly vigilant for the presence of mental disorders, regardless of the etiology of liver disease. Specialized care is recommended to minimize the early exclusion of patients with no other therapeutic possibilities, as well as care of all people with mental disorders.
HEADINGS – Liver transplantation. Liver diseases. Mental disorders. Quality of life.
Declared conflict of interest of all authors: noneDisclosure of funding: This project was supported by the National Council of Technological and Scientific Development (CNPq): 462014/2014-2 – Edital Universal MCT/CNPQ 2014. The funders had no role in study design, data collection and analysis, decision to publish, or preparation of the manuscript.1 Universidade Federal da Bahia, Faculdade de Medicina, Programa de Pós-graduação em Medicina e Saúde, Salvador, BA, Brasil. 2 Universidade Federal da Bahia, Faculdade de Medicina, Salvador, BA, Brasil. 3 Universidade Federal da Bahia, Serviço de Psiquiatria, Com-HUPES, Salvador, BA, Brasil.Corresponding author: Lívia Guerreiro Costa. E-mail: [email protected]
ALD is one of the leading causes of chronic liver disease worldwide and has become a public health problem. This disease may range from simple steatosis, alcoholic hepatitis or steatohepatitis, progressive fibrosis, and eventually cirrhosis and/or hepatocellular carcinoma(10). Alcohol consumption corresponds to 3.8% of overall mortality(11).
This study aims to investigate whether patients in the liver trans-plant list showed differences in psychiatric characteristics, medical variables and quality of life according to the different liver diseases.
METHODS
This was a cross-sectional study which included patients, aged over 18 years, eligible for liver transplantation, enrolled in the Hepatology Service of Professor Edgar Santos University Hospital and Portuguese Hospital between 2010 and 2014. This study was approved by the local Institutional Review Board (MCO-UFBA – process number 14/2002) in accordance with the guidelines and norms of both the Brazilian Resolution 466/2012 and the Declara-tion of Helsinki of 2013 on research involving human beings. All participants provided written informed consent.
AG-2019-58dx.doi.org/10.1590/S0004-2803.201900000-63

Guerreiro-Costa LNF, Araújo-Filho JEO, Marback RF, Jesus-Nunes AP, Morais-de-Jesus M, Quarantini LC.Mental disorders and quality of life in patients awaiting liver transplantation
340 • Arq Gastroenterol • 2019. v. 56 nº 4 out/dez
Patients eligible for liver transplantation were analyzed in four different groups according to the clinical indication for transplanta-tion. The first group – HCV – was formed by individuals infected with hepatitis C, including individuals with hepatitis B coinfection. The second – ALD – had individuals with alcoholic liver cirrhosis. The third – HCV and ALD – included patients with both diag-noses and the fourth one – other indications – were composed of individuals nominated for transplantation due to other diseases, such as autoimmune hepatitis, NASH, Wilson’s disease, hepatitis B and liver cancer.
Patients admitted to the hepatic transplant outpatient clinic were evaluated after insertion in the transplant list, submitted to the analysis of clinical and instrumental data for the diagnosis of psychiatric disorders and quality of life (QOL).
QOL was evaluated by the SF-36 self-assessment scale, which has eight quality of life domains: physical functioning, limitation of roles due to physical aspects, pain, general health, vitality, social functioning, emotional aspects and mental health. Each domain ranges from 0 to 100(12).
The Mini International Neuropsychiatric Interview in its ex-tended version – M.I.N.I. PLUS 5.0(13) was used to standardize the diagnostic method during the research. It is based on the DSM-IV criteria, the 4th version of the American Psychiatric Association Handbook on Mental Disorders, and the ICD-10 (World Health Organization, 1997). The structural organization of M.I.N.I. is composed of modules represented by letters of the alphabet which correspond to each category of diagnosis. There are key issues at the beginning of each module that represent the required criterion/criteria for each diagnosis. The questions were answered with a simple “yes” or “no” and the questionnaire was applied by the trained researchers.
In accordance with the distribution of continuous variables data, they were compared by using Student’s t-test, Mann-Whitney test and ANOVA. The categorical variables were compared using the chi-square test and Fisher’s exact test (when necessary) and the powers of association between the independent variables as well as the outcomes studied were evaluated. Statistical analyses were performed using the Statistical Package for the Social Sciences soft-ware (version 21.0). Significance was defined as a value of P<0.05.
RESULTS
A total of 248 patients were included in the study: 193 (77.8%) patients were male and 55 (22.2%) female. Two hundred and seven patients were older than or equal to 40 years (83.5%). One hundred and seventy-six patients were married or had a stable relation-ship, 38 were divorced or widowed and 32 were unmarried. With regard to the occupation, 170 patients were active professionals, 14 unemployed, 45 retired by age and 16 away by illness (TABLE 1).
Regarding the etiological diagnosis, 69 patients had hepatitis C, 64 presented alcoholic etiology, 36 had hepatitis C associated with alcoholic etiology and in 43 of them it was related toother etiologies (TABLE 2).
TABLE 2 also indicates the association of psychiatric comor-bidities with demographic data, showing a higher prevalence of comorbidities among women (40%) and in those under 40 years (48.6%) P<0.05.
TABLE 3 shows that, although there is no statistically signifi-cant difference, patients with hepatitis C present a higher prevalence of five out of nine psychiatric comorbidities: current major depres-
sive episode, prior major depressive episode, anxiety disorders, illicit drug abuse and post-traumatic stress disorder. Patients with alcoholic etiology had a higher prevalence of alcohol abuse and/or dependence throughout life. No patient was diagnosed with psychotic disorders.
Concerning the clinical data, we did not detect any statistically significant difference regarding the prevalence of diabetes mellitus and arterial hypertension in the different etiological groups.
No statistically significant difference was detected among the four etiological groups of liver disease in any of the eight domains studied regarding quality of life (TABLE 4).
TABLE 1. Socio-demographic characteristics.
Variables N (%)
Gender
Female 55 (22.18)
Male 193 (77.82)
Age
<40 41 (16.53)
≥40 207 (83.47)
Marital status
Single 32 (12.90)
Married/Stable relationship 176 (70.97)
Divorced/Widowed 38 (15.33)
Occupation
Unemployed 14 (5.65)
Professionally active 170 (68.55)
Retired by age 45 (18.14)
Retired due to illness 16 (6.45)
TABLE 2. Distribution of psychiatric comorbidities.
Variables Total
Psychiatric comorbidities
P valueAbsence
N (%)Presence
N (%)
Gender 0.001*
Female 55 33 (60.0) 22 (40.0)
Male 193 160 (82.9) 33 (17.1)
Age 0.00*
<40 37 19 (51.4) 18 (48.6)
≥40 207 170 (82.1) 37 (17.9)
Diagnosis etiology 0.170**
HCV 69 53 (76.8) 16 (23.2)
ALD 64 53 (82.8) 11 (17.2)
HCV and ALD 36 31 (86.1) 5 (13.9)
Others 43 28 (65.1) 15 (34.1)
HCV: hepatitis C virus. ALD: alcoholic liver disease. *Exact Fisher. **Analyzed through pearson chi-square.
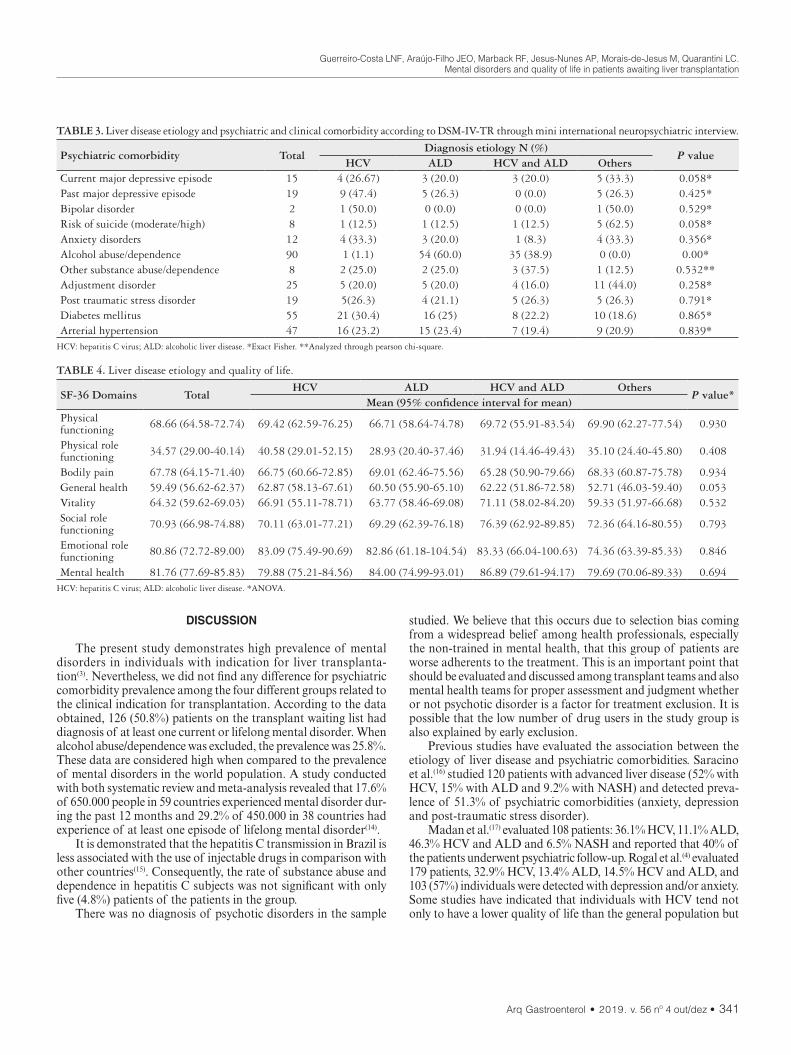
Guerreiro-Costa LNF, Araújo-Filho JEO, Marback RF, Jesus-Nunes AP, Morais-de-Jesus M, Quarantini LC.Mental disorders and quality of life in patients awaiting liver transplantation
Arq Gastroenterol • 2019. v. 56 nº 4 out/dez • 341
DISCUSSION
The present study demonstrates high prevalence of mental disorders in individuals with indication for liver transplanta-tion(3). Nevertheless, we did not find any difference for psychiatric comorbidity prevalence among the four different groups related to the clinical indication for transplantation. According to the data obtained, 126 (50.8%) patients on the transplant waiting list had diagnosis of at least one current or lifelong mental disorder. When alcohol abuse/dependence was excluded, the prevalence was 25.8%. These data are considered high when compared to the prevalence of mental disorders in the world population. A study conducted with both systematic review and meta-analysis revealed that 17.6% of 650.000 people in 59 countries experienced mental disorder dur-ing the past 12 months and 29.2% of 450.000 in 38 countries had experience of at least one episode of lifelong mental disorder(14).
It is demonstrated that the hepatitis C transmission in Brazil is less associated with the use of injectable drugs in comparison with other countries(15). Consequently, the rate of substance abuse and dependence in hepatitis C subjects was not significant with only five (4.8%) patients of the patients in the group.
There was no diagnosis of psychotic disorders in the sample
studied. We believe that this occurs due to selection bias coming from a widespread belief among health professionals, especially the non-trained in mental health, that this group of patients are worse adherents to the treatment. This is an important point that should be evaluated and discussed among transplant teams and also mental health teams for proper assessment and judgment whether or not psychotic disorder is a factor for treatment exclusion. It is possible that the low number of drug users in the study group is also explained by early exclusion.
Previous studies have evaluated the association between the etiology of liver disease and psychiatric comorbidities. Saracino et al.(16) studied 120 patients with advanced liver disease (52% with HCV, 15% with ALD and 9.2% with NASH) and detected preva-lence of 51.3% of psychiatric comorbidities (anxiety, depression and post-traumatic stress disorder).
Madan et al.(17) evaluated 108 patients: 36.1% HCV, 11.1% ALD, 46.3% HCV and ALD and 6.5% NASH and reported that 40% of the patients underwent psychiatric follow-up. Rogal et al.(4) evaluated 179 patients, 32.9% HCV, 13.4% ALD, 14.5% HCV and ALD, and 103 (57%) individuals were detected with depression and/or anxiety. Some studies have indicated that individuals with HCV tend not only to have a lower quality of life than the general population but
TABLE 4. Liver disease etiology and quality of life.
SF-36 Domains TotalHCV ALD HCV and ALD Others
P value*Mean (95% confidence interval for mean)
Physical functioning 68.66 (64.58-72.74) 69.42 (62.59-76.25) 66.71 (58.64-74.78) 69.72 (55.91-83.54) 69.90 (62.27-77.54) 0.930
Physical role functioning 34.57 (29.00-40.14) 40.58 (29.01-52.15) 28.93 (20.40-37.46) 31.94 (14.46-49.43) 35.10 (24.40-45.80) 0.408
Bodily pain 67.78 (64.15-71.40) 66.75 (60.66-72.85) 69.01 (62.46-75.56) 65.28 (50.90-79.66) 68.33 (60.87-75.78) 0.934General health 59.49 (56.62-62.37) 62.87 (58.13-67.61) 60.50 (55.90-65.10) 62.22 (51.86-72.58) 52.71 (46.03-59.40) 0.053Vitality 64.32 (59.62-69.03) 66.91 (55.11-78.71) 63.77 (58.46-69.08) 71.11 (58.02-84.20) 59.33 (51.97-66.68) 0.532Social role functioning 70.93 (66.98-74.88) 70.11 (63.01-77.21) 69.29 (62.39-76.18) 76.39 (62.92-89.85) 72.36 (64.16-80.55) 0.793
Emotional role functioning 80.86 (72.72-89.00) 83.09 (75.49-90.69) 82.86 (61.18-104.54) 83.33 (66.04-100.63) 74.36 (63.39-85.33) 0.846
Mental health 81.76 (77.69-85.83) 79.88 (75.21-84.56) 84.00 (74.99-93.01) 86.89 (79.61-94.17) 79.69 (70.06-89.33) 0.694HCV: hepatitis C virus; ALD: alcoholic liver disease. *ANOVA.
TABLE 3. Liver disease etiology and psychiatric and clinical comorbidity according to DSM-IV-TR through mini international neuropsychiatric interview.
Psychiatric comorbidity TotalDiagnosis etiology N (%)
P valueHCV ALD HCV and ALD Others
Current major depressive episode 15 4 (26.67) 3 (20.0) 3 (20.0) 5 (33.3) 0.058*Past major depressive episode 19 9 (47.4) 5 (26.3) 0 (0.0) 5 (26.3) 0.425*Bipolar disorder 2 1 (50.0) 0 (0.0) 0 (0.0) 1 (50.0) 0.529*Risk of suicide (moderate/high) 8 1 (12.5) 1 (12.5) 1 (12.5) 5 (62.5) 0.058*Anxiety disorders 12 4 (33.3) 3 (20.0) 1 (8.3) 4 (33.3) 0.356*Alcohol abuse/dependence 90 1 (1.1) 54 (60.0) 35 (38.9) 0 (0.0) 0.00*Other substance abuse/dependence 8 2 (25.0) 2 (25.0) 3 (37.5) 1 (12.5) 0.532**Adjustment disorder 25 5 (20.0) 5 (20.0) 4 (16.0) 11 (44.0) 0.258*Post traumatic stress disorder 19 5(26.3) 4 (21.1) 5 (26.3) 5 (26.3) 0.791*Diabetes mellitus 55 21 (30.4) 16 (25) 8 (22.2) 10 (18.6) 0.865*Arterial hypertension 47 16 (23.2) 15 (23.4) 7 (19.4) 9 (20.9) 0.839*
HCV: hepatitis C virus; ALD: alcoholic liver disease. *Exact Fisher. **Analyzed through pearson chi-square.

Guerreiro-Costa LNF, Araújo-Filho JEO, Marback RF, Jesus-Nunes AP, Morais-de-Jesus M, Quarantini LC.Mental disorders and quality of life in patients awaiting liver transplantation
342 • Arq Gastroenterol • 2019. v. 56 nº 4 out/dez
also to have a high presence of psychiatric symptoms associated with their own course(9,15,18,19,20). According to the present data, the patients assessed presented different serious liver conditions but with no statistically significant difference in relation to quality of life.
The main limitation of this study is the limited sample size, once it was divided into four groups. Another limitation is the absence of assessment for personality disorders. Finally, a possible critical limitation in this study is that the most severe psychiatric patients are not even able to get on the waiting list for liver transplantation, thus promoting interpretation bias.
CONCLUSION
A high prevalence of psychiatric disorders was found among all clinical conditions most associated with the indication of liver transplantation. Detailed evaluation of mental health by specialized team is required, minimizing the exclusion of patients with pos-sibility of adherence and therapeutic success. It is noteworthy that transplantation is the only therapeutic possibility for patients with advanced hepatic insufficiency, being, therefore, fundamental the implantation of psychiatric/psychological support, guaranteeing to the patient adequate evaluation of his mental health condition before the decision to exclude this possibility of treatment.
ACKNOWLEDGEMENTS
The authors thank all the patients who agreed to be included in this study for their cooperation. We are also grateful to Denise Pinheiro for proofreading, Liana Codes, Maria Isabel Schinoni,
André C. Lyra, Jorge Luiz Andrade-Bastos and Raymundo Paraná for the review and suggestions, Alessandra de Castro and Maria Auxiliadora Evangelista for the help in collecting the data.
Authors’ contributionJesus-Nunes AP, Morais-de-Jesus M, Marback RF and Quar-
antini LC were responsible for the psychological and psychiatric evaluation of the patients. Guerreiro-Costa LNF and Araújo-Filho JEO made the evaluation of the clinical data. All authors partici-pated in the analysis of the results and writing of the manuscript.
OrcidLívia N F Guerreiro Costa. Orcid: 0000-0002-2367-0870.José Edson O Araújo Filho. Orcid: 0000-0002-6283-9579.Roberta Ferrari Marback. Orcid: 0000-0003-3870-8963.Ana Paula Jesus Nunes. Orcid: 0000-0002-0389-1940.Mychelle Morais de Jesus. Orcid: 0000-0003-3856-3776.Lucas C Quarantini. Orcid: 0000-0002-8807-8464.
Guerreiro-Costa LNF, Araújo-Filho JEO, Marback RF, Jesus-Nunes AP, Morais-de-Jesus M, Quarantini LC. Desordens mentais e qualidade de vida em pacientes em lista de espera para realização de transplante de fígado. Arq Gastroenterol. 2019;56(4):339-43.RESUMO – Contexto – O transplante hepático é a principal alternativa terapêutica para pacientes com doença hepática avançada. Esses pacientes apre-
sentam alta prevalência de comorbidades psiquiátricas que podem interferir negativamente nos desfechos clínicos e qualidade de vida. Não está claro na literatura se as diferentes etiologias de doença hepática têm a mesma prevalência de transtornos psiquiátricos. Objetivo – O objetivo deste estudo foi investigar se os pacientes na lista de transplante hepático apresentavam diferenças nas variáveis psiquiátricas, variáveis clínicas e qualidade de vida em diferentes grupos etiológicos. Métodos – Estudo transversal que avalia as comorbidades psiquiátricas e clínicas e as variáveis de qualidade de vida por meio da aplicação de questionários e instrumentos validados em 248 pacientes inseridos em lista de espera para transplante hepático no período de 2010 a 2014, acompanhados no Hospital Universitário Professor Edgard Santos e Hospital Português (Salvador, BA). Os pacientes foram avaliados através da aplicação do Mini International Neuropsychiatric Interview (M.I.N.I. PLUS 5.0) e Medical Outcomes Short-Form Health Survey (SF-36). Resultados – A etiologia da doença hepática mais prevalente foi o vírus da hepatite C. Prevalência de 50,8% de pelo menos um transtorno mental foi identificada. Quando o abuso/dependência de álcool foi excluído, a prevalência foi de 25,8%. A saúde mental não apresentou diferença estatisticamente significante nos diversos grupos etiológicos. Maior prevalência de comorbidades psiquiátricas foi detectada entre mulheres e menores de 40 anos. Não foram detectados casos de transtornos psicóticos, possivelmente pela não inclusão destes pacientes na lista. Não houve diferença nos domínios de qualidade de vida nos diferentes grupos etiológicos. Conclusão – Uma alta prevalência de transtornos psiquiátricos foi encontrada nos pacientes com todas as condições clínicas mais associadas à indicação de transplante hepático. Chama a atenção a ausência de pacientes com transtornos psicóticos, o que sugere que possivelmente o transplante não tem sido indicado para esse grupo de pacientes. Por esses motivos, os profissionais que cuidam de candidatos ao transplante de fígado devem ser altamente vigilantes para a presença de transtornos mentais, independentemente da etiologia da doença hepática. A atenção especializada é recomendada para os pacientes com transtornos mentais, com minimização de exclusão precoce da lista de pacientes sem outras possibilidades terapêuticas.
DESCRITORES – Transplante de fígado. Hepatopatias. Transtornos mentais. Qualidade de vida.
Guerreiro-Costa LNF, Araújo-Filho JEO, Marback RF, Jesus-Nunes AP, Morais-de-Jesus M, Quarantini LC.Mental disorders and quality of life in patients awaiting liver transplantation
Arq Gastroenterol • 2019. v. 56 nº 4 out/dez • 343
REFERENCES
1. Mies S. Transplante de Fígado. Revista da Associação Médica Brasilei-ra.1998;44:127-34.
2. Maldonado JR, Sher Y, Lolak S, Swendsen H, Skibola D, Neri E, et al. The Stanford Integrated Psychosocial Assessment for Transplantation: A Prospective Study of Medical and Psychosocial Outcomes. Psychosom Med. 2015;77:1018-30.
3. Grover S, Sarkar S. Liver transplant-psychiatric and psychosocial aspects. J Clin Exp Hepatol. 2012;2:382-92.
4. Rogal SS, Landsittel D, Surman, Chung RT, Rutherford A. Pretransplant de-pression, antidepressant use, and outcomes of orthotopic liver transplantation. Liver Transp. 2011;17:251-60.
5. Martins PD, Sankarankutty AK, Silva Ode C, Gorayeb R. Psychological distress in patients listed for liver transplantation. Acta Cir Bras. 2006;21:40-3.
6. Schneekloth TD, Jowsey SG, Biernacka JM, Burton MC, Vasquez AR, Bergquist T, et al. Pretransplant psychiatric and substance use comorbidity in patients with cholangiocarcinoma who received a liver transplant. Psychosomatics. 2012;53:116-22
7. Heinrich TW, Marcangelo M. Psychiatric issues in solid organ transplantation. Harv Rev Psychiatry. 2009;17:398-406.
8. Stilley CS, DiMartini AF, Tarter RE, DeVera M, Sereika S, Dew MA, et al. Liver transplant recipients: individual, social, and environmental resources. Prog Transplant. 2010;20:68-74.
9. Golden J, O’Dwyer AM, Conroy RM. Depression and anxiety in patients with hepatitis C: prevalence, detection rates and risk factors. Gen Hosp Psychiatry. 2005;27:431-8.
10. O’Shea RS, Dasarathy S, McCullough AJ; Alcoholic liver disease. Hepatology. 2010;51:307-28.
11. Rehm J, Mathers C, Popova S, Thavorncharoensap M, Teerawattananon Y, Patra J. Global burden of disease and injury and economic cost attributable to alcohol use and alcohol-use disorders. Lancet. 2009;373:2223-33.
12. Ciconelli R, F.M., Santos W, Meinão I, Quaresma M. Tradução para a língua portuguesa e validação do questionário genérico de avaliação de qualidade de vida SF-36 (Brasil SF-36). Rev Bras Reumatol. 1999;39(3).
13. Amorim, P., Mini International Neuropsychiatric Interview (MINI): validação de entrevista breve para diagnóstico de transtornos mentais. Revista Brasileira de Psiquiatria. 2000;22:106-15.
14. Steel Z, Marnane C, Iranpour C, Chey T, Jackson JW, Patel V, Silove D. The global prevalence of common mental disorders: a systematic review and meta-analysis 1980-2013. Int J Epidemiol. 2014;43:476-93.
15. Batista-Neves SC, Quarantini LC, de Almeida AG, Bressan RA, Lacerda AL, de-Oli veira IR, et al. High frequency of unrecognized mental disorders in HCV-infected patients. Gen Hosp Psychiatry. 2008;30:80-2. (era 10 passou a ser 15)
16. Saracino RM, Jutagir DR, Cunningham A, Foran-Tuller KA, Driscoll MA, Sledge WH, Emre SH, Fehon DC. Psychiatric Comorbidity, Health-Related Quality of Life, and Mental Health Service Utilization Among Patients Awaiting Liver Transplant. J Pain Symptom Manage. 2018;56:44-52.
17. Madan A Borckardt JJ, Balliet WE, Barth KS, Delustro LM, Malcolm RM, Koch D, Willner I, Baliga P, Reuben A. Neurocognitive status is associated with all-cause mortality among psychiatric, high-risk liver transplant candidates and recipients. Int J Psychiatry Med. 2015;49:279-95.
18. Kristiansen MG, Lochen ML, Gutteberg TJ, Mortensen L, Eriksen BO, Flor-holmen J. Total and cause-specific mortality rates in a prospective study of com-munity-acquired hepatitis C virus infection in northern Norway. J Viral Hepat. 2011;18:237-44. Era 11 passou a 18
19. Johnson ME, Fisher DG, Fenaughty A, Theno SA. Hepatitis C virus and de-pression in drug users. Am J Gastroenterol. 1998;93:785-9.
20. Rifai MA, Gleason OC, Sabouni D. Psychiatric care of the patient with hep-atitis C: a review of the literature. PrimCare Companion J ClinPsychiatry. 2010;12:PCC.09r00877.
AHEAD OF PRINTORIGINAL ARTICLE
344 • Arq Gastroenterol • 2019. v. 56 nº 4 out/dez
INTRODUCTION
Globally, it has been estimated that 257, 71, and 36.7 million people are infected with chronic hepatitis B virus (HBV), hepatitis C virus (HCV), and human immunodeficiency virus (HIV), respec-tively(1,2). HIV, HBV, and HCV share similar forms of transmission, and thus, it has been estimated that 2.7 and 2.3 million people are living with HIV-HBV and HIV-HCV coinfections, respectively(1).
Infections by these viruses present a dynamic interaction, thereby amplifying each other and leading to increased morbidity in HIV coinfected patients(3). Among HIV-HBV coinfected patients, liver-related complications were increased, and immune recovery is attenuated(4). For HIV-HCV coinfections, several studies have shown effects of coinfection on the CD4+ T-cell count(5-8). How-ever, despite evidence of the impact of HIV-HCV coinfection on CD4+ T-cell counts, it is unclear whether this effect was related to the different HCV genotypes.
HCV is currently classified in seven genotypes (HCV-1 to HCV-7) and multiple subtypes according to their genetic sequence(9). Globally, the occurrence of the HCV genotype is variable. HCV-1 is predominant in Australia, Europe, Latin America, and North America (53%–71% of all cases), whereas HCV-3 occurs pre-dominantly in Asian countries (40% of all infections)(10). In Brazil, there is a predominance of HCV-1 (64.9%), followed by HCV-3
Profile of HCV genotypes and HIV-subtypes among HIV-coinfected patients in Southern Brazil
Claudinei Mesquita da SILVA, Leyde Daiane de PEDER, Mateus Vailant THOMAZELLA, Jorge Juarez Vieira TEIXEIRA and Dennis Armando BERTOLINI
Received 22/4/2019Accepted 7/9/2019
ABSTRACT – Background – Hepatitis B and C virus (HBV and HCV) are the two most common infections among human immunodeficiency virus (HIV)-infected patients. Objective – To identify the frequency of HIV subtypes and HCV genotypes in HIV-coinfected patients. Methods – A cross-sec-tional and retrospective study was carried out into two reference centers in Southern Brazil between January 1, 2002 and June 30, 2016. The Abbott Real Time HCV Genotype II system was used for routine diagnostics to determine the HCV genotype based on dual-target real-time PCR. Proviral HIV-1 RNA was extracted from serum samples and fragments of the pol gene were generated by PCR. The HIV-1 PT and RT gene sequences were submitted to Maximum Likelihood Phylogenetic analysis by collecting reference sequences from the HIV-1 group M subtype of the Los Alamos da-tabase. Results – During the study period, 3340 patients with HIV were diagnosed at both referral centers, of which 4.97% (166/3340) had HBV and/or HCV coinfection. Seroprevalence of HIV-HBV, HIV-HCV and HIV-HBV-HCV was 37.4%, 58.4%, and 4.2%, respectively. HIV-HCV-coinfected patients had a lower median nadir CD4+ T-cell count when compared to HIV-HBV-coinfected patients (P=0.01). Among those coinfected with HCV, HCV-1 (HCV-1) and HCV-3 (HCV-3) genotypes were the most prevalent, being detected in 73.8% and 21.4%, respectively. Among the HCV-1 coinfected patients, 79.3% and 20.1% had subtypes 1a and 1b, respectively. HIV subtype B was the most prevalent in HIV-coinfected patients. There was no significant difference regarding nadir CD4+ T-cell count and HIV viral load when compared to coinfected with HCV-1 with HCV-3, as well as those co-infected with HCV-1a with HCV-1b. Conclusion – In the present study, a higher frequency of subtype B of HIV and HCV-1 were found in HIV-coinfected patients. Further larger-scale and long-term studies are needed to better understand the effect of HCV genotypes in HIV-infected patients.
HEADINGS – HIV infections. Hepacivirus. Genotype. CD4 lymphocyte count.
Declared conflict of interest of all authors: noneDisclosure of funding: no funding receivedUniversidade Estadual de Maringá, Departamento de Análises Clínicas e Biomedicina, Maringá, PR, Brasil.Corresponding author: Claudinei Mesquita da Silva. E-mail: [email protected]
(30.2%)(11). However, there is little information about the frequency of HCV genotypes among HIV-coinfected populations in Brazil.
Among HIV-coinfected patients, the presence of a hepatotropic virus can lead to an overload of the host’s immune system, which may lead to the emergence of specific HIV variants(12). However, there is little information on the genetic variability of HIV in HBV- and/or HCV-coinfected patients. Thus, we investigated the frequency of HIV subtypes and HCV genotypes/subtypes, and their relationship to the nadir CD4+ T-cell count among HIV-coinfected patients.
METHODS
Study areaThis study was carried out into two reference centers for the
diagnosis, treatment, and follow-up of patients with HIV and viral hepatitis: Specialized Center for Infectious and Parasitic Diseases (Centro Especializado de Doenças Infecto Parasitárias) in Cascavel city, and the Specialized Service of Sexually Transmitted Infections (Serviço Especializado de Infecções Sexualmente Transmissíveis) in Maringá city, both in Paraná State, Southern Brazil. These two centers serve 25 and 30 municipalities, respectively, with a total population of 1,189,062(13), and are part of Unified Health System (Sistema Único de Saúde).
AG-2019-69dx.doi.org/10.1590/S0004-2803.201900000-68

Silva CM, Peder LD, Thomazella MV, Teixeira JJV, Bertolini DA.Profile of HCV genotypes and HIV-subtypes among HIV-coinfected patients in Southern Brazil
Arq Gastroenterol • 2019. v. 56 nº 4 out/dez • 345
Study designWe developed a cross-sectional and retrospective study between
April and December 2017. HIV-coinfected patients and who tested positive for HBV and/or HCV between January 1, 2002 and June 30, 2016 were included in the study. However, for HIV subtyping, only HIV-coinfected patients who had HIV viral loads between January 2014 and December 2016, regardless of whether they were treatment-naive or not were included. For calculations of the nadir CD4+ T-cell count and HIV viral load, only HIV-infected patients with a positive test for HBV or HCV at baseline were considered. Sociodemographic information of the enrolled participants were collected by trained nurses and physicians, using a structured and pre-tested questionnaire. The following variables were collected: date of birth, sex, ethnicity, use of antiretroviral drugs, level of educational attainment, sexual preference, fibrosis levels, time du-ration of HIV infection diagnosis and coinfection, use of injected drugs, and region. The classification of liver biopsies followed the METAVIR scale(14).
Laboratory measurementsHIV infection status was based on positive test results from two
peripheral blood samples, performed using an HIV Enzyme-linked Immunosorbent Assay (Abbott Diagnostics, Chicago, USA) and confirmed by western blotting (Bio-Rad, Marnes La Coquette, France). HBsAg, anti-HBs, anti-HBc, and anti-HCV were tested by commercially available enzyme immunoassay (Abbott Diagnos-tics). Positive results for anti-HCV were confirmed by amplification of HCV RNA using Reverse Transcription Polymerase Chain Reaction (RT-PCR) by COBAS Ampliprep/Cobas TaqMan48 real-time RT-PCR (Roche Diagnostics, Pleasanton, USA), as described elsewhere(15). Anti-HIV, anti-HCV, HBV markers, and HCV-RNA data were entered into the patients’ medical records and subsequently collected.
The CD4+ T-cell count was performed by flow cytometry (BD TrucountTM Tubes) using the FACSCalibur apparatus (Becton-Dickinson, New Jersey, USA). HIV viral load was determined by PCR using Abbott Real Time HIV-1 (Abbott Diagnostics), and the results were presented as base 10 logarithms. The minimum detection value for the HIV viral load was 50 copies/mL. Data of CD4 cell count and HIV viral load were stored and subsequently obtained for tabulation of data from the national network of the Sistema de Controle de Exames Laboratoriais (SISCEL; the Laboratory Test Control System), at the virology laboratory of the State University of Maringá. All information from SISCEL is stored using data encryption in its central database, which is located in the Department of Chronic Diseases and Sexually Transmitted Infections.
The Abbott Real Time HCV Genotype II system (Abbott Di-agnostics) was used for routine diagnostics to determine the HCV genotype based on dual-target real-time PCR: a 5’ UTR target region was used to discriminate between HCV genotypes, and the NS5B gene was the target for 1a and 1b subtyping, using previ-ously described methods(16). The viral genotype was determined after phylogenetic analysis of the sequences obtained, along with established GenBank reference sequences(17).
Proviral HIV-1 RNA was extracted from serum samples using the QIAamp Viral RNA mini Kit® (Qiagen, Hilden, Ger-many) following the manufacturer’s instructions, and the cDNA was sequentially obtained using the Superscript III RT-PCR kit (Invitrogen, CA). Fragments of the pol gene were generated by
PCR according to a previously reported(18,19). Strict laboratory precautions were taken to avoid cross contamination. The genes for protease (PR) and transcriptase (RT) were amplified, and the purified PCR products were sequenced with the ABI Prism® Big-Dye™ Terminator version 3.1 cycle sequencing kit ready reaction (Applied Biosystems, Foster City, CA) following the manufacturer’s instructions in the automatic sequencer AB 3500 Genetic Analyzer (Applied Biosystems, Foster City, CA).
The HIV-1 PT and RT gene sequences were concatenated and submitted to Maximum Likelihood Phylogenetic analysis by col-lecting reference sequences from the HIV-1 group M subtype of the Los Alamos database (https://www.hiv.lanl.gov/content/sequence/HIV/mainpage.html) and BioAfrica (http://www.bioafrica.net/rega-genotype/html/subtypinghiv.html). In addition, the HIV mutation profile associated with resistance to antiretroviral therapy (ART) was analyzed by subjecting the sequences obtained from PT and RT to the Stanford University HIV Drug Resistance Database (https://hivdb.stanford.edu/hivdb/by-sequences/).
Statistical analysisPearson’s chi-square test or Fisher’s exact test were adopted
for categorical variables, and the Mann–Whitney test was used in terms of quantitative variables. The level of significance was set at P<0.05. Statistical analysis was performed using Stata (version 12.0)(20). This study was reviewed and approved by the Research Ethical Committee of University Center of Assis Gurgacz Foundation (Report n. 1.397.212 of 28/01/2016). The norms for ethical research were followed by the researchers according to the requirements of the country, guaranteeing total confidentiality, and anonymity of the data.
RESULTS
During the study period, 3340 patients with HIV were diag-nosed at both referral centers, of which 4.97% (166/3340) had HBV and/or HCV coinfection. Among them, 37.4% (62/166) were HIV-HBV, 58.4% (97/166) were HIV-HCV, and 4.2% (7/166) were HIV-HBV-HCV coinfected. Among all HIV-coinfected patients, 63.3% (105/166) were men (median age: 42 years, IQR 42–53 years) and 36.7% (61/166) were women (median age: 45 years, IQR 37–53 years).
Regarding HBV serological markers, 39.0% (30/77) and 37.5% (30/80) of HIV-HCV patients were positive for anti-HBc and anti-HBs, respectively; and 14.3%% (11/77) were positive for both anti-HBc and anti-HBs. The presence of HBeAg was detected in 50% (10/20) of HBV-coinfected patients. With regard to the risk factors for HCV coinfection acquisition, 31.6% (36/104) patients were illicit drug users, 21.2% (22/104) of which were people who inject drugs (PWID).
Of all patients, 91.6% (151/166) of HIV-coinfected patients had laboratory tests of CD4+ T-cell counts and HIV viral load determined, with a median nadir CD4+ T-cell count of 327 cells/mm3 (IQR 225-494), and log10 HIV viral load of 4.5 (IQR 4-6) at the time of HIV diagnosis. In addition, there were no significant differences between HIV-HBV and HIV-HCV coinfection patients for median log HIV viral load, sex, ethnicity, education level, sexual preference, and number of sexual partners in last 12 months. How-ever, compared to HIV-HBV patients, HIV-HCV patients had a lower median nadir CD4+ T-cell count, higher numbers of Illicit user drugs and PWID, and longer duration of HIV diagnosis and
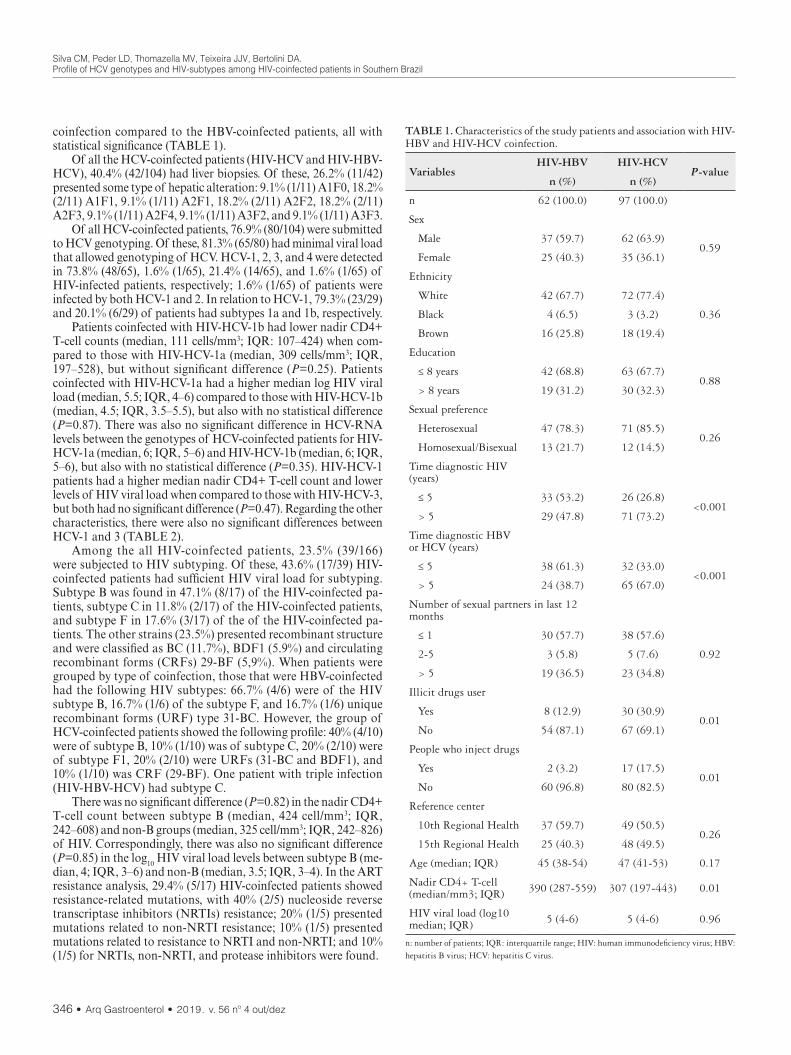
Silva CM, Peder LD, Thomazella MV, Teixeira JJV, Bertolini DA.Profile of HCV genotypes and HIV-subtypes among HIV-coinfected patients in Southern Brazil
346 • Arq Gastroenterol • 2019. v. 56 nº 4 out/dez
coinfection compared to the HBV-coinfected patients, all with statistical significance (TABLE 1).
Of all the HCV-coinfected patients (HIV-HCV and HIV-HBV-HCV), 40.4% (42/104) had liver biopsies. Of these, 26.2% (11/42) presented some type of hepatic alteration: 9.1% (1/11) A1F0, 18.2% (2/11) A1F1, 9.1% (1/11) A2F1, 18.2% (2/11) A2F2, 18.2% (2/11) A2F3, 9.1% (1/11) A2F4, 9.1% (1/11) A3F2, and 9.1% (1/11) A3F3.
Of all HCV-coinfected patients, 76.9% (80/104) were submitted to HCV genotyping. Of these, 81.3% (65/80) had minimal viral load that allowed genotyping of HCV. HCV-1, 2, 3, and 4 were detected in 73.8% (48/65), 1.6% (1/65), 21.4% (14/65), and 1.6% (1/65) of HIV-infected patients, respectively; 1.6% (1/65) of patients were infected by both HCV-1 and 2. In relation to HCV-1, 79.3% (23/29) and 20.1% (6/29) of patients had subtypes 1a and 1b, respectively.
Patients coinfected with HIV-HCV-1b had lower nadir CD4+ T-cell counts (median, 111 cells/mm3; IQR: 107–424) when com-pared to those with HIV-HCV-1a (median, 309 cells/mm3; IQR, 197–528), but without significant difference (P=0.25). Patients coinfected with HIV-HCV-1a had a higher median log HIV viral load (median, 5.5; IQR, 4–6) compared to those with HIV-HCV-1b (median, 4.5; IQR, 3.5–5.5), but also with no statistical difference (P=0.87). There was also no significant difference in HCV-RNA levels between the genotypes of HCV-coinfected patients for HIV-HCV-1a (median, 6; IQR, 5–6) and HIV-HCV-1b (median, 6; IQR, 5–6), but also with no statistical difference (P=0.35). HIV-HCV-1 patients had a higher median nadir CD4+ T-cell count and lower levels of HIV viral load when compared to those with HIV-HCV-3, but both had no significant difference (P=0.47). Regarding the other characteristics, there were also no significant differences between HCV-1 and 3 (TABLE 2).
Among the all HIV-coinfected patients, 23.5% (39/166) were subjected to HIV subtyping. Of these, 43.6% (17/39) HIV-coinfected patients had sufficient HIV viral load for subtyping. Subtype B was found in 47.1% (8/17) of the HIV-coinfected pa-tients, subtype C in 11.8% (2/17) of the HIV-coinfected patients, and subtype F in 17.6% (3/17) of the of the HIV-coinfected pa-tients. The other strains (23.5%) presented recombinant structure and were classified as BC (11.7%), BDF1 (5.9%) and circulating recombinant forms (CRFs) 29-BF (5,9%). When patients were grouped by type of coinfection, those that were HBV-coinfected had the following HIV subtypes: 66.7% (4/6) were of the HIV subtype B, 16.7% (1/6) of the subtype F, and 16.7% (1/6) unique recombinant forms (URF) type 31-BC. However, the group of HCV-coinfected patients showed the following profile: 40% (4/10) were of subtype B, 10% (1/10) was of subtype C, 20% (2/10) were of subtype F1, 20% (2/10) were URFs (31-BC and BDF1), and 10% (1/10) was CRF (29-BF). One patient with triple infection (HIV-HBV-HCV) had subtype C.
There was no significant difference (P=0.82) in the nadir CD4+ T-cell count between subtype B (median, 424 cell/mm3; IQR, 242–608) and non-B groups (median, 325 cell/mm3; IQR, 242–826) of HIV. Correspondingly, there was also no significant difference (P=0.85) in the log10 HIV viral load levels between subtype B (me-dian, 4; IQR, 3–6) and non-B (median, 3.5; IQR, 3–4). In the ART resistance analysis, 29.4% (5/17) HIV-coinfected patients showed resistance-related mutations, with 40% (2/5) nucleoside reverse transcriptase inhibitors (NRTIs) resistance; 20% (1/5) presented mutations related to non-NRTI resistance; 10% (1/5) presented mutations related to resistance to NRTI and non-NRTI; and 10% (1/5) for NRTIs, non-NRTI, and protease inhibitors were found.
TABLE 1. Characteristics of the study patients and association with HIV-HBV and HIV-HCV coinfection.
VariablesHIV-HBV HIV-HCV
P-valuen (%) n (%)
n 62 (100.0) 97 (100.0)
Sex
Male 37 (59.7) 62 (63.9)0.59
Female 25 (40.3) 35 (36.1)
Ethnicity
White 42 (67.7) 72 (77.4)
0.36 Black 4 (6.5) 3 (3.2)
Brown 16 (25.8) 18 (19.4)
Education
≤ 8 years 42 (68.8) 63 (67.7)0.88
> 8 years 19 (31.2) 30 (32.3)
Sexual preference
Heterosexual 47 (78.3) 71 (85.5)0.26
Homosexual/Bisexual 13 (21.7) 12 (14.5)
Time diagnostic HIV (years)
≤ 5 33 (53.2) 26 (26.8)<0.001
> 5 29 (47.8) 71 (73.2)
Time diagnostic HBV or HCV (years)
≤ 5 38 (61.3) 32 (33.0)<0.001
> 5 24 (38.7) 65 (67.0)
Number of sexual partners in last 12 months
≤ 1 30 (57.7) 38 (57.6)
0.92 2-5 3 (5.8) 5 (7.6)
> 5 19 (36.5) 23 (34.8)
Illicit drugs user
Yes 8 (12.9) 30 (30.9)0.01
No 54 (87.1) 67 (69.1)
People who inject drugs
Yes 2 (3.2) 17 (17.5)0.01
No 60 (96.8) 80 (82.5)
Reference center
10th Regional Health 37 (59.7) 49 (50.5)0.26
15th Regional Health 25 (40.3) 48 (49.5)
Age (median; IQR) 45 (38-54) 47 (41-53) 0.17
Nadir CD4+ T-cell (median/mm3; IQR) 390 (287-559) 307 (197-443) 0.01
HIV viral load (log10 median; IQR) 5 (4-6) 5 (4-6) 0.96
n: number of patients; IQR: interquartile range; HIV: human immunodeficiency virus; HBV: hepatitis B virus; HCV: hepatitis C virus.

Silva CM, Peder LD, Thomazella MV, Teixeira JJV, Bertolini DA.Profile of HCV genotypes and HIV-subtypes among HIV-coinfected patients in Southern Brazil
Arq Gastroenterol • 2019. v. 56 nº 4 out/dez • 347
DISCUSSION
The genetic diversity of HCV has been linked to treatment responses. Direct-acting antivirals (DAAs) have been successfully used in the treatment of HCV, all of which have been strictly cor-related with the genotype(10). In 2015, the Brazilian Ministry of Health incorporated the first DAAs for the treatment of hepatitis C. The current guidelines in Brazil recommend that HIV-HCV-coinfected patients must be treated using the approach that non–HIV-infected individuals follow because the efficacy of the cur-rently licensed DAA regimens does not appear to differ between HCV-monoinfected and coinfected individuals(21). The treatment for hepatitis C and coinfections currently indicated in Brazil has two new therapeutic options that joins the scheme comprising the association of sofosbuvir/daclatasvir, pan-genotypic already offered since 2015. In addition to these options, the Brazilian Ministry of Health maintained the indications for ledipasvir/sofosbuvir (genotype 1), elbasvir/pibrentasvir (genotypes 1 and 4), ribavirin and alfapeginterferon (for some pediatric situa-tions)(21). Treatment schedules are defined based on genotype and sub genotype of HCV, and knowledge of HCV genotypes helps to predict therapeutic responses and determines the durations of drug treatments(22).
The geographic distribution of HCV genotypes is complex; the epidemic subtypes – especially, 1a, 1b, 2a, and 3a – are widely distributed around the world and account for a significant share of HCV cases(23). In this study, HCV-1 presented the highest fre-quency (73.8%), followed by HCV-3 (21.4%) among HIV-coinfected patients. The frequency of HCV genotypes reported here was similar to that found by other authors among HIV-coinfected and HCV-monoinfected patients in Brazil(24-26) as well as in Greece(27), Northern and Central Asia, and in Central and Western Europe(23). We did not detect HCV-5 or 6, which was in agreement with other studies(28-30). More studies are needed to add data on the genetic diversity of HCV among HIV-infected patients and may provide important evidence for the understanding of the origin and spread of HCV infections in Southern Brazil.
The high frequency of HCV-1 has been associated with the transmission of HCV by PWID, which is responsible for increasing the risk of acquiring HCV(31,32). In our study, PWID were the most infected with HCV-1 among the HIV-coinfected patients. These results suggest that HCV-1 was introduced into PWID and spread among HIV-infected patients. Considering that the administrative route of the drug was the only difference between PWID and non-PWID, these data emphasize the importance of not sharing needles to prevent the spread of HCV-1 among HIV-infected patients. However, the origins of HCV-1 have not yet been specified and further investigations are required.
HIV is characterized by high genetic diversity and extensive heterogeneity. This characteristic is due to multiple factors, includ-ing multiple human populations, high rates of viral evolution/recombination, selective pressure of the host immune system and/or antiretroviral therapy(12,33). Although subtype B has been showing a declining trend in sexual transmission, it still accounts for a large proportion. In the United States and Western Europe, HIV-1 subtype B is the most common variant. In Brazil, HIV subtypes C, F1, and recombinants BC and BF are generally observed at low frequencies as previously described(34). However, there have been a few studies showing the genetic variability of HIV-1 among patients with HIV-hepatitis coinfections. A study
TABLE 2. Characteristics of HCV-coinfected patients and association with HCV-1 and 3.
VariablesGenotype 1 Genotype 3
P-valuen (%) n (%)
n 48 (100.0) 14 (100.0)
Sex
Male 28 (58.3) 10 (71.4)0.38
Female 20 (41.7) 4 (28.6)
Ethnicity
White 38 (82.6) 10 (71.4)
0.66 Black 2 (4.3) 1 (7.2)
Brown 6 (13.1) 3 (21.4)
Education
≤ 8 years 29 (63.1) 8 (57.1)0.69
> 8 years 17 (36.9) 6 (42.9)
Sexual preference
Heterosexual 33 (82.5) 9 (75.0)0.56
Homosexual/Bisexual 7 (17.5) 3 (25.0)
Time diagnostic HIV (years)
≤ 5 9 (18.8) 4 (28.6)0.43
> 5 39 (81.2) 10 (71.4)
Time diagnosis HCV (years)
≤ 5 11 (22.9) 5 (35.7)0.34
> 5 37 (77.1) 9 (64.3)
Number of sexual partners in last 12 months
≤ 1 19 (55.9) 2 (20.0)
0.13 2-5 3 (8.8) 2 (20.0)
> 5 12 (35.3) 6 (60.0)
Illicit drugs user
Yes 15 (31.3) 4 (28.6)0.85
No 33 (68.7) 10 (71.4)
People who inject drugs
Yes 10 (20.4) 1 (7.1)0.24
No 38 (79.6) 13 (92.9)
Reference center
10th Regional Health 14 (29.2) 5 (35.7)
0.6415th Regional Health 34 (70.8) 9 (64.3)
Age (median; IQR) 50 (42.5-54.5) 49 (45-54) 0.88
Nadir CD4+ T-cell (median/mm3; IQR) 304 (190-424) 234 (129-317) 0.29
HIV viral load (log median; IQR) 5.5 (4.2-6) 6 (5.5-6) 0.73
HCV viral load (log median; IQR) 6.2 (5.9-6.5) 6.2 (5.7-6.3) 0.70
n: number of patients; IQR: interquartile range; HIV: human immunodeficiency virus; HCV: hepatitis C virus. Pearson’s chi-square test for comparison between groups.

Silva CM, Peder LD, Thomazella MV, Teixeira JJV, Bertolini DA.Profile of HCV genotypes and HIV-subtypes among HIV-coinfected patients in Southern Brazil
348 • Arq Gastroenterol • 2019. v. 56 nº 4 out/dez
in HIV-coinfected patients in Brazil reported that HIV-1 subtype C and B were present in 47.4% and 31.6% of HIV-coinfected patients, respectively(35); another Brazilian study reported that HIV-1 subtype B was the most prevalent(12). Our study corrobo-rates the results of these studies. In addition, the results of the present study were in accordance with previous investigations, which report that B recombinant and CRFs of HIV-1 circulate among HIV-coinfected patients(12,35). The detailed dynamics of HIV subtypes viral propagation in the study region is not well understood, although two phylogeographic studies have demon-strated possible routes for the origin and spread of subtype C in the Southern region of the country(36,37).
Studies on HIV-HBV coinfection have focused on the screening of HBsAg as a marker of HBV infections. However, information on other markers remains unclear(38). In Brazil, studies among HIV-infected individuals have found positive rates for anti-HBc ranging from 38.6% to 55.1%(39-42). These differences likely reflect the percentage of risk factors in the groups studied and the pattern of endemicity of HBV in different regions. Our study reported that 39.0% of HIV-HCV-coinfected people had anti-HBc reactivity. Anti-HBc alone in the HIV population can be interpreted as a marker of occult hepatitis B(43), a phenomenon that may be caused by either a resolved HBV infection(44), or loss of anti-HBs over time(45); other studies have reinforced these findings(43,46). In addition, in our study, we found a high frequency of patients with HBeAg (50%) among HIV-HBV-coinfected patients. The AIDS-related im-munosuppression increases the frequency of reactivation of HBV, with the recurrence of HBeAg and reversion to the immunoactive phase among HIV-HBV-coinfected patients(47).
Assessing the severity and predicting the course of HIV infec-tions with both CD4 + T cell counts and HIV viral load levels are essential for estimating the severity of HIV-related immunodefi-ciency. The present study showed a lack of statistical association between HCV-1 and HCV-3 for nadir CD4+ T-cell count and HIV viral loads. Few studies have systematically investigated the CD4+ T-cell count among HCV genotypes in HIV-infected patients. In a study carried out in Brazil, no significant differences were observed in the CD4+ T-cell count for HCV genotypes 1 and 3(48); our data corroborate this finding. Our study was also in line with data already published in the EuroSIDA study(49). The authors of this study report that they found no significant differences in the CD4+ T-cell count and HIV viral load in relation to the HCV genotype.
HCV infection could impact the course of HIV infections via chronic immune activation and cytokine production in coinfected individuals(50,51), which may result in diminished CD4+ T-cell counts(52). In our study, patients with HIV-HCV had a signifi-cantly lower median nadir CD4+ cell count when compared with those with HIV-HBV; this result is supported by the biology of the coinfection(52). Thus, HCV in HIV patients can cause damage to their immune system, which could subsequently increase viral replication of HIV and HCV, further contributing to an impaired immune system and consequently lower CD4+ T-cell count(53,54). However, caution should be taken in the interpretation of CD4+ T-cell counts since it may not truly reflect the immunological status of HIV-infected patients. Factors such as medications, advanced
liver disease, splenomegaly, and viral infections such as Epstein Barr Virus, cytomegalovirus, and HTLV-1, as well as bacterial infections such as tuberculosis may cause the absolute CD4+ T-cell count to decrease(55). In addition, the lymphoid tissue fibrosis and liver fibrosis contributes to CD4+ T-cell depletion(56-58), and a low CD4+ T-cell count was associated with advanced and major liver disease histological index(59). In this sense, our reports showed that patients HCV coinfected and with Fibrosis F3 had a higher median nadir T CD4 + when compared to individuals HCV coinfected with Fibrosis F4. However, due to the low amount individuals, we cannot position ourselves on this finding.
Our study presents some limitations. First, convenience sam-pling for HIV-1 subtyping among HIV-coinfected patients was the main limitation of our study. A more systematic sampling, spanning all coinfected patients, would certainly provide a more accurate picture for the diversity of HIV-1 in our region. Secondly, because of a few patients with HCV-3, the power of the study may be insufficient to compare HCV-1 and 3 in HIV-infected patients who may be masked by potential confounding factors and to allow for more precise conclusions. Thirdly, information on epidemiology was collected from questionnaires administered during individual interviews, all of which may not have been completed with the same level of detail, potentially generating biases.
CONCLUSION
HCV-1 was the most prevalent among HIV-HCV-coinfected patients, followed by HCV-3, as well as subtype B of HIV-1 among HIV-coinfected patients. Significantly lower values for nadir CD4+ T-cell counts in the HIV-HCV group were found when compared to those with HIV-HBV. There was no statistically significant as-sociation between nadir CD4+ T-cell counts and HIV viral load among HCV-1 and HCV-3 among HIV-infected patients. Prospec-tive studies should be conducted to better understand the effect of HCV genotypes in HIV-infected patients.
ACKNOWLEDGEMENTS
The authors extend their thanks to the Secretariat of Health of the City of Cascavel and Maringá.
Authors’ contributionSilva CM and Bertolini DA conceived the study; Silva CM and
Peder LD designed the study; Silva CM, Teixeira JJV and Bertolini DA analyzed and interpreted the data; Silva CM and Thomazella MV collected and processed the samples and interpreted the results; Teixeira JJV and Bertolini DA revised the paper. All authors con-tributed to and read and approved the final manuscript.
OrcidClaudinei Mesquita da Silva. Orcid: 0000-0003-4393-0331.Leyde Daiane de Peder. Orcid: 0000-0002-0814-2586.Mateus Vailant Thomazella. Orcid: 0000-0002-1527-6910.Jorge Juarez Vieira Teixeira. Orcid: 0000-0001-7719-5350.Dennis Armando Bertolini. Orcid: 0000-0002-6460-7560.

Silva CM, Peder LD, Thomazella MV, Teixeira JJV, Bertolini DA.Profile of HCV genotypes and HIV-subtypes among HIV-coinfected patients in Southern Brazil
Arq Gastroenterol • 2019. v. 56 nº 4 out/dez • 349
REFERENCES
1. World Health Organization. Global Hepatitis Report, 2017. [Internet]. [Accessed 2018 June 10]. Available from: http://apps.who.int/iris/bitstream/10665/255016/1/9789241565455-eng.pdf?ua=1
2. Joint United Nations Programme on HIV/AIDS. AIDS by the numbers, 2016. [Internet]. [Accessed 2018 June 10]. Available from: http://www.unaids.org/sites/default/files/media_asset/AIDS-by-the-numbers-2016_en.pdf
3. Oliveira SB, Merchán-Hamann E, Amorim LDAF. HIV/AIDS coinfection with the hepatitis B and C viruses in Brazil. Cad Saude Publica. 2014;30:433-8.
4. Thio CL, Smeaton L, Saulynas M, Hwang H, Saravan S, Kulkarni S, et al: Char-acterization of HIV-HBV coinfection in a multinational HIV-infected cohort. AIDS. 2013;27:191-201.
5. Chandra N, Joshi N, YSN Raju, Kumar A, Teja VD. Hepatitis B and/or C co-infection in HIV infected patients: a study in a tertiary care centre from South India. Indian J Med Res. 2013;138:950-954.
6. Muriuki BM, Gicheru MM, Wachira D, Nyamache AK, Khamadi SA. Preva-lence of hepatitis B and C viral co-infections among HIV-1 infected individuals in Nairobi, Kenya. BMC Res Notes. 2013;6:363.
7. Mallet V, Vallet-Pichard A, Pol S. The impact of human immunodeficiency virus on viral hepatitis. Liver Int. 2011 (Suppl 1):S135-S139.
8. Otegbayo J, Taiwo BO, Akingbola TS, Odaibo GN, Adedapo KS, Penugonda S, et al. Prevalence of hepatitis B and C seropositivity in a Nigerian cohort of HIV-infected patients. Ann Hepatol. 2008;7:152-6.
9. Scheel TKH, Prentoe J, Carlsen THR, Mikkelsen LS, Gottwein JM, Bukh J. Analysis of functional differences between hepatitis C virus NS5A of genotypes 1-7 in infectious cell culture systems. PLoS Pathog. 2012;8:e1002696.
10. Petruzziello A, Marigliano S, Loquercio G, Cozzolino A, Cacciapuoti C. Global epidemiology and genotype distribution of the hepatitis C virus infection. J Hepatol. 2014;61:S45-57.
11. Campiotto S, Pinho JRR, Carrilho FJ, Da Silva LC, Souto FJD, Spinelli V, et al. Geographic distribution of hepatitis C virus genotypes in Brazil. Braz J Med Biol Res. 2005;38:41-9.
12. Cantão NM, Fogaça De Almeida L, Rodrigo Wolf I, Oliveira Almeida R, Alves De Almeida Cruz A, Nunes C, et al. HIV Reverse Transcriptase and Protease Genes Variability Can Be a Biomarker Associated with HIV and Hepatitis B or C Coinfection. Sci Rep. 2018;8:8280.
13. Regionais de Saúde - Centro de Apoio Operacional das Promotorias de Proteção à Saúde Pública. [Internet]. [Accessed 2018 May 23]. Available from: http://www.saude.mppr.mp.br/modules/conteudo/conteudo.php?conteudo=522
14. Bedossa P, Poynard T. An algorithm for the grading of activity in chronic hepatitis C. The METAVIR Cooperative Study Group. Hepatology. 1996;24:289-93.
15. Gupta E, Bajpai M, Choudhary A. Hepatitis C virus: Screening, diagnosis, and interpretation of laboratory assays. Asian J Transfus Sci. 2014;8:19-25.
16. van de Laar TJW, Langendam MW, Bruisten SM, Welp E a E, Verhaest I, van Ameijden EJC, et al. Changes in risk behavior and dynamics of hepatitis C virus infections among young drug users in Amsterdam, the Netherlands. J Med Virol. 2005;77:509-18.
17. Simmonds P, Bukh J, Combet C, Deléage G, Enomoto N, Feinstone S, et al. Consensus proposals for a unified system of nomenclature of hepatitis C virus genotypes. Hepatology. 2005;42:962-73.
18. Bello G, Passaes CP, Guimarães ML, Lorete RS, Matos Almeida SE, Medeiros RM, et al. Origin and evolutionary history of HIV-1 subtype C in Brazil. AIDS. 2008;22:1993-2000.
19. Telele NF, Kalu AW, Gebre-Selassie S, Fekade D, Marrone G, Grossmann S, et al. A viral genome wide association study and genotypic resistance testing in patients failing first line antiretroviral therapy in the first large countrywide Ethiopian HIV cohort. BMC Infect Dis. 2019;19:569.
20. StataCorp L. Stata version 12.0. College station. TX StataCorp LP. 2011.21. Brasil. Ministério da Saúde. Protocolo Clínico e Diretrizes Terapêuticas para
Hepatite C e Coinfecções. [Internet]. [Accessed July 29, 2019]. Available from: http://www.aids.gov.br/pt-br/pub/2017/protocolo-clinico-e-diretrizes-terapeuti-cas-para-hepatite-c-e-coinfeccoes
22. Fried MW, Shiffman ML, Reddy KR, Smith C, Marinos G, Gonçales FL, et al. Peginterferon alfa-2a plus ribavirin for chronic hepatitis C virus infection. N Engl J Med. 2002;347:975-82.
23. Petruzziello A, Marigliano S, Loquercio G, Cozzolino A, Cacciapuoti C. Global epidemiology of hepatitis C virus infection: An up-date of the distribution and circulation of hepatitis C virus genotypes. World J Gastroenterol. 2016;22:7824-40.
24. Mendes-Correa MC, Cavalheiro NP, Mello C, Barone AA, Gianini RJ. Genotypic distribution of hepatitis C among hepatitis C and HIV co-infected patients in Brazil. Int J STD AIDS. 2008;19:595-9.
25. Silva CM, Costi C, Krug LP, Ramos AB, Grandi T, Gandolfi VL, et al. High proportion of hepatitis C virus genotypes 1 and 3 in a large cohort of patients from Southern Brazil. Mem Inst Oswaldo Cruz. 2007;102:867-70.
26. Freitas SZ, Teles SA, Lorenzo PC, Puga MAM, Tanaka TSO, Thomaz DY, et al. HIV and HCV coinfection: prevalence, associated factors and genotype characterization in the Midwest Region of Brazil. Rev Inst Med Trop Sao Paulo. 2014;56:517-24.
27. Triantos C, Konstantakis C, Tselekouni P, Kalafateli M, Aggeletopoulou I, Manolakopoulos S. Epidemiology of hepatitis C in Greece. World J Gastroenterol. 2016;22:8094-102.
28. Valle Tovo C, Alves de Mattos A, Ribeiro de Souza A, Ferrari de Oliveira Rigo J, Lerias de Almeida PR, Galperim B, et al. Impact of human immunodeficiency virus infection in patients infected with the hepatitis C virus. Liver Int. 2007;27:40-6.
29. Krug LP, Lunge VR, Ikuta N, Fonseca AS, Cheinquer H, Ozaki LS, et al. Hepatitis C virus genotypes in Southern Brazil. Braz J Med Biol Res. 1996;29:1629-32.
Silva CM, Peder LD, Thomazella MV, Teixeira JJV, Bertolini DA. Perfil dos genótipos do HCV e subtipos de HIV em pacientes coinfectados no Sul do Brasil. Arq Gastroenterol. 2019;56(4):344-50. RESUMO – Contexto – Os vírus das hepatites B e C (VHB e VHC) são os causadores das duas infecções mais comuns entre os pacientes infectados pelo
vírus da imunodeficiência humana (HIV). Objetivo – Identificar a frequência dos subtipos do HIV e genótipos de VHC em pacientes coinfectados com HIV. Métodos – Estudo transversal e retrospectivo realizado em dois centros de referência do Sul do Brasil, entre 1º de janeiro de 2002 e 30 de junho de 2016. O sistema Abbott Real Time HCV Genótipo II foi utilizado para diagnósticos de rotina para determinar o genótipo do HCV com base na PCR em tempo real de duplo alvo. O RNA viral do HIV-1 foi extraído de amostras de soro e fragmentos do gene pol foram obtidos por PCR. As sequências do gene PT e RT do HIV-1 foram submetidas à análise filogenética por máxima verossimilhança através da coleta de sequências de referência do subtipo M do grupo HIV-1 da base de dados Los Alamos. Resultados – Durante o período do estudo, 3340 pacientes foram diagnosticados com HIV em ambos os centros de referência, dos quais 4,97% (166/3340) possuíam coinfecção com HBV e/ou HCV. A soroprevalência de HIV-HBV, HIV-HCV e HIV-HBV-HCV foi de 37,4%, 58,4% e 4,2%, respectivamente. Pacientes HIV-VHC possuíam menor nadir de células T CD4+ quando comparados aos pacientes HIV-VHB (P=0,01). Entre os pacientes HIV-VHC, os genótipos VHC-1 e VHC-3 foram os mais prevalentes, sendo encon-trados em 73,8% e 21,4%, respectivamente. Entre os coinfectados com VHC-1, 79,3% e 20,1% tinham subtipos 1a e 1b, respectivamente. O subtipo B do HIV foi o mais prevalente em pacientes coinfectados. Não houve diferença significativa em relação nadir de células T CD4+ e carga viral do HIV quando comparadas os coinfectados com o VHC-1 com o VHC-3, assim como, os coinfectados com HCV-1a quando comparados com o HCV-1b. Conclusão – No presente estudo, uma maior frequência do subtipo B do HIV e do VHC-1 foram encontrados em pacientes coinfectados com HIV. Outros estudos em larga escala e a longo prazo são necessários para entender melhor o efeito dos genótipos do HCV em pacientes infectados pelo HIV.
DESCRITORES – Infecções por HIV. Hepacivirus. Genótipo. Contagem de linfócito CD4.

Silva CM, Peder LD, Thomazella MV, Teixeira JJV, Bertolini DA.Profile of HCV genotypes and HIV-subtypes among HIV-coinfected patients in Southern Brazil
350 • Arq Gastroenterol • 2019. v. 56 nº 4 out/dez
30. Galperim B, Cheinquer H, Stein A, Fonseca A, Lunge V, Ikuta N. Prevalence of hepatitis C virus in alcoholic patients: Role of parenteral risk factors. Arq Gastroenterol. 2006;43:81-4.
31. Alter MJ. Epidemiology of viral hepatitis and HIV co-infection. J Hepatol. 2006;44 (Suppl 1):S6-9.
32. Wolff FH, Fuchs SC, Barcellos NT, Falavigna M, Cohen M, Brandão AB, et al. Risk factors for hepatitis C virus infection in individuals infected with the HIV. Dig Liver Dis. 2008;40:460-7.
33. Hemelaar J. Implications of HIV diversity for the HIV-1 pandemic. J Infect. 2013;66:391-400.
34. Librelotto CS, Graf T, Simon D, de Almeida SEM, Lunge VR. HIV-1 epidemi-ology and circulating subtypes in the countryside of South Brazil. Rev Soc Bras Med Trop. 2015;48:249-57.
35. Avanzi VM, Vicente BA, Beloto NCP, Gomes-Da-Silva MM, Ribeiro CEL, Tuon FF, et al. Profile of HIV subtypes in HIV/HBV- and HIV/HCVcoinfected patients in Southern Brazil. Rev Soc Bras Med Trop. 2017;50:470-77.
36. Bello G, Zanotto PM de A, Iamarino A, Gräf T, Pinto AR, Couto-Fernandez JC, et al. Phylogeographic analysis of HIV-1 subtype C dissemination in Southern Brazil. PLoS One. 2012;7:e35649.
37. Delatorre E, Couto-Fernandez JC, Guimarães ML, Vaz Cardoso LP, de Alcan-tara KC, Martins de Araújo Stefani M, et al. Tracing the Origin and Northward Dissemination Dynamics of HIV-1 Subtype C in Brazil. PLoS One. 2013;8: e74072.
38. Chen X, He J-M, Ding L-S, Zhang G-Q, Zou X-B, Zheng J. Prevalence of hepatitis B virus and hepatitis C virus in patients with human immunodeficiency virus infection in Central China. Arch Virol. 2013;158:1889-94.
39. Mendes-Corrêa MCJ, Barone AA, Cavalheiro NP, Tengan FM, Guastini C. Prevalence of hepatitis B and C in the sera of patients with HIV infection in Sao Paulo, Brazil. Rev do Inst Med Trop São Paulo. 2000;42:81-85.
40. de Almeida Pereira RAR, Mussi ADH, de Azevedo e Silva VC, Souto FJD. Hepatitis B Virus infection in HIV-positive population in Brazil: results of a survey in the state of Mato Grosso and a comparative analysis with other regions of Brazil. BMC Infect Dis. 2006;6:34.
41. Marchesini AM, Pra-Baldi ZP, Mesquita F, Bueno R, Buchalla CM. Hepatitis B and C among injecting drug users living with HIV in Sao Paulo, Brazil. Rev Saude Publica. 2007;41 (Suppl 2):57-63.
42. Freitas SZ, Soares CC, Tanaka TSO, Lindenberg ASC, Teles SA, Torres MS, et al. Prevalence, risk factors and genotypes of hepatitis B infection among HIV-infected patients in the State of MS, Central Brazil. Braz J Infect Dis. 2014;18:473-80.
43. Gandhi RT, Wurcel A, Lee H, McGovern B, Boczanowski M, Gerwin R, et al. Isolated antibody to hepatitis B core antigen in human immunodeficiency virus type-1-infected individuals. Clin Infect Dis. 2003;36:1602-5.
44. Thio CL. Hepatitis B in the human immunodeficiency virus-infected patient: Epidemiology, natural history, and treatment. Semin Liver Dis. 2003;23:125-36.
45. Collier MG, Drobeniuc J, Cuevas-Mota J, Garfein RS, Kamili S, Teshale EH. Hepatitis A and B among young persons who inject drugs-Vaccination, past, and present infection. Vaccine. 2015;33:2808-12.
46. French AL, Operskalski E, Peters M, Strickler HD, Tien PC, Sharp GB, et al. Isolated hepatitis B core antibody is associated with HIV and ongoing but not resolved hepatitis C virus infection in a cohort of US women. J Infect Dis. 2007;195:1437-42.
47. Hoffmann CJ, Thio CL. Clinical implications of HIV and hepatitis B co-infection in Asia and Africa. Lancet Infect Dis. 2007;7:402-9.
48. Wolff FH, Fuchs SC, Barcellos NNT, de Alencastro PR, Ikeda MLR, Brandão ABM, et al. Co-infection by Hepatitis C virus in HIV-infected patients in Southern Brazil: Genotype distribution and clinical correlates. PLoS One. 2010;5.e10494.
49. Soriano V, Mocroft A, Rockstroh J, Ledergerber B, Knysz B, Chaplinskas S, et al. Spontaneous viral clearance, viral load, and genotype distribution of hepatitis C virus (HCV) in HIV-infected patients with anti-HCV antibodies in Europe. J Infect Dis. 2008;198:1337-44.
50. Gonzalez VD, Falconer K, Blom KG, Reichard O, Mørn B, Laursen AL, et al. High levels of chronic immune activation in the T-cell compartments of patients coinfected with hepatitis C virus and human immunodeficiency virus type 1 and on highly active antiretroviral therapy are reverted by alpha interferon and ribavirin treatment. J Virol. 2009;83:11407-11.
51. Graham CS, Curry M, He Q, Afdhal N, Nunes D, Fleming C, et al. Comparison of HCV‐specific intrahepatic CD4+ T cells in HIV/HCV versus HCV. Hepatology. 2004;40:125-32.
52. Hunt PW, Martin JN, Sinclair E, Bredt B, Hagos E, Lampiris H, et al. T cell activation is associated with lower CD4+ T cell gains in human immunodeficiency virus-infected patients with sustained viral suppression during antiretroviral therapy. J Infect Dis. 2003;187:1534-43.
53. Adewole OO, Anteyi E, Ajuwon Z, Wada I, Elegba F, Ahmed P, et al. Hepatitis B and C virus co-infection in Nigerian patients with HIV infection. J Infect Dev Ctries. 2009;3:369-75.
54. Netski DM, Mosbruger T, Astemborski J, Mehta SH, Thomas DL, Cox AL. CD4+ T cell-dependent reduction in hepatitis C virus-specific humoral immune responses after HIV infection. J Infect Dis. 2007;195:857-63.
55. Schechter M, Harrison LH, Halsey NA, Trade G, Santino M, Moulton LH, et al. Coinfection with human T-cell lymphotropic virus type I and HIV in Brazil. Impact on markers of HIV disease progression. JAMA. 1994;271:353-7.
56. Sanchez JL, Hunt PW, Reilly CS, Hatano H, Beilman GJ, Khoruts A, et al. Lymphoid fibrosis occurs in long-term nonprogressors and persists with antiret-roviral therapy but may be reversible with curative interventions. J Infect Dis. 2014;211:1068-75.
57. Rockstroh JK, Spengler U, Sudhop T, Ewig S, Theisen A, Hammerstein U, et al. Immunosuppression may lead to progression of hepatitis C virus-associated liver disease in hemophiliacs coinfected with HIV. Am J Gastroenterol. 1996;91:2563-8.
58. Puoti M, Bonacini M, Spinetti A, Putzolu V, Govindarajan S, Zaltron S, et al. Liv-er fibrosis progression is related to CD4 cell depletion in patients coinfected with hepatitis C virus and human immunodeficiency virus. J Infect Dis. 2001;183:134-7.
59. Mohsen AH, Easterbrook PJ, Taylor C, Portmann B, Kulasegaram R, Murad S, et al. Impact of human immunodeficiency virus (HIV) infection on the progression of liver fibrosis in hepatitis C virus infected patients. Gut. 2003;52:1035-40.
AHEAD OF PRINTORIGINAL ARTICLE
Arq Gastroenterol • 2019. v. 56 nº 4 out/dez • 351
INTRODUCTION
Crohn’s disease (CD) is an idiopathic chronic inflammatory disorder of the gastrointestinal tract with a relapsing-remitting course(1). Although its etiology is not completely known, it is believed that a combination of environmental factors, intestinal microbiota modifications, and dysfunction of the mucosal immune system are involved in its development in genetically susceptible individuals(1). Over the past 50 years, the incidence of CD and its prevalence rates have been increasing in countries that have adapted a ‘‘westernized’’ lifestyle(2,3). It is speculated that this phenomenon can be explained, at least in part, by the impact of modifications in dietary habits and sedentary lifestyle on the composition of the gut microbiota(4).
Physical activity has been associated with the pathogenesis of CD(3). The benefits of physical activity to patients with CD may be due to modulation of immune function, with suppression of pro-inflammatory factors and an increase of anti-inflammatory mechanisms(5). These benefits are associated with clinical improve-ment, as demonstrated by Jones et al., in a prospective study, in which level inflammatory bowel disease (IBD) patients in remission with high exercise levels presented a lower risk of flare up, compared to patients with lower exercise levels(6). Moreover, regular exercise
Physical activity in daily life, exercise capacity and quality of life in patients with Crohn’s disease on infliximab-induced remission: a preliminary study
Andrea Lemos CABALZAR1, Felipe Meirelles de AZEVEDO2, Fernando de Azevedo LUCCA1, Maycon de Moura REBOREDO2, Carla MALAGUTI2 and Júlio Maria Fonseca CHEBLI1
Received 6/6/2019Accepted 23/7/2019
ABSTRACT – Background – Physical activity in daily life and exercise capacity have not been assessed in patients with Crohn’s disease to date. Objective – To evaluate the physical activity in daily life, exercise capacity, quality of life, and prevalence of mood disorders in patients with moderate-to-severe Crohn’s disease on infliximab-induced remission and the possible associations among variables. Methods – A cross-sectional preliminary study was conducted. Twenty-six patients with Crohn’s disease and 20 controls were selected. Participants underwent evaluation of physical activity in daily life (triaxial accelerometer), exercise capacity (shuttle walk test), handgrip strength, quality of life, and presence of mood disorders. Results – The number of steps taken (7446±3081 vs 7898±2487), active time (80.6±42 vs 89.7±24.3min), shuttle walk test distance [665 (405) vs 710 (409) m] and handgrip strength [31 (15) vs 29 (20) kgf did not show any difference between the patients with Crohn’s disease and the controls. The time spent lying down [95.8 (68.8) vs 60.9 (74.7) min] was greater and some domains of the quality of life were superior in the patients with Crohn’s disease. No correlation was observed between the physical activity in daily life and quality of life or presence of mood disorders in patients with Crohn’s disease. Conclusion – Patients with Crohn’s disease on infliximab-induced remission, despite to more time spent lying down, they have the same level of physical activity in daily life and exercise capacity min compared with the controls.
HEADINGS – Crohn disease. Exercise tolerance. Exercise.
Declared conflict of interest of all authors: JMF Chebli has served as speaker for Abbott, Abbvie, Janssen, and Takeda. Even so, JMF Chebli claims to have no conflict of interest. For the remaining authors none were declared.Disclosure of funding: Partially supported by Fundação de Amparo à Pesquisa do Estado de Minas Gerais (FAPEMIG), Conselho Nacional de Desenvolvimento Científico e Tecnológico (CNPq) and by the Coordenação de Aperfeiçoamento de Pessoal de Nível Superior - Brasil (CAPES) – Finance Code 001.1 Universidade Federal de Juiz de Fora, Faculdade de Medicina, Departamento de Gastroenterologia, Hospital Universitário, Centro de Doenças Inflamatórias Intestinais, Juiz de Fora, MG, Brasil. 2 Universidade Federal de Juiz de Fora, Faculdade de Fisioterapia, Programa de Pós-Graduação Ciências da Reabilitação e Desempenho Físico-Funcional, Juiz de Fora, MG, Brasil. Corresponding author: Carla Malaguti. E-mail: [email protected]
has other positive impacts such as improvement of nutritional and mood status, improvement of body composition and reduction of bone mineral loss, reduction of fatigue levels, and increase of quality of life (QoL)(7).
Diarrhea, abdominal pain, anorexia, and weight loss are the main symptoms of CD, and altogether, they result in malnutrition, fatigue, sarcopenia, osteopenia, and osteoporosis(8,9), and a higher risk of fractures(10,11). The patients with patients encounter difficul-ties in exercising and frequently present a sedentary lifestyle, which may impair the control of the disease, inducing a vicious cycle(3,7).
The use of anti-tumor necrosis factor-alpha (TNF-α) agents, such as infliximab, has markedly changed the treatment of the pa-tients with CD. It has been demonstrated that they not only elicit and maintain remission of the disease, but also reverse some of its deleterious consequences, including muscle wasting and sarcopenia that arise from chronic inflammation(12). We hypothesized that the patients with CD on infliximab-induced remission have similar levels of exercise capacity and physical activity in daily life as the healthy controls. We conducted this study to assess physical activity in daily life, exercise capacity, QoL and mood disorders in outpatients with infliximab-induced remission of moderate-to-severe CD. We also investigated variables associated with physical activity in daily life.
AG-2019-81dx.doi.org/10.1590/S0004-2803.201900000-65

Cabalzar AL, Azevedo FM, Lucca FA, Reboredo MM, Malaguti C, Chebli JMF. Physical activity in daily life, exercise capacity and quality of life in patients with Crohn’s disease on infliximab-induced remission: a preliminary study
352 • Arq Gastroenterol • 2019. v. 56 nº 4 out/dez
METHODS
Study designThis cross-sectional preliminary study was conducted between
December 2014 and November 2016 at the University Hospital of the Federal University of Juiz de Fora, Brazil.
ParticipantsVolunteers were recruited from patients of the Inflammatory
Bowel Disease Outpatients Clinic (CD group) and the General Gas-troenterology Outpatients Clinic (control group) of the hospital. In both cases, patients who presented at the clinics for scheduled medical appointments were assessed regarding study eligibility and invited to participate. We recruited control group subjects with functional dyspepsia since these are comparators of the same socioeconomic status as users of a University Hospital.
All procedures performed in studies involving human par-ticipants were in accordance with the ethical standards of the institutional and/or national research committee and with the 1964 Helsinki declaration and its later amendments, or comparable ethi-cal standards. The Ethics Review Board of the institution approved the study under nº 95.125and informed consent was obtained from all individual participants in the study.
The patients with CD were included if they were 18 years of age or older and presented moderate-to-severe disease in infliximab-induced clinical remission over for at least six months. The diagnosis of CD was based on clinical, radiologic, endoscopic, and histo-pathological criteria(13), and its severity was defined based on the CD activity index score and symptomology, according to European Crohn’s and Colitis Organization guidelines on the diagnosis and management of CD(13). Clinical remission was defined by a Harvey-Bradshaw Index (HBI) of less than 5(14). The control group was recruited from asymptomatic patients with diagnosis of functional dyspepsia, defined by the ROME IV diagnostic criteria(15).
We excluded patients who have presented active CD (HBI ≥5) during the last six months despite infliximab therapy, those who had mild CD, those who had articular, neurologic or neuromuscular disease, short-bowel syndrome; and those with a stoma. In both groups, we excluded participants who had severe comorbidities, such as cardiopulmonary disease, hepatic disease, end-stage renal disease and active malignancy (except cutaneous), and obesity grade II. Pregnant or nursing women, and those who wanted to become pregnant during the study were not selected.
Measurements and outcomesAfter obtaining written informed consent, patients’ anthropo-
metric, medical and socio-demographic data were collected. We also obtained disease-associated variables, including duration of disease, location and phenotype of CD according to the Montreal classifica-tion, and activity of the disease measured according to the HBI(16).
Physical activity in daily lifePhysical activity in daily life was monitored by a DynaPort
activity monitor (McRoberts BV, The Hague, Netherlands), a tri axial accelerometer that measures the time spent in different activi-ties and positions (standing, walking, lying down and sitting), and the number of steps taken. Patients were instructed to place the accelerometer at the waistline and to wear it during the waking periods (12-hour periods) of four consecutive days, including one day of the weekend, except during showers and water activities.
Patients were instructed to maintain normal activity behavior while using the device(17).
The modified Baecke questionnaire, validated for the Brazilian population, was applied to measure self-reported physical activity. It includes questions about household activities, sports, and leisure time during the last 12 months, as previously described(18). The sum of the results of the three separated domains yields a final score that classifies the patients into: sedentary (<9); active (9–16) or athletic (>16).
Exercise capacityExercise capacity was evaluated by the shuttle walking test
(SWT)(19). In SWT the patient is instructed to walk up and down a 10 m course separated by cones. An audio sign dictates the speed of which the patient is supposed to walk. Every minute the walking speed increased by a small increment. The test was stopped when the patient was unable to maintain the required speed or showed any symptoms. The total distance indicated the exercise capacity. Vital signs, such as heart rate, blood pressure, and peripheral oxygen saturation were recorded. The modified Borg scale score for evalua-tion of dyspnea and fatigue was measured before and after SWT(20).
Peripheral muscle strengthHandgrip strength (HS) is a simple and objective test that
evaluates the function of skeletal muscle. HS was performed with a hydraulic dynamometer (SAEHAN, Korea), according to Ameri-can Society of Hand Therapists recommendations(21). Three values were obtained with the dominant hand, and the highest value was compared to the normality table based on sex and age(22).
Quality of lifeThe QoL was assessed both by the Short Form 36 Healthy
Survey (SF-36) and the Inflammatory Bowel Disease Question-naire (IBDQ), which were previously translated and validated in Brazil(23,24). SF-36 is comprised of 36 questions that gather data on: physical health, such as physical functioning, role-physical, bodily pain, and general health; and components related to mental health, specifically, vitality, social functioning, role-emotional and mental health in general. The answers to these questions in each domain are assigned a numerical score, which is coded and classified on a scale from 0 to 100, with 100 being the highest QoL(23). IBDQ is a specifi-cally designed questionnaire that evaluates the QoLof patients with IBD. It is made up of 32 questions that evaluates different aspects of health quality gathered into four domains: intestinal symptoms, systemic symptoms, social and emotional functions. The score is based on the Likert scale that ranges from 1 to 7, with 1 being the worst state and 7 the best QoL. All the domains are grouped and summed up giving the global score(24).
Anxiety and depressionAnxiety and depression levels were assessed using the Hospital
Anxiety and Depression Scale (HADS), validated for the Brazil-ian population(25). It screens for clinically significant anxiety and depressive symptoms in medically ill patients. HADS is composed of 14 items, equally divided into anxiety and depression-related questions. Each item is rated on a 4-point scale, ranging from 0 (no impairment) to 3 (highest impairment). Anxiety and depression scores are considered as the sum of the respective items, ranging from 0 to 21. According to the validated translations of HADS, the cutoff value for depressive or anxiety symptoms is 8.
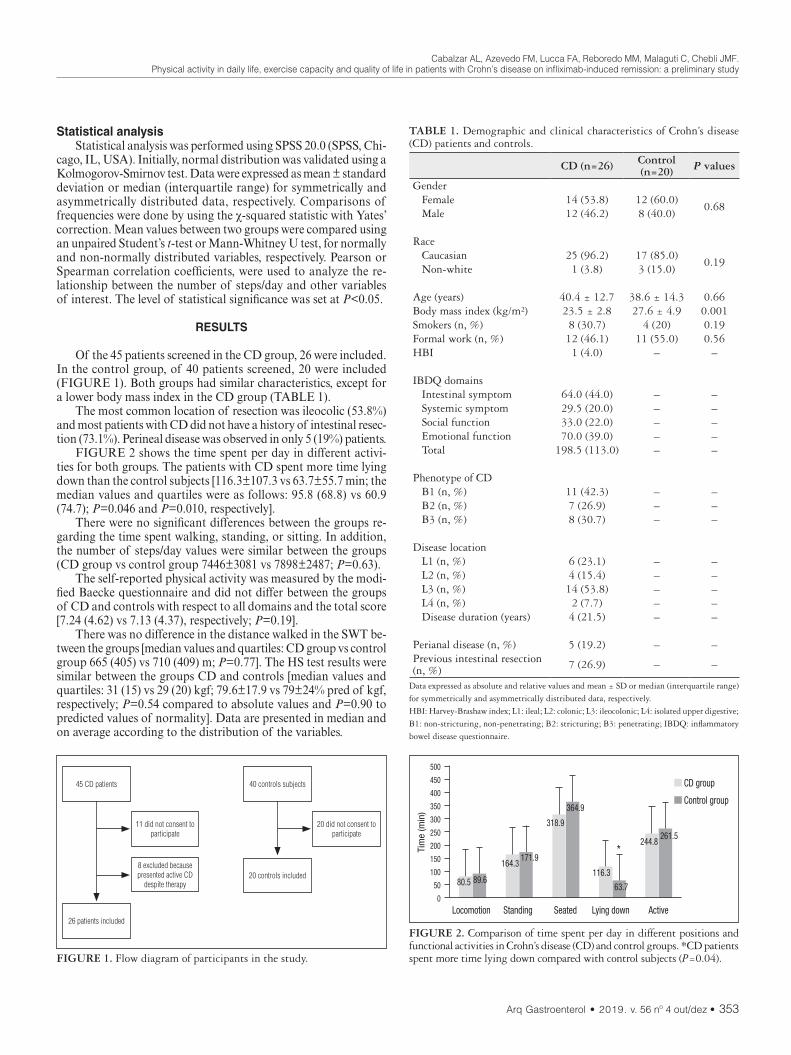
Cabalzar AL, Azevedo FM, Lucca FA, Reboredo MM, Malaguti C, Chebli JMF. Physical activity in daily life, exercise capacity and quality of life in patients with Crohn’s disease on infliximab-induced remission: a preliminary study
Arq Gastroenterol • 2019. v. 56 nº 4 out/dez • 353
Statistical analysisStatistical analysis was performed using SPSS 20.0 (SPSS, Chi-
cago, IL, USA). Initially, normal distribution was validated using a Kolmogorov-Smirnov test. Data were expressed as mean ± standard deviation or median (interquartile range) for symmetrically and asymmetrically distributed data, respectively. Comparisons of frequencies were done by using the χ-squared statistic with Yates’ correction. Mean values between two groups were compared using an unpaired Student’s t-test or Mann-Whitney U test, for normally and non-normally distributed variables, respectively. Pearson or Spearman correlation coefficients, were used to analyze the re-lationship between the number of steps/day and other variables of interest. The level of statistical significance was set at P<0.05.
RESULTS
Of the 45 patients screened in the CD group, 26 were included. In the control group, of 40 patients screened, 20 were included (FIGURE 1). Both groups had similar characteristics, except for a lower body mass index in the CD group (TABLE 1).
The most common location of resection was ileocolic (53.8%) and most patients with CD did not have a history of intestinal resec-tion (73.1%). Perineal disease was observed in only 5 (19%) patients.
FIGURE 2 shows the time spent per day in different activi-ties for both groups. The patients with CD spent more time lying down than the control subjects [116.3±107.3 vs 63.7±55.7 min; the median values and quartiles were as follows: 95.8 (68.8) vs 60.9 (74.7); P=0.046 and P=0.010, respectively].
There were no significant differences between the groups re-garding the time spent walking, standing, or sitting. In addition, the number of steps/day values were similar between the groups (CD group vs control group 7446±3081 vs 7898±2487; P=0.63).
The self-reported physical activity was measured by the modi-fied Baecke questionnaire and did not differ between the groups of CD and controls with respect to all domains and the total score [7.24 (4.62) vs 7.13 (4.37), respectively; P=0.19].
There was no difference in the distance walked in the SWT be-tween the groups [median values and quartiles: CD group vs control group 665 (405) vs 710 (409) m; P=0.77]. The HS test results were similar between the groups CD and controls [median values and quartiles: 31 (15) vs 29 (20) kgf; 79.6±17.9 vs 79±24% pred of kgf, respectively; P=0.54 compared to absolute values and P=0.90 to predicted values of normality]. Data are presented in median and on average according to the distribution of the variables.
26 patients included
11 did not consent to participate
8 excluded because presented active CD
despite therapy20 controls included
20 did not consent to participate
40 controls subjects45 CD patients
FIGURE 1. Flow diagram of participants in the study.
TABLE 1. Demographic and clinical characteristics of Crohn’s disease (CD) patients and controls.
CD (n=26) Control (n=20) P values
Gender Female 14 (53.8) 12 (60.0)
0.68 Male 12 (46.2) 8 (40.0)
Race Caucasian 25 (96.2) 17 (85.0)
0.19 Non-white 1 (3.8) 3 (15.0)
Age (years) 40.4 ± 12.7 38.6 ± 14.3 0.66Body mass index (kg/m²) 23.5 ± 2.8 27.6 ± 4.9 0.001Smokers (n, %) 8 (30.7) 4 (20) 0.19Formal work (n, %) 12 (46.1) 11 (55.0) 0.56HBI 1 (4.0) – –
IBDQ domains Intestinal symptom 64.0 (44.0) – – Systemic symptom 29.5 (20.0) – – Social function 33.0 (22.0) – – Emotional function 70.0 (39.0) – – Total 198.5 (113.0) – –
Phenotype of CD B1 (n, %) 11 (42.3) – – B2 (n, %) 7 (26.9) – – B3 (n, %) 8 (30.7) – –
Disease location L1 (n, %) 6 (23.1) – – L2 (n, %) 4 (15.4) – – L3 (n, %) 14 (53.8) – – L4 (n, %) 2 (7.7) – – Disease duration (years) 4 (21.5) – –
Perianal disease (n, %) 5 (19.2) – –Previous intestinal resection (n, %) 7 (26.9) – –
Data expressed as absolute and relative values and mean ± SD or median (interquartile range) for symmetrically and asymmetrically distributed data, respectively.HBI: Harvey-Brashaw index; L1: ileal; L2: colonic; L3: ileocolonic; L4: isolated upper digestive; B1: non-stricturing, non-penetrating; B2: stricturing; B3: penetrating; IBDQ: inflammatory bowel disease questionnaire.
FIGURE 2. Comparison of time spent per day in different positions and functional activities in Crohn’s disease (CD) and control groups. *CD patients spent more time lying down compared with control subjects (P=0.04).
500
450
400
350
300
250
200
150
100
50
0 Locomotion Standing Seated Lying down Active
89.6
164.3171.9
318.9
364.9
116.3
244.8
63.7
261.5
CD group
Control group
80.5
*Tim
e (m
in)
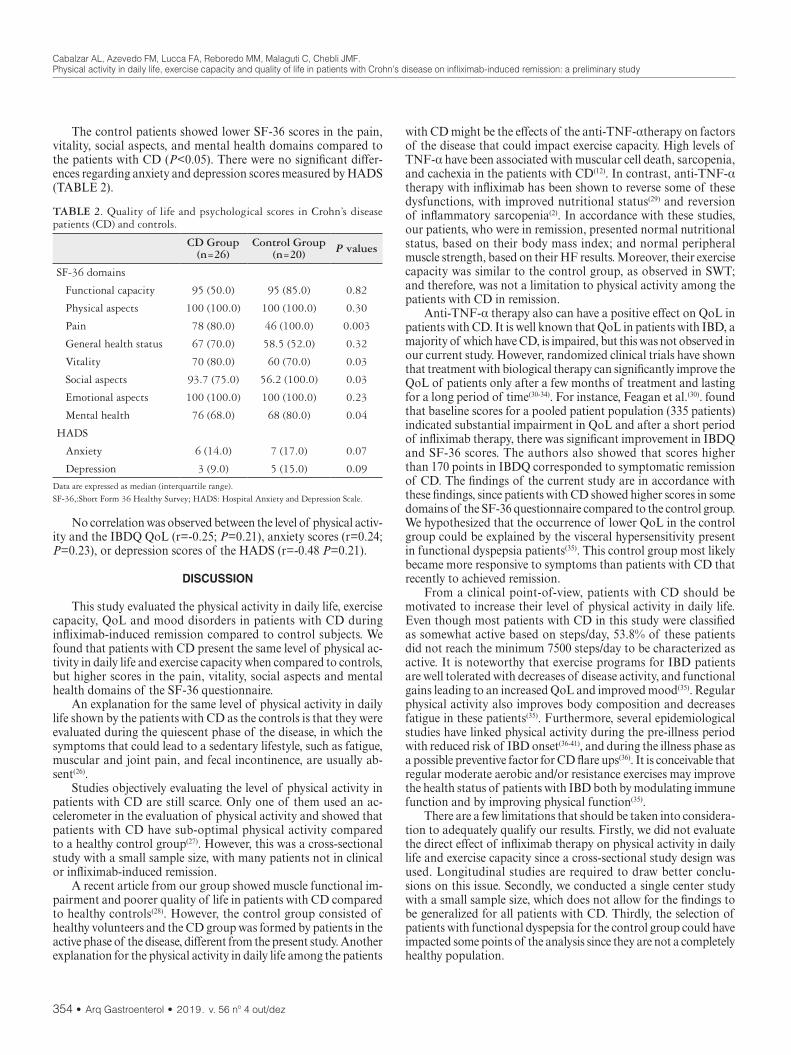
Cabalzar AL, Azevedo FM, Lucca FA, Reboredo MM, Malaguti C, Chebli JMF. Physical activity in daily life, exercise capacity and quality of life in patients with Crohn’s disease on infliximab-induced remission: a preliminary study
354 • Arq Gastroenterol • 2019. v. 56 nº 4 out/dez
The control patients showed lower SF-36 scores in the pain, vitality, social aspects, and mental health domains compared to the patients with CD (P<0.05). There were no significant differ-ences regarding anxiety and depression scores measured by HADS (TABLE 2).
with CD might be the effects of the anti-TNF-αtherapy on factors of the disease that could impact exercise capacity. High levels of TNF-α have been associated with muscular cell death, sarcopenia, and cachexia in the patients with CD(12). In contrast, anti-TNF-α therapy with infliximab has been shown to reverse some of these dysfunctions, with improved nutritional status(29) and reversion of inflammatory sarcopenia(2). In accordance with these studies, our patients, who were in remission, presented normal nutritional status, based on their body mass index; and normal peripheral muscle strength, based on their HF results. Moreover, their exercise capacity was similar to the control group, as observed in SWT; and therefore, was not a limitation to physical activity among the patients with CD in remission.
Anti-TNF-α therapy also can have a positive effect on QoL in patients with CD. It is well known that QoL in patients with IBD, a majority of which have CD, is impaired, but this was not observed in our current study. However, randomized clinical trials have shown that treatment with biological therapy can significantly improve the QoL of patients only after a few months of treatment and lasting for a long period of time(30-34). For instance, Feagan et al.(30). found that baseline scores for a pooled patient population (335 patients) indicated substantial impairment in QoL and after a short period of infliximab therapy, there was significant improvement in IBDQ and SF-36 scores. The authors also showed that scores higher than 170 points in IBDQ corresponded to symptomatic remission of CD. The findings of the current study are in accordance with these findings, since patients with CD showed higher scores in some domains of the SF-36 questionnaire compared to the control group. We hypothesized that the occurrence of lower QoL in the control group could be explained by the visceral hypersensitivity present in functional dyspepsia patients(35). This control group most likely became more responsive to symptoms than patients with CD that recently to achieved remission.
From a clinical point-of-view, patients with CD should be motivated to increase their level of physical activity in daily life. Even though most patients with CD in this study were classified as somewhat active based on steps/day, 53.8% of these patients did not reach the minimum 7500 steps/day to be characterized as active. It is noteworthy that exercise programs for IBD patients are well tolerated with decreases of disease activity, and functional gains leading to an increased QoL and improved mood(35). Regular physical activity also improves body composition and decreases fatigue in these patients(35). Furthermore, several epidemiological studies have linked physical activity during the pre-illness period with reduced risk of IBD onset(36-41), and during the illness phase as a possible preventive factor for CD flare ups(36). It is conceivable that regular moderate aerobic and/or resistance exercises may improve the health status of patients with IBD both by modulating immune function and by improving physical function(35).
There are a few limitations that should be taken into considera-tion to adequately qualify our results. Firstly, we did not evaluate the direct effect of infliximab therapy on physical activity in daily life and exercise capacity since a cross-sectional study design was used. Longitudinal studies are required to draw better conclu-sions on this issue. Secondly, we conducted a single center study with a small sample size, which does not allow for the findings to be generalized for all patients with CD. Thirdly, the selection of patients with functional dyspepsia for the control group could have impacted some points of the analysis since they are not a completely healthy population.
TABLE 2. Quality of life and psychological scores in Crohn’s disease patients (CD) and controls.
CD Group (n=26)
Control Group (n=20) P values
SF-36 domains
Functional capacity 95 (50.0) 95 (85.0) 0.82
Physical aspects 100 (100.0) 100 (100.0) 0.30
Pain 78 (80.0) 46 (100.0) 0.003
General health status 67 (70.0) 58.5 (52.0) 0.32
Vitality 70 (80.0) 60 (70.0) 0.03
Social aspects 93.7 (75.0) 56.2 (100.0) 0.03
Emotional aspects 100 (100.0) 100 (100.0) 0.23
Mental health 76 (68.0) 68 (80.0) 0.04
HADS
Anxiety 6 (14.0) 7 (17.0) 0.07
Depression 3 (9.0) 5 (15.0) 0.09
Data are expressed as median (interquartile range). SF-36,:Short Form 36 Healthy Survey; HADS: Hospital Anxiety and Depression Scale.
No correlation was observed between the level of physical activ-ity and the IBDQ QoL (r=-0.25; P=0.21), anxiety scores (r=0.24; P=0.23), or depression scores of the HADS (r=-0.48 P=0.21).
DISCUSSION
This study evaluated the physical activity in daily life, exercise capacity, QoL and mood disorders in patients with CD during infliximab-induced remission compared to control subjects. We found that patients with CD present the same level of physical ac-tivity in daily life and exercise capacity when compared to controls, but higher scores in the pain, vitality, social aspects and mental health domains of the SF-36 questionnaire.
An explanation for the same level of physical activity in daily life shown by the patients with CD as the controls is that they were evaluated during the quiescent phase of the disease, in which the symptoms that could lead to a sedentary lifestyle, such as fatigue, muscular and joint pain, and fecal incontinence, are usually ab-sent(26).
Studies objectively evaluating the level of physical activity in patients with CD are still scarce. Only one of them used an ac-celerometer in the evaluation of physical activity and showed that patients with CD have sub-optimal physical activity compared to a healthy control group(27). However, this was a cross-sectional study with a small sample size, with many patients not in clinical or infliximab-induced remission.
A recent article from our group showed muscle functional im-pairment and poorer quality of life in patients with CD compared to healthy controls(28). However, the control group consisted of healthy volunteers and the CD group was formed by patients in the active phase of the disease, different from the present study. Another explanation for the physical activity in daily life among the patients

Cabalzar AL, Azevedo FM, Lucca FA, Reboredo MM, Malaguti C, Chebli JMF. Physical activity in daily life, exercise capacity and quality of life in patients with Crohn’s disease on infliximab-induced remission: a preliminary study
Arq Gastroenterol • 2019. v. 56 nº 4 out/dez • 355
CONCLUSION
Patients with moderate-severe CD on infliximab-induced clini-cal remission have the same level of physical activity in daily life, and exercise capacity compared to controls subjects, although they spend more time resting. QoL was impaired in domains of pain, vitality, social aspects and mental health in the control patients with functional dyspepsia, probably due to the visceral hypersen-sitivity of these subjects. However, because asymptomatic patients with quiescent CD have a similar low level of physical activity and more time lying down, it is important for strategies that promote physical activity be a component of regular care for the patients with CD, so that patients may obtain optimal health benefits from exercise. Nonetheless, the real long-term effect of infliximab on physical activity in daily life is not known and further longitudinal studies are needed.
Authors’ contributionCabalzar AL: acquisition of data, analysis and interpretation
of data, drafting the manuscript, final approval before submission.
Azevedo FM: acquisition of data, drafting the manuscript, final approval before submission. Lucca FA: acquisition of data, revi-sing the manuscript for critically important intellectual content, final approval before submission. Reboredo MM: conception and design of the study, analysis and interpretation of data, drafting the manuscript, final approval before submission. Malaguti C: conception and design of the study, analysis and interpretation of data, drafting the manuscript, final approval before submission. Chebli JMF: conception and design of the study, analysis and interpretation of data, drafting the manuscript, final approval before submission.
OrcidAndrea Lemos Cabalzar: Orcid: 0000.0002.5963.1945.Felipe Meirelles de Azevedo: Orcid: 0000. 0002.9520.4510.Fernando de Azevedo Lucca: Orcid: 0000.0003.3401.9597.Maycon de Moura Reboredo: Orcid: 0000.0001.8155-7414.Carla Malaguti: Orcid: 0000.0002.6619.136X.Júlio Maria Fonseca Chebli: Orcid: 0000.0003.1527.0663.
REFERENCES
1. Ricci JER Júnior, Chebli LA, Ribeiro TCDR, Castro ACS, Gaburri PD, Pace FHDL, et al. Small-Intestinal Bacterial Overgrowth is Associated With Concur-rent Intestinal Inflammation But Not With Systemic Inflammation in Crohn’s Disease Patients. J Clin Gastroenterol. 2018;52:530-6.
2. Cosnes J, Gower-Rousseau C, Seksik P, Cortot A. Epidemiology and natural history of inflammatory bowel diseases. Gastroenterology. 2011;140:1785-94.
3. Cosnes J. Smoking, physical activity, nutrition and lifestyle: Environmental factors and their impact on IBD. Dig Dis. 2010;28:411-7.
4. Hold GL, Smith M, Grange C, Watt ER, El-Omar EM, Mukhopadhya I. Role of the gut microbiota in inflammatory bowel disease pathogenesis: What have we learnt in the past 10 years? World J Gastroenterol. 2014;20:1192-210.
5. Ng V, Millard W, Lebrun C, Howard J. Exercise and Crohn’s disease: Speculations on potential benefits. Can J Gastroenterol. 2006;20:657-60.
6. Jones PD, Kappelman MD, Martin CF, Chen W, Sandler RS, Long MD. Exercise decreases risk of future active disease in inflammatory bowel disease patients in remission. Inflamm Bowel Dis. 2015;21:1063-71.
7. Klare P, Nigg J, Nold J, Haller B, Krug AB, Mair S, et al. The impact of a ten-week physical exercise program on health-related quality of life in patients with inflammatory bowel disease: A prospective randomized controlled trial. Digestion. 2015;91:239-47.
Cabalzar AL, Azevedo FM, Lucca FA, Reboredo MM, Malaguti C, Chebli JMF. Atividade física de vida diária, capacidade de exercício e qualidade de vida de pacientes com doença de Crohn em remissão induzida por infliximabe: um estudo preliminar. Arq Gastroenterol. 2019;56(4):351-6.RESUMO – Contexto – A atividade física na vida diária e a capacidade de exercício não tem sido avaliada em pacientes com doença de Crohn. Objetivo –
Avaliar a atividade física na vida diária, capacidade de exercício, qualidade de vida e distúrbios de humor em pacientes com doença de Crohn modera-da-grave em remissão induzida pelo infliximabe, e as possíveis associações entre essas variáveis. Métodos – Este foi um estudo preliminar transversal, envolvendo 26 pacientes com doença de Crohn e 20 controles. Os participantes realizaram as seguintes avaliações: atividade física na vida diária por meio de um acelerômetro triaxial, capacidade de exercício (teste de Shuttle), força de preensão palmar, qualidade de vida e distúrbios do humor. Resultados – O número de passos registrados (7446±3081 vs 7898±2487), o tempo ativo (80,6±42,0 vs 89,7±24,3min), a distância caminhada no teste de Shuttle 665 (405) vs 710 (409) m, e a força de preensão manual 31(15) vs 29 (20) kgf não mostraram diferenças entre os pacientes com doença de Crohn e os controles, respectivamente. O tempo gasto na posição deitada 95.8 (68.8) vs 60.9 (74.7) min, e alguns domínios da qualidade de vida foram maiores nos pacientes com doença de Crohn. Nenhuma correlação foi observada entre a atividade física na vida diária e a qualidade de vida ou distúrbios do humor nos pacientes com doença de Crohn. Conclusão – Pacientes com doença de Crohn em remissão induzida por infliximabe, apesar de passarem mais tempo deitados, apresentam mesmo nível de atividade física e capacidade de exercício quando comparados aos controles.
DESCRITORES – Doença de Crohn. Tolerância ao exercício. Exercício.
8. Abraham C, Cho JH. Inflammatory Bowel Disease. New Engl J Med. 2009;361:2066-78.
9. Levine JS, Burakoff R. Extraintestinal Manifestations of Inflammatory Bowel Disease. Gastroenterol Hepatol. 2011;7:255-63.
10. Lee N, Radford-smith G, Taaffe DR. Bone Loss in Crohn’s Disease : Exercise as a Potential Countermeasure. Inflamm Bowel Dis. 2005;11:1108-18.
11. Abitbol V, Roux C, Chaussade S, Guillemant S, Kolta S, Dougados M, et al. Metabolic bone assessment in patients with inflammatory bowel disease. Gas-troenterology. 1995;108:417-22.
12. Subramaniam K, Fallon K, Ruut T, Mckay R, Shadbolt B, et al. Infliximab reverses inflammatory muscle wasting (sarcopenia) in Crohn’s disease. Aliment Pharmacol Ther. 2015;41:419-28.
13. Maaser C, Sturm A, Vavricka SR, Kucharzik T, Fiorino G, Annese V, et al. ECCO-ESGAR Guideline for Diagnostic Assessment in IBD Part 1: Initial dia-gnosis, monitoring of known IBD, detection of complications.J Crohns Colitis. 2019;144-64.
14. Elliott PR, Lennard-Jones JE, Hathway N. Simple Index of Crohn’s Disease Activity. Lancet. 1980;315:876.
15. Stanghellini V, Chan FK, Hasler WL, Malagelada JR, Suzuki H, Tack J, et al. Gastroduodenal disorders. Gastroenterology. 2016;150:1380-92.

Cabalzar AL, Azevedo FM, Lucca FA, Reboredo MM, Malaguti C, Chebli JMF. Physical activity in daily life, exercise capacity and quality of life in patients with Crohn’s disease on infliximab-induced remission: a preliminary study
356 • Arq Gastroenterol • 2019. v. 56 nº 4 out/dez
16. Silverberg MS, Satsangi J, Ahmad T, Arnott ID, Bernstein CN, Brant SR, et al. Toward an integrated clinical, molecular andserological classification of inflam-matory bowel disease: Report of a Working Party of the 2005 Montreal World Congress of Gastroenterology. Can J Gastroenterol. 2005;19:5-36.
17. Welk GJ, McClain J, Ainsworth BE. Protocols for evaluating equivalency of accelerometer-based activity monitors. Med Sci Sport Exerc. 2012;44:39-49.
18. Florindo AA, Latorre MRDO. Validação e reprodutibilidade do questionário de Baecke de avaliação da atividade física habitual em homens adultos. Rev Bras Med do Esporte. 2003;9:129-35.
19. Singh SJ, Morgan MDL, Scott S, Walters D, Hardman AE. Development of a shuttle walking test of disability in patients with chronic airways obstruction. Thorax. 1992;47:1019-24.
20. Borg GAV. Psychophysical bases of perceived exertion. Med Sci Sports Ex-erc.1982;14:377-81.
21. Fess EE. Grip strength. In: Casanova JS, editor. Clinical Assessment Recom-mendations. 2nd ed. Chicago: American Society of Hand Therapists;1992.
22. Angst F, Drerup S, Werle S, Herren DB, Simmen BR, Goldhahn J. Prediction of grip and key pinch strength in 978 healthy subjects. BMC Musculoskelet Disord. 2010;11:94.
23. Ciconelli RM, Ferraz MB, Santos W, Meinão I, Quaresma MR. Tradução para a língua portuguesa e validação do questionário genérico de avaliação de qualidade de vida SF-36 (Brasil SF-36). Rev Bras Reumatol. 1999;39:143-50.
24. Pontes RMA, Miszputen SJ, Ferreira-Filho OF, Miranda C, Ferraz MB. Quali-dade de vida em pacientes portadores de doença inflamatória intestinal: tradução para o português e validação do questionário Inflammatory Bowel Disease Questionnaire (IBDQ). Arq Gastroenterol. 2004;41:137-43.
25. Botega NJ, Bio MR, Zomignani MA, Júnior CG, Pereira WAB. Transtornos do humor em enfermaria de clínica médica e validação da escala de medida (HAD) de ansiedade e depressão.Rev Saúde Pública. 1995;29:355-63.
26. Lu ZL, Wang TR, Qiao YQ, Zheng Q, Sun Y, Lu JT, et al. Handgrip Strengh Index Predicts Nutritional Status as a Complement to Body Mass Index in Crohn’s Disease. J Crohn’s Colitis. 2016;10:1395-400.
27. Langenberg DR, Papandony MC, Gibson PR. Sleep and physical activity measured by accelerometry in Crohn’s disease. Aliment Pharmacol Ther. 2015;41:991-1004.
28. Cabalzar AL, Oliveira DJF, Reboredo MM, Lucca FA, Chebli JMF, Malaguti C. Muscle function and quality of life in the Crohn’s disease. Fisioter Mov. 2017;30:337-45.
29. Nakahigashi M, Yamamoto T. Increases in body mass index during infliximab therapy in patients with Crohn’s disease: An open label prospective study. Cyto-kine. 2011;56:531-5.
30. Feagan BG, Yan S, Bala M, Bao W, Lichtenstein GR. The effects of infliximab maintenance therapy on health-related quality of life. Am J Gastroenterol. 2003;98:2232-8.
31. Loftus EV, Feagan BG, Colombel JF, Rubin DT, Wu EQ, Yu AP, et al. Effects of adalimumab maintenance therapy on health-related quality of life of patients with Crohn’s disease: Patient-reported outcomes of the CHARM trial. Am J Gastroenterol. 2008;103:3132-41.
32. Colombel JF, Sandborn WJ, Ghosh S, Wolf DC, Panaccione R, Feagan B, et al. Four-year maintenance treatment with adalimumab in patients with moderately to severely active ulcerative colitis: Data from ULTRA 1, 2, and 3. Am J Gas-troenterol. 2014;109:1771-80.
33. Leblanc K, Moli MH, Parker CE, MacDonald JK. The impact of biological interventions for ulcerative colitis on health-related quality of life. Cochrane Database Syst Rev. 2015. DOI:10.1002/14651858.CD008655.pub3.
34. Holdam ASK, Bager P, Dahlerup JF. Biological therapy increases the health-re-lated quality of life in patients with inflammatory bowel disease in a clinical setting. Scand J Gastroenterol. 2016;51:706-11.
35. Shephard RJ. The Case for Increased Physical Activity in Chronic Inflammatory Bowel Disease: A Brief Review. Int J Sports Med. 2016;37:505-15.
36. Khalili H, Ananthakrishnan AN, Konijeti GG, Liao X, Higuchi LM, Fuchs CS, et al. Physical activity and risk of inflammatory bowel disease: prospective study from the Nurses’ Health Study cohorts. BMJ 2013. DOI:10.1136/bmj.f6633.
37. Sonnenberg A, Walker JT. Occupational mortality associated with inflammatory bowel disease in the United States 1984-1998. Inflamm Bowel Dis. 2012;18: 1249-53.
38. Persson PG, Leijonmarck CE, Bernell O, Hellers G, Ahlbom A. Risk Indicators for Inflammatory Bowel-Disease. Int J Epidemiol. 1993;22:268-72.
39. Reif S, Klein I, Lubin F, Farbstein M, Hallak A, Gilat T. Pre-illness dietary factors in inflammatory bowel disease. Gut. 1997;40:754-60.
40. Cucino C, Sonnenberg A. Occupational mortality from inflammatory bowel disease in the United States 1991-1996. Am J Gastroenterol. 2001;96:1101-5.
41. Melinder C, Hiyoshi A, Hussein O, Halfvarson J, Ekbom A, Montgomery S. Physical Fitness in Adolescence and Subsequent Inflammatory Bowel Disease Risk. Clin Transl Gastroenterol. 2015;6:e121.
AHEAD OF PRINTORIGINAL ARTICLE
Arq Gastroenterol • 2019. v. 56 nº 4 out/dez • 357
INTRODUCTION
Non-alcoholic fatty liver disease (NAFLD) is found in 73% to 90% of individuals with obesity(1). NAFLD comprises a broad spectrum of diseases, such as simple steatosis, steatohepatitis and cirrhosis, which can progress to hepatocellular carcinoma(2). NAFLD is defined as the deposition of lipids in the hepatic pa-renchyma exceeding 5% of liver weight in the absence of viral, alcoholic or metabolic etiologies. Several classes of lipids can accumulate in the liver, but triglycerides are the most frequently found in fatty infiltration(3).
NAFLD is the most common form of chronic liver disease in several countries(4). In industrialized nations, the prevalence of NAFLD determined by ultrasonography ranges from 20% to 40%(5). The male sex, aging, systemic arterial hypertension and type II diabetes mellitus are associated factors; moreover, diet and life-style play a fundamental role in the pathogenesis of this disease(6).
Besides the hepatic complications arising from NAFLD, in 2014, the Korean Sarcopenic Obesity Study published, for the first time, the possible relation between the loss of muscle mass, also known as sarcopenia, and the increasing prevalence of NAFLD unrelated to obesity and metabolic syndrome(7). Defined by The European Work-ing Group on Sarcopenia in Older People, sarcopenia is a syndrome characterized by the progressive, widespread loss of skeletal muscle tissue and strength, increasing the risk of adverse outcomes, such as physical disability, poor quality of life and even death(8).
Sarcopenia and severity of non-alcoholic fatty liver diseaseJosilda Ferreira CRUZ1, Yasmim Anayr Costa FERRARI1, Carla Perez MACHADO2, Nathalia Nascimento SANTANA1, Allan Victor Hora MOTA1 and Sonia Oliveira LIMA1
Received 11/6/2019Accepted 14/8/2019
ABSTRACT – Background – Non-alcoholic fatty liver disease is characterized by deposition of lipids in the hepatic parenchyma exceeding 5% of liver weight in the absence of other conditions, such as viral or alcoholic hepatitis and metabolic disease. Non-alcoholic fatty liver disease is the most common form of chronic liver disease in several countries. In addition to liver complications, recent studies have shown a relation between liver fat and sarcopenia. Objective – Determine the association between sarcopenia and the severity of non-alcoholic hepatic steatosis diagnosed by abdominal ultrasonography. Methods – A clinical, cross-sectional study was conducted with a sample of male and female adults (18 to 70 years of age) submitted to ultrasonography for the investigation of non-alcoholic hepatic steatosis. Evaluations were also performed for the determination of upper and lower limb muscle strength. Data analysis was performed with the aid of the SPSS 22.0 program and involved ANCOVA and the Bonferroni post hoc test, with P-value <0.05 considered indicative of statistical significance. Results – One hundred two patients were submitted to abdominal ultrasonogra-phy, 57.8% of whom presented some degree of non-alcoholic hepatic steatosis. The presence and degree of fatty liver infiltration were significantly associated with the sarcopenic index, determined by the ratio between upper and lower limb strength and BMI (P=0.009 and post-test P=0.028 for upper limbs; P=0.006 and post-test P=0.013 for lower limbs). Conclusion – In the present study, an association was found between the sarcopenic index and non-alcoholic hepatic steatosis, with an inversely proportional relation between this index and the severity of fatty infiltration. This finding offers further evidence of the metabolic interaction of the liver, adipose tissue and muscle.
HEADINGS – Non-alcoholic fatty liver disease. Sarcopenia. Ultrasonography. Muscle strength.
Declared conflict of interest of all authors: noneDisclosure of funding: no funding received1 Universidade Tiradentes, Aracaju, SE, Brasil. 2 Santa Casa de Misericórdia de Belo Horizonte, MG, Brasil.Corresponding author: Sonia Oliveira Lima. E-mail: [email protected]
The term sarcopenic obesity was first defined by Baumgartner in the year 2000 and regards the co-presence of obesity and sar-copenia. The complex interaction of common pathophysiological mechanisms, such as increased proinflammatory cytokines, oxida-tive stress, insulin resistance and hormonal changes, mark the close relation between these two conditions(9). To elucidate the metabolic axis among the liver, adipose tissue and muscle, studies have shown that myostatin, which is a member of the TGF-beta protein super-family, is a muscle growth limiting factor and blocking this protein results in an increase in muscle mass as well as protection against hepatic steatosis and insulin resistance(10).
The myostatin receptor activin IIBR was found in hepatic stellate cells, which synthesize collagen in the presence of chronic inflammation, promoting hepatic fibrosis. This raised questions in the scientific community as to whether fat in the liver promotes the activation of myostatin, resulting in the loss of muscle tissue, or whether sarcopenia, through the action of myostatin, promotes the fibrogenic effect of hepatic stellate cells(7,10).
Therefore, the aim of the present study was to determine the association between sarcopenia and the severity of non-alcoholic hepatic steatosis diagnosed by abdominal ultrasonography.
METHODS
A clinical, cross-sectional study was conducted using data collected from November 2018 to January 2019 at an ultrasound
AG-2019-83dx.doi.org/10.1590/S0004-2803.201900000-66

Cruz JF, Ferrari YAC, Machado CP, Santana NN, Mota AVH, Lima SO. Sarcopenia and severity of non-alcoholic fatty liver disease
358 • Arq Gastroenterol • 2019. v. 56 nº 4 out/dez
service in the city of Aracaju, Brazil, after receiving approval by the local Ethics Committee (certificate number: 2.996.430). The study population was a convenience sample of patients who sought the ultrasound service either spontaneously or by medical indication and signed a statement of informed consent. Abdominal ultrasonography was performed using a good imaging resolution apparatus with a dynamic, convex transducer (with continuous, automatic image formation) operating at 3.75 MHz.
Male and female adults (age range: 18 to 70 years) evaluated by the same physician were included in the study. The exclusion criteria were alcohol consumption ≥140 g/week for men and ≥70 g/week for women, malignant liver tumor, previous liver disease, manifestations of a stroke and physical or cognitive impairment.
The preparation for abdominal ultrasonography was fasting for at least six hours and the use of an anti-gas agent. The hepatic parenchyma was analyzed and hepatic steatosis was classified as follows: Grade 0 – normal echogenicity; Grade 1– mild steatosis, with visualization of fine echoes in the hepatic parenchyma, nor-mal visualization of diaphragm and intrahepatic vessels; Grade 2 – moderate steatosis, with diffuse increase in fine echoes, impaired visualization of intrahepatic vessels and diaphragm; Grade 3 – accentuated steatosis, with considerable increase in fine echoes, impaired visualization or absence of intrahepatic vessels(11).
After the ultrasound procedure, the patients were submit-ted to strength evaluations at the same service by a specialized physiotherapist. The body mass index (BMI) was calculated from weight and height. Knee extensor and elbow flexor strength tests were performed with the dominant limb. A LAFAYETTE manual dynamometer was used to record maximum strength, providing reliable, accurate, stable muscle strength readings. After a trial run to become familiarized with the procedure, three trials of each test were performed with maximum effort with a one-minute interval between readings. The mean of the three readings was recorded in Newtons. The tests were performed with the patient sitting in a chair with adjustable straight back: knee extension strength – meas-urement of force applied to the ankle with the leg not supported and the knee bent at 90º; elbow flexion strength – measurement of force applied to the anterior region of the forearm with the arm extended at 180º.
The sarcopenic index were calculated by the ratio of the forces of the elbow flexors and knee extensors by the BMI.
After correction for sex and age, the data were analyzed using SPSS version 22.0. ANCOVA was used to test the association be-tween the sarcopenic index and non-alcoholic hepatic steatosis. The Bonferroni post-test was used to compare each grade separately and a P-value <0.05 was considered indicative of statistical significance.
RESULTS
One hundred six patients were recruited and four were excluded. Thus, the final sample was composed of 102 patients (mean age: 45.3±13.1 years; range: 21 to 70 years). The female sex accounted for the majority of the sample (n=65; 63.7%). Regarding the degree of fatty infiltration, 43 were classified with Grade 0 (42.1%) and only five were classified with Grade 3 (4.9%) (TABLE 1).
Mean BMI was 28.7±5.1 kg/m2 (range: 17.7 to 40.8 kg/m2). Mean waist circumference was 92.7±14.9 cm (range: 46 to 127 cm). Regarding the biochemical variables, mean blood sugar concentra-tion was 103.1±61.8 mg/dL (range: 61 to 474 mg/dL); mean HDL was 57.5±31.2 mg/dL (range: 25 to 219 mg/dL); mean triglyceride
concentration was 146.0±74.1 mg/dL (range: 34 to 369 mg/dL); mean total cholesterol was 209.3±48.5 (range: 123 to 301); and mean LDL was 127.5±43.8 (range: 50 to 216). Mean elbow flexor strength was 68.6±16.3 (range: 35.3 to 115) and mean knee extensor strength was 98.7±28.9 (range: 34 to 156) (TABLE 2).
TABLE 1. Socio-demographic and clinical data of patients submitted to abdominal ultrasonography and muscle strength evaluations between November 2018 and January 2019 in Aracaju, Brazil.
Variables / categories Mean SD Minimum Maximum
Age 45.3 13.1 21 70
Absolute frequency Percentage
Sex
Male 37 36.2
Female 65 63.7
Grade of steatosis
0 43 42.1
1 25 24.5
2 29 28.4
3 5 4.9
SD: standard deviation.
TABLE 2. Anthropometric and biochemical characteristics of patients submitted to abdominal ultrasonography and muscle strength evaluations between November 2018 and January 2019 in Aracaju, Brazil.
Variable Mean SD Minimum Maximum
Waist circumference (cm) 92.7 14.9 46.0 127.0
BMI 28.7 5.1 17.7 40.8
Blood sugar (mg/dL) 103.1 61.8 61.0 474.0
HDL (mg/dL) 57.5 31.2 25.0 219.0
TG (mg/dL) 146.0 74.1 34.0 369.0
Total cholesterol 209.3 48.5 123.0 301.0
LDL 127.2 43.8 50.0 216.0
Elbow flexor strength 68.6 16.3 35.3 115
Knee extensor strength 98.7 28.9 34 156.2
SD: standard deviation; BMI: body mass index; HDL: high density lipoprotein; TG: high triglyceride; LDL: Low-density lipoprotein.
TABLES 3 and 4 show the sarcopenic index of the upper and lower limbs according to sex and degree of non-alcoholic hepatic steatosis evaluated by abdominal ultrasonography. The association between the sarcopenic index and non-alcoholic fatty liver disease was statistically significant for the upper and lower limbs after cor-recting for sex and age (P=0.009 and P=0.006, respectively), with the statistically significant post-test results (P=0.028 and P=0.013, respectively) (TABLE 5).
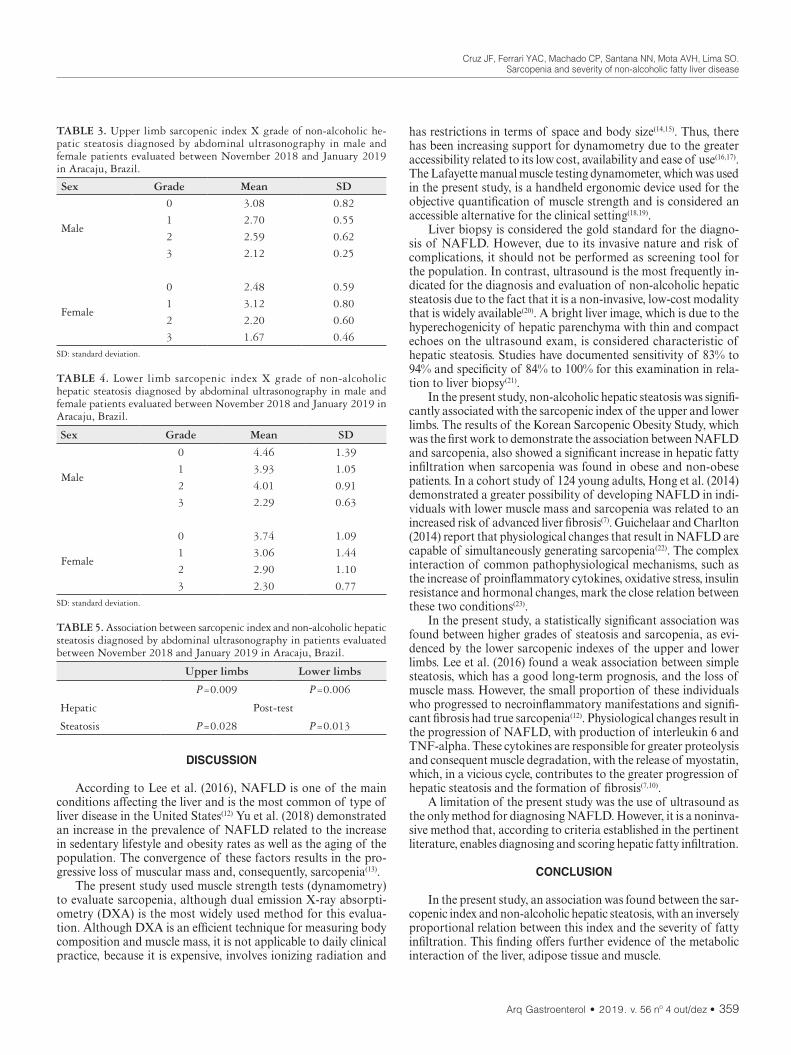
Cruz JF, Ferrari YAC, Machado CP, Santana NN, Mota AVH, Lima SO. Sarcopenia and severity of non-alcoholic fatty liver disease
Arq Gastroenterol • 2019. v. 56 nº 4 out/dez • 359
has restrictions in terms of space and body size(14,15). Thus, there has been increasing support for dynamometry due to the greater accessibility related to its low cost, availability and ease of use(16,17). The Lafayette manual muscle testing dynamometer, which was used in the present study, is a handheld ergonomic device used for the objective quantification of muscle strength and is considered an accessible alternative for the clinical setting(18,19).
Liver biopsy is considered the gold standard for the diagno-sis of NAFLD. However, due to its invasive nature and risk of complications, it should not be performed as screening tool for the population. In contrast, ultrasound is the most frequently in-dicated for the diagnosis and evaluation of non-alcoholic hepatic steatosis due to the fact that it is a non-invasive, low-cost modality that is widely available(20). A bright liver image, which is due to the hyperechogenicity of hepatic parenchyma with thin and compact echoes on the ultrasound exam, is considered characteristic of hepatic steatosis. Studies have documented sensitivity of 83% to 94% and specificity of 84% to 100% for this examination in rela-tion to liver biopsy(21).
In the present study, non-alcoholic hepatic steatosis was signifi-cantly associated with the sarcopenic index of the upper and lower limbs. The results of the Korean Sarcopenic Obesity Study, which was the first work to demonstrate the association between NAFLD and sarcopenia, also showed a significant increase in hepatic fatty infiltration when sarcopenia was found in obese and non-obese patients. In a cohort study of 124 young adults, Hong et al. (2014) demonstrated a greater possibility of developing NAFLD in indi-viduals with lower muscle mass and sarcopenia was related to an increased risk of advanced liver fibrosis(7). Guichelaar and Charlton (2014) report that physiological changes that result in NAFLD are capable of simultaneously generating sarcopenia(22). The complex interaction of common pathophysiological mechanisms, such as the increase of proinflammatory cytokines, oxidative stress, insulin resistance and hormonal changes, mark the close relation between these two conditions(23).
In the present study, a statistically significant association was found between higher grades of steatosis and sarcopenia, as evi-denced by the lower sarcopenic indexes of the upper and lower limbs. Lee et al. (2016) found a weak association between simple steatosis, which has a good long-term prognosis, and the loss of muscle mass. However, the small proportion of these individuals who progressed to necroinflammatory manifestations and signifi-cant fibrosis had true sarcopenia(12). Physiological changes result in the progression of NAFLD, with production of interleukin 6 and TNF-alpha. These cytokines are responsible for greater proteolysis and consequent muscle degradation, with the release of myostatin, which, in a vicious cycle, contributes to the greater progression of hepatic steatosis and the formation of fibrosis(7,10).
A limitation of the present study was the use of ultrasound as the only method for diagnosing NAFLD. However, it is a noninva-sive method that, according to criteria established in the pertinent literature, enables diagnosing and scoring hepatic fatty infiltration.
CONCLUSION
In the present study, an association was found between the sar-copenic index and non-alcoholic hepatic steatosis, with an inversely proportional relation between this index and the severity of fatty infiltration. This finding offers further evidence of the metabolic interaction of the liver, adipose tissue and muscle.
TABLE 3. Upper limb sarcopenic index X grade of non-alcoholic he-patic steatosis diagnosed by abdominal ultrasonography in male and female patients evaluated between November 2018 and January 2019 in Aracaju, Brazil.
Sex Grade Mean SD
Male
0 3.08 0.82
1 2.70 0.55
2 2.59 0.62
3 2.12 0.25
Female
0 2.48 0.59
1 3.12 0.80
2 2.20 0.60
3 1.67 0.46SD: standard deviation.
TABLE 4. Lower limb sarcopenic index X grade of non-alcoholic hepatic steatosis diagnosed by abdominal ultrasonography in male and female patients evaluated between November 2018 and January 2019 in Aracaju, Brazil.
Sex Grade Mean SD
Male
0 4.46 1.39
1 3.93 1.05
2 4.01 0.91
3 2.29 0.63
Female
0 3.74 1.09
1 3.06 1.44
2 2.90 1.10
3 2.30 0.77SD: standard deviation.
TABLE 5. Association between sarcopenic index and non-alcoholic hepatic steatosis diagnosed by abdominal ultrasonography in patients evaluated between November 2018 and January 2019 in Aracaju, Brazil.
Upper limbs Lower limbs
P=0.009 P=0.006
Hepatic Post-test
Steatosis P=0.028 P=0.013
DISCUSSION
According to Lee et al. (2016), NAFLD is one of the main conditions affecting the liver and is the most common of type of liver disease in the United States(12) Yu et al. (2018) demonstrated an increase in the prevalence of NAFLD related to the increase in sedentary lifestyle and obesity rates as well as the aging of the population. The convergence of these factors results in the pro-gressive loss of muscular mass and, consequently, sarcopenia(13).
The present study used muscle strength tests (dynamometry) to evaluate sarcopenia, although dual emission X-ray absorpti-ometry (DXA) is the most widely used method for this evalua-tion. Although DXA is an efficient technique for measuring body composition and muscle mass, it is not applicable to daily clinical practice, because it is expensive, involves ionizing radiation and
Cruz JF, Ferrari YAC, Machado CP, Santana NN, Mota AVH, Lima SO. Sarcopenia and severity of non-alcoholic fatty liver disease
360 • Arq Gastroenterol • 2019. v. 56 nº 4 out/dez
Authors’ contributionCruz JF: study conception and design, data acquisition, analy-
sis and interpretation of data, statistical analysis and writing of manuscript. Ferrari YAC, Machado CP, Santana NN, Mota AVH: data collection, analysis and interpretation of the data and writing of manuscript. Lima SO: conception and design of the research, analysis and interpretation of the data, writing of text and critical revision of manuscript.
OrcidJosilda Ferreira Cruz. Orcid: 0000-0001-5161-9717.Yasmim Anayr Costa Ferrari. Orcid: 0000-0003-1766-341X.Carla Perez Machado. Orcid: 0000-0002-7038-157X.Nathalia Nascimento Santana. Orcid: 0000-0002-7272-9787.Allan Victor Hora Mota. Orcid: orcid.org/0000-0001-6612-4653.Sonia Oliveira Lima. Orcid: 0000-0002-3257-2412.
REFERENCES
1. Arslan N. Obesity, fatty liver disease and intestinal microbiota. World J Gastro-enterol. 2014;20:16452-63.
2. Cleveland E, Bandy A, Vanwagner LB. Diagnostic Challenges of Nonalcoholic Fatty Liver Disease/Nonalcoholic Steatohepatitis. Clin Liver Dis (Hoboken). 2018;11:98-104.
3. Cotrim HP, Parise ER, Figueiredo-Mendes C, Galizzi-Filho J, Porta G, Oliveira CP. Nonalcoholic fatty liver disease Brazilian Society of Hepatology Consensus. Arq Gastroenterol. 2016;53:118-22.
4. Fan JG, Kim SU, Wong VW. New Trends on Obesity and NAFLD in Asia. J Hepatol. 2017;67:862-73.
5. Williams CD, Stengel J, Asike MI, Torres DM, Shaw J, Contreras M. Prevalence of nonalcoholic fatty liver disease and nonalcoholic steatohepatitis among a largely middle-aged population utilizing ultrasound and liver biopsy: a prospective study. Gastroenterology. 2011;140:124-31.
6. Pang Q, Zhang J, Song S, Qu K, Xu X, Liu S, et al. Central obesity and non-alcoholic fatty liver disease risk after adjusting for body mass index. World J Gastroenterol. 2015;21:1650-62.
7. Hong HC, Hwang SY, Choi HY, Yoo HJ, Seo JA, Kim SG, et al. Relationship between sarcopenia and nonalcoholic fatty liver disease: the Korean Sarcopenic Obesity Study. Hepatology. 2014;59:1772-8.
8. Zhai Y, Xiao Q. The Common Mechanisms of Sarcopenia and NAFLD. Biomed Res Int. 2017;2017:6297651.
9. Baumgartner RN. Body Composition in Healthy aging. Ann N Y Acad Sci. 2000;904:437-48.
10. Harris-Love MO, Monfaredi R, Ismail C, Blackman MR, Cleary K. Quantita-tive Ultrasound: Measurement Considerations for the Assessment of Muscular Dystrophy and Sarcopenia. Front Aging Neurosci. 2014;14:172.
11. Saadeh S, Younossi ZM, Remer EM. The utility of radiological imaging in nonalcoholic fatty liver disease. Gastroenterology. 2002;123:745-50.
12. Lee Y, Kim SU, Song K, Park JY, Kim DY, Ahn SH, et al. Sarcopenia is associated with significant liver fibrosis independently of obesity and insulin resistance in nonalcoholic fatty liver disease: nationwide surveys (KNHANES 2008-2011). Hepatology. 2016;63:776-86.
Cruz JF, Ferrari YAC, Machado CP, Santana NN, Mota AVH, Lima SO. Sarcopenia e gravidade da doença hepática gordurosa não-alcoólica. Arq Gastroenterol. 2019;56(4):357-60.RESUMO – Contexto – A doença hepática gordura não-alcoólica caracteriza-se pela deposição de lipídios no parênquima hepático, excedendo 5% do
peso do fígado na ausência de outras afecções como hepatites virais, alcoólicas ou doenças metabólicas. A doença hepática gordura não-alcoólica tem sido observada como a forma mais comum de doença hepática crônica em diversos países. Além das complicações hepáticas, estudos recentes têm demonstrado a relação entre a presença de gordura hepática e a sarcopenia. Objetivo – Determinar a associação entre a sarcopenia e a gravidade da esteatose hepática não-alcoólica diagnosticada pela ultrassonografia abdominal. Métodos – Estudo clínico e transversal com amostra de pacientes de ambos os sexos, de 18 a 70 anos de idade, diagnosticados como portadores ou não de esteatose hepática não-alcoólica pela ultrassonografia e submetidos à avaliação da força muscular dos membros superiores e inferiores. Os dados foram inseridos no programa estatístico SPSS 22.0, analisados através do teste ANCOVA e pós-teste de Bonferroni, sendo considerado significante P<0,05. Resultados – Foram avaliados pela ultrassonografia abdominal 102 pacientes e destes, 57,8% apresentaram algum grau de esteatose hepática não-alcoólica. A presença e os graus da infiltração gordurosa no fígado tiveram associação estatisticamente significativa com o índice sarcopênico, determinado pela razão entre força muscular dos membros superiores e inferiores e o IMC (P=0,009 e pós-teste P=0,028 MMSS; P=0,006 e pós-teste P=0,013 MMII). Conclusão – Observou-se associação entre o índice sarcopênico e a presença de esteatose hepática não-alcoólica, com relação inversamente proporcional entre esse índice e a gravidade da infiltração gordurosa, reforçando a interação do eixo metabólico entre fígado, tecido adiposo e músculo.
DESCRITORES – Hepatopatia gordurosa não-alcoólica. Sarcopenia. Ultrassonografia. Força muscular.
13. Yu R, Shi Q, Liu L, Chen L. Relationship of sarcopenia with steatohepatitis and advanced liver fibrosis in non-alcoholic fatty liver disease: a meta-analysis. China: BMC Gastroenterology. 2018;18:51.
14. Ismail C, Zabal J, Hernandez HJ, Woletz P, Manning H, Texeira C, et al. Di-agnostic ultrasound estimates of muscle mass and muscle quality discriminate between women with and without sarcopenia. Front Physiol. 2015;6:302.
15. Ticinesi A, Meschi T, Narici MV, Lauretani F, Maggio M. Muscle Ultrasound and Sarcopenia in Older Individuals: A Clinical Perspective. J Am Med Dir Assoc. 2017;18:290-300.
16. Bredella MA, Ghomi RH, Thomas BJ, Torriani M, Brick DJ, Gerweck AV, et al. Comparison of DXA and CT in the assessment of body composition in pre-menopausal women with obesity and anorexia nervosa. Obesity. 2010;18:2227-33.
17. Giusto M, Lattanzi B, Albanese C, Galtieri A, Farcomeni A, Giannelli V, et al. Sarcopenia in liver cirrhosis: the role of computed tomography scan for the assessment of muscle mass compared with dual-energy X-ray absorptiometry and anthropometry. Eur J Gastroenterol Hepatol. 2015;27:328-34.
18. Stark T, Walker B, Phillips JK, Fejer R, Beck R. Hand-held dynamometry Cor-relation with the Gold Standard Isokinetic Dynamometry: A Systematic Review. PM R. 2010;3:472-9.
19. Vermeulen J, Neyens JCL, Spreeuwenberg MD, Van Rossum E, Hewson DJ, De Witte LP. Measuring grip strength in older adults: comparing the grip-ball with the Jamar dynamometer. J Geriatr Phys Ther. 2015;38:148-53.
20. Tarzamni MK, Khoshbaten M, Sadrarhami S, Daneshpajouhnejad P, Jalili J, Gholamian M, et al. Hepatic Artery and Portal Vein Doppler Indexes in Non-al-coholic Fatty Liver Disease Before and After Treatment to Prevent Unnecessary Health Care Costs. International Journal of Preventive Medicine. 2014;5:472-7.
21. Almeida AA, Cotrim HP, Barbosa DBV, Athayde LGM, Santos AS, Bitencourt AGV, et al. Fatty liver disease in severe obese patients: Diagnostic value of ab-dominal ultrasound. World J Gastroenterol. 2008;14:1415-8.
22. Guichelaar MMJ, Charlton MR. Decreased muscle mass in nonalcoholic fatty liver disease: new evidence of a link between growth hormone and fatty liver disease? Hepatology. 2014;59:1668-70.
23. Choi KM. Sarcopenia and Sarcopenic Obesity. Am J Physiol Endocrinol Metab. 2013;28:86-9.

AHEAD OF PRINTORIGINAL ARTICLE
Arq Gastroenterol • 2019. v. 56 nº 4 out/dez • 361
INTRODUCTION
Chronic Helicobacter pylori infection is causally related to benign and serious malignant upper gastrointestinal diseases, including peptic ulcer, gastric mucosa-associated lymphoid tissue lymphoma, and gastric cancer. Conversely, eradication of H. pylori is associated with ulcer healing, regression of mucosa-associated lymphoid tissue lymphoma, and decreased cancer risk(1). Chile has one of the highest rates of H. pylori infection in the world(2,3) and different studies have shown a prevalence of infection ranging from 60% to 79%, according to socio-economic, educational and health conditions of the population studied(4). In addition, Merino et al.(5) suggested that in Chile exists an increased risk of infection by H. pylori during the first year of life (up to 23.9 %). Moreover, gastric adenocarcinoma and the high prevalence of H. pylori at younger ages are a major cause of cancer-related mortality(2).
Antibiotic resistance surveillance of Helicobacter pylori at the Biobío region (Chile) in a decade
Cristian PARRA-SEPÚLVEDA1, José S MERINO2, Katia SÁEZ-CARRILLO3, Carlos GONZÁLEZ1 and Apolinaria GARCÍA-CANCINO1
Received 12/6/2019Accepted 19/9/2019
ABSTRACT – Background – Helicobacter pylori infection in Chile remains as a public and private health-care system’s challenge, with a prevalence of the infection over 70%. Nowadays, antibiotic treatment of the infection is mandatory to prevent the arising of severe associated diseases but failures in the eradication therapy mainly due to clarithromycin resistance has been observed worldwide and first line eradication therapy seems to be not effective anymore in several geographical areas. Thus, health-care systems are committed to maintain an epidemiological surveillance upon the evolution of the antibiotic resistance of this priority 2 pathogen. Objective – This work reports a 10 years surveillance of the primary antibiotic resistance of H. pylori clinical isolates at the Biobío region-Chile, and the evolution of resistance toward amoxicillin, clarithromycin, levofloxacin, metronidazole, and tetracycline among the species. Methods – H. pylori strains were investigated during the periods 2005-2007 (1435 patients analysed) and 2015-2017 (220 patients analysed) by inoculating a saline homogenate biopsy onto the surface of Columbia agar (Oxoid, Basingstoke, UK) – supplemented with 7% horse red blood cells plus DENT inhibitor (Oxoid, Basingstoke, UK) – following by incubation at 37ºC under 10% CO2 atmosphere for five days. Antibiotic resistance pattern of the isolates was assessed using the disk diffusion test in Müeller-Hinton agar supplemented with 7% horse red blood cells followed by incubation for further three days under 10% CO2 atmosphere. Statistical analysis was done using the SPSS v22 software and P values <0.05 were considered statistically significant. Results – A total of 41% of 1435 patients were detected to be infected with H. pylori by bacteriological culture in 2005-2007 period, meanwhile 32.7% from 220 patients were also infected in 2015-2017 period. The clinical isolates of H. pylori are mostly susceptible to amoxicillin and tetracycline (both over 98% of strains), but less susceptible to levofloxacin in both periods analysed (over 79% of the strains). On the other hand, metronidazole continuous showing the highest score of resistant isolates (over 40% of resistant strains), although an 18% fewer resistant strains were observed in 2015-2017 period. Clarithromycin, the key antibiotic in eradication therapies, has an increased frequency of resistant strain isolated in the decade (22.5% in 2005-2007 and 29.2% in 2015-2017). Multidrug resistant strains (two, three and four antibiotics) were also detected in both periods with the highest scores for simultaneous resistance to clarithromycin-metronidazole (18%) and clarithromycin-metroni-dazole-levofloxacin (12.5%) resistant strains. According to gender, the isolates resistant to amoxicillin, clarithromycin and metronidazole were more frequent in female, with a specific increment in amoxicillin and clarithromycin resistance. Conclusion – The frequency of clarithromycin resistance (29.2%) detected in 2015-2017 suggests that conventional triple therapy is no longer effective in this region.
HEADINGS – Helicobacter pylori, drug effects. Helicobacter infections. Anti-bacterial agents. Bacterial drug resistance. Clarithromycin. Men. Women. Chile.
Declared conflict of interest of all authors: noneDisclosure of funding: This work received financial support from Grant Fondef D03i1105 and Grants from the Universidad de Concepción-Chile.1 Universidad de Concepción, Facultad de Ciencias Biológicas, Departamento de Microbiología, Concepción, Chile. 2 Universidad de las Américas, Facultad de Medicina Veterinaria y Agronomía, Concepción, Chile. 3 Universidad de Concepción, Facultad de Ciencias Físicas y Matemáticas, Departamento de Estadística, Concepción, Chile.Corresponding author: Apolinaria García-Cancino. E-mail: [email protected]
Successful treatment for H. pylori infection requires multidrug regimens, which are frequently based on clarithromycin as the central component, and the first-line therapy for eradicating this pathogen includes a widespread regime, which involves the ad-ministration of a combination of a proton pump inhibitor (PPI) plus clarithromycin and metronidazole or amoxicillin(6). However, eradication rates vary with the level of antibiotic resistance preva-lence in a particular geographical area and the use of clarithro-mycin without previous susceptibility testing is not recommended in populations with more than 15%–20% prevalence of resistant isolates(1). In addition, the Maastricht V Consensus recommended that susceptibility tests should be performed too in these areas at least after a treatment failure(7,8).
Special attention is conceited by clarithromycin-resistant iso-lates of H. pylori – recognized by the World Health Organisation as a high priority species (priority 2) in clinical issues – for which
AG-2019-84dx.doi.org/10.1590/S0004-2803.201900000-72
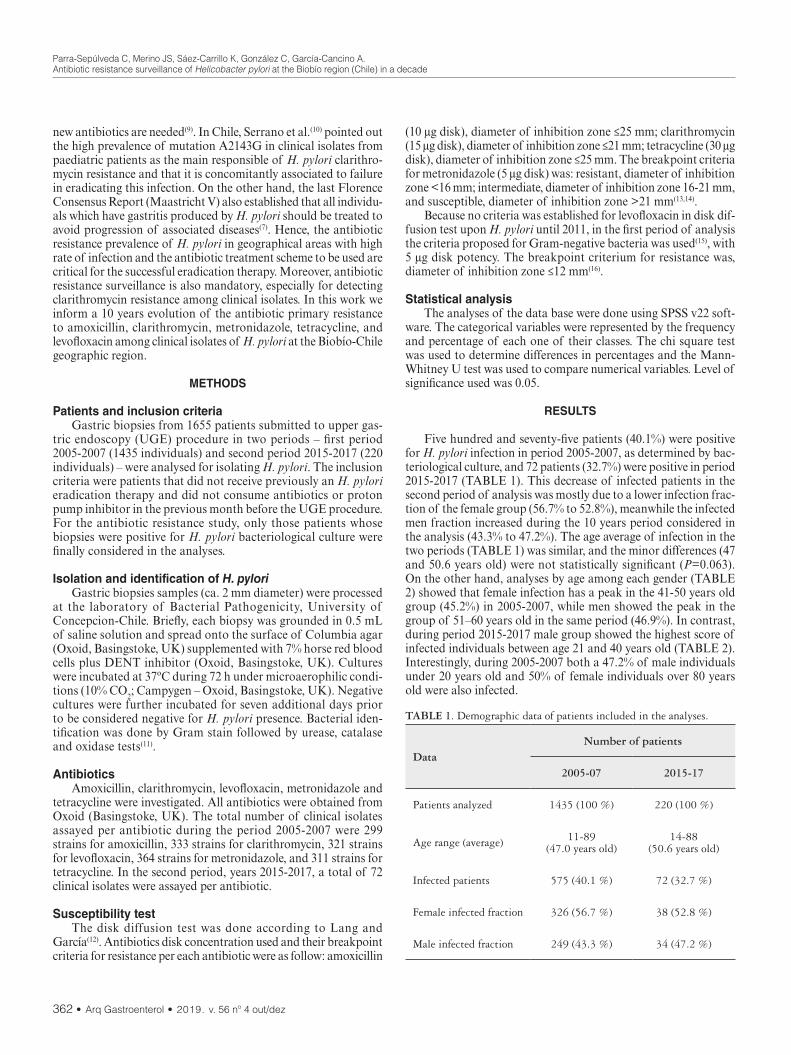
Parra-Sepúlveda C, Merino JS, Sáez-Carrillo K, González C, García-Cancino A.Antibiotic resistance surveillance of Helicobacter pylori at the Biobío region (Chile) in a decade
362 • Arq Gastroenterol • 2019. v. 56 nº 4 out/dez
new antibiotics are needed(9). In Chile, Serrano et al.(10) pointed out the high prevalence of mutation A2143G in clinical isolates from paediatric patients as the main responsible of H. pylori clarithro-mycin resistance and that it is concomitantly associated to failure in eradicating this infection. On the other hand, the last Florence Consensus Report (Maastricht V) also established that all individu-als which have gastritis produced by H. pylori should be treated to avoid progression of associated diseases(7). Hence, the antibiotic resistance prevalence of H. pylori in geographical areas with high rate of infection and the antibiotic treatment scheme to be used are critical for the successful eradication therapy. Moreover, antibiotic resistance surveillance is also mandatory, especially for detecting clarithromycin resistance among clinical isolates. In this work we inform a 10 years evolution of the antibiotic primary resistance to amoxicillin, clarithromycin, metronidazole, tetracycline, and levofloxacin among clinical isolates of H. pylori at the Biobío-Chile geographic region.
METHODS
Patients and inclusion criteriaGastric biopsies from 1655 patients submitted to upper gas-
tric endoscopy (UGE) procedure in two periods – first period 2005-2007 (1435 individuals) and second period 2015-2017 (220 individuals) – were analysed for isolating H. pylori. The inclusion criteria were patients that did not receive previously an H. pylori eradication therapy and did not consume antibiotics or proton pump inhibitor in the previous month before the UGE procedure. For the antibiotic resistance study, only those patients whose biopsies were positive for H. pylori bacteriological culture were finally considered in the analyses.
Isolation and identification of H. pyloriGastric biopsies samples (ca. 2 mm diameter) were processed
at the laboratory of Bacterial Pathogenicity, University of Concepcion-Chile. Briefly, each biopsy was grounded in 0.5 mL of saline solution and spread onto the surface of Columbia agar (Oxoid, Basingstoke, UK) supplemented with 7% horse red blood cells plus DENT inhibitor (Oxoid, Basingstoke, UK). Cultures were incubated at 37ºC during 72 h under microaerophilic condi-tions (10% CO
2; Campygen – Oxoid, Basingstoke, UK). Negative cultures were further incubated for seven additional days prior to be considered negative for H. pylori presence. Bacterial iden-tification was done by Gram stain followed by urease, catalase and oxidase tests(11).
AntibioticsAmoxicillin, clarithromycin, levofloxacin, metronidazole and
tetracycline were investigated. All antibiotics were obtained from Oxoid (Basingstoke, UK). The total number of clinical isolates assayed per antibiotic during the period 2005-2007 were 299 strains for amoxicillin, 333 strains for clarithromycin, 321 strains for levofloxacin, 364 strains for metronidazole, and 311 strains for tetracycline. In the second period, years 2015-2017, a total of 72 clinical isolates were assayed per antibiotic.
Susceptibility testThe disk diffusion test was done according to Lang and
García(12). Antibiotics disk concentration used and their breakpoint criteria for resistance per each antibiotic were as follow: amoxicillin
(10 µg disk), diameter of inhibition zone ≤25 mm; clarithromycin (15 µg disk), diameter of inhibition zone ≤21 mm; tetracycline (30 µg disk), diameter of inhibition zone ≤25 mm. The breakpoint criteria for metronidazole (5 µg disk) was: resistant, diameter of inhibition zone <16 mm; intermediate, diameter of inhibition zone 16-21 mm, and susceptible, diameter of inhibition zone >21 mm(13,14).
Because no criteria was established for levofloxacin in disk dif-fusion test upon H. pylori until 2011, in the first period of analysis the criteria proposed for Gram-negative bacteria was used(15), with 5 µg disk potency. The breakpoint criterium for resistance was, diameter of inhibition zone ≤12 mm(16).
Statistical analysisThe analyses of the data base were done using SPSS v22 soft-
ware. The categorical variables were represented by the frequency and percentage of each one of their classes. The chi square test was used to determine differences in percentages and the Mann-Whitney U test was used to compare numerical variables. Level of significance used was 0.05.
RESULTS
Five hundred and seventy-five patients (40.1%) were positive for H. pylori infection in period 2005-2007, as determined by bac-teriological culture, and 72 patients (32.7%) were positive in period 2015-2017 (TABLE 1). This decrease of infected patients in the second period of analysis was mostly due to a lower infection frac-tion of the female group (56.7% to 52.8%), meanwhile the infected men fraction increased during the 10 years period considered in the analysis (43.3% to 47.2%). The age average of infection in the two periods (TABLE 1) was similar, and the minor differences (47 and 50.6 years old) were not statistically significant (P=0.063). On the other hand, analyses by age among each gender (TABLE 2) showed that female infection has a peak in the 41-50 years old group (45.2%) in 2005-2007, while men showed the peak in the group of 51–60 years old in the same period (46.9%). In contrast, during period 2015-2017 male group showed the highest score of infected individuals between age 21 and 40 years old (TABLE 2). Interestingly, during 2005-2007 both a 47.2% of male individuals under 20 years old and 50% of female individuals over 80 years old were also infected.
TABLE 1. Demographic data of patients included in the analyses.
DataNumber of patients
2005-07 2015-17
Patients analyzed 1435 (100 %) 220 (100 %)
Age range (average) 11-89 (47.0 years old)
14-88 (50.6 years old)
Infected patients 575 (40.1 %) 72 (32.7 %)
Female infected fraction 326 (56.7 %) 38 (52.8 %)
Male infected fraction 249 (43.3 %) 34 (47.2 %)

Parra-Sepúlveda C, Merino JS, Sáez-Carrillo K, González C, García-Cancino A.Antibiotic resistance surveillance of Helicobacter pylori at the Biobío region (Chile) in a decade
Arq Gastroenterol • 2019. v. 56 nº 4 out/dez • 363
Amoxicillin resistant strains isolated in both periods were of low frequency (2% and 4.2%, respectively) (TABLE 3). A similar behaviour with tetracycline resistance was observed, because only 1% and 1.4% of the strains showed to be resistant, respectively. On the other hand, a mild increase (6.7%) in the frequency of clarithro-mycin resistant strains was observed, with frequencies of 22.5% and 29.2% per period, respectively. Regarding levofloxacin, an increase (5.5%) of resistant strains isolated was detected, with a frequency of 15.3 and 20.8% per period. Unexpectedly, a significant decrease (18%, P=0.005) in the frequency for metronidazole resistant strains isolated (55.5% to 37.5%) was observed too.
The frequency of isolation of H. pylori resistant strains among genders also varied in both periods. Thus, among female an increase of 1.8% of amoxicillin resistant strains and 5.3% of clarithromycin resistant strains were observed meanwhile a decrease of 6.6% in the frequency of metronidazole resistant strains isolated was detected too. Levofloxacin resistant strains also showed a mild decrease in female (0.9%). On the other hand, among male both amoxicillin and clarithromycin resistant strains did not vary significantly their frequency of isolation during the two periods analysed. However, a significant increase of 6.4% of levofloxacin resistant strains isolated (P=0.020) and a significant decrease (P=0.019) of metronidazole resistant strains (11.4%) were observed among male group in 2015-2017 period. Tetracycline resistant strains did not vary their frequency of isolation in the two periods studied, independently of the gender (TABLE 5).
TABLE 2. Percentage of individuals infected with Helicobacter pylori per age group according to gender.
Age groupPercentage of infected individuals among gender
Female + Male Female Male
Years old 2005-07 2015-17 2005-07 2015-17 2005-07 2015-17
11–20 40.7 (35/86) 0 (0/4) 36.0 (18/50) 0 (0/3) 47.2 (17/36) 0 (0/1)
21–30 36.4 (55/151) 40.0 (8/20) 32.5 (26/80) 25.0 (3/12) 40.8 (29/71) 62.5 (5/8)
31–40 39.7 (72/181) 44.1 (15/34) 37.9 (33/87) 26.7 (4/15) 41.5 (39/94) 57.9 (11/19)
41–50 43.3 (191/441) 28.6 (10/35) 45.2 (112/248) 25.0 (6/24) 40.9 (79/193) 36.4 (4/11)
51–60 42.4 (125/295) 40.8 (29/71) 39.6 (72/182) 39.6 (19/48) 46.9 (53/113) 43.5 (10/23)
61–70 35.2 (57/162) 19.0 (8/42) 40.0 (38/95) 15.4 (4/26) 28.4 (19/67) 25.0 (4/16)
71–80 30.7 (26/85) 7.7 (1/13) 35.5 (16/45) 12.5 (1/8) 25.0 (10/40) 0 (0/5)
81–90 41.2 (14/34) 100 (1/1) 50.0 (11/22) 100 (1/1) 25.0 (3/12) 0 (0)
Total 40.1 (575/1435) 32.7 (72/220) 40.3 (326/809) 27.7 (38/137) 39.7 (249/626) 40.9 (34/83)
TABLE 3. Susceptible and resistant strains to antibiotics used in the eradication therapy of Helicobacter pylori.
Antibiotic
Percentage of strains (number)
Susceptible Resistant
2005-07 2015-17 2005-7 2015-17
Amoxicillin 98.0 (293) 95.8 (69) 2 (6) 4.2 (3)
Clarithromycin 77.5 (258) 70.8 (51) 22.5 (75) 29.2 (21)
Levofloxacin 84.7 (272) 79.1 (57) 15.3 (49) 20.8 (15)
Metronidazole 44.5 (162) 62.5 (45) 55.5 (202) 37.5 (27)
Tetracycline 99.0 (377) 98.6 (71) 1.0 (4) 1.4 (1)
Simultaneous resistance to two antibiotics was observed among clinical isolates during the 2005-2007 period (TABLE 4), with increased prevalence of clarithromycin-metronidazole resistance (5.8%), levofloxacin-metronidazole (5.5%) and clarithromycin-levofloxacin (9.2%) for the 2015-2017 period. Moreover, in this period three and four antibiotic resistant strains were also iso-lated, with the highest frequency of isolation for the phenotype clarithromycin-levofloxacin-metronidazole resistance (2.2%). Also, resistance frequency of 18% for clarithromycin-metronidazole and 12.5% for both levofloxacin-metronidazole resistance and clarithromycin-levofloxacin were detected too. In addition, isolates resistant to three and four antibiotics were also detected, with the highest score for clarithromycin-levofloxacin-metronidazole isolates (12.5%).
TABLE 4. Isolation frequency of multi-resistant Helicobacter pylori strains in the decade.
Phenotype of resistance
Percentage of strains in periods Increase in
isolation frequency2005-07
[n=271]2015-17 [n=72]
AMX-CLR 0.7 (2) 2.8 (2) 2.1
AMX-LEV 1.5 (4) 4.2 (3) 2.7
AMX-MTZ 2.2 (6) 4.2 (3) 2.0
CLA-LEV 3.3 (9) 12.5 (9) 9.2
CLA-MTZ 12.2 (33) 18 (13) 5.8
LEV-MTZ 7 (19) 12.5 (9) 5.5
AMX-CLA-LEV 0.4 (1) 2.8 (2) 2.4
AMX-CLA-MTZ 1.1 (3) 2.8 (2) 1.7
CLA-LEV-MTZ 2.2 (6) 12.5 (9) 10.3
AMX-CLA-LEV-MTZ 0.4 (1) 2.8 (2) 2.4

Parra-Sepúlveda C, Merino JS, Sáez-Carrillo K, González C, García-Cancino A.Antibiotic resistance surveillance of Helicobacter pylori at the Biobío region (Chile) in a decade
364 • Arq Gastroenterol • 2019. v. 56 nº 4 out/dez
DISCUSSION
The results show that clinical isolates of H. pylori remain susceptible to amoxicillin, with mild increase in the frequency of isolation of amoxicillin resistant H. pylori strains from 0% among 91 clinical isolates observed during 1999-2000(17) to 2% in 2005-2007 (this work, n=299), 3.3% in 2008-2009 (27, n=30), and 5.6% in pe-riod 2015-2017 (this work, n=72). This continuous increase in the frequency of amoxicillin resistance strains among clinical H. pylori could be the consequence of the wide use of this antibiotic among the Chilean population. On the other hand, since we informed the first two strains of clarithromycin resistant phenotype isolated among 91 clinical isolates (2.2%) at the Biobío-Chile region in the period 1999-2000, an increase of this resistance in clinical isolates was observed with values of 22.5% and 29.2% for the periods 2005-2007 and 2015-2017, respectively. The results were not a surprise, as suggested by Vásquez et al.(18) and Ott et al.(19), because when a resistance to macrolide appears for any specific pathogen in a par-ticular geographic area, this resistance is rapidly spread and cross resistance to all macrolides is observed too. In addition, Alba et al.(8) pointed out that patients with a history of macrolide consumption are more likely to be carriers of clarithromycin resistant strains. In addition, increasing of clarithromycin resistance could be expected due to its use in the treatment of extra-digestive infections(19). Recently, Gonzalez-Hormazabal et al.(20) estimated a 31.8% preva-lence of clarithromycin resistance in H. pylori at Santiago-Chile by real-time PCR directly from gastric mucosa. These results are higher than the results presented in this work, but it is known that bacteriological cultures underestimate the prevalence of H. pylori as compared to other methods, especially as compared to PCR detection for clarithromycin. Also, Serrano et al.(10) found infected paediatric patients at Santiago-Chile, with high prevalence of the A2143G mutation, responsible for clarithromycin resistance which is indicative of an increased prevalence of this resistance among H. pylori early in childhood. Regarding metronidazole resistance, a frequency of 41.8% was observed among 91 clinical strains in 1999-2000(17), which increased to 55.5% in the 2005-2007, but this frequency decreased to 37.5% during in period 2015-2017. This lower frequency of metronidazole resistant has been observed by others, too(21). The result obtained in 2015-2017 is similar to the frequency of metronidazole resistant strains informed previously by using agar dilution assay(22). Thus, the differences in percentage of resistant strains isolated observed with metronidazole could be consequence of the method used in the assay(23). Although disk diffusion test is not the gold standard method for determining H. pylori we used it, since minor variations in detecting primary resistance to clarithromycin has been observed(1,23,24). In addition, the recommended agar dilution test – included it modified version(25) – or the more flexible E-test(26) assays are both time consuming
or more expensive than the disk diffusion method to be used for routinely large-scale patient cohorts’ analyses, especially in low resources laboratories(27).
With respect to levofloxacin resistance, an increase of 5.5% in the frequency of isolation in period 2015-2017 was detected. However, the resistance frequency (20.8%) is similar to that in-formed in a previous work in Argentina(23). Thus, this antibiotic could be used in triple therapies among adult Chilean patients in areas of increased eradication failures with more conventional therapies as suggested by Fallone et al.(28), in spite of the adverse effect known to be present in long-term treatment(29). Moreover, this substitution in the triple therapy should also be considered in geographical areas where the resistance to clarithromycin is over 20% of the clinical isolates and MET resistance frequency among clinical isolates is higher too. In those cases the recommended rescue quadruple therapy(7) will also fail.
Our results showed the arise of simultaneous antibiotic re-sistant strains among clinical isolates of H. pylori, with increas-ing prevalence of resistance to clarithromycin-levofloxacin and clarithromycin-levofloxacin-metronidazole. A similar study done in Valdivia (Chile) by Ott et al.(19) reported only five strains of H. pylori with resistance to clarithromycin-metronidazole and only one strain showing simultaneous resistance to three antibiotics (amoxicillin-clarithromycin-metronidazole). On the other hand, Pereira et al.(23) informed two clinical isolates with resistance to metronidazole-clarithromycin and three to metronidazole-clarithromycin-ciprofloxacin simultaneously. The increased frequency in the isolation of multiple resistant strains including amoxicillin-clarithromycin-metronidazole resistance could be the result of the frequent use of these antibiotics in the therapy of gastric H. pylori infection in Chile(19).
When gender was considered in the analyses, we found the exist-ence of a relationship between the increment in the frequency of isolation of amoxicillin, clarithromycin and levofloxacin resistant H. pylori and female condition in 2015-2017, concomitant with a decrease of metronidazole resistant strains. On the other hand, male showed only a decrease of the metronidazole resistant isolates. Lang and García(12) found that differences in the clinical prevalence of antibiotic resistant strains between gender at Costa Rica were not significant. Although, the authors suggested, that the difference in the level of frequency of metronidazole resistant strains isolated could be a consequence of the use of this antibiotic in gynaecologi-cal treatments. Also, the massive use of this antimicrobial agent for the treatment of other infections, such as gynaecologic, dental, gastrointestinal, giardiasis, and amoebiasis could be responsible for the development of metronidazole resistant strains among H. pylori isolated from females(19). Besides, Lang and García(12) also mentioned the existence of regional differences in the frequency of metronidazole resistance among female in Latin-America. In
TABLE 5. Antibiotic resistant Helicobacter pylori strains isolated during a decade among female and male patients.
Percentage of resistant strains to
Amoxicillin Clarithromycin Levofloxacin Metronidazole Tetracycline
2005-07 (n=299)
2015-17 (n=72)
2005-07 (n=333)
2015-17 (n=72)
2005-07 (n=321)
2015-17 (n= 72)
2005-07 (n=364)
2015-17 (n= 72)
2005-07 (n=381)
2015-17 (n= 72)
Female 1.0 [3] 2.8 [2] 11.4 [38] 16.7 [12] 10.6 [34] 9.7 [7] 30.2 [110] 23.6 [17] 0.5 [2] 1.4 [1]
Male 1.0 [3] 1.4 [1] 11.1 [37] 12.5 [9] 4.7 [15] 11.1 [8] 25.3 [92] 13.9 [10] 0.5 [2] 0 [0]
Total 2.0 [6] 4.2 [3] 22.5 [75] 29.2 [21] 15.3[49] 20.8 [15] 55.5 [202] 37.5 [27] 1.0 [4] 1.4 [1]
Parra-Sepúlveda C, Merino JS, Sáez-Carrillo K, González C, García-Cancino A.Antibiotic resistance surveillance of Helicobacter pylori at the Biobío region (Chile) in a decade
Arq Gastroenterol • 2019. v. 56 nº 4 out/dez • 365
addition, the worldwide use of antibiotics increased 15% in the last 15 years, being quinolones and macrolides the most consumed(30), exerting pressure on H. pylori favouring the emergence of resist-ant strains. This can, in part, explain the increase of amoxicillin, clarithromycin and metronidazole resistant strains in women because they are consuming more antibiotics(31,32), therefore the likelihood of selecting resistant strains.
The results obtained in this work showed that the epidemio-logical patterns of the infection caused by H. pylori have changed within the last 10 years. Presently, the infection in men has increased when compared to the previous monitoring and that the associated diagnoses are mainly gastritis and intestinal metaplasia. Despite males continue to be the mostly affected gender; women are the group showing higher rates of resistance to antibiotics, which could be partly explained by the larger intake of them. On the other hand, to continue the regional eradication strategy, the search for alternatives to the use of clarithromycin and metronidazole is recommended because, even though the resistance to the latter is decreasing, it continues to be worryingly high. Finally, it is clear that the triple therapy in Chile, as in many other countries of the world, has become obsolete and it is being not advised in all recent revisions of the consensus, as indicated by Molina-Infante et al.(33).
CONCLUSION
The frequency of clarithromycin resistant strains in clinical practice detected in 2015-2017 (29.2%) suggests that conventional triple therapy is no longer effective in the Biobío-Chile region.
In addition, keeping in mind the increased resistance observed among the clinical isolates toward antibiotics most commonly used in eradication therapies in the decade, including simultane-ous resistance to three and four antibiotics, we call the attention to maintain an epidemiological surveillance upon the evolution of the resistance of this highly prevent pathogen. The searching for new therapeutic alternatives and prophylactic strategies – i.e. probiotic foods, new active molecules against H. pylori from natural origin or the expected vaccine – are mandatory, too.
The use of levofloxacin in the triple therapy should also be considered in geographical areas, like Chile, where the resistance to clarithromycin and metronidazole is high, with increased failure of conventional eradication therapies.
Authors’ contributionParra-Sepúlveda C: data collection, bacterial isolation, an-
tibiotics resistance studies. Merino JS: manuscript preparation. Sáez-Carrillo K: statistical analysis. González C: data collection and manuscript preparation. García-Cancino A: data collection and manuscript preparation.
OrcidCristian Parra-Sepúlveda. Orcid: 0000-0002-9836-8107.José S Merino. Orcid: 0000-0002-2797-5786.Katia Sáez Carrillo. Orcid: 0000-0002-8580-8038.Carlos González. Orcid: 0000-0002-9636-5586.Apolinaria García-Cancino. Orcid: 0000-0003-3909-9733.
Parra-Sepúlveda C, Merino JS, Sáez-Carrillo K, González C, García-Cancino A. Vigilância da resistência a antibióticos contra o Helicobacter pylori na região do Biobío (Chile) em uma década. Arq Gastroenterol. 2019;56(4):361-6.RESUMO – Contexto – A infecção por Helicobacter pylori no Chile permanece como um desafio do sistema de saúde público e privado, com prevalência
da infecção acima de 70%. Hoje em dia, o tratamento antibiótico da infecção é obrigatório para prevenir o surgimento de graves doenças associadas, mas falhas na terapia de erradicação, principalmente devido à resistência à claritromicina, têm sido observadas em todo o mundo, e a terapia de erradicação de primeira linha parece não ser mais eficaz em várias áreas geográficas. Assim, os sistemas de saúde estão comprometidos em manter uma vigilância epidemiológica sobre a evolução da resistência aos antibióticos deste patógeno prioritário tipo 2. Objetivo – Este trabalho relata uma vigilância de 10 anos da resistência antibiótica primária de isolados clínicos de H. pylori na região do Biobío-Chile, e a evolução da resistência em relação à amoxicilina, claritromicina, levofloxacina, metronidazol e tetraciclina entre as espécies. Métodos – As cepas de H. pylori foram investigadas durante os períodos 2005-2007 (1435 pacientes analisados) e 2015-2017 (220 pacientes analisados) inoculando uma biópsia de homogeneizado fisi-ológico na superfície do agar Columbia (Oxoid, Basingstoke, Reino Unido) – suplementado com 7% de glóbulos vermelhos do cavalo mais o inibidor de DENTE (Oxoid, Basingstoke, Reino Unido) – seguindo pela incubação em 37ºC a atmosfera de 10% de CO
2 por cinco dias. O padrão de resistên-cia aos antibióticos dos isolados foi avaliado utilizando-se o teste de difusão em disco em agar Müeller-Hinton suplementado com 7% de glóbulos vermelhos de cavalo seguidos de incubação por mais três dias a atmosfera de 10% de CO2. A análise estatística foi realizada utilizando-se o software SPSS V22 e os valores de P<0,5 foram considerados estatisticamente significantes. Resultados – Um total de 41% dos 1435 pacientes foram detectados como contaminados por H. pylori pela cultura bacteriológica no período 2005-2007, ao mesmo tempo 32,7% de 220 pacientes foram contaminados igualmente no período 2015-2017. Os isolados clínicos de H. pylori são principalmente suscetíveis à amoxicilina e tetraciclina (tanto mais de 98% das cepas), mas menos suscetíveis à levofloxacina em ambos os períodos analisados (mais de 79% das cepas). Por outro lado, o metronidazol permaneceu mostrando a maior pontuação de resistentes isolados (mais de 40% de cepas resistentes), embora tenham sido observados 18% menos cepas resistentes no período de 2015-2017. A claritromicina, o antibiótico-chave em terapias de erradicação, tem uma frequência aumentada de cepa resistente isolada na década (22,5% em 2005-2007 e 29,2% em 2015-2017). Cepas multirresistentes (dois, três e quatro antibióticos) também foram detectadas em ambos os períodos com os maiores escores de resistência simultânea à claritromicina-metronidazol (18%) e claritromicina-metronidazol-levofloxacina (12,5%) cepas resistentes. De acordo com o sexo, os isolados resistentes à amoxicilina, claritromicina e metronidazol foram mais frequentes no sexo feminino, com incremento específico em amoxicilina e resistência à claritromicina. Conclusão – A frequência de resistência à claritromicina (29,2%) detectada em 2015-2017 sugere que a terapia tripla convencional não é mais efetiva nesta região.
DESCRITORES – Helicobacter pylori, efeitos dos fármacos. Infecções por Helicobacter. Antibacterianos. Farmacorresistência bacteriana. Claritromicina. Homens. Mulheres. Chile.
Parra-Sepúlveda C, Merino JS, Sáez-Carrillo K, González C, García-Cancino A.Antibiotic resistance surveillance of Helicobacter pylori at the Biobío region (Chile) in a decade
366 • Arq Gastroenterol • 2019. v. 56 nº 4 out/dez
REFERENCES
1. Camargo MC, García A, Riquelme A, Otero W, Camargo CA, Hernandez-García T, Candia R, Bruce MG, Rabkin CS. The problem of Helicobacter pylori resis-tance to antibiotics: a systematic review in Latin America. Am J Gastroenterol. 2014;109:485-95.
2. Ferreccio C, Rollán A, Harris PR, Serrano C, Gederlini A, Margozzini P, et al. Gastric cancer is related to early Helicobacter pylori infection in a high-prevalence country. Cancer Epidemiol Biomarkers Prev. 2007;16:662-7.
3. Porras C, Nodora J, Sexton R, Ferreccio C, Jimenez S, Dominguez RL, et al. Epidemiology of Helicobacter pylori infection in six Latin American countries (SWOG Trial S0701). Cancer Causes Control. 2013;24:209-15.
4. Ministerio de Salud. Tratamiento de erradicación de Helicobacter pylori en el paciente con ulcera péptica. Serie Guías Clínicas MINSAL. 2013:1-44.
5. Merino JS, Araneda L, Lincoñir-Campos P, Parra C, Sáez K, García A. Dinámica de la infección por Helicobacter pylori en lactantes durante los primeros seis meses de vida. Enfermedades Infecciosas y Microbiología Clínica. 2019;37:109-11.
6. Malfertheiner P, Megraud F, O’Morain CA, Gisbert JP, Kuipers EJ, Axon AT, Bazzoli F, et al. Management of Helicobacter pylori infection–the Maastricht IV/Florence Consensus Report. Gut. 2012;61:646-64.
7. Malfertheiner P, Megraud F, O’Morain CA, Gisbert JP, Kuipers EJ, Axon AT, et al. European Helicobacter and Microbiota Study Group and Consensus panel. Management of Helicobacter pylori infection-the Maastricht V/Florence Con-sensus Report. Gut. 2017;66:6-30.
8. Alba C, Blanco A, Alarcón T. Antibiotic resistance in Helicobacter pylori. Curr Opin Infect Dis. 2017;30:489-97.
9. Tacconelli E, Carrara E, Savoldi A, Harbarth S, Mendelson M, Monnet D, et al, and the WHO Pathogens Priority List Working Group. Discovery, research, and development of new antibiotics: the WHO priority list of antibiotic-resistant bacteria and tuberculosis. Lancet Infect Dis. 2018:18;318-27.
10. Serrano CA, Leon MA, Palma C, Vera M, Hernandez C, Harris PR. Helicobacter pylori-clarithromycin resistance in symptomatic paediatric patients in a High Prevalence Country. J Pediatr Gastroenterol Nutr. 2017;64:e56-e60.
11. Schnell G, Shubert T. Usefulness of culture, histology, and urease testing in detection of C. pyloridis. Am J Gastroenterol. 1989;84:132-7.
12. Lang L, García F. Comparison of E-Test and disk diffusion assay to evaluate resistance of Helicobacter pylori isolates to amoxicillin, clarithromycin, metro-nidazole and tetracycline in Costa Rica. Int J Antimicrob Ag. 2004;24:572-7.
13. Chaves S, Gadanho M, Tenreiro R, Cabrita J. Assessment of metronidazole sus-ceptibility in Helicobacter pylori: Statistical validation and error rate analysis of breakpoints determined by disk diffusion test. J Clin Microbiol. 1999;37:1628-31.
14. Yepes CA, Rodríguez A, Ruiz A, Ariza B. Resistencia antibiótica del Helicobacter pylori en el Hospital Universitario San Ignacio de Bogotá. Acta Méd Colomb. 2008;33:11-4.
15. Pfaller MA, Barry AL, Fuchs PC. Levofloxacin disk potency and interpretative criteria for susceptibility tests. J Clin Microbiol. 1993;31:1924-6.
16. Yu C, Li L, Chen W, Jiao Y, Yang N, Yang E, et al. Levofloxacin susceptibility testing for Helicobacter pylori in China: Comparison of E‐Test and disk diffusion method. Helicobacter. 2011;16:119-23.
17. González CC, García CA, Daroch MF, Kawaguchi PF, Solar RH, Rivera FN, et al. Susceptibilidad in vitro de cepas de Helicobacter pylori: aislamiento de cepas resistentes a claritromicina. Rev Méd Chile. 2001;129:643-6.
18. Vásquez A, Valdez Y, Gilman RH, McDonald JJ, Westblom TU, Berg D, et al. Metronidazole and clarithromycin resistance in Helicobacter pylori determined by measuring MICs of antimicrobial agents in color indicator egg yolk agar in a miniwell format. The Gastrointestinal Physiology Working Group of Universidad Peruana Cayetano Heredia and the Johns Hopkins University. J Clin Microbiol. 1996;34:1232-4.
19. Otth L, Wilson M, Fernández H, Otth C, Toledo C, Cárcamo V, et al. Isolation of Helicobacter pylori in gastric mucosa and susceptibility to five antimicrobial drugs in Southern Chile. Braz J Microbiol. 2011;42:442-7.
20. Gonzalez-Hormazabal P, Musleh M, Escandar S, Valladares H, Lanzarini E, Castro GV, et al. Prevalence of clarithromycin resistance in Helicobacter pylori in Santiago, Chile, estimated by real-time PCR directly from gastric mucosa. BMC Gastroenterol. 2018;18:91.
21. Dan W, Guo Q, Yuan Y, Gong Y. The antibiotic resistance of Helicobacter pylori to five antibiotics and influencing factors in an area of China with a high risk of gastric cancer. BMC Microbiol. 2019;19:152-62.
22. Soto A, García A, González CL. In vitro Antagonism of Rabeprazole and Metro-nidazole upon Clinical Isolates of Helicobacter pylori. Chemother. 2009;55:308-11.
23. Pereyra LV, Gorordo Ipiña RC, Berruezo FA, Amieva CA, García ME, Bottiglieri MT. Sensibilidad a los antimicrobianos de aislamientos de Helicobacter pylori aislados de lesiones gástricas. Rev Argent Microbiol. 2017;49:153-7.
24. Ogata S, Gales A, Kawakami E. Antimicrobial susceptibility testing for Helico-bacter pylori isolates from Brazilian children and adolescents: Comparing agar dilution, E-test, and disk diffusion. Braz J Microbiol. 2014;45:1439-48.
25. Di Giulio M, Di Campli E, Di Bartolomeo S, Cataldi V, Marzio L, Grossi L, et al. In vitro antimicrobial susceptibility of Helicobacter pylori to nine antibiotics currently used in Central Italy. Scand J Gastroenterol. 2016;51:263-9.
26. Ducournau A, Benejat L, Sifre E, Ducournau A, Benejat L, Sifre E. Helicobacter pylori resistance to antibiotics in 2014 in France detected by phenotypic and genotypic methods. Clin Microbiol Infect. 2016;22:715-8.
27. Boyanova L, Ilieva J, Gergova G, Mitov I. Levofloxacin susceptibility testing against Helicobacter pylori: evaluation of a modified disk diffusion method compared to E test. Diagn Microbiol Infect Dis. 2016;84:55-6.
28. Fallone C, Steven F, Moss, Malfertheiner. Reconciliation of Recent Helicobacter pylori Treatment Guidelines in a Time of Increasing Resistance to Antibiotics. Gastroenterology. 2019, Apr 15. pii: S0016- 5085(19)35704-X.
29. European Medicine Agency (EMA). Disabling and potentially permanent side effects lead to suspension or restrictions of quinolone and fluoroquinolone antibiotics [11 March 2019].
30. Klein EY, Van Boeckel TP, Martinez EM, Pant S, Gandra S, Levin SA, et al. Global increase and geographic convergence in antibiotic consumption between 2000 and 2015. PNAS. 2018;115(15):E3463–E3470.
31. Lallana MJ, Feja C, Malo S, Abad JM, Bjerrum L, Rabanaque MJ. Variabilidad de la prescripción de antibióticos en atención primaria de los sectores sanitarios de Aragón. Revista Española de Salud Pública. 2012;86:627-35.
32. Serna MC, Ribes E, Real J, Galván L, Gascó E, Godoy P. Alta exposición a an-tibióticos en la población y sus diferencias por género y edad. Atención Primaria. 2011:43:236-44.
33. Molina-Infante J, Corti R, Doweck J, McNicholl A, Gisbert J. Avances recientes en el tratamiento de la infección por Helicobacter pylori. Acta Gastroenterol Latinoam 2017;47:75-85.

AHEAD OF PRINTORIGINAL ARTICLE
Arq Gastroenterol • 2019. v. 56 nº 4 out/dez • 367
INTRODUCTION
Gastric cancer is the fourth most common cause of mortality due to malignancies around the world. Despite many advances in treatment, the survival rate of those who underwent surgical procedures is less than five years(1,2). It is suggested that genetic sensitivity plays an important role in the progression of the gastric cancer(3,4). Gastric cancer has an epithelial source that is caused by genetic and environmental factors (eg exposure to chronic exposure to metals)(5-7).
Metallothioneins (MTs) are members of the family of low mo-lecular weight cysteine proteins (molecular weights ranging from 500 to 14,000 daltons)(8). Metallothionein proteins have the ability to bind to the physiological heavy metals (zinc, cooper, selenium) and non-physiological heavy ions (cadmium, mercury, silver, ar-senic), using the thiol group of the cysteine amino acids (Cystine amino acid consist about 30% of the amino acid content of the metallothionein proteins)(9). They exist in all living organisms and accumulate in the membrane of the golgi apparatus(10).
MTs have multiple cellular functions including the protection against the heavy metal toxicity, adjustment and absorption of physiological heavy fluorides, aid in the transport and disposal of heavy metals, metabolism of essential metals, immune response and protection against oxidative stress(6,11). The four main groups of MTs are expressed in humans, which include MT4, MT3, MT2,
Metallothionein-2A (rs1610216&rs28366003) gene polymorphisms and the risk of stomach adenocarcinoma
Mohammad SHOKRZADEH1, Abbas MOHAMMADPOUR2, Nasrin GHASSEMI-BARGHI1, Vahid HOSEINI3, Saied ABEDIANKENARI3 and Yahya Saleh TABARI1
Received 23/6/2019Accepted 12/8/2019
ABSTRACT – Background – Gastric cancer is the fourth most common cause of worldwide cancer. Also in contrast to the huge advances in curing, the chance of living is very low even in surgery cases. Having a genetic predisposition plays an important role in cancer development. The association between Metallothionein-2A gene polymorphisms and the risk of adenocarcinoma has been widely studied, yet there is only one study on stomach diseases. Objective – In this study, we aimed to investigate the association between 2 (MT-2A) polymorphisms and adenocarcinoma. Methods – This cross-sectional case control study was performed between Mach 2014 and January 2015 at the Tuba Hospital of Sari, Iran. Peripheral blood samples were collected in EDTA tube. DNA extraction was performed using the spin column procedure. The MT-2A polymorphisms MT-2A (rs1610216), (rs28366003) were determined by polymerase chain reaction-restriction fragment length polymorphism analysis in 95 a topic adenocarcinoma patients and 90 healthy individuals from Iranian population. Results – The MT-2A rs1610216 polymorphism increased the risk of adeno carcinoma in our Iranian population [OR: 3.8533; 95%CI, 1.3155-11.2869; P=0.0139] and rs28366003 [OR: 4.0978; 95%CI, 1.2521-13.4108; P=0.0197]. Conclusion – The MT-2A gene polymorphism was associated with the risk of adenocarcinoma in the Iranian population.
HEADINGS – Metallothionein. Neoplasias gástricas. Genetic polymorphism. Polymorphism, restriction fragment length.
Declared conflict of interest of all authors: noneDisclosure of funding: no funding received1 Pharmaceutical Research Center, Department of Toxicology and Pharmacology, Faculty of Pharmacy, Mazandaran University of Medical Sciences, Sari, Iran. 2 Gastrointestinal Cancer Research Center, Mazandaran University of Medical Sciences, Sari, Iran. 3 Professor, Immunogenetics Research Center, Mazandaran University of Medical Sciences, Sari, Iran.Corresponding author: Yahya Saleh Tabari. Email: [email protected]
MT1, each of which contains several subgroups(12,13). The levels of MTs vary in different tissues. MT3 is expressed mainly in neural, heart, renal, gastric, and tongue cells(2,14,15). MT4 is seen only in some epithelial cells(16). MT1, MT2A is extensively expressed in the tissues, and MT2A seems to be more expressed than MT1(17).
The expression of MTs can be c by several stimuli factors such as exposure to flask, oxidative stress, glucocytocoids and gene poly-morphism(18). The response to these stimuli also depends on the MT gene. Since MTs play important roles in regulating over-the-counter factors, toxicity related to heavy metals, etc., then malfunctioning or disturbances in the expression of MTs results in the lack of controlling the cells and eventually cancer(19-21).
Previous studies have been shown to increase or decrease the expression and polymorphism of MTs in some cancers, such as the kidney, liver, lung, prostate, mouth and skin. The most common form of human genetic differences is single nucleoid polymorphisms (SNPs), and they may play an important role in individual aller-gies(22). Single-nucleotide polymorphism is a change in just one base of DNA. These single-nucleotide variations cause different phenotypes, predisposing to or susceptibility to certain diseases(23). Regarding the high prevalence of non-surgical advanced gastric adenocarcinomas and the low response of patients to conventional treatments (surgery, radiotherapy chemotherapy) in Mazandaran and also due to the role of MT-2A subtype (MT2A) polymorphism in the development of cancer we decide to evaluate this issue.
AG-2019-90dx.doi.org/10.1590/S0004-2803.201900000-69

Shokrzadeh M, Mohammadpour A, Ghassemi-Barghi N, Hoseini V, Abediankenari S, Tabari YS.Metallothionein-2A (rs1610216&rs28366003) gene polymorphisms and the risk of stomach adenocarcinoma
368 • Arq Gastroenterol • 2019. v. 56 nº 4 out/dez
In this study, the polymorphism of the C>T region of the nu-cleotide position 609 of the MT-2A gene induced the transfer of C-to-T into codon 187, the exon of six proline amino acids to the serine(24-26), and also the region G>A polymorphism in rs28366003 the nucleotide G mutant has been replaced by an ancestral nucleo-tide A, in which the genomic DNA extracted from peripheral blood leucocytes in patients with gastric cancer and healthy subjects was investigated. Identifying genetic polymorphisms in people with gastric cancer, in addition to helping to recognize the mechanism of the disease, is effective in identifying and screening people who are prone to illness and as a result of their prevention.
METHODS
This case-control study was performed on 95 patients with gas-tric cancer who referred to the Toba Clinic, Mazandaran University of Medical Sciences, (Informed consent was taken for testing) who had no family history of gastric cancer and identified by expert physician based on the results of endoscopic and pathologic stud-ies. Also, 90 healthy individuals matched according to age, sex, and living area of Mazandaran province were studied as control group. The genomic DNA was extracted using DynaBio extraction kit, a biochemical assay, and extracted from peripheral blood leukocytes. A spectrophotometer was used to determine the quality and amount of the extracted DNA. After examining the quality of the DNA extracted from the control and the patient samples, in the follow-ing, we mixed 2 μL of the sample with 12.5 μL of mastermix and 0.8 μL of the relevant primers, and eventually Distilled water was dispersed in a volume of 25 μL in order to to prepare the required samples for PCR (TABLE 1).
Then the polymerase chain reaction was performed using a Bio-Rad apparatus according to the initial annealing temperature program at 94°C for 5 minutes, secondary annealing was done at 94°C for 30 seconds, the primer binding temperature (rs1610216 (58) and (rs28366003) 60°C for 30 seconds, initial amplification of the product at 37°C for 30 seconds to 36 cycles, and finally the reproduction temperature of the secondary product at 72°C for 10 minutes (TABLE 2). After polymerase chain reaction to ensure reproduction, the product was applied to 1% agarose gel using TBE solution at test temperature The apparent and 100 mV voltage cre-ated using the power lab Bio-Rad device was electrophoresed in the vicinity of the marker, then, they were stained using ethidium bromide, and identified using a dye gel device.
After observing the desired fragment, 8 μL of PCR product (rs1610216) C>T and (rs28366003) G>A were mixed with 1 μL of the enzyme x10 buffer and 0.2 μL of the enzyme SmaI and BsgI, respectively for enzymatic digestion of each SNP, and were finally distilled into 10 μL distilled water and placed at 37°C for 2 hours. After the adjuvant time with the product enzyme, electrophoresis of 1.5% agarose gel was performed, then electrophoresis bands were detected and the polymorphism was detected by Doc gel method. Statistical analysis was performed using Medcalc software, the results are presented below.
Statistical analysisThe association between cases and controls were examined
by chi-square test with medcalc software. Value of P<0.05 was considered to be significant. Also the genotype frequencies were checked for consistency among groups.
RESULTS
This case-control study was performed on 95 patients with gastric cancer and 90 healthy individual age range of 22–90 years (TABLE 3).
TABLE 1. Primer feature.
PCR product sequence PCR product Restriction Enzyme Primer Sequence Location
56608619 to 56608263 T: 396bpC: 268+128bp SmaI Forward: GCTAGAGTCGGGACAGGTTG
Reverse: CAGGTTCGAGTACAGGACAGGC>T
(rs1610216)
56608522 to 56608650 A: 39+107bpG: 146bp BsgI Forward: GGGGCTTTTGCACTCGTC
Reverse: GTTGGGATCCATGGCGAG(rs28366003)
G>A
TABLE 2. Temperature protocol for ThermoCycler device.
Denaturing at a temperature of 94°C for 5 minutes A single cycle
Denaturing at 94°C for 30 seconds
Annealingrs1610216 at a temperature of
58° for 30 s 35 cycles
rs28366003 at 60° for 30 sExtension at 72°C for 30 secondsExtension temperature of 72°C for 10 minutes A single cycle
TABLE 3. Questionnaire information for people with gastric cancer.
City (number) Man (number) Woman (number)
Sari (42 people) 28 14
Ghaemshahr (14 people) 10 4
Behshahr (7 people) 5 2
Neka (15 people) 11 4
Juybar (6 people) 4 2
Mahmoud Abad (3 people) 2 1
Galoogah (2 people) 1 1
Surk (3 people) 2 1
Savadkuh (3 people) 2 1
Total (95 people) 65 30
The two groups were examined for single-nucleotide poly-morphism (rs1610216) C>T and (rs28366003) G>A in the MT-2A gene, and a significant difference was observed between the polymorphism of the MT-2A gene in control and control groups [OR: 3.8533; 95% CI, 1.3155-11.2869; P=0.0139] rs1610216 and rs28366003 [OR: 4.0978; 95% CI, 1.2521-13.4108; P=0.0197] The distribution of genotypic and allotropic abnormalities in patients with gastric cancer and control group is summarized in sections 4 and 5.
In genotypic study conducted in this study between two groups of patients and control in polymorphism (rs28366003) MT-2, the comparison of homozygote genotype (AA) with mutant homozy-gous genotype (GG) increased the risk of increase of population to patient by four times Find (P=0.0197). (TABLE 4)
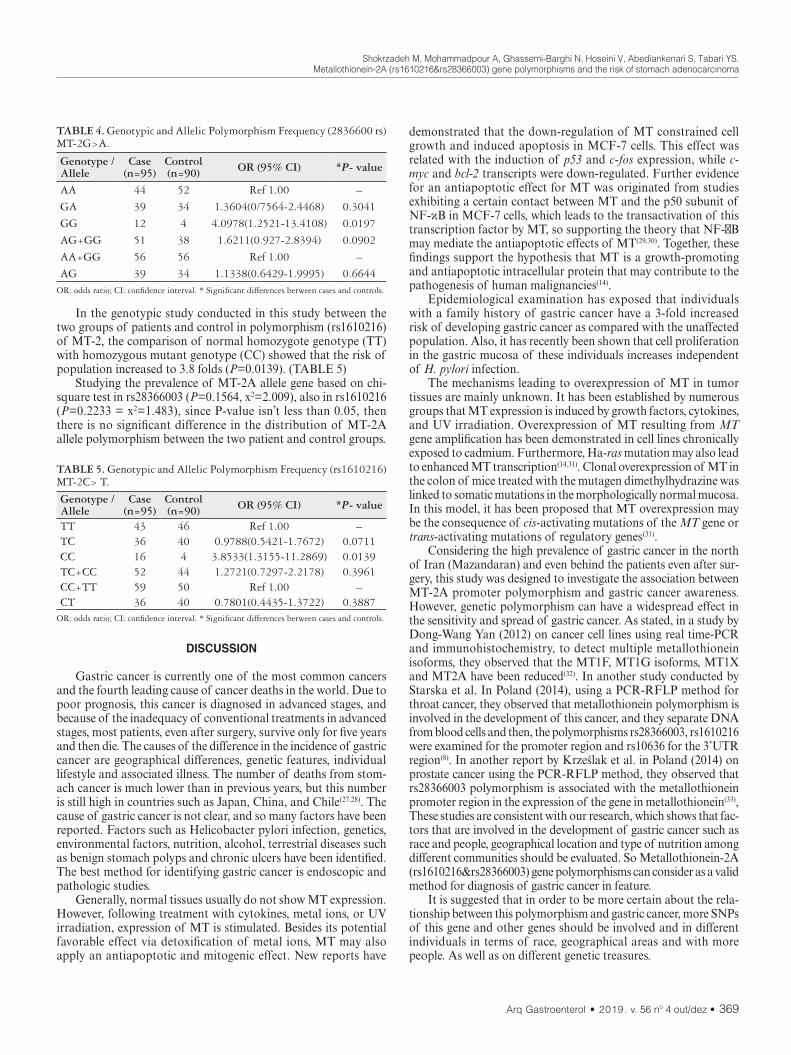
Shokrzadeh M, Mohammadpour A, Ghassemi-Barghi N, Hoseini V, Abediankenari S, Tabari YS.Metallothionein-2A (rs1610216&rs28366003) gene polymorphisms and the risk of stomach adenocarcinoma
Arq Gastroenterol • 2019. v. 56 nº 4 out/dez • 369
In the genotypic study conducted in this study between the two groups of patients and control in polymorphism (rs1610216) of MT-2, the comparison of normal homozygote genotype (TT) with homozygous mutant genotype (CC) showed that the risk of population increased to 3.8 folds (P=0.0139). (TABLE 5)
Studying the prevalence of MT-2A allele gene based on chi-square test in rs28366003 (P=0.1564, x2=2.009), also in rs1610216 (P=0.2233 = x2=1.483), since P-value isn’t less than 0.05, then there is no significant difference in the distribution of MT-2A allele polymorphism between the two patient and control groups.
demonstrated that the down-regulation of MT constrained cell growth and induced apoptosis in MCF-7 cells. This effect was related with the induction of p53 and c-fos expression, while c-myc and bcl-2 transcripts were down-regulated. Further evidence for an antiapoptotic effect for MT was originated from studies exhibiting a certain contact between MT and the p50 subunit of NF-κB in MCF-7 cells, which leads to the transactivation of this transcription factor by MT, so supporting the theory that NF-κB may mediate the antiapoptotic effects of MT(29,30). Together, these findings support the hypothesis that MT is a growth-promoting and antiapoptotic intracellular protein that may contribute to the pathogenesis of human malignancies(14).
Epidemiological examination has exposed that individuals with a family history of gastric cancer have a 3-fold increased risk of developing gastric cancer as compared with the unaffected population. Also, it has recently been shown that cell proliferation in the gastric mucosa of these individuals increases independent of H. pylori infection.
The mechanisms leading to overexpression of MT in tumor tissues are mainly unknown. It has been established by numerous groups that MT expression is induced by growth factors, cytokines, and UV irradiation. Overexpression of MT resulting from MT gene amplification has been demonstrated in cell lines chronically exposed to cadmium. Furthermore, Ha-ras mutation may also lead to enhanced MT transcription(14,31). Clonal overexpression of MT in the colon of mice treated with the mutagen dimethylhydrazine was linked to somatic mutations in the morphologically normal mucosa. In this model, it has been proposed that MT overexpression may be the consequence of cis-activating mutations of the MT gene or trans-activating mutations of regulatory genes(31).
Considering the high prevalence of gastric cancer in the north of Iran (Mazandaran) and even behind the patients even after sur-gery, this study was designed to investigate the association between MT-2A promoter polymorphism and gastric cancer awareness. However, genetic polymorphism can have a widespread effect in the sensitivity and spread of gastric cancer. As stated, in a study by Dong-Wang Yan (2012) on cancer cell lines using real time-PCR and immunohistochemistry, to detect multiple metallothionein isoforms, they observed that the MT1F, MT1G isoforms, MT1X and MT2A have been reduced(32). In another study conducted by Starska et al. In Poland (2014), using a PCR-RFLP method for throat cancer, they observed that metallothionein polymorphism is involved in the development of this cancer, and they separate DNA from blood cells and then, the polymorphisms rs28366003, rs1610216 were examined for the promoter region and rs10636 for the 3’UTR region(8). In another report by Krześlak et al. in Poland (2014) on prostate cancer using the PCR-RFLP method, they observed that rs28366003 polymorphism is associated with the metallothionein promoter region in the expression of the gene in metallothionein(33), These studies are consistent with our research, which shows that fac-tors that are involved in the development of gastric cancer such as race and people, geographical location and type of nutrition among different communities should be evaluated. So Metallothionein-2A (rs1610216&rs28366003) gene polymorphisms can consider as a valid method for diagnosis of gastric cancer in feature.
It is suggested that in order to be more certain about the rela-tionship between this polymorphism and gastric cancer, more SNPs of this gene and other genes should be involved and in different individuals in terms of race, geographical areas and with more people. As well as on different genetic treasures.
TABLE 4. Genotypic and Allelic Polymorphism Frequency (2836600 rs) MT-2G>A.
Genotype /Allele
Case (n=95)
Control (n=90) OR (95% CI) *P- value
AA 44 52 Ref 1.00 –
GA 39 34 1.3604(0/7564-2.4468) 0.3041
GG 12 4 4.0978(1.2521-13.4108) 0.0197
AG+GG 51 38 1.6211(0.927-2.8394) 0.0902
AA+GG 56 56 Ref 1.00 –
AG 39 34 1.1338(0.6429-1.9995) 0.6644OR: odds ratio; CI: confidence interval. * Significant differences between cases and controls.
TABLE 5. Genotypic and Allelic Polymorphism Frequency (rs1610216) MT-2C> T.
Genotype /Allele
Case (n=95)
Control (n=90) OR (95% CI) *P- value
TT 43 46 Ref 1.00 –TC 36 40 0.9788(0.5421-1.7672) 0.0711CC 16 4 3.8533(1.3155-11.2869) 0.0139TC+CC 52 44 1.2721(0.7297-2.2178) 0.3961CC+TT 59 50 Ref 1.00 –CT 36 40 0.7801(0.4435-1.3722) 0.3887
OR: odds ratio; CI: confidence interval. * Significant differences between cases and controls.
DISCUSSION
Gastric cancer is currently one of the most common cancers and the fourth leading cause of cancer deaths in the world. Due to poor prognosis, this cancer is diagnosed in advanced stages, and because of the inadequacy of conventional treatments in advanced stages, most patients, even after surgery, survive only for five years and then die. The causes of the difference in the incidence of gastric cancer are geographical differences, genetic features, individual lifestyle and associated illness. The number of deaths from stom-ach cancer is much lower than in previous years, but this number is still high in countries such as Japan, China, and Chile(27,28). The cause of gastric cancer is not clear, and so many factors have been reported. Factors such as Helicobacter pylori infection, genetics, environmental factors, nutrition, alcohol, terrestrial diseases such as benign stomach polyps and chronic ulcers have been identified. The best method for identifying gastric cancer is endoscopic and pathologic studies.
Generally, normal tissues usually do not show MT expression. However, following treatment with cytokines, metal ions, or UV irradiation, expression of MT is stimulated. Besides its potential favorable effect via detoxification of metal ions, MT may also apply an antiapoptotic and mitogenic effect. New reports have
Shokrzadeh M, Mohammadpour A, Ghassemi-Barghi N, Hoseini V, Abediankenari S, Tabari YS.Metallothionein-2A (rs1610216&rs28366003) gene polymorphisms and the risk of stomach adenocarcinoma
370 • Arq Gastroenterol • 2019. v. 56 nº 4 out/dez
ACKNOWLEDGEMENTS
Authors would like to thank all the people who participated in this research. In the Ethics Committee of Mazandaran University of Medical Sciences, it has the code IR.MAZUMS.REC.96.1211. This study was conducted with the financial support of the Research and Technology Dept. of Mazandaran University of Medical Sciences. The benefits of this research is for Mazandaran’s medical sciences. The researchers are grateful to the vice president for their support.
Authors’ contributionShokrzadeh M: study design and management. Hoseini V:
perform tests. Abediankenari S and Tabari YS: perform tests. Mohammadpour A: statistical analyses. Ghassemi-Barghi N: writ-ing article, all authors read and approve final manuscript.
OrcidMohammad Shokrzadeh. Orcid: 0000-0002-0071-6530.Abbas Mohammadpour. Orcid: 0000-0003-2797-1766.Nasrin Ghassemi-Barghi. Orcid: 0000-0002-0673-4262.Vahid Hosseini: Orcid. 0000-0002-2303-4460.Saeid Abediankenari. Orcid: 0000-0002-4287-2670.Yahya Saleh Tabari. Orcid: 0000-0001-8339-1745.
REFERENCES
1. Nasrabadi NN, Ataee R, Abediankenari S, Shokrzadeh M, Najafi M, Hoseini SV, et al. Expression of MT2 receptor in patients with gastric adenocarcinoma and its relationship with clinicopathological features. J Gastrointest Cancer. 2014;45:54-60.
2. Shokrzadeh M, Ghassemi-Barghi N. Melatonin loading chitosan-tripolyphos-phate nanoparticles: Application in attenuating etoposide-induced genotoxicity in HepG2 cells. Pharmacology. 2018;102:74-80.
3. Ghasemi M, Hoseini V, Alizadeh A, Farzad F. Caspase 9 Promoter Polymor-phisms in Gastric Cancer, Mazandaran Province. J Mazandaran Univ Med Sci. 2013;23:2-7.
4. Abediankenari S, Shokrzadeh M, Aminjan HH, Nasri N, Alizadeh A. Evaluation of caspase3 and 9 gene polymorphisms in gastric cancer patients in Mazandaran province: a brief report. Tehran Univ Med J. 2013;71:536-40.
5. Zhen T, Dai S, Li H, Yang Y, Kang L, Shi H, et al. MACC1 promotes carcinoge nesis of colorectal cancer via β-catenin signaling pathway. Oncotarget. 2014;5:3756.
6. Ghassemi-Barghi N, Etebari M, Jafarian-Dehkordi A. Protective effect of am-ifostine on busulfan induced DNA damage in human hepatoma cells. Toxicol Mech Methods. 2017;27:52-7.
7. Shokrzadeh M, Ghassemi-Barghi N. Genoprotective Effects of Amifostine against Mitomycin C-induced Toxicity in Human Hepatoma Cells. Int J Cancer Res Ther. 2018;2:1-5.
8. Starska K, Krześlak A, Forma E, Olszewski J, Lewy-Trenda I, Osuch-Wójcik-iewicz E, et al. Genetic polymorphism of metallothionein 2A and risk of laryngeal cancer in a Polish population. Med Oncol. 2014;31:75.
9. Yang C-C, Chen H-I, Chiu Y-W, Tsai C-H, Chuang H-Y. Metallothionein 1A poly-morphisms may influence urine uric acid and N-acetyl-beta-D-glucosaminidase (NAG) excretion in chronic lead-exposed workers. Toxicology. 2013;306:68-73.
10. Ganasyam SR, Rao TB, Murthy Y, Jyothy A, Sujatha M. Association of Estrogen Receptor-α Gene & Metallothionein-1 Gene Polymorphisms in Type 2 Diabetic Women of Andhra Pradesh. Indian J Clin Biochem. 2012;27:69-73.
11. Krześlak A, Forma E, Jóźwiak P, Szymczyk A, Smolarz B, Romanowicz-Ma-kowska H, et al. Metallothionein 2A genetic polymorphisms and risk of ductal breast cancer. Clin Exp Med. 2014;14:107-13.
Shokrzadeh M, Mohammadpour A, Ghassemi-Barghi N, Hoseini V, Abediankenari S, Tabari YS. Polimorfismos do gene metalotioneína-2A (rs1610216&rs28366003) e o risco de adenocarcinoma de estômago. Arq Gastroenterol. 2019;56(4):367-71.RESUMO – Contexto – O câncer gástrico é a quarta causa mais comum de câncer em todo o mundo. Também em contraste com os enormes avanços
na cura, a chance de viver é muito baixa, mesmo em casos de cirurgia. Ter uma predisposição genética desempenha um papel importante no desen-volvimento do câncer. A associação entre polimorfismos do gene metalotioneína-2A e o risco de adenocarcinoma tem sido amplamente estudada, mas há apenas um estudo sobre doenças estomacais. Objetivo – Neste estudo, objetivou-se investigar a associação entre 2 (MT-2A) polimorfismos e adenocarcinoma. Métodos – Um estudo de controle de caso transversal foi realizado entre março de 2014 e janeiro de 2015 no hospital Tuba, Sari, Irã. Amostras de sangue periférico foram coletadas em tubo EDTA. A extração do ADN foi executada usando o procedimento da coluna da rotação. Os polimorfismos MT-2a MT-2A (rs1610216), (rs28366003) foram determinados pela análise do polimorfismo do comprimento do fragmento da reação-limitação de cadeia da polimerase em 95 pacientes com adenocarcinoma tópico e em 90 indivíduos saudáveis da população iraniana. Resulta-dos – O polimorfismo MT-2A rs1610216 aumentou o risco de adenocarcinoma de em nossa população iraniana. [OR: 3,8533; 95%CI, 1,3155-11,2869; P=0,0139] e rs28366003 [OR: 4,0978; 95%CI, 1,2521-13,4108; P=0,0197]. Conclusão – O polimorfismo do gene MT-2A foi associado ao risco de adenocarcinoma na população iraniana.
DESCRITORES – Metalotioneína. Neoplasias gástricas. Polimorfismo genético. Polimorfismo de fragmento de restrição.
12. Lei L, Chang X, Rentschler G, Tian L, Zhu G, Chen X, et al. A polymorphism in metallothionein 1A (MT1A) is associated with cadmium-related excretion of urinary beta 2‐microglobulin. Toxicol Appl Pharmaco. 2012;265:373-9.
13. Shokrzadeh M, Mohammadpour A, Hoseini V, Abediankenari S, Ghassemi-Bar-ghi N, Tabari YS. Serum cytokine of IL-2, IL-10 and IL-12 levels in patients with stomach adenocarcinoma. Arq Gastroenterol. 2018;55:385-9.
14. Forma E, Krzeslak A, Wilkosz J, Jozwiak P, Szymczyk A, Rozanski W, et al. Metallothionein 2A genetic polymorphisms and risk of prostate cancer in a Polish population. Cancer Genet. 2012;205:432-5.
15. Mohammadi H, Ghassemi-Barghi N, Malakshah O, Ashari S. Pyrethroid exposure and neurotoxicity: a mechanistic approach. Arh Hig Rada Toksikol. 2019;70:74-89.
16. Wong R-H, Huang C-H, Yeh C-B, Lee H-S, Chien M-H, Yang S-F. Effects of metallothionein-1 genetic polymorphism and cigarette smoking on the develop-ment of hepatocellular carcinoma. Ann Surg Oncol. 2013;20:2088-95.
17. Chen X, Lei L, Tian L, Zhu G, Jin T. Bone mineral density and polymorphisms in metallothionein 1A and 2A in a Chinese population exposed to cadmium. Sci Total Environ. 2012;423:12-7.
18. Raudenska M, Gumulec J, Podlaha O, Sztalmachova M, Babula P, Eckschlager T, et al. Metallothionein polymorphisms in pathological processes. Metallomics. 2014;6:55-68.
19. Woods JS, Heyer NJ, Russo JE, Martin MD, Pillai PB, Farin FM. Modification of neurobehavioral effects of mercury by genetic polymorphisms of metallothionein in children. Neurotoxicol Teratol. 2013;39:36-44.
20. Yang C, Wang L, Jiang Q, Wang J, Yue F, Zhang H, et al. The polymorphism in the promoter region of metallothionein 1 is associated with heat tolerance of scallop Argopecten irradians. Gene. 2013;526:429-36.
21. Ghassemi-Barghi N, Varshosaz J, Etebari M, Dehkordi AJ. Role of recombinant human erythropoietin loading chitosan-tripolyphosphate nanoparticles in busul-fan-induced genotoxicity: Analysis of DNA fragmentation via comet assay in cultured HepG2 cells. Toxicol In Vitro. 2016;36:46-52.
22. Lyn-Cook B, Yan-Sanders Y, Moore S, Taylor S, Word B, Hammons G. Increased levels of NAD (P) H: quinone oxidoreductase 1 (NQO1) in pancreatic tissues from smokers and pancreatic adenocarcinomas: a potential biomarker of early damage in the pancreas. Cell Biol Toxicol. 2006;22:73-80.

Shokrzadeh M, Mohammadpour A, Ghassemi-Barghi N, Hoseini V, Abediankenari S, Tabari YS.Metallothionein-2A (rs1610216&rs28366003) gene polymorphisms and the risk of stomach adenocarcinoma
Arq Gastroenterol • 2019. v. 56 nº 4 out/dez • 371
23. Vignal A, Milan D, SanCristobal M, Eggen A. A review on SNP and other types of molecular markers and their use in animal genetics. Evolution. 2002;34:275.
24. Dziegiel P, Pula B, Kobierzycki C, Stasiolek M, Podhorska-Okolow M. Metal-lothioneins: structure and functions. Metallothioneins in Normal and Cancer Cells: Springer; 2016. p. 3-20.
25. Sekovanić A, Jurasović J, Piasek M, Pašalić D, Orct T, Grgec AS, et al. Metallo-thionein 2A gene polymorphism and trace elements in mother-newborn pairs in the Croatian population. J Trace Elem Med Biol. 2018;45:163-70.
26. Hattori Y, Naito M, Satoh M, Nakatochi M, Naito H, Kato M, et al. Metallo-thionein MT2A A-5G polymorphism as a risk factor for chronic kidney disease and diabetes: Cross-sectional and cohort studies. Toxicol Sci. 2016;152:181-93.
27. Zhang Y, Wang Z, Zhong J. Meta-analysis demonstrates that the NAD (P) H: quinone oxidoreductase 1 (NQO1) gene 609 C> T polymorphism is associated with increased gastric cancer risk in Asians. Genet Mol Res. 2012;11:2328-37.
28. Hu W-G, Hu J-J, Cai W, Zheng M-H, Zang L, Wang Z-T, et al. The NAD (P) H: quinine oxidoreductase 1 (NQO1) gene 609 C> T polymorphism is associated with gastric cancer risk: evidence from a case-control study and a meta-analysis. Asian Pac J Cancer Prev. 2014;15:2363-7.
29. Kayaaltı Z, Mergen G, Söylemezoğlu T. Effect of metallothionein core pro-moter region polymorphism on cadmium, zinc and copper levels in autopsy kidney tissues from a Turkish population. Toxicol Appl Pharmacol. 2010;245: 252-5.
30. Deng D, El-Rifai We, Ji J, Zhu B, Trampont P, Li J, et al. Hypermethylation of metallothionein-3 CpG island in gastric carcinoma. Carcinogenesis. 2003; 24:25-9.
31. Starska K, Bryś M, Forma E, Olszewski J, Pietkiewicz P, Lewy-Trenda I, et al. Metallothionein 2A core promoter region genetic polymorphism and its impact on the risk, tumor behavior, and recurrences of sinonasal inverted papilloma (Schneiderian papilloma). Tumor Biol. 2015;36:8559-71.
32. Yan D-W, Fan J-W, Yu Z-h, Li M-x, Wen Y-G, Li D-W, et al. Downregulation of metallothionein 1F, a putative oncosuppressor, by loss of heterozygosity in colon cancer tissue. Biochim Biophys Acta Mol Basis Dis. 2012;1822: 918-26.
33. Krześlak A, Forma E, Chwatko G, Jóźwiak P, Szymczyk A, Wilkosz J, et al. Effect of metallothionein 2A gene polymorphism on allele-specific gene expression and metal content in prostate cancer. Toxicol Appl Pharmacol. 2013;268:278-85.
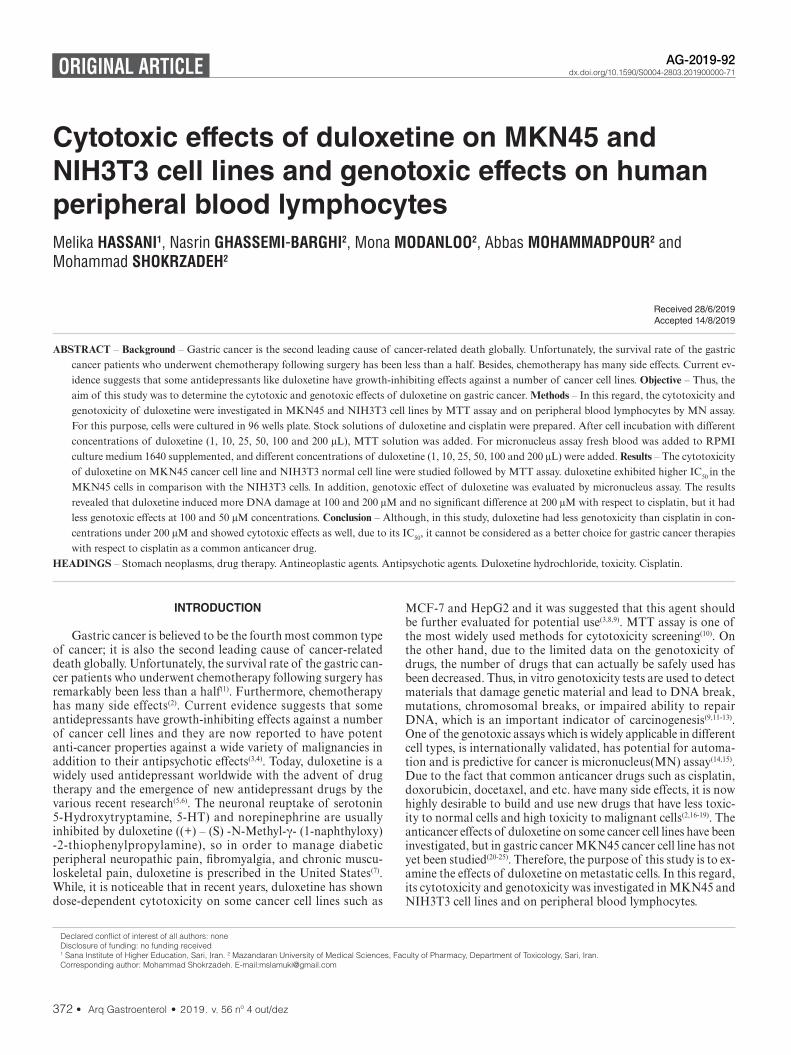
AHEAD OF PRINTORIGINAL ARTICLE
372 • Arq Gastroenterol • 2019. v. 56 nº 4 out/dez
INTRODUCTION
Gastric cancer is believed to be the fourth most common type of cancer; it is also the second leading cause of cancer-related death globally. Unfortunately, the survival rate of the gastric can-cer patients who underwent chemotherapy following surgery has remarkably been less than a half(1). Furthermore, chemotherapy has many side effects(2). Current evidence suggests that some antidepressants have growth-inhibiting effects against a number of cancer cell lines and they are now reported to have potent anti-cancer properties against a wide variety of malignancies in addition to their antipsychotic effects(3,4). Today, duloxetine is a widely used antidepressant worldwide with the advent of drug therapy and the emergence of new antidepressant drugs by the various recent research(5,6). The neuronal reuptake of serotonin 5-Hydroxytryptamine, 5-HT) and norepinephrine are usually inhibited by duloxetine ((+) – (S) -N-Methyl-γ- (1-naphthyloxy) -2-thiophenylpropylamine), so in order to manage diabetic peripheral neuropathic pain, fibromyalgia, and chronic muscu-loskeletal pain, duloxetine is prescribed in the United States(7). While, it is noticeable that in recent years, duloxetine has shown dose-dependent cytotoxicity on some cancer cell lines such as
Cytotoxic effects of duloxetine on MKN45 and NIH3T3 cell lines and genotoxic effects on human peripheral blood lymphocytesMelika HASSANI1, Nasrin GHASSEMI-BARGHI2, Mona MODANLOO2, Abbas MOHAMMADPOUR2 and Mohammad SHOKRZADEH2
Received 28/6/2019Accepted 14/8/2019
ABSTRACT – Background – Gastric cancer is the second leading cause of cancer-related death globally. Unfortunately, the survival rate of the gastric cancer patients who underwent chemotherapy following surgery has been less than a half. Besides, chemotherapy has many side effects. Current ev-idence suggests that some antidepressants like duloxetine have growth-inhibiting effects against a number of cancer cell lines. Objective – Thus, the aim of this study was to determine the cytotoxic and genotoxic effects of duloxetine on gastric cancer. Methods – In this regard, the cytotoxicity and genotoxicity of duloxetine were investigated in MKN45 and NIH3T3 cell lines by MTT assay and on peripheral blood lymphocytes by MN assay. For this purpose, cells were cultured in 96 wells plate. Stock solutions of duloxetine and cisplatin were prepared. After cell incubation with different concentrations of duloxetine (1, 10, 25, 50, 100 and 200 μL), MTT solution was added. For micronucleus assay fresh blood was added to RPMI culture medium 1640 supplemented, and different concentrations of duloxetine (1, 10, 25, 50, 100 and 200 μL) were added. Results – The cytotoxicity of duloxetine on MKN45 cancer cell line and NIH3T3 normal cell line were studied followed by MTT assay. duloxetine exhibited higher IC50 in the MKN45 cells in comparison with the NIH3T3 cells. In addition, genotoxic effect of duloxetine was evaluated by micronucleus assay. The results revealed that duloxetine induced more DNA damage at 100 and 200 μM and no significant difference at 200 μM with respect to cisplatin, but it had less genotoxic effects at 100 and 50 μM concentrations. Conclusion – Although, in this study, duloxetine had less genotoxicity than cisplatin in con-centrations under 200 μM and showed cytotoxic effects as well, due to its IC50, it cannot be considered as a better choice for gastric cancer therapies with respect to cisplatin as a common anticancer drug.
HEADINGS – Stomach neoplasms, drug therapy. Antineoplastic agents. Antipsychotic agents. Duloxetine hydrochloride, toxicity. Cisplatin.
Declared conflict of interest of all authors: noneDisclosure of funding: no funding received1 Sana Institute of Higher Education, Sari, Iran. 2 Mazandaran University of Medical Sciences, Faculty of Pharmacy, Department of Toxicology, Sari, Iran.Corresponding author: Mohammad Shokrzadeh. E-mail:[email protected]
MCF-7 and HepG2 and it was suggested that this agent should be further evaluated for potential use(3,8,9). MTT assay is one of the most widely used methods for cytotoxicity screening(10). On the other hand, due to the limited data on the genotoxicity of drugs, the number of drugs that can actually be safely used has been decreased. Thus, in vitro genotoxicity tests are used to detect materials that damage genetic material and lead to DNA break, mutations, chromosomal breaks, or impaired ability to repair DNA, which is an important indicator of carcinogenesis(9,11-13). One of the genotoxic assays which is widely applicable in different cell types, is internationally validated, has potential for automa-tion and is predictive for cancer is micronucleus(MN) assay(14,15). Due to the fact that common anticancer drugs such as cisplatin, doxorubicin, docetaxel, and etc. have many side effects, it is now highly desirable to build and use new drugs that have less toxic-ity to normal cells and high toxicity to malignant cells(2,16-19). The anticancer effects of duloxetine on some cancer cell lines have been investigated, but in gastric cancer MKN45 cancer cell line has not yet been studied(20-25). Therefore, the purpose of this study is to ex-amine the effects of duloxetine on metastatic cells. In this regard, its cytotoxicity and genotoxicity was investigated in MKN45 and NIH3T3 cell lines and on peripheral blood lymphocytes.
AG-2019-92dx.doi.org/10.1590/S0004-2803.201900000-71
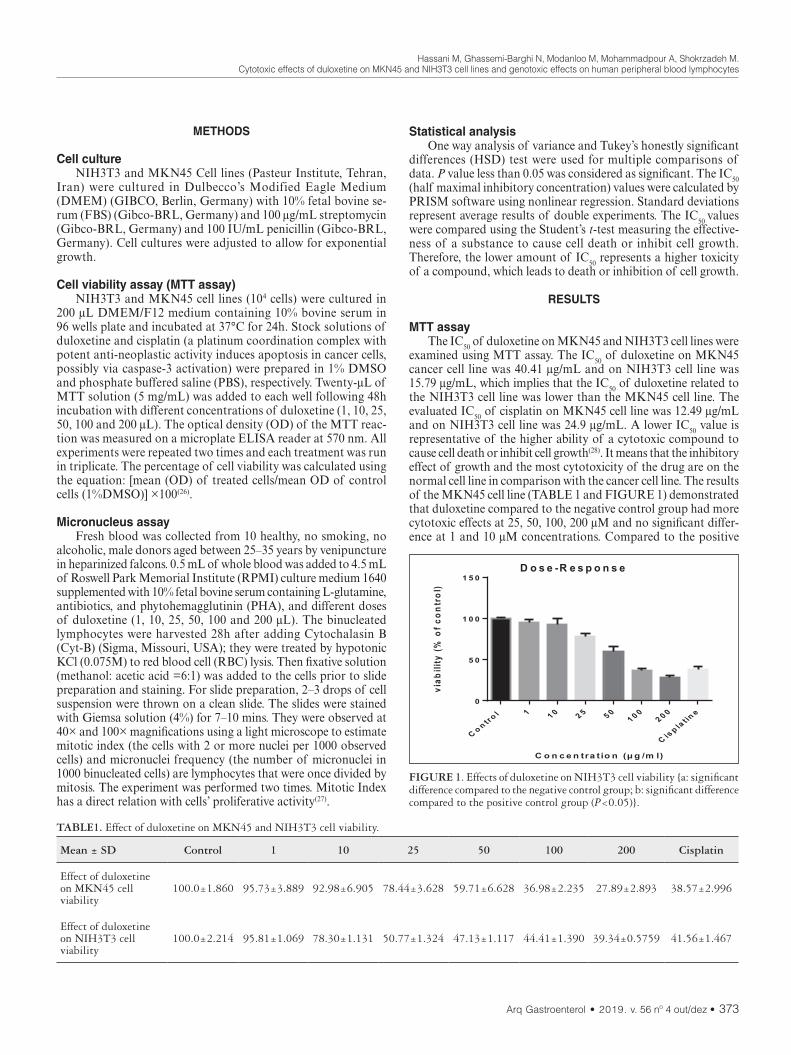
Hassani M, Ghassemi-Barghi N, Modanloo M, Mohammadpour A, Shokrzadeh M.Cytotoxic effects of duloxetine on MKN45 and NIH3T3 cell lines and genotoxic effects on human peripheral blood lymphocytes
Arq Gastroenterol • 2019. v. 56 nº 4 out/dez • 373
METHODS
Cell cultureNIH3T3 and MKN45 Cell lines (Pasteur Institute, Tehran,
Iran) were cultured in Dulbecco’s Modified Eagle Medium (DMEM) (GIBCO, Berlin, Germany) with 10% fetal bovine se-rum (FBS) (Gibco-BRL, Germany) and 100 μg/mL streptomycin (Gibco-BRL, Germany) and 100 IU/mL penicillin (Gibco-BRL, Germany). Cell cultures were adjusted to allow for exponential growth.
Cell viability assay (MTT assay)NIH3T3 and MKN45 cell lines (104 cells) were cultured in
200 μL DMEM/F12 medium containing 10% bovine serum in 96 wells plate and incubated at 37°C for 24h. Stock solutions of duloxetine and cisplatin (a platinum coordination complex with potent anti-neoplastic activity induces apoptosis in cancer cells, possibly via caspase-3 activation) were prepared in 1% DMSO and phosphate buffered saline (PBS), respectively. Twenty-μL of MTT solution (5 mg/mL) was added to each well following 48h incubation with different concentrations of duloxetine (1, 10, 25, 50, 100 and 200 μL). The optical density (OD) of the MTT reac-tion was measured on a microplate ELISA reader at 570 nm. All experiments were repeated two times and each treatment was run in triplicate. The percentage of cell viability was calculated using the equation: [mean (OD) of treated cells/mean OD of control cells (1%DMSO)] ×100(26).
Micronucleus assayFresh blood was collected from 10 healthy, no smoking, no
alcoholic, male donors aged between 25–35 years by venipuncture in heparinized falcons. 0.5 mL of whole blood was added to 4.5 mL of Roswell Park Memorial Institute (RPMI) culture medium 1640 supplemented with 10% fetal bovine serum containing L-glutamine, antibiotics, and phytohemagglutinin (PHA), and different doses of duloxetine (1, 10, 25, 50, 100 and 200 μL). The binucleated lymphocytes were harvested 28h after adding Cytochalasin B (Cyt-B) (Sigma, Missouri, USA); they were treated by hypotonic KCl (0.075M) to red blood cell (RBC) lysis. Then fixative solution (methanol: acetic acid =6:1) was added to the cells prior to slide preparation and staining. For slide preparation, 2–3 drops of cell suspension were thrown on a clean slide. The slides were stained with Giemsa solution (4%) for 7–10 mins. They were observed at 40× and 100× magnifications using a light microscope to estimate mitotic index (the cells with 2 or more nuclei per 1000 observed cells) and micronuclei frequency (the number of micronuclei in 1000 binucleated cells) are lymphocytes that were once divided by mitosis. The experiment was performed two times. Mitotic Index has a direct relation with cells’ proliferative activity(27).
Statistical analysisOne way analysis of variance and Tukey’s honestly significant
differences (HSD) test were used for multiple comparisons of data. P value less than 0.05 was considered as significant. The IC50 (half maximal inhibitory concentration) values were calculated by PRISM software using nonlinear regression. Standard deviations represent average results of double experiments. The IC50 values were compared using the Student’s t-test measuring the effective-ness of a substance to cause cell death or inhibit cell growth. Therefore, the lower amount of IC50 represents a higher toxicity of a compound, which leads to death or inhibition of cell growth.
RESULTS
MTT assayThe IC50 of duloxetine on MKN45 and NIH3T3 cell lines were
examined using MTT assay. The IC50 of duloxetine on MKN45 cancer cell line was 40.41 μg/mL and on NIH3T3 cell line was 15.79 μg/mL, which implies that the IC50 of duloxetine related to the NIH3T3 cell line was lower than the MKN45 cell line. The evaluated IC50 of cisplatin on MKN45 cell line was 12.49 μg/mL and on NIH3T3 cell line was 24.9 μg/mL. A lower IC50 value is representative of the higher ability of a cytotoxic compound to cause cell death or inhibit cell growth(28). It means that the inhibitory effect of growth and the most cytotoxicity of the drug are on the normal cell line in comparison with the cancer cell line. The results of the MKN45 cell line (TABLE 1 and FIGURE 1) demonstrated that duloxetine compared to the negative control group had more cytotoxic effects at 25, 50, 100, 200 μM and no significant differ-ence at 1 and 10 μM concentrations. Compared to the positive
TABLE1. Effect of duloxetine on MKN45 and NIH3T3 cell viability.
Mean ± SD Control 1 10 25 50 100 200 Cisplatin
Effect of duloxetine on MKN45 cell viability
100.0±1.860 95.73±3.889 92.98±6.905 78.44±3.628 59.71±6.628 36.98±2.235 27.89±2.893 38.57±2.996
Effect of duloxetine on NIH3T3 cell viability
100.0±2.214 95.81±1.069 78.30±1.131 50.77±1.324 47.13±1.117 44.41±1.390 39.34±0.5759 41.56±1.467
FIGURE 1. Effects of duloxetine on NIH3T3 cell viability {a: significant difference compared to the negative control group; b: significant difference compared to the positive control group (P<0.05)}.

Hassani M, Ghassemi-Barghi N, Modanloo M, Mohammadpour A, Shokrzadeh M.Cytotoxic effects of duloxetine on MKN45 and NIH3T3 cell lines and genotoxic effects on human peripheral blood lymphocytes
374 • Arq Gastroenterol • 2019. v. 56 nº 4 out/dez
control group (cisplatin), it had less cytotoxic effects at 1, 10, 25, 50 μM and no significant difference at 100 and 200 μM (P<0.05). In addition, the results of the NIH3T3 cell line (TABLE 1 and FIGURE 2) showed that duloxetine in comparison with the nega-tive control group was significantly different in all concentrations; it means that it had more cytotoxic effects in every data. Moreover, in comparison with the positive control group, it had less cytotoxic effects at 1, 10, 25, 50 μM and no significant difference at 100 and 200 μM concentrations (P<0.05).
caused by this drug was also evaluated using MN assay. The IC50 of duloxetine on MKN45 cancer cell line and NIH3T3 cell line was calculated 40.41 μg/mL and 15.79 μg/mL respectively. However, the IC50 of cisplatin on MKN45 is 12.49 μg/mL and on NIH3T3 cell line is 24.9 μg/mL. The lower IC50 value is representa-tive of the higher ability of a cytotoxic compound to cause cell death or inhibit cell growth. As reported here, the dose-dependent cytotoxicity of duloxetine on MKN45 cancer cell line is consist-ent with some other researches(3,8). The cytotoxic effects of the seven most commonly prescribed antidepressants was evaluated on MCF-7 breast cancer cell line(13,29). Their results showed that Sertraline was the most potent drug in growth inhibition and had to be further analyzed(3). The anti-tumor effects of four SSRIs and two SNRIs on HepG2 cells were compared as well, and the IC50 reduced relatively in the order of sertraline, paroxetine, du-loxetine, fluvoxamine, escitalopram, and milnacipran(8,30). Besides, the anti-viability effects of some drugs were fully proved on the proliferation of MKN45 cell line(20-24). Nonetheless, by compar-ing the cytotoxic effects and the IC50 of duloxetine on MKN45 and NIH3T3 cell lines it was shown that the cytotoxic effects of duloxetine on NIH3T3 normal cell line was higher than MKN45 cancer cell line. Taken together, it seems that duloxetine in the concentrations presented in this research could not be considered as a better choice for MKN45 gastric cancer therapy. Additionally, we used lymphocytes in our in vitro studies to assess the potential genotoxic effect of duloxetine. Results from the micronucleus as-say confirmed the ability of duloxetine to induce the formation of micronuclei. The induction of micronuclei is commonly used to evaluate the chromosomal damage. The cellular and tissue
FIGURE 2. Effects of duloxetine on NIH3T3 cell viability {a: significant difference compared to the negative control group; b: significant difference compared to the positive control group (P<0.05)}.
Micronucleus assayThe genotoxic effects of duloxetine were studied based on
the number of MN produced in peripheral blood lymphocytes following treatment with different concentrations of duloxetine (TABLE 2 and FIGURE 3). Results showed that the MN number was relatively increased based on the increase in the duloxetine concentration. Fifty-μM concentration of duloxetine did not produce any significant difference in MN number relative to the control group. While, 100 and 200 μM concentrations of duloxetine significantly increased the number of MN. Comparison of different concentrations of duloxetine and cisplatin showed that treatment of lymphocytes with 50 and 100 μM of duloxetine significantly decreased the number of MN. Two hundred-μM concentration of duloxetine did not produce any significant difference in MN number relative to the cisplatin (P<0.05).
DISCUSSION
In this study, the cytotoxic effect of duloxetine on MKN45 gastric cancer cell line was investigated and compared to NIH3T3 normal cell line by MTT assay. The NIH3T3 cell line used in this study is the murine embryonic fibroblast, which is a standard and reliable source for these studies. Moreover, the genetic damage
TABLE2. Micronuclei frequency in different concentrations of duloxetine.
Control Duloxetine 50 Duloxetine 100 Duloxetine 200 Cisplatin
Mean ± SD 0.6667±0.5774 4.667±2.082 11.00±1.000 16.67±2.082 17.67±3.055
FIGURE 3. Micronuclei frequency in different concentrations of dulo-xetine {a: significant difference compared to the negative control group; b: significant difference compared to the positive control group (P<0.05)}.

Hassani M, Ghassemi-Barghi N, Modanloo M, Mohammadpour A, Shokrzadeh M.Cytotoxic effects of duloxetine on MKN45 and NIH3T3 cell lines and genotoxic effects on human peripheral blood lymphocytes
Arq Gastroenterol • 2019. v. 56 nº 4 out/dez • 375
toxicity was observed in the increased therapeutic concentrations of duloxetine. duloxetine and its metabolites can bind DNA, caus-ing damage that can result in chromosome breaks, micronucleus formation, and cell death. As evident, duloxetine induced DNA damage to human lymphocytes compared to the negative control group except at 50 μM concentration. In addition, this drug had no significant difference with cisplatin at 200 μM concentration, but it had a low genotoxicity at 100 and 50 μM concentrations (P<0.05). It confirmed that this drug is safe to be used at these concentrations. A recent report in mouse bone marrow was made to evaluate the capacity of three doses of duloxetine (2, 20, and 200 mg/kg). Their results indicated a moderate but significant increase of SCE (sister chromatid exchanges) with three concentrations tested, no effect regarding the mitotic index and a small reduction in the proliferation kinetics(5,31). Also the possible genotoxic potential of duloxetine was explored by evaluating structural chromosomal aberrations, mitotic index, nuclear division index, index binuclea-tion, number of cells (with one, two, three and four micronuclei) and the number of cells with nucleoplasmic bridges. As the positive control, Cyclophosphamide (6 μg/mL) and different concentrations of duloxetine (10–150 ng/mL) were applied on primary cultures of blood lymphocytes. Their results showed that the cultures incubated with duloxetine indices had lower scores suggesting a degree of the drug cytotoxicity. However, a significant increase in the presence of chromosomal aberrations and micronuclei was observed only by the concentrations of 100 and 150 ng/mL. It should be noted these concentrations were close to the upper limit of the therapeutic range of the drug used in humans (Araújo, 2014). Our genotoxic studies were in line with the past studies earlier mentioned.
CONCLUSION
In conclusion, given that, this is the first time that cytogenetic study of duloxetine was evaluated and compared in MKN45 and NIH3T3 cell lines, based on the results of this study and com-parisons with cisplatin in these concentrations, its value is low. Because the higher IC50 shows less power of sample in killing cells or inhibiting their growth. In addition, the genetic damage caused by duloxetine in blood lymphocytes had no significant difference with cisplatin at higher concentrations.
ACKNOWLEDGEMENT
This research was supported/partially supported by Sana institute of high education. We thank our colleagues from Mehdi Abbasi Roshan who provided insight and expertise.
Authors’ contributionShokrzadeh M: study design and management. Modanloo M:
MTT assay. Mohammadpour A: MN assay. Ghassemi-Barghi N: writing article. Hassani M: MN assay. All authors read and ap-prove final manuscript.
OrcidMelika Hassani. Orcid: 0000-0001-5762-4736.Nasrin Ghassemi-Barghi. Orcid: 0000-0002-0673-4262.Mona Modanloo. Orcid: 0000-0001-7526-4009.Abbas Mohammadpour. Orcid: 0000-0003-2797-1766Mohammad Shokrzadeh. Orcid: 0000-0002-0071-6530.
Hassani M, Ghassemi-Barghi N, Modanloo M, Mohammadpour A, Shokrzadeh M. Efeitos citotóxicos da duloxetina nas linhagens celulares MKN45 e NIH3T3 e efeitos genotóxicos em linfócitos sanguíneos periféricos humanos. Arq Gastroenterol. 2019;56(4):372-6.RESUMO – Contexto – O câncer gástrico é a segunda principal causa de morte relacionada ao câncer globalmente. Infelizmente, a taxa de sobrevivência
dos pacientes com câncer gástrico que se submeteram à quimioterapia após a cirurgia, tem sido inferior à metade. Além disso, a quimioterapia tem muitos efeitos colaterais. Evidências atuais sugerem que alguns antidepressivos como a duloxetina têm efeitos inibidores de crescimento contra um número de linhas de células cancerosas. Objetivo – Assim, o objetivo deste estudo foi determinar os efeitos citotóxicos e genotóxicos da duloxetina sobre o câncer gástrico. Métodos – A este respeito, a citotoxicidade e a genotoxicidade da duloxetina foram investigadas em linhas celulares MKN45 e NIH3T3 por ensaio de MTT e por ensaio de MN em linfócitos periféricos de sangue. Para este efeito, as células foram cultivadas em 96 placas. Soluções de estoque de duloxetina e cisplatina foram preparadas. Após incubação celular com diferentes concentrações de duloxetina (1, 10, 25, 50, 100 e 200 μL), a solução de MTT foi adicionada. Para o teste do micronúcleo o sangue fresco foi adicionado ao meio de cultura RPMI 1640 suple-mentado, e as concentrações diferentes de duloxetina (1, 10, 25, 50, 100 e 200 μL) foram adicionadas. Resultados – A citotoxicidade da duloxetina na linha celular cancerosa MKN45 e NIH3T3 linha celular normal foram estudadas e seguidas pelo ensaio de MTT. A duloxetina exibiu maior IC
50
nas células MKN45 em comparação com as células NIH3T3. Além disso, o efeito genotóxico da duloxetina foi avaliado pelo ensaio de micronúcleos. Os resultados revelaram que a duloxetina induziu mais dano de DNA em 100 e 200 μM e não houve diferença significativa em 200 μM em relação à cisplatina, mas teve menos efeitos genotóxicos nas concentrações de 100 e 50 μM. Conclusão – Embora, neste estudo, a duloxetina tenha menos genotoxicidade do que a cisplatina em concentrações inferiores a 200 μm e também tenha mostrado efeitos citotóxicos, devido ao seu IC50, não pode ser considerada como uma escolha terapêutica melhor para o câncer gástrico no que diz respeito à cisplatina como uma droga anticâncer comum.
DESCRITORES – Neoplasias gástricas, tratamento farmacológico. Antineoplásicos. Antipsicóticos. Cloridrato de duloxetina, toxicidade. Cisplatino.

Hassani M, Ghassemi-Barghi N, Modanloo M, Mohammadpour A, Shokrzadeh M.Cytotoxic effects of duloxetine on MKN45 and NIH3T3 cell lines and genotoxic effects on human peripheral blood lymphocytes
376 • Arq Gastroenterol • 2019. v. 56 nº 4 out/dez
REFERENCES
1. Carcas LP. Gastric cancer review. J Carcinog. 2014;13:14.2. Mazani M, Hadizadeh SH, Najafzadeh N, Amani M, Mansouri Torshizi H.
Anticancer effects of new palladium complexes on gastric cancer cell line. Jour Guilan Uni Med Sci. 2014. 23:72-9.
3. Bavadekar S, Panchal P, Hanbashi A, Vansal S. Cytotoxic effects of selective serotonin-and serotonin-norepinephrine reuptake inhibitors on human metastatic breast cancer cell line, MCF-7 (842.3). FASEB J. 2014;28(1 Supplement):842-3.
4. Huang J, Zhao D, Liu Z, Liu F. Repurposing psychiatric drugs as anti-cancer agents. Cancer Lett. 2018;419:257-65.
5. Madrigal-Bujaidar E, Álvarez-González I, Madrigal-Santillán EO, Mo-rales-González JA. Evaluation of duloxetine as micronuclei inducer in an acute and a subchronic assay in mouse. Biol Pharm Bull. 2015;38:1245-9.
6. Araújo DBD. Genotoxicidade humana e fármacos antidepressivos: avaliação da duloxetina em culturas de linfócitos. Universidade Federal do Pará, 2014. pp.56.
7. Pergolizzi JV Jr, Raffa RB, Taylor R Jr, Rodriguez G, Nalamachu S, Langley P. A review of duloxetine 60 mg once‐daily dosing for the management of diabetic peripheral neuropathic pain, fibromyalgia, and chronic musculoskeletal pain due to chronic osteoarthritis pain and low back pain. Pain Pract. 2013;13:239-52.
8. Kuwahara J, Yamada T, Egashira N, Ueda M, Zukeyama N, Ushio S, Masuda S. Comparison of the anti-tumor effects of selective serotonin reuptake inhibitors as well as serotonin and norepinephrine reuptake inhibitors in human hepatocellular carcinoma cells. Biol Pharm Bull. 2015;38:1410-4.
9. Mohammadi H, Ghassemi-Barghi N, Malakshah O, Ashari S. Pyrethroid expo-sure and neurotoxicity: a mechanistic approach. Arh Hig Rada Toksikol. 2019; 70:74-89.
10. Ho WY, Yeap SK, Ho CL, Rahim RA, Alitheen NB. Development of multicellular tumor spheroid (MCTS) culture from breast cancer cell and a high throughput screening method using the MTT assay. PLoS One. 2012;7:e44640.
11. Ko H, Jeong Y, Kim M. Cytotoxicities and genotoxicities of cements based on calcium silicate and of dental formocresol. Mutat Res. 2017;815:28-34.
12. Ghassemi-Barghi N, Varshosaz J, Etebari M, Jafarian Dehkordi A. Role of recom-binant human erythropoietin loading chitosan-tripolyphosphate nanoparticles in busulfan-induced genotoxicity: Analysis of DNA fragmentation via comet assay in cultured HepG2 cells. Toxicol In Vitro. 2016;36:46-52.
13. Shokrzadeh M, Mohammadpour A, Hoseini V, Abediankenari S, Ghassemi-Bar-ghi N, Tabari YS. Serum cytokine of IL-2, IL-10 and IL-12 levels in patients with stomach adenocarcinoma. Arq Gastroenterol. 2018;55:385-9.
14. Kirsch-Volders M, Plas G, Elhajouji A, Lukamowicz M, Gonzalez L, Vande Loock K, Decordier I. The in vitro MN assay in 2011: origin and fate, biolog-ical significance, protocols, high throughput methodologies and toxicological relevance. Arch Toxicol. 2011;85:873-99.
15. Shokrzadeh M, Ghassemi-Barghi N. Melatonin loading chitosan-tripolyphos-phate nanoparticles: Application in attenuating etoposide-induced genotoxicity in HepG2 cells. Pharmacology. 2018;102:74-80.
16. Coates A, Abraham S, Kaye SB, Sowerbutts T, Frewin C, Fox RM, Tattersall MH. On the receiving end- -patient perception of the side-effects of cancer chemotherapy. Eur J Cancer Clin Oncol. 1983;19:203-8.
17. Griffin AM, Butow PN, Coates AS, Childs AM, Ellis PM, Dunn SM, Tattersall MH. On the receiving end V: patient perceptions of the side effects of cancer chemotherapy in 1993. Ann Oncol. 1996;7:189-95.
18. Florea AM, Büsselberg D. Cisplatin as an anti-tumor drug: cellular mechanisms of activity, drug resistance and induced side effects. Cancers (Basel). 2011;3:1351-71.
19. Chen Y, Wan Y, Wang Y, Zhang H, Jiao Z. Anticancer efficacy enhancement and attenuation of side effects of doxorubicin with titanium dioxide nanoparticles. Int J Nanomedicine. 2011;6:2321-6.
20. Yoo HW1, Suh ME, Park SW. Synthesis and cytotoxicity of 2-methyl-4, 9-dihy-dro-1-substituted-1H-imidazo[4,5-g]quinoxaline-4,9-diones and 2,3-disubstitut-ed-5,10-pyrazino[2,3-g]quinoxalinediones. J Med Chem. 1998;41:4716-22.
21. Hill BT, Whelan RD, Shellard SA, McClean S, Hosking LK. Differential cytotoxic effects of docetaxel in a range of mammalian tumor cell lines and certain drug resistant sublines in vitro. Invest New Drugs. 1994;12:169-82.
22. Shao QS, Ye ZY, Ling ZQ, Ke JJ. Cell cycle arrest and apoptotic cell death in cultured human gastric carcinoma cells mediated by arsenic trioxide. World J Gastroenterol. 2005;11:3451-6.
23. Bailly C, Qu X, Chaires JB, Colson P, Houssier C, Ohkubo M, et al. Substitution at the F-ring N-imide of the indolocarbazole antitumor drug NB-506 increases the cytotoxicity, DNA binding, and topoisomerase I inhibition activities. J Med Chem. 1999;42:2927-35.
24. Toiyama Y, Tanaka K, Konishi N, Mohri Y, Tonouchi H, Miki C, Kusunoki M. Administration sequence-dependent antitumor effects of paclitaxel and 5-fluorouracil in the human gastric cancer cell line MKN45. Cancer Chemother Pharmacol. 2006;57:368-75.
25. Ghassemi-Barghi N, Etebari M, Jafarian-Dehkordi A. Protective effect of am-ifostine on busulfan induced DNA damage in human hepatoma cells. Toxicol Mech Methods. 2017;27:52-7.
26. Abel SDA, Baird SK. Honey is cytotoxic towards prostate cancer cells but interacts with the MTT reagent: considerations for the choice of cell viability assay. Food Chem. 2018;241:70-8.
27. Huang ZH, Li N, Rao KF, Liu CT, Huang Y, Ma M, Wang ZJ. Development of a data-processing method based on Bayesian k-means clustering to discriminate aneugens and clastogens in a high-content micronucleus assay. Hum Exp Toxicol. 2018;37:285-94.
28. Saravi SS, M Shokrzadeh, Hosseini Shirazi F. Cytotoxicity of Sambucus ebulus on cancer cell lines and protective effects of vitamins C and E against its cytotoxicity on normal cell lines. African Journal of Biotechnology, 2013;12:3360-5.
29. Mohammadi H, Ghassemi-Barghi N, Malakshah O, Ashari S. Pyrethroid expo-sure and neurotoxicity: a mechanistic approach. Arh Hig Rada Toksikol. 2019; 70:74-89.
30. Shokrzadeh M, Ghassemi-Barghi N. Genoprotective Effects of Amifostine against Mitomycin C-induced Toxicity in Human Hepatoma Cells. Int J Cancer Res Ther. 2018;3(2):1-5.
31. Shokrzadeh M, Ghassemi-Barghi N. Antioxidant and Genoprotective Effects of Amifostine against Irinotecan Toxicity in Human Hepatoma Cells. Int J Cancer Res Ther. 2018;3(1):1-5.

AHEAD OF PRINTORIGINAL ARTICLE
Arq Gastroenterol • 2019. v. 56 nº 4 out/dez • 377
INTRODUCTION
Esophageal cancer treatment is based on neoadjuvant chemo-radiotherapy followed by surgery in most potentially curable esophageal cancer(1,2). Esophagectomy usually presents high post-operative morbidity and mortality, and certain complications may even influence long-term survival(3).
Accumulating evidence shows that preoperative hematologi-cal biomarkers from routine complete blood count, such as red cell distribution width (RDW), neutrophil-to-lymphocyte ratio (NLR), platelet-to-lymphocyte ratio (PLR), and mean corpuscular volume (MCV) may predict long-term outcomes in cancer(4-14). For esophageal cancer, preoperative NLR before surgery predicts over-all survival (OS) and disease-free survival (DFS)(15). Postoperative NLR elevation after surgery may also predict early postoperative outcomes in esophageal cancer(16).
The value of cellular blood components prior to neoadjuvant therapy and prior to surgery in the setting of trimodal therapy for esophageal cancer in predicting early postoperative complications and mortality has not been reported, and is the aim of this study.
Lymphocyte count and platelet volume predicts postoperative complications in esophagectomy for cancer: a cohort studyFrancisco TUSTUMI, Flávio Roberto TAKEDA, Antonio Adolfo Guerra Soares BRANDÃO, Rubens Antonio Aissar SALLUM, Ulysses RIBEIRO JUNIOR and Ivan CECCONELLO
Received 28/6/2019Accepted 15/8/2019
ABSTRACT – Background – Biomarkers from routine complete blood count are known predictive factors of long-term outcomes in cancer patients. The value of these biomarkers in the setting of trimodal therapy for esophageal cancer in predicting early postoperative outcomes is not studied. Objective – The present study evaluated the value of cellular blood components changes during neoadjuvant chemoradiotherapy followed by curative intent esophagectomy for cancer in predicting postoperative mortality and morbidity. Methods – A cohort of 149 consecutive patients that underwent chemoradiotherapy using platinum- and taxane-based regimens followed by esophagectomy was analyzed. Cellular components of blood collected before neoadjuvant therapy (period A) and before surgery (period B) were assessed for postoperative mortality and complications. Univariate and multivariate Cox regression models were applied to evaluate the independent prognostic significance of blood count variables. Results – Postoperative morbidity was present in 46% of the patients. On multiple regression analysis platelet volume (B) (OR: 1.53; 95% CI: 1.2–2.33) was an independent predictor of general complications. Severe postoperative surgical complications were present in 17% of the patients. On multiple regression analysis, lymphocyte decrease between B-A periods (OR: 0.992; 95% CI: 0.990–0.997) was related to higher risk for severe complications. Cervical anastomotic leakage was present in 25.6% of the patients. On univariate analysis eosinophil count in A and B periods was related to cervical anastomotic leakage. For this outcome, multivariate joint model could not identify independent risk variables of cellular components of blood. The 30-day mortality rate was 7.4%. On univariate analysis, platelet count in period B was associated to higher risk for mortality. The multivariate joint model could not accu-rately predict mortality due to the few number of patients in the mortality group. Conclusion – This is the first study to assess the relationship between peripheral blood count variables changes during neoadjuvant chemoradiotherapy using a platinum- and taxane-based regimen followed by curative intent esophagectomy for cancer in predicting postoperative complications. The platelet volume prior to surgery is related to postoperative complications and the lymphocyte count change prior to surgery predicts severe postoperative complications in the setting of trimodal therapy for esophageal cancer.
HEADINGS – Esophageal neoplasms. Neoadjuvant therapy. Blood cells. Leukocytes. Blood platelets. Lymphocytes. Neutrophils.
Declared conflict of interest of all authors: noneDisclosure of funding: no funding receivedUniversidade de São Paulo, Divisão de Cirurgia Digestiva, Departamento de Gastroenterologia, São Paulo, SP, Brasil.Corresponding author: Francisco Tustumi. Email: [email protected]
METHODS
A retrospective cohort was performed, assessing the correla-tion of cellular components of blood and their changes during trimodal therapy for esophageal carcinoma with postoperative mortality and postoperative complications. Consecutive patients of a single institute with completion of neoadjuvant chemoradio-therapy using platinum- and taxane-based regimens, followed by curative intent esophagectomy, were selected. Peripheral blood was obtained in two different moments: before neoadjuvant therapy (A); and before surgery (1-7 days) (B). Blood test was not collected during acute infectious disease, neither during targeted antitumor therapy.
Recruitment included 2009 to 2019 period. Patients were staged with endoscopy, CT-scan, and PET-scan prior to neoad-juvant therapy and classified accordingly to the 8th edition of UICC staging(17). Patients were followed with clinical evaluation, peripheral blood analysis, CT-scan and endoscopy. Complications were classified accordingly to the international consensus on standardization of data collection for complications associated
AG-2019-93dx.doi.org/10.1590/S0004-2803.201900000-70

Tustumi F, Takeda FR, Brandão AAGS, Sallum RAA, Ribeiro Junior U, Cecconello I.Lymphocyte count and platelet volume predicts postoperative complications in esophagectomy for cancer: a cohort study
378 • Arq Gastroenterol • 2019. v. 56 nº 4 out/dez
with esophagectomy(18) and Clavien-Dindo classification(19). Patho-logical response to neoadjuvant therapy was graded accordingly to Ryan score(20). The local ethics committee approved the study.
Statistical analysisFor absolute and relative variable, chi-square test, Fisher test or
likelihood-ratio test were used for each outcome. Multivariate Cox proportional hazard analysis was performed to determine independ-ent risk factors for the outcomes. Only variables that were significant (P<0.1) on univariate analysis were included as co-variables in the multivariable analyses. Data were assessed with IBM-SPSS software version 20.0, and a significance level of 0.05 was adopted.
Ethics approval and consent to participateThis study was approved by local Ethics Committee (CAPEPesq).
RESULTS
Patients’ baseline characteristicsOne hundred and forty-nine consecutive patients underwent
neoadjuvant chemoradiotherapy using platinum- and taxane-based regimens followed by esophagectomy and were included. The mean age was 60.9 years (SD±8.6), with male predominance (75.8%). There were 117 transthoracic (video-assisted thoraco-scopic) procedures and 32 transhiatal procedures, all of them with cervical anastomosis. The median time from completion of neoadjuvant chemoradiotherapy to surgery was 13 weeks (IQR 8). The two chemotherapy regimens adopted were carboplatin and paclitaxel (75.2%), and cisplatin and paclitaxel (24.8%). The radiation therapy dosage was 41.4 cGy (75%), 45 cGy (13.5%), and 50.4 cGy (11.5%).
General postoperative complicationsThe postoperative morbidity was present in 46% of the pa-
tients. Clinical postoperative complications, such as pneumonia, cardiovascular events, respiratory failure, thromboembolic events, were present in 22% of the patients. Surgical complications, such as bleeding, chylothorax, cervical anastomotic leak, were present in 35.5% of the patients.
On univariate analysis age was related to general postoperative complications. Before surgery (period B), platelet volume was also related to general complications. On multiple regression analysis, age (OR: 1.05; 95% CI: 1.01-1.1; P=0.019) and platelet volume (B) (OR: 1.53; 95% CI: 1.2-2.33; P=0.045) were independent predic-tors of general complications (TABLE 1 and FIGURE 1). The predictive model for general complications can be expressed by the following equation: equation = exp (-7.3+0.049 x Age+0.423 x Platelet Volume (B)) / (1+exp (-7.3+0.049 x Age+0.423 x Platelet Volume (B))).
Severe postoperative complicationsSevere postoperative complications (Clavien-Dindo ≥ IIIa) were
present in 17% of the patients.On univariate analysis transhiatal access was related to severe
postoperative complications. The decrease of lymphocytes between B-A periods was correlated to severe complications. On multiple regression analysis, surgical access (thoracoscopy: OR: 0.23; 95% CI: 0.088-0.602; P=0.003) and lymphocyte change between B-A periods (OR: 0.992; 95% CI: 0.990-0.997; P=0.046) were related to higher risk for severe complications (TABLE 2 and FIGURE 2).
The predictive model for severe complications can be expressed by the following equation = exp (-1.12–0.001 x Lymphocyte (B-A) – 1.47 (if thoracoscopy)) / (1+exp (-1.12–0.001 x Lymphocyte (B-A) – 1.47 (if thoracoscopy)).
Cervical anastomotic leakageCervical anastomotic leakage was present in 25.6% of the pa-
tients, and mostly was easily manageable and classified as grade(18) I or II (90%).
On univariate analysis grade of cellular differentiation was related to cervical anastomotic leakage. Eosinophil count in A (OR: 1.001; 95% CI: 1-1.002; P=0.011), and B (OR: 1.001; 95% CI: 0.999–1.002; P=0.038) periods was also related to cervical anastomotic leakage (TABLE 3). The multivariate joint model was performed and the risk for cervical anastomotic leakage was constant, independently of the blood cellular variables.
Postoperative mortalityThe 30-day mortality rate was 7.4%.On univariate analysis, age, histology, clinical stage, Ryan
pathological response score, and complications were related to 30-days postoperartive mortality. For cellular components of blood, all variables were not related to postoperartive mortality, but platelet count in period B (OR: 1.007; 95% CI: 0.999–1.017; P=0.017) (TABLE 4). The multivariate joint model could not accurately predict postoperative 30-day mortality due to the few number of patients in the mortality group.
DISCUSSION
Results of this cohort of 149 consecutive esophageal cancer patients that underwent neoadjuvant chemoradiotherapy using a platinum- and taxane-based regimen followed by curative intent esophagectomy suggest that mean platelet volume and lymphocyte decrease during neoadjuvant therapy are independent variables that can predict postoperative complications.
It has been well established that there is a complex relationship among tumor, systemic inflammation, and nutritional and immune status(5,11,21-23) that may influence in surgical complications risks(24-26).
Cancer cells release growth factors and inflammatory media-tors that stimulate production and activation of peripheral blood platelets(27,28). Increased mean platelet volume is an early index of activated platelets(29). In our study, mean platelet volume was related to higher risk for general complications, although the peripheral platelet count was not related to higher risk for complications.
Lymphocyte decrease in cancer patients reflects host immune function due to hormonal change, malnutrition, antitumor immune response, or may be due to chemotherapy induced depletion(30-36). Lymphopenia has strong relationship with lower heart ejection fraction postoperatively(37), major adverse cardiac outcomes(38-40) and infectious complications(36). In the present study, lymphocyte decrease between B and A periods increases the risk for severe postoperative complications. Despite lymphopenia may also reflect radiation therapy side effect(41), in the present radiation dose did not influence morbidity.
Although previous studies reported that preoperative NLR might predict severe postoperative complications for colorectal, head and neck, and gastric surgery(26,42-46), in the present study NLR and PLR were not related to postoperative complications in esophageal carcinoma.
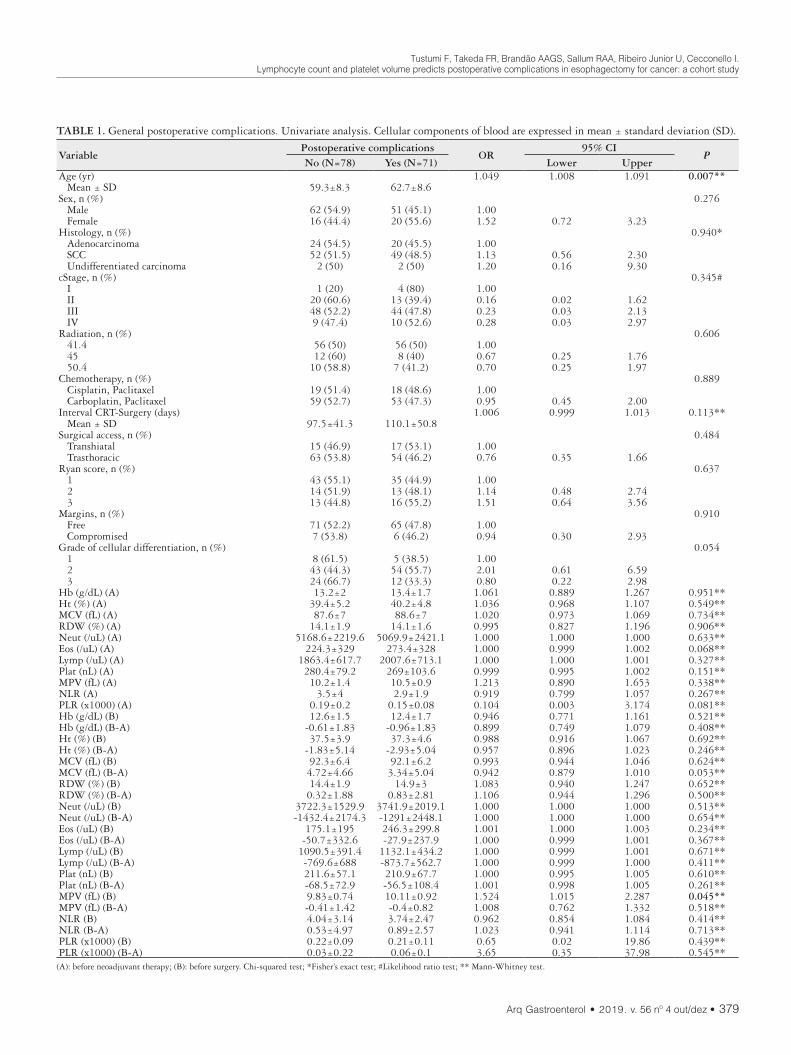
Tustumi F, Takeda FR, Brandão AAGS, Sallum RAA, Ribeiro Junior U, Cecconello I.Lymphocyte count and platelet volume predicts postoperative complications in esophagectomy for cancer: a cohort study
Arq Gastroenterol • 2019. v. 56 nº 4 out/dez • 379
TABLE 1. General postoperative complications. Univariate analysis. Cellular components of blood are expressed in mean ± standard deviation (SD).
VariablePostoperative complications
OR95% CI
PNo (N=78) Yes (N=71) Lower Upper
Age (yr) 1.049 1.008 1.091 0.007** Mean ± SD 59.3±8.3 62.7±8.6Sex, n (%) 0.276 Male 62 (54.9) 51 (45.1) 1.00 Female 16 (44.4) 20 (55.6) 1.52 0.72 3.23Histology, n (%) 0.940* Adenocarcinoma 24 (54.5) 20 (45.5) 1.00 SCC 52 (51.5) 49 (48.5) 1.13 0.56 2.30 Undifferentiated carcinoma 2 (50) 2 (50) 1.20 0.16 9.30cStage, n (%) 0.345# I 1 (20) 4 (80) 1.00 II 20 (60.6) 13 (39.4) 0.16 0.02 1.62 III 48 (52.2) 44 (47.8) 0.23 0.03 2.13 IV 9 (47.4) 10 (52.6) 0.28 0.03 2.97Radiation, n (%) 0.606 41.4 56 (50) 56 (50) 1.00 45 12 (60) 8 (40) 0.67 0.25 1.76 50.4 10 (58.8) 7 (41.2) 0.70 0.25 1.97Chemotherapy, n (%) 0.889 Cisplatin, Paclitaxel 19 (51.4) 18 (48.6) 1.00 Carboplatin, Paclitaxel 59 (52.7) 53 (47.3) 0.95 0.45 2.00Interval CRT-Surgery (days) 1.006 0.999 1.013 0.113** Mean ± SD 97.5±41.3 110.1±50.8Surgical access, n (%) 0.484 Transhiatal 15 (46.9) 17 (53.1) 1.00 Trasthoracic 63 (53.8) 54 (46.2) 0.76 0.35 1.66Ryan score, n (%) 0.637 1 43 (55.1) 35 (44.9) 1.00 2 14 (51.9) 13 (48.1) 1.14 0.48 2.74 3 13 (44.8) 16 (55.2) 1.51 0.64 3.56Margins, n (%) 0.910 Free 71 (52.2) 65 (47.8) 1.00 Compromised 7 (53.8) 6 (46.2) 0.94 0.30 2.93Grade of cellular differentiation, n (%) 0.054 1 8 (61.5) 5 (38.5) 1.00 2 43 (44.3) 54 (55.7) 2.01 0.61 6.59 3 24 (66.7) 12 (33.3) 0.80 0.22 2.98Hb (g/dL) (A) 13.2±2 13.4±1.7 1.061 0.889 1.267 0.951**Ht (%) (A) 39.4±5.2 40.2±4.8 1.036 0.968 1.107 0.549**MCV (fL) (A) 87.6±7 88.6±7 1.020 0.973 1.069 0.734**RDW (%) (A) 14.1±1.9 14.1±1.6 0.995 0.827 1.196 0.906**Neut (/uL) (A) 5168.6±2219.6 5069.9±2421.1 1.000 1.000 1.000 0.633**Eos (/uL) (A) 224.3±329 273.4±328 1.000 0.999 1.002 0.068**Lymp (/uL) (A) 1863.4±617.7 2007.6±713.1 1.000 1.000 1.001 0.327**Plat (nL) (A) 280.4±79.2 269±103.6 0.999 0.995 1.002 0.151**MPV (fL) (A) 10.2±1.4 10.5±0.9 1.213 0.890 1.653 0.338**NLR (A) 3.5±4 2.9±1.9 0.919 0.799 1.057 0.267**PLR (x1000) (A) 0.19±0.2 0.15±0.08 0.104 0.003 3.174 0.081**Hb (g/dL) (B) 12.6±1.5 12.4±1.7 0.946 0.771 1.161 0.521**Hb (g/dL) (B-A) -0.61±1.83 -0.96±1.83 0.899 0.749 1.079 0.408**Ht (%) (B) 37.5±3.9 37.3±4.6 0.988 0.916 1.067 0.692**Ht (%) (B-A) -1.83±5.14 -2.93±5.04 0.957 0.896 1.023 0.246**MCV (fL) (B) 92.3±6.4 92.1±6.2 0.993 0.944 1.046 0.624**MCV (fL) (B-A) 4.72±4.66 3.34±5.04 0.942 0.879 1.010 0.053**RDW (%) (B) 14.4±1.9 14.9±3 1.083 0.940 1.247 0.652**RDW (%) (B-A) 0.32±1.88 0.83±2.81 1.106 0.944 1.296 0.500**Neut (/uL) (B) 3722.3±1529.9 3741.9±2019.1 1.000 1.000 1.000 0.513**Neut (/uL) (B-A) -1432.4±2174.3 -1291±2448.1 1.000 1.000 1.000 0.654**Eos (/uL) (B) 175.1±195 246.3±299.8 1.001 1.000 1.003 0.234**Eos (/uL) (B-A) -50.7±332.6 -27.9±237.9 1.000 0.999 1.001 0.367**Lymp (/uL) (B) 1090.5±391.4 1132.1±434.2 1.000 0.999 1.001 0.671**Lymp (/uL) (B-A) -769.6±688 -873.7±562.7 1.000 0.999 1.000 0.411**Plat (nL) (B) 211.6±57.1 210.9±67.7 1.000 0.995 1.005 0.610**Plat (nL) (B-A) -68.5±72.9 -56.5±108.4 1.001 0.998 1.005 0.261**MPV (fL) (B) 9.83±0.74 10.11±0.92 1.524 1.015 2.287 0.045**MPV (fL) (B-A) -0.41±1.42 -0.4±0.82 1.008 0.762 1.332 0.518**NLR (B) 4.04±3.14 3.74±2.47 0.962 0.854 1.084 0.414**NLR (B-A) 0.53±4.97 0.89±2.57 1.023 0.941 1.114 0.713**PLR (x1000) (B) 0.22±0.09 0.21±0.11 0.65 0.02 19.86 0.439**PLR (x1000) (B-A) 0.03±0.22 0.06±0.1 3.65 0.35 37.98 0.545**(A): before neoadjuvant therapy; (B): before surgery. Chi-squared test; *Fisher’s exact test; #Likelihood ratio test; ** Mann-Whitney test.
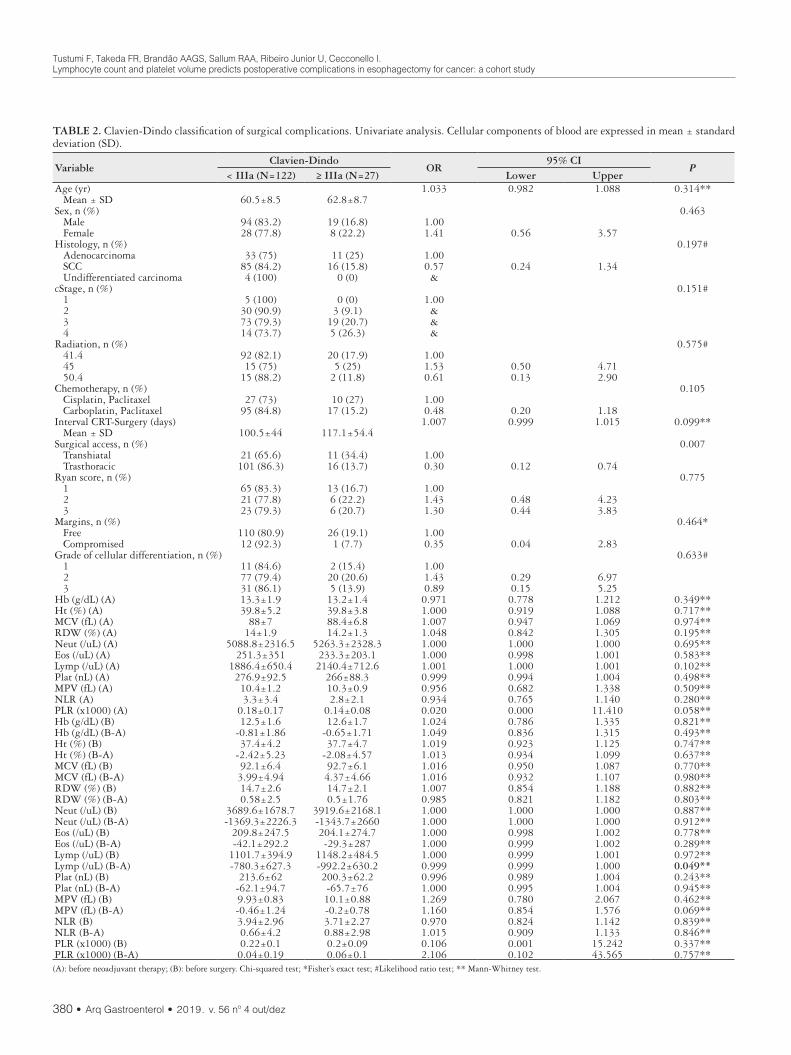
Tustumi F, Takeda FR, Brandão AAGS, Sallum RAA, Ribeiro Junior U, Cecconello I.Lymphocyte count and platelet volume predicts postoperative complications in esophagectomy for cancer: a cohort study
380 • Arq Gastroenterol • 2019. v. 56 nº 4 out/dez
TABLE 2. Clavien-Dindo classification of surgical complications. Univariate analysis. Cellular components of blood are expressed in mean ± standard deviation (SD).
VariableClavien-Dindo
OR95% CI
P< IIIa (N=122) ≥ IIIa (N=27) Lower Upper
Age (yr) 1.033 0.982 1.088 0.314** Mean ± SD 60.5±8.5 62.8±8.7Sex, n (%) 0.463 Male 94 (83.2) 19 (16.8) 1.00 Female 28 (77.8) 8 (22.2) 1.41 0.56 3.57Histology, n (%) 0.197# Adenocarcinoma 33 (75) 11 (25) 1.00 SCC 85 (84.2) 16 (15.8) 0.57 0.24 1.34 Undifferentiated carcinoma 4 (100) 0 (0) &cStage, n (%) 0.151# 1 5 (100) 0 (0) 1.00 2 30 (90.9) 3 (9.1) & 3 73 (79.3) 19 (20.7) & 4 14 (73.7) 5 (26.3) &Radiation, n (%) 0.575# 41.4 92 (82.1) 20 (17.9) 1.00 45 15 (75) 5 (25) 1.53 0.50 4.71 50.4 15 (88.2) 2 (11.8) 0.61 0.13 2.90Chemotherapy, n (%) 0.105 Cisplatin, Paclitaxel 27 (73) 10 (27) 1.00 Carboplatin, Paclitaxel 95 (84.8) 17 (15.2) 0.48 0.20 1.18Interval CRT-Surgery (days) 1.007 0.999 1.015 0.099** Mean ± SD 100.5±44 117.1±54.4Surgical access, n (%) 0.007 Transhiatal 21 (65.6) 11 (34.4) 1.00 Trasthoracic 101 (86.3) 16 (13.7) 0.30 0.12 0.74Ryan score, n (%) 0.775 1 65 (83.3) 13 (16.7) 1.00 2 21 (77.8) 6 (22.2) 1.43 0.48 4.23 3 23 (79.3) 6 (20.7) 1.30 0.44 3.83Margins, n (%) 0.464* Free 110 (80.9) 26 (19.1) 1.00 Compromised 12 (92.3) 1 (7.7) 0.35 0.04 2.83Grade of cellular differentiation, n (%) 0.633# 1 11 (84.6) 2 (15.4) 1.00 2 77 (79.4) 20 (20.6) 1.43 0.29 6.97 3 31 (86.1) 5 (13.9) 0.89 0.15 5.25Hb (g/dL) (A) 13.3±1.9 13.2±1.4 0.971 0.778 1.212 0.349**Ht (%) (A) 39.8±5.2 39.8±3.8 1.000 0.919 1.088 0.717**MCV (fL) (A) 88±7 88.4±6.8 1.007 0.947 1.069 0.974**RDW (%) (A) 14±1.9 14.2±1.3 1.048 0.842 1.305 0.195**Neut (/uL) (A) 5088.8±2316.5 5263.3±2328.3 1.000 1.000 1.000 0.695**Eos (/uL) (A) 251.3±351 233.3±203.1 1.000 0.998 1.001 0.583**Lymp (/uL) (A) 1886.4±650.4 2140.4±712.6 1.001 1.000 1.001 0.102**Plat (nL) (A) 276.9±92.5 266±88.3 0.999 0.994 1.004 0.498**MPV (fL) (A) 10.4±1.2 10.3±0.9 0.956 0.682 1.338 0.509**NLR (A) 3.3±3.4 2.8±2.1 0.934 0.765 1.140 0.280**PLR (x1000) (A) 0.18±0.17 0.14±0.08 0.020 0.000 11.410 0.058**Hb (g/dL) (B) 12.5±1.6 12.6±1.7 1.024 0.786 1.335 0.821**Hb (g/dL) (B-A) -0.81±1.86 -0.65±1.71 1.049 0.836 1.315 0.493**Ht (%) (B) 37.4±4.2 37.7±4.7 1.019 0.923 1.125 0.747**Ht (%) (B-A) -2.42±5.23 -2.08±4.57 1.013 0.934 1.099 0.637**MCV (fL) (B) 92.1±6.4 92.7±6.1 1.016 0.950 1.087 0.770**MCV (fL) (B-A) 3.99±4.94 4.37±4.66 1.016 0.932 1.107 0.980**RDW (%) (B) 14.7±2.6 14.7±2.1 1.007 0.854 1.188 0.882**RDW (%) (B-A) 0.58±2.5 0.5±1.76 0.985 0.821 1.182 0.803**Neut (/uL) (B) 3689.6±1678.7 3919.6±2168.1 1.000 1.000 1.000 0.887**Neut (/uL) (B-A) -1369.3±2226.3 -1343.7±2660 1.000 1.000 1.000 0.912**Eos (/uL) (B) 209.8±247.5 204.1±274.7 1.000 0.998 1.002 0.778**Eos (/uL) (B-A) -42.1±292.2 -29.3±287 1.000 0.999 1.002 0.289**Lymp (/uL) (B) 1101.7±394.9 1148.2±484.5 1.000 0.999 1.001 0.972**Lymp (/uL) (B-A) -780.3±627.3 -992.2±630.2 0.999 0.999 1.000 0.049**Plat (nL) (B) 213.6±62 200.3±62.2 0.996 0.989 1.004 0.243**Plat (nL) (B-A) -62.1±94.7 -65.7±76 1.000 0.995 1.004 0.945**MPV (fL) (B) 9.93±0.83 10.1±0.88 1.269 0.780 2.067 0.462**MPV (fL) (B-A) -0.46±1.24 -0.2±0.78 1.160 0.854 1.576 0.069**NLR (B) 3.94±2.96 3.71±2.27 0.970 0.824 1.142 0.839**NLR (B-A) 0.66±4.2 0.88±2.98 1.015 0.909 1.133 0.846**PLR (x1000) (B) 0.22±0.1 0.2±0.09 0.106 0.001 15.242 0.337**PLR (x1000) (B-A) 0.04±0.19 0.06±0.1 2.106 0.102 43.565 0.757**(A): before neoadjuvant therapy; (B): before surgery. Chi-squared test; *Fisher’s exact test; #Likelihood ratio test; ** Mann-Whitney test.
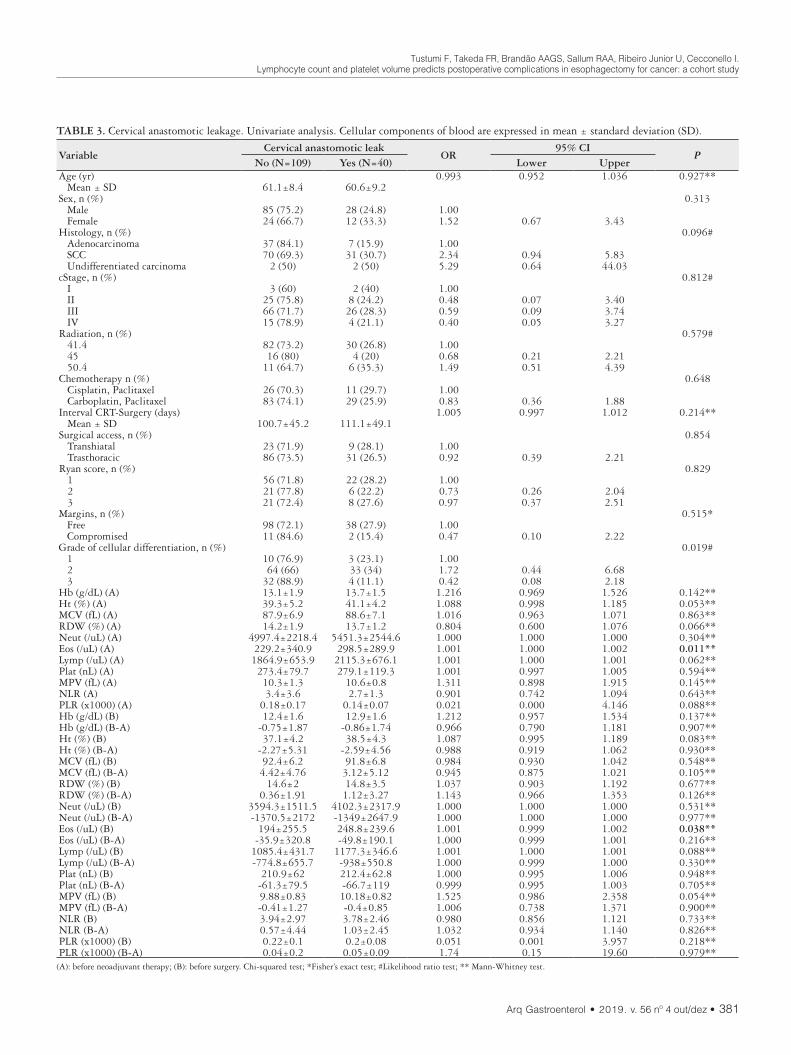
Tustumi F, Takeda FR, Brandão AAGS, Sallum RAA, Ribeiro Junior U, Cecconello I.Lymphocyte count and platelet volume predicts postoperative complications in esophagectomy for cancer: a cohort study
Arq Gastroenterol • 2019. v. 56 nº 4 out/dez • 381
TABLE 3. Cervical anastomotic leakage. Univariate analysis. Cellular components of blood are expressed in mean ± standard deviation (SD).
VariableCervical anastomotic leak
OR95% CI
PNo (N=109) Yes (N=40) Lower Upper
Age (yr) 0.993 0.952 1.036 0.927** Mean ± SD 61.1±8.4 60.6±9.2Sex, n (%) 0.313 Male 85 (75.2) 28 (24.8) 1.00 Female 24 (66.7) 12 (33.3) 1.52 0.67 3.43Histology, n (%) 0.096# Adenocarcinoma 37 (84.1) 7 (15.9) 1.00 SCC 70 (69.3) 31 (30.7) 2.34 0.94 5.83 Undifferentiated carcinoma 2 (50) 2 (50) 5.29 0.64 44.03cStage, n (%) 0.812# I 3 (60) 2 (40) 1.00 II 25 (75.8) 8 (24.2) 0.48 0.07 3.40 III 66 (71.7) 26 (28.3) 0.59 0.09 3.74 IV 15 (78.9) 4 (21.1) 0.40 0.05 3.27Radiation, n (%) 0.579# 41.4 82 (73.2) 30 (26.8) 1.00 45 16 (80) 4 (20) 0.68 0.21 2.21 50.4 11 (64.7) 6 (35.3) 1.49 0.51 4.39Chemotherapy n (%) 0.648 Cisplatin, Paclitaxel 26 (70.3) 11 (29.7) 1.00 Carboplatin, Paclitaxel 83 (74.1) 29 (25.9) 0.83 0.36 1.88Interval CRT-Surgery (days) 1.005 0.997 1.012 0.214** Mean ± SD 100.7±45.2 111.1±49.1Surgical access, n (%) 0.854 Transhiatal 23 (71.9) 9 (28.1) 1.00 Trasthoracic 86 (73.5) 31 (26.5) 0.92 0.39 2.21Ryan score, n (%) 0.829 1 56 (71.8) 22 (28.2) 1.00 2 21 (77.8) 6 (22.2) 0.73 0.26 2.04 3 21 (72.4) 8 (27.6) 0.97 0.37 2.51Margins, n (%) 0.515* Free 98 (72.1) 38 (27.9) 1.00 Compromised 11 (84.6) 2 (15.4) 0.47 0.10 2.22Grade of cellular differentiation, n (%) 0.019# 1 10 (76.9) 3 (23.1) 1.00 2 64 (66) 33 (34) 1.72 0.44 6.68 3 32 (88.9) 4 (11.1) 0.42 0.08 2.18Hb (g/dL) (A) 13.1±1.9 13.7±1.5 1.216 0.969 1.526 0.142**Ht (%) (A) 39.3±5.2 41.1±4.2 1.088 0.998 1.185 0.053**MCV (fL) (A) 87.9±6.9 88.6±7.1 1.016 0.963 1.071 0.863**RDW (%) (A) 14.2±1.9 13.7±1.2 0.804 0.600 1.076 0.066**Neut (/uL) (A) 4997.4±2218.4 5451.3±2544.6 1.000 1.000 1.000 0.304**Eos (/uL) (A) 229.2±340.9 298.5±289.9 1.001 1.000 1.002 0.011**Lymp (/uL) (A) 1864.9±653.9 2115.3±676.1 1.001 1.000 1.001 0.062**Plat (nL) (A) 273.4±79.7 279.1±119.3 1.001 0.997 1.005 0.594**MPV (fL) (A) 10.3±1.3 10.6±0.8 1.311 0.898 1.915 0.145**NLR (A) 3.4±3.6 2.7±1.3 0.901 0.742 1.094 0.643**PLR (x1000) (A) 0.18±0.17 0.14±0.07 0.021 0.000 4.146 0.088**Hb (g/dL) (B) 12.4±1.6 12.9±1.6 1.212 0.957 1.534 0.137**Hb (g/dL) (B-A) -0.75±1.87 -0.86±1.74 0.966 0.790 1.181 0.907**Ht (%) (B) 37.1±4.2 38.5±4.3 1.087 0.995 1.189 0.083**Ht (%) (B-A) -2.27±5.31 -2.59±4.56 0.988 0.919 1.062 0.930**MCV (fL) (B) 92.4±6.2 91.8±6.8 0.984 0.930 1.042 0.548**MCV (fL) (B-A) 4.42±4.76 3.12±5.12 0.945 0.875 1.021 0.105**RDW (%) (B) 14.6±2 14.8±3.5 1.037 0.903 1.192 0.677**RDW (%) (B-A) 0.36±1.91 1.12±3.27 1.143 0.966 1.353 0.126**Neut (/uL) (B) 3594.3±1511.5 4102.3±2317.9 1.000 1.000 1.000 0.531**Neut (/uL) (B-A) -1370.5±2172 -1349±2647.9 1.000 1.000 1.000 0.977**Eos (/uL) (B) 194±255.5 248.8±239.6 1.001 0.999 1.002 0.038**Eos (/uL) (B-A) -35.9±320.8 -49.8±190.1 1.000 0.999 1.001 0.216**Lymp (/uL) (B) 1085.4±431.7 1177.3±346.6 1.001 1.000 1.001 0.088**Lymp (/uL) (B-A) -774.8±655.7 -938±550.8 1.000 0.999 1.000 0.330**Plat (nL) (B) 210.9±62 212.4±62.8 1.000 0.995 1.006 0.948**Plat (nL) (B-A) -61.3±79.5 -66.7±119 0.999 0.995 1.003 0.705**MPV (fL) (B) 9.88±0.83 10.18±0.82 1.525 0.986 2.358 0.054**MPV (fL) (B-A) -0.41±1.27 -0.4±0.85 1.006 0.738 1.371 0.900**NLR (B) 3.94±2.97 3.78±2.46 0.980 0.856 1.121 0.733**NLR (B-A) 0.57±4.44 1.03±2.45 1.032 0.934 1.140 0.826**PLR (x1000) (B) 0.22±0.1 0.2±0.08 0.051 0.001 3.957 0.218**PLR (x1000) (B-A) 0.04±0.2 0.05±0.09 1.74 0.15 19.60 0.979**
(A): before neoadjuvant therapy; (B): before surgery. Chi-squared test; *Fisher’s exact test; #Likelihood ratio test; ** Mann-Whitney test.

Tustumi F, Takeda FR, Brandão AAGS, Sallum RAA, Ribeiro Junior U, Cecconello I.Lymphocyte count and platelet volume predicts postoperative complications in esophagectomy for cancer: a cohort study
382 • Arq Gastroenterol • 2019. v. 56 nº 4 out/dez
TABLE 4. Postoperative mortality (30-days). Univariate analysis. Cellular components of blood are expressed in mean ± standard deviation (SD).
VariableMortality (30-days)
Total (N=149) OR95% CI
PNo (N=138) Yes (N=11) Lower Upper
Age (yr) 1.113 1.017 1.218 0.034** Mean ± SD 60.5±8.4 66.9±8.6 60.9±8.6Sex, n (%) 0.462* Male 106 (93.8) 7 (6.2) 113 1.00 Female 32 (88.9) 4 (11.1) 36 1.89 0.52 6.88Histology, n (%) 0.043# Adenocarcinoma 37 (84.1) 7 (15.9) 44 1.00 SCC 97 (96) 4 (4) 101 0.22 0.06 0.79 Undifferentiated carcinoma 4 (100) 0 (0) 4 &cStage, n (%) 0.011# I 5 (100) 0 (0) 5 1.00 II 33 (100) 0 (0) 33 & III 81 (88) 11 (12) 92 & IV 19 (100) 0 (0) 19 &Radiation, n (%) 0.882# 41.4 104 (92.9) 8 (7.1) 112 1.00 45 18 (90) 2 (10) 20 1.44 0.28 7.36 50.4 16 (94.1) 1 (5.9) 17 0.81 0.10 6.94Chemotherapy, n (%) >0.999* Cisplatin, Paclitaxel 34 (91.9) 3 (8.1) 37 1.00 Carboplatin, Paclitaxel 104 (92.9) 8 (7.1) 112 0.87 0.22 3.47Interval CRT-Surgery (days) 1.011 1.000 1.022 0.107** Mean ± SD 101.3±43.6 130.8±70 103.5±46.3Surgical access, n (%) 0.251* Transhiatal 28 (87.5) 4 (12.5) 32 1.00 Trasthoracic 110 (94) 7 (6) 117 0.45 0.12 1.63Ryan score, n (%) 0.024# 1 75 (96.2) 3 (3.8) 78 1.00 2 21 (77.8) 6 (22.2) 27 7.14 1.65 31.00 3 27 (93.1) 2 (6.9) 29 1.85 0.29 11.69Margins, n (%) >0.999* Free 126 (92.6) 10 (7.4) 136 1.00 Compromised 12 (92.3) 1 (7.7) 13 1.05 0.12 8.92Grade of cellular differentiation, n (%) 0.865# 1 12 (92.3) 1 (7.7) 13 1.00 2 89 (91.8) 8 (8.2) 97 1.08 0.12 9.40 3 34 (94.4) 2 (5.6) 36 0.71 0.06 8.51Postoperative complications, n (%) 0.003 No 77 (98.7) 1 (1.3) 78 1.00 Yes 61 (85.9) 10 (14.1) 71 12.62 1.57 101.33Cervical anastomotic leak, n (%) 0.728* No 100 (91.7) 9 (8.3) 109 1.00 Yes 38 (95) 2 (5) 40 0.59 0.12 2.83Clavien Dindo, n (%) <0.001* < IIIa 121 (99.2) 1 (0.8) 122 1.00 ≥ IIIa 17 (63) 10 (37) 27 71.18 8.57 591.43Hb (g/dL) (A) 13.3±1.9 12.7±1.5 13.3±1.9 0.847 0.636 1.129 0.103**Ht (%) (A) 39.9±5 38.2±4.5 39.8±5 0.939 0.843 1.047 0.177**MCV (fL) (A) 88±6.9 89.6±7.5 88.1±7 1.036 0.944 1.137 0.604**RDW (%) (A) 14.1±1.8 14.1±1.1 14.1±1.8 1.005 0.712 1.419 0.450**Neut (/uL) (A) 5086.7±2319.8 5543.6±2270.8 5120.9±2311.6 1.000 1.000 1.000 0.515**Eos (/uL) (A) 253±336 186.4±212.7 248±328.3 0.999 0.996 1.002 0.443**Lymp (/uL) (A) 1926.8±633 2010.5±1039.9 1933±667.1 1.000 0.999 1.001 0.860**Plat (nL) (A) 275.6±94.1 266.3±46.5 274.9±91.6 0.999 0.991 1.006 0.911**MPV (fL) (A) 10.4±1.2 10.3±0.6 10.4±1.2 0.959 0.589 1.560 0.667**NLR (A) 3.1±3 4.3±4.8 3.2±3.2 1.074 0.949 1.216 0.866**PLR (x1000) (A) 0.17±0.15 0.22±0.23 0.17±0.15 3.387 0.245 46.9 0.852**Hb (g/dL) (B) 12.5±1.5 12.3±2 12.5±1.6 0.918 0.621 1.357 0.778**Hb (g/dL) (B-A) -0.81±1.82 -0.36±2.02 -0.78±1.83 1.136 0.826 1.562 0.329**Ht (%) (B) 37.5±4.1 37.2±5.9 37.4±4.3 0.984 0.852 1.138 0.849**Ht (%) (B-A) -2.47±5.06 -0.98±5.72 -2.36±5.11 1.055 0.943 1.180 0.337**MCV (fL) (B) 92.2±6.3 92.5±6.4 92.2±6.3 1.008 0.913 1.112 0.942**MCV (fL) (B-A) 4.16±4.93 2.91±4.24 4.06±4.88 0.948 0.835 1.077 0.467**RDW (%) (B) 14.6±2.6 15±1.6 14.7±2.5 1.056 0.862 1.293 0.219**RDW (%) (B-A) 0.54±2.42 0.96±1.83 0.57±2.38 1.064 0.861 1.315 0.339**Neut (/uL) (B) 3704.9±1763.7 4063.6±1927.9 3731.6±1771.9 1.000 1.000 1.000 0.532**Neut (/uL) (B-A) -1355.2±2305.7 -1480±2372.3 -1364.6±2302.7 1.000 1.000 1.000 0.630**Eos (/uL) (B) 206.3±239.2 240±389.7 208.8±251.7 1.000 0.998 1.003 0.852**Eos (/uL) (B-A) -47.3±279.4 53.6±407.2 -39.7±290.3 1.002 0.999 1.004 0.476**Lymp (/uL) (B) 1089.9±380 1363.6±668.7 1110.2±411.3 1.001 1.000 1.003 0.281**Lymp (/uL) (B-A) -833.6±600.3 -646.8±953.7 -819.5±631.1 1.000 0.999 1.001 0.654**Plat (nL) (B) 208.9±62.8 243.1±40.9 211.3±62 1.007 0.999 1.017 0.017**Plat (nL) (B-A) -65.7±93.4 -23.2±42.5 -62.8±91.4 1.007 0.998 1.017 0.058**MPV (fL) (B) 9.97±0.83 9.87±0.95 9.96±0.84 0.870 0.408 1.854 0.282**MPV (fL) (B-A) -0.41±1.2 -0.43±0.76 -0.41±1.17 0.984 0.568 1.706 0.837**NLR (B) 3.94±2.9 3.38±2 3.89±2.84 0.907 0.672 1.223 0.504**NLR (B-A) 0.84±3.87 -0.97±5.21 0.7±3.99 0.925 0.826 1.035 0.352**PLR (x1000) (B) 0.21±0.09 0.23±0.12 0.21±0.1 4.632 0.010 2202.1 0.752**PLR (x1000) (B-A) 0.05±0.17 0.01±0.25 0.04±0.17 0.436 0.029 6.669 0.851**(A): before neoadjuvant therapy; (B): before surgery. Chi-squared test; *Fisher’s exact test; #Likelihood ratio test; ** Mann-Whitney test.

Tustumi F, Takeda FR, Brandão AAGS, Sallum RAA, Ribeiro Junior U, Cecconello I.Lymphocyte count and platelet volume predicts postoperative complications in esophagectomy for cancer: a cohort study
Arq Gastroenterol • 2019. v. 56 nº 4 out/dez • 383
The role of eosinophils in solid tumors is unclear, and may favor an antitumor inflammatory response, depending on the surrounding stimuli(47-50). Eosinophils also might contribute to thrombophilia in patients with cancer(51,52). In the present study, higher eosinophil level, either prior to neoadjuvant therapy or prior to surgery, was related to higher chance of esophageal anastomotic leak on univariate analysis. The effect was not retained on multi-variate analysis. This may be attributable to the small sample size of cervical anastomotic leakage.
The results of this study should be interpreted in the context of certain inherent limitations. It is a single-center retrospective study with a relatively small sample size. The low number of complication events and mortality limited the statistical power of the analysis of the results. Also, cellular blood components levels are dynamic and may vary in the same patient from day-to-day. Future controlled prospective studies are warranted to validate the predictive risk models.
Despite these limitations, this is the first study to assess the relationship between peripheral blood count variables changes during neoadjuvant chemoradiotherapy using a platinum- and taxane-based regimen followed by curative intent esophagectomy for esophageal cancer in predicting postoperative complications. Variables of routine blood count are already in use as part of the patient’s routine laboratory work for esophageal cancer patients,
and are easily assessable, cost-effective, readily available, and can be used as predictive risk factors for postoperative outcomes.
CONCLUSION
The platelet volume prior to surgery is related to postoperative complications and the lymphocyte count change prior to surgery predicts severe postoperative complications in the setting of tri-modal therapy for esophageal cancer.
Authors’ contributionTustumi F: analysis and interpretation of data. Takeda FR:
acquisition of data. Brandão AAGS: drafting the article. Sallum RAA: revising the article critically for important intellectual con-tent. Ribeiro Junior U: conception and design of the study. Cec-conello I: final approval of the version to be submitted.
OrcidFrancisco Tustumi. Orcid: 0000-0001-6695-0496.Flávio Roberto Takeda. Orcid: 0000-0001-7338-922X.Antonio Adolfo Guerra Soares Brandão. Orcid: 0000-0002-1826-611X.Rubens Antonio Aissar Sallum. Orcid: 0000-0003-1823-0042.Ulysses Ribeiro Junior. Orcid: 0000-0003-1711-7347.Ivan Cecconello. Orcid: 0000-0002-3535-4170.
FIGURE 2. Box-plot of mean platelet volume (MPV) before surgery and its relationship with postoperative complications. MPV are ex-pressed in fL.
FIGURE 1. Box-plot of lymphocyte change between before surgery period (B) and before neoadjuvant therapy period (A), accordingly to Clavien-Dindo classification. Lymphocytes are expressed in units/μL.
Tustumi F, Takeda FR, Brandão AAGS, Sallum RAA, Ribeiro Junior U, Cecconello I.Lymphocyte count and platelet volume predicts postoperative complications in esophagectomy for cancer: a cohort study
384 • Arq Gastroenterol • 2019. v. 56 nº 4 out/dez
REFERENCES
1. van Hagen P, Hulshof MC, van Lanschot JJ, Steyerberg EW, van Berge Hene-gouwen MI, Wijnhoven BP, et al. Preoperative chemoradiotherapy for esophageal or junctional cancer. N Engl J Med. 2012;366:2074-84.
2. Mota FC, Cecconello I, Takeda FR, Tustumi F, Sallum RAA, Bernardo WM. Neoadjuvant therapy or upfront surgery? A systematic review and meta-analysis of T2N0 esophageal cancer treatment options. Int J Surg. 2018;54:176-81.
3. Booka E, Takeuchi H, Nishi T, Matsuda S, Kaburagi T, Fukuda K, et al. The Impact of Postoperative Complications on Survivals After Esophagectomy for Esophageal Cancer. Medicine (Baltimore). 2015;94:e1369.
4. Hyder J, Boggs DH, Hanna A, Suntharalingam M, Chuong MD. Changes in neu-trophil-to-lymphocyte and platelet-to-lymphocyte ratios during chemoradiation predict for survival and pathologic complete response in trimodality esophageal cancer patients. J Gastrointest Oncol. 2016;7:189-95.
5. Kwon HC, Kim SH, Oh SY, Lee S, Lee JH, Choi HJ, et al. Clinical significance of preoperative neutrophil-lymphocyte versus platelet-lymphocyte ratio in patients with operable colorectal cancer. Biomarkers. 2012;17:216-22.
6. Liu JS, Huang Y, Yang X, Feng JF. A nomogram to predict prognostic values of various inflammatory biomarkers in patients with esophageal squamous cell carcinoma. Am J Cancer Res. 2015;5:2180-9.
7. Miao C, Zhu S, Pan H, Cao X, Yuan S, Hu X. Combined neutrophil-platelet score and hemoglobin level predict survival in esophageal squamous cell carcinoma patients treated with chemoradiotherapy. Oncotarget. 2017;8:87971-9.
8. Rassouli A, Saliba J, Castano R, Hier M, Zeitouni AG. Systemic inflammatory markers as independent prognosticators of head and neck squamous cell carci-noma. Head Neck. 2015;37:103-10.
9. Sharaiha RZ, Halazun KJ, Mirza F, Port JL, Lee PC, Neugut AI, Altorki NK, Abrams JA. Elevated preoperative neutrophil: lymphocyte ratio as a predictor of postoperative disease recurrence in esophageal cancer. Ann Surg Oncol. 2011;18:3362-9.
10. Smith RA, Bosonnet L, Raraty M, Sutton R, Neoptolemos JP, Campbell F, Ghaneh P. Preoperative platelet-lymphocyte ratio is an independent significant prognostic marker in resected pancreatic ductal adenocarcinoma. Am J Surg. 2009;197:466-72.
11. Walsh SR, Cook EJ, Goulder F, Justin TA, Keeling NJ. Neutrophil-lymphocyte ratio as a prognostic factor in colorectal cancer. J Surg Oncol. 2005;91:181-4.
12. Wang CY, Hsieh MJ, Chiu YC, Li SH, Huang HW, Fang FM, Huang YJ. Higher serum C-reactive protein concentration and hypoalbuminemia are poor prognostic indicators in patients with esophageal cancer undergoing radiotherapy. Radiother Oncol. 2009;92:270-5.
Tustumi F, Takeda FR, Brandão AAGS, Sallum RAA, Ribeiro Junior U, Cecconello I. Linfócitos e volume plaquetário estão associados a complicações pós-esofagectomia por câncer: um estudo de coorte. Arq Gastroenterol. 2019;56(4):377-85.RESUMO – Contexto – Os biomarcadores obtidos do hemograma completo são fatores prognósticos a longo prazo em pacientes com câncer. No entanto,
o valor desses biomarcadores no contexto da terapia trimodal para o câncer de esôfago na predição de resultados pós-operatórios precoces não é estudado. Objetivo – O presente estudo avaliou o papel dos componentes celulares do sangue na predição de mortalidade e morbidade pós-operatória. Métodos – Uma coorte de 149 pacientes consecutivos submetidos à quimiorradioterapia usando esquemas baseados em platina e taxano seguidos por esofagectomia foi analisada. Os componentes celulares do sangue coletados antes da terapia neoadjuvante (período A) e antes da cirurgia (período B) foram avaliados quanto à mortalidade e complicações pós-operatórias. Modelos de regressão de Cox univariada e multivariada foram aplicados para avaliar a significância prognóstica independente das variáveis da contagem sanguínea. Resultados – A morbidade pós-operatória esteve presente em 46% dos pacientes. Na análise de regressão múltipla, o volume plaquetário (B) (OR: 1,53; IC95%: 1,2–2,33) foi um preditor independente de complicações gerais. Complicações cirúrgicas pós-operatórias graves estavam presentes em 17% dos pacientes. Na análise de regressão múltipla, a diminuição de linfócitos entre os períodos B-A (OR: 0,992; 95% CI: 0,990–0,997) esteve relacionada ao maior risco de complicações graves. Fístula da anastomose cervical esteve presente em 25,6% dos pacientes. Na análise univariada, a contagem de eosinófilos nos períodos A e B relacionou-se com a fístula da anastomose cervical. Para este resultado, o modelo multivariado de articulação não conseguiu identificar variáveis de risco independentes entre os componentes celulares do sangue. A taxa de mortalidade em 30 dias foi de 7,4%. Na análise univariada, a contagem no período B foi associada a maior risco de mortalidade. O modelo multivariado de articulação não pôde predizer mortalidade devido ao pequeno número de pacientes no grupo de mortalidade. Conclusão – Este é o primeiro estudo a avaliar o papel das variáveis do hemograma durante a quimiorradioterapia neoadjuvante para câncer na predição de complicações pós-operatórias. Volume plaquetário e variação da contagem de linfócitos séricos antes da cirurgia podem ser utilizados como biomarcadores preditivos de complicações pós-operatórias nos pacientes com neoplasia de esôfago submetidos a terapia trimodal.
DESCRITORES – Neoplasias esofágicas. Terapia neoadjuvante. Células sanguíneas. Leucócitos. Plaquetas. Linfócitos. Neutrófilos.
13. Cakmak Templeton AJ, McNamara MG, Seruga B, et al. Prognostic role of neu-trophil-to-lymphocyte ratio in solid tumors: a systematic review and meta-analysis. J Natl Cancer Inst. 2014;106:dju124.
14. Szor DJ, Dias AR, Pereira MA, Ramos MFKP, Zilberstein B, Cecconello I, Ribeiro-Júnior U. Prognostic Role of Neutrophil/Lymphocyte Ratio in Resected Gastric Cancer: A Systematic Review and Meta-analysis. Clinics (Sao Paulo). 2018;73:e360.
15. Xiao Q, Zhang B, Deng X, Wu J, Wang H, Wang Y, Wang W. The Preoperative Neutrophil-To-Lymphocyte Ratio Is a Novel Immune Parameter for the Prog-nosis of Esophageal Basaloid Squamous Cell Carcinoma. PLoS One. 2016;11: e0168299.
16. Vulliamy P, McCluney S, Mukherjee S, Ashby L, Amalesh T. Postoperative Ele-vation of the Neutrophil: Lymphocyte Ratio Predicts Complications Following Esophageal Resection. World J Surg. 2016;40:1397-403.
17. Rice TW, Patil DT, Blackstone EH. 8th edition AJCC/UICC staging of cancers of the esophagus and esophagogastric junction: application to clinical practice. Ann Cardiothorac Surg. 2017;6:119-30.
18. Low DE, Alderson D, Cecconello I, Chang AC, Darling GE, D’Journo XB, et al. International Consensus on Standardization of Data Collection for Com-plications Associated With Esophagectomy: Esophagectomy Complications Consensus Group (ECCG). Ann Surg. 2015;262:286-94.
19. Dindo D, Demartines N, Clavien PA. Classification of surgical complications: a new proposal with evaluation in a cohort of 6336 patients and results of a survey. Ann Surg. 2004;240:205-13.
20. Ryan R, Gibbons D, Hyland JM, Treanor D, White A, Mulcahy HE, O’Dono-ghue DP, Moriarty M, Fennelly D, Sheahan K. Pathological response following long-course neoadjuvant chemoradiotherapy for locally advanced rectal cancer. Histopathology. 2005;47:141-6.
21. Paramanathan A, Saxena A, Morris DL. A systematic review and meta-analysis on the impact of pre-operative neutrophil lymphocyte ratio on long term outcomes after curative intent resection of solid tumours. Surg Oncol. 2014;23:31-9.
22. Balkwill F, Mantovani A. Inflammation and cancer: back to Virchow? Lancet. 2001;357:539-45.
23. Guthrie GJ, Charles KA, Roxburgh CS, Horgan PG, McMillan DC, Clarke SJ. The systemic inflammation-based neutrophil-lymphocyte ratio: experience in patients with cancer. Crit Rev Oncol Hematol. 2013;88:218-30.
24. Casey J, Flinn WR, Yao JS, Fahey V, Pawlowski J, Bergan JJ. Correlation of immune and nutritional status with wound complications in patients undergoing vascular operations. Surgery. 1983;93:822-7.

Tustumi F, Takeda FR, Brandão AAGS, Sallum RAA, Ribeiro Junior U, Cecconello I.Lymphocyte count and platelet volume predicts postoperative complications in esophagectomy for cancer: a cohort study
Arq Gastroenterol • 2019. v. 56 nº 4 out/dez • 385
25. Kubo T, Ono S, Ueno H, Shinto E, Yamamoto J, Hase K. Impact of the periope-rative neutrophil-to-lymphocyte ratio on the long-term survival following an elective resection of colorectal carcinoma. Int J Colorectal Dis. 2014;29:1091-9.
26. Takeda FR, Viyuela MS, da Cruz Junior JB, Tustumi F, Braghiroli OFM, Karolyne Ernesto Luiz Nobre KEL, et al. Variables Associated to Pathologic Complete Response, Overall Survival and Disease-Free Survival in the Neoadju-vant Setting for Esophageal Cancer: A Retrospective Cohort Analysis. Int Surg: 2018;103:214-21.
27. Nowarski R, Gagliani N, Huber S, Flavell RA. Innate immune cells in inflam-mation and cancer. Cancer Immunol Res. 2013;1:77-84.
28. Alexandrakis MG, Passam FH, Moschandrea IA, Christophoridou AV, Pappa CA, Coulocheri SA, Kyriakou DS. Levels of serum cytokines and acute phase proteins in patients with essential and cancer-related thrombocytosis. Am J Clin Oncol. 2003;26:135-40.
29. Yun ZY, Li N, Zhang X, Zhang H, Bu Y, Sun Y, et al. Mean platelet volume, platelet distribution width and carcinoembryonic antigen to discriminate gastric cancer from gastric ulcer. Oncotarget. 2017;8:62600-5.
30. Grivennikov SI, Greten FR, Karin M. Immunity, inflammation, and cancer. Cell. 2010;140:883-99.
31. Zhao W, Wang P, Jia H, Chen M, Gu X, Liu M, Zhang Z, Cheng W, Wu Z. Lymphocyte count or percentage: which can better predict the prognosis of advanced cancer patients following palliative care? BMC Cancer. 2017;17:514.
32. Dutta S, Crumley AB, Fullarton GM, Horgan PG, McMillan DC. Compari-son of the prognostic value of tumour- and patient-related factors in patients undergoing potentially curative resection of oesophageal cancer. World J Surg. 2011;35:1861-6.
33. Nishida T, Sakakibara H. Association between underweight and low lymphocyte count as an indicator of malnutrition in Japanese women. J Womens Health (Larchmt). 2010;19:1377-83.
34. Bergquist J, Tarkowski A, Ewing A, Ekman R. Catecholaminergic suppression of immunocompetent cells. Immunol Today. 1998;19:562-7.
35. Weigent DA. Hypoxia and cytoplasmic alkalinization upregulate growth hormone expression in lymphocytes. Cell Immunol. 2013;282:9-16.
36. Mackall CL, Fleisher TA, Brown MR, Magrath IT, Shad AT, Horowitz ME, et al. Lymphocyte depletion during treatment with intensive chemotherapy for cancer. Blood. 1994;84:2221-8.
37. Aghdaii N, Ferasatkish R, Mohammadzadeh Jouryabi A, Hamidi SH. Significance of preoperative total lymphocyte count as a prognostic criterion in adult cardiac surgery. Anesth Pain Med. 2014;4:e20331.
38. Bian C, Wu Y, Shi Y, Xu G, Wang J, Xiang M, Weng S, et al. Predictive value of the relative lymphocyte count in coronary heart disease. Heart Vessels. 2010;25:469-73.
39. Major AS, Fazio S, Linton MF. B-lymphocyte deficiency increases atherosclerosis in LDL receptor-null mice. Arterioscler Thromb Vasc Biol. 2002;22:1892-8.
40. Núñez J, Sanchis J, Bodí V, Núñez E, Mainar L, Heatta AM, et al. Relationship between low lymphocyte count and major cardiac events in patients with acute chest pain, a non-diagnostic electrocardiogram and normal troponin levels. Atherosclerosis. 2009;206:251-7.
41. Mohri Y, Tanaka K, Toiyama Y, Ohi M, Yasuda H, Inoue Y, Kusunoki M. Impact of Preoperative Neutrophil to Lymphocyte Ratio and Postoperative Infectious Complications on Survival After Curative Gastrectomy for Gastric Cancer: A Single Institutional Cohort Study. Medicine (Baltimore). 2016;95:e3125.
42. Shiraishi Y, Fang P, Xu C, Song J, Krishnan S, Koay EJ, Mehran RJ, et al. Severe lymphopenia during neoadjuvant chemoradiation for esophageal cancer: A propensity matched analysis of the relative risk of proton versus photon-based radiation therapy. Radiother Oncol. 2018;128:154-60.
43. Josse JM, Cleghorn MC, Ramji KM, Jiang H, Elnahas A, Jackson TD, et al. The neutrophil-to-lymphocyte ratio predicts major perioperative complications in patients undergoing colorectal surgery. Colorectal Dis. 2016;18:O236-42.
44. Nozoe T, Kimura Y, Ishida M, Saeki H, Korenaga D, Sugimachi K. Correlation of pre-operative nutritional condition with post-operative complications in surgical treatment for oesophageal carcinoma. Eur J Surg Oncol. 2002;28:396-400.
45. Maruyama Y, Inoue K, Mori K, Gorai K, Shimamoto R, Onitsuka T, et al. Neutrophil-lymphocyte ratio and platelet-lymphocyte ratio as predictors of wound healing failure in head and neck reconstruction. Acta Otolaryngol. 2017;137:106-10.
46. Kang WM, Zhu CZ, Yang XX, Yu JC, Ma ZQ, Ye X, et al. Application of the Onodera prognostic nutrition index and neutrophil-to-lymphocyte ratio in risk evaluation of postoperative complications in Crohn’s disease. Sci Rep. 2017;7:8481.
47. Galdiero MR, Varricchi G, Seaf M, Marone G, Levi-Schaffer F, Marone G. Bidirectional Mast Cell-Eosinophil Interactions in Inflammatory Disorders and Cancer. Front Med (Lausanne). 2017;4:103.
48. Lotfi R, Lee JJ, Lotze MT. Eosinophilic granulocytes and damage-associated molecular pattern molecules (DAMPs): role in the inflammatory response within tumors. J Immunother. 2007;30:16-28.
49. Ito T, Hirahara K, Onodera A, Koyama-Nasu R, Yano I, Nakayama T. An-ti-tumor immunity via the superoxide-eosinophil axis induced by a lipophilic component of Mycobacterium lipomannan. Int Immunol. 2017;29:411-21.
50. Sakkal S, Miller S, Apostolopoulos V, Nurgali K. Eosinophils in Cancer: Favour-able or Unfavourable? Curr Med Chem. 2016;23:650-66.
51. Uemura K, Nakajima M, Yamauchi N, Fukayama M, Yoshida K. Sudden death of a patient with primary hypereosinophilia, colon tumours, and pulmonary emboli. J Clin Pathol. 2004;57:541-3.
52. Aderka D, Brown A, Zelikovski A, Pinkhas J. Idiopathic deep vein thrombosis in an apparently healthy patient as a premonitory sign of occult cancer. Cancer. 1986;57:1846-9.

AHEAD OF PRINTORIGINAL ARTICLE
386 • Arq Gastroenterol • 2019. v. 56 nº 4 out/dez
INTRODUCTION
Dysphagia is a symptom of difficulty in swallowing, which can be related to a dysfunction in the oral, pharyngeal or esophageal phase of swallowing(1). The perception of bolus transit through the thoracic esophagus may be caused by esophageal anatomic changes, motility disorders, esophageal hypersensitivity or hiper vigilance(1), or the dysphagia is functional. Functional dysphagia is defined as “a sensation of abnormal bolus transit through the esophageal body in the absence of structural, mucosal, or motor abnormalities to explain the symptom”(2). Functional dysphagia is the least prevalent of the functional esophageal disorders(2). Es-ophageal motility disorders can cause mild-to-severe dysphagia(3,4).
Healthy individuals may have, in some swallows, the perception of esophageal bolus transit. This sensation may be a manifestation of functional dysphagia, which has a different prevalence in differ-ent populations, 7.5% of the functional esophageal diseases in the United States(5) and 0.6% in Asia(6). These differences are related to different populations and diagnostic criteria. However, the percep-tion of bolus transit in some swallows in healthy individuals is not always a consequence of functional dysphagia, but rather, of an altered esophageal motility. Previous studies did not show changes in esophageal motility in perceived bolus transit(7), perhaps because the method used for assessment of esophageal motility was differ-ent from the ones currently used, the high-resolution manometry (HRM). The hypothesis of this investigation was that perception of bolus transit through the esophagus after swallows is associated with changes in esophageal motility.
To evaluate this hypothesis esophageal motility was investigated
Altered esophageal motility during perception of bolus transit in healthy volunteers
Tarciana Vieira COSTA and Roberto Oliveira DANTAS
Received 5/7/2019Accepted 30/9/2019
ABSTRACT – Background – The perception of bolus transit through the thoracic esophagus may be caused by altered esophageal anatomy and function. Objective – To evaluate the hypothesis that, in healthy volunteers, swallows followed by perception of esophageal bolus transit are associated with changes in esophageal motility. Methods – Simultaneous evaluation of motility and perception of esophageal bolus transit was performed in 22 healthy volunteers. Esophageal motility was evaluated by high-resolution manometry with a 32-channel solid state catheter. Each volunteer performed, in the sitting position, 10 swallows of a 5 mL bolus of saline and 10 swallows of pieces of 1 cm3 of bread, with an interval of at least 30 seconds between swallows. After each swallow the volunteers were asked about the perception of bolus transit through the esophagus. Results – Perception of bolus transit occurred in 11.7% of liquid swallows and in 48.1% of solid swallows. In liquid swallows the perception was associated with higher distal con-tractile integral and shorter proximal contraction length. Perception of solid bolus transit was associated with a longer distal latency, longer proximal contraction length, lower proximal contractile integral and shorter proximal contraction duration. Conclusion – The perception of swallowed bolus transit through the esophagus in healthy individuals is more frequent with solid than liquid swallows and is associated with changes in proximal esophageal contractions.
HEADINGS – Esophageal motility disorders. Deglutition disorders. Smooth muscle. Dysphagia.
Declared conflict of interest of all authors: noneDisclosure of funding: no funding receivedUniversidade de São Paulo, Faculdade de Medicina de Ribeirão Preto, Ribeirão Preto, SP, Brasil.Corresponding author: Roberto Oliveira Dantas. E-mail: [email protected]
by high- resolution manometry, and swallows followed by the per-ception of bolus passage through the esophagus were compared with those without perception.
METHODS
Esophageal motility and perception of esophageal transit was evaluated in 22 healthy volunteers, 10 men and 12 women with ages from 22 to 50 years (mean: 38.1±7.7 years). The mean of body mass index was 29.1±3.7 kg/m2. They did not have any gastroenterologi-cal, neurological, endocrine disease, surgery in the digestive tract or any disease at the time of evaluation of esophageal motility. They did not complain of dysphagia, heartburn, acid regurgita-tion or chest pain. The investigation was approved by the Human Research Ethics Committee of the University Hospital, number 14757/2012, and all volunteers gave written informed consent to participate in the investigation.
Esophageal motility was evaluated by high resolution manom-etry with a 32-channel solid state catheter (Sandhill Instruments, Highlands Ranch, CO, USA). The tests were performed after a 6-hour fasting, with individuals in sitting position. After the calibration at 0 mmHg and 100 mmHg, the manometry catheter was introduced through the nose until the distal channels reached the stomach, and registration of intraluminal pressure from the pharynx to the stomach was performed.
After five minutes for stabilization of the manometric record, each volunteer performed, in the sitting position, 10 swallows of a 5 mL bolus of saline at room temperature. After five minutes from the end of the wet swallows the volunteers performed another 10
AG-2019-98dx.doi.org/10.1590/S0004-2803.201900000-78
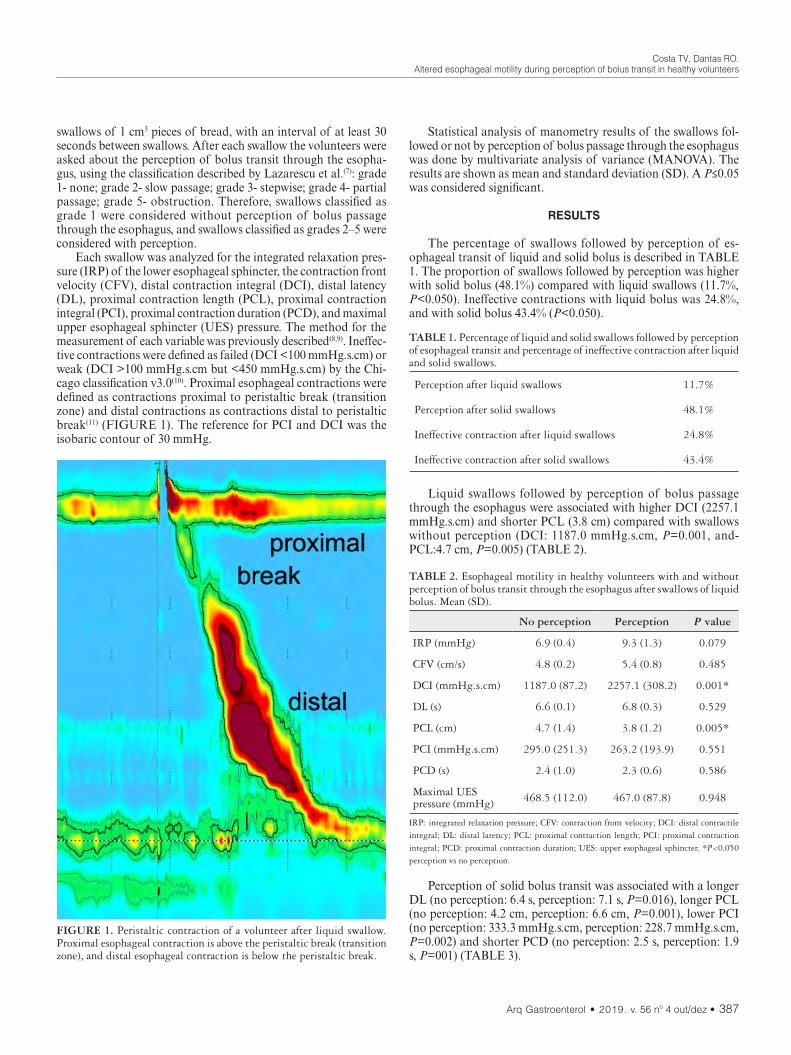
Costa TV, Dantas RO.Altered esophageal motility during perception of bolus transit in healthy volunteers
Arq Gastroenterol • 2019. v. 56 nº 4 out/dez • 387
swallows of 1 cm3 pieces of bread, with an interval of at least 30 seconds between swallows. After each swallow the volunteers were asked about the perception of bolus transit through the esopha-gus, using the classification described by Lazarescu et al.(7): grade 1- none; grade 2- slow passage; grade 3- stepwise; grade 4- partial passage; grade 5- obstruction. Therefore, swallows classified as grade 1 were considered without perception of bolus passage through the esophagus, and swallows classified as grades 2–5 were considered with perception.
Each swallow was analyzed for the integrated relaxation pres-sure (IRP) of the lower esophageal sphincter, the contraction front velocity (CFV), distal contraction integral (DCI), distal latency (DL), proximal contraction length (PCL), proximal contraction integral (PCI), proximal contraction duration (PCD), and maximal upper esophageal sphincter (UES) pressure. The method for the measurement of each variable was previously described(8,9). Ineffec-tive contractions were defined as failed (DCI <100 mmHg.s.cm) or weak (DCI >100 mmHg.s.cm but <450 mmHg.s.cm) by the Chi-cago classification v3.0(10). Proximal esophageal contractions were defined as contractions proximal to peristaltic break (transition zone) and distal contractions as contractions distal to peristaltic break(11) (FIGURE 1). The reference for PCI and DCI was the isobaric contour of 30 mmHg.
Statistical analysis of manometry results of the swallows fol-lowed or not by perception of bolus passage through the esophagus was done by multivariate analysis of variance (MANOVA). The results are shown as mean and standard deviation (SD). A P≤0.05 was considered significant.
RESULTS
The percentage of swallows followed by perception of es-ophageal transit of liquid and solid bolus is described in TABLE 1. The proportion of swallows followed by perception was higher with solid bolus (48.1%) compared with liquid swallows (11.7%, P<0.050). Ineffective contractions with liquid bolus was 24.8%, and with solid bolus 43.4% (P<0.050).
FIGURE 1. Peristaltic contraction of a volunteer after liquid swallow. Proximal esophageal contraction is above the peristaltic break (transition zone), and distal esophageal contraction is below the peristaltic break.
TABLE 1. Percentage of liquid and solid swallows followed by perception of esophageal transit and percentage of ineffective contraction after liquid and solid swallows.
Perception after liquid swallows 11.7%
Perception after solid swallows 48.1%
Ineffective contraction after liquid swallows 24.8%
Ineffective contraction after solid swallows 43.4%
Liquid swallows followed by perception of bolus passage through the esophagus were associated with higher DCI (2257.1 mmHg.s.cm) and shorter PCL (3.8 cm) compared with swallows without perception (DCI: 1187.0 mmHg.s.cm, P=0.001, and-PCL:4.7 cm, P=0.005) (TABLE 2).
TABLE 2. Esophageal motility in healthy volunteers with and without perception of bolus transit through the esophagus after swallows of liquid bolus. Mean (SD).
No perception Perception P value
IRP (mmHg) 6.9 (0.4) 9.3 (1.3) 0.079
CFV (cm/s) 4.8 (0.2) 5.4 (0.8) 0.485
DCI (mmHg.s.cm) 1187.0 (87.2) 2257.1 (308.2) 0.001*
DL (s) 6.6 (0.1) 6.8 (0.3) 0.529
PCL (cm) 4.7 (1.4) 3.8 (1.2) 0.005*
PCI (mmHg.s.cm) 295.0 (251.3) 263.2 (193.9) 0.551
PCD (s) 2.4 (1.0) 2.3 (0.6) 0.586
Maximal UES pressure (mmHg) 468.5 (112.0) 467.0 (87.8) 0.948
IRP: integrated relaxation pressure; CFV: contraction front velocity; DCI: distal contractile integral; DL: distal latency; PCL: proximal contraction length; PCI: proximal contraction integral; PCD: proximal contraction duration; UES: upper esophageal sphincter. *P<0.050 perception vs no perception.
Perception of solid bolus transit was associated with a longer DL (no perception: 6.4 s, perception: 7.1 s, P=0.016), longer PCL (no perception: 4.2 cm, perception: 6.6 cm, P=0.001), lower PCI (no perception: 333.3 mmHg.s.cm, perception: 228.7 mmHg.s.cm, P=0.002) and shorter PCD (no perception: 2.5 s, perception: 1.9 s, P=001) (TABLE 3).
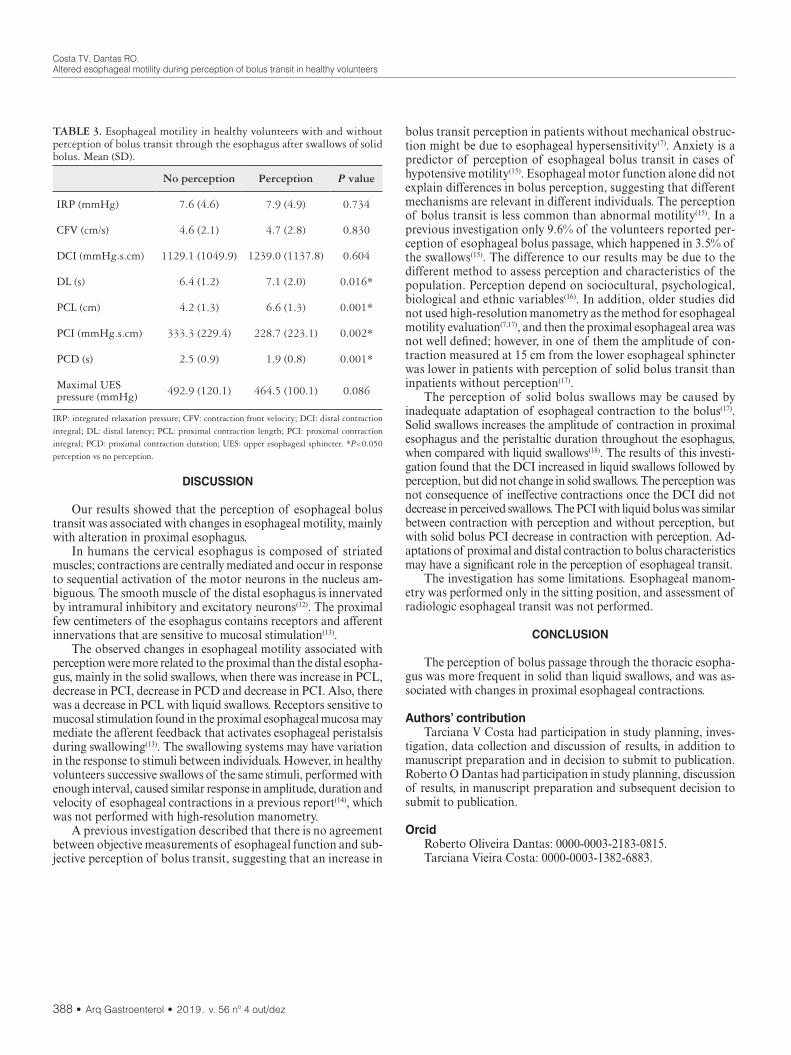
Costa TV, Dantas RO.Altered esophageal motility during perception of bolus transit in healthy volunteers
388 • Arq Gastroenterol • 2019. v. 56 nº 4 out/dez
bolus transit perception in patients without mechanical obstruc-tion might be due to esophageal hypersensitivity(7). Anxiety is a predictor of perception of esophageal bolus transit in cases of hypotensive motility(15). Esophageal motor function alone did not explain differences in bolus perception, suggesting that different mechanisms are relevant in different individuals. The perception of bolus transit is less common than abnormal motility(15). In a previous investigation only 9.6% of the volunteers reported per-ception of esophageal bolus passage, which happened in 3.5% of the swallows(15). The difference to our results may be due to the different method to assess perception and characteristics of the population. Perception depend on sociocultural, psychological, biological and ethnic variables(16). In addition, older studies did not used high-resolution manometry as the method for esophageal motility evaluation(7,17), and then the proximal esophageal area was not well defined; however, in one of them the amplitude of con-traction measured at 15 cm from the lower esophageal sphincter was lower in patients with perception of solid bolus transit than inpatients without perception(17).
The perception of solid bolus swallows may be caused by inadequate adaptation of esophageal contraction to the bolus(17). Solid swallows increases the amplitude of contraction in proximal esophagus and the peristaltic duration throughout the esophagus, when compared with liquid swallows(18). The results of this investi-gation found that the DCI increased in liquid swallows followed by perception, but did not change in solid swallows. The perception was not consequence of ineffective contractions once the DCI did not decrease in perceived swallows. The PCI with liquid bolus was similar between contraction with perception and without perception, but with solid bolus PCI decrease in contraction with perception. Ad-aptations of proximal and distal contraction to bolus characteristics may have a significant role in the perception of esophageal transit.
The investigation has some limitations. Esophageal manom-etry was performed only in the sitting position, and assessment of radiologic esophageal transit was not performed.
CONCLUSION
The perception of bolus passage through the thoracic esopha-gus was more frequent in solid than liquid swallows, and was as-sociated with changes in proximal esophageal contractions.
Authors’ contributionTarciana V Costa had participation in study planning, inves-
tigation, data collection and discussion of results, in addition to manuscript preparation and in decision to submit to publication. Roberto O Dantas had participation in study planning, discussion of results, in manuscript preparation and subsequent decision to submit to publication.
OrcidRoberto Oliveira Dantas: 0000-0003-2183-0815.Tarciana Vieira Costa: 0000-0003-1382-6883.
TABLE 3. Esophageal motility in healthy volunteers with and without perception of bolus transit through the esophagus after swallows of solid bolus. Mean (SD).
No perception Perception P value
IRP (mmHg) 7.6 (4.6) 7.9 (4.9) 0.734
CFV (cm/s) 4.6 (2.1) 4.7 (2.8) 0.830
DCI (mmHg.s.cm) 1129.1 (1049.9) 1239.0 (1137.8) 0.604
DL (s) 6.4 (1.2) 7.1 (2.0) 0.016*
PCL (cm) 4.2 (1.3) 6.6 (1.3) 0.001*
PCI (mmHg.s.cm) 333.3 (229.4) 228.7 (223.1) 0.002*
PCD (s) 2.5 (0.9) 1.9 (0.8) 0.001*
Maximal UES pressure (mmHg) 492.9 (120.1) 464.5 (100.1) 0.086
IRP: integrated relaxation pressure; CFV: contraction front velocity; DCI: distal contraction integral; DL: distal latency; PCL: proximal contraction length; PCI: proximal contraction integral; PCD: proximal contraction duration; UES: upper esophageal sphincter. *P<0.050 perception vs no perception.
DISCUSSION
Our results showed that the perception of esophageal bolus transit was associated with changes in esophageal motility, mainly with alteration in proximal esophagus.
In humans the cervical esophagus is composed of striated muscles; contractions are centrally mediated and occur in response to sequential activation of the motor neurons in the nucleus am-biguous. The smooth muscle of the distal esophagus is innervated by intramural inhibitory and excitatory neurons(12). The proximal few centimeters of the esophagus contains receptors and afferent innervations that are sensitive to mucosal stimulation(13).
The observed changes in esophageal motility associated with perception were more related to the proximal than the distal esopha-gus, mainly in the solid swallows, when there was increase in PCL, decrease in PCI, decrease in PCD and decrease in PCI. Also, there was a decrease in PCL with liquid swallows. Receptors sensitive to mucosal stimulation found in the proximal esophageal mucosa may mediate the afferent feedback that activates esophageal peristalsis during swallowing(13). The swallowing systems may have variation in the response to stimuli between individuals. However, in healthy volunteers successive swallows of the same stimuli, performed with enough interval, caused similar response in amplitude, duration and velocity of esophageal contractions in a previous report(14), which was not performed with high-resolution manometry.
A previous investigation described that there is no agreement between objective measurements of esophageal function and sub-jective perception of bolus transit, suggesting that an increase in
Costa TV, Dantas RO.Altered esophageal motility during perception of bolus transit in healthy volunteers
Arq Gastroenterol • 2019. v. 56 nº 4 out/dez • 389
Costa TV, Dantas RO. Alteração da motilidade do esôfago durante percepção do trânsito do bolo em voluntários saudáveis. Arq Gastroenterol. 2019;56(4):386-9. RESUMO – Contexto – A percepção do trânsito de bolo deglutido através do esôfago torácico pode ser consequência de alterações anatômicas ou fun-
cionais do esôfago. Objetivo – Avaliar, em voluntários saudáveis, se a deglutição com percepção do trânsito do bolo pelo esôfago está associada a alteração da motilidade esofágica. Método – Avaliação simultânea da percepção do trânsito pelo esôfago e motilidade foi realizada em 22 voluntários saudáveis. A motilidade esofágica foi avaliada por manometria de alta resolução. Cada voluntário realizou, na posição sentada, 10 deglutições de 5 mL de soro fisiológico e 10 deglutições de pedaços de 1 cm3 de pão, com um intervalo de pelo menos 30 segundos entre as deglutições. Após cada deglutição, os voluntários foram questionados sobre a percepção do trânsito do bolo através do esôfago. Resultados – A percepção do trânsito ocorreu em 11,7% das deglutições do bolo líquido e em 48,1% das deglutições do bolo sólido. A percepção do bolo líquido foi associada com menor extensão de contração proximal e maior integral da contração distal, comparadas com deglutições sem percepção. A percepção do trânsito de bolus sólido foi associada a maior latência distal, menor extensão de contração proximal, menor integral da contração proximal e menor duração da contração proximal. Conclusão – A percepção do trânsito do bolo deglutido pelo esôfago torácico ocorreu mais frequentemente com bolo sólido e foi associada a alteração das contrações esofágicas proximais.
DESCRITORES – Transtornos da motilidade esofágica. Transtornos de deglutição. Músculo liso.
REFERENCES
1. Clavé P, Shaker R. Dysphagia: current reality and scope of the problem. Nat Rev Gastroenterol Hepatol. 2015;12:259-70.
2. Aziz Q, Fass R, Gyawali CP, Miwa H, Pandolfino JE, Zerbib F. Esophageal disorders. Gastroenterology. 2016;150:1368-79.
3. Rohof WOA, Bredenoord AJ. Chicago classification of esophageal motility disorders: lessons learned. Curr Gastroenterol Rep. 2017;19:37-42.
4. Wang D, Wang X, Yu Y, Xu X, Wand J, Jia Y, et al. Assessment of esophageal motor disorders using high-resolution manometry in esophageal dysphagia with normal endoscopy. J Neurogastroenterol Motil. 2019;25:61-7.
5. Drossman DA, Li Z, Andruzzi E, Temple RD, Talley NJ, Thompson WG, et al. US householder survey of functional gastrointestinal disorders. Prevalence, sociodemography, and health impact. Dig Dis Sci. 1993;38:1569-80.
6. Kwan ACP, Chakkaphak BS, Chang FI, Ke WY, Law NM, Leelakusolvong S, et al. Validation of Rome III criteria for functional gastrointestinal disorders by factor analysis of symptoms in Asian patient sample. J Gastroenterol Hepatol. 2003;18:796-802.
7. Lazarescu A, Karamanolis G, Aprile L, Oliveira RB, Dantas R, Sifrim D. Percep-tion of dysphagia: lack of correlation with objective measurements of esophageal function. Neurogastroenterol Motil. 2010;22:1292-e337.
8. Herregods TVK, Roman S, Kahrilas PJ, Smout AJPM, Bredenoord AJ. Norma-tive values in esophageal high-resolution manometry. Neurogastroenterol Motil. 2015;27:175-87.
9. Bredenoord AJ, Fox M, Kahrilas PJ, Pandolfino JE, Schwizer W, Smout AJP & the International High Resolution Manometry Working Group. Chicago classification criteria of esophageal motility disorders defined in high resolution esophageal pressure topography. Neurogastroenterol Motil. 2012;24 (Suppl 1):57-65.
10. Kahrilas PJ, Bedenoord AJ, Fox M, Gyawali CP, Roman S, Smout AJPM, Pan-dolfino JE. The Chicago classification of esophageal motility disorders, V3.0. Neurogastroenterol Motil 2015;27:160-74.
11. Pohl D, Ribosi M, Savarino E, Frühauf H, Fried M, Castell DO, Tutuian R. Characteristics of the esophageal low-pressure zone in healthy volunteers and patients with esophageal symptoms: assessment by high-resolution manometry. Am J Gastroenterol. 2008;103:2544-9.
12. Goyal RK, Chaudhury A. Physiology of normal esophageal motility. J Clin Gastroenterol. 2008;42:610-9.
13. Lang IM. Brain stem control of the phases of swallowing. Dysphagia. 2009;24:333-48.
14. Dantas RO. Effect of successive swallows on oesophageal motility of normal volunteers, patients with Chagas’ disease and patients with idiopathic achalasia. Neurogastroenterol Motil. 2003;15:57-62.
15. Cisternas D, Scheerens C, Omari T, Monrroy H, Hani A, Leguizano A, et al. Anxiety can significantly explain bolus perception in the context of hypotensive esophageal motility: results of a large multicenter study in asymptomatic indi-viduals. Neurogatroenterol Motil. 2017;29:e13088.
16. Francisconi CF, Sperber AD, Fang X, Fukudo S, Gerson MJ, Kang JY, et al. Multicultural aspects in functional gastrointestinal disorders (FGIDs). Gastro-enterology. 2016;150:1344-54.
17. Dalmazo J, Aprile LRO, Dantas RO. Esophageal contractions, bolus transit and perception of transit after swallows of liquid and solid bolus in normal subjects. Arq Gastroenterol. 2012;49:250-4.
18. Johnston BT, Colins JS, McFarland RJ, Blackwell JN, Love AH. A comparison of esophageal motility in response to bread swallows and water swallows. Am J Gastroenterol. 1993;88:351-5.
AHEAD OF PRINTORIGINAL ARTICLE
390 • Arq Gastroenterol • 2019. v. 56 nº 4 out/dez
INTRODUCTION
Pharmacotherapy plays an important role in preserving and reestablishing people’s good health conditions, thus contributing to improve the quality of life and life expectancy of the population. The ongoing progress of Health Sciences allows the introduction of new pharmaceutical products that either prevent or treat diseases that were thought untreatable. However, the misuse of medicines is one of the main causes of health issues as well as social and economic losses.
Therefore, it is essential that pharmaceutical products are used in a rational manner, in order to ensure the desired therapeutic effects. According to the World Health Organization (WHO), the rational use of medicines requires that “patients receive medica-tions appropriate to their clinical needs, in doses that meet their own individual requirements, for an adequate period of time, and at the lowest cost to them and their community”(1).
One of the main causes of liver disease is drug-induced liver injury (DILI), which is directly related with toxicity by drug therapy to which certain susceptible patients are subjected to(2). The World Health Organization defines adverse reaction as “a response to a drug which is noxious and unintended, and which occurs at doses normally used in man for the prophylaxis, diagnosis, or therapy of disease, or for the modification of physiological function.(3)”
In addition, some factors make people susceptible to or pre-disposed to develop liver injury, such as age, gender, nutritional status, use of allopathic medicine, herbal or dietary supplements
Prospective monitoring of drug use: drug-induced liver injury in a primary healthcare center
Nília Maria de Brito Lima PRADO1, Gladistone Correia MESSIAS1, Genário Oliveira SANTOS JUNIOR2, Vinícius Santos NUNES2, Maria Isabel SCHINONNI3 and Raymundo PARANÁ4
Received 8/7/2019Accepted 27/9/2019
ABSTRACT – Background – Drug-induced liver injury is still misunderstood in Brazil due to diagnostic difficulties or lack of reporting incidents. Objec-tive – To assess the frequency of adverse events related to the use of medicines in a primary healthcare unit, in a city locate southwestern of the state of Bahia, Brazil. Methods – Prospective study conducted at the Primary Center for Specialized Health (CEMEA), February at August of 2013 in Vitoria da Conquista, Bahia, Brazil. Interviews were conducted with patients over 18 years old, and their clinical and laboratorial data were collected. The CIOMS scale was used to validate the cases. Results – A total of 149 patients, mainly Afro-Brazilian women, received follow-up. Among these patients, three cases of hepatotoxicity were identified, and the medicines associated to drug-induced liver injuries were: nimesulide, budesonide and valacyclovir. Conclusion – Drug-induced liver injury is rare in primary healthcare units. It also allowed estimating the incidence of hepatotoxicity induced by allopathic medicines which are standardized by public healthcare authorities.
HEADINGS – Chemical and drug induced liver injury. Drug-related side effects and adverse reactions. Pharmacovigilance.
Declared conflict of interest of all authors: noneDisclosure of funding: Johnson & Johnson do Brasil Indústria e Comercio de Produtos para a Saúde Ltda.1 UFBA, Faculdade de Farmácia do Instituto de Saúde Multidisciplinar, Salvador, BA, Brasil. 2 UFBA, Hospital Universitário Prof. Edgard Santos, Salvador, BA, Brasil. 3 UFBA, Instituto de Ciências da Saúde (ICS), Salvador, BA, Brasil. 4 UFBA, Faculdade de Medicina da Bahia, Salvador, BA, Brasil.Corresponding author: Genario Oliveira Santos Junior. E-mail: [email protected]
(HDS), polypharmacy, drug or alcohol abuse. Besides elderly people, women, and children are the most vulnerable groups(4-8).
DILI is observed both in hospitals and outpatient units. Pros-pective data on adverse events concerning patients in outpatient clinics are rather scarce. This scarcity is the result of several factors, such as lack of patient/physician communication, self-administra-tion of medications by patients, and inadequate documentation.
In Brazil, data on drug-induced hepatotoxicity in outpatient clinics are extremely limited. Literature reviews did not show results of surveys in healthcare units, neither in primary nor secondary care. In addition, the knowledge of specific risk factors that favor adverse reactions to medications allows the implementation of preventive actions and actions to raise awareness about the system of medicine use.
METHODS
A cohort prospective study, was conducted at the Primary Center for Specialized Health (CEMEA) in Vitoria da Conquista, located in the southwestern region of the state of Bahia, Brazil. CEMEA is a public healthcare center which offers specialized medical services that serve both this city and neighboring towns. Patients were enrolled during the study period from February to August 2013. The project aimed to put together healthcare profes-sionals and expert physicians, thus building a collaborative network that allowed the assessment of the incidence of drug-induced liver-related adverse events.
AG-2019-102dx.doi.org/10.1590/S0004-2803.201900000-73
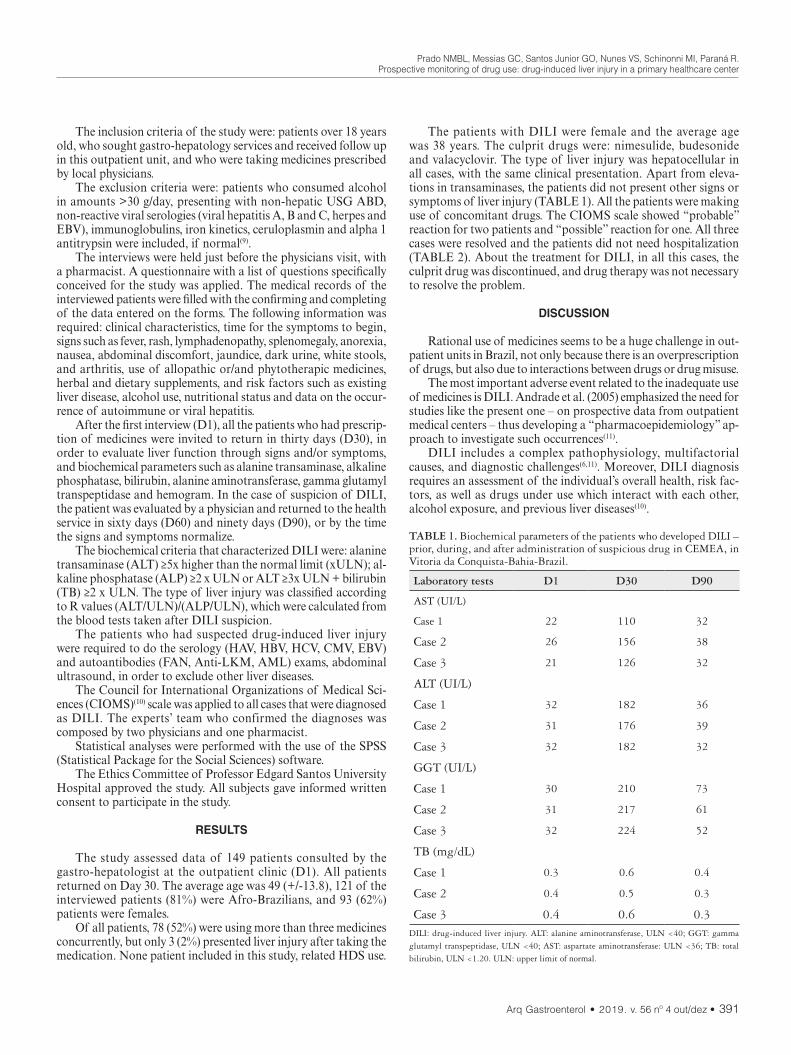
Prado NMBL, Messias GC, Santos Junior GO, Nunes VS, Schinonni MI, Paraná R.Prospective monitoring of drug use: drug-induced liver injury in a primary healthcare center
Arq Gastroenterol • 2019. v. 56 nº 4 out/dez • 391
The inclusion criteria of the study were: patients over 18 years old, who sought gastro-hepatology services and received follow up in this outpatient unit, and who were taking medicines prescribed by local physicians.
The exclusion criteria were: patients who consumed alcohol in amounts >30 g/day, presenting with non-hepatic USG ABD, non-reactive viral serologies (viral hepatitis A, B and C, herpes and EBV), immunoglobulins, iron kinetics, ceruloplasmin and alpha 1 antitrypsin were included, if normal(9).
The interviews were held just before the physicians visit, with a pharmacist. A questionnaire with a list of questions specifically conceived for the study was applied. The medical records of the interviewed patients were filled with the confirming and completing of the data entered on the forms. The following information was required: clinical characteristics, time for the symptoms to begin, signs such as fever, rash, lymphadenopathy, splenomegaly, anorexia, nausea, abdominal discomfort, jaundice, dark urine, white stools, and arthritis, use of allopathic or/and phytotherapic medicines, herbal and dietary supplements, and risk factors such as existing liver disease, alcohol use, nutritional status and data on the occur-rence of autoimmune or viral hepatitis.
After the first interview (D1), all the patients who had prescrip-tion of medicines were invited to return in thirty days (D30), in order to evaluate liver function through signs and/or symptoms, and biochemical parameters such as alanine transaminase, alkaline phosphatase, bilirubin, alanine aminotransferase, gamma glutamyl transpeptidase and hemogram. In the case of suspicion of DILI, the patient was evaluated by a physician and returned to the health service in sixty days (D60) and ninety days (D90), or by the time the signs and symptoms normalize.
The biochemical criteria that characterized DILI were: alanine transaminase (ALT) ≥5x higher than the normal limit (xULN); al-kaline phosphatase (ALP) ≥2 x ULN or ALT ≥3x ULN + bilirubin (TB) ≥2 x ULN. The type of liver injury was classified according to R values (ALT/ULN)/(ALP/ULN), which were calculated from the blood tests taken after DILI suspicion.
The patients who had suspected drug-induced liver injury were required to do the serology (HAV, HBV, HCV, CMV, EBV) and autoantibodies (FAN, Anti-LKM, AML) exams, abdominal ultrasound, in order to exclude other liver diseases.
The Council for International Organizations of Medical Sci-ences (CIOMS)(10) scale was applied to all cases that were diagnosed as DILI. The experts’ team who confirmed the diagnoses was composed by two physicians and one pharmacist.
Statistical analyses were performed with the use of the SPSS (Statistical Package for the Social Sciences) software.
The Ethics Committee of Professor Edgard Santos University Hospital approved the study. All subjects gave informed written consent to participate in the study.
RESULTS
The study assessed data of 149 patients consulted by the gastro-hepatologist at the outpatient clinic (D1). All patients returned on Day 30. The average age was 49 (+/-13.8), 121 of the interviewed patients (81%) were Afro-Brazilians, and 93 (62%) patients were females.
Of all patients, 78 (52%) were using more than three medicines concurrently, but only 3 (2%) presented liver injury after taking the medication. None patient included in this study, related HDS use.
The patients with DILI were female and the average age was 38 years. The culprit drugs were: nimesulide, budesonide and valacyclovir. The type of liver injury was hepatocellular in all cases, with the same clinical presentation. Apart from eleva-tions in transaminases, the patients did not present other signs or symptoms of liver injury (TABLE 1). All the patients were making use of concomitant drugs. The CIOMS scale showed “probable” reaction for two patients and “possible” reaction for one. All three cases were resolved and the patients did not need hospitalization (TABLE 2). About the treatment for DILI, in all this cases, the culprit drug was discontinued, and drug therapy was not necessary to resolve the problem.
DISCUSSION
Rational use of medicines seems to be a huge challenge in out-patient units in Brazil, not only because there is an overprescription of drugs, but also due to interactions between drugs or drug misuse.
The most important adverse event related to the inadequate use of medicines is DILI. Andrade et al. (2005) emphasized the need for studies like the present one – on prospective data from outpatient medical centers – thus developing a “pharmacoepidemiology” ap-proach to investigate such occurrences(11).
DILI includes a complex pathophysiology, multifactorial causes, and diagnostic challenges(6,11). Moreover, DILI diagnosis requires an assessment of the individual’s overall health, risk fac-tors, as well as drugs under use which interact with each other, alcohol exposure, and previous liver diseases(10).
TABLE 1. Biochemical parameters of the patients who developed DILI – prior, during, and after administration of suspicious drug in CEMEA, in Vitoria da Conquista-Bahia-Brazil.
Laboratory tests D1 D30 D90
AST (UI/L)
Case 1 22 110 32
Case 2 26 156 38
Case 3 21 126 32
ALT (UI/L)
Case 1 32 182 36
Case 2 31 176 39
Case 3 32 182 32
GGT (UI/L)
Case 1 30 210 73
Case 2 31 217 61
Case 3 32 224 52
TB (mg/dL)
Case 1 0.3 0.6 0.4
Case 2 0.4 0.5 0.3
Case 3 0.4 0.6 0.3DILI: drug-induced liver injury. ALT: alanine aminotransferase, ULN <40; GGT: gamma glutamyl transpeptidase, ULN <40; AST: aspartate aminotransferase: ULN <36; TB: total bilirubin, ULN <1.20. ULN: upper limit of normal.

Prado NMBL, Messias GC, Santos Junior GO, Nunes VS, Schinonni MI, Paraná R.Prospective monitoring of drug use: drug-induced liver injury in a primary healthcare center
392 • Arq Gastroenterol • 2019. v. 56 nº 4 out/dez
The present study assessed 149 patients who were all using at least one drug. Many of these patients were taking two or more medicines, and some of them have been using seven different medi-cines for a long time, hence they were more susceptible to develop adverse events, notably, drug-induced hepatotoxicity(7,8). However, even among patients using multiple concomitant medicines, there was no screening protocol resulting in DILI.
The current study found three cases of DILI, which is a low frequency when compared to other prospective studies in the lite-rature in which the number of patients with DILI was between 31 and 300, and the observation time of these studies was from 24 to 48 months respectively(12,13). Such a low frequency could be related to the limited time available to observe the adverse effects on the population. None of the patients with DILI had any diagnosis of previous hepatic disease. Some studies report that 2% of suspected DILI cases occur in patients with chronic liver disease(13).
The culprit drugs found in the present study were already mentioned in others studies. Among them, AINES is the most common responsible agent of DILI in Latin America, with an incidence of 32% (62/171)(14). In addition, nimesulide was the anti-inflammatory which most caused DILI in an Italian Center, responsible for 82% of cases in a period of ten years (14/17)(15). Budesonide is a corticoid, and corticosteroid therapy can cause hepatic steatosis and hepatic enlargement, but these conditions are often not clinically apparent, especially in adults. These ef-fects can occur quite rapidly and are equally rapidly reversed with discontinuation of the medicine. Cases of DILI caused by the use of budesonide are uncommon but, as for the present study, liver diseases such as viral hepatitis and autoimmune diseases were excluded. Regarding the use of concomitant drugs, the patient was making use of them for a long time by the moment of the assessment, but the transaminases elevation was observed only after the use of budesonide, thus the use the concomitants drugs improve the risk of DILI, especially prednisone and betametha-sone, both corticosteroid drugs(16).
The antiviral valacyclovir was also already reported in litera-ture as a causing agent of DILI. The patient underwent therapy for seven days and developed DILI, with transaminases elevation similar to the present study(17).
In most cases of DILI, previous exposure to at least one medi-cine as well as the combination of hepatotoxic drugs considerably increases the risk of DILI. As for the present study, all the patients who developed liver injury were taking concomitants drugs(18).
The study assessed the general characteristics of each indi-vidual, such as age, gender, and obesity as risk factors for the development of liver injury. The population was composed mainly
by Afro-Brazilian women, with an average age of 49 years old. Moreover, 22% of the patients were overweight. All the patients who developed DILI were female with an average age of 38 years old. In a similar study conducted in India, the average age was 38 years old and 53% of the patients were female(19).
By the moment of the assessment, only three patients had suspected DILI, of hepatocellular type, with this result being compatible with other studies(15,16,18).
The CIOMS method resulted in “probable” for two cases and “possible” for one. Its application becomes relevant as it considers the main criteria for imputation of causality in hepatic damage and has greater specificity, as already described in the literature.
Other authors have mentioned antibiotics as the most com-mon type of medicine resulting in drug-induced hepatotoxicity. Also, the use of NSAIDs (nonsteroidal anti-inflammatory drugs) is quite common in the general population, and their association with drug-induced liver injury is expressive, especially diclofenac and nimesulide(10).
As the study assessed the medicines with greater implication in DILI cases, we observed that all of them are included on Lists of Essential Medicines all over the world. The majority of patients assessed in this study were taking at least one medicine that has been implicated in DILI cases. Therefore, it is important to properly monitor these medicines for possible adverse events.
CONCLUSION
The present prospective study allowed reporting new cases of DILI in 3 (2%) outpatients. It also allowed estimating the incidence of hepatotoxicity induced by allopathic medicines which are stand-ardized by public healthcare authorities.
Authors’ contributionPrado NMBL and Messias GC: designed the study, collected,
analysed data and wrote manuscript. Santos Junior GO: wrote manuscript and revised the manuscript. Nunes VS, Schinonni MI: revised the manuscript. Paraná R: designed the study and revised the manuscript.
OrcidNília Maria de Brito Lima Prado. Orcid: 0000-0001-8243-5662.Gladistone Correia Messias. Orcid: 0000-0002-3192-9432.Genário Oliveira Santos Junior. Orcid: 0000-0001-7766-2238.Vinícius Santos Nunes. Orcid: 0000-0002-0988-9526.Maria Isabel Schinonni. Orcid: 0000-0001-9037-8127.Raymundo Paraná. Orcid: 0000-0002-4019-4597.
TABLE 2. Characteristics and clinical presentation of the patients who developed DILI after administration of suspicious drug in CEMEA, in Vitoria da Conquista-Bahia-Brazil.
Case Age (female)
Culprit drug
Indication use
Clinical presentation
Type of liver injury (Hepatocellular) Concomitant drugs CIOMS Outcome
01 35 Nimesulide Headache Transaminases elevation ALT:235, ALP:52 Levothyroxine,
Nortriptyline, Torsilax® Probable Resolved
02 42 Budesonide Sinusitis Transaminases elevation ALT:230, ALP:46 Hydrochlorothiazide,
Methyldopa, Prednisone Probable Resolved
03 38 Valacyclovir Herpes simplex
Transaminases elevation ALT:228, ALP: 46 Hydrochlorothiazide,
Methyldopa Possible Resolved
DILI: drug-induced liver injury. ALT: alanine aminotransferase, ULN <40; ALP: alkaline phosphatase, ULN <290; ULN: upper limit of normal; CIOMS: Council for International Organizations of Medical Sciences.

Prado NMBL, Messias GC, Santos Junior GO, Nunes VS, Schinonni MI, Paraná R.Prospective monitoring of drug use: drug-induced liver injury in a primary healthcare center
Arq Gastroenterol • 2019. v. 56 nº 4 out/dez • 393
REFERENCES
1. WHO. The Pursuit of Responsible Use of Medicines: Sharing and Learning from Country Experiences78. Publication date: October 2012.
2. Lee WM, Senior JR. Recognizing drug-induced liver injury: current problems, possible solutions. Toxicol Pathol. 2005;33:155-64.
3. WHO. The Importance of Pharmacovigilance - Safety Monitoring of Medicinal Products. 2002.
4. Lee WM. Drug Induced Hepatotoxicity. The New England Journal of Medicine. 2003;5:474-85.
5. Sedky K, Nazir R, Joshi A, Kaur G, Lippmann S. Which psychotropic medications induce hepatotoxicity? Gastroenterology. 2012;34:53-61.
6. Farmer AD, Brind A. Drug-Induced liver injury. Gastroenterology, 2011.7. Bjornsson E, Davidsdottir L. The long-term follow-up after idiosyncratic drug-in-
duced liver injury with jaundice. Journal oh Hepatology. 2009;50:511-7.8. Gandhi TK, Weingart SN, Borus J, Seger AC, Peterson J, Burdick E, et al. Adverse
Drug Events in Ambulatory Care. N Engl J Med. 2003;348:1556-64.9. Kaplan MM, Pratts DS. Laboratory tests in diseases of the liver. 8ª ed. Uol 1.
Philadelphia lippincott, Raven, 1999. 10. García-Cortés M, Stephens, C, Lucena MI, Fernández-Castañer A, Andrade
RJ. Causality assessment methods in drug induced liver injury: Strengths and weaknesses. J. Hepatol. 2011;55:683-91.
11. Andrade RJ, Lucena MI, Fernández MC, Pelaez G, Pachkoria K, García-Ruiz E, et al. Drug-Induced Liver Injury: An Analysis of 461 Incidences Submitted to the Spanish Registry Over a 10-Year Period. Gastroenterology. 2005:512-21.
12. Wai CT, Tan BH, Chan CL, Sutedja DS, Lee YM, Khor C, Lim SG. Drug‐in-duced liver injury at an Asian center: a prospective study. Liver International. 2007;27:465-74.
13. Chalasani N, Fontana RJ, Bonkovsky HL, Watkins PB, Davern T, Serrano J, et al. Causes, Clinical Features, and Outcomes From a Prospective Study of Drug-In-duced Liver Injury in the United States. Gastroenterology. 2008;135:1924-34.
14. Hernández N, Bessone F, Sánchez A, Di Pace M, Brahm J, Zapata R, et al. Profile of idiosyncratic drug induced liver injury in Latin America: an analysis of published reports. Ann Hepatol. 2014;13:231-9.
15. Licata A, Calvaruso V, Cappello M, Craxì A, Almasio PL. Clinical course and outcomes of drug-induced liver injury: nimesulide as the first implicated medi-cation. Dig Liver Dis. 2010;42:143-8.
16. Sagir A, Wettstein M, Oette M, Erhardt A, Häussinger D. Budesonide-induced acute hepatitis in an HIV-positive patient with ritonavir as a co-medication. AIDS. 2002;16:1191-2.
17. Renkes P, Trechot P, Blain H. Valaciclovir-induced hepatitis. Acta Clin Belg. 1999;54:17-8.
18. Chen M, Suzuki A, Borlak J, Andrade RJ, Lucena MI. Drug-induced liver in-jury: Interactions between drug properties and host factors. J Hepatol. 2015;63: 503-14.
19. Devarbhavi H, Patil M, Reddy VV, Singh R, Joseph T, Ganga D. Drug-induced acute liver failure in children and adults: Results of a single-centre study of 128 patients. Liver Int. 2018;38:1322-9.
Prado NMBL, Messias GC, Santos Junior GO, Nunes VS, Schinonni MI, Paraná R. Monitoramento prospectivo do uso de medicamentos: lesão hepática induzida por medicamentos em um centro municipal de saúde. Arq Gastroenterol. 2019;56(4):390-3.RESUMO – Contexto – As lesões hepáticas induzidas por drogas (DILI), ainda são mal compreendidas no Brasil devido a dificuldades diagnósticas ou à
falta de relatos. Objetivo – Avaliar a frequência de eventos adversos relacionados ao uso de medicamentos em uma unidade básica de saúde, em uma cidade do sudoeste baiano. Métodos – Estudo prospectivo realizado no período de fevereiro a agosto de 2013 em Vitória da Conquista, Bahia, Brasil. Entrevistas foram realizadas com pacientes maiores de 18 anos; os dados clínicos e laboratoriais foram coletados. A escala do CIOMS foi usada para avaliar causalidade dos casos. Resultados – Um total de 149 pacientes, principalmente mulheres afro-brasileiras, receberam acompanhamento. Entre esses pacientes, três casos de hepatotoxicidade foram identificados e os medicamentos associados à DILI foram: nimesulida, budesonida e valaciclovir. Conclusão – DILI é raro em unidades básicas de saúde. Os três casos foram todos reversíveis, sem necessidade de internação hospitalar. Políticas de saúde que fomentam a prática da farmacovigilância são extremamente importantes para a prevenção e detecção de DILI.
DESCRITORES – Doença hepática induzida por substâncias e drogas. Efeitos colaterais e reações adversas relacionados a medicamentos. Farmacovigilância.

AHEAD OF PRINTORIGINAL ARTICLE
394 • Arq Gastroenterol • 2019. v. 56 nº 4 out/dez
INTRODUCTION
Chronic hepatitis C has the hepatitis C virus (HCV) as its etiological agent, discovered in the late 1980’s by Choo et al.(1). This pathology may remain stable or develop into hepatic fibrosis, cirrhosis and hepatocellular carcinoma(2).
The World Health Organization estimates that about 71 million people worldwide live with chronic HCV infection. Data shows that approximately 399,000 people die every year from hepatitis C because they develop cirrhosis or hepatocellular carcinoma(3). The study “Global Burden of Disease” (GBD) has shown that viral hepatitis remains among the top ten global killers(4).
Data from the Brazilian Epidemiological Bulletin indicate that 331,855 cases of hepatitis C were reported in 2018 with the anti-HCV or HCV-RNA markers. In 2017, the ranking of capital cities with the highest rates of hepatitis C detected Porto Alegre (RS) at the top, with 90.7 cases per 100,000 inhabitants, while the national
Sustained virologic response rate in chronic hepatitis C patients through direct-acting antivirals therapy
Andréa Delfino TORRES, Jucéli Maria Hendges SPARVOLI, Antonio Cardoso SPARVOLI and Carla Vitola GONÇALVES
Received 23/7/2019Accepted 14/10/2019
ABSTRACT – Background – In recent years the management of hepatitis C virus infection and the possibility of its eradication have been researched due to the importance that they represent in the health of the world population. Obtaining data that help to cope with this pathology improves the quality of life of those affected by it. The present study evaluated the effectiveness of direct-acting antiviral therapies provided by the Brazilian Ministry of Health in accordance to the Clinical Protocol and Therapeutic Guidelines of 2015. Objective – To evaluate the epidemiological profile of patients with chronic hepatitis C and the rate of sustained virologic response using direct-acting antivirals of all individuals that attended the referral service for the treatment of chronic hepatitis C at the Hospital of the Federal University of Rio Grande. Methods – This was an observational, retrospective/prospective study with all patients with chronic hepatitis C who had their treatments available from December 2015 to August 2017 according to the criteria of the Clinical Protocol and Therapeutic Guidelines of 2015. In the first phase, the clinical and demographic variables of all individuals enrolled in a treatment for hepatitis C were selected and collected from the Reference Service database. In the second phase, treatment data were collected. The outcome variable, sustained virologic response, was defined as an undetectable viral load on the blood test three months after the end of treatment. The descriptive and bivariate analyzes were performed with Pearson’s chi-square and Fisher’s Exact test, adopting a P value ≤0.05 in the SPSS 20 software. Results – Of the 252 participants in the study, 228 (90.5%) had a sustained virologic response, 55.2% were male with an average age of 58.6 years (SD±9.1). Genotype 1 was the most prevalent, observed in 54.4% of the participants, and 87.4% of the patients had moderate/advanced hepatic fibrosis. After the statistical analysis, it was observed that the individuals with genotype 3 and moderate/advanced hepatic fibrosis had lower sustained virologic response rate (P=0.05 and P=0.04, respectively). Conclusion – It was observed that the use of direct-acting antivirals, in comparison to previous therapeutic regimens, increases the sustained virologic response, reaching all patients with mild fibrosis. This study provides information that helps in the hepatitis C treatment by showing that prescribing early treatment for patients without hepatic fibrosis and/or genotype 3 virus could increase therapeutic effectiveness.
HEADINGS – Chronic hepatitis C. Epidemiology. Sustained virologic response. Antiviral agents.
Declared conflict of interest of all authors: noneDisclosure of funding: no funding receivedUniversidade Federal do Rio Grande (FURG), Faculdade de Medicina, Programa de Pós-Graduação em Ciências da Saúde, Rio Grande, RS, Brasil.Corresponding author: Andréa Delfino Torres. E-mail: [email protected]
average was of 11.9 cases per 100,000 inhabitants(5). The constant improvement of the Clinical Protocol and Therapeutic Guidelines makes available for the year 2019 new easy-to-manage antiviral medications and dosage including the retreatment of those already tried with other direct-acting antiviral (DAA) drugs(6).
In 2015, the Brazilian government started to offer the treat-ment of the Clinical Protocol and Therapeutic Guidelines, with the use of DAA agents (sofosbuvir, daclatasvir and simeprevir). The objective was to eradicate the virus by providing sustained virologic response (SVR)(7,8). The use of the previous protocols led to unsatisfactorily low SVR rates that ranged between 50% and 70%. Indices were even worse in cases with advanced fibrosis and infection by genotype 1 HCV, besides presenting adverse effects of difficult management(9-11).
The present study was motivated by the limited availability of Brazilian research documenting and recording real-life data regarding the success rates of DAAs(12-14). Here we evaluated the
AG-2019-109dx.doi.org/10.1590/S0004-2803.201900000-79

Torres AD, Sparvoli JMH, Sparvoli AC, Gonçalves CV.Sustained virologic response rate in chronic hepatitis C patients through direct-acting antivirals therapy
Arq Gastroenterol • 2019. v. 56 nº 4 out/dez • 395
epidemiological profile of patients with chronic hepatitis C and the rate of SVR of all individuals treated in accordance to the Clinical Protocol and Therapeutic Guidelines of 2015 that attended the Reference Center for the treatment of chronic hepatitis C of the Federal University of Rio Grande, termed Center for the Applica-tion and Monitoring of Injectable Medicines (CAMMI).
METHODS
This was an observational, retrospective/prospective study that evaluated the epidemiological profile and determined the SVR rate of all chronic hepatitis C patients who had their treatments available in the period from December 2015 to August 2017 and attended CAMMI, in the Hospital of the Federal University of Rio Grande. The eligibility criteria was defined by the inclusion of all individuals treated in the service according to the 2015 Protocol.
The first phase of the study consisted in the selection of the participants using the CAMMI database. This study included all patients registered for treatment following the Clinical Protocol and Therapeutic Guidelines of 2015 in accordance to clinical setting and previous diagnosis, resulting in 357 eligible individu-als. Demographic variables (sex and age) were also collected in this phase.
During the second phase, medical records were used to col-lect data on the treatment of hepatitis C (genotype, fibrosis, therapeutic regimen, duration, previous use of protease inhibitor, coinfection, extrahepatic criteria and previous treatment). SVR and HCV genotype data was obtained by the undetectable viral load test, which consisted of a HCV-RNA measurement test performed by Real Time PCR at least 12 weeks after the end of treatment. Both the viral load test and the HCV genotyping are molecular biology tests performed from blood samples sent from the central laboratory of the University Hospital. Samples were analyzed in the Viral Load laboratory situated in the academic area of the Health Campus.
Fibrosis was considered in the evaluation tests to characterize liver damage. Tests included hepatic biopsy (METAVIR), hepatic elastography (KPa ≤7.1 = F1, KPa ≥7.2 = F2, KPa ≥9.5= F3), abdominal ultrasound, endoscopy or scores calculations that take into account laboratory findings (transaminases and prothrombin time) and clinical evaluation, which are called APRI and FIB4 (APRI ≥0.5 or FIB4 ≥1.45 = F2 and APRI >1.5 or FIB4 >3.25 = F3). The results obtained followed the METAVIR classification, which is the most commonly used method to stage hepatic fibro-sis(15,16). METAVIR score was based on Rockey et al.(17) F1 and F2 were characterized as mild fibrosis, F3 as moderate to advanced fibrosis, and F4 as cirrhosis and esophageal varices. In the extra-hepatic criteria are included the situations that did not include the evaluation of the hepatic damage, patients with kidney or liver transplantation and also cases where prescriptions were based on clinical manifestations of the virus such as problems in articulations (arthralgias) and in the skin (porphyria cutanea tarde).
The database was organized in Microsoft Excel spreadsheets with the following variables: SVR, sex, age, genotype, fibrosis, coinfection, extrahepatic criteria, treatment regimen and duration (weeks), previous use of first-generation protease inhibitors (PI) and treatment-naïve. The descriptive and bivariate analyzes were performed with Pearson’s chi- square and Fisher’s Exact tests, adopting a P value ≤0.05 in SPSS 20 software.
The present study followed the ethical precepts recommended
by the Resolution CNS 466/12 of the Ministry of Health, and was approved by the Research Ethics Committee of the Federal University of Rio Grande – FURG under the number 203/2018 CEPAS 96/2018.
RESULTS
Of the 357 eligible individuals, 27 were excluded for not initiating treatment within the pre-established period, discon-tinuing treatment or dying. There were 78 participants that were excluded because the record of the viral load test performed three months after finishing the treatment were not found. Therefore, 252 (76.4%) patients were included in the statistical analysis. No statistical difference was found between the study group and the losses (TABLE 1) when considering sex, age, genotype, fibrosis and treatment-naïve.
TABLE 1. Comparison of sociodemographic factors, C virus genotype and host characteristics among participants and losses of the sustained viral response rate study in patients with chronic hepatitis C treated with direct-acting antivirals (n=330).
VariableParticipants Losses
n (%) n (%)
Sex 0.320
Male 139 (55.2) 48 (61.5)
Female 113 (44.8) 30 (38.5)
Genotype 0.175
1 137 (54.4) 47 (60.3)
2 24 (9.5) 11 (14.1)
3 91 (36.1) 20 (25.6)
Age 0.678
≤59 years 136 (54.0) 40 (51.3)
≥60 years 116 (46.0) 38 (48.7)
Fibrosis 0.792
Mild 29 (12.6) 10 (14.5)
Moderate 83 (36.1) 22 (31.9)
Advanced 118 (51.3) 37 (53.6)
Naïve 0.182
Yes 140 (55.6) 50 (64.1)
No 112 (44.4) 28 (35.9)
SVR was obtained from 228 (90.5%) of the sample. Among the 252 participants, 55.2% were males, with a mean age of 58.6 years (SD±9.1). In relation to chronic hepatitis C, the genotype 1 was the most prevalent for HCV (54.4%), and 87.4 % of partici-pants presented a moderate to advanced degree of hepatic fibrosis. HIV coinfection was observed in 19 (7.5%) of the participants, and 12 (4.8%) individuals had extrahepatic complications. In the aspects related to the therapeutic regimen, the combination sofosbuvir-daclatasvir was used by 44.4% of the patients, followed by sofosbuvir-daclatasvir-ribavirin, used by 29% of the sample. Concerning the duration of the treatments, 90.5% were carried out for 12 weeks. In addition, it was observed that 16 (6.3%) patients received triple therapy with IP, and 140 (55.6 %) of the subjects were naïve (TABLE 2).

Torres AD, Sparvoli JMH, Sparvoli AC, Gonçalves CV.Sustained virologic response rate in chronic hepatitis C patients through direct-acting antivirals therapy
396 • Arq Gastroenterol • 2019. v. 56 nº 4 out/dez
The bivariate analysis (TABLE 2) showed that SVR was observed in 95.8% of the individuals infected with HCV genotype 2, while it was of 93.4% and 84.6% for infections of HCV 1 and 3, respectively (P=0.055). Concerning the cases of liver fibrosis, SVR was found in 100% of participants with mild fibrosis and in 89.1% of those with moderate to advanced fibrosis (P=0.044). When we analyzed SVR in relation to HCV genotype and the degree of hepatic fibrosis, SVR was observed in 100% of the patients with mild fibrosis infected by HCV genotypes 1 and 2, while it was of 93% in patients with moderate to advanced fibrosis. SVR rate was of 100% in patients infected by HCV genotype 3 with mild fibrosis, while it was signifi-cantly less prevalent in patients with moderate to advanced fibrosis, being observed in of 82.2% of the cases (P=0.021). The therapeutic regimen that achieved better SVR results was sofosbuvir-daclatasvir (96.4% recovery), closely followed by sofosbuvir-simeprevir-ribavirin, sofosbuvir-ribavirin, and sofobuvir-peginterferon-ribavirin, with a success rate of 96.2% (P=0.006). The association of the therapeutic regimen with the degree of hepatic fibrosis, showed that 100% of SVR rate for the mild fibrosis was observed regardless of the thera-peutic regimen. However, SVR rates varied in cases of moderate to advanced fibrosis, with sofosbuvir-daclatasvir scheme reaching a rate of 96.7% and with sofosbuvir-simeprevir-ribavirin, sofosbuvir-ribavirin, sofosbuvir-peginterferon-ribavirin schemes achieving a rate of 95.7% (P=0.002).
DISCUSSION
The demographic profile of the population with chronic hepati-tis C showed that this pathology is more diagnosed among men with a mean age of 58.6 years (SD±9.1). According to the epidemiologi-cal bulletin, since 1999 in Brazil there is a predominance of males aging about 60 years among the confirmed cases of hepatitis C(5). Chronic hepatitis C discovery is recent, dating back to 1989, and epidemiological findings in relation to the age group shows that the majority of the individuals were suffering the consequences of the disease prior to this date, when the virus was unknown and therefore there was no testing in the blood banks.
In this study, with the use DAAs indicated by the Clinical Protocol and Therapeutic Guidelines of 2015, the SVR rate was of 90.5% in a total of 252 individuals. In previous studies conducted in Europe, SVR rates with the use of DAAs ranged from 58% to 97%(18-24). In the first report of a real world experience in southern Brazil the authors describe in your results a total of 219 patients a SVR rate of 95% (n=208) in patients with cirrhosis (n=89) the SVR was 92.7% and for genotype 3 with cirrhosis (n=21) the SVR was 87.5%(12). In addition, this study observed that the rate of SVR was higher among women (93.8%) than among men (87.8%). Al-though not significant, this dissimilarity may conceivably be due to the different adherence and discipline to the therapeutic regimen between women and men. Among the factors studied, the ones that showed a significant association with SVR were related to the characteristics of the virus, liver damage and therapeutic scheme.
In relation to patients with HCV genotype 3, the treatment success rate was of 84.6%, which is low when compared to SVR between 93% and 95% for HCV genotypes 1 and 3, respectively. European surveys have observed an SVR rate of 79-97% for geno-types 1 and 2 and of 58-97% for genotype 3(18-24). Also in research carried out in Brazil, we find in Ferreira et al. (2008), results the SVR rates between 88-96% for various schemes interferon-free and the genotype 3 as the hardest to be treated(25). Studies conducted in
TABLE 2. Descriptive and bivariate analysis of the sustained viral res-ponse rate in patients with chronic hepatitis C treated with direct-acting antivirals (n=252).
Variable Sample description n (%)
SVR n (%) P-value
Sex 0.105 Male 139 (55.2) 122 (87.8) Female 113 (44.8) 106 (93.8)Age 0.984 ≤59 years 136 (54.0) 123 (90.4) ≥60 years 116 (46.0) 105 (90.5)Genotype 0.055 1 137 (54.4) 128 (93.4) 2 24 (9.5) 23 (95.8) 3 91 (36.1) 77 (84.6)Fibrosis 0.044 Mild 29 (12.6) 29 (100.0) Moderate/advanced 201 (87.4) 179 (89.1)Genotype/Fibrosis 0.021 G1 G2 / Mild 20 (8.7) 20 (100.0) G1 G2/Mod. Advan 128 (51.7) 119 (93.0) G3/Mild 9 (3.9) 9 (100.0) G3/Mod. Advan 73 (26.1) 60 (82.2)Coinfection (HIV) 0.877 Yes 19 (7.5) 17 (89.5) No 233 (92.5) 211 (90.6)Extra-hepatic criteria 0.681 Yes 12 (4.8) 11 (91.7) No 240 (95.2) 217 (90.4)Therapeutic Regimen 0.006 Sofoa/Daclab 112 (44.4) 108 (96.4) Sofoa/Daclab/Ribac 73 (29.0) 61 (83.6) Sofoa/Simed 41 (16.3) 34 (82.9)
Sofoa/Simed/Ribac; Sofoa/Ribac; Sofoa/Pege/Ribac
26 (10.3) 25 (96.2)
Therapeutic Regimen # 0.002 Sofoa/Daclab 112 (44.4) 88 (96.7) Sofoa/Daclab/Ribac 73 (29.0) 42 (79.2) Sofoa/Simed 41 (16.3) 27 (79.4)
Sofoa/Simed/Ribac; Sofoa/Ribac; Sofoa/Pege/Ribac
26 (10.3) 22 (95.7)
Duration (weeks) 0.347 12 228 (90.5) 205 (89.9) 24 24 (9.5) 23 (95.8)Previous use of PIf 0.536 Yes 16 (6.3) 15 (93.8) No 236 (93.7) 213 (90.3)Naïve 0.886 Yes 140(55.6) 127 (90.7) No 112(44.4) 101 (90.2)
asofosbuvir; bdaclatasvir; cribavirina; dsimeprevir; epeginterferon; fprotease inhibitor. #Terapeutic Regimen with moderate/advanced fibrosis.

Torres AD, Sparvoli JMH, Sparvoli AC, Gonçalves CV.Sustained virologic response rate in chronic hepatitis C patients through direct-acting antivirals therapy
Arq Gastroenterol • 2019. v. 56 nº 4 out/dez • 397
the last decade have shown that HCV genotype 3 progresses faster to cirrhosis and its complications in comparison to HCV genotypes 1 and 2, and it is theoretically associated with a lower survival free of hepatocellular carcinoma. Thus, HCV genotype 3 is considered to be more steatogenic, more frequently leading to metabolic syn-drome (viral steatosis)(26,27). In addition to the worst response to treatment, HCV genotype 3 was also the second most prevalent, with 36.1% of cases, while HCV genotypes 1 and 2 accounted for 54.4% and 9.5% of the cases, respectively. The most prevalent HCV genotypes in Brazil are 1 (65%), 3 (30%) and 2 (5%). Concerning the Brazilian regions, the highest prevalence of HCV genotype 3 is in the South (43.2%), while of HCV genotype 2 in the Central West (11.4%)(28). The Clinical Protocol and therapeutic guidelines, in force in Brazil in 2019, changed the treatment management to genotype 3, including the antiviral velpatasvir and increasing the treatment duration to 24 weeks in individuals with cirrhosis(6). Knowing that HCV genotype 3 induces more liver fibrosis and for this reason leads to a lower rate of SVR, it was assumed that this genotype is the most difficult to be treated. The inclusion of new DAAs in the Brazilian therapeutic schemes is urgent, as well as the revision of the antiviral combinations for future treatments in patients did not or will not respond to the current scheme. How-ever, besides the HCV genotype, the degree of hepatic fibrosis was another relevant and significant characteristic for the SVR rate.
We found moderate to advanced hepatic fibrosis in 87.4% of the patients studied. SVR in this group was of 89.1%, while in the group without hepatic injury or mild fibrosis this rate was of 100% (P=0.044). When analyzing the SVR associating the genotype with the degree of hepatic fibrosis, we observed that the degree of mild fi-brosis remained at 100% for every HCV genotype, but for infections with genotypes 1 and 2 with moderate to advanced fibrosis it was of 93%, although this difference was not significant. However, for patients with HCV genotype 3 with moderate to advanced fibrosis, SVR rate was 82.2%, and this decrease was significant (P=0.021). Studies show that independently of the HCV genotype, the associa-tion of the virus with hepatic fibrosis decreases the effectiveness of the therapy(8). Also in relation to the European studies, the rate of SVR for patients with hepatic fibrosis was of 58% for HCV genotype 3 and 79% for genotypes 1 and 2, being lower than the success rate for patients without hepatic injury(22,24). Finding that liver damage directly influences SVR highlights the need to extend the therapeutic access to all patients, regardless of the degree of the hepatic injury. Unfortunately, this hypothesis was not considered as relevant at the time of this study, and the Clinical Protocol and Therapeutic Guidelines of 2015 never considered treating patients without advanced fibrosis. Nevertheless, other studies(29) developed over the years have also shown the efficacy of treating patients that did not present hepatic disease, leading to the revision and release of new Clinical Protocol and Therapeutic Guidelines in 2017 and 2018, enhancing treatment for all infected with HCV(30).
When evaluating the SVR rates in relation to the antiviral com-binations used to treat patients with moderate to advanced fibrosis, it was observed that the most commonly used therapeutic regimen was sofosbuvir-daclatasvir, with a success rate of 96.7%, followed by the combinations sofosbuvir-simeprevir-ribavirin, sofosbuvir-ribavirin and sofosbuvir-peginterferon-ribavirin, with a success rate of 95.7%. All other therapeutic regimens achieved SVR rates under 80% (P=0.002). The effectiveness of the therapeutic regimens persisted even when we associate the variable of moderate to advanced fibrosis, considered by previous studies as a criterion of negative influence
for therapeutic success(7). Thus, effectiveness of these schemes was demonstrated even in patients with more serious clinical profiles, fitting to emphasize SVR rates were of 100% for patients with a mild degree of hepatic fibrosis, regardless of the scheme used.
The assessment of the success rate achieved by people with chronic hepatitis C treated in accordance to the Clinical Protocol and Therapeutic Guidelines of 2015 allowed us to provide informa-tion on the current status of the treatment strategies, on the detec-tion of HCV carriers and also on strategies for the prevention of the progress of liver disease, enabling improvements in the quality of life of the infected individuals and facilitating the global strategies for the eradication of viral hepatitis as a public health problem until 2030. We believe that even though DAAs act on the virus, they do not eliminate the great influence that host characteristics have on the outcome. In addition, although SVR is used to measure the effectiveness of the treatment, the evolution of liver disease may persist even after the eradication of the virus, not eliminating the risk of clinical decompensation and hepatocellular carcinoma. For this reason, it is wise to take into consideration that HCV geno-type 3 infections, with or without mild fibrosis, after liver fibrosis aggravation will have a significantly lower SVR in comparison to carriers of other genotypes regardless of the degree of the fibrosis. Thus, the best perspective of SVR for HCV genotype 3 infections is to receive treatment before the development of cirrhosis, as the natural evolution of this disease is usually slow for those who are only chronic carriers of hepatitis C.
Among the limitations of the study is the comprehensiveness of the CAMMI reference center, as the center receives patients both from the public system and from private health insurance services. This posed an obstacle to verify the SVR outcome, result-ing in losses that were withdrawn from the study. We are aware that sample size may influence results, making important differences unnoticed. For this reason, we analyzed the 78 individuals of the losses and the characteristics found were similar to those of the studied sample. However, we reached a number of subjects inferior to what was estimated, because our commitment was to analyze all the individuals treated in accordance to the Clinical Protocol and Therapeutic Guidelines of 2015.
CONCLUSION
It was observed that, in comparison to previous therapeutic regimens, the use of DAAs led to an increased SVR, reaching the totality among patients with mild fibrosis. This study provided information that helps in the treatment, showing that indicating early treatment in patients without hepatic fibrosis and infected HCV genotype 3 can enhance therapeutic effectiveness.
Authors’ contributionTorres AD: elaboration and execution of the research, collec-
tion of data, writing of the text and statistical analysis. Sparvoli JMH: data collection and research execution. Sparvoli AC: data collection and research execution. Gonçalves CV: statistical analysis and writing of the text.
OrcidAndréa Delfino Torres. Orcid: 0000-0003-2189-5715.Jucéli Maria Hendges Sparvoli. Orcid: 0000-0002-1278-2957.Antonio Cardoso Sparvoli. Orcid: 0000-0002-9885-0454.Carla Vitola Gonçalves. Orcid: 0000-0001-6580-6417.

Torres AD, Sparvoli JMH, Sparvoli AC, Gonçalves CV.Sustained virologic response rate in chronic hepatitis C patients through direct-acting antivirals therapy
398 • Arq Gastroenterol • 2019. v. 56 nº 4 out/dez
REFERENCES
1. Choo QL, Kuo G, Weiner AJ, Overby LR, Bradley DW, Houghton M. Isolation of a cDNA clone derived from a blood-boron non-A, non-B viral hepatitis genome. Science. 1989;244:359-62.
2. Moreira JP. Characterization of the hepatitis C virus core region mutations as-sociated with hepatocellular carcinoma. [Thesis]. University of Sao Paulo. 2015. Available from: https://www.teses.usp.br/teses/disponiveis/5/5168/tde-24022016-153617/publico/JoaoPauloMoreira.pdf
3. WHO (World Health Organization). Hepatitis C [On-line]. Updated 18 Jul. 2018. Accessed on: Dec. 24. 2018. Available from: https: //www.who.int/news-room/fact-sheets/detail/hepatitis-c.
4. Stanaway JD, Flaxman AD, Naghavi M, Fitzmaurice C, Vos T, Abubakar I, et al. The global burden of viral hepatitis from 1990 to 2013: findings from the Global Burden of Disease Study. 2016;388:1081-8.
5. Brasil. Ministério da Saúde. Epidemiological Bulletin “Viral Hepatitis”. Year VI - n. 1. Brasília, DF; 2018.
6. Brasil. Ministério da Saúde. Clinical Protocol and Therapeutic Guidelines for Hepatitis C and Coinfections. Brasilia DF; 2019.
7. Brasil. Ministério da Saúde. Clinical Protocol and Therapeutic Guidelines for Hepatitis C and Coinfections. Brasilia DF; 2015.
8. EASL, The European Association for the Study of the Liver. Clinical Practice Guidelines: EASL Recommendations on Treatment of Hepatitis C. Elsevier; 2015.
9. Kohli A, Shaffer A, Sherman A, Kottilil S. Treatment of hepatitis C: a systematic review. JAMA. 2014;12:631-40.
10. AASLD / IDSA HCV Guidance Panel (American Association for the Study of Liver Diseases and the Infectious Diseases Society of America). Hepatitis C guidance: AASLD-IDSA recommendations for testing, managing, and treating adults infected with hepatitis C virus. Hepatology. 2015;62:932-54.
11. Brasil. Ministério da Saúde. Supplement 2. Clinical Protocol and Therapeutic Guidelines for Viral Hepatitis C and Coinfections. Brasília, DF; 2013.
12. Cheinquer H, Sette H Jr, Wolff FH, et al. Treatment of chronic HCV infection with the new direct acting antivirals (DAA): First report of a real world experience in Southern Brazil. Ann Hepatol. 2017;16:727-33.
13. Ferreira VL, Borba HHL, Wiens A, Pedroso MLA, et al. Effectiveness and tol-erability of direct-acting antivirals for chronic hepatitis C patients in a Southern state of Brazil. Braz J Infect Dis. 2018;22:186-92.
14. Medeiros T, Salviato CM, do Rosario NF, et al. Adverse effects of direct acting antiviral-based regimens in chronic hepatitis C patients: a Brazilian experience. Int J Clin Pharm. 2017;39:1304-11.
15. Bedossa P, Poynard T. An algorithm for the grading of activity in chronic hepatitis C. The METAVIR cooperative study group. Hepatol. 1996;24:289-93.
16. Colloredo G, Guido M, Sonzogni A, Leandro, G. Impact of liver biopsy size on histological evaluation of chronic viral hepatitis: the smaller the sample, the milder the disease. J Hepatol. 2003;39:239-44.
17. Rockey DC, Caldwell SH, Goodman ZD, Nelson RC, Smith AD. Liver biopsy. Hepatol. 2009;49:1017-44.
Torres AD, Sparvoli JMH, Sparvoli AC, Gonçalves CV. Taxa de resposta viral sustentada em pacientes de hepatite C crônica tratados com antivirais de ação direta. Arq Gastroenterol. 2019;56(4):394-8.RESUMO – Contexto – O manejo e a possibilidade de erradicação da infecção pelo vírus da hepatite C têm sido muito pesquisados nos últimos anos pela
importância que representam na saúde pública para a população mundial. A obtenção de dados que auxiliem o enfrentamento dessa patologia resulta na melhor qualidade de vida dos seus portadores. O presente estudo avaliou a efetividade da terapêutica com os antivirais de ação direta, fornecida pelo Ministério da Saúde, através do Protocolo Clínico e Diretrizes Terapêuticas de 2015. Objetivo – Avaliar o perfil epidemiológico dos portadores de hepatite C crônica e a taxa de resposta viral sustentada com o uso dos antivirais de ação direta em todos os indivíduos atendidos no Centro de Referência no tratamento da hepatite C crônica do Hospital Universitário da Universidade Federal do Rio Grande. Métodos – Estudo observacional retrospectivo/prospectivo com todos os portadores de hepatite C crônica que tiveram seus tratamentos disponibilizados no período de dezembro de 2015 a agosto de 2017 segundo os critérios do Protocolo Clínico e Diretrizes Terapêuticas de 2015. Na primeira fase foram selecionadas e coletadas as variáveis demográficas e clínicas, no banco de dados do centro de referência de todos os indivíduos cadastrados para tratamento para hepatite C e na segunda fase foram coletados dados referentes ao tratamento. A variável desfecho, resposta viral sustentada, foi definida pela carga viral indetectável no exame sanguíneo três meses após o término do tratamento. Foram realizadas as análises descritivas e bivariadas com cálculo do qui quadrado de Pearson e Exato de Fisher, adotando um valor P≤0,05, no programa SPSS 20. Resultados – Dos 252 participantes do estudo 228 (90,5%) obtiveram resposta viral sustentada, sendo 55,2% do sexo masculino com média de idade de 58,6 anos (DP±9,1). O genótipo 1 foi o mais prevalente, presente em 54,4% dos participantes, 87,4% dos estudados apresentavam grau de fibrose hepática moderada/avançada. Após a análise estatística observou-se que os indivíduos com genótipo 3 e fibrose hepática moderada/avançada, tiveram menor taxa de resposta viral sustentada (P=0,05 e P=0,04 respec-tivamente). Conclusão – Observou-se que com o uso dos antivirais de ação direta as taxas de resposta viral sustentada foram altas, em relação aos esquemas terapêuticos anteriores, podendo chegar à totalidade nos pacientes com fibrose leve. Este estudo mostra que a realização do tratamento precoce, ou seja, de forma antecipada em pacientes sem fibrose hepática e genótipo 3 pode aumentar a taxa de sucesso.
DESCRITORES – Hepatite C crônica. Epidemiologia. Resposta viral sustentada. Antivirais.
18. Kwo P, Gitlin N, Nahass R, Bernstein D, Rojter S, Schiff E, et al. Phase 3, ran-domized, open-label study to evaluate the efficacy and safety of 12 and 8 weeks of simeprevir (SMV) plus sofosbuvir (SOF) in treatment-naïve and -experienced patients with chronic HCV genotype 1 infection without cirrhosis: OPTIMIST- 1. Conference Reports for NaTaP; 2015. Available from: http://www.natap.org/2015/EASL/EASL_72.htm
19. Lawitz E, Matusow G, DeJesus E, Yoshida E, Felizarta F, Ghalib R, et al. (2015, April 22-26). Phase 3, open-label, single-arm study to evaluate the efficacy and safety of 12 weeks of simeprevir (SMV) plus sofosbuvir (SOF) in treatment-naïve or -experienced patients with chronic HCV genotype 1 infection and cirrhosis: OPTIMIST- 2. Conference Reports for NaTaP; 2015. Available from: http : //www.natap.org/2015/EASL/EASL_76.htm
20. Sulkowski MS, Gardiner DF, Rodriguez-Torres M, Reddy R, Hassanein T, Jacobson I, et al. Daclatasvir plus sofosbuvir for previously treated or untreated chronic HCV infection. The New England Journal of Medicine. 2014;370:211-21.
21. Poordad F, Schiff E, Vierling J, Landis C, Fontana R, Yang R, et al. Daclatasvir, Sofosbuvir, and Ribavirin Combination for HCV Patients with Advanced Cirrhosis or Post-transplant Recurrence: ALLY-1 Phase 3 Study. Conference Reports for NaTaP; 2015. Available from: http://www.natap.org/2015/EASL/EASL_56.htm
22. Lawitz E, Mangia A, Wyles D, Rodriguez-Torres M, Hassanein T, Gordon SC, et al. Sofosbuvir for previously untreated chronic hepatitis C infection. N Engl J Med. 2013;368:1878-7.
23. Jacobson I, Gordon S, Kowdley K, Yoshida E, Rodriguez-Torres M, Sulkowski M, et al. Sofosbuvir for Hepatitis C Genotype 2 or 3 in Patients without Treatment Options. N Engl J Med. 2013;368:1867-77.
24. Nelson DR, Cooper JN, Lalezari JP, Lawitz E, Pockros PJ, Gitlin N, et al. All-oral 12-week treatment with daclatasvir plus sofosbuvir in patients with hepatitis C virus genotype 3 infection: ALLY-3 phase 3 study. Hepatology. 2015;61:1127-35.
25. Ferreira VL, Leonart LP, Tonin FS, Borba HHL, Pontarolo R. Sustained virolog-ical response in special populations with chronic hepatitis C using interferon-free treatments: a systematic review and meta-analysis of observational cohort studies. Clin Drug Investig. 2018;38:389-400.
26. Bochoud PY, Cai T, Overbeck K, Bochud M, Dufour JF, et al. Genotype 3 is associated with accelerated fibrosis progression in chronic hepatitis C. J Hepatol. 2009;51:655-66.
27. Nkontchou G, Ziol M, Aout M, Lhabadie M, Baazia Y, et al. HCV genotype 3 is associated with a higher hepatocellular carcinoma incidence in patients with ongoing viral C cirrhosis. J Viral Hepat. 2011;18:516-22.
28. Campiotto S, Pinho JRR, Carrilho FJ, Da Silva LC, Souto FJD, Spinelli V, Rosa H. Geographic distribution of hepatitis C virus genotypes in Brazil. Braz J Med Biol Res. 2005;38:41-9.
29. AASLD-IDSA HCV Guidance Panel. Hepatitis C guidance 2018 update: AAS-LD-IDSA recommendations for testing, managing, and treating hepatitis C virus infection. Clin Infect Dis. 2018;67:1477-92.
30. Brasil. Ministério da Saúde. Clinical Protocol and Therapeutic Guidelines for Hepatitis C and Coinfections. Brasilia DF; 2018.

AHEAD OF PRINTORIGINAL ARTICLE
Arq Gastroenterol • 2019. v. 56 nº 4 out/dez • 399
INTRODUCTION
Colorectal cancer (CRC) is worldwide, the third cause of cancer and the second cause of death. An estimated 1.8 million new cases and 881,000 deaths occurred by this cancer yearly(1). According to the Brazilian statistics, CRC is the second cause of cancer for women and the second for men(2).
CRC screening is necessary to detect polyps and cancer preco-ciously(3). The diagnosis at initial stages is crucial for acquiring the best prognosis. Colonoscopy, sigmoidoscopy and the fecal occult blood test (FOBT) are the main methods for CRC screening. Co-lonoscopy is a highly sensitive exam for identifying adenomas and cancers but is an invasive and expensive method with low adhesion even in developed countries(4). The FOBT has low sensitivity and specificity, particularly for adenomas, but is a non-invasive and low-cost exam that reduces CRC mortality up to 16%. Sigmoi-doscopy, allow partial visualization of the colon but also reduced mortality up to 30%(5).
There is an urgent need to develop simple tests, less invasive, with high sensitivity and specificity. In recent decades, many studies have been conducted to detect molecular markers in blood, stools and urine. Mutations or methylations alterations on DNA may be interesting ways for CRC diagnosis(6).
Study of lipid biomarkers of patients with polyps and colorectal cancer
Patricia Valeria Pereira SERAFIM1, Adiel Goes de FIGUEIREDO JR1, Aledson Vitor FELIPE1, Edson Guimaraes Lo TURCO2, Ismael Dale Cotrim Guerreiro da SILVA3 and Nora Manoukian FORONES1
Received 29/7/2019Accepted 27/9/2019
ABSTRACT – Background – Colorectal cancer (CRC) is one of the leading causes of cancer worldwide. Early diagnostic methods using serum biomarkers are required. The study of omics, most recently lipidomics, has the purpose of analyzing lipids for a better understanding of human lipidoma. The evolution of mass spectrometry methods, such as MALDI-MS technology, has enabled the detection and identification of a wide variety of lipids with great potential to open new avenues for predictive and preventive medicine. Objective – To determine the lipid profile of patients with colorectal cancer and polyps. Methods – Patients with stage I-III CRC, adenomatous polyps and individuals with normal colonoscopy were selected. All patients under-went peripheral blood collection for lipid extraction. The samples were analyzed by MALDI-MS technique for lipid identification. Statistical analysis – Univariate and multivariate (principal component analysis [PCA] and discriminant analysis by partial least squares [PLS-DA]) analyses workflows were applied to the dataset, using MetaboAnalyst 3.0 software. The ions were identified according to the class of lipids using the online database Lipid Maps (http://www.lipidmaps.org). Results – We included 88 individuals, 40 with CRC, 12 with polyps and 32 controls. Boxplot analysis showed eight VIP ions in the three groups. Differences were observed between the cancer and control groups, as well as between cancer and polyp, but not between polyps and control. The polyketide (810.1) was the lipid represented in cancer and overrepresented in polyp and control. Among the patients with CRC we observed differences between lipids with lymph node invasion (N1-2) compared to those without lymph node invasion (N). Conclusion – Possible lipid biomarkers were identified among cancer patients compared to control and polyp groups. The polyketide lipid (810.1) was the best biomarker to differentiate the cancer group from control and polyp. We found no difference between the biomarkers in the polyp group in relation to the control.
HEADINGS – Colorectal neoplasms. Biomarkers. Mass spectrometry. Lipid metabolism.
Declared conflict of interest of all authors: noneDisclosure of funding: The study had been supported by CAPES Coordination for the Improvement of Higher Education Personnel.1 Universidade Federal de São Paulo, Disciplina de Gastroenterologia, Departamento de Medicina, São Paulo, SP, Brasil. 2 Universidade Federal de São Paulo, Disciplina de Urologia, Departamento de Cirurgia, São Paulo, SP, Brasil. 3 Universidade Federal de São Paulo, Disciplina de Ginecologia, Departamento de Cirurgia, São Paulo, SP, Brasil.Corresponding author: Nora Manoukian Forones. E-mail: [email protected]
The MALDI-TOF MS technique is a high sensitivity and specificity analytical test for the diagnosis of cancer, applied to identify a multitude of cancer types such as gastrointestinal, lung, renal, bladder, ovarian, leukemia, melanoma and breast carcinoma. The analysis of lipid profiles can significantly contribute to the indication of some pathologies such as cancer(7). Qualitative and quantitative assessment of lipids in blood and other body fluids may reveal new biomarkers for early diagnosis of cancer, as well as to follow cancer patients after treatment(8).
The family of lipid is composed of a wide variety of molecular species, divided into eight classes that include 1,680,000 species complex lipids. These are involved in various physiological pro-cesses regulated by thousands of metabolic pathways. Changes in expression levels of individual lipid species may be associated with numerous diseases including cancer(9).
There are two strategies for lipid analysis. The first one that focus on known lipids and the other one that analysis non-target lipid that provides a vast amount of data, which require the assis-tance of bioinformatics for data processing. This process includes three phases: the first refers to the principal component analysis (PCA) and discriminatory analysis of partial least squares (PLS-DA) that aims to identify the differential lipids. The second strategy has the purpose of recovery of the database coupled with MS/MS
AG-2019-110dx.doi.org/10.1590/S0004-2803.201900000-80

Serafim PVP, Figueiredo JR AG, Felipe AV, Turco EG, Silva IDCG, Forones NM.Study of lipid biomarkers of patients with polyps and colorectal cancer
400 • Arq Gastroenterol • 2019. v. 56 nº 4 out/dez
spectra for identification of different lipids. The third and final phase targeted the interpretation of the data for the acquisition of meaningful information(10).
The mass spectrometry (MS) is a single analytical method that allows the identification of a wide range of molecules along the surface of a biological sample. With the advances in MS technolo-gies, many analytical equipment was developed allowing different ionization and fragmentation approaches. The MALDI technique is the most currently used as a high-performance tool, due to its high sensitivity. MALDI-TOF/MS has become a promising tool between the present analytical platforms for lipidomic research, proving to be an attractive platform for application in lipidomics for pre-clinical biomarker studies(11,12).
The objective of the study was to compare the plasmatic lipid profiles of patients with colorectal cancer to controls and patients with polyps.
METHODS
Patients were selected sequentially from the Clinical Oncology, Surgical Gastroenterology and Endoscopy Division of the Federal University of Sao Paulo. The study enrolled patients with colorectal cancer or polyps and patients with normal colonoscopy of both genders, aged between 20 and 80 years.
Colon cancer patients before surgical resection of the tumor and rectal cancer patients before neoadjuvant treatment were included and compose the cancer group. Patients undergoing colonoscopy with normal colonoscopy or with adenomas polyps were included before polypectomy and compose the control and the polyps’ group respectively. Patients with inflammatory bowel disease, familial ad-enomatous polyposis or previous history of cancer were excluded.
The study was approved by the Ethics and Clinical Research Committee Coordenadoria de Ensino e Pesquisa do Hospital São Paulo – HU/UNIFESP under no. 72523. All the patients were informed about the study and signed an Informed Consent term prior to their inclusion.
All patients underwent collection of 10 mL of peripheral blood in tubes with EDTA. After centrifugation, the plasma was stored at -80°C for further lipids analysis.
Lipid extractionAliquots were thawed at room temperature for lipids extraction
following the protocol described by Bligh-Dyer (1959)(13). In a tube 300 μL of the sample were added to 375 μL of chloroform and 750 μL of methanol. After homogenization, 187.5 μL of chloroform and 150 μL of distilled water were added to supernatant and centri-fuged at 3000 x g for 1 minute. Approximately 200 μL of the organic phase containing the lipids were gently transferred to a new tube, which remained open at room temperature for solvent evaporation.
Samples were resuspended in 8 μL methanol, placed in duplicate spot of 1 μL by the MTP adapter 384 (Bruker Daltonics, Bremen, Germany) and coated with 1 μL of 2,5-dihydroxybenzoic acid (DHB) and alfacyano-4-hydroxycinnamic (CHCA) both in the concentra-tion of 7 mg/mL trifluoroacetic acid (TFA) 0.01% dissolved in 70% methanol and 30% water. The acquisition of the spectra was per-formed in the AUTOFLEX Speedy TOF/TOF (Bruker Daltonics, Bremen, Germany) in positive mode at a range of 700–1200 m/z with the frequency 500 water 1000 shots/sec and power 90%.
Statistical analysisA list of ions and their intensities had been generated by
Flexanalysis software (Bruker Daltonics, Bremen, Germany) and afterwards exported to an Excell spreadsheet. The statistical processing was performed in MetaboAnalyst software 2.0 (http://www.metaboanalyst.ca). The principal component analysis (PCA) and discriminant analysis by least squares (PLS-DA) were applied to evaluate the quality of the models. To find different changes on circulating lipids between the groups, 15 VIP lipids (variable importance in discriminant analysis) was obtained.
The ROC curves were generated, the area under the curve was generated to evaluate the cutoff, sensitivity, specificity for each VIP lipid in the groups.
The ions were identified by lipid subclasses by Simlipid 4 soft-ware (Premier Biosoft, Califonia, USA) and online database Lipid Maps (National Institute of Medical Sciences of the United States) (http://www.lipidmaps.org). They were identified and accepted hydrogen adducts (M+), sodium (Na+) and potassium (K+), since they form part of the composition of solvents.
RESULTS
Eighty-eight patients were included, 40 of them with CRC, 12 with adenomatous polyps and 32 controls (TABLE 1). The mean age of patients with CRC was 64 years (±15.18), with polyps was 66 years (±12.37) and for controls 58 years (±12.30).
TABLE 1. Descriptive analysis of the studied groups.
GroupsControl
(n=32)
Polyp
(n=12)
Cancer
(n=40)
Age
Mean (SD) 58 (12.30) 66 (12.37) 64 (15.18)
Gender
Male 20 06 27
Female 12 06 13
Stadium
I 4
II 5
III 31
Degree of differentiation
Well differentiated 12 12
Moderately differentiated 26 26
Poorly differentiated 2 2
SD: standard deviation.
The analysis of boxplot evidenced the distribution of eight VIP ions in the three groups (TABLE 2). All these ions were in different concentrations in CRC compared to controls or polyps. However, there was no difference between polyps and controls. (FIGURE 1). Due to the lack of difference between polyps and controls, all analyzes were performed between the cancer and control groups.
The cluster confirms the difference between the groups (FIGURE 2).
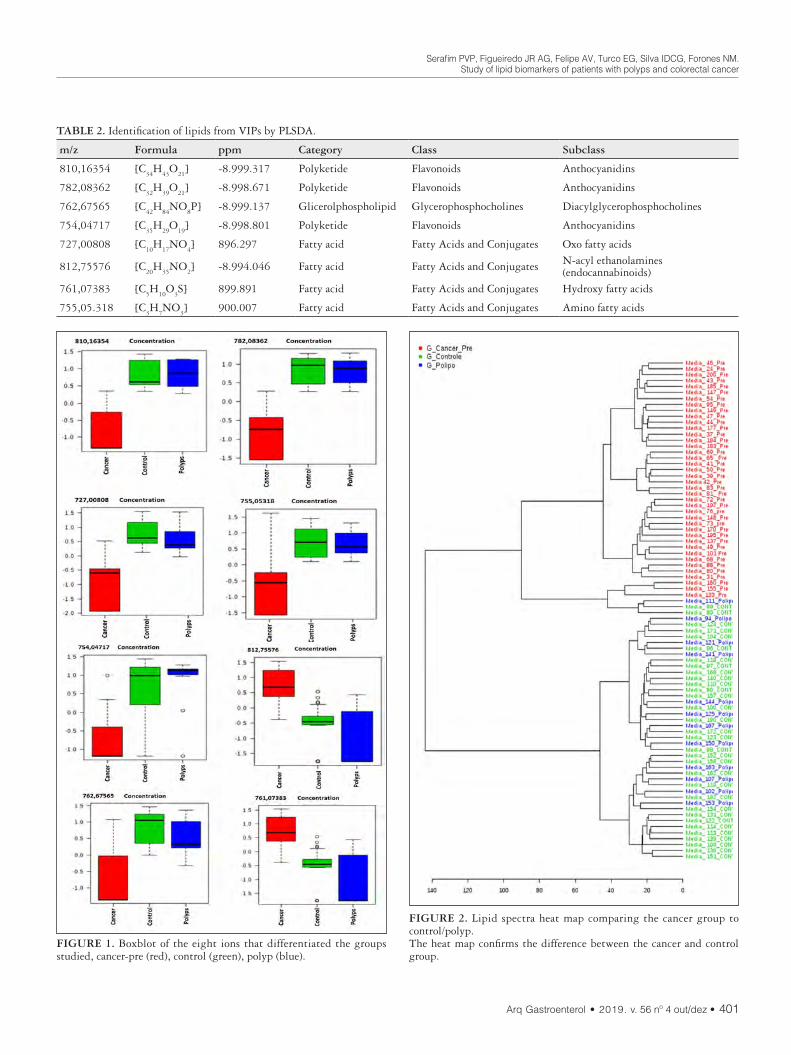
Serafim PVP, Figueiredo JR AG, Felipe AV, Turco EG, Silva IDCG, Forones NM.Study of lipid biomarkers of patients with polyps and colorectal cancer
Arq Gastroenterol • 2019. v. 56 nº 4 out/dez • 401
TABLE 2. Identification of lipids from VIPs by PLSDA.
m/z Formula ppm Category Class Subclass
810,16354 [C34
H43
O21
] -8.999.317 Polyketide Flavonoids Anthocyanidins
782,08362 [C32
H39
O21
] -8.998.671 Polyketide Flavonoids Anthocyanidins
762,67565 [C42
H84
NO8P] -8.999.137 Glicerolphospholipid Glycerophosphocholines Diacylglycerophosphocholines
754,04717 [C35
H29
O19
] -8.998.801 Polyketide Flavonoids Anthocyanidins
727,00808 [C10
H17
NO4] 896.297 Fatty acid Fatty Acids and Conjugates Oxo fatty acids
812,75576 [C20
H35
NO2] -8.994.046 Fatty acid Fatty Acids and Conjugates N-acyl ethanolamines
(endocannabinoids)761,07383 [C
5H
10O
3S] 899.891 Fatty acid Fatty Acids and Conjugates Hydroxy fatty acids
755,05.318 [C3H
7NO
3] 900.007 Fatty acid Fatty Acids and Conjugates Amino fatty acids
FIGURE 1. Boxblot of the eight ions that differentiated the groups studied, cancer-pre (red), control (green), polyp (blue).
FIGURE 2. Lipid spectra heat map comparing the cancer group to control/polyp.The heat map confirms the difference between the cancer and control group.

Serafim PVP, Figueiredo JR AG, Felipe AV, Turco EG, Silva IDCG, Forones NM.Study of lipid biomarkers of patients with polyps and colorectal cancer
402 • Arq Gastroenterol • 2019. v. 56 nº 4 out/dez
Initially, 15 ions (m/z) highlighted by PLS-DA were obtained as important lipids to differentiate CRC patients from the others. The concentration between cancers patients were at least 2-fold higher. Most ions were hypo-represented in cancer patients compared to controls and polyps (FIGURE 3A and 3B).
DISCUSSION
Lipids play many essential roles in cellular functions, such as survival, proliferation and death. They are involved in the storage of chemical energy, cell signaling, cell membranes and cell-cell interactions in tissues. These cellular processes are strongly related to pathways of carcinogenesis, particularly transformation, progres-sion and metastasis(14).
In our study, we investigated the plasma lipid profile of patients with CRC without metastases and compared to controls and pa-tients with polyps. The analysis tool was composed by an analytical method of MALDI-TOF mass spectrometry to identify possible lipid biomarkers for diagnosis.
Statistical data processing proceeded using the analysis of the main components PCA and the values of the variable importance in the projection (VIP) of the PLS-DA. The PCA is an unsupervised method; each of the main components detects the directions of greater variance in the data matrix, while the PLS-DA is a predic-tive supervised method of statistical validation for biomarkers(15).
We observed a different mass spectrum in CRC patients. The small size of the polyps, the low degree of atypia and the reduced number of patients may be the cause of the lack of lipid difference between this group and controls.
We identified eight lipids that best represent the cancer group compared to the control group. The analysis of the ROC curve made with these lipids showed a high accuracy, sensitivity and specificity, suggesting that they may be potential biomarkers. As a way of improving these results, we propose a multiple logistic regression model composed with the eight selected metabolites and obtained the following predictive model.
Our results identified that the ions 810,16354, 782,08362; 754,04717; 727.00808; 755,05318; 761.07383; 762.67565 were hypo-represented and the ion 812,75576 m/z, hyper-represented in the cancer group, indicating the possible association of the lipids with the carcinogenic and metabolic pathways involved in carcinogenensis.
When assessing lymph node involvement, the boxplot test showed that patients with stage III tumors had difference on lipid profiles compared to the others (AUC: 0.924, CI 95%: 0.815–0.982), indicating a high sensitivity and specificity. These results suggest that the ions 71,587,337 and 76,308,826 may be potential prognostic biomarkers.
FIGURE 3. A) 15 VIPs identified by PLS-DA. The colored boxes on the right indicate the relation of the concentrations of the corresponding metabolite in each of the groups, cancer and control. PLSD-DA Shows Groups Separation According Components 1(96.9%). B) The PCA analysis indicates intrinsic differences between the groups, which could be observed by MALDI-TOF-MS metabolomics profiling.
A
B
The ratio between the lipids that best differentiate the groups was 71,587,337 / 76,308,826 with sensitivity of 100% and specific-ity of 78.6%. The concentration of lipids of patients with tumors that had positive lymph node invasion (N1 or N2) was different from the patients with negative lymph node invasion (FIGURE 4).
FIGURE 4. The ROC and Box-Plot curve analysis shows AUCs, a variable that indicates the accuracy of the absence of lymph node invasion (N0) compared to the presence of lymph node invasion (N1 or N2).

Serafim PVP, Figueiredo JR AG, Felipe AV, Turco EG, Silva IDCG, Forones NM.Study of lipid biomarkers of patients with polyps and colorectal cancer
Arq Gastroenterol • 2019. v. 56 nº 4 out/dez • 403
The increase of lipogenic expression in cancer cells is a common event for the development of cancer, due to rapid cell proliferation and reprogramming of energy metabolism, causing a decrease in plasma lipid levels. According to Corominas-Faja et al., the lipo-genic phenotype plays a fundamental role in cellular processes, associated with transformations of cancer cells, including signal transduction, gene expression and response to therapy(16).
The lipids were identified according to their categories and classes in polyketide (PK), fatty acids (FA) and glycerolphos-phophosphates (GP). The ion 812,5576, hyper-represented in the cancer group, belongs to the category of FA, subclass N-acyl-entolamine(17). These authors investigated the plasma lipid profile in patients with advanced CRC by MALDI–TOF. They also identified that GP and PK, were hypo represented in the cancer group and hyper represented in the control.
Glycerophospholipids, characterized as phospholipids, are integrators of cell membranes and play the role in cell metabolism and signaling. Demonstrating a relationship of these lipids with metabolic dysregulation and differentiation, certain lipid species strongly linked to cell signaling.
The phospholipid molecules are abundant in the plasma and heterogeneous, this fact is attributed, largely of variations of the FA, as well as the structural differences presented by them. Its structural diversity suggests critical involvement in many physi-ological and pathological processes(18). Prospective studies associ-ated high circulating choline concentration with an increased risk of CRC. Phosphatidylcholines and phosphatidylethanolamines are key components of cell membranes responsible for maintaining structural integrity(19).
Several prospective studies suggest an association between high intake of flavonoids, particularly flavonols, anthocyanins and a decrease risk of CRC through various anti-inflammatory mechanisms, anti-oxidant properties, induction of apoptosis, in-hibition of proliferation and angiogenesis(20). Protective activities have been widely attributed to anthocyanins by negative regulation of inflammatory signaling pathways, including the light chain of NF-kB, mitogen-activated protein kinase (MAPK), c-Jun N -ter-minal kinase (JNK), and transducer and transcription activator (STAT). They inhibit cell proliferative pathways, such as the Wnt signaling pathway, which is upregulated in most sporadic CRC. However, the mechanisms that can suppress the colon carcinoge-nesis has not yet been fully elucidated(21).
FAs have a structural role in cell membranes, influencing their fluidity, functions and cell membrane composition, as well as being the main structural component of each lipid group. Lipid metabo-lism is associated with carcinogenicity, progression and alterations in the expression of FA. The lipogenesis process is a known feature that may be present in malignant cells. A key enzyme, fatty acid synthase (FASN) that regulates the biosynthesis of lipogenesis de novo in many cancers, including CRC, is associated with disease aggressiveness and a poor prognosis. Suggesting that this enzyme may be a potential biomarker to investigate the relationships be-tween lipid metabolism and cancer(22,23).
Fernandes Messias MC et al., 2018 described reduced levels of different forms of lysophospholipideocolin (LPC), a category of glycerolphospholipid (GP) in plasma of CRC patients. Phospho-lipids (PLs) play important cellular functions, such as signal trans-duction, post-translational modifications, homeostasis, adhesion, migration, apoptosis and neurotransmission(24). In the presence of cancer these molecules are often subject to modifications, with marked changes in the metabolism of phosphatidylcholine (PC) and phosphatidylethanolamine (PE) due to changes in the activity of degradative enzymes, which may be useful for the diagnosis and treatment of cancer(25).
Yu Z et al., 2018 evaluated the lipid profiles of 199 patients with lung cancer (NSCLC) and 147 controls by MALDI. The authors defined a panel of four lipid markers with sensitivity of 81.9% and specificity of 70%; that can be lipid biomarkers for the diagnosis of lung carcinomas(26).
The role of lipid synthesis in cancer metabolism and tumor development as well as in precancerous lesions still requires many studies to elucidate the numerous mechanisms and pathways of its development. IN clinical practice, the lipid profile is measured based on the serum concentrations of total cholesterol, high-density lipoprotein, low-density lipoprotein and triacylglycerols being poor information for the analysis of the lipid fractions. The mass spectrometry (lipid) technique allowed identifying the specific categories of lipids. Cancer cells are characterized by changes in lipid metabolism. Membrane alterations, rupture of energetic homeostasis, cell signaling, gene expression and protein distribution, affecting several cellular functions, such as apoptosis, autophagy, necrosis, proliferation, differentiation, growth, drug resistance(27).
In conclusion, we found different lipid profiles between the non-metastatic cancer group and the control group. Eight VIP potential lipid biomarkers were identified.
Authors’ contributionSerafim PVP contributed to the acquisition of blood samples,
performance of the experiments of lipidomic, statistical analysis and writing the article. Figueiredo JR AG contributed the analysis of the spectrum by MALDI-TOF and Felipe AV contributed to the statistical analysis Turco EG contributed to the statistical analysis and the concept of the study. Silva IDCGcontributed to the concept and statistical analysis, Forones NM contributed to the concept, design and drafted the manuscript.
OrcidPatricia Pereira Valeria Serafim. Orcid: 0000-0002-2096-6991.Adiel Goes Figueiredo Junior. Orcid: 0000-0003-0296-1473.Aledson Vitor Felipe. Orcid: 0000-0003-1335-1478.Edson Guimaraes Lo Turco. Orcid: 0000-0002-3509-847X.Ismael Dale Cotrim Guerreiro da Silva. Orcid: 0000-0003-0316-1718.Nora Manoukian Forones. Orcid: 0000-0001-9414-0343.

Serafim PVP, Figueiredo JR AG, Felipe AV, Turco EG, Silva IDCG, Forones NM.Study of lipid biomarkers of patients with polyps and colorectal cancer
404 • Arq Gastroenterol • 2019. v. 56 nº 4 out/dez
REFERENCES
1. Bray F, Ferlay J, Soerjomataram I, Siegel RL, Torre LA, Jemal A. Global cancer statistics 2018: GLOBOCAN estimates of incidence and mortalty worldwide for 36 cancers in 185 countries CA Cancer J Clin. 2018;68:394-424.
2. National Cancer Institute (INCA). Estimate 2018: Cancer incidence in Brazil. [Internet]. [Acessed 2019 June 19]. Available from: https://www.inca.gov.br/search/conteudo/estimativa
3. Dumoulin FL Hildenbrand R. Endoscopic resection techniques for colorectal neoplasia: current developments. World J Gastroenterol. 2019;25:300-7.
4. Issa IA, Noureddine M. Colorectal cancer screening: an updated review of the available options. World J Gastroenterol. 2017;23:5086-96.
5. Bray C, Bell LN, Liang H, Collins D, Yale SH. Colorectal Cancer Screening. WMJ. 2017;116:27-33.
6. Yiu AJ, Yiu CY. Biomarkers in Colorectal. Anticancer Res. 2016;36:1093-102.7. Wang C, Miao Wang M, Han X. Applications of Mass Spectrometry for Cellular
Lipid Analysis. Mol Biosyst. 2015;11:698-713.8. Li M, Yang L, Bai Y, Liu H. Analytical Methods in Lipidomics and Their Ap-
plications. Anal Chem. 2014;86:161-75. 9. Ingólfsson HI, Melo MN, van Eerden FJ, Arnarez C, Lopez CA, Wassenaar TA, et
al. Lipid organization of the plasma membrane. J Am Chem Soc. 2014;136:14554-9. 10. Li L, Han J, Wang Z, Liu J, Wei J, Xiong S, et al. Mass spectrometry methodology
in lipid analysis. Int J Mol Sci, 2014;15:1492-507.11. Calvano CD, van der Werf ID, Palmisano F, Sabbatini L. Identification of
lipid- and protein-based binders in paintings by direct on-plate wet chemistry and matrix-assisted laser desorption ionization mass spectometry. Anal Bioanal Chem. 2015;407:1015-22.
12. Takats Z, Strittmatter N, McKenzie JS. Ambient Mass Spectrometry in Cancer Research. Adv Cancer Res. 2017;134:231-56.
13. Bligh EG, Dyer WJ. A rapid method of total lipid extraction and purification. Can J Biochem Physiol. 1957;37:911-7.
14. Perrotti F, Rosa C, Cicalini I, Sacchetta P, Del Boccio P, Genovesi D, Pieragostino D. Advances in Lipidomics for Cancer Biomarkers Discovery. Int J Mol Sci. 2016;17(12).
15. Bijlsma S, Bobeldijk I, Verheij ER, Ramaker R, Kochhar S, Macdonald IA, et al. Large-scale human metabolomics studies: a strategy for data (pre-) processing and validation. Anal Chem. 2006;78:567-74.
Serafim PVP, Figueiredo JR AG, Felipe AV, Turco EG, Silva IDCG, Forones NM. Estudo de biomarcadores lipídicos em pacientes portadores com pólipos e câncer colorretal. Arq Gastroenterol. 2019;56(4):399-404.RESUMO – Contexto – O câncer colorretal (CCR) é, mundialmente, uma das principais causas de câncer. Métodos de diagnóstico precoce através de
biomarcadores séricos são necessários. O estudo das ômicas, mais recentemente a lipidômica, tem a finalidade de analisar os lipídeos para melhor compreensão do lipidoma humano. A evolução dos métodos de espectrometria de massa, como a tecnologia por MALDI-MS, possibilitou a de-tecção e a identificação de uma ampla variedade de lipídeos com grande potencial para abrir novos caminhos para a medicina preditiva e preventiva. Objetivo – Determinar o perfil lipidômico de pacientes com câncer colorretal e pólipos. Métodos – Foram selecionados pacientes com CCR estádio I-III, com pólipos adenomatosos e indivíduos com colonoscopia normal. Todos os pacientes foram submetidos a coleta do sangue periférico para extração do lipídeo. As amostras foram analisadas por técnica de MALDI-MS para a identificação dos lipídeos. Análise estatística – Para análise univariada e multivariada foram utilizados a análise de componentes principais (PCA) e a análise discriminante pelos quadrados mínimos (PLS-DA). Os íons foram identificados de acordo com a classe de lipídeos usando-se o Lipid Maps (http://www.lipidmaps.org). Resultados – Foram incluídos 88 indivíduos, 40 com CCR, 12 com pólipos e 32 controles. A análise de boxbolt evidenciou oito íons VIP nos três grupos. Observou-se diferenças entre os grupos câncer e controle, assim como entre câncer e pólipo, mas não entre pólipos e controle. O policetídeo (810,1) foi o lipídeo hipo-representado no câncer e hiperrepresentado no pólipo e controle. Entre os pacientes com CCR observamos diferenças entre os lipídeos com invasão linfonodal (N1-2) comparados aos sem invasão linfonodal (N0). Conclusão – Foram identificados possíveis biomarcadores lipídicos entre os pacientes com câncer comparados aos grupos controle e pólipo. O lipídeo policetídeo (810,1) foi o melhor biomarcador para diferenciar o grupo câncer do controle e pólipo. Não encontramos diferença entre os biomarcadores no grupo pólipo em relação ao controle.
DESCRITORES – Neoplasias colorretais. Biomarcadores. Espectrometria de massas. Metabolismo dos lipídeos.
16. Corominas-Faja B, Cuyàs E, Gumuzio J, Bosch-Barrera J, Leis O, Martin ÁG, et al. Chemical inhibition of acetyl-CoA carboxylase suppresses self-renewal growth of cancer stem cells. Oncotarget. 2014;30:8306-16.
17. de Figueiredo Junior AG, Serafim PVP, de Melo AA, Felipe AV, Lo Turco EG, et al. Analysis of the lipid profile in patients with colorectal cancer in advanced stages. Asian Pac J Cancer Prev. 2018;19:1287-93.
18. Wenk MR, Lipidomics: New Tools and Applications. Cell. 2010;143:888-95. 19. Shu X, Xiang YB, Rothman N, Yu D, Li HL, Yang G, et al. Prospective study
of blood metabolites associated with colorectal cancer risk. Int J Cancer. 2018;143:527-34.
20. Nimptsch K, Zhang X, Cassidy A, Song M, O’Reilly ÉJ, Lin JH, et al. Habitual Intake of flavonoid subclasses and risk of colorectal cancer in 2 large prospective cohorts. Am J Clin Nutr. 2016;103:184-91.
21. Li Y, Zhang T, Chen GY. Flavonoids and Colorectal Cancer Prevention. Anti-oxidants (Basel). 2018;7(12).
22. Zaytseva YY, Harris JW, Mitov MI, Kim JT, Butterfield DA, Lee EY, et al. Increased expression of fatty acid synthase provides a survival advantage to colorectal cancer cells via upregulation of cellular respiration. Oncotarget. 2015;6:18891-904.
23. Notarnicola M, Caruso MG, Tutino V, De Nunzio V, Gigante I, De Leonardis G, et al. Nutrition and lipidomic profile in colorectal cancers. Acta Biomed. 2018;89(9-S):87-96.
24. Fernandes Messias MC, Mecatti GC, Figueiredo Angolini CF, Eberlin MN, Credidio L, Real Martinez CA, et al. Plasma Lipidomic Signature of Rectal Adenocarcinoma Reveals Potential Biomarkers. Front Oncol. 2018;7:325.
25. Zhao Z, Xiao Y, Elson P, Tan H, Plummer SJ, Berk M, et al. Plasma lysophos-phatidylcholine levels: Potential biomarkers for colorectal cancer. J Clin Oncol. 2007;25:2696-701.
26. Yu Z, Chen H, Zhu Y, Ai J, Li Y, Gu W, et al. Global lipidomics reveals two plasma lipids as novel biomarkers for the detection of squamous cell lung cancer: a pilot study. Oncol Lett. 2018;16:761-8.
27. Pakiet A, Kobiela J, Stepnowski P, Sledzinski T, Mika A. Changes in lipids composition and metabolism in colorectal cancer: a review. Lipids Health Dis. 2019;18:29.

AHEAD OF PRINTORIGINAL ARTICLE
Arq Gastroenterol • 2019. v. 56 nº 4 out/dez • 405
INTRODUCTION
The serotonin or 5-hydroxytryptamine (5-HT) is a major signaling molecule in the gastrointestinal tract (GIT) and is also considered as neurotransmitter, neuromodulator and a paracrine factor(1-4). The 5-HT is produced by the enterochromaffin (EC) cells, which form part of the epithelial lining of the gut. This signaling molecule is also present in the enteric neurons of the submucosal and myenteric plexuses of the Enteric Nervous System (ENS). The 5-HT release from EC cells, which is produced in response to the increase of the intraluminal pressure in the gastrointestinal, may stimulate both intrinsic and extrinsic primary afferent (sensory) neurons, via at least three different 5-HT receptors (e.g. 5-HT3, 5-HT4 and 5-HT1)(2,5). Activation of the 5-HT receptors may depolarize afferent nerve terminals, which can lead to a variety of physiological functions, including the initiation of peristalsis, vasodilatation, secretory reflexes and extrinsic primary afferents involved in transmission of sensory information to the Central Nervous System(2,6-9).
Abnormal levels of 5-HT in the circulating blood plasma and intestinal tissues have been associated with diarrhea, dysmotility and inflammation. Furthermore, 5-HT displays a crucial patho-physiological role in some gastrointestinal disorders(10-12).
Quercetin supplementation prevents changes in the serotonin and caspase-3 immunoreactive cells of the jejunum of diabetic rats
Juliana Vanessa Colombo MARTINS-PERLES, Isabela ZIGNANI, Sara Raquel Garcia de SOUZA, Flávia Cristina Vieira FREZ, Gleison Daion Piovezana BOSSOLANI and Jacqueline Nelisis ZANONI
Received 16/8/2019Accepted 14/10/2019
ABSTRACT – Background – Serotonin (5-HT) is present in the epithelial enterochromaffin cells (EC), mast cells of the lamina propria and enteric neurons. The 5-HT is involved in regulating motility, secretion, gut sensation, immune system and inflammation. Objective – Evaluate the effects of diabetes and quercetin supplementation on serotoninergic cells and its cell loss by apoptosis in jejunal mucosa of streptozotocin-induced diabetic rats (STZ-rats). Methods – Twenty-four male Wistar rats were divided into four groups: normoglycemic (C), normoglycemic supplemented with 40 mg/day quercetin (Q), diabetic (D) and diabetic supplemented with 40 mg/day quercetin (DQ). After 120 days, the jejunum was collected and fixated in Zamboni’s solu-tion for 18 h. After obtaining cryosections, immunohistochemistry was performed to label 5-HT and caspase-3. Quantification of 5-HT and caspase-3 immunoreactive (IR) cells in the lamina propria, villi and crypts were performed. Results – The diabetic condition displayed an increase of the number of 5-HT-IR cells in villi and crypts, while decreased number of these cells was observed in lamina propria in the jejunum of STZ-rats. In the diabetic animals, an increased density of apoptotic cells in epithelial villi and crypts of the jejunum was observed, whereas a decreased number of caspase-3-IR cells was observed in lamina propria. Possibly, quercetin supplementation slightly suppressed the apoptosis phenomena in the epithelial villi and crypts of the STZ-rats, however the opposite effect was observed on the 5-HT-IR cells of the lamina propria. Quercetin supplementation on healthy animals promoted few changes of serotoninergic function and apoptotic stimuli. Conclusion – These results suggest that quercetin supplementation mostly improved the serotonergic function affected by diabetes maybe due to antioxidant and anti-inflammatory properties of quercetin.
HEADINGS – Diabetes mellitus. Intestinal mucosa. Quercetin. Serotonin. Apoptosis. Rats.
Declared conflict of interest of all authors: noneDisclosure of funding: this work was supported by grants from Fundação Araucária (496/2010), Brasil.Universidade Estadual de Maringá, Departamento de Ciências Morfológicas – Laboratório de Plasticidade Neural Entérica, Maringá, PR, Brasil.Corresponding author: Juliana Martins Perles. E-mail: [email protected]
Diabetes mellitus (DM) is considered a complex and systemic metabolic disease characterized by the presence of hyperglycemia and increased oxidative stress(13,14). The diabetic neuropathy affects the organization of the ENS, resulting in quantitative loss of its cellular components with functional and morphological changes as-sociated with the mechanisms of cellular plasticity(13,15,16). Changes in the serotonin levels and serotonin-immunoreactive (-IR) cellular density has been already reported in GIT of diabetic animals(1,8). Additionally, changes in either levels of neuronal and mucosal serotonin or its receptors may be involved in the pathogenesis of diabetic diarrhea and the efficacy of the 5-HT3 receptor antago-nists, such as ondansetron(17) and ramosetron(18) used in the treat-ment of diabetic diarrhea has been already reported.
In this context, quercetin, a common dietary flavonoid, gave rise to a promising antidiarrheal molecule. Several studies in the past have revealed that quercetin may produce antidiarrheal effects(19,20), mainly due to their antihistamine and anti-inflammatory activi-ties(21,22). Furthermore, quercetin displays other important biological effects, including antioxidant, anticancer, hepatoprotective, anti-diabetic and antibacterial actions(23-25). In an electrophysiological study on mice, quercetin inhibits the 5-HT3 receptor-mediated ion current by interacting with pre-transmembrane domain I of Ca+2 channel(26). For these reasons, studies suggest that quercetin may
AG-2019-115dx.doi.org/10.1590/S0004-2803.201900000-81
Martins-Perles JVC, Zignani I, Souza SRG, Frez FCV, Bossolani GDP, Zanoni JN.Quercetin supplementation prevents changes in the serotonin and caspase-3 immunoreactive cells of the jejunum of diabetic rats
406 • Arq Gastroenterol • 2019. v. 56 nº 4 out/dez
inhibit diabetic diarrhea by serotonergic mechanisms. Besides its antioxidant activity, quercetin may protect cells from oxidative stress-mediated apoptosis(27,28). In addition, quercetin acts on di-verse signaling pathways, which mainly result in the suppression of the activation of inflammatory cells, decrease of oxidative stress due to its free radical scavenging, diminution of the activation of inflammatory cascades mediated by TNF-α and production of pro-inflammatory cytokines, thereby reducing the intestinal inflammation(24).
In line with previous studies regarding the quercetin proper-ties, the aim of the present study was to investigate the effect of diabetes and supplementation with quercetin on the serotonin-IR and caspase-3-IR cells in jejunal mucosa of diabetic rats in order to evaluate whether the diabetes impairs the serotoninergic intestinal function and whether quercetin avoids these diabetic consequences on the jejunum.
METHODS
AnimalsExperiments were performed using twenty-four male Wistar
rats (Rattus norvegicus) aged three months. The rats were obtained from the Central Biotery of the Universidade Estadual de Maringá and distributed into four groups: normoglycemic (C), normogly-cemic supplemented with quercetin (Q), diabetic (D) and diabetic supplemented with quercetin (DQ) (Protocol number: 03/2009).
Animals were housed in individual cages for 120 days using a 12 h/12h light-dark cycle and controlled temperature (24±2ºC). The animals received balanced standard Nuvital chow (Nuvilab, Colombo, PR, Brazil). Food and water were available ad libitum. All animal procedures were conducted in accordance with the ethical principles of the Brazilian Society of Science in Labora-tory Animals (SBCAL) and approved by the Committee of Ethics in Animal Experimentation (protocol number: 053/2009) of the Universidade Estadual de Maringá.
Animal model of diabetesAfter a 14 h fast, diabetes mellitus was induced in the rats of
the D and DQ groups by the injection of streptozotocin (35 mg/kg, iv; Sigma, St. Louis, MO, USA) dissolved in citrate buffer, pH 4.5 (10 mM). After four days of diabetes induction, glycemia was determined using an Accu-Chek Active glucometer (Roche Diag-nostics GmbH, Mannheim, Germany). The rats were considered diabetic whether the glucose levels were higher than 200 mg/dL, confirming the establishment of the experimental model.
The Q and DQ groups daily received water supplemented with quercetin (40 mg/day; Cromofarma, São Paulo, SP, Brazil) dis-solved in alkalized water solution with NaOH (1N) 8% and dose was calculated as described by De Souza et al. (2017)(29). The C and D groups only received water without quercetin supplementation.
After 120 days, the animals were weighed and anesthetized with 40 mg/kg Thiopental (i.p.; Cristália Laboratories, Itapira, SP, BRA). Blood samples were collected by cardiac puncture to determine glycemic levels using the glucose oxidase method(30). The jejunum was collected.
Tissue preparationThe jejunum was fixed in Zamboni’s solution (4% paraform-
aldehyde and 0.4% picric acid in phosphate buffer) for 18 h. After fixation, the tissue was repeatedly washed in phosphate buffered
saline (PBS; pH 7.4, 0.1 M) for 12 h. Afterwards, cryoprotection was performed in a solution of 18% sucrose in PBS for 24 h. After sample immersion in the soaking medium for frozen tissue (OCT 4583 compound; Tissue-Tek), tissues were frozen in liquid nitrogen and stored in a freezer at -70°C.
Afterwards, 10-µm semi-serial sections were obtained and disposed in identified slides previously prepared using poly-L-lysine (Sigma-Aldrich, St. Louis, MO, USA) solution in water concentration of 1:10 and stored at -20°C. Slides with five slices were prepared per animal to perform the immunohistochemistry.
ImmunohistochemistryFrozen histological sections were washed in PBS containing
0.5% Triton X-100 (2x10 min) (Sigma-Aldrich, Inc., São Paulo, Brazil), followed by incubation in PBS containing 10% goat serum for 1 h. After incubation, the intestinal samples were incubated in a solution containing the following primary antibodies: rabbit anti-5-HT (1:300, (Sigma-Aldrich, Co., St Louis, MO, USA) and goat anti-caspase-3 (1:200; Santa Cruz Biotechnology, inc., CA, USA) for 48 h at 4°C in a moist chamber. After incubation in the primary antibodies, the jejunal tissues were washed in PBS containing 0.5% Triton X-100 (3x10 min). After that, the intestinal samples were rinsed in PBS containing 0.5% Triton X-100 (2x10 min) and then, the jejunal segments were incubated in a solution that contained corresponding secondary antibodies: Alexa Fluor 488-conjugated donkey anti-rabbit IgG (Molecular Probes, Eugene, Oregon, USA) and Alexa Fluor 546-conjugated donkey anti-goat IgG (Molecular Probes, Eugene, Oregon, USA) for 2 h at room temperature. The histological sections were mounted using a ProLong Gold antifade reagent (Molecular Probes, Eugene, Oregon, USA).
Image analysisThe images of the histological sections were obtained using high
resolution camera Moticam® 2500 5.0 Mega Pixel (Motic China Group Co., Shanghai, China) coupled to a fluorescence microscope Olympus® BX40 (Olympus Co., Japan) and transferred to a PC us-ing the software Motic images Plus® 2.0 mL (Motic China Group Co., Shanghai, China). The images were captured using a 10x objective lens coupled with an eyepiece lens 10x, thereby the total magnification was 100x times. To obtain only the figures of this paper and morphological description of 5-HT-IR cells in lamina propria, the images were acquired using a Zeiss LSM 5 Pascal laser-scanning microscope (Carl Zeiss).
The numbers of caspase-3-IR and 5-HT-IR cells were separately quantified in the zone of villi, crypts and lamina propria, as well as their merge of these biological markers in each region. A total of either 50 units of villi or crypts or lamina propria (in the same zone of villi-crypts) per animal was evaluated.
Statistical analysisThe data were submitted to the analysis of normality and ho-
moscedasticity and data comparison was obtained by Randomized Block design. Data were tested for normality by the D’Agostino-Pearson test; comparisons between groups were performed by Newman-Keuls test for parametric data and nonparametric data was performed by Fisher’s test for nonparametric data. Statistical analyses were performed using Statistic® 7.1 software and Graph-Pad Prism® 6.1 software. For comparison between the different groups, values of P<0.05 were considered significant and data were reported as average ± standard error.

Martins-Perles JVC, Zignani I, Souza SRG, Frez FCV, Bossolani GDP, Zanoni JN.Quercetin supplementation prevents changes in the serotonin and caspase-3 immunoreactive cells of the jejunum of diabetic rats
Arq Gastroenterol • 2019. v. 56 nº 4 out/dez • 407
RESULTS
At the end of the experimental period, D and DQ groups showed a significant (P<0.00) increase in glycemia, was accom-panied by significant body weight loss. Glycemic values were 149.1±25.32 (C group), 144.7±16.33 (Q group) 564.4 mg/dL ±45.33 (D group) and 542.4 mg/dL ± 46.18 (DQ group) and final weight of groups C=521.1 g ±15.07, Q=500.0 g ±12.46, D=331.0 g ±16.39 and DQ=321.7 g ±20.25.
FIGURES 1 and 2 illustrate the histological sections used to quantify 5-HT-IR-cells, caspase-3-IR-cells and 5-HT-IR-caspase-3-IR cells. In the FIGURE 2, the villi can be visualized, especially for 5-HT-IR enteroendocrine cells (white arrow) in a higher magni-fication. In the lamina propria, next to the crypts, typical cells with morphological features similar to the mastocytes can be visualized in 5-HT-IR/caspase-3-IR cells (indicated by red arrows).
5-HT-IR cells, caspase-3-IR cells and their merge (5-HT-IR-caspase/3-IR cells) in the villus and crypts
In the villus, there was an increase in the number of the 5-HT-IR cells in the Q group (P<0.02) and D group (P<0.009) (vs C, FIGURE 3A). The supplementation with quercetin in the DQ
FIGURE 1. Confocal representative photomicrographs of 5-HT-IR cells, caspase-3-IR cells and 5-HT-IR/caspase-3-IR cells (merge) of the jejunum. Experimental groups: normoglycemic (C), normoglycemic supplemented with quercetin (Q), diabetic (D) and diabetic supplemented with quercetin (DQ). Calibration bar=200µm.
FIGURE 2. Confocal photomicrographs of 5-HT-IR cells, caspase-3--IR cells and 5-HT-IR/caspase-3-IR cells (merge) of the jejunum in the following groups: normoglycemic (C), normoglycemic supplemented with quercetin (Q), diabetic (D) and diabetic supplemented with quercetin (DQ). Calibration bar=50µm. The right column is showing zoomed images in the crypts (C group) and cell mast morphology (red arrow). On top of the mucosa, the zoomed image illustrated the villi region (D group) and cellular morphology of enterochromaffin cells (white arrow).
FIGURE 3. The number of 5-HT-IR cells (A), caspase-3-IR cells (B) and 5-HT-IR/caspase-3-IR cells (C) per 50 villi and crypt units in the jejunum. Experimental groups: normoglycemic (C), normoglycemic su-pplemented with quercetin (Q), diabetic (D) and diabetic supplemented with quercetin (DQ). The data are expressed as mean ± standard error. (n = 6/group). *P<0.05, compared to C group and **P<0.05 compared to D group).

Martins-Perles JVC, Zignani I, Souza SRG, Frez FCV, Bossolani GDP, Zanoni JN.Quercetin supplementation prevents changes in the serotonin and caspase-3 immunoreactive cells of the jejunum of diabetic rats
408 • Arq Gastroenterol • 2019. v. 56 nº 4 out/dez
group promoted a reduction of 42.70% in the number of these cells (vs D, P<0.006). The values observed in the DQ group were similar to the C group (P>0.05, FIGURE 3A). In the crypt, there was an increase in the number of 5HT-IR cells in Q, D and DQ groups (vs C, P<0.0001, FIGURE 3B), and this increase was more significant in the group DQ.
In villus and crypt, no differences were detected in the number of caspase-3-IR cells of Q group (vs C, FIGURE 3C and 3D). In these two regions in diabetic animals (D group), there was an increase in the number of caspase-3-IR cells (vs C, P<0.001, FIGURE 3C and D). Quercetin administration (DQ group) only reduced the number of caspase-3-IR cells in the crypt (vs D, P>0.05, FIGURE 3D).
The numbers of 5-HT-IR/Caspase-3-IR cells in the villus for Q groups (P<0.02) and D (P<0.01) were higher than the control (FIGURE 3E). In the crypt, there also was a significant increase in 5-HT-IR/Caspase-3-IR cells in D group (vs C, FIGURE 3F). In DQ group, there was a significant reduction in the number of 5-HT-IR/Caspase-3-IR cells in the villus (vs D, P<0.008, FIGURE 3E) and crypt (vs D, P>0.05, FIGURE 3F).
5-HT-IR cells, caspase-3-IR cells and their merge (5-HT-IR/caspase-3-IR cells) in the lamina propria
The number of 5-HT-IR cells in the lamina propria was re-duced in the Q (P<0.001), D (P<0.005) and DQ (P<0.0002) (vs C, FIGURE 4A) groups. However, regarding Caspase-3-IR and 5-HT-IR-Caspase-3-IR cells, there was no significant change between the studied groups (P>0.05, FIGURE 4B and 2C).
DISCUSSION
The diabetic condition was confirmed during the experiment through polyuria, polydipsia and polyphagia observed (data not shown). The severe hyperglycemia was comproved (group D and DQ >500 mg/dL).
The initial weight of the animals in the different groups showed no statistically significant difference (data not shown), while the weight at the end of the experimental protocol was significantly reduced in the diabetic groups. The lower weight gain in diabetic rats is characteristic and has been evidenced in other experiments performed in our research group(31,32).
Serotonin is produced by the epithelial EC cells, mast cells, T cells of lamina propria and enteric neurons(3). In this study, the immunohistochemical technique was used to label 5-HT-IR cells and caspase-3-IR cells in three different areas of GIT: epithelial villi, crypts and lamina propria.
The remarkably increased number of 5-HT-IR cells in the villus and crypt in the diabetic rats suggests an increase in the serotonin content in this region of epithelium. Recent studies strongly sug-gest that 5-HT can act as a pro-inflammatory signaling molecule in the mucosal layer of the small intestine(2,3,10,33). The increase in the 5-HT availability can activate primary afferent nerves, thereby contributing to intensify the motility and/or secretion during diabetes, which may be one of the causes of diabetic diarrhea(34). Furthermore, increased plasma levels of 5-HT are considered a biomarker for diabetic complications(35).
Regarding 5-HT-IR-caspase/3-IR cells, the diabetic condition yielded an increased number of these cells in the villi and crypt. Caspase-3 is an effector caspase that leads to the apoptotic mor-phological changes, such as: membrane blebbing, cytoplasmic and nuclear condensation, DNA fragmentation and formation of apoptotic bodies(36). In addition, hyperglycemia induces an increase of apoptosis phenomena associated to the increased oxidative stress(37). In the quantitative analysis, the diabetes promoted an increase of the number of caspase-3-IR cells in the villus (93.9%) and crypt (84%). These results demonstrated that the cell death was occurring in different cell types and not only in 5-HT-IR cells.
The quercetin supplementation in the DQ group promoted a significant reduction in the number of 5-HT-IR cells in the villi and enhance of these cells, even being non-significant, in the crypts in relation to the D group. These results were opposite to those observed in D group in relation to the C group, which indicate a serotoninergic reduction in the villi, though a proliferative action of 5-HT-IR cells was observed in the crypts. Anti- and proliferative ef-fects of quercetin on different cell types have been described in other studies(38-40). As above described, the significant reduction of 5-HT-IR cells by quercetin may indicate a beneficial anti-inflammatory effect since serotonin is considered a pro-inflammatory molecule.
In the villus and crypts, a lower number of 5-HT apoptotic cells was observed in diabetic animals that consumed quercetin compared to diabetic animals without supplementation, which demonstrates that the quercetin displayed a protective effect on this cell popula-tion. Such results may be indirectly explained since quercetin is an antioxidant, which displays free radical-scavenging activities(24,29), thereby the reduction of hyperglycemia-induced oxidative stress may result in a decrease of intracellular apoptotic stimuli(41). Furthermore, quercetin has anti-apoptotic actions already described(24-29).
In the analysis of caspase-3-IR cells in the villi and crypt, no alterations were observed in the DQ group in relation to the D group. Based on these results, quercetin yielded a protective effect especially in the 5-HT-IR cells on diabetic rats.
FIGURE 4. The number of 5-HT-IR cells (A), caspase-3-IR cells (B) and 5-HT-IR/caspase-3-IR cells (C) in lamina propria of 50 villus-crypt units in the jejunum. Experimental groups: normoglycemic (C), normoglycemic supplemented with quercetin (Q), diabetic (D) and diabetic supplemented with quercetin (DQ). The data are expressed as mean ± standard error (n=6 /group). *P<0.05 compared to C group.

Martins-Perles JVC, Zignani I, Souza SRG, Frez FCV, Bossolani GDP, Zanoni JN.Quercetin supplementation prevents changes in the serotonin and caspase-3 immunoreactive cells of the jejunum of diabetic rats
Arq Gastroenterol • 2019. v. 56 nº 4 out/dez • 409
As previously described, immunohistochemical staining for caspase-3 demonstrated that diabetes remarkably induced mucosal apoptosis in crypt epithelial cells. The integrity of the mucosal epithelium of GIT depends upon the balance among cell proliferation, cell migration and cellular death via apoptosis(42). In addition, quercetin exerts protective effects on cellular com-ponents of ENS (e.g. enteric glial cells and enteric neurons) and interstitial cells of Cajal by prevention of cellular loss(29,32,33,43) and from the results obtained in this work, regarding 5-HT-IR epithelial cells, quercetin supplementation was able to slightly prevent cell apoptosis induced by diabetes.
The quercetin-supplemented healthy rats displayed an increase of 5-HT-IR epithelial cells (villi and crypts) and reduction of these cells in lamina propria. Additionally, increased apoptosis of 5-HT cells was detected in the jejunum villi of rats of the Q group. It is known that secretion of 5-HT by the enterochromaffin cell may stimulate peristaltic reflexes and, thus this would modify intestinal motility. Furthermore, the enteroendocrine cell-derived 5-HT is an essential component of the gastrointestinal inflammatory response and is also a hormone, which inhibits osteoblast proliferation and promotes hepatic regeneration(8). For these reasons, quercetin-induced serotonergic effects should be further investigated.
In the lamina propria, the 5-HT-IR cells displayed a granular appearance and an circular or elliptical in form, when examined under confocal microscopy. No other 5-HT-IR morphological features were seen in these layers. Stoyanova and Gulubova(44) also detected 5-HT positive cells in the lamina propria of the colon in humans using toluidine blue and tryptase staining, indicating they are mast cells. Other researchers reported that rodent mast cells may synthesize and release 5-HT to the appropriate target cells(2). In the lamina propria, mast cells are preferentially located next to nerve terminals, where they are activated by secreted neuropeptides, such as substance P. When these cells are stimulated by substance P, mast cells release inflammatory mediators, such as serotonin and proteases as well as proinflammatory cytokines(45).
The results observed in the lamina propria 5-HT-IR cells demonstrated a statistically significant reduction in the number of these cells in the Q, D and DQ groups. Mast cells are involved in mediating subsequent tissue repair and exacerbating and/or modulating inflammation(46). Quercetin is known as a natural inhibitor of mast cell activation through the inhibition of Ca2+ influx, thereby demonstrating that quercetin may have acted as a natural anti-inflammatory since mast cells release many cytokines involved in inflammatory process(47). Therefore, the quercetin sta-bilizes the cell membrane of mast cells and basophils that contains histamine and serotonin, preventing the release of these chemicals mediators(47,48), thereby downregulating the density of 5-HT-IR mast cells observed in this work.
The decreased number of 5-HT-IR cells in the lamina propria
of diabetic rats was not caused by increase of apoptosis process of these cells. Furthermore, there was no significant alteration in the number of 5-HT-IR/caspase-3-IR cells in lamina propria of the analyzed groups, including the D group. The quercetin sup-plementation reverted the reduction of 5-HT-IR cells in D group, although the quercetin has also well-known stabilizing capacity of cell membrane of mast cells, which are important regulators of in-testinal function and tight junction integrity(49). However, quercetin may have normalized the cell death process in other cell types in the lamina propria, which was altered due to diabetic condition.
Based on quercetin supplementation effects under healthy con-dition, slight changes, in which most results were non-significant, were observed in the serotoninergic function and apoptotic stimuli. For these reasons, regarding our results in CQ group, non-toxic ef-fects were observed but further studies have to be performed using different quercetin doses and supplementation times.
CONCLUSION
Therefore, diabetes promoted increased number of cells 5-HT-IR in villus and crypt, although decreased density of these cells in the lamina propria was observed in the jejunum of diabetic animals. On the other hand, diabetic rats that consumed quercetin presented a lower number of 5-HT-IR cells with values similar to the control. Furthermore, the apoptosis process was increased in the villi and crypt regions in the jejunum of the diabetic group. The quercetin supplementation possibly suppressed the apoptosis of the 5-HT-IR cells in the jejunal mucosa of the diabetic rats, but other studies should be done to better investigate the effects of quercetin on the apoptotic events. For these reasons, in general, supplementation with quercetin revealed to display mainly protective actions against serotoninergic changes in the jejunal mucosa of diabetic rats prob-ably due to its antioxidant and anti-inflammatory properties.
Authors’ contributionMartins-Perles JVC: data collection, survey execution, writing
of text. Zignani I: data collection, survey execution. Souza SRG: data collection, survey execution. Frez FCV: data collection, sur-vey execution. Bossolani GDP: survey execution, writing of text. Zanoni JN: survey execution, writing of text, Advisor.
OrcidJuliana Vanessa Colombo Martins Perles. Orcid: 0000-0002-6701-2917.Isabela Zignani. Orcid: 0000-0002-3410-6298.Sara Raquel Garcia de Souza. Orcid: 0000-0002-1599-5341.Flávia Cristina Vieira Frez. Orcid: 0000-0002-4579-7127. Gleison Daion Piovezana Bossolani. Orcid: 0000-0001-6472-2748.Jacqueline Nelisis Zanoni. Orcid: 0000-0002-2892-5123.
Martins-Perles JVC, Zignani I, Souza SRG, Frez FCV, Bossolani GDP, Zanoni JN.Quercetin supplementation prevents changes in the serotonin and caspase-3 immunoreactive cells of the jejunum of diabetic rats
410 • Arq Gastroenterol • 2019. v. 56 nº 4 out/dez
REFERENCES
1. Gershon MD, Tack J. The serotonin signaling system: from basic understanding to drug development for functional GI disorders. Gastroenterology. 2007;132:397-414.
2. Mawe GM, Hoffman JM. Serotonin signalling in the gut-functions, dysfunctions and therapeutic targets. Nat Rev Gastroenterol Hepatol. 2013;10:473-86.
3. Shajib MS, Baranov A, Khan WI. Diverse Effects of Gut-Derived Serotonin in Intestinal Inflammation. ACS Chem Neurosci. 2017;8:920-31.
4. Terry N, Margolis KG. Serotonergic Mechanisms Regulating the GI Tract: Experimental Evidence and Therapeutic Relevance. Handb Exp Pharmacol. 2016;319-42.
5. Molderings G. Physiological, Pathophysiological and Therapeutic Impact of the Enteric Serotonergic System. Arzneimittelforschung. 2012;62:157-66.
6. Li Z, Chalazonitis A, Huang Y, Mann JJ, Margolis KG, Yang QM, et al. Essential Roles of Enteric Neuronal Serotonin in Gastrointestinal Motility and the Develop-ment/Survival of Enteric Dopaminergic Neurons. J Neurosci. 2011;31:8998-9009.
7. Gershon MD. Serotonin is a sword and a shield of the bowel: serotonin plays offense and defense. Trans Am Clin Climatol Assoc. 2012;123:268-80.
8. Gershon MD. 5-Hydroxytryptamine (serotonin) in the gastrointestinal tract. Curr Opin Endocrinol Diabetes Obes. 2013;20:14-21.
9. Keating DJ, Spencer NJ. What is the role of endogenous gut serotonin in the control of gastrointestinal motility? Pharmacol Res. 2018.
10. Manocha M, Khan WI. Serotonin and GI Disorders: An Update on Clinical and Experimental Studies. Clin Transl Gastroenterol. 2012;3:e13-e13.
11. Shajib MS, Khan WI. The role of serotonin and its receptors in activation of immune responses and inflammation. Acta Physiol (Oxf). 2015;213:561-74.
12. Coates MD, Tekin I, Vrana KE, Mawe GM. Review article: the many potential roles of intestinal serotonin (5-hydroxytryptamine, 5-HT) signalling in inflam-matory bowel disease. Aliment Pharmacol Ther. 2017;46:569-80.
13. Bagyánszki M, Bódi N. Diabetes-related alterations in the enteric nervous system and its microenvironment. World J Diabetes. 2012;3:80-93.
14. Gotfried J, Priest S, Schey R. Diabetes and the Small Intestine. Curr Treat Options Gastroenterol. 2017;15:490-507.
15. Uranga-Ocio JA, Bastús-Díez S, Delkáder-Palacios D, García-Cristóbal N, Leal-García MÁ, Abalo-Delgado R. Enteric neuropathy associated to diabetes mellitus. Rev Esp Enferm Dig. 2015;107:366-73.
16. Azpiroz F, Malagelada C. Diabetic neuropathy in the gut: pathogenesis and diagnosis. Diabetologia. 2015;59;404-8.
17. Bossi A, Baresi A, Ballini A, Bindelli C. Ondasentron in the treatment of diabetic diarrhea. Diabetes Care. 1994;17:453-4.
18. Murao S, Hosokawa H. Serotonin 5-HT3 receptor antagonist for treatment of severe diabetic diarrhea. Diabetes Care. 2010;33:e38.
19. Galvez J, Zarzuelo A, Crespo M, Lorente M, Ocete M, Jimenez J. Antidiarrhoeic activity of Euphorbia hirta extract and isolation of an active flavonoid constituent. Planta Medica 1993;59:333-6.
Martins-Perles JVC, Zignani I, Souza SRG, Frez FCV, Bossolani GDP, Zanoni JN. A suplementação com quercetina previne mudanças em células imu-norreativas à serotonina e caspase-3 do jejuno de ratos diabéticos. Arq Gastroenterol. 2019;56(4):405-11.RESUMO – Contexto – A serotonina (5-HT) está presente nas células epiteliais enterocromafins (CE), nos mastócitos da lâmina própria e nos neurônios
entéricos. A 5-HT está envolvida na regulação da motilidade, secreção, nocepção intestinal, sistema imunológico e inflamação. Objetivo – Avaliar os efeitos do diabetes e da suplementação de quercetina sobre a função serotoninérgica e a perda celular por apoptose na mucosa jejunal de ratos diabéti-cos induzidos por estreptozotocina (ratos STZ). Métodos – Vinte e quatro ratos Wistar machos foram divididos em quatro grupos: normoglicêmico (C), normoglicêmico suplementado com quercetina 40 mg/dia (Q), diabético (D) e diabético suplementado com quercetina 40 mg/dia (DQ). Após 120 dias, o jejuno foi coletado e fixado na solução de Zamboni por 18 horas. Após a obtenção de cortes em criostato, a imuno-histoquímica foi realizada para marcar 5-HT e caspase-3. A quantificação de células imunorreativas (IR) à 5-HT e caspase-3 foram realizadas na lâmina própria, vilosidades e criptas. Resultados – A condição diabética ocasionou um aumento do número de células 5-HT-IR nas vilosidades e criptas, enquanto que na lâmina própria houve uma redução dessas células, no jejuno de ratos STZ. Nos animais diabéticos, foi observada uma densidade aumentada de células apoptóticas no epitélio do jejuno, tanto nas vilosidades quanto nas criptas, por outro lado um número reduzido de células caspase-3-IR foi obser-vado na lâmina própria. Possivelmente, a suplementação de quercetina suprimiu ligeiramente os fenômenos de apoptose no epitélio de vilosidades e criptas do jejuno de ratos STZ, no entanto, o efeito oposto foi observado nas células 5-HT-IR da lâmina própria. A suplementação com quercetina em animais saudáveis promoveu poucas alterações na função serotoninérgica e nos estímulos apoptóticos. Conclusão – Estes resultados sugerem que a suplementação de quercetina melhorou principalmente a função serotoninérgica afetada pelo diabetes, talvez devido às propriedades antioxidantes e anti-inflamatórias da quercetina.
DESCRITORES – Diabetes mellitus. Mucosa intestinal. Quercetina. Serotonina. Apoptose. Ratos.
20. Galvez J, Sanchez M, Jimenez J, Torres MI, Fernandez MI, Nunez MC, et al. Effect of quercetin on lactose-induced diarrhoea in rats. Planta Medica. 1995;61:302-6.
21. Galvez J, Crespo ME, Jimenez J, Suarez A, Zarzuelo A. Anti-diarrhoeic activity of quercetrin in mice and rats. J Pharm Pharmacol. 1993;45:157-9.
22. Zhang WJ, Chen BT, Wang CY, Zhu QH, Mo ZX. Mechanism of quercetin as an antidiarrheal agent. Di Yi Jun Yi Da Xue Xue Bao. 2003;23:1029-31.
23. Abdelmoaty MA, Ibrahim MA, Ahmed NS, Abdelaziz MA. Confirmatory studies onthe antioxidant and antidiabetic effect of quercetin in rats. Indian J Clin Biochem. 2010;25:188-92.
24. Li, Y, Yao, J, Han, C, Yang, J, Chaudhry, MT, Wang, S, Yin, Y. Quercetin, inflammation and immunity. Nutrients. 2016;8:167.
25. Roslan J, Giribabu N, Karim K, Salleh N. Quercetin ameliorates oxidative stress, inflammation and apoptosis in the heart of streptozotocin-nicotinamide-induced adult male diabetic rats. Biomed Pharmacother. 2017;86:570-82.
26. Lee BH, Jeong S, Jung S, Lee J, Kim J, Yoon I, et al. Quercetin inhibits the 5-hydroxytryptamine type 3 receptor-mediated ion current by interacting with pre-transmembrane domain I. Mol Cells. 2005;20:69-73.
27. Gomes IB, Porto ML, Santos MCL, Campagnaro BP, Pereira TM, Meyrelles SS, et al. Renoprotective, anti-oxidative and anti-apoptotic effects of oral low-dose quercetin in the C57BL/6J model of diabetic nephropathy. Lipids Health Dis. 2014;13:184.
28. Yang T, Kong B, Gu JW, Kuang YQ, Cheng L, Yang WT, et al. Anti-apoptotic and Anti-oxidative Roles of Quercetin After Traumatic Brain Injury. Cell Mol Neurobiol. 2014;34:797-804.
29. de Souza SR, de Miranda Neto MH, Martins Perles JV, Vieira Frez FC, Zignani I, Ramalho FV, et al. Antioxidant Effects of the Quercetin in the Jejunal Myenteric Innervation of Diabetic Rats. Front Med (Lausanne). 2017;4:8.
30. Bergmeyer HU. Methods of Enzymatic Analysis. Bergmeyer HU, Bernet E, editors. Academic Press: New York; 1974.
31. Lopes CR, Ferreira PE, Zanoni JN, Alves AM, Alves EP, Buttow NC. Neu-roprotective effect of quercetin on the duodenum enteric nervous system of streptozotocin-induced diabetic rats. Dig Dis Sci. 2012;57:3106-15.
32. Ferreira PE, Lopes CR, Alves AM, Alves ÉP, Linden DR, Zanoni JN, Buttow NC. Diabetic neuropathy: an evaluation of the use of quercetin in the cecum of rats. World J Gastroenterol. 2013;19:6416-26.
33. Margolis KG, Gershon MD. Enteric Neuronal Regulation of Intestinal Inflam-mation. Trends Neurosci. 2016;39:614-24.
34. Chen JJ, Li Z, Pan H, Murphy DL, Tamir H, Koepsell H, et al. Maintenance of serotonin in the intestinal mucosa and ganglia of mice that lack the high-affinity serotonin transporter: abnormal intestinal motility and the expression of cation transporters. J Neurosci. 2001;21:6348-61.
35. Yang Y, Huang H, Xu Z, Duan J. Serotonin and Its Receptor as a New Antioxidant Therapeutic Target for Diabetic Kidney Disease. J Diabetes Res. 2017;1-9.

Martins-Perles JVC, Zignani I, Souza SRG, Frez FCV, Bossolani GDP, Zanoni JN.Quercetin supplementation prevents changes in the serotonin and caspase-3 immunoreactive cells of the jejunum of diabetic rats
Arq Gastroenterol • 2019. v. 56 nº 4 out/dez • 411
36. Chen H, Yang X, Feng Z, Tang R, Ren F, Wei K, et al. Prognostic value of Caspase-3 expression in cancers of digestive tract: a meta-analysis and systematic review. Int J Clin Exp Med. 2015;8:10225-34.
37. Zhao M, Liao D, Zhao J. Diabetes-induced mechanophysiological changes in the small intestine and colon. World J Diabetes. 2017;8:249-69.
38. Liu Y, Tang ZG, Lin Y, Qu XG, Lv W, Wang GB, Li CL. Effects of quercetin on proliferation and migration of human glioblastoma U251 cells. Biomed Pharmacother. 2017;92:33-8.
39. Choi EJ, Bae SM, Ahn WS. Antiproliferative effects of quercetin through cell cycle arrest and apoptosis in human breastcancer MDA-MB-453 cells. Arch Pharm Res. 2008;31:1281-5.
40. Rotelli AE, Aguilar CF, Pelzer LE. Structural basis of the anti-inflammatory activity of quercetin: inhibition of the 5-hydroxytryptamine type 2 receptor. Eur Biophys J. 2009;38:865-71.
41. Lee SC, Pervaiz S. Apoptosis in the pathophysiology of diabetes mellitus. Int J Biochem Cell Biol. 2007;39:497-504.
42. Delgado ME, Grabinger T, Brunner T. Cell death at the intestinal epithelial front line. The FEBS Journal. 2015;283:2701-19.
43. Vieira-Frez FC, Martins Colombo Perles JV, Robert Linden D, Gibbons SJ, Amilcar Martins H, Almeida Brito Romualdo D, et al. Restoration of density of interstitial cells of Cajal in the jejunum of diabetic rats after quercetin sup-plementation. Rev Esp Enferm Dig. 2017;109:190-5.
44. Stoyanova II, Gulubova MV. Mast cells and inflammatory mediators in chronic ulcerative colitis. Acta Histochem. 2002;104:185-92.
45. Da Silva EZM, Jamur MC, Oliver C. Mast Cell Function. J Histochem Cytochem. 2014;62:698-738.
46. Tellechea A, Leal EC, Kafanas A, Auster ME, Kuchibhotla S, Ostrovsky Y, et al. Mast Cells Regulate Wound Healing in Diabetes. Diabetes. 2016;65:2006-19.
47. Mlcek J, Jurikova T, Skrovankova S, Sochor J. Quercetin and Its Anti-Allergic Immune Response. Molecules. 2016;21:623.
48. Middleton E, Kandaswami C, Theoharides TC. The effects of plant flavonoids on mammalian cells: implications for inflammation, heart disease, and cancer. Pharmacol Rev. 2000;52:673-751.
49. Bischoff SC, Krämer S. Human mast cells, bacteria, and intestinal immunity. Immunol Rev. 2007;217:329-37.
AHEAD OF PRINTORIGINAL ARTICLE
412 • Arq Gastroenterol • 2019. v. 56 nº 4 out/dez
INTRODUCTION
Percutaneous endoscopic gastrostomy (PEG) was first per-formed by Gauderer and colleges in 1999(1) and rapidly became the main support of nutritional care for patients with long-term swallowing dysfunction(2). PEG is thought to be a more accept-able choice to deliver food than nasogastric tube because it is not associated with uncomfortable oropharyngeal symptoms and has better aesthetic appeal(3). As opposed to nasogastric feeding, PEG use decreases the incidence of complications such as esophageal esophagitis and respiratory infections, resulting in lower risk of occlusion and dislocation and better compliance(4). An increasingly common indication for PEG placement is the nutritional support provided to older patients who have lost their ability to eat because of cerebrovascular diseases, or who have severe incapability due to neurological chronic disease or advanced dementia(2,3,5,6).
Although PEG placement is safe(7), it is not free from the risk of mortality nor devoid of early severe complications, including bleeding, peritonitis, bowel obstruction or perforation, and abscess of operative wound(4,8). Therefore, studies worldwide have failed to demonstrate benefits of PEG tube in older patients(9,10). In case of in-hospital and 30-day postoperative stages, mortality can be as
Risk factors associated with early mortality after percutaneous endoscopic gastrostomy in patients at a tertiary care center in Brazil: a retrospective single-center survival studyLuiz Eduardo MIRANDA1, Marcel Rolland Ciro da PENHA1, Ana Clara Galindo MIRANDA2, Diego Laurentino LIMA1, Matheus Wanderly Fernandes COSTA2 and Alexandre de Oliveira AMORIM2
Received 22/8/2019Accepted 14/10/2019
ABSTRACT – Background – Percutaneous endoscopic gastrostomy (PEG) is the main accepted method for long-term tube feeding. Objective – To inves-tigate the risk factors associated with early mortality after PEG. Methods – Retrospective survival analysis in a tertiary-level center in Recife, Brazil. We reviewed the medical records of 150 patients with PEG placement. The data were analysed by the Kaplan-Meier method. Multivariable Cox proportional regression models were also built to test the effects of PEG on mortality. Results – A total of 150 patients who submitted to PEG were studied (70 male). Of the participants, 87 (58%) had blood hypertension; 51 (34%) patients had diabetes; 6 (4%) patients had chronic renal disease; and 6 (4%) had malignancy. Chronic neurodegenerative diseases were the more common clinical indication for PEG. The 30-day and 60-day proportional mortality probability rates were 11.05% and 15.34% respectively. A multivariate Cox proportional regression model, haemoglobin (HR 4.39, 95% CI 1.30–14.81, P=0.017) and pre-procedure UCI staying (HR 0.66, 95% CI 0.50–0.87, P=0.004) were significant predictors of early mortality. A haemoglobin cut-off value of 10.05 g/dL was shown to have a sensibility of 82.6% (61.2% to 95% CI) and an acceptable sensitivity of 59.0 (50.6% to 68.6% CI), and a likelihood ratio of 2.06 for eight weeks mortality. Conclusion – In patients who had been subjected to the PEG procedure for long-term nutrition, low haemoglobin, pre-procedure intensive care unit internment or both are associated with the risk of early mortality.
HEADINGS – Deglutition disorders. Malnutrition. Enteral nutrition. Critical illness. Dementia.
Declared conflict of interest of all authors: noneDisclosure of funding: no funding received1 Universidade de Pernambuco, Hospital Universitário Oswaldo Cruz, Departamento de Cirurgia Geral e Transplante Hepático, Recife, PE, Brasil. 2 Universidade de Pernambuco, Faculdade de Ciências Médicas, Recife, PE, Brasil. Corresponding author: Diego Laurentino Lima. E-mail: [email protected]
high as 10.3% and 54% respectively(11-15), especially in hospitalized patients, although the procedure-related mortality itself is 0.5% to 2%. Indicating the procedure to a patient who naturally dies a few days after it is a bad decision(7,16,17). Therefore, it is imperative to improve PEG indication to choose only those patients who actually have a chance of benefiting from it, thereby voiding futile indications(6,18).
We reviewed our experience with PEG placement at a private tertiary-care Brazilian hospital and investigated independent varia-bles associated with early mortality after PEG, considering only simple clinical and laboratory variables easily found for most patients.
METHODS
PatientsPatients with swallow dysfunction treated with PEG between
January 2012 and December 2016 at the Unimed Recife Hospital were retrospectively studied from an electronic database. This is a tertiary-care hospital which works for a cooperative of medical services as a unit of supplementary health service in Brazil. This hospital is highly certified by the Canadian Council for Health Service Accreditation because of the quality of its clinical protocols
AG-2019-120dx.doi.org/10.1590/S0004-2803.201900000-83
Miranda LE, Penha, MRC, Miranda ACG, Lima DL, Costa MWF, Amorim AO.Risk factors associated with early mortality after percutaneous endoscopic gastrostomy in patients at a tertiary care center in Brazil: a retrospective single-center survival study
Arq Gastroenterol • 2019. v. 56 nº 4 out/dez • 413
and patient security. It has an electronic medical records system that has the highest level of certification by the Healthcare Information and Management System Society.
Data were collected from adults, of both genders, requiring long-term enteral nutrition that has been submitted to first PEG placement. Outpatients, patients whose chart records were incom-plete, and patients who had submitted to PEG replacement and those whose procedure had not been unsuccessful were excluded.
No dysphagia score was used. PEG placement was indicated by the doctor responsible for the patient through clinical observation that he/she was no longer able to feed themselves or with the help of another person and that he/she was dependent on tube feeding. The patient or his/her family, if the patients could not decide for themselves, was informed about advantages, disadvantage, risk, costs and potential clinical or surgical complications related to PEG placement and authorized it.
The following variables were collected: gender, age, mean diagnosis (e.g., Parkinson disease, sequels of stroke, dementia, tumours, and senility), comorbidities (diabetes mellitus, arterial hypertension, and renal insufficiency), laboratory exams (urea, haemoglobin), pre- and post-operative hospitalization in intensive care unit (ICU), orotracheal tube procedure, tracheostomy and dialysis (considering a period of two months before and after the procedure), the presence of surgical complications, diagnosis of the underlying disease, the endoscopy report and the time of survival.
Surgical techniqueAll procedures were performed by the same surgical team
(MRCP, the surgeon and LECM, the endoscopist, both experi-enced) who ensured the well being of the patient until the moment of discharge and were responsible for the medical records. The support of an anaesthesiologist was indicated when necessary and at the discretion of the medical team.
Immediately prior to the initiation of the procedure, 2 g of cefazolin was injected intravenously as a prophylactic antibiotic, unless the patient was already taking antibiotics for another reason. Two puffs of 10% xylocaine spray were released in the oropharynx. Sedation was done with 50 μg fentanyl and 1% propofol by the sur-gical team or with the anaesthesiologist’s assistance when necessary and slowly until reaching the desired sedation plan.
All patients received oxygen via nasal catheter or tracheostomy and were monitored for pulse oximetry, blood pressure, and heart rate and frequency. The procedure was performed in an endoscopy room that meets the requirements of Brazilian legislation for an endoscopic centre. PEG was performed by the traction method using a standard forward-view endoscope (GIFH-180; Olympus America, Center Valley, PA). Upon endoscopic observation, a place in the anterior wall of the distal fornix was chosen and a puncture was made at this point through the abdominal wall using a needle 16 gauge until it reached the stomach lumen. Through this needle was delivered a guide wire, which was taken by a loop and exter-nalized via the patient’s mouth. This guide was attached to a PEG tube. The surgeon drew the guide wire through the abdominal wall, taking the tube from the mouth to the stomach and externalizing it through the abdominal wall. A silicone dome at the end of the probe prevents it from being drawn out of the stomach. The external bolster of the PEG kit was placed, keeping the probe attached to the abdominal wall and the stomach in juxtaposition to the inner abdominal wall. This creates a fistula between the stomach and the external environment through which the patient can be fed. The
round external bolster was fixed to the skin with 3.0 nylon stitches and the same wire was attached to the gastrostomy tube, prevent-ing it from moving into the abdomen. The stitches were removed by the surgical team itself 48–72 hours after the procedure and the tube was loosened by 0.5 cm to avoid the buried bumper syndrome. The patients were kept under observation of the responsible team until recovery from sedation and then sent to the hospital sector of origin. Six hours after the procedure, as long as no postoperative complications were observed, feeding was allowed partially by the gastrostomy tube, and after 24 hours, they were fed according to the nutritional demands of each patient.
Either an EndoViveTM enteral access initial placement system (24Fr Peg-Kit, Boston Scientific, Marlborough Mass, USA) or a PEG 24® Pull Method Kit (Cook Endoscopy, Indiana, USA) was used at the endoscopist’s judgment.
Follow ups were conducted with each patient by the medical staff until the hospital discharge. The caregiver was instructed in the handling and maintenance of the gastrostomy cannula in order to avoid complications such as buried bumper syndrome or tube avulsion.
The following complications were defined: Buried bumper syndrome – migration of the silicone dome alongside the track of the stoma outside the stomach, occluding the gastric orifice; abscess – purulent drainage through the gastrostomy port; perito-nitis – inflammation (caused by extravasation of gastric contents or food) of the membrane lining the abdominal wall, which then covers the abdominal organs; avulsion – the patient or caregiver himself/herself inadvertently pulls the gastrostomy tube completely out; dermatitis – inflammation of the dermis caused by extravasation of gastric contents by the external orifice; and bleeding – haemor-rhage through the external orifice of gastrostomy.
Statistical analysisCategorical values were described by proportions and com-
pared by chi-square test or Fisher’s exact test, when appropriate. Continuous values were expressed by mean ± standard deviation or median and minimum-maximum and compared by Student’s t-test or the Mann-Whitney U test respectively.
In order to identify individual potential factors influencing the death prognosis associated with PEG at eight weeks follow-up, univariate Cox models were used. All factors with P<0.20 after univariate analysis were included in the multivariate Cox model to assess their independent prognosis effects. Then, a backward stepwise procedure was used to select the final Cox model, retain-ing only those factors with P<0.05. In the univariate as well as in the multivariate Cox models, hazard ratios (HR) and the respec-tive 95% confidence interval (CI) were reported. To evaluate the proportionality assumption and overall fit of the Cox models, graphics and tests based, respectively, on the scaled Schoenfeld and Cox-Snell residuals were examined. No serious violation of either the proportionality assumption or the overall fit of the models was observed. Overall survival was estimated by using the Kaplan-Meier method. All tests were two-sided and statistical significance was defined as a P value less than 0.05. The receiver operating curve (ROC curves) was applied to calculate the sensibility and specific-ity of predictors for short-term survival. The area under a ROC curve quantifies the overall ability of the predictor to discriminate between those individuals with the outcome and those without the outcome. The validity of the model was measured by means of the area under the receiving operating characteristic curve (AUROC).
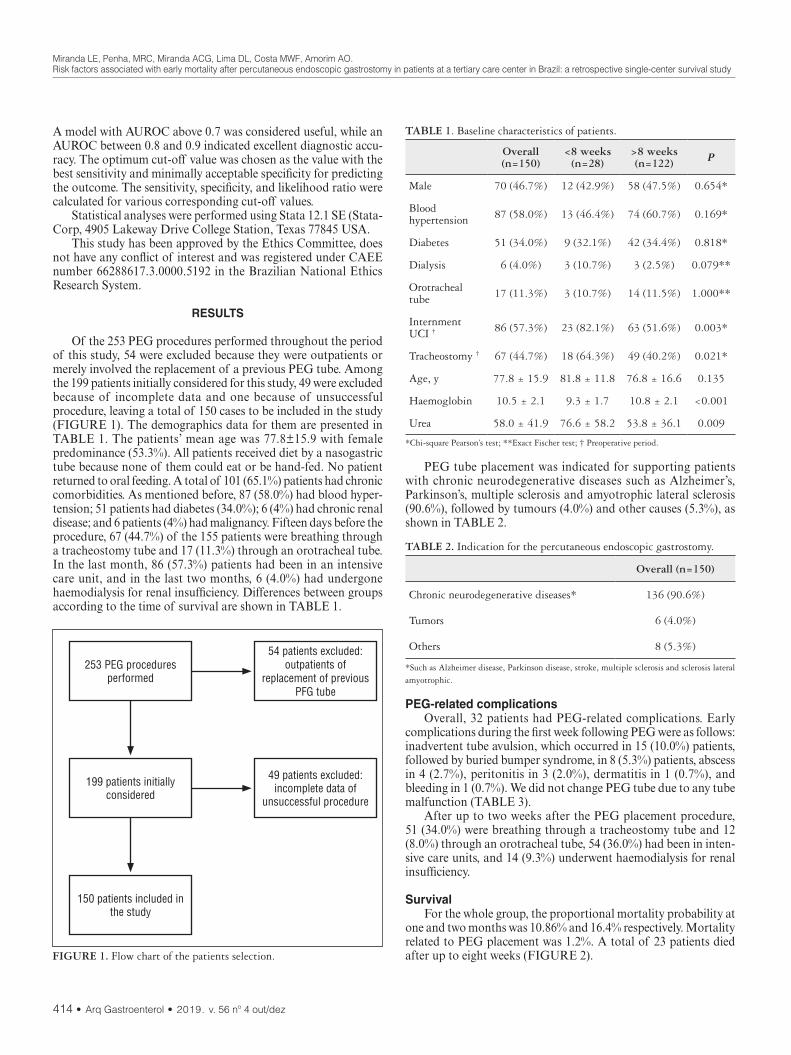
Miranda LE, Penha, MRC, Miranda ACG, Lima DL, Costa MWF, Amorim AO.Risk factors associated with early mortality after percutaneous endoscopic gastrostomy in patients at a tertiary care center in Brazil: a retrospective single-center survival study
414 • Arq Gastroenterol • 2019. v. 56 nº 4 out/dez
A model with AUROC above 0.7 was considered useful, while an AUROC between 0.8 and 0.9 indicated excellent diagnostic accu-racy. The optimum cut-off value was chosen as the value with the best sensitivity and minimally acceptable specificity for predicting the outcome. The sensitivity, specificity, and likelihood ratio were calculated for various corresponding cut-off values.
Statistical analyses were performed using Stata 12.1 SE (Stata-Corp, 4905 Lakeway Drive College Station, Texas 77845 USA.
This study has been approved by the Ethics Committee, does not have any conflict of interest and was registered under CAEE number 66288617.3.0000.5192 in the Brazilian National Ethics Research System.
RESULTS
Of the 253 PEG procedures performed throughout the period of this study, 54 were excluded because they were outpatients or merely involved the replacement of a previous PEG tube. Among the 199 patients initially considered for this study, 49 were excluded because of incomplete data and one because of unsuccessful procedure, leaving a total of 150 cases to be included in the study (FIGURE 1). The demographics data for them are presented in TABLE 1. The patients’ mean age was 77.8±15.9 with female predominance (53.3%). All patients received diet by a nasogastric tube because none of them could eat or be hand-fed. No patient returned to oral feeding. A total of 101 (65.1%) patients had chronic comorbidities. As mentioned before, 87 (58.0%) had blood hyper-tension; 51 patients had diabetes (34.0%); 6 (4%) had chronic renal disease; and 6 patients (4%) had malignancy. Fifteen days before the procedure, 67 (44.7%) of the 155 patients were breathing through a tracheostomy tube and 17 (11.3%) through an orotracheal tube. In the last month, 86 (57.3%) patients had been in an intensive care unit, and in the last two months, 6 (4.0%) had undergone haemodialysis for renal insufficiency. Differences between groups according to the time of survival are shown in TABLE 1.
PEG tube placement was indicated for supporting patients with chronic neurodegenerative diseases such as Alzheimer’s, Parkinson’s, multiple sclerosis and amyotrophic lateral sclerosis (90.6%), followed by tumours (4.0%) and other causes (5.3%), as shown in TABLE 2.
TABLE 1. Baseline characteristics of patients.
Overall (n=150)
<8 weeks (n=28)
>8 weeks (n=122) P
Male 70 (46.7%) 12 (42.9%) 58 (47.5%) 0.654*
Blood hypertension 87 (58.0%) 13 (46.4%) 74 (60.7%) 0.169*
Diabetes 51 (34.0%) 9 (32.1%) 42 (34.4%) 0.818*
Dialysis 6 (4.0%) 3 (10.7%) 3 (2.5%) 0.079**
Orotracheal tube 17 (11.3%) 3 (10.7%) 14 (11.5%) 1.000**
Internment UCI † 86 (57.3%) 23 (82.1%) 63 (51.6%) 0.003*
Tracheostomy † 67 (44.7%) 18 (64.3%) 49 (40.2%) 0.021*
Age, y 77.8 ± 15.9 81.8 ± 11.8 76.8 ± 16.6 0.135
Haemoglobin 10.5 ± 2.1 9.3 ± 1.7 10.8 ± 2.1 <0.001
Urea 58.0 ± 41.9 76.6 ± 58.2 53.8 ± 36.1 0.009
*Chi-square Pearson’s test; **Exact Fischer test; † Preoperative period.
FIGURE 1. Flow chart of the patients selection.
253 PEG proceduresperformed
199 patients initiallyconsidered
150 patients included inthe study
54 patients excluded:outpatients of
replacement of previousPFG tube
49 patients excluded:incomplete data of
unsuccessful procedure
TABLE 2. Indication for the percutaneous endoscopic gastrostomy.
Overall (n=150)
Chronic neurodegenerative diseases* 136 (90.6%)
Tumors 6 (4.0%)
Others 8 (5.3%)
*Such as Alzheimer disease, Parkinson disease, stroke, multiple sclerosis and sclerosis lateral amyotrophic.
PEG-related complicationsOverall, 32 patients had PEG-related complications. Early
complications during the first week following PEG were as follows: inadvertent tube avulsion, which occurred in 15 (10.0%) patients, followed by buried bumper syndrome, in 8 (5.3%) patients, abscess in 4 (2.7%), peritonitis in 3 (2.0%), dermatitis in 1 (0.7%), and bleeding in 1 (0.7%). We did not change PEG tube due to any tube malfunction (TABLE 3).
After up to two weeks after the PEG placement procedure, 51 (34.0%) were breathing through a tracheostomy tube and 12 (8.0%) through an orotracheal tube, 54 (36.0%) had been in inten-sive care units, and 14 (9.3%) underwent haemodialysis for renal insufficiency.
SurvivalFor the whole group, the proportional mortality probability at
one and two months was 10.86% and 16.4% respectively. Mortality related to PEG placement was 1.2%. A total of 23 patients died after up to eight weeks (FIGURE 2).

Miranda LE, Penha, MRC, Miranda ACG, Lima DL, Costa MWF, Amorim AO.Risk factors associated with early mortality after percutaneous endoscopic gastrostomy in patients at a tertiary care center in Brazil: a retrospective single-center survival study
Arq Gastroenterol • 2019. v. 56 nº 4 out/dez • 415
Variables associated with survival up to eight weeksEight preoperative variables that are considered relevant for
predicting survival at eight weeks were tested using univariate analy-sis. As shown in TABLE 4, haemoglobin, the history of dialysis, tracheostomy and ICU internment were considered significantly associated with survival up to eight weeks.
Variables independently associated with survival up to eight weeks
A multivariate analysis was performed by Cox regression for all variables. As shown in TABLE 5, significant independent associa-tion with survival up to eight weeks was found for haemoglobin and preoperative ICU internment by the final model.
TABLE 3. Clinical outcomes and complications of percutaneous endos-copic gastrostomy.
Overall (n=150)
<8 weeks (n=28)
>8 semanas (n=122) P
Dialysis† 14 (9.3%) 5 (17.9%) 9 (7.4%) 0.140*
Tracheostomy† 51 (34.0%) 14 (50.0%) 37 (30.3%) 0.048**
Orotracheal tube† 12 (8.0%) 4 (14.3%) 8 (6.6%) 0.238*
ICU internment† 54 (36.0%) 14 (50%) 40 (32.8%) 0.087**
Buried bumper syndrome 8 (5.3%) 0 (0.0%) 8 (6.6%) 0.353*
Abscess 4 (2.7%) 1 (3.6%) 3 (2.5%) 0.566*
Peritonitis 3 (2.0%) 2 (7.1%) 1 (0.8%) 0.090*
Avulsion 15(10.0%) 4 (14.3%) 11 (9.0%) 0.482*
Dermatitis 1 (0.7%) 0 (0.0%) 1 (0.8%) 1.000*
Bleeding 1 (0.7%) 0 (0.0%) 1 (0.8%) 1.000*
*Fisher exact test; **Pearson chi-square test. † Postoperative period.
FIGURE 2. Kaplan-Meier graph showing 8-week survival.
TABLE 4. Univariate analysis of preoperative factors associated with survival at eight weeks.
VariableSample Deaths
N N HR (IC95%) P*
Neurodegenera-tive diseases 136 22 (16.2%) 2.30 (0.3–17.06) 0.353
Others 14 1 (7.1%) 1.0
Blood hypertension 0.276
Yes 87 11 (12.6%) 0.63 (0.28–1.44)
No 63 12 (19.0%) 1.0
Diabetes mellitus 0.987
Yes 51 8 (15.7%) 1.01 (0.43–2.38)
No 99 15 (15.2%) 1.0
Preoperative dyalisis 0.062
Yes 6 3 (50.0%) 3.91 (1.16–13.19)
No 144 20 (13.9%) 1.0
Tracheostomy 0.011
Yes 67 16 (23.9%) 2.98 (1.22–7.24)
No 83 7 (8.4%) 1.0
Preoperative ICU internment <0.001
Yes 86 20 (23.3%) 5.63 (1.67–18.94)
No 64 3 (4.7%) 1.0
Orotracheal tube 0.711
Yes 17 2 (11.8%) 0.77 (0.18–3.28)
No 133 21 (15.8%) 1.0
Haemoglobin 150 – 0.60 (0.49–0.83) <0.001*Likelihood ratio test.
TABLE 5. Results of the adjustments of the initial and final Cox regres-sion models to identify preoperative risk factors for mortality of PEG in patients.
VariablesInicial model (n=150) Final model (n=150)
HR (IC95%) P HR (IC95%) P
Dyalisis
Yes 2.34 (0.65–8.39) 0.191
No 1.0
Preoperative tracheostomy
Yes 1.21 (0.46–3.18) 0.700
No 1.0
Preoperative ICU internment
Yes 4.02 (1.10–14.61) 0.035 4.39 (1.30–4.81) 0.017
No 1.0 1.0
Haemoglobin 0.69 (0.52–0.92) 0.013 0.66 (0.50–0.87) 0.004
ROC curveThe receiver operating curve (ROC) for haemoglobin adjusted
for 8 weeks of survival is shown in FIGURE 3. The area under the curve (AUROC) was 0.75 (0.6454 to 0.8528, CI), considered useful, but not excellent. Based on the ROC curve analysis, the optimum cut-off of haemoglobin was set at 10.05 mg/dL. A haemoglobin level less than 10.05 is related to short-term survival (Se=82.6%, 61.2% to 95% CI; Sp=59.0%, 50.6% to 68.6%, CI; likelihood ratio of 2.06).

Miranda LE, Penha, MRC, Miranda ACG, Lima DL, Costa MWF, Amorim AO.Risk factors associated with early mortality after percutaneous endoscopic gastrostomy in patients at a tertiary care center in Brazil: a retrospective single-center survival study
416 • Arq Gastroenterol • 2019. v. 56 nº 4 out/dez
DISCUSSION
Providing food to people afflicted with chronic disease who are neither able to feed themselves nor be fed by hand seems a direct and simple choice since not providing food to these people means death by starvation, which is ethically, morally, and religiously unacceptable. However, this decision represents a major medical di-lemma. A reasonable number of consistent studies have concluded that enteral feeding tubes can be inappropriate and deleterious for some patients(10,19-22), especially older patients with dementia.
In spite of studies worldwide reliably revealing that devices used to provide enteral nutrition are associated with potential compli-cations(6,23) and mortality(12,13) and even though some studies have failed to show real benefits of enteral tubes(6,19), there will be an oc-casion in the life of a chronic patient in which he/she will depend on long nutritional support and death does not appear to be imminent. In many countries, as in Brazil, relatives will not accept absence of feeding or insufficient oral feeding and rules to not spend time with the patient beyond the fear caused by religious, moral and ethical reasons(17). In such instances, doctors will be stressed by relatives of the patients to prescribe PEG tube to end his/her starvation. Despite guidelines discouraging enteral nutrition(24), doctors will prescribe nasogastric tube feeding, which can be continued for a few weeks. After this short period, the nasogastric tube must be replaced by a PEG tube or the patient must be orally fed.
The 30-day proportional mortality rate was 11.05%, which was equivalent to the mortality rates – ranging from 1.5%(25) to 54%(11) (TABLE 4) – mentioned by other studies; similarly comparable was the mortality related to PEG insertion (1.2%). Differences can be attributed to the authors’ selection of populations with different numbers of severe patients, as well as features intrinsic to each medical service and population investigated. Sanders et al.(11) found an initial mortality of 28% at thirty days post gastrostomy, but pa-tients with dementia had a mortality of 54% at one month. These results are higher than those commonly published and inevitably lead us to inquire whether these authors would not be indicating the procedure to end-of-life patients.
Eight weeks after PEG, 23 patients had died. We considered that the patients who died up to eight weeks following PEG insertion had a futile indication for PEG because they were submitted to the risk, complications, and discomfort of an invasive procedure, and financial resources were spent. They could have had the nasogastric tube left in place or even had the nutrition discontinued for cases where he/she was at the threshold of his/her life. Defining a time that would characterize a bad indication for PEG is not a simple assignment. We chose eight weeks as the cut-off because although the nasogastric tube is recommended for short-term use, there may be special situations where a longer use of nasogastric access may be admitted. A patient with nasogastric access and risk factor for short survival may qualify as one such situation. We arbitrarily chose eight weeks as a reasonable time to extend the nasogastric tube in selected patients to avoid further risks of PEG access.
We found a rate of severe or simple complications that are comparable to those in the literature(11,26). Sanders and colleagues(11) reported on six cases of stomach bleeding that resulted in patient death. We did not observe gastric haemorrhage in our series, and we believe that this complication can be avoided with the dedication of the operative technique. Also, we did not observe tube blockage, because we insisted that the tube be supplied abundantly with water after the diet and that it be replaced every six months.
We found that haemoglobin and ICU staying on the third last day are preoperative independent risk factors associated with death after eight weeks. Although haemoglobin AUROC has been shown to be an acceptable but not excellent predictor, the haemoglobin value of 10.05 g/dL provides reasonable sensitivity and specificity on which to base the medical decision. Patients who were hospital-ized in the ICU in the days leading up to the procedure are obviously frail patients with chronic conditions or illnesses, are poised at the end of their lives and should not be indicated for PEG.
Many authors have been concerned with identifying risk factors for PEG death in groups of patients such as patients with dementia, those with neurological diseases, with cranioencephalic trauma, or in non-secreted samples at short or long term.
Diabetes mellitus(27), chronic obstructive pulmonary disease, hypo albuminemia(16,28,29), neoplasms(23,26,30), low transferrin and low cholesterol(28), nil by mouth more than seven days(31), high serum creatinine(27), low IBM, past history of ischemic heart disease(27), more than 1 cardiac factor(31), abdominal pain and severe complica-tions(12), neurological disease(23), stroke(32), high C-reactive protein(33,34), inpatient(7,11), and age(12) have been concluded – by logistic regression analysis – to be independent risk factors associated with short- or long-term survival after PEG in retrospectives studies. Some findings are contradictory. Dong-jun Oh’s(29) study of patients older than 65 years found no difference in mortality and procedure-related compli-cations compared to those of younger patients. Sobani Zan and col-leagues(35) studying patients over 100 years of age found no differences regarding the serious complications, success rate or patient mortality associated with PEG tubes and concluded that PEG tube can be administered with careful selection in patients older than 100 years.
These results show various risk factors related with mortality after PEG, and it is understandable and acceptable that they are different. The authors involved conducted investigations in hetero-geneous populations, in hospitals with different characteristics, and with different protocols, so they investigated different outcomes in retrospective studies and consequently with many limitations. To our knowledge, this is the only Brazilian study to investigate short-term survival in patients with PEG.
FIGURE 3. Receiver operating curve for haemoglobin as predictor of early mortality after PEG placement. The area under receiver operating curve was 0.7491 (0.64 to 0.85, 95% CI) considered utile. The ideal area under the curve is 1.00. The reference line represents that based on chance alone (area under the curve 0.50).

Miranda LE, Penha, MRC, Miranda ACG, Lima DL, Costa MWF, Amorim AO.Risk factors associated with early mortality after percutaneous endoscopic gastrostomy in patients at a tertiary care center in Brazil: a retrospective single-center survival study
Arq Gastroenterol • 2019. v. 56 nº 4 out/dez • 417
Although the authors identified distinct risk factors for mortal-ity after PEG, these can be classified into two groups: those that in-dicate malnutrition (albumin, low IBM, anaemia, and starvation) or those that indicate patients with severe chronic diseases (AMI, DM, renal failure, and preoperative stroke ICU staying). These results urge us to reflect on the current guidelines for indication of PEG, especially in elderly patients with some degree of dementia. Most guidelines recommend oral feeding, even if this is time-consuming and demands constant support from caregivers, and they are based on the conclusion that elderly patients with eating limitations do not benefit from the procedure, resulting in them being exposed to the procedure risks, including high mortality. However, if elderly patients with eating problems are becoming malnourished at the time of tube feeding indication, it is natural to assume that atten-tion and care to nutrition have failed in the weeks or months prior to tube feeding, probably because oral feeding, despite efforts to optimize it, was no longer able to meet the nutritional demands of the elderly. Indicating the PEG tube when the patient is already malnourished and has frail organic defences is to submit him/her to a high-risk procedure, and this appears to be a clinical mistake. Mitchell(19) and colleagues investigated the timing for PEG indica-tion after development of eating limitations using nationwide data and concluded that neither the insertion of PEG tubes nor the timing of insertion affects the survival of patients with advanced cognitive impairment from dementia and new eating problems. Although this is a relevant conclusion, the authors did not study the nutritional status or associated diseases of patients at different times of indication for PEG tube insertion, and this could have limited the conclusion. It may be more reasonable to indicate tube feeding when patients show the first signs of malnutrition or eating problems rather than definitively contraindicating enteral feeding or indicating it late. If indicated at this time of clinical evolution, the expected effects on the nutrition, well-being, and quality of life of patients that have not been established by current studies may perhaps be detected.
This study has certain limitations as well. First, it is a retro-spective study, which lacks matched control group and randomi-zation. Some information that we would have liked to evaluate – for example, albumin, nutritional status, medications used, and associated diagnoses associated – were missing and could not be investigated. The lack of these data did not let us study certain subgroups; therefore, results in patients with specific diagnoses could not be observed. Follow up of the patients was limited. Many patients died at home or at home nursing and were not autopsied, so there is no documentation on the cause of death, and death by aspiration pneumonia and other conditions related with PEG have not been studied. The study also does not consider
the locoregional characteristics of the population. Many patients were cared for by their relatives at home. Often, healthcare pro-viders at home are not optimally equipped to implement medical recommendations at the bedside. This has many consequences. Adequate care might not have been taken to avoid probe avulsion, buried bumper syndrome or aspiration pneumonia. If patients were kept in the nursing home under the care of professionals and under strict attention protocols, these complications would probably be less frequent than those observed. These facts limit the generalization of results. Our patients were hospitalized. These patients have a higher risk of death after PEG(7,11). Finally, we studied a relatively small sample. Although the sample size is comparable to that of other published studies, a larger sample would give us greater confidence in the results.
In conclusion, based on the results presented and discussed above, anaemia and previous ICU admission are independent risk factors associated with eight weeks mortality after percuta-neous endoscopic tube feeding. Patients who were anaemic and who had recently been admitted to the ICU should be given the indication for PEG to be discouraged. The clinical indication of PEG tube feeding should be rigidly evaluated in patients who are anaemics or have severe comorbidities. An early indication for enteral feeding in patients with eating disorders may be a clinical solution for high procedure-related mortality. Keeping all this in mind, future studies should address the issue of the timing for PEG indication carefully.
ACKNOWLEDGEMENTS
The authors would like to thank Dr. José Natal Figueiroa for their excellent technical assistance as statistical reviewer.
Authors’ contribution Miranda LE, Penha MCR, developed the research question
and designed the study. Miranda ACG, Costa MWF, Amorim AO collected data. Lima DL, Miranda LE, Penha MCR contributed to the draft of the manuscript. All authors read and approved the final manuscript.
OrcidLuiz Eduardo Correia Miranda. Orcid: 0000-0002-7450-3212. Ana Clara Galindo Miranda. Orcid: 0000-0001-6802-8032. Matheus Wanderly Fernandes Costa. Orcid: 0000-0002-3012-8940.Alexandre de Oliveira Amorim. Orcid: 0000-0002-6338-1897. Marcel Rolland Ciro da Penha. Orcid: 0000-0002-5781-6727.Diego Laurentino Lima. Orcid: 0000-0001-7383-1284.

Miranda LE, Penha, MRC, Miranda ACG, Lima DL, Costa MWF, Amorim AO.Risk factors associated with early mortality after percutaneous endoscopic gastrostomy in patients at a tertiary care center in Brazil: a retrospective single-center survival study
418 • Arq Gastroenterol • 2019. v. 56 nº 4 out/dez
REFERENCES
1. Gauderer MWL, Ponsky JL, Izant RJ. Gastrostomy without laparotomy: A percutaneous endoscopic technique. J Pediatr Surg. 1980;15:872-5.
2. Gauderer M. Twenty years of percutaneous endoscopic gastrostomy: Origin and evolution of a concept and its expanded applications. Gastrointest Endosc. 1999;50:879-83.
3. DeLegge MH. Enteral Access and Associated Complications. Gastroenterol Clin North Am. 2018;47:23-37.
4. Prabhakaran S, Doraiswamy VA, Nagaraja V, Cipolla J, Macbean U, Evans D, et al. Nasoenteric tube complications. Scand J Surg. 2012;101:147-55.
5. Ribera-Casado JM. Feeding and hydration in terminal stage patients. Eur Geriatr Med. 2015;6:87-90.
6. Moran C, O’mahony S. When is feeding via a percutaneous endoscopic gastros-tomy indicated? Curr Opin Gastroenterol. 2015;31:137-42.
7. Niv Y, Abuksis G. Indications for percutaneous endoscopic gastrostomy insertion: ethical aspects. Dig Dis. 2002;20:253-6.
8. Hucl T, Spicak J. Complications of percutaneous endoscopic gastrostomy. Best Pract Res Clin Gastroenterol. 2016;30:769-81.
9. Mitchell, Susan L, Tetroe JM. Survival After Percutaneous Endoscopic Gastros-tomy Placement in Older Persons. Journals Gerontol. 2000;55:M735-M739.
10. Candy B1, Sampson EL, Jones L. Enteral tube feeding in older people with advanced dementia: findings from a Cochrane systematic review. Int J Palliat Nurs. 2009;15:396-404.
11. Sanders DS, Carter MJ, D’Silva J, James G, Bolton RP, Bardhan KD. Survival analysis in percutaneous endoscopic gastrostomy feeding: a worse; outcome in patients with dementia. Am J Gastroenterol. 2000;95(6):1472-5.
12. Wirth R, Voss C, Smoliner C, Sieber CC, Bauer JM, Volkert D. Complications and Mortality After Percutaneous Endoscopic Gastrostomy in Geriatrics: A Prospective Multicenter Observational Trial. J Am Med Dir Assoc. 2012;13:228-33.
13. Arora G, Rockey D, Gupta S. High in-hospital mortality after percutaneous endoscopic gastrostomy: Results of a nationwide population-based study. Clin Gastroenterol Hepatol. 2013;11:1437-44.
14. Grant MD. Gastrostomies in older patients: the 1990 National Hospital Discharge Survey. J Am Board Fam Pract. 1998;11:187-92.
15. Galia RN, Melli RN, Negba RN, Ilana RN, Shlomit RN, Jaqueline S, et al. Percutaneous Endoscopic Gastrostomy : High Mortality Rates in Hospitalized Patients. Am. J. Gastroenterol. 2000;95:128-32.
16. Nair S, Hertan H, Pitchumoni CS. Hypoalbuminemia is a poor predictor of survival after percutaneous endoscopic gastrostomy in elderly patients with dementia. Am J Gastroenterol. 2000;95:133-6.
17. O’Mahony S. Percutaneous endoscopic gastrostomy (PEG): cui bono? Frontline Gastroenterol. 2015;6:298-300.
18. Schwartz DB, Barrocas A, Wesley JR, Kliger G, Pontes-Arruda A, Márquez HA, et al. Gastrostomy tube placement in patients with advanced dementia or near end of life. Nutr Clin Pr. 2014;29:829-840.
19. Teno JM, Gozalo PL, Mitchell SL, Kuo S, Rhodes RL, Bynum JP, et al. Does feeding tube insertion and its timing improve survival? J Am Geriatr Soc. 2012;60:1918-21.
20. Ticinesi A, Nouvenne A, Lauretani F, Prati B, Cerundolo N, Maggio M, et al. Survival in older adults with dementia and eating problems: To PEG or not to PEG? Clin Nutr. 2016;35:1512-6.
21. Goldberg LS, Altman KW. The role of gastrostomy tube placement in advanced dementia with dysphagia: a critical review. Clin Interv Aging. 2014;9:1733-9.
22. Nakanishi M, Hattori K. Percutaneous endoscopic gastrostomy (PEG) tubes are placed in elderly adults in Japan with advanced dementia regardless of expecta-tions of improvement in quality of life. J Nutr Heal Aging. 2014;18:503-9.
23. Blomberg J, Lagergren J, Martin L, Mattsson F, Lagergren P. Complications after percutaneous endoscopic gastrostomy in a prospective study. Scand J Gastroen-terol. 2012;47:737-42.
24. Cegelka A. American Geriatrics Society feeding tubes in advanced dementia position statement. J Am Geriatr Soc. 2014;62:1590-3.
25. Varnier A, Iona L, Dominutti MC, Deotto E, Bianchi L, Iengo A, et al. Per-cutaneous endoscopic gastrostomy: complications in the short and long-term follow-up and efficacy on nutritional status. Eura Medicophys. 2006;42:23-6.
25. Finocchiaro C, Galletti R, Rovera G, Ferrari A, Todros L, Vuolo A, et al. Percuta-neous endoscopic gastrostomy: A long-term follow-up. Nutrition. 1997;13:520-3.
27. Yokohama S, Aoshima M. Risk factors of early mortality after percutaneous endoscopic gastrostomy: a retrospective study. Nihon Shokakibyo Gakkai Zasshi. 2009;106:1313-20.
28. Nunes G, Santos CA, Santos C, Fonseca J. SUN-PP086: Percutaneous Endoscopic Gastrostomy for Nutritional Support in Patients with Dementia. Clin Nutr. 2015;34:S55-S56.
29. Oh DJ, Kim B, Lee JK, Kang HW, Kim JH, Lim YJ, et al. Can percutaneous endoscopic gastrostomy be carried out safely in the elderly? Geriatr Gerontol Int. 2016;16:481-5.
30. Fisman DN, Levy AR, Gifford DR, Tamblyn R. Survival after percutaneous endoscopic gastrostomy among older residents of Quebec. J Am Geriatr Soc. 1999;47:349-53.
31. Janes SEJ, Price CSG, Khan S. Percutaneous endoscopic gastrostomy: 30-day mortality trends and risk factors. J Postgrad Med. 2005;51:23-9.
32. Kara O, Kizilarslanoglu MC, Canbaz B, Arik G, Varan HD, Kuyumcu ME, et al. Survival after Percutaneous Endoscopic Gastrostomy in Older Adults with Neurologic Disorders. Nutr Clin Pract. 2016;31:799-804.
33. Lee C, Im JP, Kim JW, Kim SE, Ryu DY, Cha JM, et al. Risk factors for com-plications and mortality of percutaneous endoscopic gastrostomy: a multicenter, retrospective study. Surg Endosc. 2013;27:3806-15.
34. Blomberg J, Lagergren P, Martin L, Mattsson F, Lagergren J. Albumin and C-re-active protein levels predict short-term mortality after percutaneous endoscopic gastrostomy in a prospective cohort study. Gastrointest Endosc. 2011;73:29-36.
35. Sobani ZA, Tin K, Guttmann S, Abbasi AA, Mayer I, Tsirlin Y. Safety of percu-taneous Endoscopic Gastrostomy Tubes in Centenarian Patients. Clin Endosc. 2018;51:56-60.
Miranda LE, Penha MRC, Miranda ACG, Lima DL, Costa MWF, Amorim AO. Fatores de risco associados a mortalidade precoce após gastrostomia endoscópica percutânea em pacientes em um centro terciário no Brasil: um estudo retrospectivo de sobrevida em um único centro. Arq Gastroenterol. 2019;56(4):412-8.RESUMO – Contexto – A gastrostomia endoscópica percutânea (GEP) é o principal método aceito para a alimentação por sonda em um longo período.
Objetivo – Investigar os fatores de risco associados à mortalidade precoce após a realização de GEP. Métodos – Análise retrospectiva de sobrevida em um centro terciário em Recife, Brasil. Prontuários de 150 pacientes submetidos a colocação de GEP forma revisados. Os dados foram analisados pelo método de Kaplan-Meier. Os modelos de regressão proporcional Multivariável de Cox também foram construídos para testar os efeitos da GEP na mortalidade. Resultados – Um total de 150 pacientes submetidos a GEP foram estudados (70 homens). Dos participantes, 87 (58%) tinham hip-ertensão arterial; 51 (34%) eram diabéticos; 6 (4%) pacientes tinham doença renal crônica e 6 (4%) tinham alguma malignidade. As doenças crônicas neurodegenerativas foram a indicação clínica mais comum para a GEP. As taxas de probabilidade de mortalidade proporcionais de 30 e 60 dias foram de 11,05% e 15,34% respectivamente. A análise multivariada por meio da regressão de Cox mostrou a hemoglobina (HR 4,39, 95% IC: 1,30–14,81, P=0,017) e a permanência em Unidade de Terapia Intensiva (UTI) (HR 0,66, 95% IC 0,50–0,87, P=0,004) como preditores significantes de mortalidade precoce. O corte no valor da hemoglobina de 10,05 g/dL mostrou uma sensibilidade de 82,6% (61,2%–95% IC) e uma sensibilidade aceitável de 59,0 (50,6%–68,6% IC), com uma taxa de 2,06 para a mortalidade em oito semanas. Conclusão – Em pacientes que foram submetidos a GEP para nutrição por um longo período, baixa hemoglobina e internamento em UTI antes do procedimento estão associados com o risco de mortalidade precoce. A GEP não deve ser indicada nesses casos.
DESCRITORES – Transtornos de deglutição. Desnutrição. Nutrição enteral. Estado terminal. Demência.
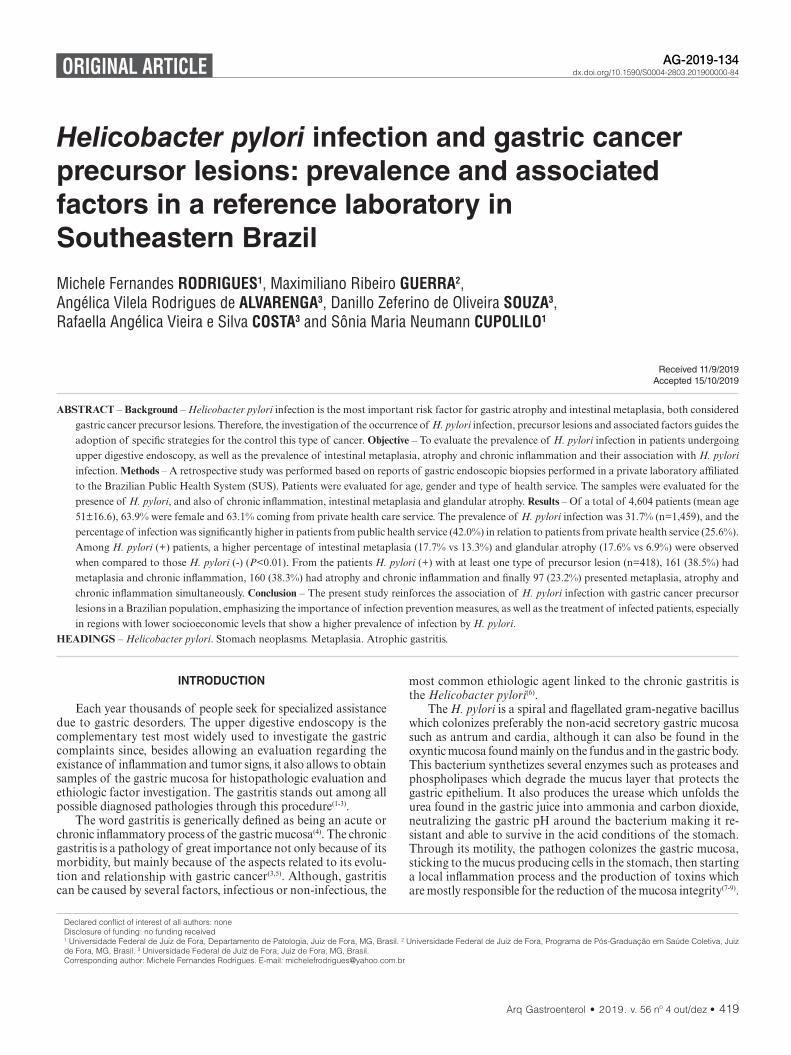
AHEAD OF PRINTORIGINAL ARTICLE
Arq Gastroenterol • 2019. v. 56 nº 4 out/dez • 419
INTRODUCTION
Each year thousands of people seek for specialized assistance due to gastric desorders. The upper digestive endoscopy is the complementary test most widely used to investigate the gastric complaints since, besides allowing an evaluation regarding the existance of inflammation and tumor signs, it also allows to obtain samples of the gastric mucosa for histopathologic evaluation and ethiologic factor investigation. The gastritis stands out among all possible diagnosed pathologies through this procedure(1-3).
The word gastritis is generically defined as being an acute or chronic inflammatory process of the gastric mucosa(4). The chronic gastritis is a pathology of great importance not only because of its morbidity, but mainly because of the aspects related to its evolu-tion and relationship with gastric cancer(3,5). Although, gastritis can be caused by several factors, infectious or non-infectious, the
Helicobacter pylori infection and gastric cancer precursor lesions: prevalence and associated factors in a reference laboratory in Southeastern Brazil
Michele Fernandes RODRIGUES1, Maximiliano Ribeiro GUERRA2, Angélica Vilela Rodrigues de ALVARENGA3, Danillo Zeferino de Oliveira SOUZA3, Rafaella Angélica Vieira e Silva COSTA3 and Sônia Maria Neumann CUPOLILO1
Received 11/9/2019Accepted 15/10/2019
ABSTRACT – Background – Helicobacter pylori infection is the most important risk factor for gastric atrophy and intestinal metaplasia, both considered gastric cancer precursor lesions. Therefore, the investigation of the occurrence of H. pylori infection, precursor lesions and associated factors guides the adoption of specific strategies for the control this type of cancer. Objective – To evaluate the prevalence of H. pylori infection in patients undergoing upper digestive endoscopy, as well as the prevalence of intestinal metaplasia, atrophy and chronic inflammation and their association with H. pylori infection. Methods – A retrospective study was performed based on reports of gastric endoscopic biopsies performed in a private laboratory affiliated to the Brazilian Public Health System (SUS). Patients were evaluated for age, gender and type of health service. The samples were evaluated for the presence of H. pylori, and also of chronic inflammation, intestinal metaplasia and glandular atrophy. Results – Of a total of 4,604 patients (mean age 51±16.6), 63.9% were female and 63.1% coming from private health care service. The prevalence of H. pylori infection was 31.7% (n=1,459), and the percentage of infection was significantly higher in patients from public health service (42.0%) in relation to patients from private health service (25.6%). Among H. pylori (+) patients, a higher percentage of intestinal metaplasia (17.7% vs 13.3%) and glandular atrophy (17.6% vs 6.9%) were observed when compared to those H. pylori (-) (P<0.01). From the patients H. pylori (+) with at least one type of precursor lesion (n=418), 161 (38.5%) had metaplasia and chronic inflammation, 160 (38.3%) had atrophy and chronic inflammation and finally 97 (23.2%) presented metaplasia, atrophy and chronic inflammation simultaneously. Conclusion – The present study reinforces the association of H. pylori infection with gastric cancer precursor lesions in a Brazilian population, emphasizing the importance of infection prevention measures, as well as the treatment of infected patients, especially in regions with lower socioeconomic levels that show a higher prevalence of infection by H. pylori.
HEADINGS – Helicobacter pylori. Stomach neoplasms. Metaplasia. Atrophic gastritis.
Declared conflict of interest of all authors: noneDisclosure of funding: no funding received1 Universidade Federal de Juiz de Fora, Departamento de Patologia, Juiz de Fora, MG, Brasil. 2 Universidade Federal de Juiz de Fora, Programa de Pós-Graduação em Saúde Coletiva, Juiz de Fora, MG, Brasil. 3 Universidade Federal de Juiz de Fora, Juiz de Fora, MG, Brasil.Corresponding author: Michele Fernandes Rodrigues. E-mail: [email protected]
most common ethiologic agent linked to the chronic gastritis is the Helicobacter pylori(6).
The H. pylori is a spiral and flagellated gram-negative bacillus which colonizes preferably the non-acid secretory gastric mucosa such as antrum and cardia, although it can also be found in the oxyntic mucosa found mainly on the fundus and in the gastric body. This bacterium synthetizes several enzymes such as proteases and phospholipases which degrade the mucus layer that protects the gastric epithelium. It also produces the urease which unfolds the urea found in the gastric juice into ammonia and carbon dioxide, neutralizing the gastric pH around the bacterium making it re-sistant and able to survive in the acid conditions of the stomach. Through its motility, the pathogen colonizes the gastric mucosa, sticking to the mucus producing cells in the stomach, then starting a local inflammation process and the production of toxins which are mostly responsible for the reduction of the mucosa integrity(7-9).
AG-2019-134dx.doi.org/10.1590/S0004-2803.201900000-84

Rodrigues MF, Guerra MR, Alvarenga AVR, Souza DZO, Costa RAVS, Cupolilo SMN.Helicobacter pylori infection and gastric cancer precursor lesions: prevalence and associated factors in a reference laboratory in Southeastern Brazil
420 • Arq Gastroenterol • 2019. v. 56 nº 4 out/dez
The H. pylori infection leads invariably to a chronic inflamma-tory process in the stomach which is characterized by an increase in the number of lymphocytes, macrophages and plasmocytes in the lamina propria in variable degrees, that can be accompanied by neutrophils which indicate inflammatory activity(1,5). This infec-tion when not treated remain for an indefinite time, and is rarely eliminated in a spontaneous way(1,10).
The maintainance of the chronic inflammation induced by the H. pylori, besides damaging the cells can, according to the Correa model, trigger a multistage process of carcinogenesis in which the non-atrophic chronic gastritis would evolve to atrophic gastritis (loss of gastrict glands), intestinal metaplasia (replacement for intestinal-type epithelium), dysplasia and gastric adenocarci-noma(11). Therefore, H. pylori infection is the most important risk factor for gastric atrophy and intestinal metaplasia and these latter are considered gastric cancer precursor lesions(12).
The majority of gastric cancer cases are intestinal-type adeno-carcinoma, located in the antrum and body of the stomach whose development is usually secondary to gastric atrophy and intestinal metaplasia(11-13). However, the diagnosis of such pathology is often performed late, when treatment can be less effective. Thus, the knowledge of gastric cancer etiopathogenesis and the investiga-tion of risk factors and precursor lesions become relevant to its prevention, early diagnosis, treatment and increase of patients’ life expectancy. So the aim of the present study was to evaluate the prevalence of H. pylori infection and its associated factors in patients who underwent upper digestive endoscopy and who had gastric biopsy analyzed at a reference laboratory in Juiz de Fora County, Minas Gerais State, as well as the prevalence of precursor histological changes of gastric cancer and their association with H. pylori infection.
METHODS
Retrospective study was performed based on gastric endoscopy biopsy data collected between 2015 and 2016 in a private lab also integrated to the Brazilian Public Health System (Sistema Único de Saúde – SUS) – according to the approval of the CEP/UFJF Re-search Ethic Committee through the legal report number 1.402.229. Only patients with simultaneous samples of gastric antrum and body separately and for whom H. pylori were investigated by specific staining were included in the study. For patients with more than one endoscopic exam with biopsies, only the samples corresponding to the last exam request were considered. Patients were evaluated for age, sex and type of the health care service (public or private).
The slides were stained by the hematoxylin-eosin (HE) tradi-tional method and the H. pylori research was done by the GRAM staining which shows satisfactory sensitivity, specificity, positive predictive value and accuracy for bacillus identification(14). Samples were evaluated for the presence of H. pylori in the antrum and/or gastric body (present or absent) and according to four morphologic variants recommended by the Sydney System: chronic inflamma-tion, inflammatory activity, intestinal metaplasia and glandular atrophy, all these variables classified as absent or present, and when present ranked as mild, moderate and severe(15).
Chronic inflammation was considered when high level of mononuclear leukocytes, including lymphocytes, plasmocyte and macrophages was found. Inflammatory activity was confirmed by the detection of polymorphonuclear (neutrophils) on the lamina propria, epithelium or lumen. Glandular atrophy was character-
ized by the loss of glands, glandular colon hyperplasia and mucin depletion. With regards to the intestinal metaplasia, it has been detected when the gastric mucosa resembled the intestine mucosa, showing goblet cells with or without gland distortion(12,16,17).
The Excell program was used for data input and data analysis was performed by Stata software version 9.0. Differences in the distribution of the variables were assessed by the chi-square test and those with value P<0.05 were considered statistically significant. Odds ratios (OR) and respective 95% confidence intervals (95%C.I.) were calculated for each gastric cancer precursor lesion in relation to the presence of H. pylori infection.
RESULTS
A total of 4,604 patients who met the inclusion criteria were evaluated, with a mean age of 51 years (±16.6). The majority of them were women (n=2,941; 63.9%) and coming from the private health care service (n=2,903; 63.1%). As shown in TABLE 1, the prevalence of H. pylori infection in the study population was 31.7% (n=1,459). The smallest percentage of infection by H. pylori (24.8%) was detected among patients under 30 years of age, while among those ranging between 30–39 years of age, the percentage was the highest (40.6%), and a decrease of infection was detected among patients age 40 and over (P<0.01). The frequency of infec-tion was higher among men (33.4%) rather than women (30.7%), however with only marginal significance (P=0.07). With regards to the origin of the health care service, the percentage of H. pylori infection was significantly higher in patients from public health service (42.0%) when compared with patients from private health service (25.6%) (P<0.01).
TABLE 1. Prevalence of H. pylori infection according to age, sex and health service. Juiz de Fora/MG, Brazil.
VariableH. pylori negative H. pylori positive
Total P-valuen (%) 3,145 (68.3%)
n (%) 1,459 (31.7%)
Age < 0.01
< 30 yrs 422 (75.2%) 139 (24.8%) 561
30–39 yrs 336 (59.4%) 230 (40.6%x) 566
40–49 yrs 566 (66.4%) 286 (33.6%) 852
50–59 yrs 747 (67.1%) 366 (32.9%) 1,113
≥ 60 yrs 1,074 (71.0%) 438 (29.0%) 1,512
Sex 0.07
Female 2,037 (69.3%) 904 (30.7%) 2,941
Male 1,108 (66.6%) 555 (33.4%) 1,663
Health service < 0.01
Private 2,159 (74.4%) 744 (25.6%) 2,903
Public (SUS) 986 (58.0%) 715 (42.0%) 1,701
When evaluating the prevalence of gastric cancer precur-sor lesions in the study polulation, 676 (14.7%) patients showed intestinal metaplasia in the body and/or antrum gastric. Among H. pylori (+) patients a higher percentage of intestinal metaplasia (17.7%) was detected when compared with H. pylori (-) patients (13.3%) (P<0.01). The odds ratio for the occurrence of metaplasia
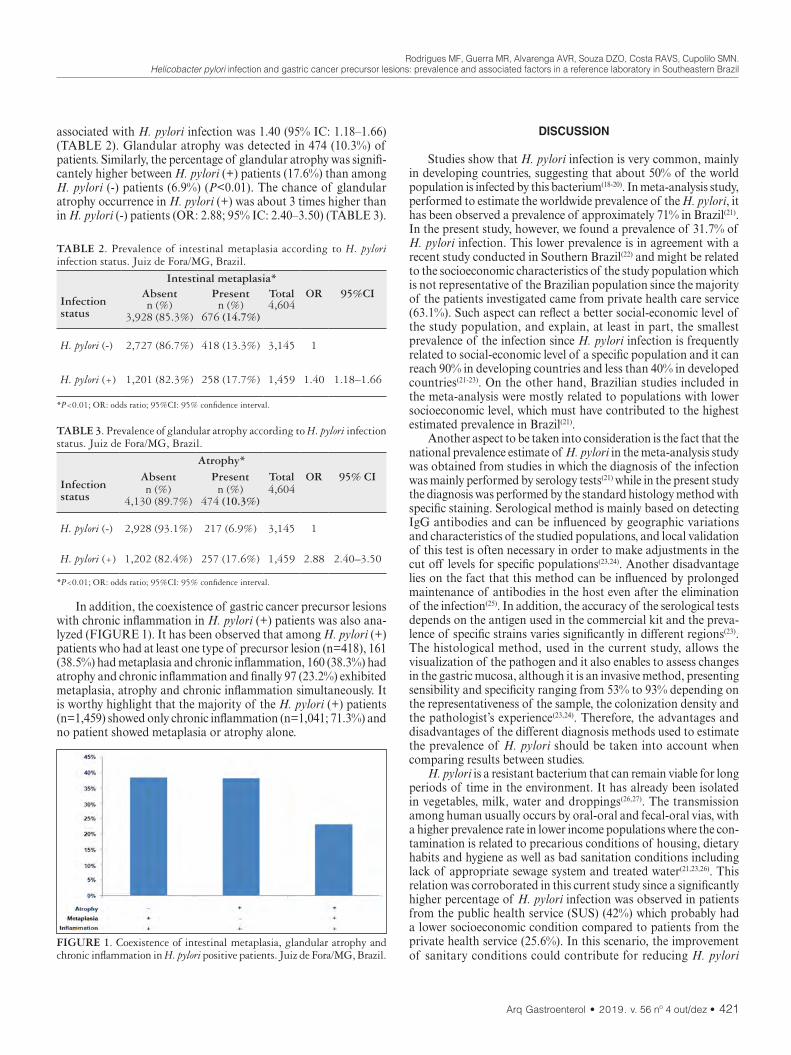
Rodrigues MF, Guerra MR, Alvarenga AVR, Souza DZO, Costa RAVS, Cupolilo SMN.Helicobacter pylori infection and gastric cancer precursor lesions: prevalence and associated factors in a reference laboratory in Southeastern Brazil
Arq Gastroenterol • 2019. v. 56 nº 4 out/dez • 421
associated with H. pylori infection was 1.40 (95% IC: 1.18–1.66) (TABLE 2). Glandular atrophy was detected in 474 (10.3%) of patients. Similarly, the percentage of glandular atrophy was signifi-cantely higher between H. pylori (+) patients (17.6%) than among H. pylori (-) patients (6.9%) (P<0.01). The chance of glandular atrophy occurrence in H. pylori (+) was about 3 times higher than in H. pylori (-) patients (OR: 2.88; 95% IC: 2.40–3.50) (TABLE 3).
DISCUSSION
Studies show that H. pylori infection is very common, mainly in developing countries, suggesting that about 50% of the world population is infected by this bacterium(18-20). In meta-analysis study, performed to estimate the worldwide prevalence of the H. pylori, it has been observed a prevalence of approximately 71% in Brazil(21). In the present study, however, we found a prevalence of 31.7% of H. pylori infection. This lower prevalence is in agreement with a recent study conducted in Southern Brazil(22) and might be related to the socioeconomic characteristics of the study population which is not representative of the Brazilian population since the majority of the patients investigated came from private health care service (63.1%). Such aspect can reflect a better social-economic level of the study population, and explain, at least in part, the smallest prevalence of the infection since H. pylori infection is frequently related to social-economic level of a specific population and it can reach 90% in developing countries and less than 40% in developed countries(21-23). On the other hand, Brazilian studies included in the meta-analysis were mostly related to populations with lower socioeconomic level, which must have contributed to the highest estimated prevalence in Brazil(21).
Another aspect to be taken into consideration is the fact that the national prevalence estimate of H. pylori in the meta-analysis study was obtained from studies in which the diagnosis of the infection was mainly performed by serology tests(21) while in the present study the diagnosis was performed by the standard histology method with specific staining. Serological method is mainly based on detecting IgG antibodies and can be influenced by geographic variations and characteristics of the studied populations, and local validation of this test is often necessary in order to make adjustments in the cut off levels for specific populations(23,24). Another disadvantage lies on the fact that this method can be influenced by prolonged maintenance of antibodies in the host even after the elimination of the infection(25). In addition, the accuracy of the serological tests depends on the antigen used in the commercial kit and the preva-lence of specific strains varies significantly in different regions(23). The histological method, used in the current study, allows the visualization of the pathogen and it also enables to assess changes in the gastric mucosa, although it is an invasive method, presenting sensibility and specificity ranging from 53% to 93% depending on the representativeness of the sample, the colonization density and the pathologist’s experience(23,24). Therefore, the advantages and disadvantages of the different diagnosis methods used to estimate the prevalence of H. pylori should be taken into account when comparing results between studies.
H. pylori is a resistant bacterium that can remain viable for long periods of time in the environment. It has already been isolated in vegetables, milk, water and droppings(26,27). The transmission among human usually occurs by oral-oral and fecal-oral vias, with a higher prevalence rate in lower income populations where the con-tamination is related to precarious conditions of housing, dietary habits and hygiene as well as bad sanitation conditions including lack of appropriate sewage system and treated water(21,23,26). This relation was corroborated in this current study since a significantly higher percentage of H. pylori infection was observed in patients from the public health service (SUS) (42%) which probably had a lower socioeconomic condition compared to patients from the private health service (25.6%). In this scenario, the improvement of sanitary conditions could contribute for reducing H. pylori
TABLE 2. Prevalence of intestinal metaplasia according to H. pylori infection status. Juiz de Fora/MG, Brazil.
Intestinal metaplasia*
Infection status
Absent Present Total OR 95%CIn (%)
3,928 (85.3%)n (%)
676 (14.7%)4,604
H. pylori (-) 2,727 (86.7%) 418 (13.3%) 3,145 1
H. pylori (+) 1,201 (82.3%) 258 (17.7%) 1,459 1.40 1.18–1.66
*P<0.01; OR: odds ratio; 95%CI: 95% confidence interval.
TABLE 3. Prevalence of glandular atrophy according to H. pylori infection status. Juiz de Fora/MG, Brazil.
Atrophy*
Infection status
Absent Present Total OR 95% CIn (%)
4,130 (89.7%)n (%)
474 (10.3%)4,604
H. pylori (-) 2,928 (93.1%) 217 (6.9%) 3,145 1
H. pylori (+) 1,202 (82.4%) 257 (17.6%) 1,459 2.88 2.40–3.50
*P<0.01; OR: odds ratio; 95%CI: 95% confidence interval.
In addition, the coexistence of gastric cancer precursor lesions with chronic inflammation in H. pylori (+) patients was also ana-lyzed (FIGURE 1). It has been observed that among H. pylori (+) patients who had at least one type of precursor lesion (n=418), 161 (38.5%) had metaplasia and chronic inflammation, 160 (38.3%) had atrophy and chronic inflammation and finally 97 (23.2%) exhibited metaplasia, atrophy and chronic inflammation simultaneously. It is worthy highlight that the majority of the H. pylori (+) patients (n=1,459) showed only chronic inflammation (n=1,041; 71.3%) and no patient showed metaplasia or atrophy alone.
FIGURE 1. Coexistence of intestinal metaplasia, glandular atrophy and chronic inflammation in H. pylori positive patients. Juiz de Fora/MG, Brazil.
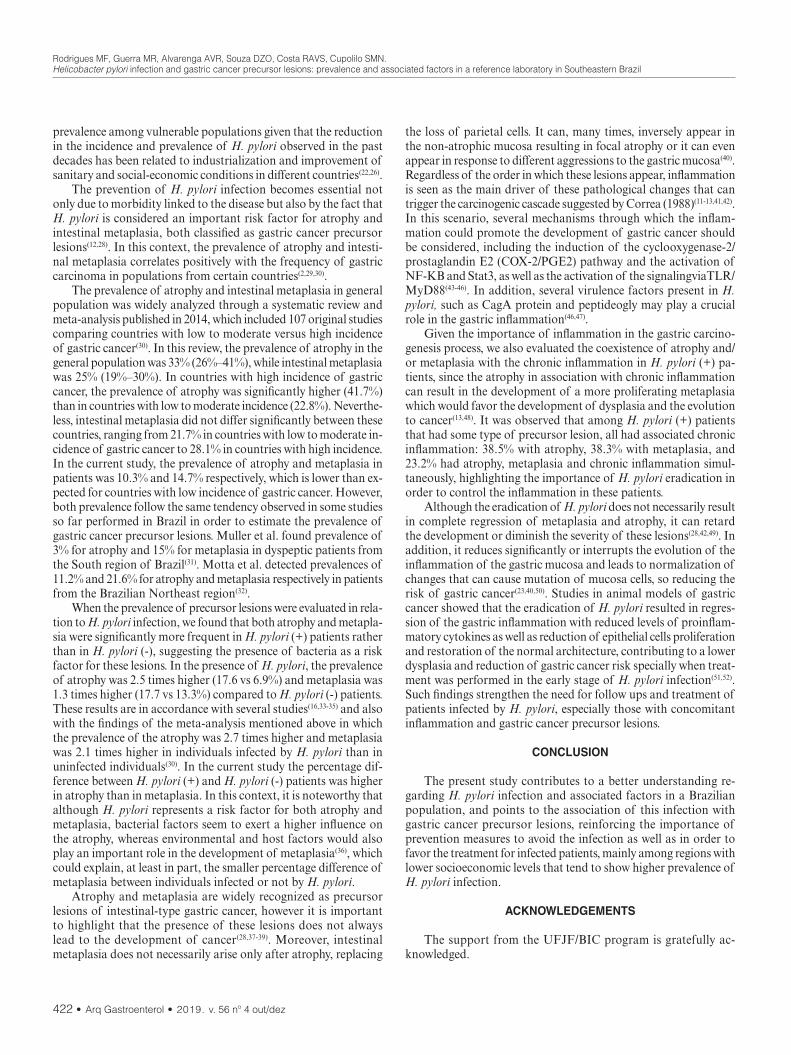
Rodrigues MF, Guerra MR, Alvarenga AVR, Souza DZO, Costa RAVS, Cupolilo SMN.Helicobacter pylori infection and gastric cancer precursor lesions: prevalence and associated factors in a reference laboratory in Southeastern Brazil
422 • Arq Gastroenterol • 2019. v. 56 nº 4 out/dez
prevalence among vulnerable populations given that the reduction in the incidence and prevalence of H. pylori observed in the past decades has been related to industrialization and improvement of sanitary and social-economic conditions in different countries(22,26).
The prevention of H. pylori infection becomes essential not only due to morbidity linked to the disease but also by the fact that H. pylori is considered an important risk factor for atrophy and intestinal metaplasia, both classified as gastric cancer precursor lesions(12,28). In this context, the prevalence of atrophy and intesti-nal metaplasia correlates positively with the frequency of gastric carcinoma in populations from certain countries(2,29,30).
The prevalence of atrophy and intestinal metaplasia in general population was widely analyzed through a systematic review and meta-analysis published in 2014, which included 107 original studies comparing countries with low to moderate versus high incidence of gastric cancer(30). In this review, the prevalence of atrophy in the general population was 33% (26%–41%), while intestinal metaplasia was 25% (19%–30%). In countries with high incidence of gastric cancer, the prevalence of atrophy was significantly higher (41.7%) than in countries with low to moderate incidence (22.8%). Neverthe-less, intestinal metaplasia did not differ significantly between these countries, ranging from 21.7% in countries with low to moderate in-cidence of gastric cancer to 28.1% in countries with high incidence. In the current study, the prevalence of atrophy and metaplasia in patients was 10.3% and 14.7% respectively, which is lower than ex-pected for countries with low incidence of gastric cancer. However, both prevalence follow the same tendency observed in some studies so far performed in Brazil in order to estimate the prevalence of gastric cancer precursor lesions. Muller et al. found prevalence of 3% for atrophy and 15% for metaplasia in dyspeptic patients from the South region of Brazil(31). Motta et al. detected prevalences of 11.2% and 21.6% for atrophy and metaplasia respectively in patients from the Brazilian Northeast region(32).
When the prevalence of precursor lesions were evaluated in rela-tion to H. pylori infection, we found that both atrophy and metapla-sia were significantly more frequent in H. pylori (+) patients rather than in H. pylori (-), suggesting the presence of bacteria as a risk factor for these lesions. In the presence of H. pylori, the prevalence of atrophy was 2.5 times higher (17.6 vs 6.9%) and metaplasia was 1.3 times higher (17.7 vs 13.3%) compared to H. pylori (-) patients. These results are in accordance with several studies(16,33-35) and also with the findings of the meta-analysis mentioned above in which the prevalence of the atrophy was 2.7 times higher and metaplasia was 2.1 times higher in individuals infected by H. pylori than in uninfected individuals(30). In the current study the percentage dif-ference between H. pylori (+) and H. pylori (-) patients was higher in atrophy than in metaplasia. In this context, it is noteworthy that although H. pylori represents a risk factor for both atrophy and metaplasia, bacterial factors seem to exert a higher influence on the atrophy, whereas environmental and host factors would also play an important role in the development of metaplasia(36), which could explain, at least in part, the smaller percentage difference of metaplasia between individuals infected or not by H. pylori.
Atrophy and metaplasia are widely recognized as precursor lesions of intestinal-type gastric cancer, however it is important to highlight that the presence of these lesions does not always lead to the development of cancer(28,37-39). Moreover, intestinal metaplasia does not necessarily arise only after atrophy, replacing
the loss of parietal cells. It can, many times, inversely appear in the non-atrophic mucosa resulting in focal atrophy or it can even appear in response to different aggressions to the gastric mucosa(40). Regardless of the order in which these lesions appear, inflammation is seen as the main driver of these pathological changes that can trigger the carcinogenic cascade suggested by Correa (1988)(11-13,41,42). In this scenario, several mechanisms through which the inflam-mation could promote the development of gastric cancer should be considered, including the induction of the cyclooxygenase-2/ prostaglandin E2 (COX-2/PGE2) pathway and the activation of NF-KB and Stat3, as well as the activation of the signalingviaTLR/MyD88(43-46). In addition, several virulence factors present in H. pylori, such as CagA protein and peptideogly may play a crucial role in the gastric inflammation(46,47).
Given the importance of inflammation in the gastric carcino-genesis process, we also evaluated the coexistence of atrophy and/or metaplasia with the chronic inflammation in H. pylori (+) pa-tients, since the atrophy in association with chronic inflammation can result in the development of a more proliferating metaplasia which would favor the development of dysplasia and the evolution to cancer(13,48). It was observed that among H. pylori (+) patients that had some type of precursor lesion, all had associated chronic inflammation: 38.5% with atrophy, 38.3% with metaplasia, and 23.2% had atrophy, metaplasia and chronic inflammation simul-taneously, highlighting the importance of H. pylori eradication in order to control the inflammation in these patients.
Although the eradication of H. pylori does not necessarily result in complete regression of metaplasia and atrophy, it can retard the development or diminish the severity of these lesions(28,42,49). In addition, it reduces significantly or interrupts the evolution of the inflammation of the gastric mucosa and leads to normalization of changes that can cause mutation of mucosa cells, so reducing the risk of gastric cancer(23,40,50). Studies in animal models of gastric cancer showed that the eradication of H. pylori resulted in regres-sion of the gastric inflammation with reduced levels of proinflam-matory cytokines as well as reduction of epithelial cells proliferation and restoration of the normal architecture, contributing to a lower dysplasia and reduction of gastric cancer risk specially when treat-ment was performed in the early stage of H. pylori infection(51,52). Such findings strengthen the need for follow ups and treatment of patients infected by H. pylori, especially those with concomitant inflammation and gastric cancer precursor lesions.
CONCLUSION
The present study contributes to a better understanding re-garding H. pylori infection and associated factors in a Brazilian population, and points to the association of this infection with gastric cancer precursor lesions, reinforcing the importance of prevention measures to avoid the infection as well as in order to favor the treatment for infected patients, mainly among regions with lower socioeconomic levels that tend to show higher prevalence of H. pylori infection.
ACKNOWLEDGEMENTS
The support from the UFJF/BIC program is gratefully ac-knowledged.

Rodrigues MF, Guerra MR, Alvarenga AVR, Souza DZO, Costa RAVS, Cupolilo SMN.Helicobacter pylori infection and gastric cancer precursor lesions: prevalence and associated factors in a reference laboratory in Southeastern Brazil
Arq Gastroenterol • 2019. v. 56 nº 4 out/dez • 423
Authors’ contributionRodrigues MF: planning of the study; literature research,
analysis and interpretation of data, writing and revision of the manuscript. Guerra MR: statistical analysis, data interpretation, critical revision of manuscript. Alvarenga AVR: literature research, data collection, data interpretation, text writing. Souza DZO: literature research, data collection. Costa RAVS: data collection. Cupolilo SMN: conception and design of the study, data interpreta-tion, critical revision of manuscript.
OrcidMichele Fernandes Rodrigues. Orcid: 0000-0002-0843-0844.Maximiliano Ribeiro Guerra. Orcid: 0000-0003-0234-7190.Angélica Vilela Rodrigues de Alvarenga. Orcid: 0000-0003-2009-7615.Danillo Zeferino de Oliveira Souza. Orcid: 0000-0002-2953-0182.Rafaella Angélica Vieira e Silva Costa. Orcid: 0000-0002-7293-1934.Sônia Maria Neumann Cupolilo. Orcid: 0000-0002-1675-1752.
Rodrigues MF, Guerra MR, Alvarenga AVR, Souza DZO, Costa RAVS, Cupolilo SMN. Infecção por Helicobacter pylori e lesões precursoras de câncer gástrico: prevalência e fatores associados em um laboratório de referência no Sudeste do Brasil. Arq Gastroenterol. 2019;56(4):419-24.RESUMO – Contexto – A infecção por Helicobacter pylori é o fator de risco mais importante para atrofia gástrica e metaplasia intestinal, ambas con-
sideradas lesões precursoras do câncer gástrico. Portanto, a investigação da ocorrência de infecção por H. pylori, das lesões precursoras e dos fatores associados orienta a adoção de estratégias específicas para o controle deste tipo de câncer. Objetivo – Avaliar a prevalência de infecção por H. pylori em pacientes submetidos à endoscopia digestiva alta, bem como a prevalência de metaplasia intestinal, atrofia e inflamação crônica e a associação destas com a infecção por H. pylori. Métodos – Foi realizado um estudo retrospectivo com base em laudos de biópsias endoscópicas gástricas realizadas em laboratório privado afiliado ao Sistema Único de Saúde (SUS). Os pacientes foram avaliados quanto à idade, sexo e tipo de serviço de saúde. As amostras foram avaliadas quanto à presença de H. pylori e também de inflamação crônica, metaplasia intestinal e atrofia glandular. Resultados – Do total de 4.604 pacientes (idade média de 51±16,6), 63,9% eram do sexo feminino e 63,1% provenientes de serviços de saúde privado. A prevalência de infecção por H. pylori foi de 31,7% (n=1.459) e o percentual de infecção foi significativamente maior nos pacientes do serviço público de saúde (42,0%) em relação aos pacientes do serviço privado de saúde (25,6%). Entre os pacientes com H. pylori (+), foi observado maior percentual de metaplasia intestinal (17,7% vs 13,3%) e atrofia glandular (17,6% vs 6,9%) quando comparados aos H. pylori (-) (P<0,01). Dos pacientes H. pylori (+) com pelo menos um tipo de lesão precursora (n=418), 161 (38,5%) apresentaram metaplasia e inflamação crônica, 160 (38,3%) apresentaram atrofia e inflamação crônica e, finalmente, 97 (23,2%) apresentaram metaplasia, atrofia e inflamação crônica simultaneamente. Conclusão – O presente estudo reforça a associação da infecção por H. pylori com lesões precursoras de câncer gástrico em uma população brasileira, enfatizando a importância de medidas de prevenção de infecção, bem como o tratamento de pacientes infectados, principalmente em regiões com níveis socioeconômicos mais baixos que apresentam maior prevalência de infecção por H. pylori.
DESCRITORES – Helicobacter pylori. Neoplasias gástricas. Metaplasia. Gastrite atrófica.
REFERENCES
1. Kumar V, Abbas AK, Aster JC. Robbins Basic Pathology. 10th ed. New York: Elsevier; 2018.
2. Choi AY, Strate LL, Fix MC, Schmidt RA, Ende AR, Yeh MM, et al. Association of gastric intestinal metaplasia and East Asian ethnicity with the risk of gastric adenocarcinoma in a U.S. population. Gastrointest Endosc. 2018;87:1023-8.
3. Sipponen P and Maaroos HI. Chronic gastritis. Scand J Gastroenterol. 2015;50:657-67.
4. Azer SA, Akhondi H. Gastritis. StatPearls [Internet]. [Update 2019 June 24]. StatPearls Publishing; 2019.
5. Maciel RARS. Estudo inter e intraobservadores da reprodutibilidade do diagnóstico histológico da gastrite crônica, de acordo com o Sistema Sydney atualizado [Thesis]. Belo Horizonte: Universidade Federal de Minas Gerais – UFMG; 2010.
6. Ddine LC, Ddine CC, Rodrigues CCR, Kirsten VR, Colpo E. Factors associated with chronic gastritis in patients with presence and absence of Helicobacter pylori. ABCD Arq Bras Cir Dig. 2012;25:96-100.
7. Camilo V, Sugiyama T, Touati E. Pathogenesis of Helicobacter pylori infection. Helicobacter. 2017;22 (Suppl 1):e12405.
8. Ladeira MSP, Salvadori DMF, Rodrigues MAM. Biopatologia do Helicobacter pylori. J Bras Patol Med Lab. 2003;39:335-42.
9. Mobley HLT, Mendz GL, Hazell SL. Helicobacter pylori. Physiology and Ge-netics. Washington (DC): ASM Press; 2001.
10. Siqueira JS, Lima PSS, Barreto AS, Quintans-Júnior LJ. General aspects of Helicobacter pylori infections review. Rev Bras Anal Clin. 2007;39:9-13.
11. Correa P. A human model of gastric carcinogenesis. Cancer Res. 1988;48:3554-60.12. Park YH, Kim N. Review of atrophic gastritis and intestinal metaplasia as a
premalignant lesion of gastric cancer. J Cancer Prev. 2015;20:25-40.13. Jeong S, Choi E, Petersen CP, Roland JT, Federico A, Ippolito R, et al. Distinct
metaplastic and inflammatory phenotypes in autoimmune and adenocarcino-ma-associated chronic atrophic gastritis. United European Gastroenterol J. 2017;5:37-44.
14. Pandya HB, Patel JS, Agravat HH, Patel SB, Thakkar MC. Identification of He-licobacter pylori by different conventional staining techniques and its comparison with polymerase chain reaction. Saudi Med J. 2013;34:942-8.
15. Price AB. The Sydney System: histological division. J Gastroenterol Hepatol. 1991;6:209-22.
16. Cu PQ, Huyen NX, Luan TT, Hung NQ, Hop TV. Helicobacter pylori and precancerous gastric lesions. Dig Endosc. 2000;12:221-4.
17. Dixon MF, Genta RM, Yardley JH, Correa P. Classification and grading of gastritis. The updated Sydney System. International Workshop on the Histopa-thology of Gastritis, Houston 1994. Am J Surg Pathol. 1996;20:1161-81.
18. Goderska K, Agudo Pena S, Alarcon T. Helicobacter pylori treatment: antibiotics or probiotics. Appl Microbiol Biotechnol. 2018;102:1-7.
19. Moayyedi P, Hunt RH. Helicobacter pylori public health implications. Helico-bacter. 2004;9 (Suppl 1):67-72.
20. Salih BA. Helicobacter pylori Infection in Developing Countries: The Burden for How Long? Saudi J Gastroenterol. 2009;15:201-7.
21. Hooi JKY, Lai WY, Ng WK, Suen MMY, Underwood FE, Tanyingoh D, et al. Global Prevalence of Helicobacter pylori Infection: Systematic Review and Meta-Analysis. Gastroenterology. 2017;153:420-9.
22. Garza-González E, Perez-Perez GI, Maldonado-Garza HJ, Bosques-Padilla FJ. A review of Helicobacter pylori diagnosis, treatment, and methods to detect eradication. World J Gastroenterol. 2014;20:1438-49.
23. Hirschl AM, Rotter ML. Serological tests for monitoring Helicobacter pylori eradication treatment. J Gastroenterol. 1996;31 (Suppl 9):33-6.
24. Axon AT. Are all helicobacters equal? Mechanisms of gastroduodenal pathology and their clinical implications. Gut. 1999; 45 (Suppl 1):1-4.
25. Frugis S, Czeczko NG, Malafaia O, Parada AA, Poletti PB, Secchi TF, et al. Prevalence of Helicobacter pylori ten years ago compared to the current preva-lence in patients undergoing upper endoscopy. ABCD Arq Bras Cir Dig. [online]. 2016;29:151-4.

Rodrigues MF, Guerra MR, Alvarenga AVR, Souza DZO, Costa RAVS, Cupolilo SMN.Helicobacter pylori infection and gastric cancer precursor lesions: prevalence and associated factors in a reference laboratory in Southeastern Brazil
424 • Arq Gastroenterol • 2019. v. 56 nº 4 out/dez
26. Zamani M, Vahedi A, Maghdouri Z, Shokri-Shirvani J. Role of food in environ-mental transmission of Helicobacter pylori. Caspian J Intern Med. 2017;8:146-52.
27. Ferrari F, Dutra ECG, Zanardi HC, Scolaro BL, Ferrari OM. Time trends of Helicobacter pylori prevalence in Itajaí - SC: a retrospective study of 25 years based on endoscopic database. Arq Gastroenterol. 2019;56:131-40.
28. Mera RM, Bravo LE, Camargo MC, Bravo JC, Delgado AG, Romero-Gallo J, et al. Dynamics of Helicobacter pylori infection as a determinant of progression of gastric precancerous lesions: 16-year follow-up of an eradication trial. Gut. 2018;67:1239-46.
29. Spence AD, Cardwell CR, McMenamin ÚC, Hicks BM, Johnston BT, Murray LJ, et al. Adenocarcinoma risk in gastric atrophy and intestinal metaplasia: a systematic review. BMC Gastroenterol. 201711;17:157.
30. Marques-Silva L, Areia M, Elvas L, Dinis-Ribeiro M. Prevalence of gastric pre-cancerous conditions: a systematic review and meta-analysis. Eur J Gastroenterol Hepatol. 2014;26:378-87.
31. Muller LB, Fagundes RB, Moraes CC, Rampazzo A. Prevalence of Helicobacter pylori infection and gastric cancer precursor lesions in patients with dyspepsia. Arq Gastroenterol. 2007;44:93-8.
32. Motta CR, Cunha MP, Queiroz DM, Cruz FW, Guerra EJ, Mota RM, et al. Gastric precancerous lesions and Helicobacter pylori infection in relatives of gastric cancer patients from Northeastern Brazil. Digestion. 2008;78:3-8.
33. Olmez S, Aslan M, Erten R, Sayar S, Bayram I. The Prevalence of Gastric In-testinal Metaplasia and Distribution of Helicobacter pylori Infection, Atrophy, Dysplasia, and Cancer in Its Subtypes. Gastroenterol Res Pract. 2015;2015: 434039.
34. Ozdil K, Sahin A, Kahraman R, Yuzbasioglu B, Demirdag H, Calhan T, et al. Current prevalence of intestinal metaplasia and Helicobacter pylori infection in dyspeptic adult patients from Turkey. Hepatogastroenterology. 2010;57:1563-6.
35. Uemura N, Okamoto S, Yamamoto S, Matsumura N, Yamaguchi S, Yamakido M, et al. Helicobacter pylori infection and the development of gastric cancer. N Engl J Med. 2001;345:784-9.
36. Kim N, Park YS, Cho SI, Lee HS, Choe G, Kim IW, et al. Prevalence and risk factors of atrophic gastritis and intestinal metaplasia in a Korean population without significant gastroduodenal disease. Helicobacter. 2008;13:245-55.
37. Abadir A, Streutker C, Brezden-Masley C, Grin A, Kim YI. Intestinal metaplasia and the risk of gastric cancer in an immigrant asian population. Clin Med Insights Gastroenterol. 2012;5:43-50.
38. Cheung DY. Atrophic Gastritis Increases the Risk of Gastric Cancer in Asymp-tomatic Population in Korea. Gut Liver. 2017;11:575-6.
39. Gomez JM, Wang AY. Gastric intestinal metaplasia and early gastric cancer in the west: a changing paradigm. Gastroenterol Hepatol (NY). 2014;10:369-78.
40. Meining A, Morgner A, Miehlke S, Bayerdörffer E, Stolte M. Atrophy-meta-plasia-dysplasia-carcinoma sequence in the stomach: a reality or merely an hypothesis? Best Pract Res Clin Gastroenterol. 2001;15:983-98.
41. Zhang RG, Duan GC, Fan QT, Chen SY. Role of Helicobacter pylori infection in pathogenesis of gastric carcinoma. World J Gastrointest Pathophysiol. 2016;7:97-107.
42. Zullo A, Hassan C, Romiti A, Giusto M, Guerriero C, Lorenzetti R, et al. Follow-up of intestinal metaplasia in the stomach: When, how and why. World J Gastrointest Oncol. 2012;4:30-6.
43. Echizen K, Hirose O, Maeda Y, Oshima M. Inflammation in gastric cancer: In-terplay of the COX-2/prostaglandin E2 and Toll-like receptor/MyD88 pathways. Cancer Sci. 2016;107:391-7.
44. Maeda Y, Echizen K, Oshima H, Yu L, Sakulsak N, Hirose O, et al. Myeloid differentiation factor 88 signaling in bone marrow-derived cells promotes gastric tumorigenesis by generation of inflammatory microenvironment. Cancer Prev Res. (Phila) 2016;9:253-63.
45. Sung JJ, Leung WK, Go MY, To KF, Cheng AS, Ng EK, et al. Cyclooxygenase-2 expression in Helicobacter pylori-associated premalignant and malignant gastric lesions. Am J Pathol. 2000;157:729–35.
46. Zhang XY, Zhang PY, Aboul-Soud MA. From inflammation to gastric cancer: Role of Helicobacter pylori. Oncol Lett. 2017;13:543-8.
47. Naito Y, Yoshikawa T. Molecular and cellular mechanisms involved in Helico-bacter pylori-induced inflammation and oxidative stress. Free Radic Biol Med. 2002;33:323-36.
48. Petersen CP, Weis VG, Nam KT, Sousa JF, Fingleton B, Goldenring JR. Macro-phages promote progression of spasmolytic polypeptide-expressing metaplasia after acute loss of parietal cells. Gastroenterology. 2014;146:1727-38.e8.
49. Cosar AM. Effect of cumulative time of Helicobacter pylori infection on gastric precancerous lesions? Turk J Gastroenterol. 2018;29:524-5.
50. Zhou L, Lin S, Ding S, Huang X, Jin Z, Cui R, et al. Relationship of Helicobacter pylori eradication with gastric cancer and gastric mucosal histological changes: a 10-year follow-up study. Chin Med J (Engl). 2014;127:1454-8.
51. Cai X, Carlson J, Stoicov C, Li H, Wang TC, Houghton J. Helicobacter felis eradication restores normal architecture and inhibits gastric cancer progression in C57BL/6 mice. Gastroenterology. 2005;128:1937-52.
52. Lee CW, Rickman B, Rogers AB, Ge Z, Wang TC, Fox JG. Helicobacter pylori eradication prevents progression of gastric cancer in hypergastrinemic INS-GAS mice. Cancer Res. 2008;68:3540-8.

Arq Gastroenterol • 2019. v. 56 nº 4 out/dez • 425
REVIEW
INTRODUCTION
Vitamin D deficiency is being recognized as a pandemic because of the volume of people affected by deficiency and the number of diseases generated or stimulated by such a deficiency(1). Vitamin D deficiency is reported worldwide, where an estimated 1 billion people have vitamin D deficiency or insufficiency(2,3). Therefore, interest in vitamin D has increased considerably in recent years among health professionals, the media and the public.
Vitamins are essential organic compounds that cannot be synthesized by the human body and must be ingested(4). The term vitamin D refers to vitamin D2 (ergosterol) and/or vitamin D3 (cholecalciferol), since they are the most abundant and active ver-sions. Vitamin D2 and vitamin D3 are types of dry steroids, that is, steroids that suffer a break between their two chemical rings(5). Vitamin D2 is not produced in the body but obtained through diet. Vitamin D3 is the conventional definition of a vitamin, which can now be defined as a pre-hormone because it is produced by the body. Differences between the two versions can be seen in the presence of a double bond between carbons 22 and 23, and a methyl group on carbon 24 of vitamin D2(6-8).
Vitamin D was identified in the early 20th century and was initially considered as a nutrient. It has now been classified as a hor-
Definition of vitamin D deficiency in schoolchildren: systematic review with meta-analysisMarcela Almeida LINDEN, Renata Germano Borges de Oliveira Nascimento FREITAS, Gabriel HESSEL, Denise Barbieri MARMO and Maria Ângela BELLOMO-BRANDÃO
Received 12/4/2019Accepted 12/9/2019
ABSTRACT – Background – Vitamin D deficiency is being recognized as a pandemic due to the volume of people affected by the deficiency and the number of illnesses generated or stimulated by the deficiency. There is a lack of consensus in the literature on what is considered vitamin D deficiency [25(OH)D]. Objective – This review brings together the most common levels of 25(OH)D found in healthy schoolchildren and what is considered deficient. Methods – This systematic review was based on the literature accessed from the electronic databases: MEDLINE, EMBASE, LILACS, SCOPUS and WEB OF SCIENCE. The following descriptors were used in English, Portuguese and Spanish: “Vitamin D”; “Vitamin D deficiency”; “Nutritional Supplements” as well as all their synonyms. The meta-analysis was performed considering the random model. Inclusion criteria: healthy children aged 6 to 12 years, studies that had vitamin D levels, defined vitamin D deficiency. Results – Of the 191 potentially eligible articles, only six articles were included, with 2618 students in total. The mean value of 25(OH)D was estimated at 18.11 ng/mL with 95% confidence interval. Among the articles found, three were considered deficiency levels below 20 ng/mL, one considered below 18 ng/mL, another below 15 ng/mL, and the latter below 11 ng/ mL. The prevalence of vitamin D deficiency among the articles was 48.6%, 7%, 98%, 64.63%, 19.5%, 28.4%, according to each classification used by the same. Conclusion – The most common definition in the literature of 25(OH)D deficiency in schoolchildren was at levels below 20 ng/mL. No side effects have been reported in studies that used fortification and/or vitamin D supplementation. Daily supplementation is more effective than seasonal supplementation. However, more studies are needed to define what can be considered as optimal levels of 25(OH)D in children.
HEADINGS – Vitamin D. Avitaminosis. Child. Dietary Supplements. Review.
Declared conflict of interest of all authors: noneDisclosure of funding: no funding receivedUniversidade Estadual de Campinas (UNICAMP), Campinas, SP, Brasil.Corresponding author: Marcela Almeida Linden. E-mail: [email protected]
mone due to its regulation of calcium and phosphorus metabolism along with parathyroid hormone(9). Since vitamin D deficiency can cause rickets and osteomalacia, this vitamin is therefore essential for the maintenance of bone health of children and adults(10-11).
The 25-hydroxyvitamin D (25[OH]D) is the most abundant metabolite and the best indicator for the evaluation of vitamin D status. Low levels of 25(OH)D are associated with several factors such as skin pigmentation, use of sunscreen, clothing, latitude, season of the year, air pollution, decreased intake of food source, malabsorption syndrome, obesity, withdrawal from sun exposure, pregnancy, age, renal or hepatic failure(12,13).
In children and adolescents, 25(OH)D blood levels are being associated with the prevention of diseases related to the immune system (asthma, diabetes mellitus type 1), infectious diseases (res-piratory infections, influenza) and cardiometabolic markers(2,14). In order to prevent hypovitaminosis D, the Institute of Medicine (IOM) increased the vitamin D recommendation by establishing a Recommended Dietary Allowance value of 400 IU/day for the first year of life, and 600 IU/day for children 1 to 18 years of age(15). The IOM, after reviewing the literature, concluded that 25(OH)D levels of 20 ng/mL meet the requirements of at least 97.5% of the population in all age groups. They also concluded that a consensus is needed at cut-off points for serum inadequacy of 25(OH)D in
AG-2019-66dx.doi.org/10.1590/S0004-2803.201900000-64
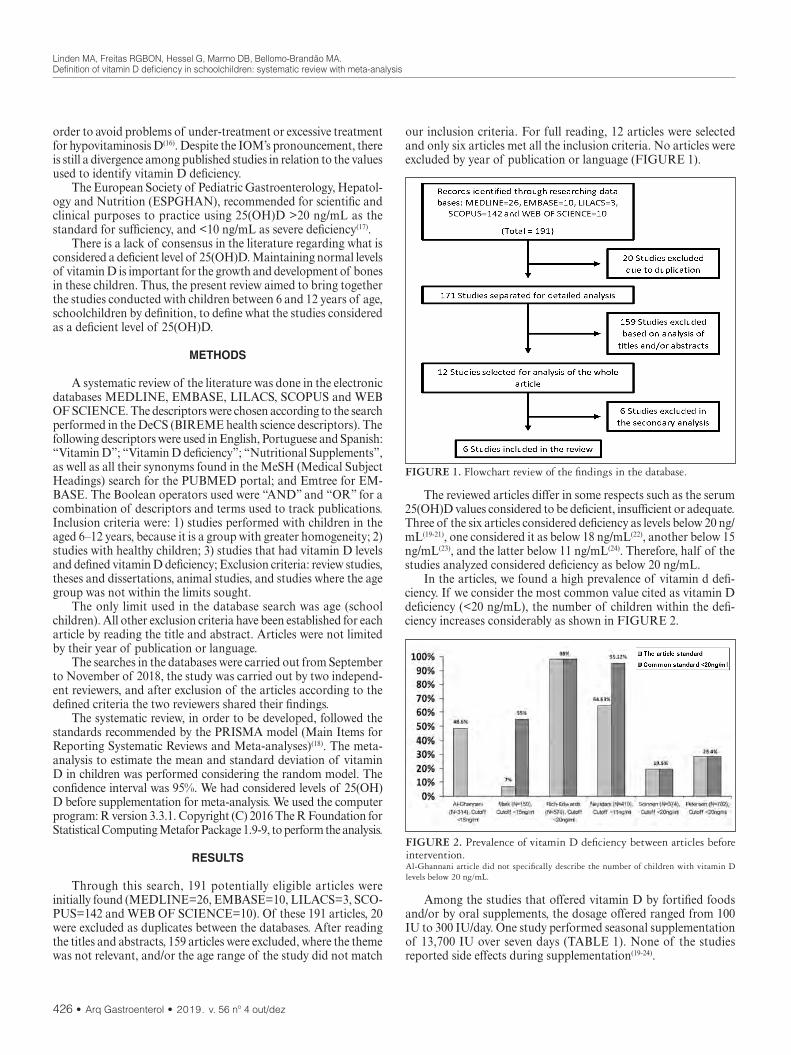
Linden MA, Freitas RGBON, Hessel G, Marmo DB, Bellomo-Brandão MA.Definition of vitamin D deficiency in schoolchildren: systematic review with meta-analysis
426 • Arq Gastroenterol • 2019. v. 56 nº 4 out/dez
order to avoid problems of under-treatment or excessive treatment for hypovitaminosis D(16). Despite the IOM’s pronouncement, there is still a divergence among published studies in relation to the values used to identify vitamin D deficiency.
The European Society of Pediatric Gastroenterology, Hepatol-ogy and Nutrition (ESPGHAN), recommended for scientific and clinical purposes to practice using 25(OH)D >20 ng/mL as the standard for sufficiency, and <10 ng/mL as severe deficiency(17).
There is a lack of consensus in the literature regarding what is considered a deficient level of 25(OH)D. Maintaining normal levels of vitamin D is important for the growth and development of bones in these children. Thus, the present review aimed to bring together the studies conducted with children between 6 and 12 years of age, schoolchildren by definition, to define what the studies considered as a deficient level of 25(OH)D.
METHODS
A systematic review of the literature was done in the electronic databases MEDLINE, EMBASE, LILACS, SCOPUS and WEB OF SCIENCE. The descriptors were chosen according to the search performed in the DeCS (BIREME health science descriptors). The following descriptors were used in English, Portuguese and Spanish: “Vitamin D”; “Vitamin D deficiency”; “Nutritional Supplements”, as well as all their synonyms found in the MeSH (Medical Subject Headings) search for the PUBMED portal; and Emtree for EM-BASE. The Boolean operators used were “AND” and “OR” for a combination of descriptors and terms used to track publications. Inclusion criteria were: 1) studies performed with children in the aged 6–12 years, because it is a group with greater homogeneity; 2) studies with healthy children; 3) studies that had vitamin D levels and defined vitamin D deficiency; Exclusion criteria: review studies, theses and dissertations, animal studies, and studies where the age group was not within the limits sought.
The only limit used in the database search was age (school children). All other exclusion criteria have been established for each article by reading the title and abstract. Articles were not limited by their year of publication or language.
The searches in the databases were carried out from September to November of 2018, the study was carried out by two independ-ent reviewers, and after exclusion of the articles according to the defined criteria the two reviewers shared their findings.
The systematic review, in order to be developed, followed the standards recommended by the PRISMA model (Main Items for Reporting Systematic Reviews and Meta-analyses)(18). The meta-analysis to estimate the mean and standard deviation of vitamin D in children was performed considering the random model. The confidence interval was 95%. We had considered levels of 25(OH)D before supplementation for meta-analysis. We used the computer program: R version 3.3.1. Copyright (C) 2016 The R Foundation for Statistical Computing Metafor Package 1.9-9, to perform the analysis.
RESULTS
Through this search, 191 potentially eligible articles were initially found (MEDLINE=26, EMBASE=10, LILACS=3, SCO-PUS=142 and WEB OF SCIENCE=10). Of these 191 articles, 20 were excluded as duplicates between the databases. After reading the titles and abstracts, 159 articles were excluded, where the theme was not relevant, and/or the age range of the study did not match
our inclusion criteria. For full reading, 12 articles were selected and only six articles met all the inclusion criteria. No articles were excluded by year of publication or language (FIGURE 1).
FIGURE 1. Flowchart review of the findings in the database.
The reviewed articles differ in some respects such as the serum 25(OH)D values considered to be deficient, insufficient or adequate. Three of the six articles considered deficiency as levels below 20 ng/mL(19-21), one considered it as below 18 ng/mL(22), another below 15 ng/mL(23), and the latter below 11 ng/mL(24). Therefore, half of the studies analyzed considered deficiency as below 20 ng/mL.
In the articles, we found a high prevalence of vitamin d defi-ciency. If we consider the most common value cited as vitamin D deficiency (<20 ng/mL), the number of children within the defi-ciency increases considerably as shown in FIGURE 2.
FIGURE 2. Prevalence of vitamin D deficiency between articles before intervention.Al-Ghannani article did not specifically describe the number of children with vitamin D levels below 20 ng/mL.
Among the studies that offered vitamin D by fortified foods and/or by oral supplements, the dosage offered ranged from 100 IU to 300 IU/day. One study performed seasonal supplementation of 13,700 IU over seven days (TABLE 1). None of the studies reported side effects during supplementation(19-24).

Linden MA, Freitas RGBON, Hessel G, Marmo DB, Bellomo-Brandão MA.Definition of vitamin D deficiency in schoolchildren: systematic review with meta-analysis
Arq Gastroenterol • 2019. v. 56 nº 4 out/dez • 427
TABLE 1. Main data of the articles selected for the systematic review.
Reference Population Age Study objective Type of study Type of interventionReference value used
Results
Mark et al., 2011(24)
159 Canadian children of both sexes.
8–11 years
To describe the modifiable correlates of vitamin D status in youth; including intake of vitamin D food sources, supplements, physical activity and adiposity.
Prospective
A 24-hour food recall for 3 days was used to evaluate the consumption of Vitamin D by diet and supplementation.
15 ng/mL
Vitamin D intake was below current recommendations, with 45% of youths having 25(OH)D levels below 20 ng/mL;Greater physical activity showed an increase of 0.84 ng/mL of 25(OH)D.They believe it is unlikely that increased milk consumption or increased physical activity (outdoors) would increase vitamin D enough to reach sufficient levels of 25(OH)D in Canadian youth.
Rich-Edwards et al., 2011(20)
579 Mongolian children of both sexes.
9–11 years
To verify if daily supplementation of vitamin D would be more effective than seasonal supplementation
Randomized
Duration of 49 days.Group with ordinary milk - 710 mL/day.Group with US fortified milk - 710 mL/day containing 300 IU of vitamin D.Group with fortified milk in Mongolia day containing 300 IU of vitamin D.Group with vitamin D supplementation of 300 IU daily.Group with seasonal vitamin D supplementation - 13700 IU after 7 days.
20 ng/mL
Of the children who received seasonal supplementation after 49 days, 98% were still with low levels of vitamin D compared to 41% in those receiving daily supplementation or fortified milk.The impact of supplementation was greater in those who started with lower baseline vitamin D levels.Supplementation with 300 IU/day of vitamin D was not able to remove the children from the deficiency; it was suggested that larger daily doses are necessary.
Neyestan et al., 2014(25)
410 Iranian children of both sexes.
9–12 years
To compare the effectiveness of vitamin D fortification in milk and orange juice and supplementation in primary school children.
Randomized double blind
Duration of 12 weeks.Group with pure milk.Group with fortified milk (100 IU of vitamin D and 500 mg of calcium per 200 mL package).Group with pure orange juice.Group with fortified orange juice (100 IU of vitamin D and 500 mg of calcium per 200 mL package).Group with supplement (200 IU of vitamin D and 500 mg of calcium).Placebo group.
11 ng/mL
After 12 weeks, supplementation with 200 IU of vitamin D and 500 mg of calcium was more effective in increasing 25(OH)D levels and in suppressing the seasonal increase in bone-specific alkaline phosphatase. However, it was not verified that the intervention contributed to the increase of osteocalcin or reduction of parathormone.Consumption of 200 IU/day via supplement or 100 IU/day via food fortification was not effective to protect D hypovitaminosis.
Al-Ghannami et al., 2016(23)
314 children of Oman of both sexes.
9–10 years
To evaluate plasma fat-soluble vitamin levels in pre-adolescent schoolchildren. To observe the effects of the fish-based menu with docosahexaenoic acid (DHA) and eicosapentaenoic acid (EPA) supplementation by fish oil in children.
Randomized
Duration of 12 weeks.Control group with normal meals.Group with fish oil (403 mg of DHA and 53 mg of EPA).Group with a meal containing 100 g of grouper, snapper, kingfisher, emperor or anchovy fish (having 150 to 200 mg of omega-3).
18 ng/mL
In children who received fish oil or a fish meal, the vitamin D value was higher than in the control group.Only 7.3% of boys and 0.6% of girls had sufficient levels of 25 (OH) D> 30 ng/mL.There is an urgent need for a well-thought program that incorporates a food and beverage fortification and outdoor activities to help address this public health problem.
Petersen et al., 2016(21)
782 Danish children of both sexes.
8–11 years
To assess vitamin D status and its determinants in children in the fall period.
Randomized
A 24-hour food recall for 7 days was carried out to evaluate the consumption of food sources of vitamin D.
20 ng/mL
The large number of children (28.4%) with vitamin D deficiency (25(OH)D <20 ng/mL) is a concern.The use of vitamin D supplements 3d/7d was associated with an increase of approximately 3.6 ng/mL of 25(OH)D.Vitamin D deficiency should not be perceived as a winter phenomenon.The non-white ethnicity and the female gender were associated with lower 25(OH)D.
Soininen et al., 2016(22)
374 Finnish children of both sexes.
6–8 years
To investigate the distribution and serum 25(OH)D levels, and risk factors for low levels (<20 ng/mL) of 25(OH)D in Finnish children.
ProspectiveA 4-day dietary recall was used to evaluate the quality of the diet.
20 ng/mL
4/5 of children do not consume the recommended daily amount of vitamin D.1/5 of the children had vitamin D deficiency (25(OH)D <20 ng/mL).Fortified milk (0.5 μg/100 g of vitamin D) was the food that contributed to the highest concentration of 25(OH)D. Next, the supplement was also a determinant for vitamin D intake among girls.There is a need to increase the supply of vitamin D (from foods or supplements) to children who live in places with higher latitudes.
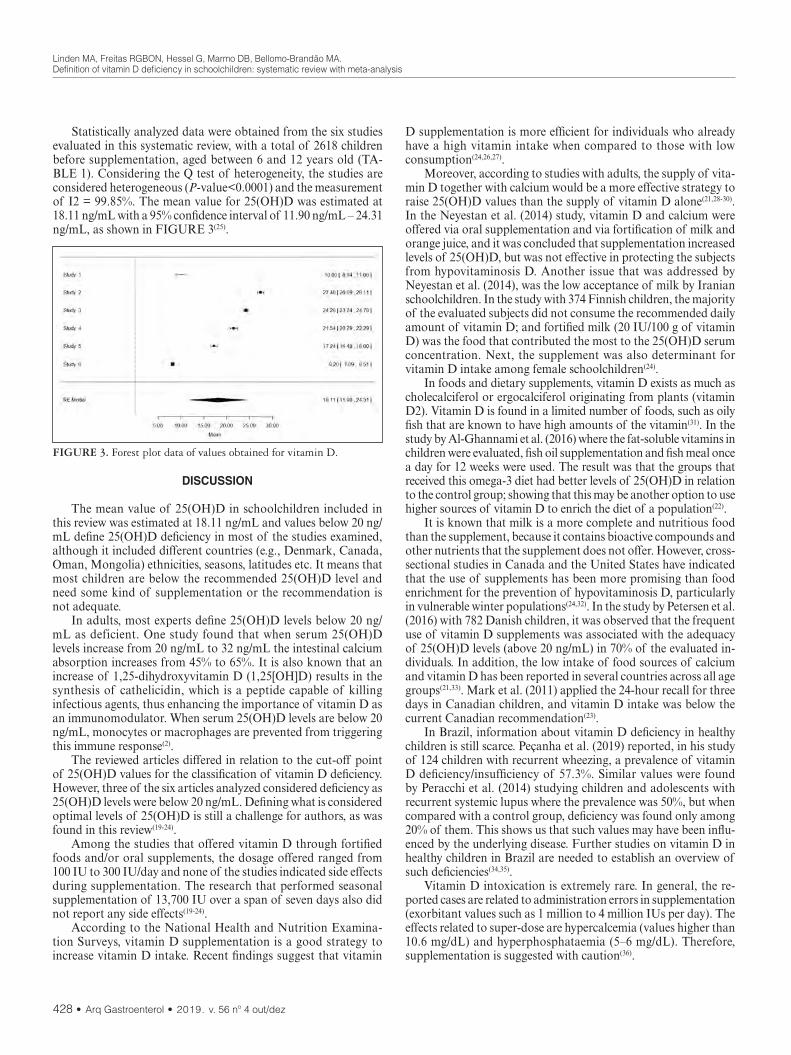
Linden MA, Freitas RGBON, Hessel G, Marmo DB, Bellomo-Brandão MA.Definition of vitamin D deficiency in schoolchildren: systematic review with meta-analysis
428 • Arq Gastroenterol • 2019. v. 56 nº 4 out/dez
Statistically analyzed data were obtained from the six studies evaluated in this systematic review, with a total of 2618 children before supplementation, aged between 6 and 12 years old (TA-BLE 1). Considering the Q test of heterogeneity, the studies are considered heterogeneous (P-value<0.0001) and the measurement of I2 = 99.85%. The mean value for 25(OH)D was estimated at 18.11 ng/mL with a 95% confidence interval of 11.90 ng/mL – 24.31 ng/mL, as shown in FIGURE 3(25).
D supplementation is more efficient for individuals who already have a high vitamin intake when compared to those with low consumption(24,26,27).
Moreover, according to studies with adults, the supply of vita-min D together with calcium would be a more effective strategy to raise 25(OH)D values than the supply of vitamin D alone(21,28-30). In the Neyestan et al. (2014) study, vitamin D and calcium were offered via oral supplementation and via fortification of milk and orange juice, and it was concluded that supplementation increased levels of 25(OH)D, but was not effective in protecting the subjects from hypovitaminosis D. Another issue that was addressed by Neyestan et al. (2014), was the low acceptance of milk by Iranian schoolchildren. In the study with 374 Finnish children, the majority of the evaluated subjects did not consume the recommended daily amount of vitamin D; and fortified milk (20 IU/100 g of vitamin D) was the food that contributed the most to the 25(OH)D serum concentration. Next, the supplement was also determinant for vitamin D intake among female schoolchildren(24).
In foods and dietary supplements, vitamin D exists as much as cholecalciferol or ergocalciferol originating from plants (vitamin D2). Vitamin D is found in a limited number of foods, such as oily fish that are known to have high amounts of the vitamin(31). In the study by Al-Ghannami et al. (2016) where the fat-soluble vitamins in children were evaluated, fish oil supplementation and fish meal once a day for 12 weeks were used. The result was that the groups that received this omega-3 diet had better levels of 25(OH)D in relation to the control group; showing that this may be another option to use higher sources of vitamin D to enrich the diet of a population(22).
It is known that milk is a more complete and nutritious food than the supplement, because it contains bioactive compounds and other nutrients that the supplement does not offer. However, cross-sectional studies in Canada and the United States have indicated that the use of supplements has been more promising than food enrichment for the prevention of hypovitaminosis D, particularly in vulnerable winter populations(24,32). In the study by Petersen et al. (2016) with 782 Danish children, it was observed that the frequent use of vitamin D supplements was associated with the adequacy of 25(OH)D levels (above 20 ng/mL) in 70% of the evaluated in-dividuals. In addition, the low intake of food sources of calcium and vitamin D has been reported in several countries across all age groups(21,33). Mark et al. (2011) applied the 24-hour recall for three days in Canadian children, and vitamin D intake was below the current Canadian recommendation(23).
In Brazil, information about vitamin D deficiency in healthy children is still scarce. Peçanha et al. (2019) reported, in his study of 124 children with recurrent wheezing, a prevalence of vitamin D deficiency/insufficiency of 57.3%. Similar values were found by Peracchi et al. (2014) studying children and adolescents with recurrent systemic lupus where the prevalence was 50%, but when compared with a control group, deficiency was found only among 20% of them. This shows us that such values may have been influ-enced by the underlying disease. Further studies on vitamin D in healthy children in Brazil are needed to establish an overview of such deficiencies(34,35).
Vitamin D intoxication is extremely rare. In general, the re-ported cases are related to administration errors in supplementation (exorbitant values such as 1 million to 4 million IUs per day). The effects related to super-dose are hypercalcemia (values higher than 10.6 mg/dL) and hyperphosphataemia (5–6 mg/dL). Therefore, supplementation is suggested with caution(36).
FIGURE 3. Forest plot data of values obtained for vitamin D.
DISCUSSION
The mean value of 25(OH)D in schoolchildren included in this review was estimated at 18.11 ng/mL and values below 20 ng/mL define 25(OH)D deficiency in most of the studies examined, although it included different countries (e.g., Denmark, Canada, Oman, Mongolia) ethnicities, seasons, latitudes etc. It means that most children are below the recommended 25(OH)D level and need some kind of supplementation or the recommendation is not adequate.
In adults, most experts define 25(OH)D levels below 20 ng/mL as deficient. One study found that when serum 25(OH)D levels increase from 20 ng/mL to 32 ng/mL the intestinal calcium absorption increases from 45% to 65%. It is also known that an increase of 1,25-dihydroxyvitamin D (1,25[OH]D) results in the synthesis of cathelicidin, which is a peptide capable of killing infectious agents, thus enhancing the importance of vitamin D as an immunomodulator. When serum 25(OH)D levels are below 20 ng/mL, monocytes or macrophages are prevented from triggering this immune response(2).
The reviewed articles differed in relation to the cut-off point of 25(OH)D values for the classification of vitamin D deficiency. However, three of the six articles analyzed considered deficiency as 25(OH)D levels were below 20 ng/mL. Defining what is considered optimal levels of 25(OH)D is still a challenge for authors, as was found in this review(19-24).
Among the studies that offered vitamin D through fortified foods and/or oral supplements, the dosage offered ranged from 100 IU to 300 IU/day and none of the studies indicated side effects during supplementation. The research that performed seasonal supplementation of 13,700 IU over a span of seven days also did not report any side effects(19-24).
According to the National Health and Nutrition Examina-tion Surveys, vitamin D supplementation is a good strategy to increase vitamin D intake. Recent findings suggest that vitamin
Linden MA, Freitas RGBON, Hessel G, Marmo DB, Bellomo-Brandão MA.Definition of vitamin D deficiency in schoolchildren: systematic review with meta-analysis
Arq Gastroenterol • 2019. v. 56 nº 4 out/dez • 429
We would like to point out the need for further studies in this area to establish a consensus of what is considered vitamin D deficiency.
Authors’ contributionContributed to conception or design: Linden MA; Freitas
RGBON. Contributed to acquisition, analysis, or interpretation: Linden MA; Freitas RGBON. Drafted the manuscript: Linden MA; Freitas RGBON. Critically revised the manuscript: Linden MA; Freitas RGBON; Hessel G; Marmo DB; Bellomo-Brandão MA. Gave final approval agrees to be accountable for all aspects
of work ensuring integrity and accuracy: Linden MA; Freitas RGBON; Hessel G; Marmo DB; Bellomo-Brandão MA.
OrcidMarcela Almeida Linden. Orcid: 0000-0001-6136-8341.Renata Germano Borges de Oliveira Nascimento Freitas. OR-CID: 0000-0002-0741-0702.Gabriel Hessel. Orcid: 0000-0002-9884-9381.Denise Barbieri Marmo. Orcid: 0000-0001-5227-2452.Maria Ângela Bellomo-Brandão. Orcid: 0000-0002-1145-2606.
REFERENCES
1. Hossein-nezhad A, Holick MF. Vitamin D for health: a global perspective. Mayo Clin Proc. 2013;88:720-755.
2. Holick MF. Vitamin D deficiency. N Engl J Med. 2007;357:266-81. 3. Holick MF, Chen TC. Vitamin D deficiency: a worldwide problem with health
consequences. Am J Clin Nutr. 2008;87:1080S-6S. 4. Fitzpatrick TB, Basset GJ, Borel P, Carrari F, DellaPenna D, Fraser PD, et al.
Vitamin deficiencies in humans: can plant science help? Plant Cell. 2012;24:395-414.5. Holick MF, Tian XQ, Allen M. Evolutionary importance for the membrane
enhancement of the production of vitamin D3 in the skin of poikilothermic animals. Proc Natl Acad Sci USA. 1995;92:3124-6.
6. Holick MF, Chen TC, Lu Z, Sauter E. Vitamin D and skin physiology: a D-lightful story. J Bone Min Res. 2007;22 (Suppl 2):V28-33.
7. Holick MF. High prevalence of vitamin D inadequacy and implications for health. Mayo Clin Proc. 2006;81:353-73.
8. Okamura WH, Midland MM, Hammond MW, Abd Rahman N, Dormanen MC, Nemere I, Norman AW. Chemistry and conformation of vitamin D molecules. J Steroid Biochem Mol Biol. 1995;53:603-13.
9. Holick M, MacLaughlin J, Clark M, Holick SA, Potts JT Jr, Anderson RR, et al. Photosynthesis of previtamin D3 in human skin and the physiologic consequences. Science. 1980;210:203-5.
10. Chung M, Balk EM, Brendel M, et al. Vitamin D and calcium: a systematic re-view of health outcomes. Evid Rep Technol Assess (Full Rep). 2009;(183):1-420. Review.
11. Rovner AJ, Stallings VA, Kawchak DA, Schall JI, Ohene-Frempong K, Zemel BS. High risk of vitamin D deficiency in children with sickle cell disease. J Am Diet Assoc. 2008;108:1512-6.
12. Misra M, Pacaud D, Petryk A, Collett-Solberg PF, Kappy M; Drug and Thera-peutics Committee of the Lawson Wilkins Pediatric Endocrine Society. Vitamin D deficiency in children and its management: review of current knowledge and recommendations. Pediatrics. 2008;122:398-417.
Linden MA, Freitas RGBON, Hessel G, Marmo DB, Bellomo-Brandão MA. Definição da deficiência de vitamina D em crianças em idade escolar: revisão sistemática com metanálise. Arq Gastroenterol. 2019;56(4):425-30.RESUMO – Contexto – A deficiência de vitamina D está sendo reconhecida como uma pandemia devido ao volume de pessoas afetadas pela deficiência e
o número de doenças geradas ou estimuladas por tal deficiência. Há falta de consenso na literatura sobre o que é considerado deficiência de vitamina D [25(OH)D]. Objetivo – Esta revisão reúne os níveis mais comuns de 25(OH)D encontrados em escolares saudáveis e o que é considerado deficiência. Métodos – Esta revisão sistemática foi baseada na literatura acessada a partir das bases de dados eletrônicas: MEDLINE, EMBASE, LILACS, SCO-PUS e WEB OF SCIENCE. Foram utilizados os seguintes descritores em inglês, português e espanhol: “Vitamina D”; “Deficiência de vitamina D”; “Suplementos Nutricionais”, bem como todos os seus sinônimos. A meta-análise foi realizada considerando o modelo aleatório. Critérios de inclusão: crianças saudáveis na faixa etária de 6 a 12 anos, estudos que tinham níveis de vitamina D, deficiência de vitamina D definida. Resultados – Dos 191 artigos potencialmente elegíveis, apenas seis artigos foram incluídos, com 2618 escolares no total. O valor médio de 25(OH)D foi estimado em 18,11 ng/mL com 95% de intervalo de confiança. Dentre os artigos encontrados três consideraram deficiência níveis abaixo de 20 ng/mL, um considerou abaixo de 18 ng/mL, outro abaixo de 15 ng/mL, e o último abaixo de 11 ng/mL. A prevalência da deficiência de vitamina D entre os artigos foi de 48,6%, 7%, 98%, 64,63%, 19,5%, 28,4%, de acordo com cada classificação utilizada por eles. Conclusão – A definição mais comum na literatura de deficiência de 25(OH)D em escolares foi em níveis inferiores a 20 ng/mL. Nenhum efeito colateral foi relatado em estudos que usaram fortificação e/ou suplementação de vitamina D. A suplementação diária é mais eficaz do que a suplementação sazonal. No entanto, mais estudos são necessários para definir o que pode ser considerado como níveis ótimos de 25(OH)D em crianças.
DESCRITORES – Vitamina D. Deficiência de vitaminas. Criança. Suplementos nutricionais. Revisão.
13. Holick MF. The vitamin D deficiency pandemic: Approaches for diagnosis, treatment and prevention. Rev Endocr Metab Disord. 2017;18:153-65.
14. Christakos S, DeLuca HF. Minireview: Vitamin D: is there a role in extraskeletal health? Endocrinology. 2011;152:2930-6.
15. Institute of Medicine. 2011. Dietary Reference Intakes for Calcium and Vi-tamin D. Washington, DC: The National Academies Press. doi:10.1542/peds. 2012-2590
16. Ross AC, Manson JE, Abrams SA, Aloia JF, Brannon PM, Clinton SK, et al. The 2011 Report on Dietary Reference Intakes for Calcium and Vitamin D from the Institute of Medicine: What Clinicians Need to Know. J Clin Endocrinol Metab. 2011;96:53-8.
17. Braegger C, Campoy C, Colomb V, Decsi T, Domellof M, Fewtrell M, et al. Vi-tamin D in the healthy European paediatric population. J Pediatr Gastroenterol Nutr. 2013;56:692-701.
18. Itens P, Revis R, Uma P. Principais itens para relatar Revisões sistemáticas e Meta-análises: A recomendação PRISMA. Epidemiol e Serviços Saúde. 2015;24:335-342. doi:10.5123/S1679-49742015000200017.
19. Rich-Edwards JW, Ganmaa D, Kleinman K, Sumberzul N, Holick MF, Lkhagvasuren T, et al. Randomized trial of fortified milk and supplements to raise 25-hydroxyvitamin D concentrations in schoolchildren in Mongolia. Am J Clin Nutr. 2011;94:578-84.
20. Petersen RA, Damsgaard CT, Dalskov SM, Sørensen LB, Hjorth MF, Ritz C, et al. Vitamin D status and its determinants during autumn in children at northern latitudes: a cross-sectional analysis from the optimal well-being, development and health for Danish children through a healthy New Nordic Diet (OPUS) School Meal Study. Br J Nutr. 2016;115:239-50.
21. Soininen S, Eloranta AM, Lindi V, Venäläinen T, Zaproudina N, Mahonen A, Lakka TA. Determinants of serum 25-hydroxyvitamin D concentration in Finnish children: the Physical Activity and Nutrition in Children (PANIC) study. Br J Nutr. 2016;115:1080-91.
Linden MA, Freitas RGBON, Hessel G, Marmo DB, Bellomo-Brandão MA.Definition of vitamin D deficiency in schoolchildren: systematic review with meta-analysis
430 • Arq Gastroenterol • 2019. v. 56 nº 4 out/dez
22. Al-Ghannami SS, Sedlak E, Hussein IS, Min Y, Al-Shmmkhi SM, Al-Oufi HS, et al. Lipid-soluble nutrient status of healthy Omani school children before and after intervention with oily fish meal or re-esterified triacylglycerol fish oil. Nutrition. 2016;32:73-8.
23. Mark S, Lambert M, Delvin EE, O’Loughlin J, Tremblay A, Gray-Donald K. Higher vitamin D intake is needed to achieve serum 25(OH)D levels greater than 50 nmol/l in Quebec youth at high risk of obesity. Eur J Clin Nutr. 2011;65: 486-92.
24. Neyestani TR, Hajifaraji M, Omidvar N, Nikooyeh B, Eshraghian MR, Shari-atzadeh N, et al. Calcium-vitamin D-fortified milk is as effective on circulating bone biomarkers as fortified juice and supplement but has less acceptance: a randomised controlled school-based trial. J Hum Nutr Diet. 2014;27:606-16.
25. Weeks JP. Journal of Statistical Software. J Stat Softw. 2010;35(12).26. Biesalski HK. Vitamin D recommendations: beyond deficiency. Ann Nutr Metab.
2011;59:10-16.27. Whiting SJ, Calvo MS. Dietary recommendations to meet both endocrine and
autocrine needs of Vitamin D. J Steroid Biochem Mol Biol. 2005;97:7-12. 28. Berlin T, Bjorkhem I. Effect of calcium intake on serum levels of 25-hydroxyvi-
tamin D3. Eur J Clin Invest. 1988;18:52-5.
29. Thomas SD, Need AG, Nordin BE. Suppression of C-terminal telopeptide in hypovitaminosis D requires calcium as well as vitamin D. Calcif Tissue Int. 2010;86:367-74.
30. Soininen S, Eloranta AM, Lindi V, Lakka TA. Response: food fortification as a means to increase vitamin D intake. Br J Nutr. 2016;116:1134-5.
31. Picciano MF. Vitamin D Status and Health. Crit Rev Food Sci Nutr. 2010;50 (Suppl 1):24-5.
32. Calvo MS, Whiting SJ, Barton CN. Vitamin D fortification in the United States and Canada: current status and data needs. Am J Clin Nutr. 2004;80 (Suppl 6):1710s-6s.
33. Kranz S, Lin P, Wagstaff D. Children’s dairy intake in the United States: too little, too fat? J Pediatr. 2007;151:642-6.
34. Peçanha M.B., Freitas R.B., Moreira T.R., Silva L.S., Oliveira L.L., Cardoso S.A. Prevalence of vitamin D defi ciency and its relationship with factors associated with recurrent wheezing. J. Bras Pneumol. 2019;45(1).
35. Peracchi OA, Terreri MT, Munekata RV, Len CA, Sarni RO, Lazaretti-Castro M, Hilário MO Low serum concentrations of 25-hydroxyvitamin D in children and adolescents with systemic lupus erythematosus. Braz J Med Biol Res. 2014;47:721-6.
36. Holick MF. The vitamin D deficiency pandemic: Approaches for diagnosis, treatment and prevention. Rev Endocr Metab Disord. 2017;18:153-65.

REVIEW
Arq Gastroenterol • 2019. v. 56 nº 4 out/dez • 431
INTRODUCTION
Non-alcoholic fatty liver disease (NAFLD) is one of the most common forms of liver disease primarily related to the progressive increase of obesity in the world. Initially, it was considered to be a liver disease with benign course, however, it is currently known to be a complex disease which involves environmental factors and genetic predisposition(1). NAFLD ranges from simple Steatosis to non-alcoholic steatohepatitis (NASH) that can have different degrees of fibrosis and progress to liver cirrhosis and hepatocel-lular carcinoma (HCC) in patients with no history of alcoholism(2). Sedentary lifestyle, inadequate intake of foods with high fat and fructose consumption, as well as obesity, metabolic syndrome (MtS), type 2 diabetes mellitus (T2DM), hormonal status and genetic background have been described as responsible for the development of NAFLD(3).
Due to increasing rates of obesity, NAFLD has become more prevalent in all populations, especially in the Western world and has been defined by specialists as the disease of the modern world(4). NAFLD is highly prevalent in the United States and around the world. However, this prevalence differs significantly according to the diagnostic method used and the population studied. As rates of obesity, T2DM and MtS continue to increase, NAFLD can significantly affect health care and the development of long-term complications such as cirrhosis and HCC in the next few years(5).
DIET, NUTRITION INTAKE AND NAFLD
Balanced and healthy nutrition is one of the main determi-nants of nutritional status that can prevent many diseases, such as NAFLD.
Impact of current diet at the risk of non-alcoholic fatty liver disease (NAFLD)
Sebastião Mauro Bezerra DUARTE1, José Tadeu STEFANO2, Denise Siqueira VANNI3, Flair José CARRILHO1,3 and Claudia Pinto Marques Souza de OLIVEIRA1,2
Received 3/5/2019Accepted 24/9/2019
ABSTRACT – The nonalcoholic fatty liver disease (NAFLD) affects approximately 20%–30% of general population and is even more prevalent among
obese individuals. The risk factors mainly associated with NAFLD are diseases related to the metabolic syndrome, genetics and environment. In this
review, we provide a literature compilation evaluating the evidence behind dietary components, including calories intake, fat, protein, fibers and car-
bohydrate, especially fructose which could be a trigger to development and progression of the NAFLD. In fact, it has been demonstrated that diet is
an important factor for the development of NAFLD and its association is complex and extends beyond total energy intake.
HEADINGS – Non-alcoholic fatty liver disease. Energy intake. Dietary fats. Dietary carbohydrates. Fructose.
Declared conflict of interest of all authors: noneDisclosure of funding: no funding received1 Universidade de São Paulo, Faculdade de Medicina, São Paulo, SP, Brasil. 2 Universidade de São Paulo, Hospital das Clínicas, Laboratório de Gastroenterologia Clínica e Experimental (LIM-07) do Departamento de Gastroenterologia da FMUSP, São Paulo, SP, Brasil. 3 Universidade de São Paulo, Hospital das Clínicas, Divisão de Gastroenterologia e Hepatologia Clínica e Departamento de Gastroenterologia da FMUSP, São Paulo, SP, Brasil.Corresponding author: Claudia Pinto Marques de Souza de Oliveira. E-mail: [email protected]
In fact, an inadequate diet, with a high concentration of satu-rated fat and cholesterol, simple carbohydrates and xenobiotics, or external contaminants, which lacks in vitamins and fibers, is an important factor for the development of NAFLD. Zelber-Sagi et al. demonstrated that excess caloric consumption, unhealthy diet, sedentary lifestyle leading to obesity and related comorbidities and weight gain per se, even a modest weight gain of 3–5 kg, are leading risk factors for NAFLD, regardless of baseline body mass index (BMI)(6).
Research studies, in order to identify factors related to the de-velopment of NAFLD and progression to NASH have discovered that endogenous and exogenous factors [biological origin, synthetic (industrial) or environmental] act as hepatotoxins, including food and water(7,8). Diet is an important factor in the development of NAFLD and this relationship is complex and extends beyond total energy intake. NAFLD patients shown higher energy intake, significantly lower protein and carbohydrate and higher total fat, higher intake of saturated fat, and n-6 consumption was identified compared to controls(9-11).
CALORIES AND FAT
Studies have analyzed the association between liver fat content and calorie and fat intake(12-14). It has been demonstrated that patients with NAFLD have a significantly higher daily overall calories intake whereas the general dietary composition displays only moderate deviations when compared to healthy controls(9,15).
Moreover, epidemiological studies have demonstrated that NASH patients have a diet richer in saturated fat and cholesterol and poorer in polyunsaturated fatty acids (PUFA) when compared to healthy controls with same age, gender and BMI(11,16).
AG-2019-74dx.doi.org/10.1590/S0004-2803.201900000-67

Duarte SMB, Stefano JT, Vanni DS, Carrilho FJ, Oliveira CPMSImpact of current diet at the risk of non-alcoholic fatty liver disease (NAFLD)
432 • Arq Gastroenterol • 2019. v. 56 nº 4 out/dez
A recent study of Solon-Biet et al. has revealed that a high fat diet induces hepatic steatosis quickly in ad libitum-fed mice(8).
In obese humans, a diet containing about 55% of fat increases the amount of intrahepatic triglycerides (TG) by 35% and the fasting insulin levels are augmented, regardless of body weight(17).
Despite the fact that excessive consumption of saturated fatty acids promotes stress in the endoplasmic reticulum and hepato-cyte injury, severe restriction may not be beneficial for patients with NAFLD as previously shown by Zivkovic et al. study. They analyzed dietary patterns with different percentages of total and saturated fat and concluded that, although there was a reduction of low-density lipoprotein cholesterol (LDL), hypolipidic diets also reduced high-density lipoprotein cholesterol levels and increased serum TG and, in individuals with higher percentages of body fat and with insulin resistance (IR), these changes were much more significant after ingestion of very low amounts of total and saturated fats(18).
On the other hand, monounsaturated fatty acids, mainly olive oil, oleaginous (nuts, almonds) and avocado, can be very benefi-cial for patients with NAFLD as they lower the levels of LDL cholesterol and TG. Diets that range between 20% and 40% of the total caloric value in the form of monounsaturated fats have been shown to be beneficial in NAFLD patients, increasing the oxidation of other fatty acids (by the activation of peroxisome proliferator-activated receptors gamma and alpha) and by reduc-tion of lipogenesis (reducing the activation of the sterol regulatory element binding protein)(19).
Low-calorie diets (800 to 1.000 kcal) were used in an attempt to promote faster and meaningfull weight loss to for a promotion adipose tissue metabolism. A calorie diet derived from low carbohy-drate supply (based on 10% of total calorie in one induction phase and then a gradual increase to 34%), was associated with weight reduction when compared to a diet with low lipid content. However, this weight loss was not sustained, and the patient showed diffi-culty in maintaining his weight in the long term(20). More evidence suggests that limiting carbohydrate intake to less than 20 g/day as well as maintaining a caloric deficit of 30%, both were beneficial in achieving improvements in NAFLD Activity Score(21), hepatic lipids(22) and serum hepatic enzymes(23). Therefore, a caloric deficit of 500-750 kcal/day is an appropriate therapeutic intervention for NAFLD. It is suggested that women should eat 1200 kcal/day and men 1500 kcal/day and a slightly higher amount of 1500 kcal/day for women and 1800 kcal/day for men might be considered, with adjustments based on their physical activity(15).
CARBOHYDRATE
During the last decade, dietary habits have evolved to more consumption of sweetened and fatty foods(24).There are substantial evidences which demonstrates that the implication of increased consumption of sugars, specially fructose (sweetened beverage intake), is related to a higher risk of developing T2DM, MtS, NAFLD and cardiovascular (CV) diseases(25).
Furthermore, excessive carbohydrate intake may be harmful in patients with NAFLD, and high carbohydrates intake appear to be associated with inflammation and disease progression(26). In fact, low-carbohydrate diets with less than 45% carbohydrates of their total kcal composition show positive results concerning weight loss, reduction of in intrahepatic TG content and improvement of metabolic parameters among obese individual. However, in an
animal model study the maintenance of low carbohydrate diets for extended period stimulated the development of NAFLD and promoted glucose intolerance(27). In this year, Sekkarie et al. evalu-ated various dietary patterns which were not limited exclusively to reduced added sugars. Such diets turned out to be protective to development and progression of NAFLD(28).
High glycemic index (GI) diets are associated with increased risk of obesity, T2DM, Hyperlipidemia and non-alcoholic fatty liver. High GI may be a good dietary marker of the effect of IR on NAFLD which confirms the importance of choosing a low-GI diet as a tool to prevent NAFLD induced by IR(29).
In the class of carbohydrates, fructose is perhaps the one that is most related to the progression of NAFLD(30,31). In the 60s, high fructose corn syrup was inserted in the food industry as a substitute of sugar and the intake increased(32). Over time, fructose was identi-fied as a sugar affecting lipid metabolism by augmenting plasma TG and free fatty acids (FFA). Recently, a cross-sectional study with obese children and adolescents with NAFLD demonstrated that fructose consumption is positively and independently associ-ated with the prevalence of NASH, as diagnosed using NAFLD Activity Score and the fatty liver progression algorithm(33). Another large-scale study with NAFLD patients analyzed the role of over-consumption of fructose-containing diet in the development of this disease. In this study, the authors describe that high daily fructose-containing diet is associated with a higher hepatic fibrosis stage in younger and elderly patients. Surprisingly, this diet was also related to a lower steatosis grade in the older group of patients(34). Volynets et al. have observed that lifestyle intervention focusing on lower fructose intake leads to reduction in hepatic reperfusion and in transaminases levels(35). These studies reinforce fructose consumption as an important preventable risk factor that may lead to advanced NAFLD.
It is known that high sugar consumption upregulates the trans-port of fructose through the GLUT5 transporter, increasing fruc-tokinase levels in the liver, independently, of energy intake excess(7). Other studies have demonstrated that fructose can also increase TG levels, lead to de novo synthesis of fatty acids, hyperuricemia, hyperferritinemia, and IR increasing the risk of NAFLD(36,37). A study conducted by Sullivan et al. investigated the absorption of fructose in lean children, obese children, and obese children with biopsy proven NAFLD and realized that children with NAFLD may be absorbing and metabolizing fructose more effectively than lean subjects, which could contribute to the pathophysiology of NAFLD. Whether this fact may be related to up-regulation of GLUT5 and fructokinase by previous fructose exposure or whether this is due to genetic/ethnic differences has yet to be determined(38).
On the other hand, high fructose consumption promotes gut inflammation followed by increasing endotoxin release, epithelial dysfunction, and reduction of tight junction proteins independently of the fat content in the diet and energy intake(39). These data il-lustrate the high impact of nutritional fructose on the intestinal barrier function. An hypothesis exists whether fructose could cause dysbiosis and increase intestinal permeability and endotoxins in the blood(40). Studies have shown a relation between NAFLD-microbi-ome and diet(33,41,42), leading to intestinal dysbiosis, a scenario that is related to risk factors inducing the development and progression of liver diseases(43,44). A proposed mechanism to explain the relation of a high fructose diet and altered intestinal microbiota leading to increased body fat is the intestinal suppression provoked by fast-ing induced adipose factor (FIAF). This protein is produced by
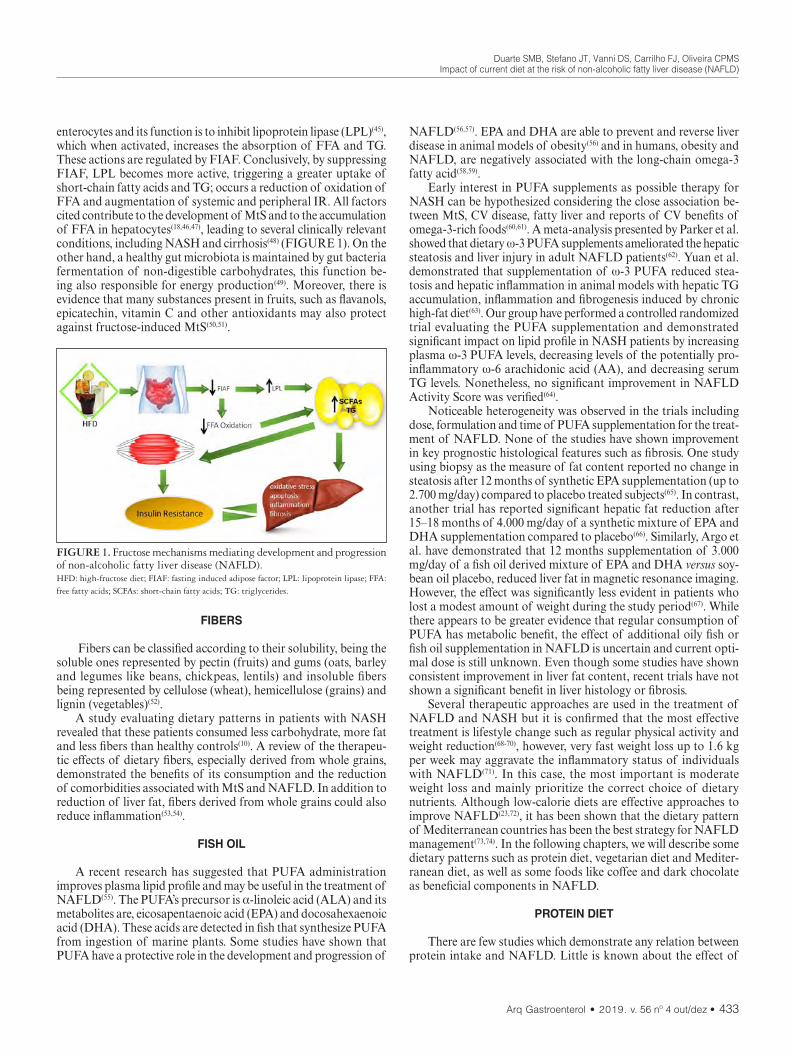
Duarte SMB, Stefano JT, Vanni DS, Carrilho FJ, Oliveira CPMSImpact of current diet at the risk of non-alcoholic fatty liver disease (NAFLD)
Arq Gastroenterol • 2019. v. 56 nº 4 out/dez • 433
enterocytes and its function is to inhibit lipoprotein lipase (LPL)(45), which when activated, increases the absorption of FFA and TG. These actions are regulated by FIAF. Conclusively, by suppressing FIAF, LPL becomes more active, triggering a greater uptake of short-chain fatty acids and TG; occurs a reduction of oxidation of FFA and augmentation of systemic and peripheral IR. All factors cited contribute to the development of MtS and to the accumulation of FFA in hepatocytes(18,46,47), leading to several clinically relevant conditions, including NASH and cirrhosis(48) (FIGURE 1). On the other hand, a healthy gut microbiota is maintained by gut bacteria fermentation of non-digestible carbohydrates, this function be-ing also responsible for energy production(49). Moreover, there is evidence that many substances present in fruits, such as flavanols, epicatechin, vitamin C and other antioxidants may also protect against fructose-induced MtS(50,51).
NAFLD(56,57). EPA and DHA are able to prevent and reverse liver disease in animal models of obesity(56) and in humans, obesity and NAFLD, are negatively associated with the long-chain omega-3 fatty acid(58,59).
Early interest in PUFA supplements as possible therapy for NASH can be hypothesized considering the close association be-tween MtS, CV disease, fatty liver and reports of CV benefits of omega-3-rich foods(60,61). A meta-analysis presented by Parker et al. showed that dietary ω-3 PUFA supplements ameliorated the hepatic steatosis and liver injury in adult NAFLD patients(62). Yuan et al. demonstrated that supplementation of ω-3 PUFA reduced stea-tosis and hepatic inflammation in animal models with hepatic TG accumulation, inflammation and fibrogenesis induced by chronic high-fat diet(63). Our group have performed a controlled randomized trial evaluating the PUFA supplementation and demonstrated significant impact on lipid profile in NASH patients by increasing plasma ω-3 PUFA levels, decreasing levels of the potentially pro-inflammatory ω-6 arachidonic acid (AA), and decreasing serum TG levels. Nonetheless, no significant improvement in NAFLD Activity Score was verified(64).
Noticeable heterogeneity was observed in the trials including dose, formulation and time of PUFA supplementation for the treat-ment of NAFLD. None of the studies have shown improvement in key prognostic histological features such as fibrosis. One study using biopsy as the measure of fat content reported no change in steatosis after 12 months of synthetic EPA supplementation (up to 2.700 mg/day) compared to placebo treated subjects(65). In contrast, another trial has reported significant hepatic fat reduction after 15–18 months of 4.000 mg/day of a synthetic mixture of EPA and DHA supplementation compared to placebo(66). Similarly, Argo et al. have demonstrated that 12 months supplementation of 3.000 mg/day of a fish oil derived mixture of EPA and DHA versus soy-bean oil placebo, reduced liver fat in magnetic resonance imaging. However, the effect was significantly less evident in patients who lost a modest amount of weight during the study period(67). While there appears to be greater evidence that regular consumption of PUFA has metabolic benefit, the effect of additional oily fish or fish oil supplementation in NAFLD is uncertain and current opti-mal dose is still unknown. Even though some studies have shown consistent improvement in liver fat content, recent trials have not shown a significant benefit in liver histology or fibrosis.
Several therapeutic approaches are used in the treatment of NAFLD and NASH but it is confirmed that the most effective treatment is lifestyle change such as regular physical activity and weight reduction(68-70), however, very fast weight loss up to 1.6 kg per week may aggravate the inflammatory status of individuals with NAFLD(71). In this case, the most important is moderate weight loss and mainly prioritize the correct choice of dietary nutrients. Although low-calorie diets are effective approaches to improve NAFLD(23,72), it has been shown that the dietary pattern of Mediterranean countries has been the best strategy for NAFLD management(73,74). In the following chapters, we will describe some dietary patterns such as protein diet, vegetarian diet and Mediter-ranean diet, as well as some foods like coffee and dark chocolate as beneficial components in NAFLD.
PROTEIN DIET
There are few studies which demonstrate any relation between protein intake and NAFLD. Little is known about the effect of
FIGURE 1. Fructose mechanisms mediating development and progression of non-alcoholic fatty liver disease (NAFLD).HFD: high-fructose diet; FIAF: fasting induced adipose factor; LPL: lipoprotein lipase; FFA: free fatty acids; SCFAs: short-chain fatty acids; TG: triglycerides.
FIBERS
Fibers can be classified according to their solubility, being the soluble ones represented by pectin (fruits) and gums (oats, barley and legumes like beans, chickpeas, lentils) and insoluble fibers being represented by cellulose (wheat), hemicellulose (grains) and lignin (vegetables)(52).
A study evaluating dietary patterns in patients with NASH revealed that these patients consumed less carbohydrate, more fat and less fibers than healthy controls(10). A review of the therapeu-tic effects of dietary fibers, especially derived from whole grains, demonstrated the benefits of its consumption and the reduction of comorbidities associated with MtS and NAFLD. In addition to reduction of liver fat, fibers derived from whole grains could also reduce inflammation(53,54).
FISH OIL
A recent research has suggested that PUFA administration improves plasma lipid profile and may be useful in the treatment of NAFLD(55). The PUFA’s precursor is α-linoleic acid (ALA) and its metabolites are, eicosapentaenoic acid (EPA) and docosahexaenoic acid (DHA). These acids are detected in fish that synthesize PUFA from ingestion of marine plants. Some studies have shown that PUFA have a protective role in the development and progression of

Duarte SMB, Stefano JT, Vanni DS, Carrilho FJ, Oliveira CPMSImpact of current diet at the risk of non-alcoholic fatty liver disease (NAFLD)
434 • Arq Gastroenterol • 2019. v. 56 nº 4 out/dez
the quantity, quality and composition of dietary proteins on the development and treatment of NAFLD. Whereas protein deficiency malnutrition can cause steatosis, and excessive protein intake can lead to glomerular sclerosis, hypertension in intrarenal capillaries as well as malfunction of the kidneys in individuals vulnerable to kidney disease(18). Limited evidence suggests that a high protein diet could be effective to treat NAFLD because of increase in energy expenditure and hepatic lipid oxidation, as liver catabo-lism of ingested amino acids is an intense energy process(75). In obese sedentary women, short-term protein supplementation was advantageous for hepatic steatosis and lipid profile(76). Soy protein has also been successfully implicated in this same clinical scenario, however the functional properties of soybeans related to the amino acid profile, polyunsaturated fatty acids and isoflavonoids were the focus on study, not the protein intake(77). As a matter of fact, soy protein has been advocated as ideal for NAFLD patients based on animal studies. Clinical evaluations are insufficient in most protocols, however weight loss tends to be prominent(78).
There are recent evidences that a high protein, low calorie diet is associated with improvement of lipid profile, glucose homeostasis and liver enzymes(23) and findings are consistent with the well-established principle of calorie restriction in the management of MtS components and liver histology(79,80).
Studies comparing different diets for NASH treatment are still scarce. In the largest randomized trial up until now, 170 overweight adults were enrolled and followed for a period of six months. They were divided in three groups of diet: high in protein, low in fat and low in carbohydrate content. Results were equivalent among groups which demonstrated: reductions in intrahepatic fat, alanine aminotransferase (ALT), visceral adiposity and total weight as well as changes in whole body insulin sensitivity(22).
A recent study showed that whey protein supplementation (60 g/day) for 30 days, without energy restriction, decreased intrahepatic lipids. Despite stability of BMI, body fat mass had diminished. Ad-ditional metabolic advantages were identified in plasma lipids levels, however it was not seen in glucose homeostasis markers(76). Two short-term protocols with protein supplementation showed also improvement in hepatic fat content with a stable body weight(81,82).
Ideal dietary intake is intended to guarantee both moderate caloric restriction and adequate protein intake. According to Eu-ropean Association for the Study of the Liver (EASL) guidelines, although good quality data are lacking, particular attention must be paid to the protein intake needed to maintain muscle mass, because of the potential risk of exacerbating sarcopenia during weight loss interventions(83).
VEGETARIAN DIET
The benefits of a vegetarian healthy diet have been reported over the last few years, but there are still few randomized controlled trials(84,85). Recently, evidence has shown that the consumption of vegetables and fruits protects against metabolic diseases such as T2DM(86), CV disease(87) and NAFLD(88). These aliments are rich in fiber and antioxidant vitamins and their caloric density is low, which favors a higher daily energy consumption, fastly promoting satiety which is sustained for a longer time. All of these facilitates the management of weight loss(89,90).
A meta-analysis conducted by Yang Y et al. have demonstrated that the consumption of vegetables, but not fruit, was associated with lower risk of HCC(91). These different effects of vegetables and
fruit might be explained by differences in their nutrient composi-tions. Fruits contain more calories and antioxidants, such as vitamin A, C, E and carotenoids. Whether vegetables not only provide dietary fiber and vitamins A and E, but they are also sources of phytochemicals (folate, tocopherols, and carotenoids) which have shown anti-tumor activities in different diseases(92,93).
Patients with NAFLD are advised to adhere to several dietary recommendations such as avoiding simple carbohydrates, saturated fats, and sweetened drinks as well as consuming diets rich in fruits and vegetables(70,94,95). Studies have demonstrated that due to a high content of fiber, phytochemicals, and antioxidants in fruits and vegetables, the high intake of these food groups showed pro-tective effects on NAFLD. Phytochemicals and antioxidants are anti-inflammatory compounds and can prevent developing hepatic steatosis and maintaining blood glucose, insulin and free fatty acids within laboratory reference ranges(96,97). In a cross-sectional study, non-starchy vegetables consumption had been associated with lower liver fat deposition, and dark green or bright orange/yellow vegetables intake had been associated with lower visceral fat and improved insulin sensitivity(88). Other positive effects attributed to fruits and vegetables consumption are related to antioxidants such as the polyphenols which are present in these foods(98). Polyphenols display beneficial effects on metabolic homeostasis and exert anti-inflammatory and anti-fibrotic effects, inhibit de novo lipogenesis and stimulate β-oxidation in the NAFLD models(89).
Although fruits and vegetables have so many benefits, their con-sumption were lower in NAFLD patients compared with healthy subjects or recommended amounts in reviewed studies(11,99,100).
MEDITERRANEAN DIET
The traditional Mediterranean diet (MD) is the most fre-quently studied diet in NAFLD scenario. Its plays a beneficial role in metabolic profile(101) and has been shown to reduce the risk of CV disease(102) and T2DM(103), two highly relevant outcomes in NAFLD patients.
The main characteristics of the MD is a large intake of fruits, vegetables, whole grains, nuts, olive oil, fish and poultry and low consumption of dairy products, processed foods, saturated fats, red meats, foods high in sugar and moderate alcohol intake, usually red wine consumed with meals(104-106). Several clinical and experimental studies have shown that the MD and the higher PUFA intake reduce hepatic triglyceride content, increase insulin sensitivity, and improve NASH(61,67,107,108) and has been consistently beneficial with respect to CV risk(109,110). Estruch R et al., observed that consumption of extra virgin olive oil or nuts in the MD resulted in a substantial reduction in the risk of CV events among high-risk people (age 55+, smokers, hypertensive patients and type 2 diabetics)(102).
The MD is also characterized by reduced carbohydrate intake (40% of calories), especially reduced sugars (sucrose and fructose) and refined carbohydrates, which may be partly responsible for its beneficial effect on NAFLD(111). Reduction in fructose intake from artificially sweetened beverages improved MtS in obese individuals, regardless of dietary fruit consumption(112). The recommendation of fruit consumption in the MD to be given safely due to the vari-ous healthy nutrients present fruit such as fiber and antioxidants.
Although the MD recommends drinking wine in moderation, it is unclear whether NAFLD patients should adopt this recom-mendation. Patients with cirrhosis should avoid alcohol, as any regular alcohol consumption puts them at higher risk of developing

Duarte SMB, Stefano JT, Vanni DS, Carrilho FJ, Oliveira CPMSImpact of current diet at the risk of non-alcoholic fatty liver disease (NAFLD)
Arq Gastroenterol • 2019. v. 56 nº 4 out/dez • 435
HCC(113). However, it remains uncertain about moderate alcohol consumption (up to two doses per day) in patients without cir-rhosis. The specific protective effect for wine may be due to the phytosterols found in grapes(114).
Adherence to the MD pattern leads to a significant decrease in liver fat in overweight and NAFLD patients(115) with or without T2DM(116,117) and have been included as therapeutic recommen-dations in the recent European guideline for the treatment of NAFLD(118).
COFFEE AND DARK CHOCOLATE
The coffee is one of the most consumed beverages in the world and can have beneficial effects on the liver. Coffee consumption has been associated with reduced liver enzymes including ALT, aspar-tate aminotransferase (AST) and gamma glutamyltransferase(119,120). Coffee intake has also been associated with lower severity of liver disease and lower rates of liver disease progression(121). In addition, drinking coffee was inversely related to alcoholic and nonalcoholic liver cirrhosis in case-control studies(122,123) and alcoholic cirrhosis in prospective study(124). Epidemiological studies have suggested that coffee consumption is protective against chronic liver disease and reduces the risk of developing HCC(125-127). Experimental data have shown potential beneficial effects on the liver following consumption of various coffee components, including caffeine(128), coffee oils (kahweol and cafestol)(129) and aromatic extracts isolated from coffee beans(130).
Caffeine is not only associated with a decreased of various liver diseases, but its consumption may also decrease mortality(131). There is evidence that daily consumption of two to three cups of coffee has significant health benefits. Thus, coffee appears to have “hepatoprotective” health benefits(132). Coffee is made up of more than 100 compounds, any of which may be responsible for their beneficial effects, so it is possible that the described hepatic benefits come from a synergistic effect of multiple compounds and not a particular compound(133). It is important to mention that different types of coffee may show different effects on liver disease. Studies show that filtered coffee has a hepatoprotective role while unfiltered coffee showed a potentially deleterious effect(125,134). Perhaps this difference is due to the presence of kahweol and cafestol which are released from ground coffee beans but removed by paper filters(135). Anty et al. showed that espresso coffee had no beneficial effect on liver disease, particularly NAFLD, but the authors postulated that espresso coffee may not have been beneficial due to the addition of sucrose(133).
Although so many studies show that coffee consumption has beneficial effects, a recent study suggests that coffee intake was not associated with lower chances of hepatic steatosis in NASH or alcoholic disease(136). Due to divergences in scientific evidence on coffee consumption and prevention or treatment of NAFLD, further longitudinal and interventionist studies are needed for this evidence.
Like coffee, dark chocolate has antioxidant components, like to epicatequina, that can play a therapeutic role in NAFLD. Con-sumption of dark chocolate is associated with improved CV risk by reducing lipid peroxidation(137). Loffredo L et al. showed that 40 g of dark chocolate supplementation per day reduced Nicoti-namide adenine dinucleotide phosphate (NOX) oxidase in NASH patients(138). In addition, the same authors recently published that the cocoa polyphenols improve endothelial function via Nox2
down-regulation in NASH patients(139). NOX is considered the major cellular source of reactive oxygen species in humans(140) and its activation has been associated with liver damage(141).
The supplementation of dark chocolate associated with cocoa and almonds in overweight and obese individuals resulted in favora-ble effects on lipid and lipoprotein profiles such as LDL, however, dark chocolate and cocoa alone had no effect on vascular health markers and oxidative stress(142). A recent study showed a prebiotic effect of dark chocolate in overweight individuals. Supplementa-tion of 10 g dark chocolate per day increased the abundance of symbiotic bacteria such as lactobacillus(143). This modulation in the intestinal microbiota may be a potential therapeutic effect for NAFLD in the future.
RECOMMENDATIONS FOR TREATMENT OF NAFLD
Lifestyle modification, including diet, exercise, and weight loss has been recommended to treat NAFLD patients. Excessive energy intake, particularly in the form of complex carbohydrates, increased fructose consumption, saturated fats and industrialized products, combined with a sedentary lifestyle have contributed to dysregu-lated metabolism and consequently leading to obesity and NAFLD. According to American Association for the Study of Liver Diseases and EASL guidelines a combination of a hypocaloric diet (daily reduction by 500–1.000 kcal) and moderate-intensity exercise is likely to provide the best likelihood to lose 7%–10% total weight and sustaining weight loss over time(118,144).
The EASL guidelines recommended adherence to the Medi-terranean diet with low-to-moderate fat and moderate-to-high carbohydrate intake and Low-carbohydrate ketogenic diets or high-protein. Besides this, it is suggested avoid fructose-containing beverages and foods. Additionally, recommended to moderate alcohol intake, strictly keep alcohol below the risk threshold (30 g/day, men; 20 g/day, women)(118). Coffee shown the protective in NAFLD, as in liver disease of other etiologies, reducing histological severity and liver-related outcomes(126). There are no liver-related limitations for coffee drinking(118).
The protein intake is essential to improves CV risk factors and insulin sensitivity and decreases the risk of morbidity and mor-tality(74). The EASL Clinical Practice Guidelines on nutrition in chronic liver disease recommended the optimal daily protein intake should not be lower than 1.2–1.5 g/kg actual body weight/day(83).
Omega-3 fatty acids should not be used as a specific treatment of NAFLD or NASH, however, they might be considered to treat hypertriglyceridemia in NAFLD patients(144).
Nowadays, pharmacological treatment of NAFLD is still limited and it is mostly based on the treatment of comorbidities. The drug therapy is based on understanding the pathogenesis of the disease, focusing on IR, oxidative stress, inflammatory process and on the mechanism involved directly and indirectly in the pro-gression of fibrosis.
Antioxidant drugs have been investigated as promising treat-ments for NASH. Vitamin E administered at a daily dose of 800 IU/day have improved liver histology in nondiabetic adults with biopsy-proven NASH and therefore might be considered for this population(145). However, vitamin E is not recommended to treat NASH in diabetic patients, NAFLD without liver biopsy, NASH cirrhosis, or cryptogenic cirrhosis(144).
N-acetylcysteine (NAC), a glutathione precursor, leads to the reduction of oxidative stress. Some studies using NAC and
Duarte SMB, Stefano JT, Vanni DS, Carrilho FJ, Oliveira CPMSImpact of current diet at the risk of non-alcoholic fatty liver disease (NAFLD)
436 • Arq Gastroenterol • 2019. v. 56 nº 4 out/dez
metformin have shown benefit in hepatic histology(146,147). Interna-tional guidelines recommend thiazolidinediones (pioglitazone) and glucagon-like peptide-1 analogues (liraglutide) showing significant results in enzymes and hepatic histology(118,144).
For patients with severe obesity (BMI >35 kg/m2) and NASH, bariatric surgery is an option to be considered, as in most of these patients diet and physical activity are not effective and are not capable of achieving significant and sustained weight loss. The metabolic surgery improving obesity and diabetes, reduces liver fat and is likely to reduce NASH progression(148). Prospective data have shown an improvement in all histological lesions of NASH, including fibrosis(149).
More recently, it has been shown that unbalance of the intes-tinal microbiota (dysbiosis) and its bacterial metabolites may also contribute to the development of NAFLD. Evidence have shown that increased intestinal permeability leads to bacterial transloca-tion and the endotoxins produced by these bacteria increases LPL activity. This augmentation of LPL activity promotes de novo fatty acid synthesis, TG production(150) and activation of inflammatory Toll-like receptors in hepatocytes(151). Current studies have shown that the use of pre- and probiotics can modulate intestinal micro-biota in several diseases(152), including NAFLD(153,154). In addition,
probiotics improved intestinal microbiota composition associated with a reduction in liver inflammation, diminished LPS concen-trations, reduction of aminotransferases concentrations(155,156), improvement of inflammatory factors(157,158) and also improvement of metabolic parameters of NAFLD, such as, visceral fat, total cholesterol and IR(159).
It is important to note that, although there are several studies showing efficacy of pre- and probiotic supplementation in NAFLD patients, the guidelines do not recommend their supplementation as NAFLD/NASH treatment.
Authors’ contributionOliveira CPMS was responsible for study design. Duarte SMB,
Stefano JT, Vanni DS writing the manuscript. Stefano JT, Carrilho FJ and Oliveira CPMS helped on the revision of the manuscript.
OrcidSebastião Mauro Bezerra Duarte: 0000-0001-6988-7701.Jose Tadeu Stefano: 0000-0002-0218-1920.Denise Siqueira Vanni: 0000-0002-2624-5116.Flair José Carrilho: 0000-0002-7682-3105.Claudia P. Oliveira: 0000-0002-2848-417X.
REFERENCES
1. Atabek ME. Non-alcoholic fatty liver disease and metabolic syndrome in obese children. World J Gastroenterol. 2011;17:4445-6.
2. Harrison B, Thomson W, Symmons D, Ollier B, Wiles N, Payton T, et al. The influence of HLA-DRB1 alleles and rheumatoid factor on disease outcome in an inception cohort of patients with early inflammatory arthritis. Arthritis Rheum. 1999;42:2174-83.
3. Murphy EF, Cotter PD, Hogan A, O’Sullivan O, Joyce A, Fouhy F, et al. Divergent metabolic outcomes arising from targeted manipulation of the gut microbiota in diet-induced obesity. Gut. 2013;62:220-6.
4. Angelico F, Del Ben M, Conti R, Francioso S, Feole K, Fiorello S, et al. Insulin resistance, the metabolic syndrome, and nonalcoholic fatty liver disease. J Clin Endocrinol Metab. 2005;90:1578-82.
5. Sayiner M, Koenig A, Henry L, Younossi ZM. Epidemiology of Nonalcoholic Fatty Liver Disease and Nonalcoholic Steatohepatitis in the United States and the Rest of the World. Clin Liver Dis. 2016;20:205-14.
6. Zelber-Sagi S, Lotan R, Shlomai A, Webb M, Harrari G, Buch A, et al. Predic-tors for incidence and remission of NAFLD in the general population during a seven-year prospective follow-up. J Hepatol. 2012;56:1145-51.
7. Roncal-Jimenez CA, Lanaspa MA, Rivard CJ, Nakagawa T, Sanchez-Lozada LG, Jalal D, et al. Sucrose induces fatty liver and pancreatic inflammation in male breeder rats independent of excess energy intake. Metabolism. 2011;60:1259-70.
8. Solon-Biet SM, McMahon AC, Ballard JW, Ruohonen K, Wu LE, Cogger VC, et al. The ratio of macronutrients, not caloric intake, dictates cardiometabolic health, aging, and longevity in ad libitum-fed mice. Cell Metab. 2014;19:418-30.
9. Wehmeyer MH, Zyriax BC, Jagemann B, Roth E, Windler E, Schulze Zur Wiesch J, et al. Nonalcoholic fatty liver disease is associated with excessive calorie intake rather than a distinctive dietary pattern. Medicine (Baltimore). 2016;95:e3887.
Duarte SMB, Stefano JT, Vanni DS, Carrilho FJ, Oliveira CPMS. Impacto da dieta usual no risco de doença hepática gordurosa não alcoólica (DHGNA). Arq Gastroenterol. 2019;56(4):431-9.RESUMO – A doença hepática gordurosa não alcoólica (DHGNA) afeta aproximadamente de 20% a 30% da população geral sendo prevalente entre os
indivíduos obesos. Os fatores de risco associados à DHGNA são: doenças relacionadas à síndrome metabólica, fatores genéticos e meio ambiente. Nesta revisão, fornecemos uma compilação bibliográfica avaliando como as evidências relacionadas aos componentes da dieta, incluindo ingestão calórica, de gorduras, de proteínas, de fibras e de carboidratos, especialmente a frutose, poderiam ser um estímulo para o desenvolvimento e pro-gressão da DHGNA. Foi demonstrado que a dieta é um fator importante para o desenvolvimento da DHGNA e sua associação se estende além do consumo total de calorias.
DESCRITORES – Hepatopatia gordurosa não alcoólica. Ingestão de energia. Gorduras na dieta. Carboidratos da dieta. Frutose.
10. Cortez-Pinto H, Jesus L, Barros H, Lopes C, Moura MC, Camilo ME. How different is the dietary pattern in non-alcoholic steatohepatitis patients? Clin Nutr. 2006;25:816-23.
11. Musso G, Gambino R, De Michieli F, Cassader M, Rizzetto M, Durazzo M, et al. Dietary habits and their relations to insulin resistance and postprandial lipemia in nonalcoholic steatohepatitis. Hepatology. 2003;37:909-16.
12. Koch M, Borggrefe J, Barbaresko J, Groth G, Jacobs G, Siegert S, et al. Dietary patterns associated with magnetic resonance imaging-determined liver fat content in a general population study. Am J Clin Nutr. 2014;99:369-77.
13. Mollard RC, Sénéchal M, MacIntosh AC, Hay J, Wicklow BA, Wittmeier KD, et al. Dietary determinants of hepatic steatosis and visceral adiposity in overweight and obese youth at risk of type 2 diabetes. Am J Clin Nutr. 2014;99:804-12.
14. Sathiaraj E, Chutke M, Reddy MY, Pratap N, Rao PN, Reddy DN, et al. A case-control study on nutritional risk factors in non-alcoholic fatty liver disease in Indian population. Eur J Clin Nutr. 2011;65:533-7.
15. Marchesini G, Petta S, Dalle Grave R. Diet, weight loss, and liver health in non-alcoholic fatty liver disease: Pathophysiology, evidence, and practice. Hepatology. 2016;63:2032-43.
16. Toshimitsu K, Matsuura B, Ohkubo I, Niiya T, Furukawa S, Hiasa Y, et al. Dietary habits and nutrient intake in non-alcoholic steatohepatitis. Nutrition. 2007;23:46-52.
17. Westerbacka J, Lammi K, Häkkinen AM, Rissanen A, Salminen I, Aro A, et al. Dietary fat content modifies liver fat in overweight nondiabetic subjects. J Clin Endocrinol Metab. 2005;90:2804-9.
18. Zivkovic AM, German JB, Sanyal AJ. Comparative review of diets for the meta-bolic syndrome: implications for nonalcoholic fatty liver disease. Am J Clin Nutr. 2007;86:285-300.
Duarte SMB, Stefano JT, Vanni DS, Carrilho FJ, Oliveira CPMSImpact of current diet at the risk of non-alcoholic fatty liver disease (NAFLD)
Arq Gastroenterol • 2019. v. 56 nº 4 out/dez • 437
19. Antonucci L, Porcu C, Iannucci G, Balsano C, Barbaro B. Non-Alcoholic Fatty Liver Disease and Nutritional Implications: Special Focus on Copper. Nutrients. 2017;9(10).
20. Sacks FM, Bray GA, Carey VJ, Smith SR, Ryan DH, Anton SD, et al. Comparison of weight-loss diets with different compositions of fat, protein, and carbohydrates. N Engl J Med. 2009;360:859-73.
21. Tendler D, Lin S, Yancy WS, Mavropoulos J, Sylvestre P, Rockey DC, et al. The effect of a low-carbohydrate, ketogenic diet on nonalcoholic fatty liver disease: a pilot study. Dig Dis Sci. 2007;52:589-93.
22. Haufe S, Engeli S, Kast P, Böhnke J, Utz W, Haas V, et al. Randomized comparison of reduced fat and reduced carbohydrate hypocaloric diets on intrahepatic fat in overweight and obese human subjects. Hepatology. 2011;53:1504-14.
23. Bezerra Duarte SM, Faintuch J, Stefano JT, Sobral de Oliveira MB, de Campos Mazo DF, Rabelo F, et al. Hypocaloric high-protein diet improves clinical and biochemical markers in patients with nonalcoholic fatty liver disease (NAFLD). Nutr Hosp. 2014;29:94-101.
24. Brownell KD, Farley T, Willett WC, Popkin BM, Chaloupka FJ, Thompson JW, et al. The public health and economic benefits of taxing sugar-sweetened beverages. N Engl J Med. 2009;361:1599-605.
25. Malik VS, Popkin BM, Bray GA, Després JP, Hu FB. Sugar-sweetened beverages, obesity, type 2 diabetes mellitus, and cardiovascular disease risk. Circulation. 2010;121:1356-64.
26. Boulangé CL, Neves AL, Chilloux J, Nicholson JK, Dumas ME. Impact of the gut microbiota on inflammation, obesity, and metabolic disease. Genome Med. 2016;8:42.
27. Schugar RC, Crawford PA. Low-carbohydrate ketogenic diets, glucose homeo-stasis, and nonalcoholic fatty liver disease. Curr Opin Clin Nutr Metab Care. 2012;15:374-80.
28. Sekkarie A, Welsh JA, Vos MB. Carbohydrates and diet patterns in nonalcoholic fatty liver disease in children and adolescents. Curr Opin Clin Nutr Metab Care. 2018;21:283-8.
29. Scribner KB, Pawlak DB, Ludwig DS. Hepatic steatosis and increased adiposity in mice consuming rapidly vs. slowly absorbed carbohydrate. Obesity (Silver Spring). 2007;15:2190-9.
30. Fedirko V, Lukanova A, Bamia C, Trichopolou A, Trepo E, Nöthlings U, et al. Glycemic index, glycemic load, dietary carbohydrate, and dietary fiber intake and risk of liver and biliary tract cancers in Western Europeans. Ann Oncol. 2013;24:543-53.
31. Stanhope KL, Havel PJ. Fructose consumption: considerations for future research on its effects on adipose distribution, lipid metabolism, and insulin sensitivity in humans. J Nutr. 2009;139:1236S-41S.
32. White JS. Challenging the fructose hypothesis: new perspectives on fructose consumption and metabolism. Adv Nutr. 2013;4:246-56.
33. Mosca A, Nobili V, De Vito R, Crudele A, Scorletti E, Villani A, et al. Serum uric acid concentrations and fructose consumption are independently associated with NASH in children and adolescents. J Hepatol. 2017;66:1031-6.
34. Abdelmalek MF, Suzuki A, Guy C, Unalp-Arida A, Colvin R, Johnson RJ, et al. Increased fructose consumption is associated with fibrosis severity in patients with nonalcoholic fatty liver disease. Hepatology. 2010;51:1961-71.
35. Volynets V, Machann J, Küper MA, Maier IB, Spruss A, Königsrainer A, et al. A moderate weight reduction through dietary intervention decreases hepatic fat content in patients with non-alcoholic fatty liver disease (NAFLD): a pilot study. Eur J Nutr. 2013;52:527-35.
36. Ouyang X, Cirillo P, Sautin Y, McCall S, Bruchette JL, Diehl AM, et al. Fructose consumption as a risk factor for non-alcoholic fatty liver disease. J Hepatol. 2008;48:993-9.
37. Zelber-Sagi S, Nitzan-Kaluski D, Goldsmith R, Webb M, Blendis L, Halpern Z, et al. Long term nutritional intake and the risk for non-alcoholic fatty liver disease (NAFLD): a population based study. J Hepatol. 2007;47:711-7.
38. Sullivan JS, Le MT, Pan Z, Rivard C, Love-Osborne K, Robbins K, et al. Oral fructose absorption in obese children with non-alcoholic fatty liver disease. Pediatr Obes. 2015;10:188-95.
39. Volynets V, Louis S, Pretz D, Lang L, Ostaff MJ, Wehkamp J, et al. Intestinal Barrier Function and the Gut Microbiome Are Differentially Affected in Mice Fed a Western-Style Diet or Drinking Water Supplemented with Fructose. J Nutr. 2017;147:770-80.
40. Machado MV, Cortez-Pinto H. Diet, Microbiota, Obesity, and NAFLD: A Dangerous Quartet. Int J Mol Sci. 2016;17:481.
41. Shimony MK, Schliep KC, Schisterman EF, Ahrens KA, Sjaarda LA, Rotman Y, et al. The relationship between sugar-sweetened beverages and liver enzymes among healthy premenopausal women: a prospective cohort study. Eur J Nutr. 2016;55:569-76.
42. Paolella G, Mandato C, Pierri L, Poeta M, Di Stasi M, Vajro P. Gut-liver axis and probiotics: their role in non-alcoholic fatty liver disease. World J Gastroenterol. 2014;20:15518-31.
43. Duarte SMB, Stefano JT, Miele L, Ponziani FR, Souza-Basqueira M, Okada LSRR, et al. Gut microbiome composition in lean patients with NASH is asso-ciated with liver damage independent of caloric intake: A prospective pilot study. Nutr Metab Cardiovasc Dis. 2018;28:369-84.
44. Zhu L, Baker RD, Zhu R, Baker SS. Gut microbiota produce alcohol and con-tribute to NAFLD. Gut. 2016;65:1232.
45. Mandard S, Zandbergen F, Tan NS, Escher P, Patsouris D, Koenig W, et al. The direct peroxisome proliferator-activated receptor target fasting-induced adipose factor (FIAF/PGAR/ANGPTL4) is present in blood plasma as a truncated pro-tein that is increased by fenofibrate treatment. J Biol Chem. 2004;279:34411-20.
46. Ley RE. Obesity and the human microbiome. Curr Opin Gastroenterol. 2010;26:5-11.
47. Musso G, Gambino R, Cassader M. Interactions between gut microbiota and host metabolism predisposing to obesity and diabetes. Annu Rev Med. 2011;62:361-80.
48. Mehal WZ. The gut-liver axis: a busy two-way street. Hepatology. 2012;55:1647-9.49. Pataky Z, Genton L, Spahr L, Lazarevic V, Terraz S, Gaïa N, et al. Impact of
Hypocaloric Hyperproteic Diet on Gut Microbiota in Overweight or Obese Patients with Nonalcoholic Fatty Liver Disease: A Pilot Study. Dig Dis Sci. 2016;61:2721-31.
50. Hu QH, Zhang X, Pan Y, Li YC, Kong LD. Allopurinol, quercetin and rutin ameliorate renal NLRP3 inflammasome activation and lipid accumulation in fructose-fed rats. Biochem Pharmacol. 2012;84:113-25.
51. Gutiérrez-Salmeán G, Meaney E, Lanaspa MA, Cicerchi C, Johnson RJ, Dugar S, et al. A randomized, placebo-controlled, double-blind study on the effects of (-)-epicatechin on the triglyceride/HDLc ratio and cardiometabolic profile of subjects with hypertriglyceridemia: Unique in vitro effects. Int J Cardiol. 2016;223:500-6.
52. Alfonzo González GC. [Effect of thermal treatment on total dietetic fiber, soluble and insoluble contents in legumes]. Arch Latinoam Nutr. 2000;50:281-5.
53. Galisteo M, Duarte J, Zarzuelo A. Effects of dietary fibers on disturbances clustered in the metabolic syndrome. J Nutr Biochem. 2008;19:71-84.
54. Federico A, Zulli C, de Sio I, Del Prete A, Dallio M, Masarone M, et al. Focus on emerging drugs for the treatment of patients with non-alcoholic fatty liver disease. World J Gastroenterol. 2014;20:16841-57.
55. Endo J, Arita M. Cardioprotective mechanism of omega-3 polyunsaturated fatty acids. J Cardiol. 2016;67:22-7.
56. Shapiro H, Tehilla M, Attal-Singer J, Bruck R, Luzzatti R, Singer P. The ther-apeutic potential of long-chain omega-3 fatty acids in nonalcoholic fatty liver disease. Clin Nutr. 2011;30:6-19.
57. Masterton GS, Plevris JN, Hayes PC. Review article: omega-3 fatty acids - a promising novel therapy for non-alcoholic fatty liver disease. Aliment Pharmacol Ther. 2010;31:679-92.
58. Araya J, Rodrigo R, Videla LA, Thielemann L, Orellana M, Pettinelli P, et al. Increase in long-chain polyunsaturated fatty acid n - 6/n - 3 ratio in relation to hepatic steatosis in patients with non-alcoholic fatty liver disease. Clin Sci (Lond). 2004;106:635-43.
59. Araya J, Rodrigo R, Pettinelli P, Araya AV, Poniachik J, Videla LA. Decreased liver fatty acid delta-6 and delta-5 desaturase activity in obese patients. Obesity (Silver Spring). 2010;18:1460-3.
60. Lonardo A, Bellentani S, Argo CK, Ballestri S, Byrne CD, Caldwell SH, et al. Epidemiological modifiers of non-alcoholic fatty liver disease: Focus on high-risk groups. Dig Liver Dis. 2015;47:997-1006.
61. Yu L, Yuan M, Wang L. The effect of omega-3 unsaturated fatty acids on non-al-coholic fatty liver disease: A systematic review and meta-analysis of RCTs. Pak J Med Sci. 2017;33:1022-8.
62. Parker HM, Johnson NA, Burdon CA, Cohn JS, O’Connor HT, George J. Ome-ga-3 supplementation and non-alcoholic fatty liver disease: a systematic review and meta-analysis. J Hepatol. 2012;56:944-51.
63. Yuan F, Wang H, Tian Y, Li Q, He L, Li N, et al. Fish oil alleviated high-fat diet-induced non-alcoholic fatty liver disease via regulating hepatic lipids metabo-lism and metaflammation: a transcriptomic study. Lipids Health Dis. 2016;15:20.
64. Nogueira MA, Oliveira CP, Ferreira Alves VA, Stefano JT, Rodrigues LS, Tor-rinhas RS, et al. Omega-3 polyunsaturated fatty acids in treating non-alcoholic steatohepatitis: A randomized, double-blind, placebo-controlled trial. Clin Nutr. 2016;35:578-86.
65. Sanyal AJ, Abdelmalek MF, Suzuki A, Cummings OW, Chojkier M, Group E-AS. No significant effects of ethyl-eicosapentanoic acid on histologic features of non-alcoholic steatohepatitis in a phase 2 trial. Gastroenterology. 2014;147:377-84.e1.
66. Scorletti E, Bhatia L, McCormick KG, Clough GF, Nash K, Hodson L, et al. Effects of purified eicosapentaenoic and docosahexaenoic acids in nonalcoholic fatty liver disease: results from the Welcome* study. Hepatology. 2014;60:1211-21.
67. Argo CK, Patrie JT, Lackner C, Henry TD, de Lange EE, Weltman AL, et al. Effects of n-3 fish oil on metabolic and histological parameters in NASH: a double-blind, randomized, placebo-controlled trial. J Hepatol. 2015;62:190-7.

Duarte SMB, Stefano JT, Vanni DS, Carrilho FJ, Oliveira CPMSImpact of current diet at the risk of non-alcoholic fatty liver disease (NAFLD)
438 • Arq Gastroenterol • 2019. v. 56 nº 4 out/dez
68. Duarte SM, Rezende RE, Stefano JT, Perandini LA, Dassouki T, Sa-Pinto AL, et al. Impaired aerobic capacity and cardiac autonomic control in sedentary postmenopausal women with nonalcoholic fatty liver disease (NAFLD). Journal of Hepatology. 2015;62:S733.
69. Finelli C, Tarantino G. Is there any consensus as to what diet or lifestyle approach is the right one for NAFLD patients? J Gastrointestin Liver Dis. 2012;21:293-302.
70. Nseir W, Hellou E, Assy N. Role of diet and lifestyle changes in nonalcoholic fatty liver disease. World J Gastroenterol. 2014;20:9338-44.
71. Andersen T, Gluud C, Franzmann MB, Christoffersen P. Hepatic effects of dietary weight loss in morbidly obese subjects. J Hepatol. 1991;12:224-9.
72. Yki-Järvinen H. Nutritional Modulation of Non-Alcoholic Fatty Liver Disease and Insulin Resistance. Nutrients. 2015;7:9127-38.
73. Suárez M, Boqué N, Del Bas JM, Mayneris-Perxachs J, Arola L, Caimari A. Mediterranean Diet and Multi-Ingredient-Based Interventions for the Manage-ment of Non-Alcoholic Fatty Liver Disease. Nutrients. 2017;9(10).
74. Eslamparast T, Tandon P, Raman M. Dietary Composition Independent of Weight Loss in the Management of Non-Alcoholic Fatty Liver Disease. Nutrients. 2017;9(8).
75. de Wit NJ, Afman LA, Mensink M, Müller M. Phenotyping the effect of diet on non-alcoholic fatty liver disease. J Hepatol. 2012;57:1370-3.
76. Bortolotti M, Maiolo E, Corazza M, Van Dijke E, Schneiter P, Boss A, et al. Effects of a whey protein supplementation on intrahepatocellular lipids in obese female patients. Clin Nutr. 2011;30:494-8.
77. Oliveira LP, de Jesús RP, Freire TO, Oliveira CP, Castro Lyra A, Lyra LG. Possible molecular mechanisms soy-mediated in preventing and treating nonalcoholic fatty liver disease. Nutr Hosp. 2012;27:991-8.
78. González Cañete N, Durán Agüero S. [Soya isoflavones and evidences on car-diovascular protection]. Nutr Hosp. 2014;29:1271-82.
79. Catalano D, Trovato GM, Martines GF, Randazzo M, Tonzuso A. Bright liver, body composition and insulin resistance changes with nutritional intervention: a follow-up study. Liver Int. 2008;28:1280-7.
80. Schwarz J, Tomé D, Baars A, Hooiveld GJ, Müller M. Dietary protein affects gene expression and prevents lipid accumulation in the liver in mice. PLoS One. 2012;7:e47303.
81. Bortolotti M, Kreis R, Debard C, Cariou B, Faeh D, Chetiveaux M, et al. High protein intake reduces intrahepatocellular lipid deposition in humans. Am J Clin Nutr. 2009;90:1002-10.
82. Theytaz F, Noguchi Y, Egli L, Campos V, Buehler T, Hodson L, et al. Effects of supplementation with essential amino acids on intrahepatic lipid concentrations during fructose overfeeding in humans. Am J Clin Nutr. 2012;96:1008-16.
83. [email protected] EAftSotLEa, Liver EAftSot. EASL Clinical Practice Guidelines on nutrition in chronic liver disease. J Hepatol. 2018.
84. Fraser GE. Associations between diet and cancer, ischemic heart disease, and all-cause mortality in non-Hispanic white California Seventh-day Adventists. Am J Clin Nutr. 1999;70(3 Suppl):532S-8S.
85. Fraser GE. Vegetarian diets: what do we know of their effects on common chronic diseases? Am J Clin Nutr. 2009;89:1607S-12S.
86. Wang PY, Fang JC, Gao ZH, Zhang C, Xie SY. Higher intake of fruits, vegetables or their fiber reduces the risk of type 2 diabetes: A meta-analysis. J Diabetes Investig. 2016;7:56-69.
87. Larsson SC, Wolk A. Dietary fiber intake is inversely associated with stroke incidence in healthy Swedish adults. J Nutr. 2014;144:1952-5.
88. Cook LT, O’Reilly GA, Goran MI, Weigensberg MJ, Spruijt-Metz D, Davis JN. Vegetable consumption is linked to decreased visceral and liver fat and improved insulin resistance in overweight Latino youth. J Acad Nutr Diet. 2014;114:1776-83.
89. Salomone F, Godos J, Zelber-Sagi S. Natural antioxidants for non-alcoholic fatty liver disease: molecular targets and clinical perspectives. Liver Int. 2016;36:5-20.
90. Saquib N, Natarajan L, Rock CL, Flatt SW, Madlensky L, Kealey S, et al. The impact of a long-term reduction in dietary energy density on body weight within a randomized diet trial. Nutr Cancer. 2008;60:31-8.
91. Yang Y, Zhang D, Feng N, Chen G, Liu J, Zhu Y. Increased intake of vegetables, but not fruit, reduces risk for hepatocellular carcinoma: a meta-analysis. Gastro-enterology. 2014;147:1031-42.
92. Wu QJ, Yang Y, Vogtmann E, Wang J, Han LH, Li HL, et al. Cruciferous vege-tables intake and the risk of colorectal cancer: a meta-analysis of observational studies. Ann Oncol. 2013;24:1079-87.
93. Wu QJ, Xie L, Zheng W, Vogtmann E, Li HL, Yang G, et al. Cruciferous vege-tables consumption and the risk of female lung cancer: a prospective study and a meta-analysis. Ann Oncol. 2013;24:1918-24.
94. Sofi F, Casini A. Mediterranean diet and non-alcoholic fatty liver disease: new therapeutic option around the corner? World J Gastroenterol. 2014;20:7339-46.
95. Zelber-Sagi S, Salomone F, Mlynarsky L. The Mediterranean dietary pattern as the diet of choice for non-alcoholic fatty liver disease: Evidence and plausible mechanisms. Liver Int. 2017;37:936-49.
96. Anderson JW, Randles KM, Kendall CW, Jenkins DJ. Carbohydrate and fiber recommendations for individuals with diabetes: a quantitative assessment and meta-analysis of the evidence. J Am Coll Nutr. 2004;23:5-17.
97. Estruch R. Anti-inflammatory effects of the Mediterranean diet: the experience of the PREDIMED study. Proc Nutr Soc. 2010;69:333-40.
98. Scalbert A, Williamson G. Dietary intake and bioavailability of polyphenols. J Nutr. 2000;130(8S Suppl):2073S-85S.
99. Han JM, Jo AN, Lee SM, Bae HS, Jun DW, Cho YK, et al. Associations between intakes of individual nutrients or whole food groups and non-alcoholic fatty liver disease among Korean adults. J Gastroenterol Hepatol. 2014;29:1265-72.
100. Shi L, Liu ZW, Li Y, Gong C, Zhang H, Song LJ, et al. The prevalence of nonalcoholic fatty liver disease and its association with lifestyle/dietary habits among university faculty and staff in Chengdu. Biomed Environ Sci. 2012;25: 383-91.
101. Grosso G, Mistretta A, Frigiola A, Gruttadauria S, Biondi A, Basile F, et al. Mediterranean diet and cardiovascular risk factors: a systematic review. Crit Rev Food Sci Nutr. 2014;54:593-610.
102. Estruch R, Ros E, Salas-Salvadó J, Covas MI, Corella D, Arós F, et al. Primary prevention of cardiovascular disease with a Mediterranean diet. N Engl J Med. 2013;368:1279-90.
103. Salas-Salvadó J, Bulló M, Estruch R, Ros E, Covas MI, Ibarrola-Jurado N, et al. Prevention of diabetes with Mediterranean diets: a subgroup analysis of a randomized trial. Ann Intern Med. 2014;160:1-10.
104. Uribarri J, del Castillo MD, de la Maza MP, Filip R, Gugliucci A, Luevano-Con-treras C, et al. Dietary advanced glycation end products and their role in health and disease. Adv Nutr. 2015;6:461-73.
105. Koschinsky T, He CJ, Mitsuhashi T, Bucala R, Liu C, Buenting C, et al. Orally absorbed reactive glycation products (glycotoxins): an environmental risk factor in diabetic nephropathy. Proc Natl Acad Sci U S A. 1997;94:6474-9.
106. Kellow NJ, Savige GS. Dietary advanced glycation end-product restriction for the attenuation of insulin resistance, oxidative stress and endothelial dysfunction: a systematic review. Eur J Clin Nutr. 2013;67:239-48.
107. Sekiya M, Yahagi N, Matsuzaka T, Najima Y, Nakakuki M, Nagai R, et al. Polyunsaturated fatty acids ameliorate hepatic steatosis in obese mice by SREBP-1 suppression. Hepatology. 2003;38:1529-39.
108. Levy JR, Clore JN, Stevens W. Dietary n-3 polyunsaturated fatty acids decrease hepatic triglycerides in Fischer 344 rats. Hepatology. 2004;39:608-16.
109. Sofi F, Abbate R, Gensini GF, Casini A. Accruing evidence on benefits of ad-herence to the Mediterranean diet on health: an updated systematic review and meta-analysis. Am J Clin Nutr. 2010;92:1189-96.
110. de Lorgeril M, Salen P, Martin JL, Monjaud I, Delaye J, Mamelle N. Mediterra-nean diet, traditional risk factors, and the rate of cardiovascular complications after myocardial infarction: final report of the Lyon Diet Heart Study. Circulation. 1999;99:779-85.
111. Romero-Gómez M, Zelber-Sagi S, Trenell M. Treatment of NAFLD with diet, physical activity and exercise. J Hepatol. 2017;67:829-46.
112. Madero M, Arriaga JC, Jalal D, Rivard C, McFann K, Pérez-Méndez O, et al. The effect of two energy-restricted diets, a low-fructose diet versus a moderate natural fructose diet, on weight loss and metabolic syndrome parameters: a randomized controlled trial. Metabolism. 2011;60:1551-9.
113. Ascha MS, Hanouneh IA, Lopez R, Tamimi TA, Feldstein AF, Zein NN. The incidence and risk factors of hepatocellular carcinoma in patients with nonal-coholic steatohepatitis. Hepatology. 2010;51:1972-8.
114. Dunn W, Xu R, Schwimmer JB. Modest wine drinking and decreased prevalence of suspected nonalcoholic fatty liver disease. Hepatology. 2008;47:1947-54.
115. Trovato FM, Catalano D, Martines GF, Pace P, Trovato GM. Mediterranean diet and non-alcoholic fatty liver disease: the need of extended and comprehensive interventions. Clin Nutr. 2015;34:86-8.
116. Bozzetto L, Prinster A, Annuzzi G, Costagliola L, Mangione A, Vitelli A, et al. Liver fat is reduced by an isoenergetic MUFA diet in a controlled randomized study in type 2 diabetic patients. Diabetes Care. 2012;35:1429-35.
117. Ryan MC, Itsiopoulos C, Thodis T, Ward G, Trost N, Hofferberth S, et al. The Mediterranean diet improves hepatic steatosis and insulin sensitivity in individuals with non-alcoholic fatty liver disease. J Hepatol. 2013;59:138-43.
118. European Association for the Study of the Liver; European Association for the Study of Diabetes; European Association for the Study of Obesity. EA-SL-EASD-EASO Clinical Practice Guidelines for the management of non-al-coholic fatty liver disease. J Hepatol. 2016;64:1388-402.
119. Hiramatsu T, Tajima O, Uezono K, Tabata S, Abe H, Ohnaka K, et al. Coffee consumption, serum γ-glutamyltransferase, and glucose tolerance status in middle-aged Japanese men. Clin Chem Lab Med. 2013;51:1233-9.
120. Ruhl CE, Everhart JE. Coffee and caffeine consumption reduce the risk of elevated serum alanine aminotransferase activity in the United States. Gastroenterology. 2005;128:24-32.
Duarte SMB, Stefano JT, Vanni DS, Carrilho FJ, Oliveira CPMSImpact of current diet at the risk of non-alcoholic fatty liver disease (NAFLD)
Arq Gastroenterol • 2019. v. 56 nº 4 out/dez • 439
121. Molloy JW, Calcagno CJ, Williams CD, Jones FJ, Torres DM, Harrison SA. As-sociation of coffee and caffeine consumption with fatty liver disease, nonalcoholic steatohepatitis, and degree of hepatic fibrosis. Hepatology. 2012;55:429-36.
122. Corrao G, Zambon A, Bagnardi V, D’Amicis A, Klatsky A, Group CS. Coffee, caffeine, and the risk of liver cirrhosis. Ann Epidemiol. 2001;11:458-65.
123. Gallus S, Tavani A, Negri E, La Vecchia C. Does coffee protect against liver cirrhosis? Ann Epidemiol. 2002;12:202-5.
124. Tverdal A, Skurtveit S. Coffee intake and mortality from liver cirrhosis. Ann Epidemiol. 2003;13:419-23.
125. Setiawan VW, Wilkens LR, Lu SC, Hernandez BY, Le Marchand L, Henderson BE. Association of coffee intake with reduced incidence of liver cancer and death from chronic liver disease in the US multiethnic cohort. Gastroenterology. 2015;148:118-25; quiz e15.
126. Saab S, Mallam D, Cox GA, Tong MJ. Impact of coffee on liver diseases: a systematic review. Liver Int. 2014;34:495-504.
127. Bravi F, Bosetti C, Tavani A, Gallus S, La Vecchia C. Coffee reduces risk for hepatocellular carcinoma: an updated meta-analysis. Clin Gastroenterol Hepatol. 2013;11:1413-21.e1.
128. He P, Noda Y, Sugiyama K. Suppression of lipopolysaccharide-induced liver injury by various types of tea and coffee in D-galactosamine-sensitized rats. Biosci Biotechnol Biochem. 2001;65:670-3.
129. Huber WW, Scharf G, Rossmanith W, Prustomersky S, Grasl-Kraupp B, Peter B, et al. The coffee components kahweol and cafestol induce gamma-glutam-ylcysteine synthetase, the rate limiting enzyme of chemoprotective glutathione synthesis, in several organs of the rat. Arch Toxicol. 2002;75:685-94.
130. Lee KG, Mitchell A, Shibamoto T. Antioxidative activities of aroma extracts isolated from natural plants. Biofactors. 2000;13:173-8.
131. Freedman ND, Park Y, Abnet CC, Hollenbeck AR, Sinha R. Association of coffee drinking with total and cause-specific mortality. N Engl J Med. 2012;366: 1891-904.
132. Torres DM, Harrison SA. Is it time to write a prescription for coffee? Coffee and liver disease. Gastroenterology. 2013;144:670-2.
133. Anty R, Marjoux S, Iannelli A, Patouraux S, Schneck AS, Bonnafous S, et al. Regular coffee but not espresso drinking is protective against fibrosis in a cohort mainly composed of morbidly obese European women with NAFLD undergoing bariatric surgery. J Hepatol. 2012;57:1090-6.
134. Urgert R, Meyboom S, Kuilman M, Rexwinkel H, Vissers MN, Klerk M, et al. Comparison of effect of cafetière and filtered coffee on serum concentrations of liver aminotransferases and lipids: six month randomised controlled trial. BMJ. 1996;313:1362-6.
135. Lee KJ, Choi JH, Jeong HG. Hepatoprotective and antioxidant effects of the coffee diterpenes kahweol and cafestol on carbon tetrachloride-induced liver damage in mice. Food Chem Toxicol. 2007;45:2118-25.
136. Veronese N, Notarnicola M, Cisternino AM, Reddavide R, Inguaggiato R, Guerra V, et al. Coffee Intake and Liver Steatosis: A Population Study in a Mediterranean Area. Nutrients. 2018;10(1).
137. Kerimi A, Williamson G. The cardiovascular benefits of dark chocolate. Vascul Pharmacol. 2015;71:11-5.
138. Loffredo L, Del Ben M, Perri L, Carnevale R, Nocella C, Catasca E, et al. Effects of dark chocolate on NOX-2-generated oxidative stress in patients with non-alcoholic steatohepatitis. Aliment Pharmacol Ther. 2016;44:279-86.
139. Loffredo L, Baratta F, Ludovica P, Battaglia S, Carnevale R, Nocella C, et al. Effects of dark chocolate on endothelial function in patients with non-alcoholic steatohepatitis. Nutr Metab Cardiovasc Dis. 2017;28:143-9.
140. Violi F, Basili S, Nigro C, Pignatelli P. Role of NADPH oxidase in atherosclerosis. Future Cardiol. 2009;5:83-92.
141. De Minicis S, Bataller R, Brenner DA. NADPH oxidase in the liver: defensive, offensive, or fibrogenic? Gastroenterology. 2006;131:272-5.
142. Lee Y, Berryman CE, West SG, Chen CO, Blumberg JB, Lapsley KG, et al. Effects of Dark Chocolate and Almonds on Cardiovascular Risk Factors in Overweight and Obese Individuals: A Randomized Controlled-Feeding Trial. J Am Heart Assoc. 2017;6(12).
143. Wiese M, Bashmakov Y, Chalyk N, Nielsen DS, Krych Ł, Kot W, et al. Prebiotic Effect of Lycopene and Dark Chocolate on Gut Microbiome with Systemic Changes in Liver Metabolism, Skeletal Muscles and Skin in Moderately Obese Persons. Biomed Res Int. 2019;2019:4625279.
144. Chalasani N, Younossi Z, Lavine JE, Charlton M, Cusi K, Rinella M, et al. The diagnosis and management of nonalcoholic fatty liver disease: Practice guidance from the American Association for the Study of Liver Diseases. Hepatology. 2018;67:328-57.
145. Sanyal AJ, Chalasani N, Kowdley KV, McCullough A, Diehl AM, Bass NM, et al. Pioglitazone, vitamin E, or placebo for nonalcoholic steatohepatitis. N Engl J Med. 2010;362:1675-85.
146. de Oliveira CP, Stefano JT, de Siqueira ER, Silva LS, de Campos Mazo DF, Lima VM, et al. Combination of N-acetylcysteine and metformin improves histological steatosis and fibrosis in patients with non-alcoholic steatohepatitis. Hepatol Res. 2008;38:159-65.
147. Thong-Ngam D, Samuhasaneeto S, Kulaputana O, Klaikeaw N. N-acetylcysteine attenuates oxidative stress and liver pathology in rats with non-alcoholic steato-hepatitis. World J Gastroenterol. 2007;13:5127-32.
148. Caiazzo R, Lassailly G, Leteurtre E, Baud G, Verkindt H, Raverdy V, et al. Roux-en-Y gastric bypass versus adjustable gastric banding to reduce nonalcoholic fatty liver disease: a 5-year controlled longitudinal study. Ann Surg. 2014;260:893-8; discussion 8-9.
149. Lassailly G, Caiazzo R, Buob D, Pigeyre M, Verkindt H, Labreuche J, et al. Bariatric Surgery Reduces Features of Nonalcoholic Steatohepatitis in Morbidly Obese Patients. Gastroenterology. 2015;149:379-88; quiz e15-6.
150. Bäckhed F, Ding H, Wang T, Hooper LV, Koh GY, Nagy A, et al. The gut mi-crobiota as an environmental factor that regulates fat storage. Proc Natl Acad Sci U S A. 2004;101:15718-23.
151. Soares JB, Pimentel-Nunes P, Roncon-Albuquerque R, Leite-Moreira A. The role of lipopolysaccharide/toll-like receptor 4 signaling in chronic liver diseases. Hepatol Int. 2010;4:659-72.
152. Sanders ME, Merenstein DJ, Reid G, Gibson GR, Rastall RA. Probiotics and prebiotics in intestinal health and disease: from biology to the clinic. Nat Rev Gastroenterol Hepatol. 2019.
153. Mofidi F, Poustchi H, Yari Z, Nourinayyer B, Merat S, Sharafkhah M, et al. Synbiotic supplementation in lean patients with non-alcoholic fatty liver disease: a pilot, randomised, double-blind, placebo-controlled, clinical trial. Br J Nutr. 2017;117:662-8.
154. Cho MS, Kim SY, Suk KT, Kim BY. Modulation of gut microbiome in nonalcoholic fatty liver disease: pro-, pre-, syn-, and antibiotics. J Microbiol. 2018;56:855-67.
155. Mokhtari Z, Gibson DL, Hekmatdoost A. Nonalcoholic Fatty Liver Disease, the Gut Microbiome, and Diet. Adv Nutr. 2017;8:240-52.
156. Wong VW, Won GL, Chim AM, Chu WC, Yeung DK, Li KC, et al. Treatment of nonalcoholic steatohepatitis with probiotics. A proof-of-concept study. Ann Hepatol. 2013;12:256-62
157. Ma X, Hua J, Li Z. Probiotics improve high fat diet-induced hepatic steatosis and insulin resistance by increasing hepatic NKT cells. J Hepatol. 2008;49:821-30.
158. Donato KA, Gareau MG, Wang YJ, Sherman PM. Lactobacillus rhamnosus GG attenuates interferon-{gamma} and tumour necrosis factor-alpha-induced barrier dysfunction and pro-inflammatory signalling. Microbiology. 2010;156(Pt 11):3288-97.
159. Shin HS, Park SY, Lee dK, Kim SA, An HM, Kim JR, et al. Hypocholesterolemic effect of sonication-killed Bifidobacterium longum isolated from healthy adult Koreans in high cholesterol fed rats. Arch Pharm Res. 2010;33:1425-31.

REVIEW
440 • Arq Gastroenterol • 2019. v. 56 nº 4 out/dez
INTRODUCTION
Although liver transplantation is considered to be a high-risk procedure, it is well-established as a treatment option for the cure and quality of life enhancement for individuals who suffer from diseases, e.g., end-stage liver disease, acute liver failure, and hepa-tocellular carcinoma; most of them are linked to the hepatitis B virus (HBV). On the other hand, transplantations may bring about a risk of disease transmission by the HBV in the periods before, during, or after the procedure(1,2).
Preventing an infection by HBV through immunization sched-ules has been the most effective way to reduce complications, since it decreases the number of people who suffer from chronic hepatitis caused by the HBV and eradicates its transmission. It is considered to be the first vaccine with an impact against cancer taking into account that HBV prevention reduces the risk of cancer linked to that virus; besides, it is the first vaccine against a sexually transmit-ted infection (STD)(3-6).
The HBV vaccine is highly effective in healthy individuals, whereas it is little immunogenic in immunocompromised individu-
New immunization schedule effectiveness against hepatitis B in liver transplantation patients
Isabela Cristina RODRIGUES1, , Rita de Cássia Martins Alves da SILVA2 Helen Catharine Camarero de FELÍCIO2 and Renato Ferreira da SILVA2
Received 13/7/2019Accepted 27/9/2019
ABSTRACT – Background – Although liver transplantation is considered to be a high-risk procedure, it is well-established as a treatment option for the cure and quality of life enhancement for individuals who suffer from diseases. Preventing an infection by hepatitis B virus through immunization schedules has been the most effective way to reduce complications, since it decreases the number of people who suffer from chronic hepatitis caused by the hepatitis B virus and eradicates its transmission Objective – 1. Analyzing evidence in the literature on various schedules employed for immunization against hepatitis B in patients who have received a liver transplantation. 2. Suggesting potential immunization schedules against hepatitis B in patients who suffer from liver cirrhosis, without previous verifying documentation, using the Child-Turcotte Pugh score, according to evidences found in the literature. Methods – Systematic review of the literature, conducted on the data bases MedLine, PubMed, and Lilacs, between September, 2017 and January, 2018, by using the following keywords: “Liver Transplantation, “Immunization Schedule”, “Hepatitis B Vaccines”. In order to analyze the articles, a summary figure was especially designed and both the results and discussion were presented in a descriptive way. Results – We included 24 studies; among them, eight had accelerated immunization schedules, 13 followed the conventional schedules, and three had super accelerated schedules. Regarding immunization, 21 studies were conducted with patients in the pre-transplant period, one with a transplanted patient, one with a pre-trans-plant group, and one with a post-transplant group. Found articles suggest that, disregarding the chosen immunization schedule, seroconversion rates tended to be lower as the liver disease advanced, compared to the healthy population. Conclusion – The studies did not find seroconversion superiority between the different immunization schedules (conventional and unconventional). However, since candidates to liver transplantation are usually very vulnerable, results show that super accelerated immunization schedules are possibly recommended for such group of patients; serologic test results will be higher when the immunization schedule is completed in the pre-transplant period.
HEADINGS – Hepatitis B vaccines. Liver transplantation. Immunization schedule.
Declared conflict of interest of all authors: noneDisclosure of funding: no funding received1 Faculdade de Medicina de São José do Rio Preto – FAMERP, São José do Rio Preto, SP, Brasil. 2 Fundação Faculdade Regional de Medicina de São José do Rio Preto / Hospital de Base – FUNFARME/FAMERP/HB, São José do Rio Preto, SP, Brasil. Corresponding author: Isabela Cristina Rodrigues. E-mail: [email protected]
als, including those who have not been transplanted, but who have advanced liver diseases, such as chronic hepatitis C (HCV); thus, spe-cific immunization schedules are recommended for specific groups(7).
This study aims to analyzing available evidence in the litera-ture about the different used schedules for immunization against hepatitis B in patients before and after they have received liver transplantation; and suggesting potential immunization schedules against hepatitis B in patients who suffer from liver cirrhosis, with-out previous verifying documentation, using the Child-Turcotte Pugh score, according to evidences found in the literature.
METHODS
It consists of a systematic exploratory review of the literature, for which the following steps were adopted: identification of the issue, search in scientific literature, article classification, results evaluation, and overview of the evidences. The guiding question was “Which immunization schedules against hepatitis B were used in patients before and after liver transplantation and which results were obtained?”.
AG-2019-106dx.doi.org/10.1590/S0004-2803.201900000-77
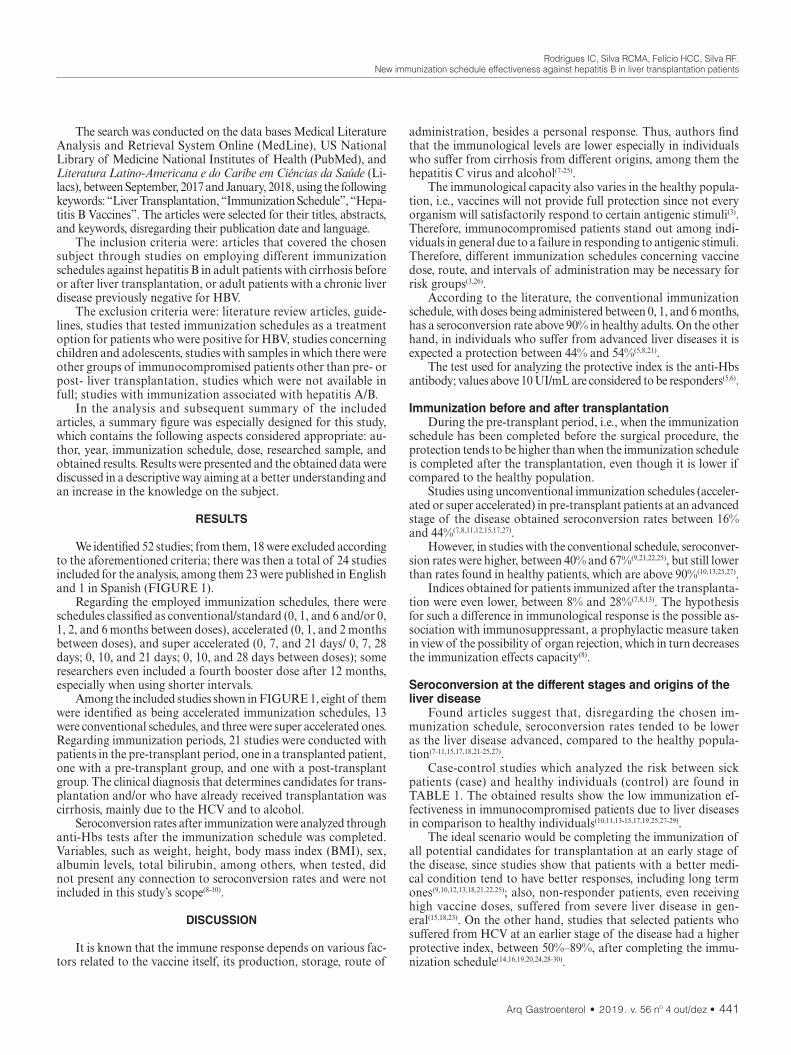
Rodrigues IC, Silva RCMA, Felício HCC, Silva RF.New immunization schedule effectiveness against hepatitis B in liver transplantation patients
Arq Gastroenterol • 2019. v. 56 nº 4 out/dez • 441
The search was conducted on the data bases Medical Literature Analysis and Retrieval System Online (MedLine), US National Library of Medicine National Institutes of Health (PubMed), and Literatura Latino-Americana e do Caribe em Ciências da Saúde (Li-lacs), between September, 2017 and January, 2018, using the following keywords: “Liver Transplantation, “Immunization Schedule”, “Hepa-titis B Vaccines”. The articles were selected for their titles, abstracts, and keywords, disregarding their publication date and language.
The inclusion criteria were: articles that covered the chosen subject through studies on employing different immunization schedules against hepatitis B in adult patients with cirrhosis before or after liver transplantation, or adult patients with a chronic liver disease previously negative for HBV.
The exclusion criteria were: literature review articles, guide-lines, studies that tested immunization schedules as a treatment option for patients who were positive for HBV, studies concerning children and adolescents, studies with samples in which there were other groups of immunocompromised patients other than pre- or post- liver transplantation, studies which were not available in full; studies with immunization associated with hepatitis A/B.
In the analysis and subsequent summary of the included articles, a summary figure was especially designed for this study, which contains the following aspects considered appropriate: au-thor, year, immunization schedule, dose, researched sample, and obtained results. Results were presented and the obtained data were discussed in a descriptive way aiming at a better understanding and an increase in the knowledge on the subject.
RESULTS
We identified 52 studies; from them, 18 were excluded according to the aforementioned criteria; there was then a total of 24 studies included for the analysis, among them 23 were published in English and 1 in Spanish (FIGURE 1).
Regarding the employed immunization schedules, there were schedules classified as conventional/standard (0, 1, and 6 and/or 0, 1, 2, and 6 months between doses), accelerated (0, 1, and 2 months between doses), and super accelerated (0, 7, and 21 days/ 0, 7, 28 days; 0, 10, and 21 days; 0, 10, and 28 days between doses); some researchers even included a fourth booster dose after 12 months, especially when using shorter intervals.
Among the included studies shown in FIGURE 1, eight of them were identified as being accelerated immunization schedules, 13 were conventional schedules, and three were super accelerated ones. Regarding immunization periods, 21 studies were conducted with patients in the pre-transplant period, one in a transplanted patient, one with a pre-transplant group, and one with a post-transplant group. The clinical diagnosis that determines candidates for trans-plantation and/or who have already received transplantation was cirrhosis, mainly due to the HCV and to alcohol.
Seroconversion rates after immunization were analyzed through anti-Hbs tests after the immunization schedule was completed. Variables, such as weight, height, body mass index (BMI), sex, albumin levels, total bilirubin, among others, when tested, did not present any connection to seroconversion rates and were not included in this study’s scope(8-10).
DISCUSSION
It is known that the immune response depends on various fac-tors related to the vaccine itself, its production, storage, route of
administration, besides a personal response. Thus, authors find that the immunological levels are lower especially in individuals who suffer from cirrhosis from different origins, among them the hepatitis C virus and alcohol(7-25).
The immunological capacity also varies in the healthy popula-tion, i.e., vaccines will not provide full protection since not every organism will satisfactorily respond to certain antigenic stimuli(3). Therefore, immunocompromised patients stand out among indi-viduals in general due to a failure in responding to antigenic stimuli. Therefore, different immunization schedules concerning vaccine dose, route, and intervals of administration may be necessary for risk groups(3,26).
According to the literature, the conventional immunization schedule, with doses being administered between 0, 1, and 6 months, has a seroconversion rate above 90% in healthy adults. On the other hand, in individuals who suffer from advanced liver diseases it is expected a protection between 44% and 54%(5,8,21).
The test used for analyzing the protective index is the anti-Hbs antibody; values above 10 UI/mL are considered to be responders(5,6).
Immunization before and after transplantationDuring the pre-transplant period, i.e., when the immunization
schedule has been completed before the surgical procedure, the protection tends to be higher than when the immunization schedule is completed after the transplantation, even though it is lower if compared to the healthy population.
Studies using unconventional immunization schedules (acceler-ated or super accelerated) in pre-transplant patients at an advanced stage of the disease obtained seroconversion rates between 16% and 44%(7,8,11,12,15,17,27).
However, in studies with the conventional schedule, seroconver-sion rates were higher, between 40% and 67%(9,21,22,25), but still lower than rates found in healthy patients, which are above 90%(10,13,25,27).
Indices obtained for patients immunized after the transplanta-tion were even lower, between 8% and 28%(7,8,13). The hypothesis for such a difference in immunological response is the possible as-sociation with immunosuppressant, a prophylactic measure taken in view of the possibility of organ rejection, which in turn decreases the immunization effects capacity(8).
Seroconversion at the different stages and origins of the liver disease
Found articles suggest that, disregarding the chosen im-munization schedule, seroconversion rates tended to be lower as the liver disease advanced, compared to the healthy popula-tion(7-11,15,17,18,21-25,27).
Case-control studies which analyzed the risk between sick patients (case) and healthy individuals (control) are found in TABLE 1. The obtained results show the low immunization ef-fectiveness in immunocompromised patients due to liver diseases in comparison to healthy individuals(10,11,13-15,17,19,25,27-29).
The ideal scenario would be completing the immunization of all potential candidates for transplantation at an early stage of the disease, since studies show that patients with a better medi-cal condition tend to have better responses, including long term ones(9,10,12,13,18,21,22,25); also, non-responder patients, even receiving high vaccine doses, suffered from severe liver disease in gen-eral(15,18,23). On the other hand, studies that selected patients who suffered from HCV at an earlier stage of the disease had a higher protective index, between 50%–89%, after completing the immu-nization schedule(14,16,19,20,24,28-30).
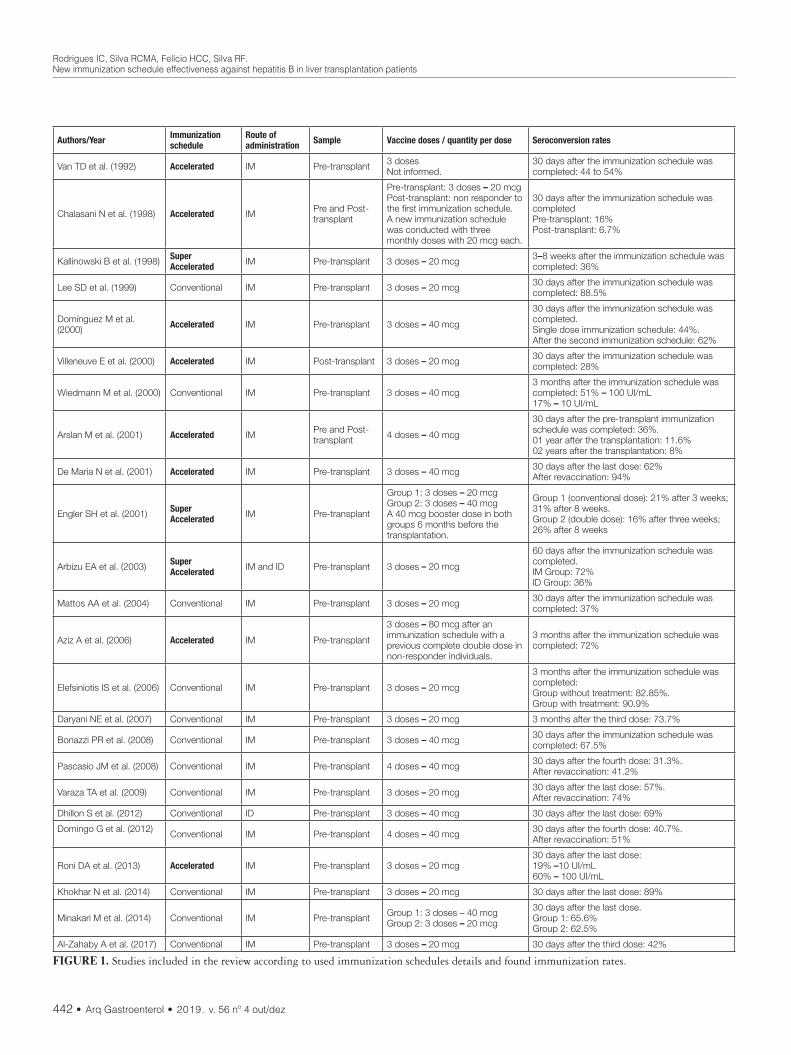
Rodrigues IC, Silva RCMA, Felício HCC, Silva RF.New immunization schedule effectiveness against hepatitis B in liver transplantation patients
442 • Arq Gastroenterol • 2019. v. 56 nº 4 out/dez
Authors/Year Immunization schedule
Route of administration Sample Vaccine doses / quantity per dose Seroconversion rates
Van TD et al. (1992) Accelerated IM Pre-transplant 3 dosesNot informed.
30 days after the immunization schedule was completed: 44 to 54%
Chalasani N et al. (1998) Accelerated IM Pre and Post-transplant
Pre-transplant: 3 doses – 20 mcgPost-transplant: non responder to the first immunization schedule.A new immunization schedule was conducted with three monthly doses with 20 mcg each.
30 days after the immunization schedule was completedPre-transplant: 16%Post-transplant: 6.7%
Kallinowski B et al. (1998) Super Accelerated IM Pre-transplant 3 doses – 20 mcg 3–8 weeks after the immunization schedule was
completed: 36%
Lee SD et al. (1999) Conventional IM Pre-transplant 3 doses – 20 mcg 30 days after the immunization schedule was completed: 88.5%
Domínguez M et al. (2000) Accelerated IM Pre-transplant 3 doses – 40 mcg
30 days after the immunization schedule was completed.Single dose immunization schedule: 44%.After the second immunization schedule: 62%
Villeneuve E et al. (2000) Accelerated IM Post-transplant 3 doses – 20 mcg 30 days after the immunization schedule was completed: 28%
Wiedmann M et al. (2000) Conventional IM Pre-transplant 3 doses – 40 mcg3 months after the immunization schedule was completed: 51% – 100 UI/mL17% – 10 UI/mL
Arslan M et al. (2001) Accelerated IM Pre and Post-transplant 4 doses – 40 mcg
30 days after the pre-transplant immunization schedule was completed: 36%.01 year after the transplantation: 11.6%02 years after the transplantation: 8%
De Maria N et al. (2001) Accelerated IM Pre-transplant 3 doses – 40 mcg 30 days after the last dose: 62%After revaccination: 94%
Engler SH et al. (2001) Super Accelerated IM Pre-transplant
Group 1: 3 doses – 20 mcgGroup 2: 3 doses – 40 mcgA 40 mcg booster dose in both groups 6 months before the transplantation.
Group 1 (conventional dose): 21% after 3 weeks; 31% after 8 weeks.Group 2 (double dose): 16% after three weeks; 26% after 8 weeks
Arbizu EA et al. (2003) Super Accelerated IM and ID Pre-transplant 3 doses – 20 mcg
60 days after the immunization schedule was completed.IM Group: 72%ID Group: 36%
Mattos AA et al. (2004) Conventional IM Pre-transplant 3 doses – 20 mcg 30 days after the immunization schedule was completed: 37%
Aziz A et al. (2006) Accelerated IM Pre-transplant
3 doses – 80 mcg after an immunization schedule with a previous complete double dose in non-responder individuals.
3 months after the immunization schedule was completed: 72%
Elefsiniotis IS et al. (2006) Conventional IM Pre-transplant 3 doses – 20 mcg
3 months after the immunization schedule was completed:Group without treatment: 82.85%.Group with treatment: 90.9%
Daryani NE et al. (2007) Conventional IM Pre-transplant 3 doses – 20 mcg 3 months after the third dose: 73.7%
Bonazzi PR et al. (2008) Conventional IM Pre-transplant 3 doses – 40 mcg 30 days after the immunization schedule was completed: 67.5%
Pascasio JM et al. (2008) Conventional IM Pre-transplant 4 doses – 40 mcg 30 days after the fourth dose: 31.3%.After revaccination: 41.2%
Varaza TA et al. (2009) Conventional IM Pre-transplant 3 doses – 20 mcg 30 days after the last dose: 57%.After revaccination: 74%
Dhillon S et al. (2012) Conventional ID Pre-transplant 3 doses – 40 mcg 30 days after the last dose: 69%
Domingo G et al. (2012) Conventional IM Pre-transplant 4 doses – 40 mcg 30 days after the fourth dose: 40.7%.After revaccination: 51%
Roni DA et al. (2013) Accelerated IM Pre-transplant 3 doses – 20 mcg30 days after the last dose:19% –10 UI/mL60% – 100 UI/mL
Khokhar N et al. (2014) Conventional IM Pre-transplant 3 doses – 20 mcg 30 days after the last dose: 89%
Minakari M et al. (2014) Conventional IM Pre-transplant Group 1: 3 doses – 40 mcgGroup 2: 3 doses – 20 mcg
30 days after the last dose.Group 1: 65.6%Group 2: 62.5%
Al-Zahaby A et al. (2017) Conventional IM Pre-transplant 3 doses – 20 mcg 30 days after the third dose: 42%
FIGURE 1. Studies included in the review according to used immunization schedules details and found immunization rates.

Rodrigues IC, Silva RCMA, Felício HCC, Silva RF.New immunization schedule effectiveness against hepatitis B in liver transplantation patients
Arq Gastroenterol • 2019. v. 56 nº 4 out/dez • 443
Varaza et al. (2009) also found a significant difference in sero-conversion when comparing the immunized group who had HCV (63.4%) and patients who suffered from cirrhosis, both by HCV and other origins (47%). Aziz et al. (2006) also obtained a protective index of 52% in individuals with cirrhosis and 83% without it, thus stressing the premise that the immunological response in patients with a history of their decompensated liver disease is considerably lower if compared to individuals who had an early diagnosis(18,23).
It is relevant to note the causes for cirrhosis, mainly for alcoholic cirrhosis, in view of the interference that alcohol has on cellular immunity, as shown by De Maria et al. (2001), who found 12% protection in cirrhotic individuals due to alcohol and 54% in those who had the VHC, when comparing seroconversion in cirrhotic groups classified according to origins. In their study, Roni et al. (2013) evaluated the seroconversion of hepatitis B immunization with liver diseases; 44% of the seroconverted were patients with alcoholic cirrhosis, compared to 56% of liver disease from other origins(15,24).
The best immunization response may be obtained in patients with a less compromised immunity. It is necessary, thus, to raise the awareness of health professionals to what immunization protocols are concerned for those patients who suffer from chronic liver diseases at an early stage of diagnosis, so that immunization can be completed before the transplantation and consequently generate better results regarding immunization seroconversion(9,15-17,19,20,22-24,28,30).
Interval between vaccine dosesConsidering the intervals between which vaccine doses will be
administered, there is no agreement among the researched arti-cles on effectiveness when comparing the several found intervals (accelerated, super accelerated, and conventional); there were no evidences of one schedule being superior to others. Some studies obtained positive results by using unconventional schedules; they showed an increase in anti-Hbs antibody rates in the first months after completing the schedule, with seroconversion rates between 30% and 70%(10-12,15,16,18,27).
However, the permanent protection duration might be infe-rior to that of the conventional schedule(7,8,10,12,13,18,27). Engler et al. (2001) show that 67% of the candidates for transplantation who obtained the pre-transplant primary response by receiving the super accelerated immunization schedule, later had a decrease in antibodies, between 4 and 7 months after transplantation. Arslan
et al. (2001), by employing an accelerated immunization schedule in a group of post-transplant patients, obtained quick responses after its completion; however, the protective antibodies decreased in four weeks; after two years, only 8% still had protective antibodies(7,10).
On the other hand, the need for high immediate protection in a short term may justify the choice of super accelerated schedules as the only option for cirrhotic patients who make it to the waiting list without immunization against hepatitis B, but with the proviso that the anti-Hbs antibody levels should be monitored after trans-plantation(9,16,27). This option is less unsafe than the total lack of immunization in that period.
All the context in which patients find themselves in order to receive a transplantation makes them very susceptible to acquiring the HBV, either through exposure during invasive procedures, the potential presence of the latent virus in the donor’s liver, which may be reactivated under immunosuppression, or the need for blood transfusions(5,9,10,12,13,18,21,22). Given the data, unconventional schedules may be appealing and increase the immunization schedule completion rates(5,16), thus providing protection for people under high contamination risks by hepatitis B in the peri-transplantation period (before, during, and immediately after surgery).
Seroconversion after booster doses and/or revaccinationStudies that considered revaccination in non-responders to
the primary immunization schedule obtained protective indices between 40% to 60%, except for De Maria et al. (2001), who ob-tained a 94% index after revaccination with high doses (80 mcg) in non-cirrhotic patients and 48% in cirrhotic ones(9,12,15,22,25).
In Brazil, the Health Ministry recommends repeating the im-munization schedule in high-risk patient groups, which include those who have received transplantation, with three more doses, following the conventional schedule. Those who are still negative for the anti-Hbs antibody after completing two immunization schedules must be considered non responders and susceptible in case of exposure(31).
Using vaccine double doses (40 mcg) in immunocompromised patients is acknowledged and is the adopted practice by the Health Ministry, which recommends four doses, with twice its usual quan-tity. Researched articles reinforced such need(12,14,17,21,25,30,32). Moreo-ver, some results suggest that the alternative schedule effectiveness is enhanced with a high vaccine dose, prompting an early antibody response in these patients(9,12,18,22).
TABLE 1. Case-control researched articles and their respective seroconversion results according to patient classification.
Author/YearSeroconversion rates after completed immunization schedule for hepatitis B
Case (sick patients) Control (healthy individuals) Patient classification
Van TD et al. (1992) 44–54% 93% Cirrhotic patients
Kallinowski B et al. (1998) 36% 95% Cirrhotic patients
Lee SD et al. (1999) 88.5% 91.4% Liver disease at early stage
Villeneuve E et al. (2000) 28% 97% Cirrhotic patients
De Maria M et al. (2001) 62% 92% Liver disease at early stage
Engler SH et al. (2001) 20–30% 95% Cirrhotic patients
Wiedmann M et al. (2001) 51% 74% Liver disease at early stage
Mattos AA et al. (2004) 37% 84.8% Cirrhotic patients
Elefsiniotis IS et al. (2006) 82.85–90.9% 92.56% Liver disease at early stage
Khokar N et al. (2014) 89% 96% Liver disease at early stage
Al-zahaby A et al. (2017) 58% 89% Liver disease at early stage
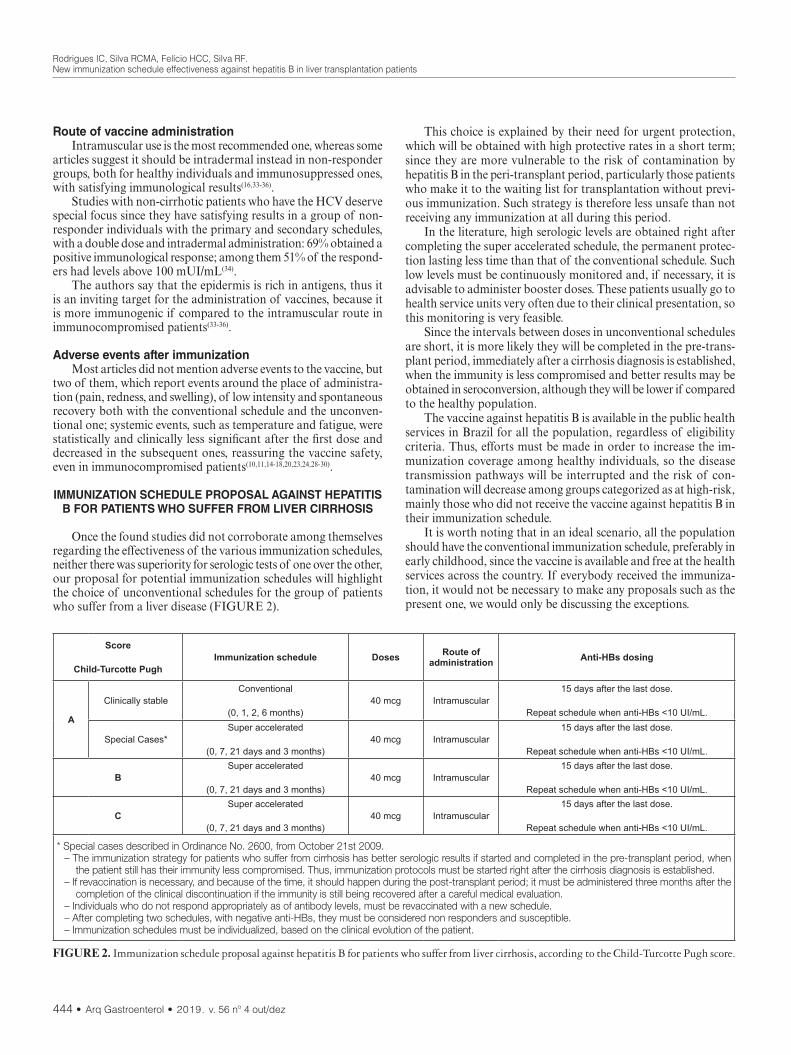
Rodrigues IC, Silva RCMA, Felício HCC, Silva RF.New immunization schedule effectiveness against hepatitis B in liver transplantation patients
444 • Arq Gastroenterol • 2019. v. 56 nº 4 out/dez
Route of vaccine administrationIntramuscular use is the most recommended one, whereas some
articles suggest it should be intradermal instead in non-responder groups, both for healthy individuals and immunosuppressed ones, with satisfying immunological results(16,33-36).
Studies with non-cirrhotic patients who have the HCV deserve special focus since they have satisfying results in a group of non-responder individuals with the primary and secondary schedules, with a double dose and intradermal administration: 69% obtained a positive immunological response; among them 51% of the respond-ers had levels above 100 mUI/mL(34).
The authors say that the epidermis is rich in antigens, thus it is an inviting target for the administration of vaccines, because it is more immunogenic if compared to the intramuscular route in immunocompromised patients(33-36).
Adverse events after immunizationMost articles did not mention adverse events to the vaccine, but
two of them, which report events around the place of administra-tion (pain, redness, and swelling), of low intensity and spontaneous recovery both with the conventional schedule and the unconven-tional one; systemic events, such as temperature and fatigue, were statistically and clinically less significant after the first dose and decreased in the subsequent ones, reassuring the vaccine safety, even in immunocompromised patients(10,11,14-18,20,23,24,28-30).
IMMUNIZATION SCHEDULE PROPOSAL AGAINST HEPATITIS B FOR PATIENTS WHO SUFFER FROM LIVER CIRRHOSIS
Once the found studies did not corroborate among themselves regarding the effectiveness of the various immunization schedules, neither there was superiority for serologic tests of one over the other, our proposal for potential immunization schedules will highlight the choice of unconventional schedules for the group of patients who suffer from a liver disease (FIGURE 2).
This choice is explained by their need for urgent protection, which will be obtained with high protective rates in a short term; since they are more vulnerable to the risk of contamination by hepatitis B in the peri-transplant period, particularly those patients who make it to the waiting list for transplantation without previ-ous immunization. Such strategy is therefore less unsafe than not receiving any immunization at all during this period.
In the literature, high serologic levels are obtained right after completing the super accelerated schedule, the permanent protec-tion lasting less time than that of the conventional schedule. Such low levels must be continuously monitored and, if necessary, it is advisable to administer booster doses. These patients usually go to health service units very often due to their clinical presentation, so this monitoring is very feasible.
Since the intervals between doses in unconventional schedules are short, it is more likely they will be completed in the pre-trans-plant period, immediately after a cirrhosis diagnosis is established, when the immunity is less compromised and better results may be obtained in seroconversion, although they will be lower if compared to the healthy population.
The vaccine against hepatitis B is available in the public health services in Brazil for all the population, regardless of eligibility criteria. Thus, efforts must be made in order to increase the im-munization coverage among healthy individuals, so the disease transmission pathways will be interrupted and the risk of con-tamination will decrease among groups categorized as at high-risk, mainly those who did not receive the vaccine against hepatitis B in their immunization schedule.
It is worth noting that in an ideal scenario, all the population should have the conventional immunization schedule, preferably in early childhood, since the vaccine is available and free at the health services across the country. If everybody received the immuniza-tion, it would not be necessary to make any proposals such as the present one, we would only be discussing the exceptions.
Score
Child-Turcotte PughImmunization schedule Doses Route of
administration Anti-HBs dosing
A
Clinically stableConventional
(0, 1, 2, 6 months)40 mcg Intramuscular
15 days after the last dose.
Repeat schedule when anti-HBs <10 UI/mL.
Special Cases*Super accelerated
(0, 7, 21 days and 3 months)40 mcg Intramuscular
15 days after the last dose.
Repeat schedule when anti-HBs <10 UI/mL.
BSuper accelerated
(0, 7, 21 days and 3 months)40 mcg Intramuscular
15 days after the last dose.
Repeat schedule when anti-HBs <10 UI/mL.
CSuper accelerated
(0, 7, 21 days and 3 months)40 mcg Intramuscular
15 days after the last dose.
Repeat schedule when anti-HBs <10 UI/mL.
* Special cases described in Ordinance No. 2600, from October 21st 2009.– The immunization strategy for patients who suffer from cirrhosis has better serologic results if started and completed in the pre-transplant period, when
the patient still has their immunity less compromised. Thus, immunization protocols must be started right after the cirrhosis diagnosis is established.– If revaccination is necessary, and because of the time, it should happen during the post-transplant period; it must be administered three months after the
completion of the clinical discontinuation if the immunity is still being recovered after a careful medical evaluation.– Individuals who do not respond appropriately as of antibody levels, must be revaccinated with a new schedule. – After completing two schedules, with negative anti-HBs, they must be considered non responders and susceptible.– Immunization schedules must be individualized, based on the clinical evolution of the patient.
FIGURE 2. Immunization schedule proposal against hepatitis B for patients who suffer from liver cirrhosis, according to the Child-Turcotte Pugh score.

Rodrigues IC, Silva RCMA, Felício HCC, Silva RF.New immunization schedule effectiveness against hepatitis B in liver transplantation patients
Arq Gastroenterol • 2019. v. 56 nº 4 out/dez • 445
However, due to several reasons, there is still a large number of people who do not receive the vaccine, and/or do not have the records of it, thus being considered not immunized; therefore, this study is crucial as a way of encouraging reflection and discussions in the scientific community.
Hence the need for randomized, multicentric and controlled studies in order to support the proposed hypothesis herein and strengthen the discussion on novel immunization strategies for risk groups, such as liver transplantation patients.
CONCLUSION
The searched studies did not find seroconversion superiority between the different immunization schedules (conventional and unconventional). However, since candidates to liver transplanta-tion are usually very vulnerable, results show that unconventional immunization schedules (accelerated and super accelerated) may be recommended for such group of patients, and serologic test results will be higher when the immunization schedule is completed in the pre-transplant period.
The need for immediate serologic protection, with high protec-tive rates in a short term, may justify employing unconventional
immunization schedules in patients who make it to a transplanta-tion waiting list without previous immunization. Such strategy is therefore less unsafe than not receiving any immunization at all during this period.
Authors’ contributionRodrigues IC: main author; this article is part of the author’s
PhD thesis. Silva RCMA: active participant in the process, from sample selection, data collection, data analysis and interpretation, statistical calculations and final review. Felício HCC: active partici-pant of the process, from the selection of the sample, data collec-tion, preparation of the manuscript and final revision. Silva RF: PhD thesis advisor, active participant of the whole process, from the project to the final review as the research group leader.
OrcidIsabela Cristina Rodrigues. Orcid: 0000-0002-5209-4286.Rita de Cássia Martins Alves da Silva. Orcid: 0000-0001-6302-0939.Helen Catharine Camarero de Felício. Orcid: 0000-0002-7791-6581.Renato Ferreira da Silva. Orcid: 0000-0001-9652-6426.
REFERENCES
1. Castells L, Esteban R. Hepatitis B vaccination in liver transplant candidates. Eur J Gastroenterol Hepatol. 2001;13:359-61.
2. Ferrazzo S, Vargas MAO, Gomes DC, Gelbcke FL, Hammerschimidt KSA, Lodeyro CF. Serviço especializado em transplante hepático em um hospital universitário: um estudo de caso. Texto contexto-enferm. 2017;26(2).
3. Pirofski LA, Casadevall A. Use of licensed vaccines for active immunization of the immunocompromised host. Clin Microbiol Rev. 1998;11:1-26.
4. Ropero Álvarez AM, Pérez-Vilar S, Pacis-Tirso C, Contreras M, El Omeiri N, Ruiz-Matus C, et al. Progress in vaccination towards hepatitis B control and elimination in the Region of the Americas. BMC Public Health. 2017;17:325.
5. Be Hernández-Bernal F, Aguilar-Betancourt A, Aljovin V, Arias G, Valenzuela C, de Alejo KP, et al. Comparison of four recombinant hepatitis B vaccines applied on an accelerated schedule in healthy adults. Hum Vaccin. 2011;7:1026-36.
Rodrigues IC, Silva RCMA, Felício HCC, Silva RF. Eficácia de um novo esquema vacinal contra hepatite B em pacientes submetidos a transplante de fígado. Arq Gastroenterol. 2019;56(4):440-6.RESUMO – Contexto – O transplante de fígado, apesar de ser um procedimento de elevado risco, está consolidado como recurso terapêutico para cura
e melhoria da qualidade de vida de indivíduos acometidos por doenças. A prevenção da infecção pelo vírus da hepatite B através da vacinação tem sido a medida mais efetiva para reduzir complicações, diminuindo o número de pessoas com hepatite crônica pelo vírus da hepatite B e eliminando a transmissão Objetivo – 1. Analisar as evidências na literatura sobre os diferentes esquemas utilizados para a vacina contra a hepatite B em pacientes submetidos a transplante de fígado. 2. Sugerir possíveis esquemas de vacinação contra hepatite B para pacientes com cirrose hepática, sem documen-tação comprovatória anterior, em relação à classificação de Child-Turcotte Pugh, segundo evidências encontradas na literatura. Métodos – Revisão sistemática da literatura, realizada nas bases de dados MedLine, PubMed e Lilacs, no período de setembro/2017 a janeiro/2018, com as seguintes palavras chaves: “Liver Transplantation, “Immunization Schedule”, “Hepatitis B Vaccines”. Para análise dos artigos foi utilizado um quadro sinóptico especialmente construído para esse fim e a apresentação dos resultados e discussão foi feita de forma descritiva. Resultados – Foram incluídos 24 estudos, sendo oito com esquemas vacinais acelerados, 13 com esquemas convencionais e três com esquemas super acelerado. Quanto ao período da vacinação, 21 estudos foram realizados com pacientes no período pré-transplante, um em pacientes transplantados e um com um grupo pré e um grupo pós transplante. Os artigos encontrados sugerem que independente do esquema vacinal escolhido, as taxas de soroconversão tendem a ser menores conforme o avançar da doença hepática, em relação à população saudável. Conclusão – Os estudos não encontraram superioridade de soroconversão entre os diferentes esquemas de vacinação (convencional e não convencional). Entretanto, sabendo da vulnerabilidade que os candidatos a transplante de fígado estão expostos, os resultados demonstram que o esquema de vacinação superacelerado pode ser indicado para este grupo de pacientes, e que os resultados sorológicos são mais elevados quando o esquema de vacinação é completado no período pré-transplante.
DESCRITORES – Vacinas contra hepatite B. Transplante de fígado. Esquemas de imunização.
6. Goel A, Aggarwal A, Aggarwal R. Hepatitis B vaccine: using skin when muscle does not work. J Gastroenterol Hepatol. 2016;31:524-6.
7. Arslan M, Wiesner RH, Sievers C, Egan K, Zein NN. Double-dose acceler-ated hepatitis b vaccine in patients with end-stage liver disease. Liver Transpl. 2001;7:314-20.
8. Chalasani N, Smallwood G, Halcomb J, Fried MW, Boyer TD. Is vaccination against hepatitis b infection indicated in patients waiting for or after orthotopic liver transplantation. Liver Transpl Surg. 1998;4:128-32.
9. Gutierrez Domingo I, Pascasio Acevedo JM, Alcalde Vargas A, Ramos Cuadra A, Ferrer Ríos MT, Sousa Martin JM, et al. Response to vaccination against hepatitis b vírus with a schedule of four 40ug doses in cirrhotic patients evalu-ated for liver transplantation: fator associated with a response. Transplant Proc. 2012;44:1499-501.
Rodrigues IC, Silva RCMA, Felício HCC, Silva RF.New immunization schedule effectiveness against hepatitis B in liver transplantation patients
446 • Arq Gastroenterol • 2019. v. 56 nº 4 out/dez
10. Engler SH, Sauer PW, Golling M, Klar EA, Benz C, Stremmel W, et al. Immu-nogenicity of two accelerated hepatitis b vaccination protocols in liver transplant candidates. Eur J Gastroenterol Hepatol. 2001;13:363-7.
11. Kallinowski B, Benz C, Buchholz L, Stremmel W. Accelerated schedule of hepa-tites B vaccination in liver transplant candidates. Transplant Proc. 1998;30:797-9.
12. Domínguez M, Bárcena R, García M, López-Sanroman A, Nuño J. Vaccination against hepatitis b virus in cirrhotic patients on liver transplant waiting list. Liver Transpl. 2000;6:440-2.
13. Villeneuve E, Vincelette J, Villeneuve JP. Ineffectiveness of hepatitits B vaccina-tion in cirrhotic patients waiting for liver transplantation. Can J Gastroenterol. 2000;14 (Suppl B):59B-62B.
14. Wiedmann M, Liebert UG, Oesen U, Porst H, Wiese M, Schroeder S, et al. De-crease immunogenicity of recombinant hepatitis b vaccine in chronic hepatitis C. Hepatology. 2000;31:230-4.
15. De Maria N, Idilman R, Colantoni A, Van Thiel DH. Increased effective im-munogenicity to high-dose and short-interval hepatitis B virus vaccination in individuals with chronic hepatitis without cirrhosis. J Viral Hepat. 2001;8:372-6.
16. Arbizu EA, Marugán RB, Grijalba JY, Serrano PL, Grande LG, Del Campo Terrón S. Intramuscular versus intradermal administration of anti-hepatitis B vaccine in non-cirrhotic hepatitis C patients. Vaccine. 2003;21:2747-50.
17. Mattos AA, Gomes EB, Tovo CV, Alexandre CO, Remião JO. Hepatitis B vaccine efficacy in patients with chronic liver disease by hepatitits C virus. Arq Gastroenterol. 2004;41:180-4.
18. Aziz A, Aziz S, Li DS, Murphy L, Leone N, Kennedy M, et al. Efficacy of repeated high dose hepatitis b vaccine (80 microg) in patients with chronic liver disease. J Viral Hepat. 2006;13:217-21.
19. Elefsiniotis IS, Vezali E, Kamposioras K, Pantazis KD, Tontorova R, Ketikoglou I, et al. Immunogenicity of recombinant hepatitis B vaccine in treatment-naïve and treatment-experienced chronic hepatitis C patients: the effect of pegylated interferon plus ribavirin treatment. World Gastroenterol. 2006;12:4420-24.
20. Daryani NE, Nassiri-Toosi M, Rashidi A, Khodarahmi I. Immunogenicity of recombinant hepatitis B virus vaccine in patients with and without chronic hepatitis C virus infection: a case-control study. World Gastroenterol. 2007;13: 294-98.
21. Bonazzi PR, Bacchella T, Freitas AC, Osaki KT, Lopes MH, Freire MP, et al. Double-dose hepatitis B vaccination in cirrhotic patients on a liver transpant waiting list. Bras J Infect Dis. 2008;12:306-9.
22. Pascasio JM, Aoufi S, Gash A, Sousa JM, Perea R, Sayago M, et al. Response to a vaccination schedule with 4 doses of 40 micro against hepatitis b vírus in cirrhotic patients evaluated for liver transplantation. Transplant Proc. 2008;40:2943-5.
23. de Artaza Varasa T, Sánchez Ruano JJ, García Vela A, Gómez Rodríguez R, Romero Gutiérrez M, de la Cruz Pérez G, et al. Eficacia y seguridad de la vacu-nación para la hepatitis A y la hepatitis B en pacientes con hepatopatia crónica. Gastroenterol Hepatol. 2009;32:483-8.
24. Roni DA, Pathapati RM, Kumar AS, Nihal L, Sridhar K, Tumkur Rajashekar S. Safety and efficacy of hepatitis B vaccination in cirrohosis of liver. Adv Virol. 2013;2013:196704.
25. Al-zahaby A, Zaky S, Hussien M, El-Tiby D, Alnoomani NM, Awadallah H, et al. Efficacy of hepatitis b virus vaccination and antibody response to reactivation dose among adult non-responders to primary hepatitis b vaccination in chronic hepatitis c Egyptian patients. J Gastroenteol Hepatol Res. 2017;6:2446-50.
26. Saltoğlu N, Inal AS, Tasova Y, Kandemir O. Comparison of the accelerated and classic vaccination schedules against hepatitis B: three-week hepatitis b vaccina-tion schedules provide immediate and proctetive immunity. Ann Clin Micro biol Antimicrob. 2003;2:10.
27. Van Thiel DH, el-Ashmawy L, Love K, Gavaler JS, Starzl TE. Response to hep-atitis b vaccination by liver transplant candidates. Dig Dis Sci. 1992;37:1245-9.
28. Lee SD, Chan CY, Yu MI, Lu RH, Chang FY, Lo KJ. Hepatitis B vaccination in patients with chronic hepatitis C. J Med Virol. 1999;59:463-68.
29. Khokhar N, Niazi TK, Qureshi MO. Effect of hepatites B vaccination in patients with chronic hepatites C. J Coll Physicians Surg Pak. 2014;24:392-5.
30. Min Minakari M, Tahmasebi A, Motlagh MH, Ataei B, Yaran M, Kalantari H, et al. Efficacy of double dose recombinant hepatitis b vaccination in chronic hepatitis C patients, compared to standard dose vaccination. Int J Prev Med. 2014;5:145-51.
31. Brasil. Ministério da Saúde. Secretaria de Vigilância em Saúde. Departamento de Vigilância das Doenças Transmissíveis. Manual dos Centros de Referência para Imunobiológicos Especiais. 4. ed. Brasíia (DF): Ministério da Saúde, 2014.
32. Moss W, Iedeman H. Immunization of the immunocompromised host. Clinical focus on primary immune deficiencies. 1998.
33. Sangaré L, Manhart L, Zehrung D, Wang CC. Intradermal hepatitits B vaccina-tion: a systematic review and meta-analysis. Vaccine 2009;1777-86.
34. Dhillon S, Moore C, Li SD, Aziz A, Kakar A, Dosanjh A, et al. Efficacy of high-dose intra-dermal hepatitis b virus vaccine in previous vaccination non-responders with chronic liver disease. Dig Dis Sci. 2012;57:215-20.
35. Walayat S, Ahmed Z, Martin D, Puli S, Cashman M, Dhillon S. Recente advances in vaccination of non-responders to standard dose hepatitis B virus vaccine. World J Hepatol. 2015;7:2503-09.
36. Filippeli M, Lionetti E, Gennaro A, Lanzafame A, Arrigo T, Salpietro C, et al. Hepatitis B vaccine by intradermal route in non responder patients: an update. World J Gastroenterol. 2014;20:10383-94.

AHEAD OF PRINTBRIEF COMMUNICATION
Arq Gastroenterol • 2019. v. 56 nº 4 out/dez • 447
INTRODUCTION
Malnutrition is associated with clinical factors, including longer hospital stay(1-4), increased morbidity and mortality(1,5) and hospital costs(4).
A recent systematic review, developed by Correia et al., 2017(4), indicated a high prevalence of malnutrition in Latin American countries(4). Tangvik et al., 2015(6) determined the nutritional risk profile in a hospital population and showed that diseases of higher prevalence were infections, cancer and lung diseases(6).
Martin-Palmero et al., 2017(3), investigated the prevalence of malnutrition in inpatients in Spain and showed that approximately half of the patients in medical and surgical wards were malnour-ished; and this was associated with longer hospital stay, medication and mortality(3).
This preliminary study aimed to investigate the prevalence of malnutrition by different nutritional indicators and type of disease, and to identify factors that contribute to malnutrition in hospitalized patients.
METHODS
Study characteristicsA cross-sectional study, with 138 (n=138) adult and elderly in-
patients. Inclusion criteria included, age ≥20 years; complete entries
Nutritional indicators of malnutrition in hospitalized patients
Vânia Aparecida LEANDRO-MERHI1,2, Caroline Lobo COSTA2, Laiz SARAGIOTTO1 and José Luiz Braga de AQUINO1,3
Received 11/7/2019Accepted 12/8/2019
ABSTRACT – Background – Malnutrition is associated with clinical factors, including longer hospital stay, increased morbidity and mortality and hos-pital costs. Objective – To investigate the prevalence of malnutrition using different nutritional indicators and to identify factors that contribute to malnutrition in hospitalized patients. Methods – We investigated anthropometric, laboratory standards, nutritional risk screening (NRS), subjective global assessment (SGA), mini nutritional assessment and habitual energy consumption (HEC). Chi-square, Fisher’s exact test, Mann-Whitney test and univariate and multiple Cox regression analysis were used, at 5% significance level. Results – It was found 21.01% of malnourished individuals by ASG; a total of 34.78% with nutritional risk according to NRS and 11.59% with low weight (BMI). There was no statistically significant difference in the prevalence of malnutrition by ASG (P=0.3344) and nutritional risk by NRS (P=0.2286), among the types of disorders. Patients with nutritional risk were of higher median age (64.5 vs 58.0 years; P=0.0246) and had lower median values of HEC (1362.1 kcal vs 1525 kcal, P=0.0030), of calf cir-cumference (32.0 cm vs 33.5 cm, P=0.0405) of lymphocyte count (1176.5 cell/mm3 vs 1760.5 cell/ mm3, P=0.0095); and higher percentage of low body weight according to the BMI (22.9% vs 5.6%; P=0.0096). Lymphocyte count was associated with nutritional risk (P=0.0414; HR= 1.000; IC95%= 0.999; 1.000). Conclusion – NRS was more sensitive than other indicators in the diagnosis of malnutrition. Patients at risk were older and had lower HEC values, calf circumference, BMI and lymphocyte count. Low lymphocyte count was considered a factor associated with nutritional risk by the NRS.
HEADINGS – Health status indicators. Malnutrition. Nutrition assessment. Nutritional status.
Declared conflict of interest of all authors: noneDisclosure of funding: no funding received1 PUC, Programa de Pós-Graduação em Ciências da Saúde, Campinas, SP, Brasil. 2 PUC, Faculdade de Nutrição, Campinas, SP, Brasil. 3 PUC, Faculdade de Medicina, Campinas, SP, Brasil.Corresponding author: Vânia Aparecida Leandro Merhi. E-mail: [email protected]
of clinical and nutritional data in medical records and assessment of nutritional status during the first 24 hours of hospitalization. Patients with incomplete entries for such information in the medi-cal records and those hospitalized only for diagnostic investigation and exams were excluded. This study is part of a larger project that is investigating the presence of malnutrition in patients hospital-ized for different kinds of diseases and indicators, previously ap-proved by the institution’s ethics and research committee (opinion no. 2,312,714). We investigated variables such as age, sex, type of disease, hospitalization time, anthropometric and laboratory standards, nutritional screening tools, energy consumption and the kind of diet prescribed during hospitalization.
Anthropometric and laboratory indicatorsAccording to standardized procedures and cutoff points defined
in the literature, the body mass index (BMI) grading was used both for adults and the elderly(7,8). According to Frisancho (1990)(9) and Burr & Phillips (1984)(10), arm circumference (AC), triceps skinfold (TSF) and arm muscle circumference (AMC) were classified by percentiles grades. Calf circumference (CC) was classified accord-ing to WHO definition(11).
Laboratory tests for lymphocyte count (LC) (cell/mm³), white blood cells (cell/mm3), erythrocytes (cm3), hematocrit (%), hemo-globin (g/dL) and MCV (fL) were classified according to standard-ized cut-off points(12).
AG-2019-105dx.doi.org/10.1590/S0004-2803.201900000-74

Leandro-Merhi VA, Costa CL, Saragiotto L, Aquino JLB.Nutritional indicators of malnutrition in hospitalized patients
448 • Arq Gastroenterol • 2019. v. 56 nº 4 out/dez
Nutritional screening tools (nutritional risk screening-NRS, subjective global assessment-SGA and mini nutritional assessment -MNA)
For nutritional risk detection, NRS was applied(13,14). This method takes into account BMI, weight loss, decreased food intake and disease severity, classifying the risk by numerical score ≥3 (at risk) and <3 (no risk)(13,14).
Based on weight loss, food consumption and clinical and physi-cal signs of malnutrition, SGA subjectively assessed the patient’s nutritional status, being classified as: well-nourished-WN, slightly malnourished-SM, moderately malnourished-MM and gravely malnourished-GM(15). In this study, patients classified as SM, MM and GM, were considered as malnourished.
MNA classifies the elderly as malnourished, risk of malnutri-tion and eutrophic, considering dietary and weight changes, physi-cal evaluation, functional capacity, AC, CC, nutritional problems and disease(16).
Percentage of adequacy of habitual energy consumption in relation to individual energy needs (% HEC/EN)
The % HEC/EN was classified as <75% and ≥75%(2,17,18). This assessment was obtained through the investigation of habitual en-ergy consumption (HEC). The energy requirements were estimated from the Harris & Benedict equation(19).
Statistical analysisA descriptive analysis was performed with frequencies for cat-
egorical variables and position and dispersion measurements for continuous variables. To compare proportions, the chi-square or Fisher’s exact test was used when necessary. For the comparison of continuous or orderly measurements between two groups, the Mann-Whitney test was applied. Subsequently, univariate and multiple Cox regression analysis was used to identify the risk fac-tors associated with SGA malnutrition and NRS nutritional risk. The variable selection process was performed stepwise. The level of significance adopted for the statistical tests was 5%(20-22).
Ethical approvalAll procedures performed in studies involving human par-
ticipants were in accordance with the ethical standards of the institutional and/or national Research Committee (CNS resolu-tion nº. 466/12).
RESULTS
This investigation included a sample of 138 inpatients, the majority being male (n=82; 59.42%). The most frequent diagnoses were: 29.71% of the patients with digestive neoplasia; 24.64% with digestive tract disorders (DTD); 20.29% with vascular diseases; 13.04% with head and neck neoplasia and 12.32% with trauma. The majority (57.25%) had been hospitalized for more than seven days. Regarding nutritional screening instruments, 21.01% patients were found as malnourished by SGA and 34.78% with nutritional risk by NRS. It was observed that 64.49% were classified as malnourished by MNA among the elderly. Using the anthropometric indicators, 11.59% of the patients were rated as low weight by BMI. And in the anthropometric indicators of body composition, we found 32.61%; 16.67% and 47.83% of patients classified ≤ to the 15th percentile (≤ P15), for AC, TSF and AMC, respectively. It was verified that 68.84% of the patients showed a HEC lower than 75% of their
estimated energy needs. In the dietary prescription, at the time of hospitalization, 27.54% were fed a general diet; 21.01% a soft diet; 17.39% liquid diet; 7.97% enteral/parenteral diet and 26.09% were prescribed oral fasting. The mean age was 55.67±17.15 years, and the mean length of hospital stay was 10.88±9.04 days. There was no statistically significant difference in the prevalence of malnutri-tion by SGA (P=0.3344) and nutritional risk by NRS (P=0.2286), among the types of diseases.
A comparison of all variables studied (sex, age, diagnosis, length of stay, fasting time, anthropometric standards, laboratory tests, HEC, type of diet prescribed upon admission) and nutritional status by SGA and nutritional risk by NRS were analyzed by the Mann-Whitney, chi-square and Fischer tests. In this analysis, it was verified that only the TSF class presented a significant difference, when we compared malnourished and well-nourished by SGA, with the percentage of patients with TSF ≤ to the percentile 15; it was higher in the malnourished, according to the SGA (37.9%, P=0.0022).
In the comparison between the studied variables and the NRS, it was verified that the variables age, HEC, CC, LC and low weight (BMI), showed a significant difference when we compared patients with risk and without nutritional risk by NRS. Patients with nutri-tional risk were characterized by a higher median age (64.5 vs 58.0 years; P=0.0246) and lower mean values in the other numerical variables (HEC: -1362.1 kcal vs 1525 kcal, P=0.0030; CC: -32.0 cm vs 33.5 cm, P=0.0405; LC: -1176.5 cell/mm3 vs 1760.5 cell/mm3, P=0.0095), and with a higher percentage of low weight according to the BMI (22.9% vs 5.6%; P=0.0096).
TABLE 1 shows the study of the risk factors associated with malnutrition (SGA), assessed by the Cox regression analysis. It was observed that no variable presented a statistically significant difference at the 5% level, as a factor associated with the risk of malnutrition by SGA.
TABLE 1. Study of the risk factors associated with malnutrition (SGA), assessed by the Cox regression analysis.
Variables Categories P-value HR CI 95%
Age 0.8740 1.002 0.981; 1.023
Gender Female vs male 0.4006 1.367 0.660; 2.831
Diseases
Digestive tract disorder vs
trauma0.1536 4.500 0.570; 35.518
Vascular disease 0.4274 2.429 0.271; 21.728
Head and neck neoplasia 0.2345 3.778 0.422; 33.799
Digestive neoplasia 0.1462 4.561 0.589; 35.326
Lymphocytes 0.6587 1.000 0.999; 1.000
Leukocytes 0.2586 1.000 1.000; 1.000
Erythrocytes 0.1517 1.100 0.966; 1.254
Hematocrit 0.0890 0.956 0.907; 1.007
Hemoglobin 0.9367 1.006 0.870; 1.163
MCV 0.5588 0.992 0.966; 1.019
HEC <75% vs ≥75% 0.6995 0.860 0.400; 1.849MCV: mean corpuscular volume, HEC: habitual energy consumption; HR: hazard ratio.

Leandro-Merhi VA, Costa CL, Saragiotto L, Aquino JLB.Nutritional indicators of malnutrition in hospitalized patients
Arq Gastroenterol • 2019. v. 56 nº 4 out/dez • 449
TABLE 2 shows the risk factors associated with nutritional risk by NRS, assessed by the COX regression analysis. Only the LC variable revealed to be a factor associated with nutritional risk; This risk was associated with lower LC values (P=0.0414, HR=1,000, 95% CI=0.999, 1,000). In other words, every 100 units less lymphocytes, increases the nutritional risk by 4.6%, by NRS.
SGA had similar capacity to predict length of stay, costs, infectious complications, and mortality. However, the NRS proved to be a better predictor for noninfectious complications(24).
Our study pointed out that regarding the anthropometric standards, a low percentage of patients with low weight by BMI was found (11.59%); while (21%), and even more was found based on the NRS (almost 35%). A deterioration of nutritional status has been observed in the literature in hospitalized patients, which may occur both at the beginning or during the hospitalization period. Tangvik, et al., 2015(6), investigated the nutritional risk of inpatients (NRS) and found a 29% nutritional risk, with different prevalence in different clinical situations and at more advanced age; besides a prevalence of malnutrition also in those patients with higher morbidity and infections. However, attention was drawn to the fact that nutritional risk was evidenced in patients with normal BMI or overweight(6).
In the present study, those patients with nutritional risk by NRS were significantly associated with older age and lower energy consumption, in addition to presenting lower values of CC, LC and with a higher percentage of low weight by BMI. Finally, this study showed that the LC indicator was associated with nutritional risk by the NRS, when assessed by the Cox regression analysis. A study conducted in Turkey investigated the use of NRS-2002, indicat-ing sensitivity of 88% and specificity of 92%, showing that this is a valid method for assessing nutritional risk in hospitalized adult patients(25). Another recent study(26) that also used anthropometric, laboratory, NRS and SGA indicators in the first 24 hours hospi-talization showed poor clinical outcomes in patients at nutritional risk, indicating further that the prevalence of malnutrition and nutritional risk on discharge was higher than that observed at hospital admission(26).
It is possible to consider as limiting factors of this study, principally the sample size, and as a consequence, the reduced number of patients in each disease category. More research should be conducted with a larger population, which could contribute to more consistent results, evidencing malnutrition and its associated factors in hospitalized patients. Such results may contribute to more effective nutritional interventions in the hospital setting.
CONCLUSION
NRS was more sensitive than other indicators in the diagnosis of malnutrition prevalence. Patients at risk were older and had lower HEC, CC, BMI and LC. Low LC was considered a factor associated with nutritional risk by NRS.
ACKNOWLEDGEMENTS
We thank the Pontifical Catholic University of Campinas-SP-Brazil.
Authors’ contributionAll authors contributed equally to data collection and analysis,
and manuscript writing and review.
OrcidVânia Aparecida Leandro Merhi. Orcid: 0000-0002-2623-6471.Caroline Lobo Costa. Orcid: 0000-0002-2792-5551.Laiz Saragiotto. Orcid: 0000-0003-1931-2795.José Luiz Braga de Aquino. Orcid: 0000-0002-0604-9054.
TABLE 2. Study of risk factors associated with nutritional risk by NRS, assessed by the Cox regression analysis.
Variables Categories P-value HR CI 95%Age 0.1116 1.014 0.977; 1.032Gender Female vs male 0.6641 0.879 0.490; 1.576
Diseases
Digestive tract disorder vs
trauma0.8446 1.125 0.346; 3.653
Vascular disease 0.6037 1.366 0.421; 4.436Head and neck
neoplasia 0.5895 1.417 0.400; 5.020
Digestive neoplasia 0.1832 2.073 0.709; 6.065
Lymphocytes 0.0414 1.000 0.999; 1.000Lymphocytes 100 units 0.956 0.915; 0.998Leukocytes 0.9461 1.000 1.000; 1.000Erythrocytes 0.8421 1.015 0.879; 1.171Hematocrit 0.1900 0.972 0.932; 1.014Hemoglobin 0.9943 1.000 0.892; 1.122MCV 0.4931 1.010 0.981; 1.041HEC <75% vs ≥75% 0.2213 1.522 0.776; 2.983
MCV: mean corpuscular volume, HEC: habitual energy consumption; HR: hazard ratio.
DISCUSSION
This is a preliminary investigation study of nutritional indica-tors that are routinely used in hospitalized patients to identify malnutrition. The data found here, perhaps because it was a small sample, did not show any association of SGA and NRS, with the different types of diseases.
Recently, Borek et al., 2017(23), pointed out that malnutrition was highly prevalent among hospitalized patients with kidney diseases, influencing hospitalization length of stay. The authors also showed that the identification of this malnutrition and of the nutritional risk, could help in the implementation of nutritional intervention actions.
In the study by Martín-Palmero, 2017(3), almost half of the patients were considered malnourished, regardless of the nutri-tional tool used. A high consistency between the NRS and SGA methods was found. In the population in this study, our data indi-cated 21.01% of malnourished patients by SGA and 34.78% with nutritional risk by NRS. Possibly, in our study, the NRS was more sensitive in the diagnosis of nutritional risk, when compared to malnutrition by the SGA. In the present study, approximately 65% of malnourished patients (MNA) were found among the elderly. Comparisons with other studies have revealed a higher prevalence of nutritional risk in older patients(1,2,4,6). Patients aged ≥70 years may present a 2.4-fold increased risk of malnutrition(1).
Another study conducted by Wang et al., 2016(24), found that the risk of malnutrition among patients was high, and that NRS and

Leandro-Merhi VA, Costa CL, Saragiotto L, Aquino JLB.Nutritional indicators of malnutrition in hospitalized patients
450 • Arq Gastroenterol • 2019. v. 56 nº 4 out/dez
REFERENCES
1. Kang MC, Kim JH, Ryu SW, Moon JY, Park JH, Park JK, et al. Prevalence of Malnutrition in Hospitalized Patients: a Multicenter Cross-sectional Study. J Korean Med Sci. 2018;33:e10.
2. Leandro-Merhi VA, Aquino JLB, Chagas JFS. Nutrition status and risk factors associated with length of hospital stay for surgical patients. JPEN J Parenter Enteral Nutr. 2011;35:241-8.
3. Martín-Palmero A, Serrano-Pérez A, Chinchetru-Ranedo MJ, Cámara-Balda A, Martínez-de-Salinas-Santamaría MA, Villar-García G, Marín-Lizárraga MM. Malnutrition in hospitalized patients: results from La Rioja. Nutr Hosp. 2017;34:402-6.
4. Correia MITD, Perman MI, Waitzberg DL. Hospital malnutrition in Latin America: A systematic review. Clin Nutr. 2017;36:958-67.
5. Leiva Badosa E, Badia Tahull M, Virgili Casas N, Elguezabal Sangrador G, Faz Méndez C, Herrero Meseguer I, et al. Hospital malnutrition screening at admission: malnutrition increases mortality and length of stay. Nutr Hosp. 2017;34:907-13.
6. Tangvik RJ, Tell GS, Guttormsen AB, Eisman JÁ, Henriksen A, Ninsen RM, Ranhoff AH. Nutritional risk profile in a university hospital population. Clin Nutr. 2015;34:705-11.
7. World Health Organization (WHO). Obesity: Preventing and managing the global epidemic - Report of a WHO Consultation on obesity. Geneva: WHO, 1998.
8. Lipschitz DA. Screening for nutritional status in the elderly. Prim Care. 1994;22:55-67.9. Frisancho AR. Anthropometric standards for the assessment of growth and
nutritional status. Michigan: The University of Michigan Press; 1990.10. Burr ML, Phillips MK. Anthropometric norms in the elderly. J Nutr. 1984;51:165-9.11. World Health Organization. Physical status: the use and interpretation of an-
thropometry: report of a WHO Expert Committee. Geneva: WHO; 1995.12. Calixto-Lima L, Reis NT. Interpretação de exames laboratoriais aplicados à
nutrição. Ed. Rubio. Rio de Janeiro. 2012.13. Kondrup J, Allison SP, Elia M, Vellas B, Plauth M. ESPEN guidelines for nutrition
screening 2002. Clin Nutr. 2003;22:415-21.14. Kondrup J, Rasmussen HH, Hamberg O, Stanga Z, ESPEN Working Group.
Nutritional risk screening (NRS 2002): a new method based on a analysis of controlled clinical trials. Clin Nutr. 2003;22:321-36.
15. Detsky AS, McLaughlin JR, Baker JP, Johnston N, Whittaker S, Mendelson RA, Jeejeebhoy KN. What is subjective global assessment of nutritional status? JPEN. 1987;11:8-13.
16. Guigoz Y, Garry JP. Mini nutritional assessment: A practical assessment tool for grading the nutritional state of elderly patients. Facts and Research in Gerontology 1994; Supplement (2):15-59.
17. Mimiran P, Hosseinpour-Niazi S, Mehrabani HH, Kavian F, Azizi F. Validity and reliability of a nutrition screening tool in hospitalized patients. Nutrition. 2011;27:647-52.
18. Pourhassan M, Böttger S, Janssen G, Sieske L, Wirth R. The association of in-flammation with food intake in older hospitalized patients. J Nutr Health Aging. 2018;22:589-93.
19. Harris JA, Benedict FG. A biometric study of basal metabolism in man. Wash-ington, DC: Carnegie Institute of Washington, Publication nº 279, 1919.
20. SAS System for Windows (Statistical Analysis System), version 9.4. SAS Institute Inc, 2002-2012, Cary, NC, USA.
21. Conover WJ. (1971). Practical Nonparametric Statistics. John Wiley & Sons Inc. New York.
22. Tabachnick BG & Fidell LS. (2001). Using Multivariate Statistics. Boston: Allyn and Bacon, 4th ed, pp 966.
23. Borek P, Chmielewski M, Małgorzewicz S, Dębska Ślizień A. Analysis of Out-comes of the NRS 2002 in Patients Hospitalized in Nephrology Wards. Nutrients. 2017;9. doi: 10.3390/nu9030287.
24. Wang F, Chen W, Bruening KS, Raj S, Larsen DA. Nutrition Screening Tools and the Prediction of Clinical Outcomes among Chinese Hospitalized Gastrointestinal Disease Patients. PLoS One 2016;11:e0159436.
25. Bolayir B, Arik G, Yeşil Y, Kuyumcu ME, Varan HD, Kara Ö, Güngör AE, Yavuz BB, Cankurtaran M, Halil MG. Validation of Nutritional Risk Screening-2002 in a hospitalized adult population. Nutr Clin Pract. 2018;30. doi: 10.1002/ ncp.10082.
26. Zhu M, Wei J, Chen W, Yang X, Cui H, Zhu S; Ad hoc Working Group. Nu-tritional risk and nutritional status at admission and discharge among Chinese hospitalized patients: a prospective, nationwide, multicenter study. J Am Coll Nutr. 2017;36:357-63.
Leandro-Merhi VA, Costa CL, Saragiotto L, Aquino JLB. Indicadores nutricionais de desnutrição em pacientes hospitalizados. Arq Gastroenterol. 2019;56(4):447-50.RESUMO – Contexto – A desnutrição está associada a fatores clínicos, incluindo maior tempo de internação, aumento da morbimortalidade e custos
hospitalares. Objetivo – Investigar a prevalência de desnutrição por diferentes indicadores nutricionais e identificar fatores que contribuem para a desnu-trição em pacientes hospitalizados. Métodos – Investigou-se indicadores antropométricos, laboratoriais, nutritional risk screening, avaliação subjetiva global (ASG), mini avaliação nutricional e consumo energético habitual (CEH). Utilizou-se os testes qui-quadrado, exato de Fisher, Mann-Whitney e análise de regressão de Cox univariada e múltipla, com nível de significância de 5%. Resultados – Verificou-se 21,01% de desnutridos pela ASG; 34,78% com risco nutricional pelo NRS e 11,59% com baixo peso pelo índice de massa corporal (IMC). Não houve diferença estatisticamente signi-ficante da prevalência de desnutrição pela ASG (P=0,3344) e de risco nutricional pelo NRS (P=0,2286), entre os tipos de doenças. Os pacientes com risco nutricional apresentaram maior mediana de idade (64,5 vs 58,0 anos; P=0,0246) e menores valores medianos no CEH (1362,1 kcal vs 1525 kcal, P=0,0030); na circunferência de panturrilha (CP) (32,0 cm vs 33,5 cm, P=0,0405); na contagem de linfócitos (CL) (1176,5 cel/mm3 vs 1760,5 cel/mm3, P=0,0095); e maior percentual de baixo peso pelo IMC (22,9% vs 5,6%; P=0,0096). A CL foi associada ao risco nutricional (P=0,0414; HR=1,000; IC95%= 0,999; 1,000). Conclusão – O NRS foi mais sensível que outros indicadores no diagnóstico de desnutrição. Pacientes com risco apresentaram mais idade e valores menores de CEH, CP, IMC e CL. A baixa CL foi considerada fator associado ao risco nutricional pelo NRS.
DESCRITORES – Indicadores básicos de saúde. Desnutrição. Avaliação nutricional. Estado nutricional.

AHEAD OF PRINTLETTER TO EDITOR
Arq Gastroenterol • 2019. v. 56 nº 4 out/dez • 451
Dear Editor, we read the publication on “Association of TNF-α-308G>A polymorphism with susceptibility to celiac dis-ease: a systematic review and meta-analysis” with a great interest(1). Aflatoonian et al. concluded that “the TNF-α-308G>A poly-morphism plays an important role in celiac disease susceptibility. However, our results are still needed to strengthen by further studies in different ethnicities and larger sample sizes(1)”. We would like to share ideas on this report. First, it is agreeable that a larger sample sizes of subjects are require to strength the conclusion. Neverthe-less, we should not forget to recognize the effect of other genetic polymorphisms that might result in susceptibility to celiac disease (such as 174 G/C and -572 G/C of IL-6 gene polymorphisms(2)).
Association of TNF-α-308G>A polymorphism and celiac disease
Beuy JOOB1 and Viroj WIWANITKIT2
Received 3/7/2019Accepted 16/8/2019
Declared conflict of interest of all authors: noneDisclosure of funding: no funding received1 Sanitation 1 Medical Academic Center, Bangkok, Thailand. Orcid: 0000-0002-5281-0369. 2 Honorary professor, dr DY Patil University, Pune, India. Orcid: 0000-0003-1039-3728.Corresponding author: Beuy Joob. E-mail: [email protected]
In fact, the genetic change from G to A can result in alteration of molecular structure. If we apply molecular quantum calculation to assess the molecular change, according to methods used in the previous referencing studies(3-5), the molecular weight at variant position due to G to A genetic variation decreases up to 16 g/Mol (from 151.13 to 135.13 g/Mol) This means the required number of molecule per final phenotypic expression of TNF- α in A allele is less. Since TNF-α is well-described for its immunopathogenic role, enhancing the IFN-gamma-induced increase of HLA-class II expression on surface enterocytes in celiac disease, the more expression per Mol in A allele can explain an increased risk in TNF-α-308G>A polymorphism.
AG-2019-96dx.doi.org/10.1590/S0004-2803.201900000-75
REFERENCES
1. Aflatoonian M, Moghimi M, Akbarian-Bafghi MJ, Morovati-Sharifabad M, Jarahzadeh MH, Neamatzadeh H. Association of TNF- α-308G>A polymorphism with susceptibility to celiac disease: a systematic review and meta-analysis. Arq Gastroenterol. 2019;56:88-94.
2. Barartabar Z, Nikzamir A, Sirati-Sabet M, Aghamohammadi E, Chaleshi V, Nejad MR, Asadzadeh-Aghdaei H, Reza Zali M. The relationship between 174 G/C and -572 G/C of IL-6 gene polymorphisms and susceptibility of celiac disease in the Iranian population. Prz Gastroenterol. 2018;13:293-8.
3. Joob B, Wiwanitkit V. Interleukin-2-330T/G and Interleukin-10-1082A/G Genetic Polymorphisms and B-Cell Non-Hodgkin Lymphoma. Turk J Haematol. 2018;35:301-2.4. Joob B, Wiwanitkit V. Methylenetetrahydrofolate reductase C677T polymorphism and diabetic retinopathy. Ophthalmic Genet. 2018;39:414.5. Joob B, Wiwanitkit V. ATP-binding cassette, sub-family B (MDR/TAP), member 1 (ABCB1) polymorphism and clopidogrel concentration in acute coronary syndrome:
molecular change can explain the observed therapeutic concentration. Anatol J Cardiol. 2016;16:303-4.

AHEAD OF PRINTLETTER TO EDITOR
452 • Arq Gastroenterol • 2019. v. 56 nº 4 out/dez
Dear Sir,
We have read with great interest the article “Predictors of un-successful of treatment for fecal incontinence biofeedback for fecal incontinence in female” by Murad-Regadas SM et al.(1). We congratu-late the journal and the Authors for the publication of a paper on the indications, outcomes and modality of biofeedback treatment in patients with fecal incontinence. In the article, the Authors un-derlined and discussed the several causes of fecal incontinence, such as anatomical causes, sphincteral damage, neurological dysfunction and idiopathic disease, and moreover, admirably highlighted the potential predictive factors of efficacy of biofeedback treatment. Murad-Regadas and colleagues, as commonly happens, stratified patients on the basis of a clinical score (Clevaland Clinic Fecal Incontinence score), assigned them a continence level and selected patients to candidate to rehabilitative treatment as biofeedback.
It is well known that biofeedback treatment allows, through a probe, a device and a dedicated monitor, the visualization and representation of the contraction and relaxation activity of the anal sphincter. It is worth to comment that, before beginning any kind of biofeedback or rehabilitative treatment, the physicians have to assess and verify the patient’ proprioceptive consciousness of the anal sphincter, namely the capacity of select it for the contraction. The authors, in their coloproctological evaluation, along with the Clevaland Clinic Fecal Incontinence score, considered the anam-nesis of previous anal surgery, of hysterectomy and of previous vaginal deliveries; all predictive factors influencing the effectiveness of the rehabilitative treatment.
Summarily, in the paper is reported that all patients were in-formed about the objective of biofeedback and of anatomy of the pelvic floor. Even though a such pretreatment teaching session, as reported by the Authors, is commendable and desirable, often it is not enough. The physicians, in fact, should assess the level of patients ‘acquisition of this fundamental information. The mere description of the anatomy and physiology of anal canal, i.e. that the anal sphincter contraction and relaxation obstruct and promote defecation respectively, does not imply a full comprehension and acquisition of the information. In this setting, it is of paramount
Predictive parameters to identify incontinent patients amenable for rehabilitation treatment: the muscular synergies evaluation
Claudio GAMBARDELLA1,2, Luigi BRUSCIANO1, Gianmattia DEL GENIO1, Salvatore TOLONE1, Gianmattia TERRACCIANO1, Giorgia GUALTIERI1, Francesco Saverio LUCIDO1 and Ludovico DOCIMO1
Received 31/7/2019Accepted 5/8/2019
Declared conflict of interest of all authors: noneDisclosure of funding: no funding received1 University of Campania “Luigi Vanvitelli”, XI Division of General, Mini-invasive and Obesity Surgery, Naples, Italy. 2 University of Campania “Luigi Vanvitelli”, Department of Cardiothoracic Sciences, Naples, Italy. Corresponding author: Claudio Gambardella. E-mail: [email protected]
importance to assess the proctological patient in a broader con-ception: the clinical-physiatric evaluation(2). One of its key tool is the evaluation of the muscular synergies. This latter test assesses properly the patient’ acquisition and the ability to put into practice of the abovementioned anatomical and functional information. In case of request of anal sphincter contraction, in fact, the recruit-ment of agonist muscles, such as the gluteus and abductor groups, can be caused by the patient’s incapacity to selectively recruit the correct muscles for the requested order. Vice versa, the identifica-tion of antagonist muscles (abdominals muscles) during the anal sphincter contraction phase represents even a conflict between the abdominal and perineal muscles(3). Therefore, in case of patient’ inability of anal contraction, the mere explanations of anatomy and physiology of pelvic floor is reductive.
In the mentioned paper, almost the 50% of patients failed the biofeedback treatment, but the Authors not wondered whether the patients, before beginning the rehabilitative treatment, have reached an adequate selectivity of contraction or have acquired a correct knowledge of the anatomical and physiological notions. Probably, in case of presence of muscular synergies without selec-tive contraction of anal sphincter, a high percentage of the failed patients would have benefited in a previous electrostimulation treatment in order to acquire consciousness and sensitization of the patient to the anal area, or simply the effect of intervening per se, as suggested by Kamm et al.(4)
Rehabilitation treatment should start with a patient’s re-edu-cational phase, in order to clearly explain and clarify that chest, abdomen, vertebral column and perineum acts as different parts of a same whole (an imaginary cuboid), in patients with defeca-tion disorders(5). Therefore, in this setting, the abovementioned abnormal concomitant contraction of abdominal muscles, during anal sphincter contraction, is the demonstration that distant areas from pelvic floor contribute to its function, and physicians and patients should necessary think and imagine the human body in a unitary way. This clinical-physiatric approach aims to improve an altered bodily function; it is not merely cognitive, while it prepares the patient toward an active, rather than a passive, role with a deep participation during the healing process.
AG-2019-111dx.doi.org/10.1590/S0004-2803.201900000-76

Gambardella C, Brusciano L, del Genio G, Tolone S, Terracciano G, Gualtieri G, Lucido FS, Docimo L.Predictive parameters to identify incontinent patients amenable for rehabilitation treatment: the muscular synergies evaluation
Arq Gastroenterol • 2019. v. 56 nº 4 out/dez • 453
In conclusion, along with the predictive reported factors of the study, before start any kind of rehabilitative treatment for incontinence, the evaluation of muscular synergies should not be neglected since it might be considered one of the most important predictive parameters of success of the therapy.
Authors’ contributionGambardella C participated substantially in the drafting and
editing of the manuscript. All authors contributed significantly to the present research and reviewed the entire manuscript.
OrcidClaudio Gambardella. Orcid: 0000-0003-2277-2960.Luigi Brusciano. Orcid: 0000-0003-4112-1282.Gianmattia del Genio. Orcid: 0000-0001-5603-8970.Salvatore Tolone. Orcid: 0000-0002-1653-9903.Gianmattia Terracciano. Orcid: 0000-0002-3759-1583.Giorgia Gualtieri. Orcid: 0000-0002-9591-1856.Francesco Saverio Lucido. Orcid: 0000-0002-8778-4690.Ludovico Docimo. Orcid: 0000-0001-5587-9452.
REFERENCES
1. Murad-Regadas SM, Regadas FSP, Regadas Filho FSP, Mendonça Filho JJ, Andrade Filho RS, Vilarinho ADS. Predictors of unsuccessful of treatment for fecal Incon-tinence biofeedback for fecal incontinence in female. Arq Gastroenterol. 2019 May 20;56(1):61-65. doi: 10.1590/S0004-2803.201900000-17.
2. Brusciano L, Limongelli P, del Genio G, Rossetti G, Sansone S, Healey A, Maffettone V, Napolitano V, Pizza F, Tolone S, del Genio A (2009) Clinical and instrumental parameters in patients with constipation and incontinence: their potential implications in the functional aspects of these disorders. Int J Colorectal Dis 24:961-967.
3. Brusciano L, Limongelli P, del Genio G, Di Stazio C, Rossetti G, Sansone S, Tolone S, Lucido F, D’Alessandro A, Docimo G, Docimo L (2013) Short-term outcomes after rehabilitation treatment in patients selected by a novel rehabilitation score system (Brusciano score) with or without previous stapled transanal rectal resection (STARR) for rectal outlet obstruction. Int J Colorectal Dis 28(6):783-789.
4. Norton C, Gibbs A, Kamm MA. Randomized, controlled trial of anal electrical stimulation for fecal incontinence. Dis Colon Rectum. 2006 Feb;49(2):190-6. 5. Brusciano L, Gambardella C, Tolone S, Del Genio G, Terracciano G, Gualtieri G, Schiano di Visconte M, Docimo L. An imaginary cuboid: chest, abdomen, vertebral
column and perineum, different parts of the same whole in the harmonic functioning of the pelvic floor. Tech Coloproctol. 2019 May 7. doi: 10.1007/s10151-019-01996-x. [Epub ahead of print] PubMed PMID: 31065825.
AHEAD OF PRINTLETTER TO EDITOR
454 • Arq Gastroenterol • 2019. v. 56 nº 4 out/dez
We read with keen interest the paper on abdominal tuber-culosis by Udgirkar and colleagues where the authors reported a large number of patients with abdominal tuberculosis from Western India(1).
This report is one of the few reports which have highlighted the use of GeneXpert for diagnosis of abdominal tuberculosis. Previous reports have suggested that the positivity of GeneXpert in intestinal tuberculosis to be 8% and 32% respectively(2,3). Bellam et al. also found one patient to have rifampin resistance amongst their cases(3). As per the findings reported by Udgirkar et al.,
GeneXpert for abdominal tuberculosis
Alka SHARMA
Received 5/9/2019Accepted 12/9/2019
Declared conflict of interest of author: none Disclosure of funding: no funding receivedAtal Bihari Vajpayee Institute of Medical Sciences and Dr RML Hospital, Department of Medicine, Delhi, India.Corresponding author: Alka Sharma. E-mail: [email protected]. Orcid: 0000-0002-4496-2522.
GeneXpert was positive in 26% of patients. The report includes a mixture of cases of peritoneal and intestinal tuberculosis and the sensitivity of GeneXpert is likely to vary in these two settings. The authors report that none of the ascitic fluid samples were positive. Interestingly, a Cochrane review combining 20 studies has reported the sensitivity of Gene Xpert in peritoneal fluid to be 50%(4). It is unclear why the sensitivity was so low in the present study. Also it would be worthwhile to know the sensitivity in the intestinal tis-sue samples and the therapeutic approach to patients who tested positive for rifampin resistance.
AG-2019-128dx.doi.org/10.1590/S0004-2803.201900000-82
REFERENCES
1. Udgirkar S, Jain S, Pawar S, Chandnani S, Contractor Q, Rathi P. Clinical profile, drug resistance pattern and treatment outcomes of abdominal tuberculosis patients in western india. Arq Gastroenterol. 2019;56:178-83.
2. Kumar S, Bopanna S, Kedia S, Mouli P, Dhingra R, Padhan R, et al. Evaluation of Xpert MTB/RIF assay performance in the diagnosis of abdominal tuberculosis. Intest Res. 2017;15:187-94.
3. Bellam BL, Mandavdhare HS, Sharma K, Shukla S, Soni H, Kumar-M P, et al. Utility of tissue Xpert-Mtb/Rif for the diagnosis of intestinal tuberculosis in patients with ileocolonic ulcers. Ther Adv Infect Dis. 2019;6:2049936119863939.
4. Kohli M, Schiller I, Dendukuri N, Dheda K, Denkinger CM, Schumacher SG, et al. Xpert(®) MTB/RIF assay for extrapulmonary tuberculosis and rifampicin resistance. Cochrane Database Syst Rev. 2018;8:CD012768.

Untitled-3 1 31/05/12 17:57

SET/
2017
6
1679
07 -
RX
– RE
VIST
A AR
QUIV
. DE
GAST
RO E
D.04
/201
7
BR/
GAI/1
611/
0003
c