Biomarcadores e Imunoterapia:
além do PD-L1
Luiz Henrique Araujo, MD, PhD
Instituto COI de Educação e Pesquisa
Instituto Nacional do Câncer (INCA)
Sumário
• Introdução
• Expressão tumoral de PD-L1
• Carga mutacional
• Perfil mutacional
• Outros biomarcadores
• Conclusões

Sumário
• Introdução
• Expressão tumoral de PD-L1
• Carga mutacional
• Perfil mutacional
• Outros biomarcadores
• Conclusões
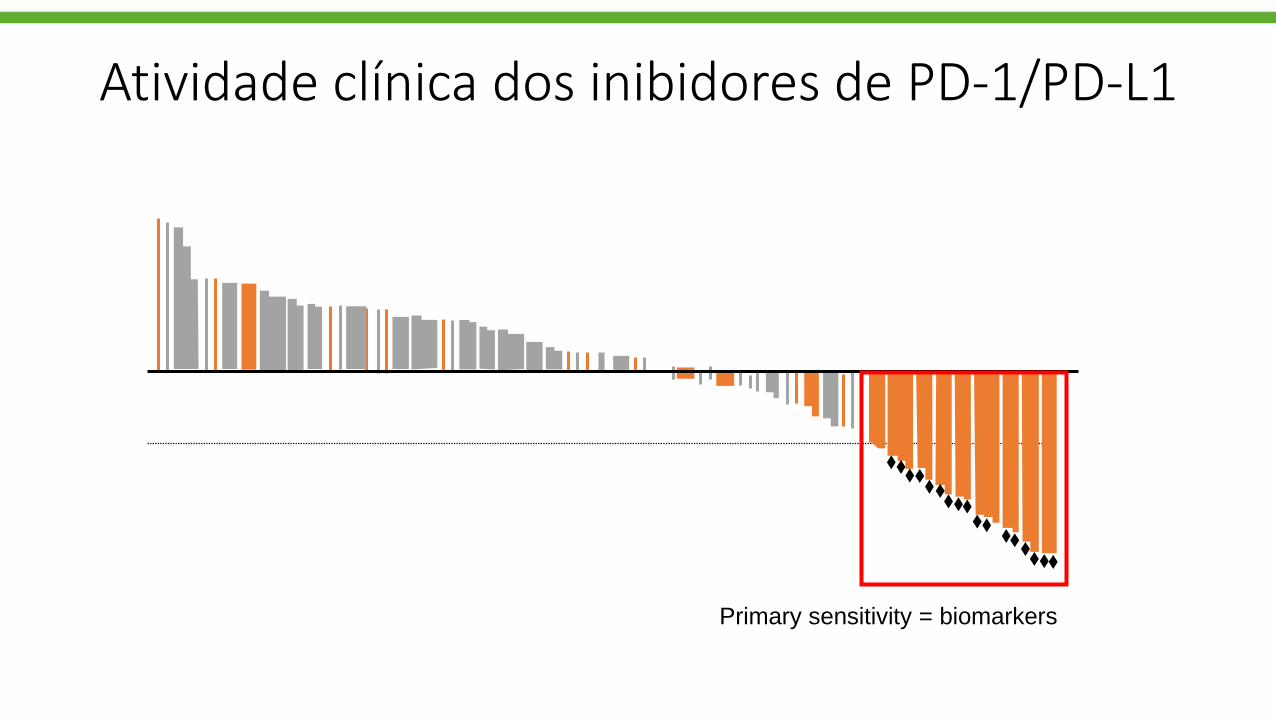
Primary sensitivity = biomarkers
Atividade clínica dos inibidores de PD-1/PD-L1

Supervisão imunológica contra o câncer
Imagem adaptada de Mellman I et al.¹
APC = células apresentadoras de antígenos; MHC = complexo principal de histocompatibilidade; TCR = receptor dos linfócitos T.
1. Mellman I et al. Nature. 2011;480(7378):480-489. 2. Dunn GP et al. Nat Immunol. 2002;3(11):991-998.
MHC
APC
TCR
Células T
Célula tumoral
Antígeno específico ao tumor
Microambiente tumoralTecido linfóide
Ativação e expansão clonal
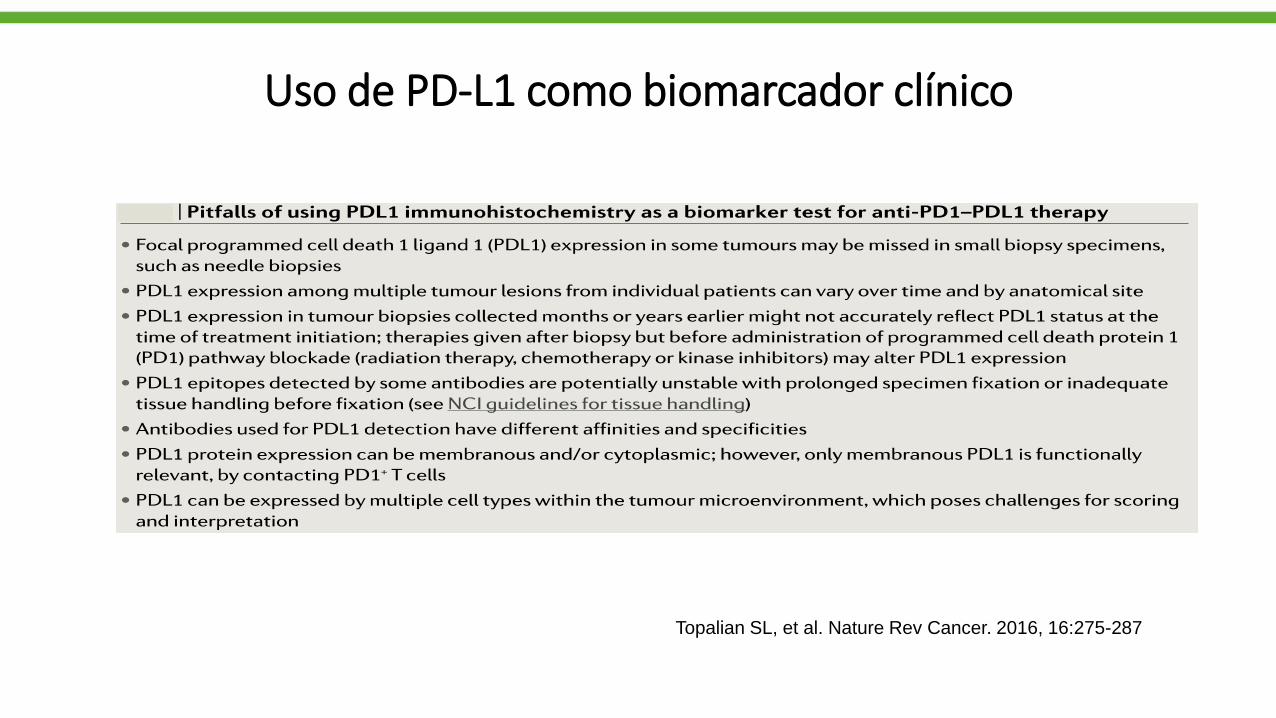
Uso de PD-L1 como biomarcador clínico
Topalian SL, et al. Nature Rev Cancer. 2016, 16:275-287
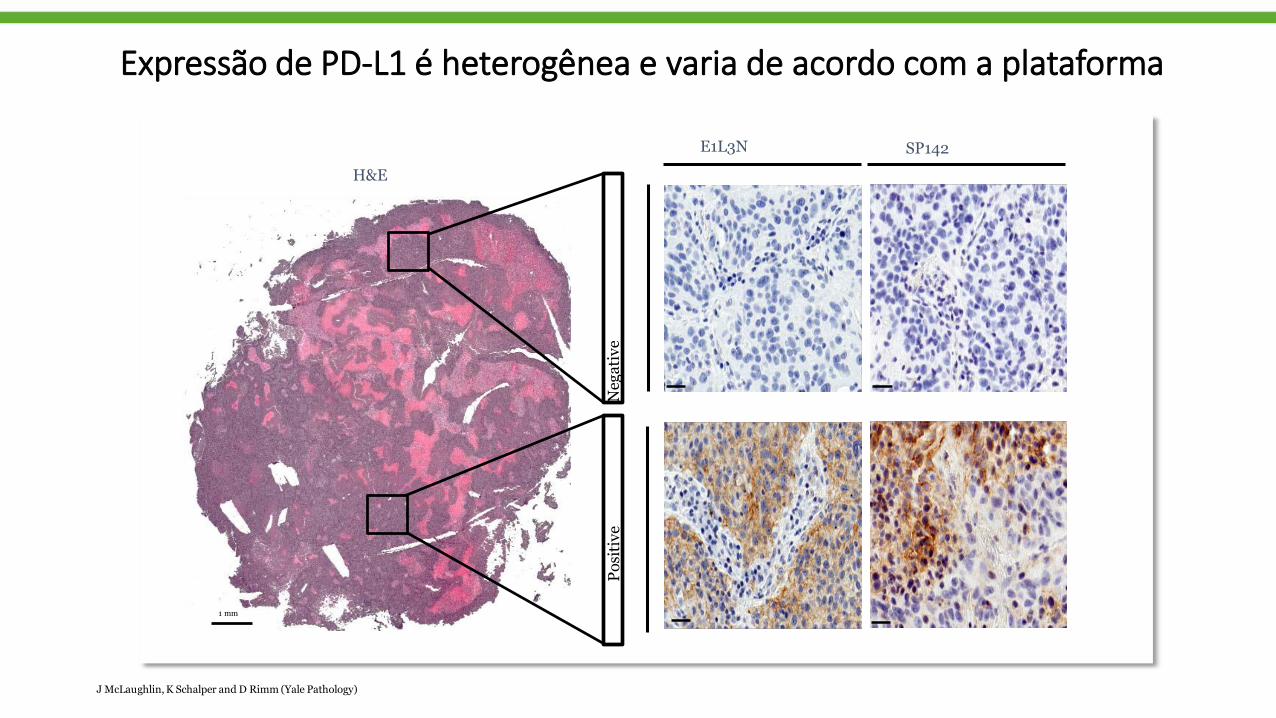
Expressão de PD-L1 é heterogênea e varia de acordo com a plataforma
E1L3N SP142
Negative
Positive
1 mm
H&E
JMcLaughlin,K Schalper and D Rimm (Yale Pathology)

DrugPD-L1 IHC
AssayPD-L1 scoring
Cut-offs reported in
clinical trials
FDA Diagnostic
Status
Nivolumab 28-8 Tumor cells 1%, 5%, 10% Complementary
Pembrolizumab 22C3 Tumor cells (TPS) 1%, 50% Companion
Atezolizumab SP142Tumor cells (TC) 1%, 5%, 50%
ComplementaryImmune cells (IC) 1%, 5%, 10%
Durvalumab SP263 Tumor cells 25% Unknown
Avelumab 73-10 Tumor cells 1%, 50%, 80% Unknown
TPS: tumor proportional score; TC: staining on tumor cell; IC: staining on immune cells
Diferentes anticorpos e plataformas

BLUEPRINT-2: Comparação entre 5 ensaios
Each circle represents the mean of all scores (glass slide & digital combined)
SP142
28-8H & E
73-10
22C3
SP263
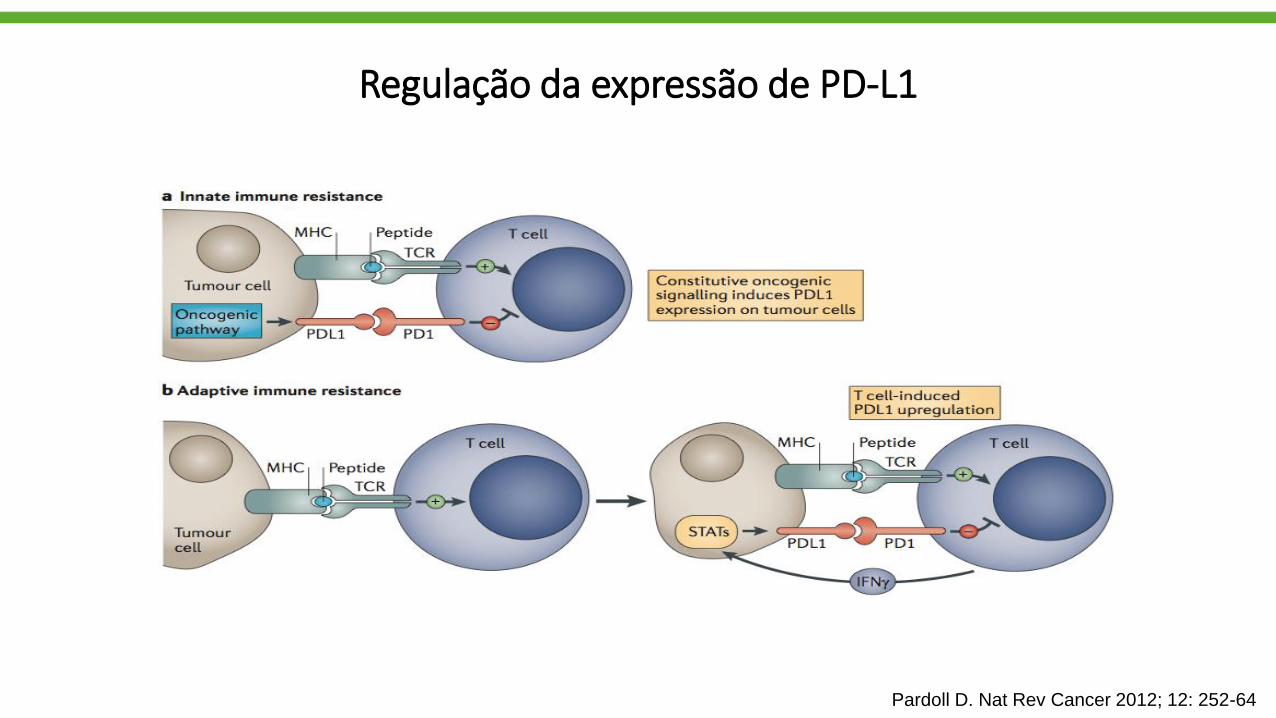
Regulação da expressão de PD-L1
Pardoll D. Nat Rev Cancer 2012; 12: 252-64

SG com pembrolizumabe em CPNPC avançado
Fase 2/3 (KEYNOTE-010)
Roy S. Herbst, presented at ESMO ASIA 2015; Lancet 2015
Median OS Pembro PDL1 ≥ 50% = 14.9 and 17.3 mo Median OS Pembro PDL ≥ 1% = 10.4 and 12.7 mo
2 vs 10 mg/kg: HR 1.122 vs 10 mg/kg: HR 1.17
Pembro 10 mg/kg
Docetaxel
Pembro 2 mg/kg
Pembro 10 mg/kg
Docetaxel
Pembro 2 mg/kg
1-yr OS rate = 34.6%
1-yr OS rate = 52.3%
1-yr OS rate = 43.2%
Inclusion criteria: PD-L1 TPS ≥1%

1. Reck M et al. N Engl J Med. 2016; DOI: 10.1056/NEJMoa160677.
2. Reck M et al. Ann Oncol. 2016;27(suppl 6):LBA8 PR.
3. Keytruda [package insert]. Kenilworth, NJ, USA: Merck Sharp & Dohme Corp.; 2016.
Data cutoff date: May 9, 2016.
From the N Engl J Med. Reck,M. et al. Pembrolizumab versus chemotherapy for PD-L1–positive non– small-
cell lung cancer. 2016;375:1823-1833. 2016 Massachusetts Medical Society. Adapted with permission from
Massachusetts Medical Society.
• KEYNOTE-024 (NCT02142738) demonstrated that pembrolizumab had superior efficacy over platinum-based chemotherapy as first-line therapy for
patients with advanced NSCLC with PD-L1 TPS ≥50%1,2
JR Brahmer, WCLC 2017
KEYNOTE-024 (NCT02142738): Efficacy Outcomes
Sumário
• Introdução
• Expressão tumoral de PD-L1
• Carga mutacional
• Perfil mutacional
• Outros biomarcadores
• Conclusões
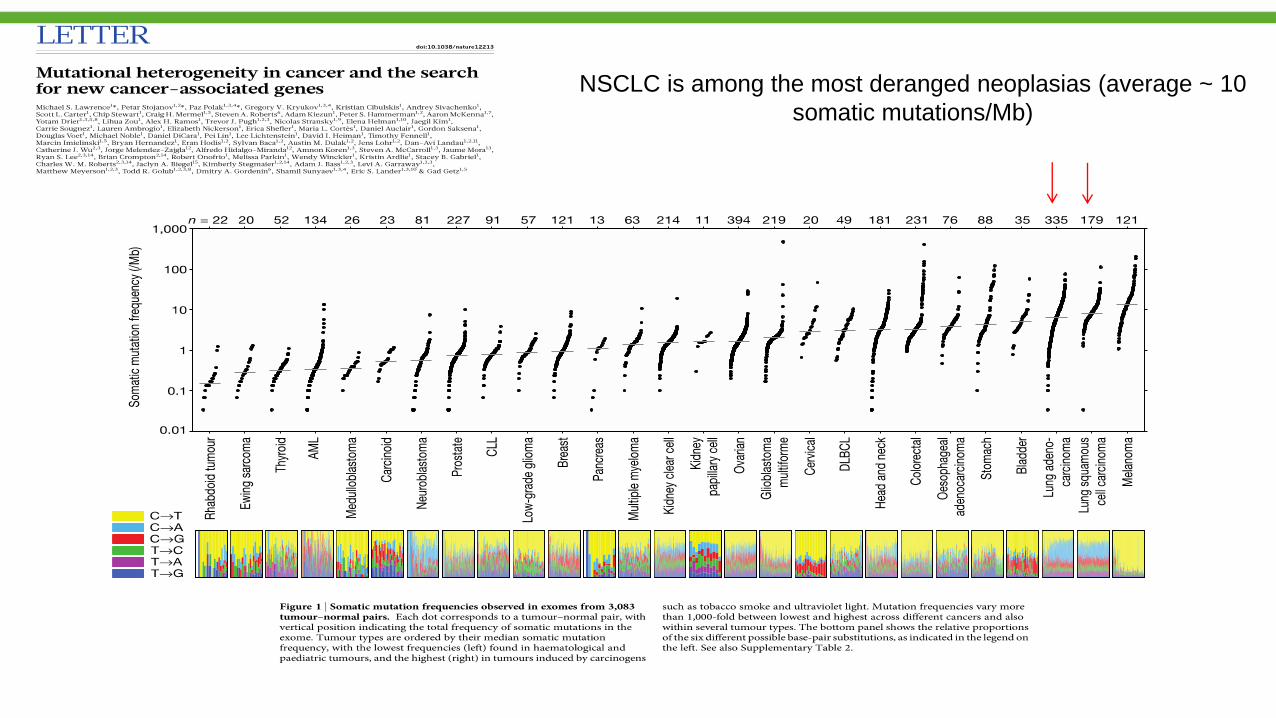
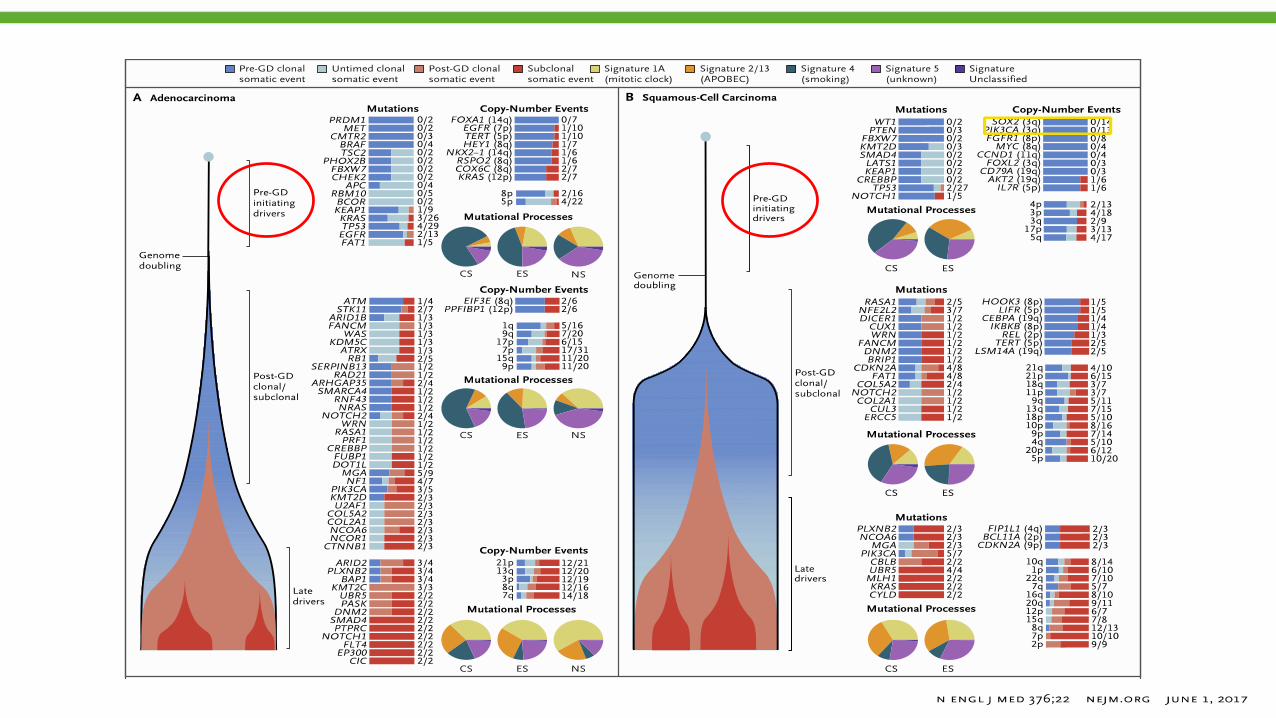
NSCLC is among the most deranged neoplasias (average ~ 10
somatic mutations/Mb)
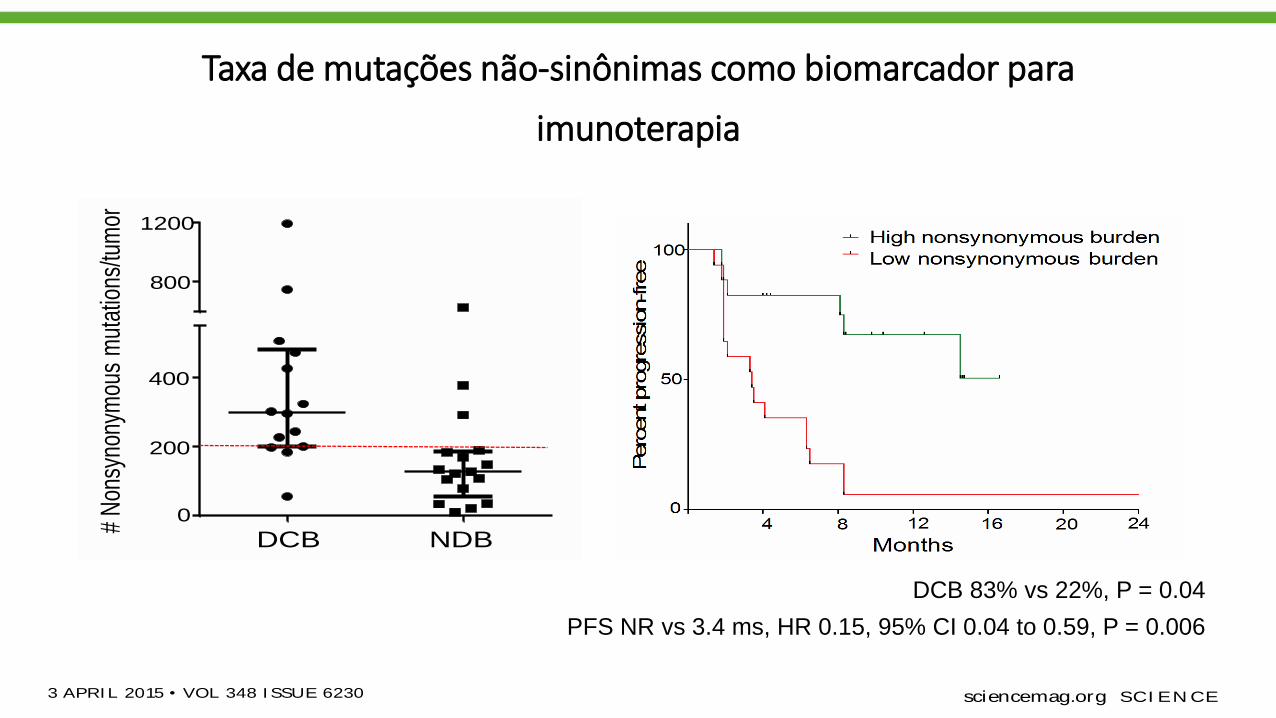
Taxa de mutações não-sinônimas como biomarcador para
imunoterapia
CANCER IMMUNOLOGY
Mutational landscapedeterminessensitivity toPD-1blockadeinnon–small cell lungcancerNaiyer A. Rizvi ,1,2*† M atthew D. Hellmann,1,2* Alexandra Snyder,1,2,3* Pia Kvistbor g,4
Vladimir M akarov,3 Jonathan J. Havel,3 W ill iam Lee,5 Jianda Yuan,6 Phi ll ip W ong,6
Teresa S. Ho,6 M artin L. M i ller,7 Natasha Rekhtman,8 Andre L. M oreira,8
Fawzia I brahim,1 Cameron Bruggeman,9 Bi llel Gasmi,10 Rober ta Zappasodi ,10
Yuka M aeda,10 Chr is Sander,7 Edward B. Garon,11 Taha M erghoub,1,10
Jedd D. W olchok,1,2,10 Ton N. Schumacher,4 Timothy A. Chan2,3,5‡
Immune checkpoint inhibitors, which unleash a patient ’s own T cells to kill tumors, are
revolut ionizing cancer treatment. To unravel the genomic determinants of response
to this therapy, we used whole-exome sequencing of non–small cell lung cancers treated
with pembrolizumab, an antibody targeting programmed cell death-1 (PD-1). In two
independent cohorts, higher nonsynonymous mutation burden in tumors was associated
with improved objective response, durable clinical benefit , and progression-free survival.
Efficacy also correlated with the molecular smoking signature, higher neoantigen
burden, and DNA repair pathway mutations; each factor was also associated with mutation
burden. In one responder, neoant igen-specific CD8+ T cell responses paralleled tumor
regression, suggest ing that ant i–PD-1 therapy enhances neoantigen-specif ic T cell
reactivity. Our results suggest that the genomic landscape of lung cancers shapes
response to ant i–PD-1 therapy.
Today, more than a century since the initial
observation that the immune system can re-
ject human cancers (1), immune checkpoint
inhibitorsaredemonstrating that adaptive
immunity can be harnessed for the treat-
ment of cancer (2–7). In advanced non–small cell
lung cancer (NSCLC), therapies with an antibody
targetingprogrammed cell death-1(anti–PD-1) dem-
onstrated response ratesof 17to 21%, with some
responses being remarkably durable (3, 8).
Understanding the molecular determinants of
response to immunotherapies such as anti–PD-1
therapy is one of the critical challenges in oncol-
ogy. Among the best responses have been in
melanomas and NSCLCs, cancers largely caused
by chronic exposure to mutagens [ultraviolet light
(9) and carcinogens in cigarette smoke (10), re-
spectively]. However, there is a large variability
in mutation burden within tumor types, ranging
from 10sto 1000sof mutations(11–13). Thisrange
is particularly broad in NSCLCs because tumors
in never-smokers generally have few somatic mu-
tations compared with tumors in smokers (14).
We hypothesized that the mutational landscape
of NSCLCs may influence response to anti–PD-1
therapy. To examinethishypothesis, wesequenced
the exomes of NSCLCs from two independent
cohorts of patients treated with pembrolizumab,
a humanized immunoglobulin G (IgG) 4-kappa
isotype antibody to PD-1(n = 16 and n = 18, re-
spectively), and their matched normal DNA (fig.
S1and table S1) (15).
Overall, tumor DNAsequencinggenerated mean
target coverage of 164x, and a mean of 94.5%of
the target sequence wascovered to a depth of at
least 10x; coverage and depth were similar be-
tween cohorts, as well as between those with or
without clinical benefit (fig. S2). We identified a
median of 200 nonsynonymous mutations per
sample(range11to 1192). Themedian number of
exonic mutations per sample was 327 (range 45
to 1732).Thequantity and rangeof mutationswere
similar to published series of NSCLCs (16, 17)
(fig. S3). Thetransition/transversion ratio (Ti/Tv)
was 0.74 (fig. S4), also similar to previously de-
scribed NSCLCs (16–18). To ensureaccuracy of our
sequencing data, targeted resequencing with an
orthogonal method (Ampliseq) was performed
using 376 randomly selected variants, and muta-
tionswereconfirmed in 357of thosevariants (95%).
Higher somatic nonsynonymous mutation
burden was associated with clinical efficacy of
pembrolizumab. In the discovery cohort (n = 16),
the median number of nonsynonymous muta-
tions was 302 in patients with durable clinical
benefit (DCB) (partial or stable response lasting
>6 months) versus 148 with no durable benefit
(NDB) (Mann-Whitney P= 0.02) (Fig. 1A). Seventy-
three percent of patients with high nonsynon-
ymous burden (defined as above the median
burden of thecohort, 209) experienced DCB, com-
pared with 13% of those with low mutation bur-
den (below median) (Fisher’sexact P= 0.04). Both
confirmed objective response rate (ORR) and
progression-free survival (PFS) were higher in
patients with high nonsynonymousburden [ORR
63% versus 0%, Fisher’s exact P = 0.03; median
PFS14.5 versus 3.7 months, log-rank P = 0.01;
hazard ratio (HR) 0.19, 95%confidence interval
(CI) 0.05 to 0.70] (Fig. 1B and table S2).
Thevalidation cohort included an independent
set of 18 NSCLC samples from patients treated
with pembrolizumab. The clinical characteristics
were similar in both cohorts. The median non-
synonymous mutation burden was 244 in tu-
mors from patients with DCB compared to 125
in those with NDB (Mann-Whitney P = 0.04)
(Fig. 1C). The ratesof DCB and PFSwere again sig-
nificantly greater in patients with a nonsynon-
ymous mutation burden above 200, the median
of the validation cohort (DCB 83% versus 22%,
Fisher’sexact P= 0.04; median PFSnot reached
versus 3.4 months, log-rank P = 0.006; HR 0.15,
95% CI 0.04 to 0.59) (Fig. 1D and table S2).
In the discovery cohort, there was high con-
cordancebetween nonsynonymousmutation bur-
den and DCB, with an area under the receiver
operator characteristic (ROC) curve(AUC) of 87%
(Fig. 1E). Patients with nonsynonymous muta-
tion burden ≥178, the cut point that combined
maximal sensitivity with best specificity, had a
likelihood ratio for DCB of 3.0; the sensitivity
and specificity of DCB using this cut point was
100%(95%CI 59 to 100%) and 67%(29 to 93%),
respectively. Applying this cut point to the
validation cohort, the rate of DCB in patients
with tumorsharboring≥178 mutationswas75%
compared to 14% in those with <178, corre-
sponding to a sensitivity of 86% and a specific-
ity of 75%.
There were few but important exceptions. Five
of 18 tumors with ≥178 nonsynonymous muta-
tions had NDB, and one tumor with a very low
burden (56 nonsynonymous mutations) responded
to pembrolizumab. However, this response was
transient, lasting 8 months. Acrossboth cohorts,
thiswas theonly patient with a tumor mutation
burden <178 and confirmed objective response.
Notably, although higher nonsynonymous mu-
tation burden correlated with improved ORR,
DCB, and PFS (Fig. 1, F and G), this correlation
was less evident when examining total exonic
mutation burden (table S2).
Wenext examined all 34 exomescollectively to
determine how patterns of mutational changes
were associated with clinical benefit to pembro-
lizumab (tables S4 and S5). C-to-A transversions
were more frequent, and C-to-T transitions were
less frequent, in patients with DCB compared to
124 3 APRI L 2015 • VOL 348 I SSUE 6230 sciencemag.org SCI EN CE
1Department of Medicine, Memorial Sloan Kettering Cancer
Center, New York, NY10065, USA. 2Weill Cornell Medical
College, New York, NY, 10065, USA. 3Human Oncology and
Pathogenesis Program, Memorial Sloan Kettering Cancer
Center, New York, NY10065, USA. 4Division of Immunology,
Netherlands Cancer Institute, 1066 CX Amsterdam,
Netherlands. 5Department of Radiation Oncology, Memorial
Sloan Kettering Cancer Center, New York, NY10065, USA.6Immune Monitoring Core, Ludwig Center for Cancer
Immunotherapy, Memorial Sloan Kettering Cancer Center,
New York, NY10065, USA. 7Computation Biology Program,
Memorial Sloan Kettering Cancer Center, New York, NY
10065, USA. 8Department of Pathology, Memorial Sloan
Kettering Cancer Center, New York, NY10065, USA.9Department of Mathematics, Columbia University, New
York, NY, 10027, USA. 10Ludwig Collaborative Laboratory,
Memorial Sloan Kettering Cancer Center, New York, NY
10065, USA. 11David Geffen School of Medicine at UCLA,
2825 Santa Monica Boulevard, Suite 200, Santa Monica, CA
90404, USA.
*These authors contributed equally to this work. †Present address:
Division of Hematology/ Oncology, New York-Presbyterian/ Columbia
University, New York, NY, USA. ‡Corresponding author. E-mail:
RESEARCH | REPORTS
on
Sep
tem
ber 1
5, 2
015
ww
w.s
cien
cem
ag.o
rgD
ownl
oade
d fro
m
on
Sep
tem
ber 1
5, 2
015
ww
w.s
cien
cem
ag.o
rgD
ownl
oade
d fro
m
on
Sep
tem
ber 1
5, 2
015
ww
w.s
cien
cem
ag.o
rgD
ownl
oade
d fro
m
on
Sep
tem
ber 1
5, 2
015
ww
w.s
cien
cem
ag.o
rgD
ownl
oade
d fro
m
on
Sep
tem
ber 1
5, 2
015
ww
w.s
cien
cem
ag.o
rgD
ownl
oade
d fro
m
CANCER IMMUNOLOGY
Mutational landscapedeterminessensitivity to PD-1blockade innon–small cell lungcancerNaiyer A. Rizvi ,1,2*† M atthew D. Hellmann,1,2* Alexandra Snyder,1,2,3* Pia Kvistbor g,4
Vladimir M akarov,3 Jonathan J. Havel,3 W ill iam Lee,5 Jianda Yuan,6 Phi l l ip W ong,6
Teresa S. Ho,6 M artin L. M i l ler,7 Natasha Rekhtman,8 Andre L. M oreira,8
Fawzia I brahim,1 Cameron Bruggeman,9 Bi l lel Gasmi,10 Rober ta Zappasodi ,10
Yuka M aeda,10 Chr is Sander,7 Edward B. Garon,11 Taha M erghoub,1,10
Jedd D. W olchok,1,2,10 Ton N. Schumacher,4 Timothy A. Chan2,3,5‡
Immune checkpoint inhibitors, which unleash a patient ’s own T cells to kill tumors, are
revolut ionizing cancer treatment. To unravel the genomic determinants of response
to this therapy, we used whole-exome sequencing of non–small cell lung cancers treated
with pembrolizumab, an antibody targeting programmed cell death-1 (PD-1). In two
independent cohorts, higher nonsynonymous mutat ion burden in tumors was associated
with improved object ive response, durable clinical benefit , and progression-free survival.
Efficacy also correlated with the molecular smoking signature, higher neoantigen
burden, and DNA repair pathway mutat ions; each factor was also associated with mutat ion
burden. In one responder, neoant igen-specific CD8+ T cell responses paralleled tumor
regression, suggest ing that ant i–PD-1 therapy enhances neoantigen-specif ic T cell
reactivity. Our results suggest that the genomic landscape of lung cancers shapes
response to ant i–PD-1 therapy.
Today, more than a century since the initial
observation that the immune system can re-
ject human cancers (1), immune checkpoint
inhibitorsaredemonstrating that adaptive
immunity can be harnessed for the treat-
ment of cancer (2–7). In advanced non–small cell
lung cancer (NSCLC), therapies with an antibody
targetingprogrammed cell death-1(anti–PD-1) dem-
onstrated response rates of 17to 21%, with some
responses being remarkably durable (3, 8).
Understanding the molecular determinants of
response to immunotherapies such as anti–PD-1
therapy is one of the critical challenges in oncol-
ogy. Among the best responses have been in
melanomas and NSCLCs, cancers largely caused
by chronic exposure to mutagens [ultraviolet light
(9) and carcinogens in cigarette smoke (10), re-
spectively]. However, there is a large variability
in mutation burden within tumor types, ranging
from 10sto 1000sof mutations(11–13). Thisrange
is particularly broad in NSCLCs because tumors
in never-smokers generally have few somatic mu-
tations compared with tumors in smokers (14).
We hypothesized that the mutational landscape
of NSCLCs may influence response to anti–PD-1
therapy. To examinethishypothesis, wesequenced
the exomes of NSCLCs from two independent
cohorts of patients treated with pembrolizumab,
a humanized immunoglobulin G (IgG) 4-kappa
isotype antibody to PD-1 (n = 16 and n = 18, re-
spectively), and their matched normal DNA (fig.
S1and table S1) (15).
Overall, tumor DNA sequencinggenerated mean
target coverage of 164x, and a mean of 94.5% of
the target sequence wascovered to a depth of at
least 10x; coverage and depth were similar be-
tween cohorts, as well as between those with or
without clinical benefit (fig. S2). We identified a
median of 200 nonsynonymous mutations per
sample(range11to 1192). Themedian number of
exonic mutations per sample was 327 (range 45
to 1732). Thequantity and rangeof mutationswere
similar to published series of NSCLCs (16, 17)
(fig. S3). Thetransition/transversion ratio (Ti/Tv)
was 0.74 (fig. S4), also similar to previously de-
scribed NSCLCs (16–18). To ensure accuracy of our
sequencing data, targeted resequencing with an
orthogonal method (Ampliseq) was performed
using 376 randomly selected variants, and muta-
tionswereconfirmed in 357of thosevariants(95%).
Higher somatic nonsynonymous mutation
burden was associated with clinical efficacy of
pembrolizumab. In the discovery cohort (n = 16),
the median number of nonsynonymous muta-
tions was 302 in patients with durable clinical
benefit (DCB) (partial or stable response lasting
>6 months) versus 148 with no durable benefit
(NDB) (Mann-Whitney P= 0.02) (Fig. 1A). Seventy-
three percent of patients with high nonsynon-
ymous burden (defined as above the median
burden of thecohort, 209) experienced DCB, com-
pared with 13% of those with low mutation bur-
den (below median) (Fisher’sexact P= 0.04). Both
confirmed objective response rate (ORR) and
progression-free survival (PFS) were higher in
patients with high nonsynonymous burden [ORR
63% versus 0%, Fisher’s exact P = 0.03; median
PFS14.5 versus 3.7 months, log-rank P = 0.01;
hazard ratio (HR) 0.19, 95% confidence interval
(CI) 0.05 to 0.70] (Fig. 1B and table S2).
Thevalidation cohort included an independent
set of 18 NSCLC samples from patients treated
with pembrolizumab. The clinical characteristics
were similar in both cohorts. The median non-
synonymous mutation burden was 244 in tu-
mors from patients with DCB compared to 125
in those with NDB (Mann-Whitney P = 0.04)
(Fig. 1C). The ratesof DCB and PFSwere again sig-
nificantly greater in patients with a nonsynon-
ymous mutation burden above 200, the median
of the validation cohort (DCB 83% versus 22%,
Fisher’sexact P= 0.04; median PFSnot reached
versus 3.4 months, log-rank P = 0.006; HR 0.15,
95% CI 0.04 to 0.59) (Fig. 1D and table S2).
In the discovery cohort, there was high con-
cordancebetween nonsynonymousmutation bur-
den and DCB, with an area under the receiver
operator characteristic (ROC) curve (AUC) of 87%
(Fig. 1E). Patients with nonsynonymous muta-
tion burden ≥178, the cut point that combined
maximal sensitivity with best specificity, had a
likelihood ratio for DCB of 3.0; the sensitivity
and specificity of DCB using this cut point was
100%(95%CI 59 to 100%) and 67%(29 to 93%),
respectively. Applying this cut point to the
validation cohort, the rate of DCB in patients
with tumorsharboring ≥178 mutationswas75%
compared to 14% in those with <178, corre-
sponding to a sensitivity of 86% and a specific-
ity of 75%.
There were few but important exceptions. Five
of 18 tumors with ≥178 nonsynonymous muta-
tions had NDB, and one tumor with a very low
burden (56 nonsynonymous mutations) responded
to pembrolizumab. However, this response was
transient, lasting 8 months. Acrossboth cohorts,
thiswas theonly patient with a tumor mutation
burden <178 and confirmed objective response.
Notably, although higher nonsynonymous mu-
tation burden correlated with improved ORR,
DCB, and PFS (Fig. 1, F and G), this correlation
was less evident when examining total exonic
mutation burden (table S2).
Wenext examined all 34 exomescollectively to
determine how patterns of mutational changes
were associated with clinical benefit to pembro-
lizumab (tables S4 and S5). C-to-A transversions
were more frequent, and C-to-T transitions were
less frequent, in patients with DCB compared to
124 3 APRI L 2015 • VOL 348 I SSUE 6230 sciencemag.org SCI EN CE
1Department of Medicine, Memorial Sloan Kettering Cancer
Center, New York, NY10065, USA. 2Weill Cornell Medical
College, New York, NY, 10065, USA. 3Human Oncology and
Pathogenesis Program, Memorial Sloan Kettering Cancer
Center, New York, NY10065, USA. 4Division of Immunology,
Netherlands Cancer Institute, 1066 CX Amsterdam,
Netherlands. 5Department of Radiation Oncology, Memorial
Sloan Kettering Cancer Center, New York, NY10065, USA.6Immune Monitoring Core, Ludwig Center for Cancer
Immunotherapy, Memorial Sloan Kettering Cancer Center,
New York, NY10065, USA. 7Computation Biology Program,
Memorial Sloan Kettering Cancer Center, New York, NY
10065, USA. 8Department of Pathology, Memorial Sloan
Kettering Cancer Center, New York, NY10065, USA.9Department of Mathematics, Columbia University, New
York, NY, 10027, USA. 10Ludwig Collaborative Laboratory,
Memorial Sloan Kettering Cancer Center, New York, NY
10065, USA. 11David Geffen School of Medicine at UCLA,
2825 Santa Monica Boulevard, Suite 200, Santa Monica, CA
90404, USA.
*These authors contributed equally to this work. †Present address:
Division of Hematology/ Oncology, New York-Presbyterian/ Columbia
University, New York, NY, USA. ‡Corresponding author. E-mail:
RESEARCH | REPORTS
on
Sep
tem
ber 1
5, 2
015
ww
w.s
cien
cem
ag.o
rgD
ownl
oade
d fro
m
on
Sep
tem
ber 1
5, 2
015
ww
w.s
cien
cem
ag.o
rgD
ownl
oade
d fro
m
on
Sep
tem
ber 1
5, 2
015
ww
w.s
cien
cem
ag.o
rgD
ownl
oade
d fro
m
on
Sep
tem
ber 1
5, 2
015
ww
w.s
cien
cem
ag.o
rgD
ownl
oade
d fro
m
on
Sep
tem
ber 1
5, 2
015
ww
w.s
cien
cem
ag.o
rgD
ownl
oade
d fro
m
NDB (Mann-Whitney P = 0.01 for both) (fig. S5).
A previously validated binary classifier to identi-
fy the molecular signature of smoking (17) was
applied to differentiate transversion-high (TH,
smoking signature) from transversion-low (TL,
never-smoking signature) tumors. Efficacy was
greatest in patients with tumors harboring the
smoking signature. The ORR in TH tumors was
56% versus 17% in TL tumors (Fisher ’s exact P =
0.03); therateof DCB was77%versus22%(Fisher’s
exact P = 0.004); the PFS was also significantly
longer in TH tumors (median not reached versus
3.5 months, log-rank P = 0.0001) (Fig. 2A). Self-
reported smoking history did not significantly
discriminate those most likely to benefit from
pembrolizumab. The rates of neither DCB nor
PFS were significantly different in ever-smokers
versus never-smokers (Fisher’s exact P = 0.66 and
log-rank P = 0.29, respectively) or heavy smokers
(median pack-years>25) versus light/never smokers
(pack-years≤25) (Fisher’s exact P = 0.08 and log-
rank P= 0.15, respectively). Themolecular smoking
signature correlated more significantly with non-
synonymous mutation burden than smoking his-
tory (fig. S6, A and B).
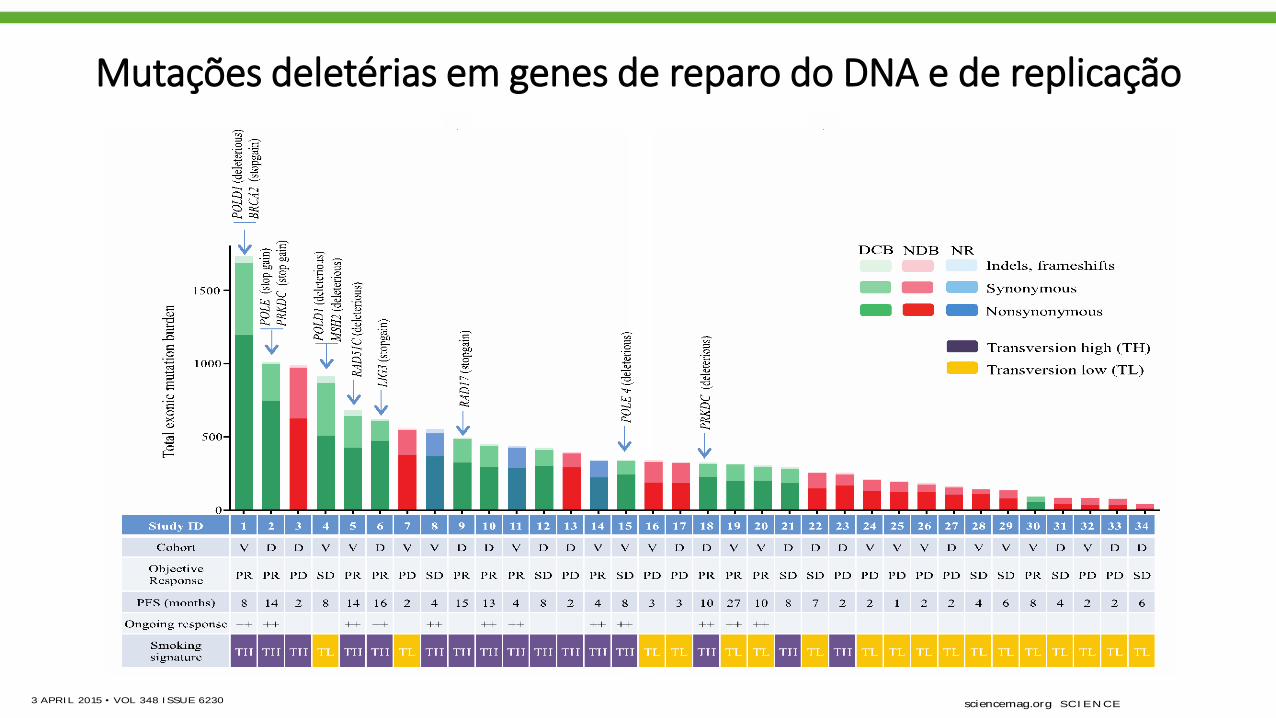
Although carcinogens in tobacco smoke are
largely responsible for the mutagenesis in lung
cancers (19), the wide range of mutation burden
within both smokers and never-smokers impli-
cates additional pathways contributing to the
accumulation of somatic mutations. We found
deleterious mutations in a number of genes that
are important in DNA repair and replication. For
example, in three responders with the highest
mutation burden, we identified deleterious mu-
tations in POLD1, POLE, and MSH2 (Fig. 3). Of
particular interest, a POLD1E374K mutation was
identified in a never-smoker with DCB whose tu-
mor harbored the greatest nonsynonymous muta-
tion burden (n = 507) of all never-smokers in our
series. POLD1Glu374 lies in the exonuclease proof-
reading domain of Pol d (20), and mutation of
this residue may contribute to low-fidelity repli-
cation of the lagging DNA strand. Consistent with
this hypothesis, this tumor exome had a relatively
low proportion of C-to-A transversions (20%) and
predominance of C-to-T transitions (51%), similar
to other POLD1 mutant, hypermutated tumors
(21) and distinct from smoking-related lung can-
cers. Another responder, with the greatest muta-
tion burden in our series, had a C284Y mutation
in POLD1, which is also located in the exonu-
clease proofreading domain. We observed non-
sense mutations in PRKDC, the catalytic subunit
of DNA-dependent protein kinase (DNA-PK),
and RAD17. Both genes are required for proper
DNA repair and maintenance of genomic integ-
rity (22, 23).
Genes harboring deleterious mutations com-
mon to four or moreDCB patientsand not present
in NDB patients included POLR2A, KEAP1, PAPPA2,
PXDNL, RYR1, SCN8A, and SLIT3. Mutations in
KRAS were found in 7of 14 tumors from patients
with DCB compared to 1of 17 in the NDB group,
a finding that may be explained by the asso-
ciation between smoking and the presence of
KRAS mutations in NSCLC (24). There were no
mutations or copy-number alterations in antigen-
presentation pathway–associated genes or CD274
SCI EN CE sciencemag.org 3 APRI L 2015 • VOL 348 I SSUE 6230 125
0 4 8 1 2 1 6 2 0 2 4
0
5 0
1 0 0
0
2 0 0
4 0 0
6 0 0
8 0 0
0
2 0 0
4 0 0
8 0 0
1 2 0 0
0 5 0 1 0 0
0
5 0
1 0 0
0
2 0 0
4 0 0
8 0 0
1 2 0 0
# N
onsy
nony
mou
s m
utat
ions
/tum
or
Discovery Cohort Validation Cohort
# N
onsy
nony
mou
s m
utat
ions
/tum
or
All Tumors
0 4 8 1 2 1 6 2 0 2 4
0
5 0
1 0 0
0 4 8 1 2 1 6 2 0 2 4
0
5 0
1 0 0
Discovery Cohort Validation Cohort
Months
All Tumors
DCB NDB DCB NDB DCB NDB
High nonsynonymous burden
Low nonsynonymous burden
High nonsynonymous burden
Low nonsynonymous burden
High nonsynonymous burden
Low nonsynonymous burden
800
600
400
200
0
1200
800
400
200
0
100
50
0
% S
ensi
tivity
1 - % Specificity 50 100
1200
800
400
200
0 # N
onsy
nony
mou
s m
utat
ions
/tum
or
100
50
0 4 8 12 16 20 24
Months
100
50
0 4 8 12 16 20 24
Per
cent
pro
gres
sion
-free
Months
100
50
0 4 8 12 16 20 24
Per
cent
pro
gres
sion
-free
Per
cent
pro
gres
sion
-free
Fig. 1. Nonsynonymous mutat ion burden associated wit h clinical bene-
f it of ant i–PD-1 therapy. (A) Nonsynonymous mutation burden in tumors
from patients with DCB (n = 7) or with NDB (n = 9) (median 302 versus
148, Mann-Whitney P = 0.02). (B) PFS in tumors with higher nonsynony-
mous mutation burden (n = 8) compared to tumors with lower nonsynony-
mous mutation burden (n = 8) in patients in the discovery cohort (HR 0.19,
95% CI 0.05 to 0.70, log-rank P = 0.01). (C) Nonsynonymous mutation
burden in tumors with DCB (n = 7) compared to those with NDB (n = 8) in
patients in the validat ion cohort (median 244 versus 125, Mann-Whitney
P = 0.04). (D) PFS in tumors with higher nonsynonymous mutation burden
(n = 9) compared to those with lower nonsynonymous mutat ion burden
(n = 9) in pat ients in the validat ion cohort (HR 0.15, 95% CI 0.04 to 0.59,
log-rank P = 0.006). (E) ROC curve for the correlat ion of nonsynonymous
mutat ion burden with DCB in discovery cohort. AUC is 0.86 (95% CI 0.66
to 1.05, null hypothesis test P = 0.02). Cut-off of ≥178 nonsynonymous mu-
tations is designated by triangle. (F) Nonsynonymous mutat ion burden in
patients with DCB (n = 14) compared to those with NDB (n = 17) for the
ent ire set of sequenced tumors (median 299 versus 127, Mann-Whitney P =
0.0008). (G) PFS in those with higher nonsynonymous mutation burden
(n = 17) compared to those with lower nonsynonymous mutat ion burden
(n = 17) in the entire set of sequenced tumors (HR 0.19, 95% CI 0.08-0.47,
log-rank P = 0.0004). In (A), (C), and (F), median and interquartile ranges of
total nonsynonymous mutations are shown, with individual values for each
tumor shown with dots.
RESEARCH | REPORTS
DCB 83% vs 22%, P = 0.04
PFS NR vs 3.4 ms, HR 0.15, 95% CI 0.04 to 0.59, P = 0.006
CANCER IMMUNOLOGY
Mutational landscapedeterminessensitivity toPD-1blockadeinnon–small cell lungcancerNaiyer A. Rizvi ,1,2*† M atthew D. Hellmann,1,2* Alexandra Snyder,1,2,3* Pia Kvistbor g,4
Vladimir M akarov,3 Jonathan J. Havel,3 W ill iam Lee,5 Jianda Yuan,6 Phi ll ip W ong,6
Teresa S. Ho,6 M artin L. M i ller,7 Natasha Rekhtman,8 Andre L. M oreira,8
Fawzia I brahim,1 Cameron Bruggeman,9 Bi llel Gasmi,10 Rober ta Zappasodi ,10
Yuka M aeda,10 Chr is Sander,7 Edward B. Garon,11 Taha M erghoub,1,10
Jedd D. W olchok,1,2,10 Ton N. Schumacher,4 Timothy A. Chan2,3,5‡
Immune checkpoint inhibitors, which unleash a patient ’s own T cells to kill tumors, are
revolut ionizing cancer treatment. To unravel the genomic determinants of response
to this therapy, we used whole-exome sequencing of non–small cell lung cancers treated
with pembrolizumab, an antibody targeting programmed cell death-1 (PD-1). In two
independent cohorts, higher nonsynonymous mutation burden in tumors was associated
with improved objective response, durable clinical benefit , and progression-free survival.
Efficacy also correlated with the molecular smoking signature, higher neoantigen
burden, and DNA repair pathway mutations; each factor was also associated with mutation
burden. In one responder, neoant igen-specific CD8+ T cell responses paralleled tumor
regression, suggest ing that ant i–PD-1 therapy enhances neoantigen-specif ic T cell
reactivity. Our results suggest that the genomic landscape of lung cancers shapes
response to ant i–PD-1 therapy.
Today, more than a century since the initial
observation that the immune system can re-
ject human cancers (1), immune checkpoint
inhibitorsaredemonstrating that adaptive
immunity can be harnessed for the treat-
ment of cancer (2–7). In advanced non–small cell
lung cancer (NSCLC), therapies with an antibody
targetingprogrammed cell death-1(anti–PD-1) dem-
onstrated response ratesof 17to 21%, with some
responses being remarkably durable (3, 8).
Understanding the molecular determinants of
response to immunotherapies such as anti–PD-1
therapy is one of the critical challenges in oncol-
ogy. Among the best responses have been in
melanomas and NSCLCs, cancers largely caused
by chronic exposure to mutagens [ultraviolet light
(9) and carcinogens in cigarette smoke (10), re-
spectively]. However, there is a large variability
in mutation burden within tumor types, ranging
from 10sto 1000sof mutations(11–13). Thisrange
is particularly broad in NSCLCs because tumors
in never-smokers generally have few somatic mu-
tations compared with tumors in smokers (14).
We hypothesized that the mutational landscape
of NSCLCs may influence response to anti–PD-1
therapy. To examinethishypothesis, wesequenced
the exomes of NSCLCs from two independent
cohorts of patients treated with pembrolizumab,
a humanized immunoglobulin G (IgG) 4-kappa
isotype antibody to PD-1(n = 16 and n = 18, re-
spectively), and their matched normal DNA (fig.
S1and table S1) (15).
Overall, tumor DNAsequencinggenerated mean
target coverage of 164x, and a mean of 94.5%of
the target sequence wascovered to a depth of at
least 10x; coverage and depth were similar be-
tween cohorts, as well as between those with or
without clinical benefit (fig. S2). We identified a
median of 200 nonsynonymous mutations per
sample(range11to 1192). Themedian number of
exonic mutations per sample was 327 (range 45
to 1732).Thequantity and rangeof mutationswere
similar to published series of NSCLCs (16, 17)
(fig. S3). Thetransition/transversion ratio (Ti/Tv)
was 0.74 (fig. S4), also similar to previously de-
scribed NSCLCs (16–18). To ensureaccuracy of our
sequencing data, targeted resequencing with an
orthogonal method (Ampliseq) was performed
using 376 randomly selected variants, and muta-
tionswereconfirmed in 357of thosevariants (95%).
Higher somatic nonsynonymous mutation
burden was associated with clinical efficacy of
pembrolizumab. In the discovery cohort (n = 16),
the median number of nonsynonymous muta-
tions was 302 in patients with durable clinical
benefit (DCB) (partial or stable response lasting
>6 months) versus 148 with no durable benefit
(NDB) (Mann-Whitney P= 0.02) (Fig. 1A). Seventy-
three percent of patients with high nonsynon-
ymous burden (defined as above the median
burden of thecohort, 209) experienced DCB, com-
pared with 13% of those with low mutation bur-
den (below median) (Fisher’sexact P= 0.04). Both
confirmed objective response rate (ORR) and
progression-free survival (PFS) were higher in
patients with high nonsynonymousburden [ORR
63% versus 0%, Fisher’s exact P = 0.03; median
PFS14.5 versus 3.7 months, log-rank P = 0.01;
hazard ratio (HR) 0.19, 95%confidence interval
(CI) 0.05 to 0.70] (Fig. 1B and table S2).
Thevalidation cohort included an independent
set of 18 NSCLC samples from patients treated
with pembrolizumab. The clinical characteristics
were similar in both cohorts. The median non-
synonymous mutation burden was 244 in tu-
mors from patients with DCB compared to 125
in those with NDB (Mann-Whitney P = 0.04)
(Fig. 1C). The ratesof DCB and PFSwere again sig-
nificantly greater in patients with a nonsynon-
ymous mutation burden above 200, the median
of the validation cohort (DCB 83% versus 22%,
Fisher’sexact P= 0.04; median PFSnot reached
versus 3.4 months, log-rank P = 0.006; HR 0.15,
95% CI 0.04 to 0.59) (Fig. 1D and table S2).
In the discovery cohort, there was high con-
cordancebetween nonsynonymousmutation bur-
den and DCB, with an area under the receiver
operator characteristic (ROC) curve(AUC) of 87%
(Fig. 1E). Patients with nonsynonymous muta-
tion burden ≥178, the cut point that combined
maximal sensitivity with best specificity, had a
likelihood ratio for DCB of 3.0; the sensitivity
and specificity of DCB using this cut point was
100%(95%CI 59 to 100%) and 67%(29 to 93%),
respectively. Applying this cut point to the
validation cohort, the rate of DCB in patients
with tumorsharboring≥178 mutationswas75%
compared to 14% in those with <178, corre-
sponding to a sensitivity of 86% and a specific-
ity of 75%.
There were few but important exceptions. Five
of 18 tumors with ≥178 nonsynonymous muta-
tions had NDB, and one tumor with a very low
burden (56 nonsynonymous mutations) responded
to pembrolizumab. However, this response was
transient, lasting 8 months. Acrossboth cohorts,
thiswas theonly patient with a tumor mutation
burden <178 and confirmed objective response.
Notably, although higher nonsynonymous mu-
tation burden correlated with improved ORR,
DCB, and PFS (Fig. 1, F and G), this correlation
was less evident when examining total exonic
mutation burden (table S2).
Wenext examined all 34 exomescollectively to
determine how patterns of mutational changes
were associated with clinical benefit to pembro-
lizumab (tables S4 and S5). C-to-A transversions
were more frequent, and C-to-T transitions were
less frequent, in patients with DCB compared to
124 3 APRI L 2015 • VOL 348 I SSUE 6230 sciencemag.org SCI EN CE
1Department of Medicine, Memorial Sloan Kettering Cancer
Center, New York, NY10065, USA. 2Weill Cornell Medical
College, New York, NY, 10065, USA. 3Human Oncology and
Pathogenesis Program, Memorial Sloan Kettering Cancer
Center, New York, NY10065, USA. 4Division of Immunology,
Netherlands Cancer Institute, 1066 CX Amsterdam,
Netherlands. 5Department of Radiation Oncology, Memorial
Sloan Kettering Cancer Center, New York, NY10065, USA.6Immune Monitoring Core, Ludwig Center for Cancer
Immunotherapy, Memorial Sloan Kettering Cancer Center,
New York, NY10065, USA. 7Computation Biology Program,
Memorial Sloan Kettering Cancer Center, New York, NY
10065, USA. 8Department of Pathology, Memorial Sloan
Kettering Cancer Center, New York, NY10065, USA.9Department of Mathematics, Columbia University, New
York, NY, 10027, USA. 10Ludwig Collaborative Laboratory,
Memorial Sloan Kettering Cancer Center, New York, NY
10065, USA. 11David Geffen School of Medicine at UCLA,
2825 Santa Monica Boulevard, Suite 200, Santa Monica, CA
90404, USA.
*These authors contributed equally to this work. †Present address:
Division of Hematology/ Oncology, New York-Presbyterian/ Columbia
University, New York, NY, USA. ‡Corresponding author. E-mail:
RESEARCH | REPORTS
on
Sep
tem
ber 1
5, 2
015
ww
w.s
cien
cem
ag.o
rgD
ownl
oade
d fro
m
on
Sep
tem
ber 1
5, 2
015
ww
w.s
cien
cem
ag.o
rgD
ownl
oade
d fro
m
on
Sep
tem
ber 1
5, 2
015
ww
w.s
cien
cem
ag.o
rgD
ownl
oade
d fro
m
on
Sep
tem
ber 1
5, 2
015
ww
w.s
cien
cem
ag.o
rgD
ownl
oade
d fro
m
on
Sep
tem
ber 1
5, 2
015
ww
w.s
cien
cem
ag.o
rgD
ownl
oade
d fro
m
CANCER IMMUNOLOGY
Mutational landscapedeterminessensitivity to PD-1blockade innon–small cell lungcancerNaiyer A. Rizvi ,1,2*† M atthew D. Hellmann,1,2* Alexandra Snyder,1,2,3* Pia Kvistbor g,4
Vladimir M akarov,3 Jonathan J. Havel,3 W ill iam Lee,5 Jianda Yuan,6 Phi l l ip W ong,6
Teresa S. Ho,6 M artin L. M i l ler,7 Natasha Rekhtman,8 Andre L. M oreira,8
Fawzia I brahim,1 Cameron Bruggeman,9 Bi l lel Gasmi,10 Rober ta Zappasodi ,10
Yuka M aeda,10 Chr is Sander,7 Edward B. Garon,11 Taha M erghoub,1,10
Jedd D. W olchok,1,2,10 Ton N. Schumacher,4 Timothy A. Chan2,3,5‡
Immune checkpoint inhibitors, which unleash a patient ’s own T cells to kill tumors, are
revolut ionizing cancer treatment. To unravel the genomic determinants of response
to this therapy, we used whole-exome sequencing of non–small cell lung cancers treated
with pembrolizumab, an antibody targeting programmed cell death-1 (PD-1). In two
independent cohorts, higher nonsynonymous mutat ion burden in tumors was associated
with improved object ive response, durable clinical benefit , and progression-free survival.
Efficacy also correlated with the molecular smoking signature, higher neoantigen
burden, and DNA repair pathway mutat ions; each factor was also associated with mutat ion
burden. In one responder, neoant igen-specific CD8+ T cell responses paralleled tumor
regression, suggest ing that ant i–PD-1 therapy enhances neoantigen-specif ic T cell
reactivity. Our results suggest that the genomic landscape of lung cancers shapes
response to ant i–PD-1 therapy.
Today, more than a century since the initial
observation that the immune system can re-
ject human cancers (1), immune checkpoint
inhibitorsaredemonstrating that adaptive
immunity can be harnessed for the treat-
ment of cancer (2–7). In advanced non–small cell
lung cancer (NSCLC), therapies with an antibody
targetingprogrammed cell death-1(anti–PD-1) dem-
onstrated response rates of 17to 21%, with some
responses being remarkably durable (3, 8).
Understanding the molecular determinants of
response to immunotherapies such as anti–PD-1
therapy is one of the critical challenges in oncol-
ogy. Among the best responses have been in
melanomas and NSCLCs, cancers largely caused
by chronic exposure to mutagens [ultraviolet light
(9) and carcinogens in cigarette smoke (10), re-
spectively]. However, there is a large variability
in mutation burden within tumor types, ranging
from 10sto 1000sof mutations(11–13). Thisrange
is particularly broad in NSCLCs because tumors
in never-smokers generally have few somatic mu-
tations compared with tumors in smokers (14).
We hypothesized that the mutational landscape
of NSCLCs may influence response to anti–PD-1
therapy. To examinethishypothesis, wesequenced
the exomes of NSCLCs from two independent
cohorts of patients treated with pembrolizumab,
a humanized immunoglobulin G (IgG) 4-kappa
isotype antibody to PD-1 (n = 16 and n = 18, re-
spectively), and their matched normal DNA (fig.
S1and table S1) (15).
Overall, tumor DNA sequencinggenerated mean
target coverage of 164x, and a mean of 94.5% of
the target sequence wascovered to a depth of at
least 10x; coverage and depth were similar be-
tween cohorts, as well as between those with or
without clinical benefit (fig. S2). We identified a
median of 200 nonsynonymous mutations per
sample(range11to 1192). Themedian number of
exonic mutations per sample was 327 (range 45
to 1732). Thequantity and rangeof mutationswere
similar to published series of NSCLCs (16, 17)
(fig. S3). Thetransition/transversion ratio (Ti/Tv)
was 0.74 (fig. S4), also similar to previously de-
scribed NSCLCs (16–18). To ensure accuracy of our
sequencing data, targeted resequencing with an
orthogonal method (Ampliseq) was performed
using 376 randomly selected variants, and muta-
tionswereconfirmed in 357of thosevariants(95%).
Higher somatic nonsynonymous mutation
burden was associated with clinical efficacy of
pembrolizumab. In the discovery cohort (n = 16),
the median number of nonsynonymous muta-
tions was 302 in patients with durable clinical
benefit (DCB) (partial or stable response lasting
>6 months) versus 148 with no durable benefit
(NDB) (Mann-Whitney P= 0.02) (Fig. 1A). Seventy-
three percent of patients with high nonsynon-
ymous burden (defined as above the median
burden of thecohort, 209) experienced DCB, com-
pared with 13% of those with low mutation bur-
den (below median) (Fisher’sexact P= 0.04). Both
confirmed objective response rate (ORR) and
progression-free survival (PFS) were higher in
patients with high nonsynonymous burden [ORR
63% versus 0%, Fisher’s exact P = 0.03; median
PFS14.5 versus 3.7 months, log-rank P = 0.01;
hazard ratio (HR) 0.19, 95% confidence interval
(CI) 0.05 to 0.70] (Fig. 1B and table S2).
Thevalidation cohort included an independent
set of 18 NSCLC samples from patients treated
with pembrolizumab. The clinical characteristics
were similar in both cohorts. The median non-
synonymous mutation burden was 244 in tu-
mors from patients with DCB compared to 125
in those with NDB (Mann-Whitney P = 0.04)
(Fig. 1C). The ratesof DCB and PFSwere again sig-
nificantly greater in patients with a nonsynon-
ymous mutation burden above 200, the median
of the validation cohort (DCB 83% versus 22%,
Fisher’sexact P= 0.04; median PFSnot reached
versus 3.4 months, log-rank P = 0.006; HR 0.15,
95% CI 0.04 to 0.59) (Fig. 1D and table S2).
In the discovery cohort, there was high con-
cordancebetween nonsynonymousmutation bur-
den and DCB, with an area under the receiver
operator characteristic (ROC) curve (AUC) of 87%
(Fig. 1E). Patients with nonsynonymous muta-
tion burden ≥178, the cut point that combined
maximal sensitivity with best specificity, had a
likelihood ratio for DCB of 3.0; the sensitivity
and specificity of DCB using this cut point was
100%(95%CI 59 to 100%) and 67%(29 to 93%),
respectively. Applying this cut point to the
validation cohort, the rate of DCB in patients
with tumorsharboring ≥178 mutationswas75%
compared to 14% in those with <178, corre-
sponding to a sensitivity of 86% and a specific-
ity of 75%.
There were few but important exceptions. Five
of 18 tumors with ≥178 nonsynonymous muta-
tions had NDB, and one tumor with a very low
burden (56 nonsynonymous mutations) responded
to pembrolizumab. However, this response was
transient, lasting 8 months. Acrossboth cohorts,
thiswas theonly patient with a tumor mutation
burden <178 and confirmed objective response.
Notably, although higher nonsynonymous mu-
tation burden correlated with improved ORR,
DCB, and PFS (Fig. 1, F and G), this correlation
was less evident when examining total exonic
mutation burden (table S2).
Wenext examined all 34 exomescollectively to
determine how patterns of mutational changes
were associated with clinical benefit to pembro-
lizumab (tables S4 and S5). C-to-A transversions
were more frequent, and C-to-T transitions were
less frequent, in patients with DCB compared to
124 3 APRI L 2015 • VOL 348 I SSUE 6230 sciencemag.org SCI EN CE
1Department of Medicine, Memorial Sloan Kettering Cancer
Center, New York, NY10065, USA. 2Weill Cornell Medical
College, New York, NY, 10065, USA. 3Human Oncology and
Pathogenesis Program, Memorial Sloan Kettering Cancer
Center, New York, NY10065, USA. 4Division of Immunology,
Netherlands Cancer Institute, 1066 CX Amsterdam,
Netherlands. 5Department of Radiation Oncology, Memorial
Sloan Kettering Cancer Center, New York, NY10065, USA.6Immune Monitoring Core, Ludwig Center for Cancer
Immunotherapy, Memorial Sloan Kettering Cancer Center,
New York, NY10065, USA. 7Computation Biology Program,
Memorial Sloan Kettering Cancer Center, New York, NY
10065, USA. 8Department of Pathology, Memorial Sloan
Kettering Cancer Center, New York, NY10065, USA.9Department of Mathematics, Columbia University, New
York, NY, 10027, USA. 10Ludwig Collaborative Laboratory,
Memorial Sloan Kettering Cancer Center, New York, NY
10065, USA. 11David Geffen School of Medicine at UCLA,
2825 Santa Monica Boulevard, Suite 200, Santa Monica, CA
90404, USA.
*These authors contributed equally to this work. †Present address:
Division of Hematology/ Oncology, New York-Presbyterian/ Columbia
University, New York, NY, USA. ‡Corresponding author. E-mail:
RESEARCH | REPORTS
on
Sep
tem
ber 1
5, 2
015
ww
w.s
cien
cem
ag.o
rgD
ownl
oade
d fro
m
on
Sep
tem
ber 1
5, 2
015
ww
w.s
cien
cem
ag.o
rgD
ownl
oade
d fro
m
on
Sep
tem
ber 1
5, 2
015
ww
w.s
cien
cem
ag.o
rgD
ownl
oade
d fro
m
on
Sep
tem
ber 1
5, 2
015
ww
w.s
cien
cem
ag.o
rgD
ownl
oade
d fro
m
on
Sep
tem
ber 1
5, 2
015
ww
w.s
cien
cem
ag.o
rgD
ownl
oade
d fro
m
Mutações deletérias em genes de reparo do DNA e de replicação

Neo-antígenos e clonalidade
McGrahanan N, et al. Science. 2016
First release: 3 March 2016 www.sciencemag.org (Page numbers not final at time of first release) 10
First release: 3 March 2016 www.sciencemag.org (Page numbers not final at time of first release) 10
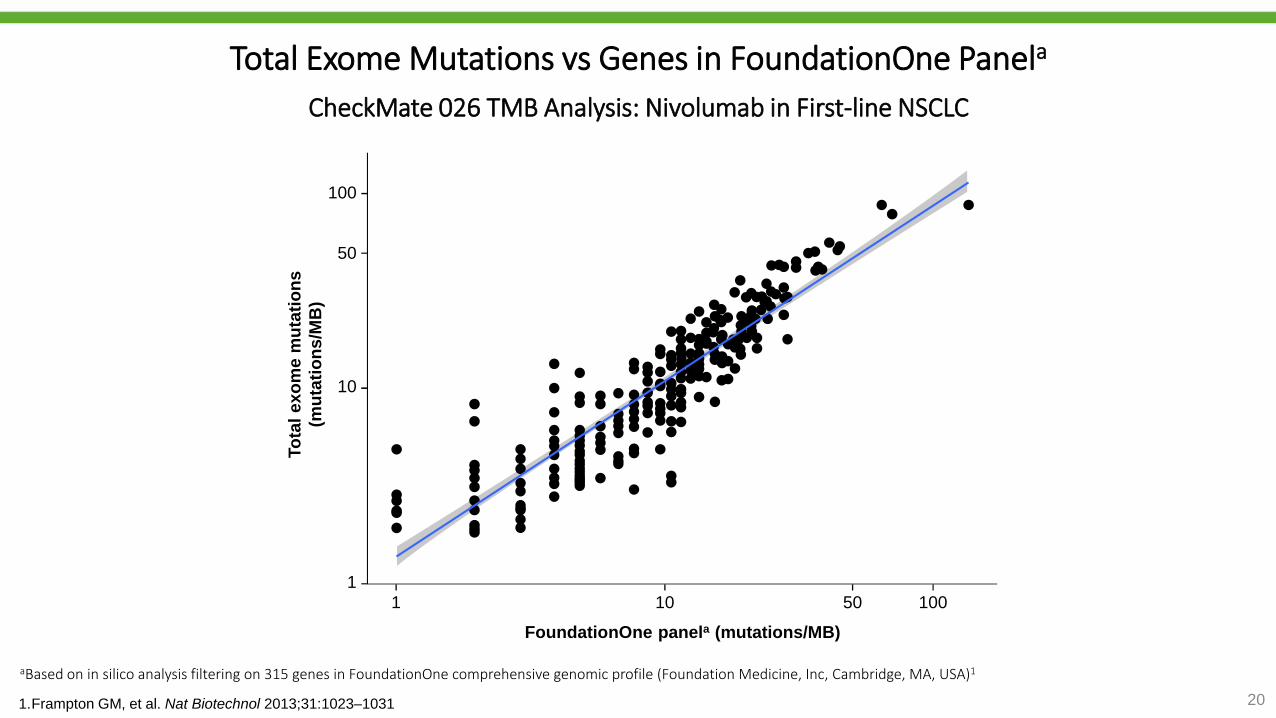
Total Exome Mutations vs Genes in FoundationOne Panela
CheckMate 026 TMB Analysis: Nivolumab in First-line NSCLC
20
aBased on in silico analysis filtering on 315 genes in FoundationOne comprehensive genomic profile (Foundation Medicine, Inc, Cambridge, MA, USA)1
1.Frampton GM, et al. Nat Biotechnol 2013;31:1023–1031
100
50
1
FoundationOne panela (mutations/MB)
To
tal
exo
me m
uta
tio
ns
(mu
tati
on
s/M
B)
10
501 10 100

Biology of TMB and PD-L1 Expression
21
High TMB
High PD-L1
PD-L1 (% tumor expression)
High TMB
7550
1000
316
100
32
10
0 25 100
TM
B
(no
. o
f m
iss
en
se
mu
tati
on
s)
Low/medium TMB
243
• There was no association between TMB and PD-L1 expression
in patients with ≥1% PD-L1 tumor expression
High TMB
Low PD-L1
Low/medium TMB
High PD-L1
Tumors may have T cells excluded,
preventing inflammation with lack
of PD-L1 upregulation
PD-L1 may be a surrogate
marker of high TMB-induced
inflammation (T cell infiltration and
interferon-γ–associated activation)
TMB may not be the only driver of
inflammation, and alternate
pathways (eg, quality neoantigens
and strong immunogenicity) may
lead to PD-L1 upregulation

22
PFS by Tumor Mutation Burden SubgroupCheckMate 026 TMB Analysis: Nivolumab in First-line NSCLC
Nivolumab
Chemotherapy
47 30 26 21 16 12 4 1
60 42 22 15 9 7 4 1
111 54 30 15 9 7 2 1 1
94 65 37 23 15 12 5 0 0
Nivolumab
n = 47 n = 60
9.7
(5.1, NR)
5.8
(4.2, 8.5)
Chemotherapy
Median PFS, months
(95% CI)
High TMB
PF
S (
%)
3 6 9 12 15 18 21
No. at RiskMonths
100
90
80
70
60
50
40
30
20
10
0
0
Nivolumab
Chemotherapy
0 3 6 9 12
Months
15 18 21 24
Nivolumab
Chemotherapy
100
90
80
70
60
50
40
30
20
10
0
n = 111 n = 94
4.1
(2.8, 5.4)
6.9
(5.5, 8.6)
HR = 1.82 (95% CI: 1.30, 2.55)
Nivolumab Chemotherapy
(95% CI)
Median PFS, months
Low/medium TMB
HR = 0.62 (95% CI: 0.38, 1.00)
23
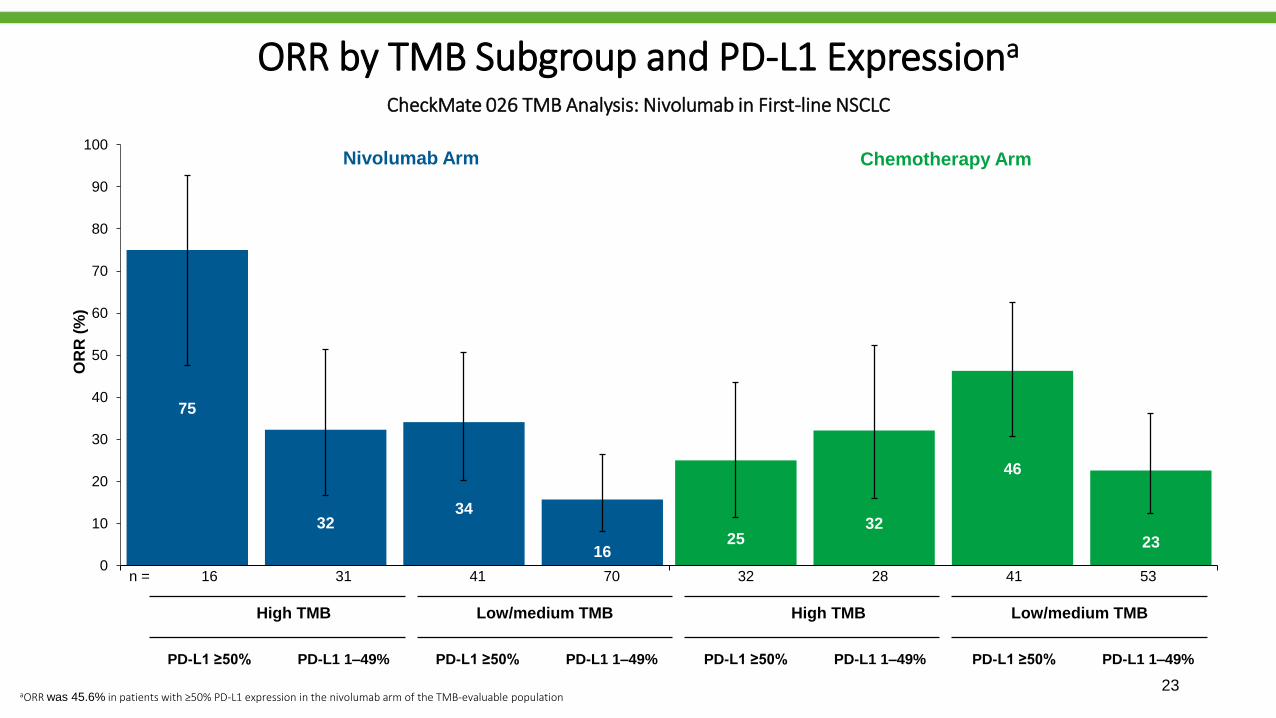
ORR by TMB Subgroup and PD-L1 Expressiona
CheckMate 026 TMB Analysis: Nivolumab in First-line NSCLC
75
2532 32
34
46
1623
0
10
20
30
40
50
60
70
80
90
100
OR
R (
%)
16 31 41 70 32 28 41 53
Nivolumab Arm Chemotherapy Arm
PD-L1 ≥50% PD-L1 1–49% PD-L1 ≥50% PD-L1 1–49% PD-L1 ≥50% PD-L1 1–49% PD-L1 ≥50% PD-L1 1–49%
n =
High TMB Low/medium TMB High TMB Low/medium TMB
aORR was 45.6% in patients with ≥50% PD-L1 expression in the nivolumab arm of the TMB-evaluable population

PFS by TMB Subgroup and PD-L1 Expression CheckMate 026 TMB Analysis: Nivolumab in First-line NSCLC
32 24 13 12 7 5 2 1
28 18 9 3 2 2 2 0
53 35 23 13 10 8 3 0
41 30 14 10 5 4 2 0
No. at Risk
High TMB, PD-L1 ≥50%
High TMB, PD-L1 1–49%
Low/medium TMB, PD-L1 1–49%
Low/medium TMB, PD-L1 ≥50%
16 13 10 8 8 6 2 0 0
31 17 16 13 8 6 2 1 0
70 33 18 9 7 5 1 1 1
41 21 12 6 2 2 1 0 0
24
Months
100
75
50
25
0
6 18930 12 15 21
Months
100
75
50
25
0
6 1893
PF
S (
%)
0 12 15 2421
High TMB, PD-L1 ≥50%
High TMB, PD-L1 1–49%
Low/medium TMB, PD-L1 1–49%
Low/medium TMB, PD-L1 ≥50%
Low/medium TMB, PD-L1 ≥50%
High TMB, PD-L1 1–49%
Low/medium TMB, PD-L1 1–49%
High TMB, PD-L1 ≥50%
Nivolumab Arm Chemotherapy Arm
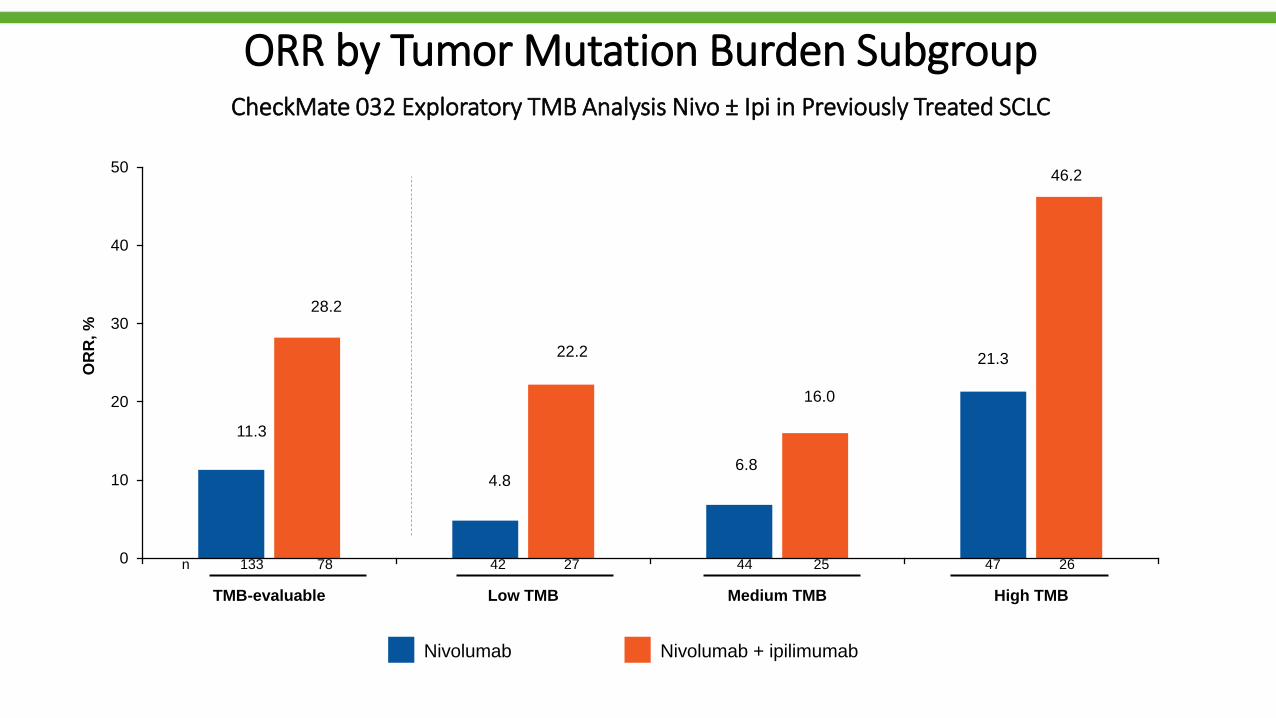
ORR by Tumor Mutation Burden SubgroupCheckMate 032 Exploratory TMB Analysis Nivo ± Ipi in Previously Treated SCLC
0
10
20
30
40
50
TMB-evaluable Low TMB Medium TMB High TMB
OR
R, %
Nivolumab Nivolumab + ipilimumab
42 27 44 25 47 26n 133 78
11.3
28.2
4.8
22.2
6.8
16.0
21.3
46.2
Sumário
• Introdução
• Expressão tumoral de PD-L1
• Carga mutacional
• Perfil mutacional (driver)
• Outros biomarcadores
• Conclusões

Adapted from Spigel ASCO 2016
Perfil mutacional vs TMB


Patients with KRAS/STK11 co-mutated LUAC exhibit poor clinical response to PD-1 axis inhibitors
ORR (RECIST 1.1) P=0.000735
Fisher’s exact test
7.4%
35.7%28.6%
KL
KP
K-only
Skoulidis et al. IASLC 18th World Conference on Lung Cancer
Sumário
• Introdução
• Expressão tumoral de PD-L1
• Carga mutacional
• Perfil mutacional
• Outros biomarcadores
• Conclusões

Teff signature was defined by mRNA expression of 3 genes (PDL1, CXCL9, IFNG) and derived from
a broader 9-gene signature from POPLAR1
In the OAK study, the Teff signature was associated with PD-L1 expression assessed by IHC (P = 7.3 x 10-45)
Teff signature partially overlaps with patients identified as PD-L1 positive by IHC and also identifies
a unique subset of patients within the PD-L1–negative population
Teff Gene Signature and Overlap With PD-L1 IHC in tumor specimens from study OAK
Kowanetz et al. OAK Teff biomarker. WCLC 2017.
Teff Gene
Signature
PDL1
IFNG
CXCL9
Pre-existing
immunity
PD-L1 expression
on TC and IC
Teff Gene Signature vs PD-L1 IHC (SP142)a
36%14% 20%
Teff
≥ median
TC1/2/3
or IC1/2/3b
N = 753

Increasing atezolizumab PFS benefit was observed with higher Teff gene expression
Patients with Teff expression ≥ median experienced a significant PFS benefit
Association Between Teff Gene Signature and PFS in OAK
0,250.25 1.0 2.0
PFS HRFavors atezolizumab Favors docetaxel
0.94
1.11
0.91
1.30
0.73
1.10
0.66PFS HR (95% CI)
0.91 (0.76, 1.09)
1.11 (0.82, 1.49)
0.94 (0.81, 1.10)
Population
Teff ≥ 25%
Teff < 25%
BEP
0.73 (0.58, 0.91)
1.30 (1.05, 1.61)
Teff ≥ 50%
Teff < 50%
0.66 (0.48, 0.91)
1.10 (0.92, 1.31)
Teff ≥ 75%
Teff < 75%
Te
ffe
xp
res
sio
n
Teff ≥ median, HR = 0.73 (0.58, 0.91)
Teff < median, HR = 1.30 (1.05, 1.61)
Atezolizumab, ≥ median
Atezolizumab, < median
Docetaxel, ≥ median
Docetaxel, < median
Pro
gre
ssio
n-F
ree S
urv
ival
(%)
Months
n (%)
189 (25%)
564 (75%)
382 (51%)
371 (49%)
566 (75%)
187 (25%)
753 (100%)
Kowanetz et al. OAK Teff biomarker. WCLC 2017.
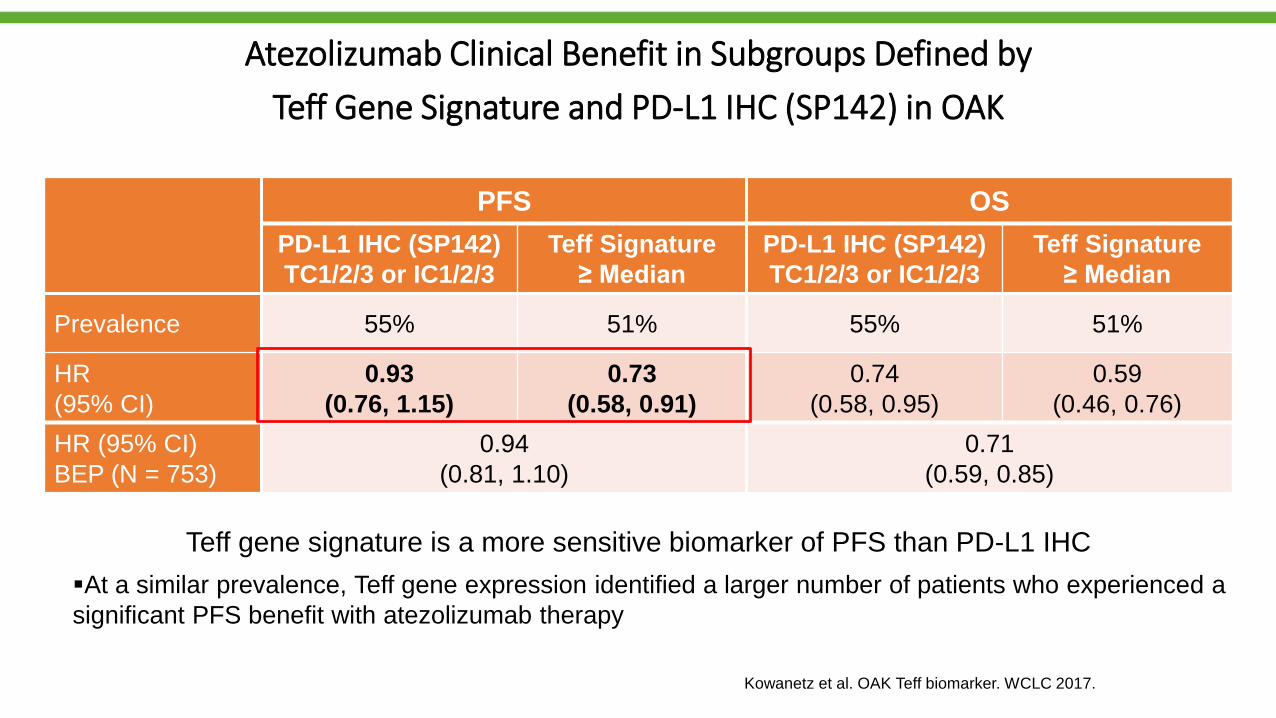
Teff gene signature is a more sensitive biomarker of PFS than PD-L1 IHC
At a similar prevalence, Teff gene expression identified a larger number of patients who experienced a
significant PFS benefit with atezolizumab therapy
Atezolizumab Clinical Benefit in Subgroups Defined by
Teff Gene Signature and PD-L1 IHC (SP142) in OAK
PFS OS
PD-L1 IHC (SP142)
TC1/2/3 or IC1/2/3
Teff Signature
≥ Median
PD-L1 IHC (SP142)
TC1/2/3 or IC1/2/3
Teff Signature
≥ Median
Prevalence 55% 51% 55% 51%
HR
(95% CI)
0.93
(0.76, 1.15)
0.73
(0.58, 0.91)
0.74
(0.58, 0.95)
0.59
(0.46, 0.76)
HR (95% CI)
BEP (N = 753)
0.94
(0.81, 1.10)
0.71
(0.59, 0.85)
Kowanetz et al. OAK Teff biomarker. WCLC 2017.

Reck M, et al. IMpower150 PFS
analysis.35The T-effector (Teff) gene signature is defined by expression of PD-L1, CXCL9 and IFNγ and is a surrogate of both PD-L1 IHC expression and pre-existing immunity (Kowanetz M, et al. WCLC, 2017).
IMpower150 study populations and objectives
ITTAll randomised
patients
Teff-high WTa
High T-effector gene signature expression
Teff-low WTa
Low T-effector gene signature expression
Co-primary objectives• Investigator-assessed PFS in ITT-WT
• Investigator-assessed PFS in Teff-high
WT
• OS in ITT-WT
1
EGFR/ALK +(13% of patients)
ITT-WTa
(87% of patients)
a WT refers to patients without EGFR
or ALK genetic alterations.
Key secondary objectives• Investigator-assessed PFS and OS in ITT
• Investigator-assessed PFS in PD-L1 IHC
subgroups
• Independent review facility (IRF)-assessed PFS
• ORR and DOR per RECIST v1.1
• Safety in ITT
2
Reck M, et al. IMpower150 PFS
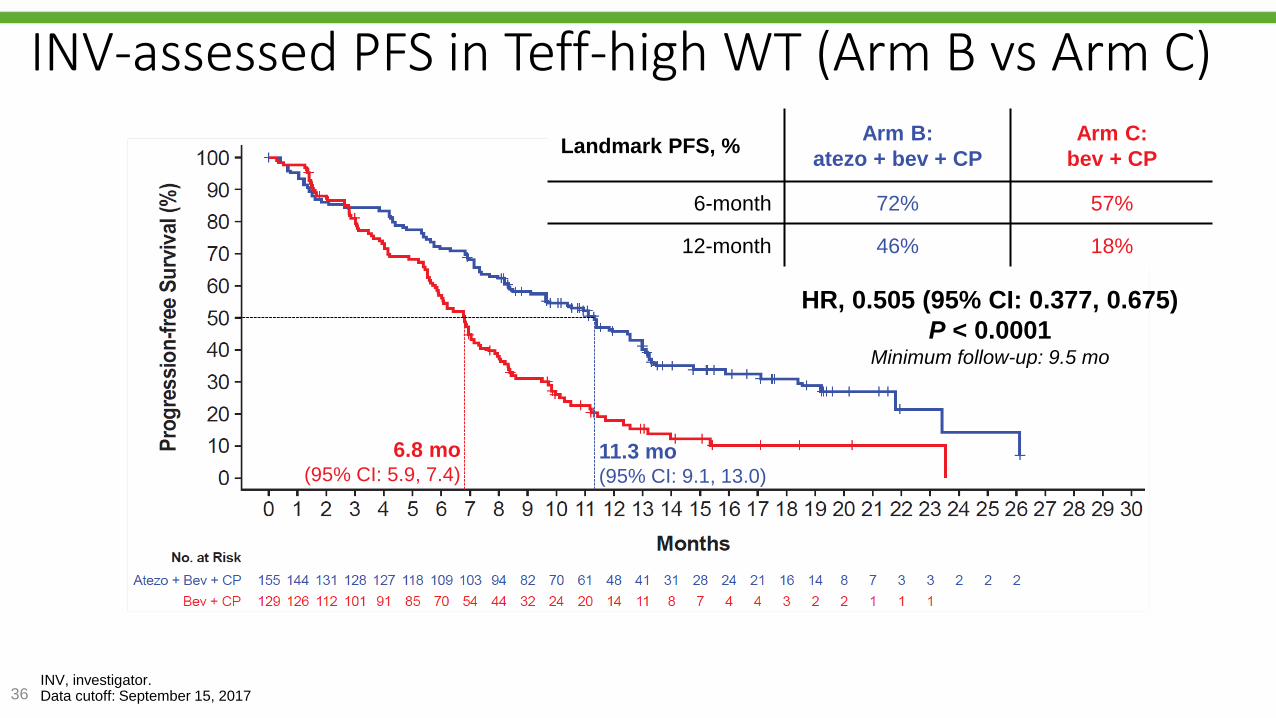
analysis.36INV, investigator.Data cutoff: September 15, 2017
INV-assessed PFS in Teff-high WT (Arm B vs Arm C)
6.8 mo(95% CI: 5.9, 7.4)
11.3 mo(95% CI: 9.1, 13.0)
HR, 0.505 (95% CI: 0.377, 0.675)
P < 0.0001Minimum follow-up: 9.5 mo
Landmark PFS, %Arm B:
atezo + bev + CP
Arm C:
bev + CP
6-month 72% 57%
12-month 46% 18%
Reck M, et al. IMpower150 PFS
analysis.37
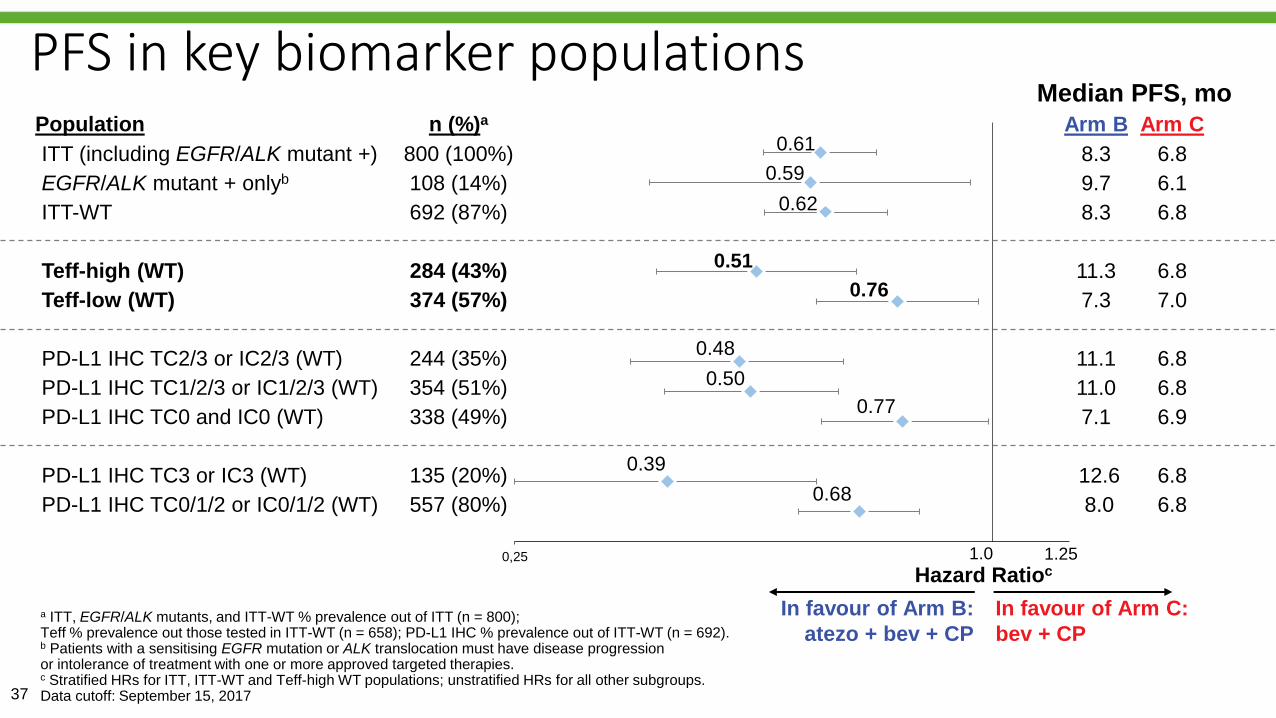
a ITT, EGFR/ALK mutants, and ITT-WT % prevalence out of ITT (n = 800); Teff % prevalence out those tested in ITT-WT (n = 658); PD-L1 IHC % prevalence out of ITT-WT (n = 692). b Patients with a sensitising EGFR mutation or ALK translocation must have disease progression or intolerance of treatment with one or more approved targeted therapies.c Stratified HRs for ITT, ITT-WT and Teff-high WT populations; unstratified HRs for all other subgroups.Data cutoff: September 15, 2017
PFS in key biomarker populations
0,25
Population n (%)a
ITT (including EGFR/ALK mutant +) 800 (100%)
EGFR/ALK mutant + onlyb 108 (14%)
ITT-WT 692 (87%)
Teff-high (WT) 284 (43%)
Teff-low (WT) 374 (57%)
PD-L1 IHC TC2/3 or IC2/3 (WT) 244 (35%)
PD-L1 IHC TC1/2/3 or IC1/2/3 (WT) 354 (51%)
PD-L1 IHC TC0 and IC0 (WT) 338 (49%)
PD-L1 IHC TC3 or IC3 (WT) 135 (20%)
PD-L1 IHC TC0/1/2 or IC0/1/2 (WT) 557 (80%)
Median PFS, mo
1.0
In favour of Arm C:
bev + CP
Hazard Ratioc
In favour of Arm B:
atezo + bev + CP
0.61
0.59
0.76
0.48
0.50
0.77
0.51
0.62
1.25
0.39
0.68
Arm B Arm C
8.3 6.8
9.7 6.1
8.3 6.8
11.3 6.8
7.3 7.0
11.1 6.8
11.0 6.8
7.1 6.9
12.6 6.8
8.0 6.8
Reck M, et al. IMpower150 PFS
analysis.
0
10
20
30
40
50
60
70
80
Arm B:atezo + bev + CP
Arm C:bev + CP
Re
sp
on
se
(%
)
38
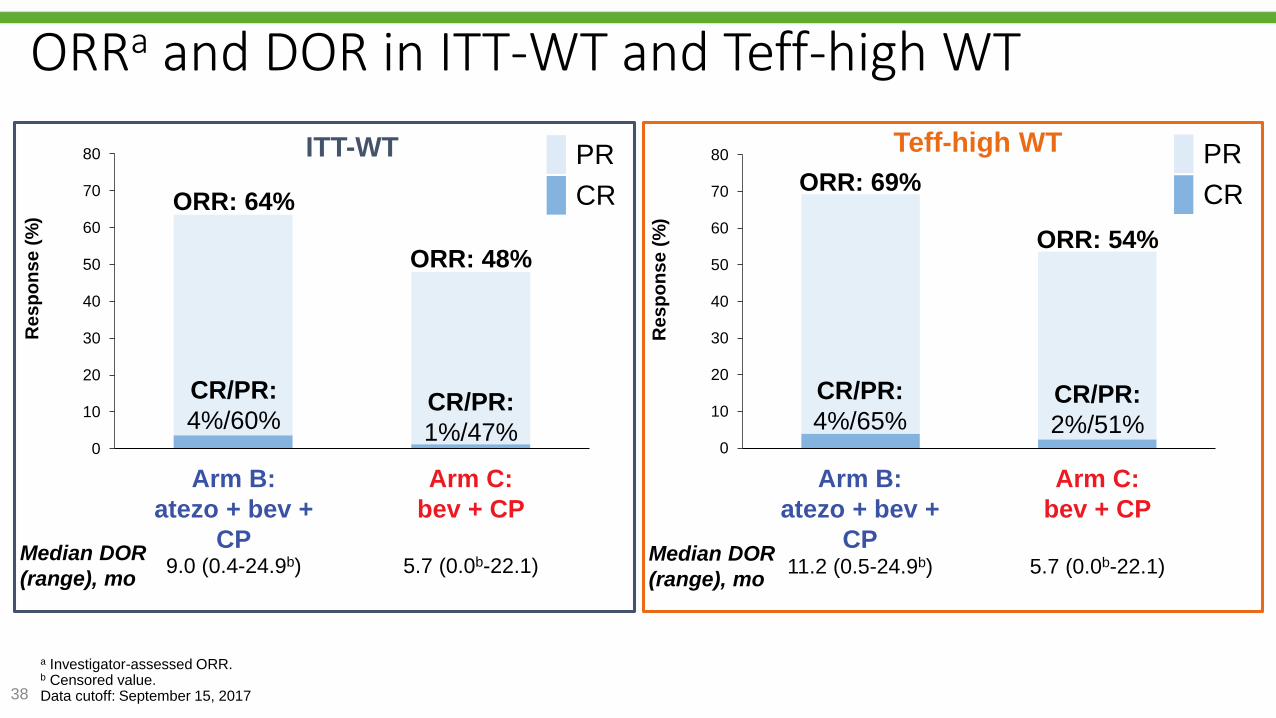
a Investigator-assessed ORR.b Censored value.Data cutoff: September 15, 2017
ORRa and DOR in ITT-WT and Teff-high WT
0
10
20
30
40
50
60
70
80
Arm B:atezo + bev + CP
Arm C:bev + CP
Re
sp
on
se
(%
)
CR/PR:
1%/47%
CR/PR:
4%/60% CR/PR:
2%/51%
CR/PR:
4%/65%
CR
PR
ORR: 48%
ORR: 64%
ORR: 54%
ORR: 69%
ITT-WT Teff-high WT
CR
PR
Median DOR
(range), mo9.0 (0.4-24.9b) 5.7 (0.0b-22.1)
Median DOR
(range), mo11.2 (0.5-24.9b) 5.7 (0.0b-22.1)
Arm B:
atezo + bev +
CP
Arm B:
atezo + bev +
CP
Arm C:
bev + CP
Arm C:
bev + CP
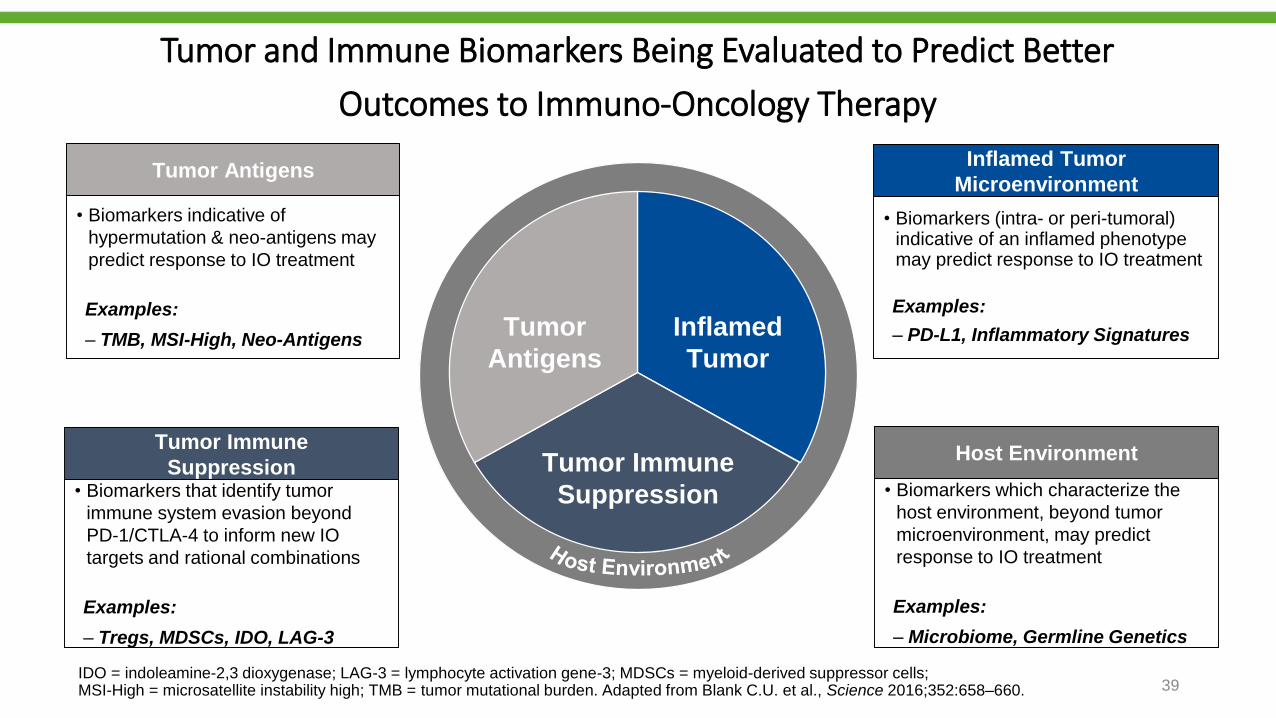
Tumor and Immune Biomarkers Being Evaluated to Predict Better
Outcomes to Immuno-Oncology Therapy
• Biomarkers indicative of
hypermutation & neo-antigens may
predict response to IO treatment
Examples:
‒ TMB, MSI-High, Neo-Antigens
Tumor Antigens
• Biomarkers that identify tumor
immune system evasion beyond
PD-1/CTLA-4 to inform new IO
targets and rational combinations
Examples:
‒ Tregs, MDSCs, IDO, LAG-3
Tumor Immune
Suppression
• Biomarkers (intra- or peri-tumoral) indicative of an inflamed phenotype may predict response to IO treatment
Examples:
‒ PD-L1, Inflammatory Signatures
Inflamed Tumor
Microenvironment
• Biomarkers which characterize the
host environment, beyond tumor
microenvironment, may predict
response to IO treatment
Examples:
‒ Microbiome, Germline Genetics
Host Environment
Tumor
Antigens
Tumor Immune
Suppression
Inflamed
Tumor
IDO = indoleamine-2,3 dioxygenase; LAG-3 = lymphocyte activation gene-3; MDSCs = myeloid-derived suppressor cells; MSI-High = microsatellite instability high; TMB = tumor mutational burden. Adapted from Blank C.U. et al., Science 2016;352:658–660. 39
Sumário
• Introdução
• Expressão tumoral de PD-L1
• Carga mutacional
• Perfil mutacional
• Outros biomarcadores
• Conclusões
Conclusões
• A expressão de PD-L1 nas células tumorais está associada com maiorresposta e maior sobrevida em pacientes tratados com terapia anti-PD1/PD-L1.
• Carga mutacional tem pouca sobreposição com PD-L1 e tem se mostradoum consistente preditor de resposta.
• Perfil mutacional pode predizer, pelo menos parcialmente, a carga mutacionale benefício ao tratamento.
• Provavelmente, será necessário a combinação de vários biomarcadores parase identificar a melhor estratégia do uso da imunoterapia.
Recommended