UNIVERSIDADE FEDERAL DO ESPÍRITO SANTO
CENTRO DE CIÊNCIAS HUMANAS E NATURAIS
PROGRAMA DE PÓS-GRADUAÇÃO EM OCEANOGRAFIA AMBIENTAL
CÍNTIA DA SILVA VARZIM
DETERMINAÇÃO DE IMPACTOS POR ENRIQUECIMENTO ORGÂNICO EM UM
ESTUÁRIO TROPICAL
VITÓRIA
2017
CÍNTIA DA SILVA VARZIM
DETERMINAÇÃO DE IMPACTOS POR ENRIQUECIMENTO ORGÂNICO EM UM
ESTUÁRIO TROPICAL
Dissertação de Mestrado apresentada ao Programa
de Pós-Graduação em Oceanografia Ambiental da
Universidade Federal do Espírito Santo, como requisito
parcial para obtenção do título de Mestre em
Oceanografia Ambiental. Orientador: Prof. Dr. Angelo
Fraga Bernardino.
VITÓRIA
2017

AGRADECIMENTOS
Aos Deuses.
À UFES, Departamento de Oceanografia e todas as pessoas envolvidas que
possibilitaram realizar esta pesquisa. Aos professores com quem tive aulas,
obrigada pelo empenho e dedicação de cada um de vocês.
Aos colegas de pesquisa do “Lab Bentos” por todos os momentos partilhados
e, pontualmente à Heliatrice, por me convidar a compor este time e ensinar sobre
identificação de bentos; à Hanieh, pelo suporte acadêmico e pessoal e, ao
Gushtavo, por ter se importado e me encorajado. Selva!
Às “estagiárias”, Lívia e Luisa, que se tornaram minhas amigas e hoje são
dedicadas oceanógrafas.
Ao meu neurologista, Dr. Saleme, por ver pelos meus olhos e além deles.
Aos que guiaram meus primeiros passos no budismo: Monge Daiju, Tayo e
demais ordenados. (Gassho).
Às amigas que também deixaram nosso amado Pampa em busca do algo
mais a que viemos nesta vida. Obrigada, Su, Liv e Mariana, pelo apoio e incentivo.
Aos companheiros de morada e de vida, High e Paris, pela compreensão,
afeto e companhia em noites não dormidas.
Aos amados, estimados, admirados, senhor e senhora: meus pais! Nilda e
Gilberto, por acreditarem. Criaram uma filha com asas mais fortes do que as raízes,
de espírito combatente e com um coração ainda maior do que os dois mil
quilômetros que nos separaram nesta jornada. Amo vocês.
Ao meu orientador, Angelo, o “Boss”, a quem devo o início, meio e fim de tudo
isto. Dedico meus maiores agradecimentos, pela acolhida e credibilidade. Pela
importância dada ao meu trabalho. Muito obrigada.
RESUMO
Os estuários são importantes áreas de transição entre terra e mar, caracterizados
pela alta produtividade biológica, vital às áreas costeiras adjacentes. Encontram-se
sob intensa exploração humana, tanto no setor urbano quanto industrial, através do
despejo de efluentes não tratados, com conseqüências para o ecossistema.
Considerando a quantidade de esgoto lançado nesses ecossistemas e a
necessidade de monitorar os impactos sofridos, é importante utilizar diferentes
metodologias para determinar a presença de poluentes e os seus efeitos ao longo
da cadeia alimentar estuarina. Neste projeto foi avaliado o impacto do
enriquecimento orgânico na comunidade bentônica da Baía de Vitória, na cidade de
Vitória, Espírito Santo, Brasil, utilizando assinaturas de isótopos estáveis (δ13C e
δ15N) aliados aos dados de esteróis marcadores geoquímicos coprostanol e
epicoprostanol, bem como a razão entre ambos, a fim de validar os dados fornecidos
pelas análises isotópicas. As assinaturas isotópicas para nitrogênio na fauna dos
pontos contaminados foi enriquecida em relação aos pontos não contaminados. A
distribuição de grupos tróficos em estações contaminadas e não contaminadas
apresentou diferença em relação ao fator contaminação, mostrando que assinaturas
isotópicas são capazes de indicar alterações ambientais em estuários tropicais.
Palavras-chave: bentos, estuário, Baía de Vitória, isótopos estáveis, poluição.
ABSTRACT
Estuaries are important transitional ecosystems between land and sea, with high
biological productivity and are vital for the adjacent coastal areas. They are under
intense human pressure, mainly urban and industrial, due to the dumping of
untreated effluents with impacts on the ecosystem. Considering the wide quantity of
sewage released in these ecosystems and the necessity of monitoring the effects of
these impacts, it is important to use different methods to determine the presence of
pollutants and their effects on the estuarine food chain. We evaluated the organic
enrichment impact on the benthic food web in Vitória Bay estuarine complex, Vitória,
Espírito Santo, Brazil. We used stable isotopes (δ13C and δ15N) from benthic
macrofauna, with geochemical markers as coprostanol and epicoprostanol and their
ratio, to validate isotopic analysis results. The macrofaunal nitrogen isotopic
signatures at contaminated sites were enriched when compared to the non-
contaminated. Macrofaunal trophic niche amplitude at most contaminated sites was
smaller if compared to the non-contaminated sites. Our results suggest that stable
isotopic signatures from benthic macrofauna could be used to evidence
environmental impacts from organic enrichment at tropical estuaries under heavily
polluted conditions.
Key-words: benthic, estuary, Vitória Bay, stable isotopes, pollution.
LISTA DE FIGURAS
Figure 1. Distribution of sites at the Vitória Bay estuary and Baía do Espírito Santo.19
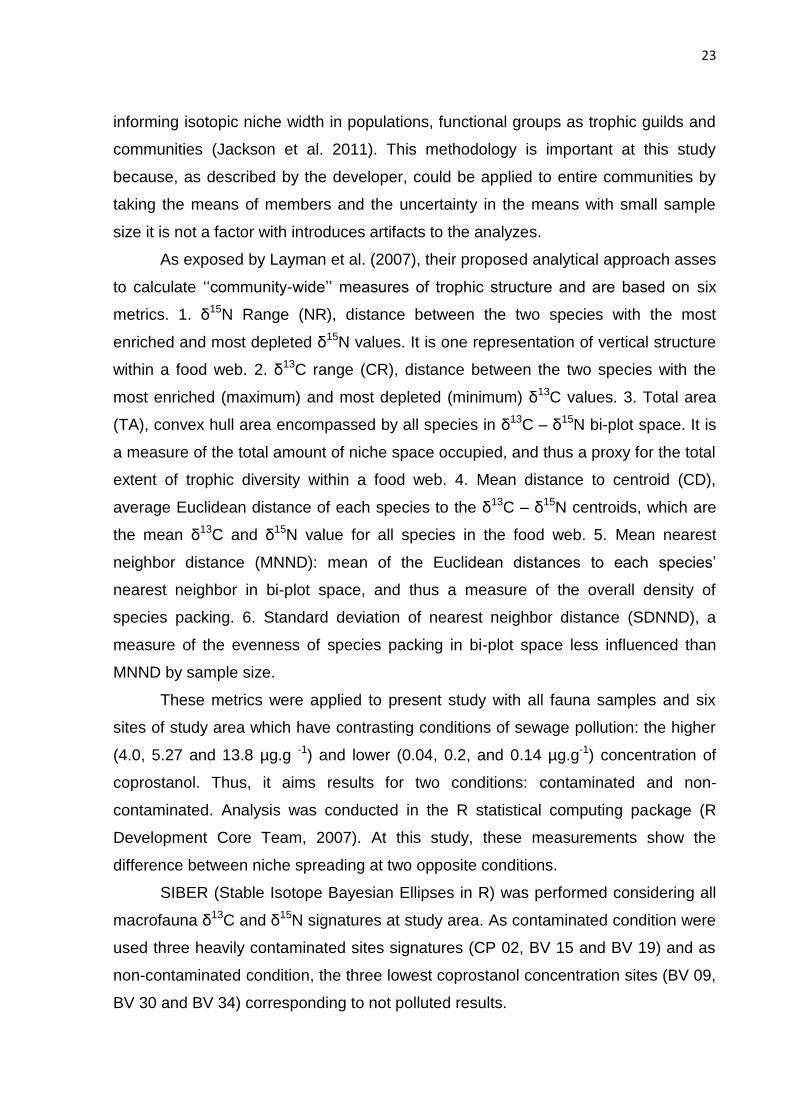
Figure 2. Coprostanol concentration (µg.g-1) at study area sampled points. Values
>1.0 μg.g -1 indicate sewage contamination (Grimalti, 1990)…………………..……...24
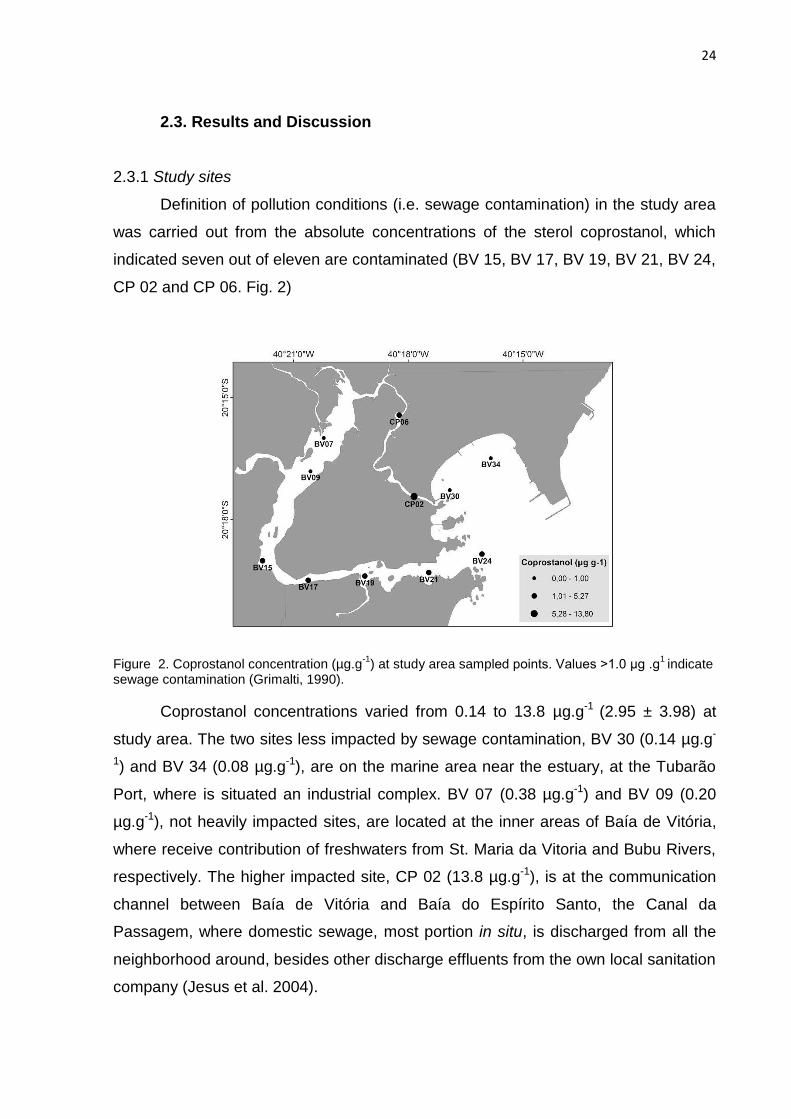
Figure 3. Ratio II (epicoprostanol/coprostanol) at study area sampled points. Values
<0.20 indicate not treated sewage (Grimalti, 1990)..………………………..………….25
Figure 4. Carbon isotopic values for the sediment samples at study area………......29
Figure 5. Nitrogen isotopic values for sediment samples at study area………..........30
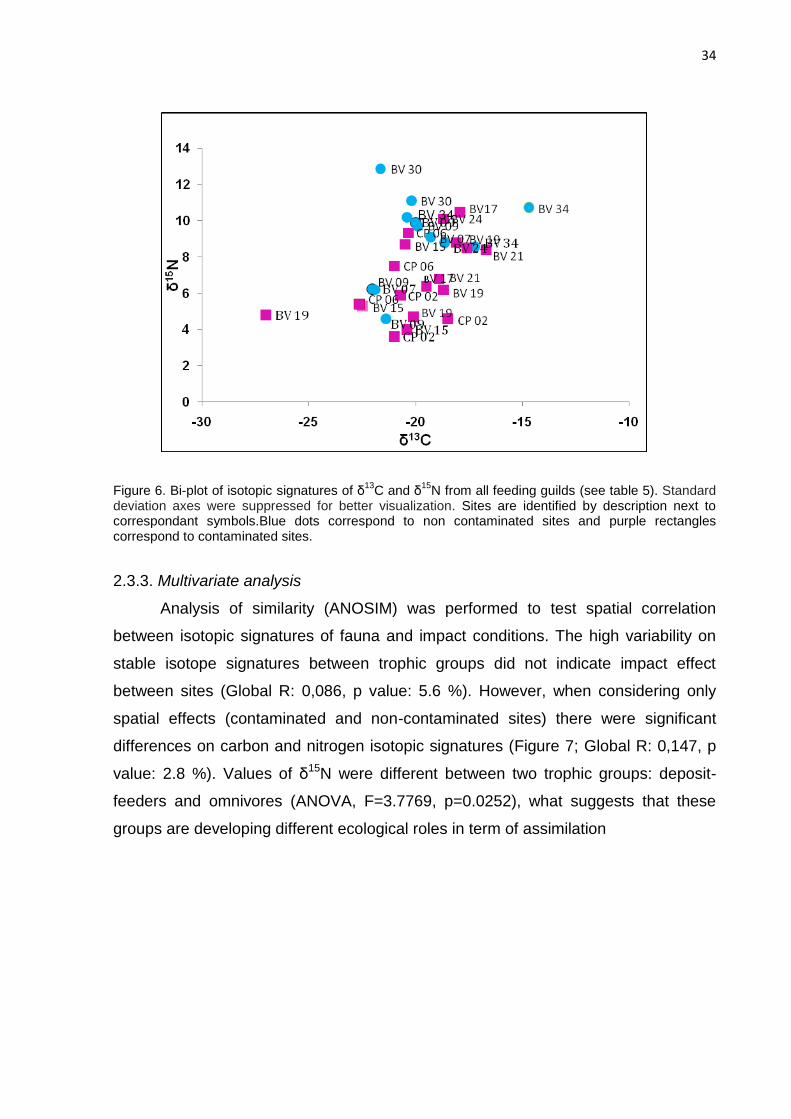
Figure 6. Bi-plot of isotopic signatures of δ13C and δ15N from all feeding guilds (see
table 5). Standard deviation axes were suppressed for better visualization. Sites are
identified by description next to correspondant symbols. Blue dots correspond to non
contaminated sites and purple rectangles correspond to contaminated sites……….34
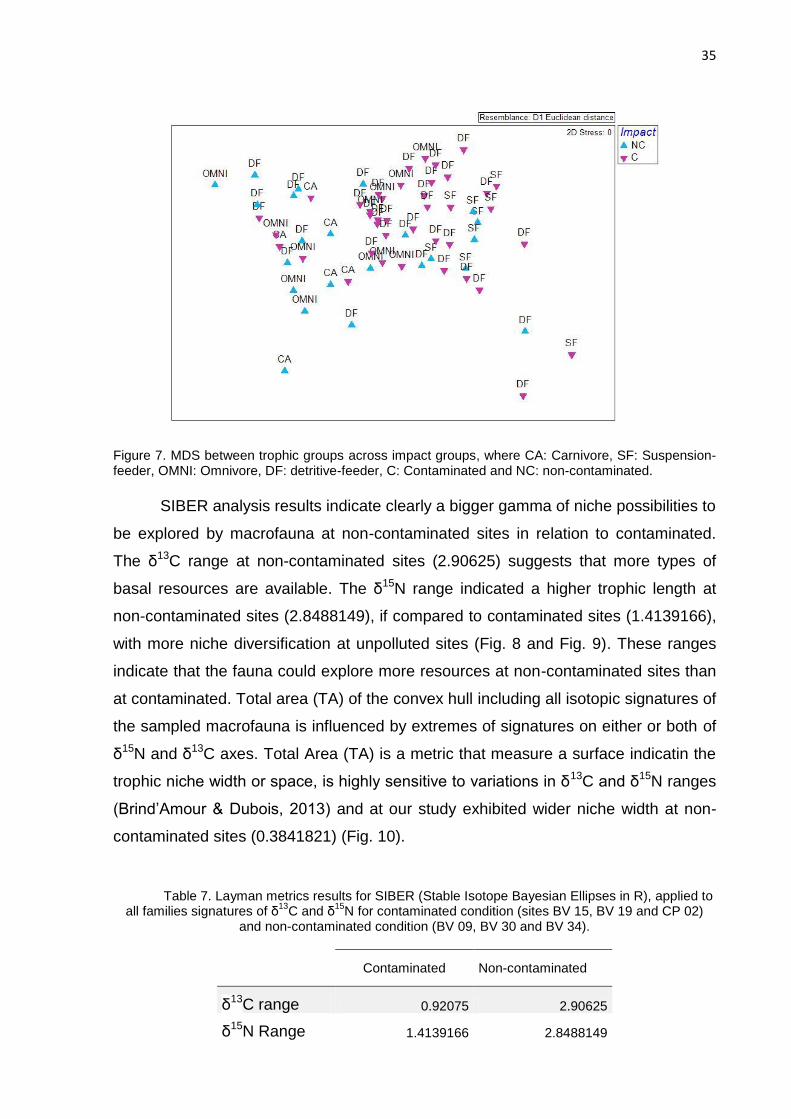
Figure 7. MDS between trophic groups across impact groups, where CA: Carnivore, SF: Suspension-feeder, OMNI: Omnivore, DF: Detritive-feeder, C: Contaminated and NC: Non-contaminated………………………………………………………………….....35
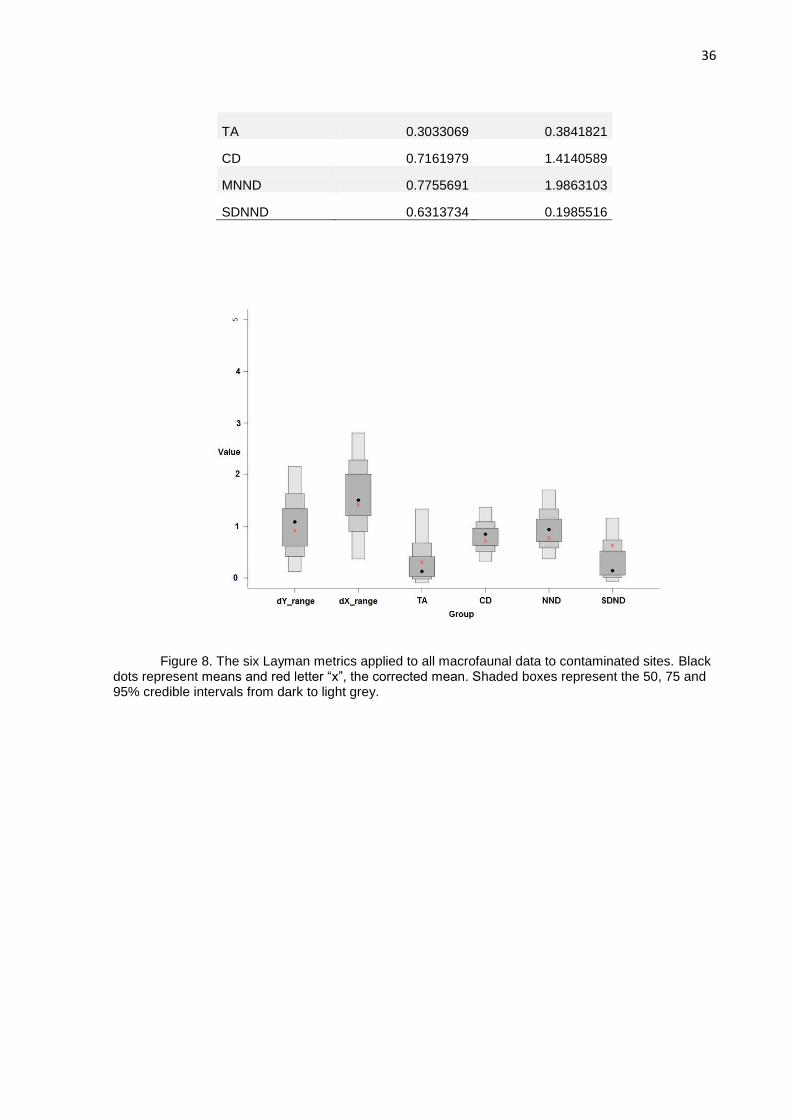
Figure 8. The six Layman metrics applied to all macrofaunal data to contaminated
sites. Black dots represent means and red letter “x”, the corrected mean. Shaded
boxes represent the 50, 75 and 95% credible intervals from dark to light
grey............................................................................................................................36
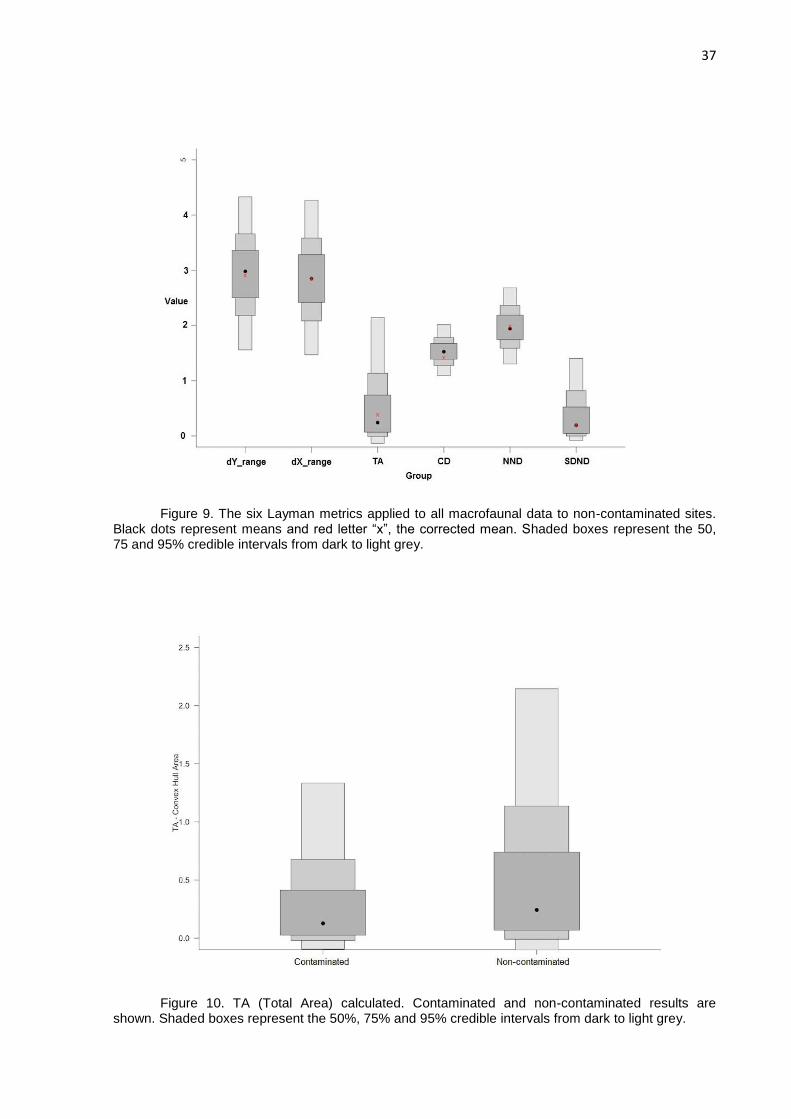
Figure 9. The six Layman metrics applied to all macrofaunal data to non-
contaminated sites. Black dots represent means and red letter “x”, the corrected
mean. Shaded boxes represent the 50, 75 and 95% credible intervals from dark to
light grey…………......................................................................................................37
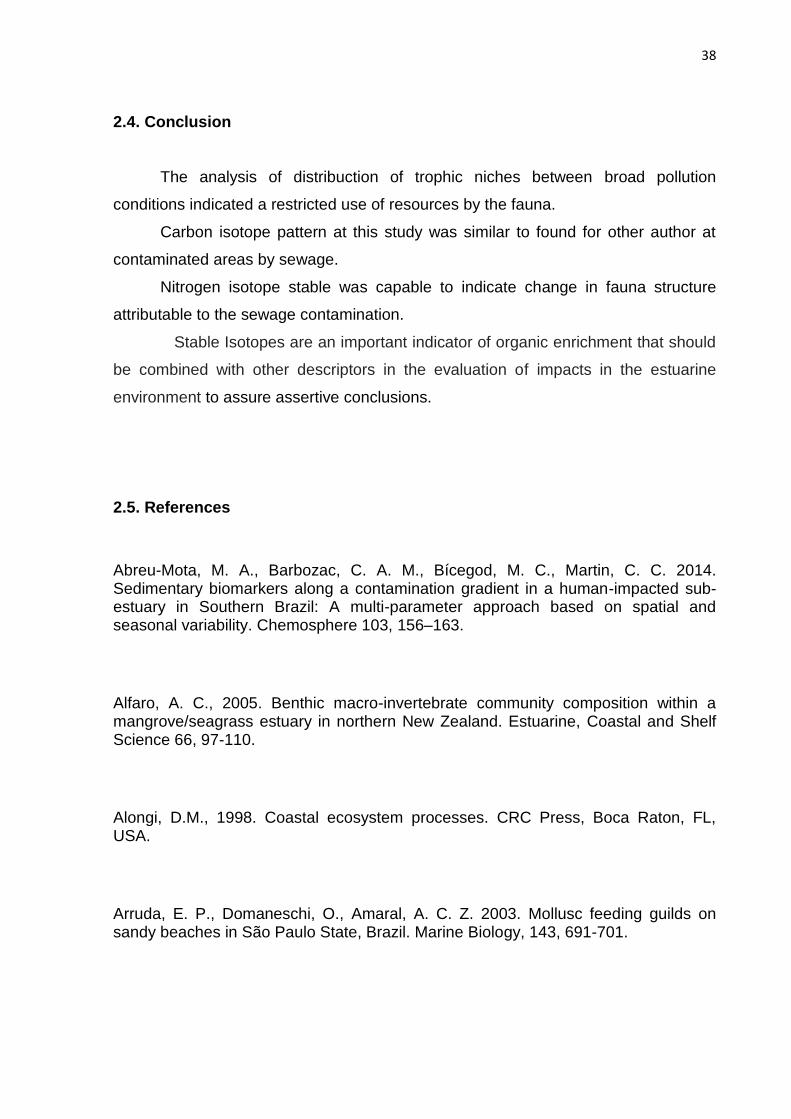
Figure 10. Total Area (TA) calculated. Contaminated and non-contaminated results
are shown. Shaded boxes represent the 50, 75 and 95% credible intervals from dark
to light grey………………..……………………..…………………..……………….…….37
LISTA DE TABELAS
Table 1. Number of benthic organisms sampled from dominant macrofaunal groups
at points and respective region from study area .......................................................20
Table 2. Twelve dominant macrofaunal families sampled at study area and selected
for isotopic analysis, in each site. Empty spaces indicate the absence of the
correspondent family to the respective site……………………………………………...20
Table 3. Coprostanol concentration (µg.g-1) at study area and other Brazilian
estuarine and coastal areas. DL: detection limit…….................................................26
Table 4. Nitrogen isotopic values for the sediment and families in the study area
(‰).............................................................................................................................28
Table 5. Carbon isotopic values for the sediment and families in the study area
(‰)…………………………………………………………………………………………...29
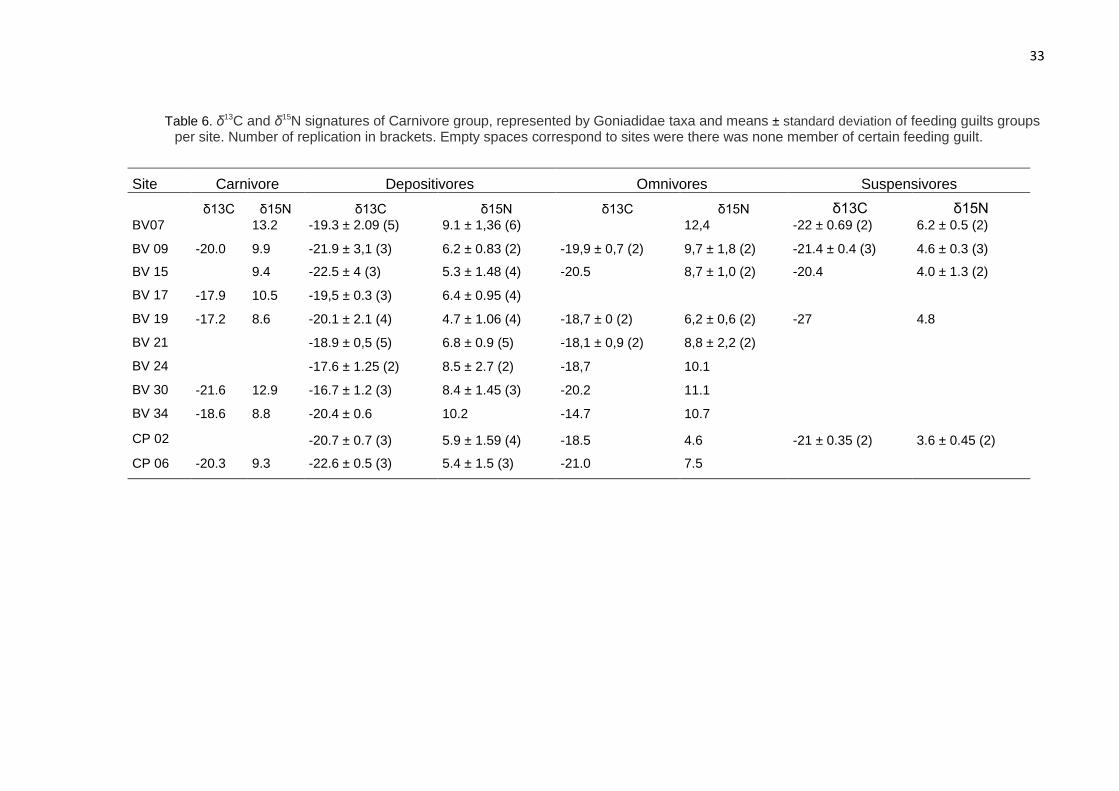
Table 6. δ13C and δ15N signatures of Carnivore group, represented by Goniadidae
taxa and means ± standard deviation of feeding guilt groups per site. Number of
replication in brackets. Empty spaces correspond to sites where there was none
member of certain feeding guilt…..............................................................................33
Table 7. Layman metrics results for SIBER (Stable Isotope Bayesian Ellipses in R),
applied to all families signatures of δ13C and δ15N for contaminated condition (sites
BV 15, BV 19 and CP 02) and non-contaminated condition (BV 09, BV 30 and BV
34)…………………………………………………………………………………………....35
SUMÁRIO
CAPÍTULO 1 - 1.1. Introdução geral………………..................................................09
1.2. Referências........................................................................................................11
CAPÍTULO 2 – Use of Stable Isotopes in Determining Impacts of Organic
Enrichment at a Tropical Estuary………………..………….……………..................15
2.1. Introduction.......................................................................................................16
2.2. Material e Methods............................................................................................18
2.2.1. Study area and sampling..................................................................................18
2.2.2. Laboratorial analysis……………………………………………………................19
2.2.3. Study sites……………….……….………………………………………...............22
2.2.4. Statistical analysis…………………………………………………………………..22
2.3. Results and Discussion…………………………………………………………….24
2.3.1 Study sites……………………………...………………….………………….……...24
2.3.2. Isotopic analysis…………………………………………………………….……....26
2.3.2.1. Sediment…………………………………………………………………………..26
2.3.2.2. Macrofaunal assemblages…………………………………………..….............31
2.3.3. Multivariate analysis……………………………..………….……….....................34
2.4. Conclusion.........................................................................................................38
2.5. References.........................................................................................................38
9
CAPÍTULO 1
1.1. Introdução geral
Estuários são ecossistemas de importância ecológica e econômica que, apesar
da variedade de serviços ambientais que propiciam para a humanidade, encontram-
se seriamente ameaçados em todo o mundo (Bouillon et al., 2008; Obade et al.,
2009). Os impactos humanos têm distanciado os estuários e ecossistemas costeiros
de sua base histórica como ecossistemas ricos, diversificados e produtivos (Lotze et
al., 2006). O intenso impacto antrópico nas áreas costeiras altera ambientes
estuarinos de variadas formas, como através da poluição de origem industrial e
urbana e de modificações físicas que visam adaptar os estuários às necessidades
humanas (Schettini et al., 2000; Cooper, 2002; Elliot & Quintino, 2007).
Ambientes estuarinos tropicais provêm importante habitat e recursos para
comunidades diversas de organismos bentônicos (Alfaro, 2005). São compostos por
espécies de hábitos interligados às condições ambientais, podendo servir como
indicadores ambientais (López-Gappa et al., 1990). A distribuição espacial desses
organismos está relacionada com fatores ambientais diversos incluindo estressores
antrópicos (Barros et al., 2008) como o lançamento de esgotos domésticos, com ou
sem tratamento prévio, que alteram o ambiente e, por conseguinte, as condições
ideais para a sobrevivência dos organismos (Carreira et al., 2001).
As comunidades macrobentônicas são compostas por espécies que podem
assimilar um conjunto de condições ambientais ao decorrer do seu tempo de vida
(Nalesso et al., 2005). Tais organismos permanecem junto ao substrato pelo menos
durante parte do seu ciclo de vida, associados aos tipos de fundo que integram os
componentes da diversidade aquática capaz de caracterizar a qualidade ecológica
do ambiente (Barbour et al., 1999). Dentre estes organismos, os poliquetas possuem
o papel de indicadores de poluição orgânica (Del-Pilar-Ruso et al., 2009).
A mais global das perturbações ambientais é o enriquecimento das águas
marinhas, condição que, por causas naturais ou artificiais, resulta em mudanças em
fatores químicos, físicos e biológicos que, por sua vez, têm efeitos diretos e indiretos
na fauna presente (Pearson & Rosenberg, 1978). As águas residuais municipais
constituem fonte de descarga de grandes montantes de compostos orgânicos ao
10
meio marinho, cujas partículas podem ser transportadas e resultarem incorporadas
ao sedimento (Maldonado et al., 2000). Uma das principais causas de deterioração
da qualidade da água e do aumento da carga de nutrientes em áreas costeiras e
internas é a poluição causada por resíduos humanos e animais (Leeming et al.,
1994).
Marcadores químicos constituem uma ferramenta amplamente utilizada para a
determinação da contaminação ambiental (Venkatesan & Mirsadeghi, 1992)
considerando, entre outros, esteróis como o coprostanol e o epicoprostanol por não
serem naturais de sedimentos marinhos, mas provenientes de material fecal humano
(Martins et al., 2005). A presença de coprostanol é um indicador de contaminação de
causa antrópica, já que ele é o principal esterol de origem fecal humana (Leeming et
al., 1994; Martins et al. 2005).
Isótopos estáveis de elementos como carbono, nitrogênio e enxofre têm sido
utilizados em estudos diversos acerca de ecologia costeira, empregando-se
comumente análises com os isótopos de carbono e de nitrogênio (Carvalho, 2008).
Tais análises podem fornecer informações sobre a dinâmica do fluxo de carbono e
da posição trófica dos consumidores nas cadeias alimentares (Mazumder et al.,
2015). A distribuição natural destes elementos reflete a história dos processos
metabólicos e físicos no ambiente, o que é uma ferramenta válida para estudos que
considerem estas variantes (Pereira, 2007). Os isótopos δ13C e δ15N permitem
caracterizar a descarga de esgoto e o efeito deste processo na cadeia alimentar
(Rogers, 1999). Análises desses isótopos na composição orgânica sedimentar na
biota marinha também fornecem uma visão detalhada da ciclagem dos elementos de
ecossistemas marinhos, permitindo distinguir a fonte orgânica e a posição trófica da
fauna na cadeia alimentar marinha (Alongi, 1998; Fry, 2006).
Devido à expansão da indústria de petróleo na região de Vitória e consequente
tráfego marinho, alterações na entrada de água doce se tornaram um dos vários
impactos antropogênicos que afetam a Baía de Vitória nos últimos cinqüenta anos
(Zalmon et. al, 2011). A ausência de planejamento das atividades humanas causa
prejuízos ambientais que levam a mudanças na comunidade biológica e na
qualidade dos serviços ecossistêmicos do sistema estuarino de Vitória (Grilo et al.
2016). Como resultado da crescente urbanização na cidade de Vitória e
considerando a capacidade de assimilação de matéria pelos organismos bentônicos
e pelo próprio substrato, esperamos encontrar diferenças significativas na assinatura
11
isotópica da fauna bêntica e do sedimento ao longo da área analisada. O presente
trabalho teve por objetivo, portanto, identificar as assinaturas isotópicas de
sedimento e de fauna em grupos majoritários de invertebrados bentônicos nas
estações amostradas, comparando eventuais mudanças espaciais com indicadores
geoquímicos de poluentes. Dessa forma, objetivamos validar a eficácia do uso de
isótopos estáveis como ferramenta para detectar impactos do enriquecimento
orgânico decorrente da ação antrópica no ambiente e os efeitos desse processo no
sistema estuarino da Baía de Vitória.
1.2. Referências
Alfaro, A. C., 2005. Benthic macro-invertebrate community composition within a mangrove/seagrass estuary in northern New Zealand. Estuarine, Coastal and Shelf Science 66, 97-110.
Alongi, D.M., 1998. Coastal ecosystem processes. CRC Press, Boca Raton, FL, USA.
Barbour, M. T., Gerritsen, J., Snyder, B. D., Stribling, J. B. 1999. Rapid bioassessment protocols for use in streams and wadeable rivers: Periphyton, Benthic Macroinvertebrates and Fish, Second Edition, EPA 841-8-99-002.
Barros, F., Hatje, V., Figueiredo, M. B., Magalhães, W. F., Dórea, H. S., Emídio, E. S. 2008. The structure of the benthic macrofaunal assemblages and sediments characteristics of the Paraguaçu estuarine system, NE, Brazil. Estuarine, Coastal and Shelf Science 78 (30), 753-762.
Bouillon, S., Borges, A. V., Castañeda-Moya, E., Diele, K., Dittmar, T., Dujke N. C., Kristense, E., Lee S. Y., Marchand, C., Middleburg, J. J., Rivera-Monroy, V. H.,Smith III, T. J., Twilley, R. 2008. Mangrove production and carbon sinks: A revision of global budget estimates. Global Biogeochemical Cycles 22, GB 2013.
12
Carreira, R., Wagener, A.L.R., Fileman, T.; Readman, J.W. 2001.Distribuição de coprostanol (5β (h)-colestan-3β-ol) em sedimentos superficiais da Baía de Guanabara: indicador da poluição recente por esgotos domésticos. Química Nova 24 (1), 37-42.
Carvalho, M. C. 2008. Uso dos isótopos estáveis de carbono, nitrogênio e enxofre em estudos de ecologia costeira. Oecologia Brasiliensis 12 (4), 694-705.
Cooper, J. A. G. 2002. Anthropogenic impacts on estuaries. Encyclopedia of Life Support Systems (EOLSS).
Del-Pilar-Ruso, Y., De-La-Ossa-Carretero, J. A., Loya-Fernández, A., Ferrero-Vicente, L. M., Giménez-Casalduero, F., Sánchez-Lizaso, J. L. 2009. Assessment of soft-bottom polychaeta assemblage affected by a spatial confluence of impacts: Sewage and brine discharges. Marine Pollution Bulletin 58, 765–786.
Elliot, M., Quintino, V. 2007. The estuarine quality paradox, environmental homeostasis and the difficulty of detecting anthropogenic stress in naturally stressed areas. Marine Pollution Bulletin 54, 640–645.
Fry, B., 2006. Stable Isotope Ecology. XII, 308 p. Springer, New York.
Leeming, R., Ball, A., Jhones, G., Ashbolt, N., Nichols, P. 1994. Distinguishing between human and animal sources of faecal pollution. Water Research 30 (12), 2893-2900.
López-Gappa, J. J., Tablado, A., Magaldi, N. H. 1990. Influence of sewage pollution on a rocky intertidal community dominated by the mytilid Brachidontes rodriguezi. Marine Ecology Progress Series 63, 163-175.
Lotze, H. K., Lenihan, H. S., Bourque, B. J., Bradbury R. H., Cooke, R. G., Kay, M. C., Kidwell, S. M., Kirby, M. X., Peterson, C. H., Jackson, J. B. C. 2006. Depletion, degradation and recovery potential of estuaries and coastal seas. Science 312, 1806-1809.
13
Maldonado, C., Venkatesan, M. I., Phillips, C. R., Bayona, J. M. 2000. Distribution of trialkylamines and coprostanol in San Pedro shelf sediments adjacent to a sewage outfall. Marine Pollution Bulletin 40 (8), 680-687.
Martins, C. C., Montone, R. C., Gambá, R. C., Pellizari, V. H. 2005. Sterols and fecal indicator microorganisms in sediments from admiralty Bay, Antarctica. Brazilian Journal Of Oceanography 53 (1/2), 1-12.
Mazumder D., Saintilan N., Alderson B. 2015. Hollins Inputs of anthropogenic nitrogen influence isotopic composition and trophic structure in SE Australian estuaries. Marine Pollution Bulletin 100 (1), 217-23.
Nalesso, R.C., Joyeux, J-C., Quintana C. O., Torezanil E., Otegui, A.C.P. 2005. Soft-bottom macrobenthic communities of the Vitória bay estuarine system, south-eastern Brazil. Brazilian Journal Of Oceanography 53 (1/2), 23-38.
Obade, P. T., Koedam, N., Soetaert, K., Neukermans, G., Bogaert, j., Nysse, E., Van Nedervelde, F., Berger, U., Dahdouh-Guebas, F. 2009. Impact of anthropogenic disturbance on a mangrove forest assessed by a 1D cellular automaton model using lotka-volterra-type competition. International Journal of Design & Nature and Ecodynamics 3 (4), 296–320.
Pearson, T. H., Rosenberg, R. 1978. Macrobenthic succession in relation to organic enrichment and pollution of the marine environment. Oceanograph and Marine Biology, an Annual Review 16, 229-31.
Pereira, A. L., 2007. Stable isotopes in ecological studies: methods, applications and perspectives. Revista Biociências, Taubaté 13 (1-2), 16-27.
Rogers, M. K. 1999. Effects of sewage contamination on macro-algae and shellfish at Moa Point, New Zealand using stable carbon and nitrogen isotopes. New Zealand Journal of Marine and Freshwater Research 33, 181-188.
14
Schettini, C. A. F., Pereira, Fo., J., Spillere, L. 2000. Notas Técnicas Facimar 4, 11-28.
Venkatesan, M. I., Mirsadeghi, F. H. 1992. Coprostanol as sewage tracer in McMurdo Sound, Antarctica. Marine Pollution Bulletin 25, 328-333.
Zalmon I. R., Krohling W., Ferreira, C. E. L. 2011. Abundance and diversity patterns of the sessile macrobenthic community associated with environmental gradients in Vitória Harbor, southeastern Brazil. Zoologia 28(5), 641–652.

15
CAPÍTULO 2
Use of Stable Isotopes in Determining Impacts of Organic Enrichment in the
Benthic Food Chain at a Tropical Estuary
Abstract
Estuaries are important transitional ecosystems between land and sea, characterized
by high biological productivity and vital for the adjacent coastal ecosystems. They are
under intense human exploitation, mainly urban and industrial, through the dumping
of untreated effluents with impacts on the ecosystem. Considering the wide quantity
of sewage released in these ecosystems and the necessity to monitor the effects of
these impacts, it is important to test different methods to identify the presence of
pollutants and their effects on the estuarine food chain. We evaluated the organic
enrichment impacts on the benthic communities in the Vitória Bay estuary, by
contrasting spatial patterns of stable isotopes signatures (δ13C and δ15N), with
geochemical markers for sewage contamination. Coprostanol concentrations ranged
from 0.14 to 13.8 µg.g-1 (2.95 ± 3.98) along the estuarine complex. Deposit-feeders
and omnivores had wide δ15N signatures, suggesting different trophic positions at the
study area. Carbon isotopic signatures of carnivore, deposit-feeders and omnivores
showed depletion at heavily impacted sites. Our results indicated that the benthic
fauna in contaminated sites exhibited less niche amplitude when compared to non-
contaminated areas, suggesting that organic contamination impact benthic food webs
and may be used as an indicator of pollution in coastal ecosystems.
Key-words: benthic, estuary, Vitória Bay, stable isotopes, pollution.
16
2.1. Introduction
Estuaries are transitional areas between land and sea (Kathiresan and
Bingham, 2001) ecologically and economically important but at the same time
seriously endangered globally (Bouillon et al., 2008; Obade et al., 2009; Olds et al.
2016). Human impacts in estuaries and coastal ecosystems altered biodiversity and
productivity (Lotze et al., 2006). The intense anthropogenic impacts on estuaries are
originated from pollution, coming from industrial and urban activities or by physical
modifications in order to adapt the estuaries to human necessities (Schettini et al.,
2000; Cooper, 2002; Elliot & Quintino, 2007).
Tropical estuaries provide important structure and resources to several
communities of benthic organisms (Alfaro, 2005) and they are composed by species
with habits linked to environmental conditions which serve as environmental
indicators (López-Gappa et al., 1990). Spatial distribution of these organisms is
connected to several environmental factors including anthropogenic stressors
(Barros et al., 2008) like the dump of domestic sewage, with or without previous
treatment, that alters environmental and conditions to the organisms survivor
(Carreira et al., 2001). Ecosystem impact assessments of estuarine ecosystems are
commonly based on the structure, function, and processes of benthic assemblages
and overall indicators of human activities (Muniz et al., 2012). In this context, the
polychaeta group has the role of indicator of organic pollution (Del-Pilar-Ruso et al.,
2009) and bivalves also constitute important biomarkers of anthropogenic impact
(Montagna & Kalke, 1995).
Organisms that belong to benthic communities naturally respond to spatial and
temporal changes quickly and are able to show signs of degradation (Warwick,
1993). In general, the ratio of sensitivity to tolerance of benthic species was used to
develop the biotic indices in order to estimate the environmental responses to
anthropogenic activities (Borja et al., 2000). The macrobenthic communities are
composed by species which can integrate a set of environmental conditions through
their lifetime (Nalesso et al., 2005) remaining close to the substrate at least for a
period of their life cycle, associated to types of bottom that ensemble the compounds
of aquatic diversity, able to characterize the environmental ecological quality
(Barbour et al., 1999).
The most universal environmental perturbation is the enrichment of marine
17
waters, by natural or artificial causes, that results in changing factors chemical,
physical and biological, with direct and indirect effects on the fauna (Pearson &
Rosenberg, 1978). One of main causes of deterioration of water quality and the
increase of nutrients in coastal and estuarine waters is the pollution caused by
human waste (Leeming et al., 1994). At South America, urban sewage is one of the
most important sources of marine pollution due to a high quantity of cities without
facilities to treat sewage (Martins et al., 2010).
Chemical markers constitute a tool to determine environmental contamination
by addition of sewage (Venkatesan & Mirsadeghi, 1992). They are compounds from
natural or anthropogenic origin (Abreu-Mota et al. 2014). Among chemical markers,
sterols as coprostanol (5β-cholestan-3β-ol) and epicoprostanol (5β-cholestan-3α-ol)
are not natural of marine sediments but are present in human fecal material (Martins
et al., 2005). Measures of coprostanol concentrations are useful to track domestic
inputs close to its source (Maldonado et. al. 2000). Stable isotopes δ13C and δ15N
from sedimentary organic matter also allow us to characterize the sewage discharge
and the effects of this process in the food chain (Rogers, 1999). Analysis of these
isotopes in sedimentary organic composition of marine biota can also provide a
detailed view of the cycling of elements of marine ecosystems, allowing distinguish
the organic source and the trophic position of fauna in marine food chain (Alongi,
1998; Fry, 2006).
Stable isotopes of elements such as carbon and nitrogen have been used in
several studies about coastal ecology (Carvalho, 2008). Such analysis may provide
insights about the dynamics of carbon flow and trophic position of consumers at food
chains (Mazumder et al., 2015). The natural distribution of these elements reflects
the history of metabolical and physical processes in the environment, which is a valid
tool to studies that consider these variants (Pereira, 2007). Ecosystems impacted by
sewage show variations in stable isotope signatures of carbon and nitrogen which
therefore may indicate effects on benthic food chain (West et al., 2006). Couch
(1989) has developed a study with benthic meiofauna, analysing assimilation of
Spartina alterniflora and benthic micro-algae by harpacticoid copepods and
nematodes using carbon and nitrogen stable isotope ratios. Iken et al. (2001)
analyzed food web structure of benthic meio- ,macro- and megafauna and evidenced
high competition for food at a very limited food system. Benthic macrofauna were
analyzed by Sampaio et al. (2010) to trace organic sources of carbon and nitrogen at

18
a coastal area under organic enrichment. Using carbon and nitrogen isotopic data of
benthic fauna and macroalgae, Mayir et al. 2011 characterized benthic food web at a
relative preserved marine ecosystem.
The discharge of municipal residual waters constitutes an important source of
organic compounds of anthropogenic origin to the estuarine and marine ecosystems
(Maldonado et al., 2000). The contamination of these systems is a relevant subject
for human and environmental health (Grilo et al. 2013). The dumping of sewage,
mostly not treated, is the main cause of environmental degradation that Victoria bay
has suffered in recent decades and characterizes this bay, along with factors as also
intense port activity, as eutrophic environment (Jesus et al., 2004).
Due to expanding the petroleum industry at region of Vitória, the marine traffic
has increased and the changes on the input of fresh water became one of the many
anthropic impacts that affect the Vitoria Bay during the last half century (Zalmon et.
al., 2011). The aim of this study was to test δ13C and δ15N isotopic signatures from
estuarine sediments and macrobenthic assemblages offer as a good proxy to identify
sewage impacts in Vitória Bay estuarine complex. Isotopic signatures were
compared to geochemical sewage markers to verify if these two data would be
congruent about indicating spatial contamination.
2.2. Material and methods
2.2.1. Study area and sampling
Vitória Bay is at the metropolitan area of Vitória city, Espírito Santo State,
Brazil and comprehends approximately 23 km² of mangrove (Chagas et al. 2006),
compounding a system with two coastal whater entrances, the Baía de Vitória itself
(BV) and the Canal da Passagem (CP) (Sterza & Fernandes, 2006). This channel
communicates the northwest Vitória Bay to a coastal embayment, through the Baía
do Espírito Santo (BV) (Jesus et al., 2004). This system is formed by the runoff of
many rivers, the Rio Santa Maria da Vitória has a midsize, while Format-Marine,
Bubu, Aribiri, Córrego Piranema and the Canal da Costa, are narrow rivers (Veronez-
Jr., 2009) (Fig. 1).
The average salinity within all study area ranged between 23.1 and 36.2 and
the average temperature, ranged between 22.1 to 27°C. The regions corresponding
19
to Baía de Vitória and Canal da Passagem presented polihaline condition and the
other regions, Canal do Porto and Baía do Espírito Santo, euhaline.
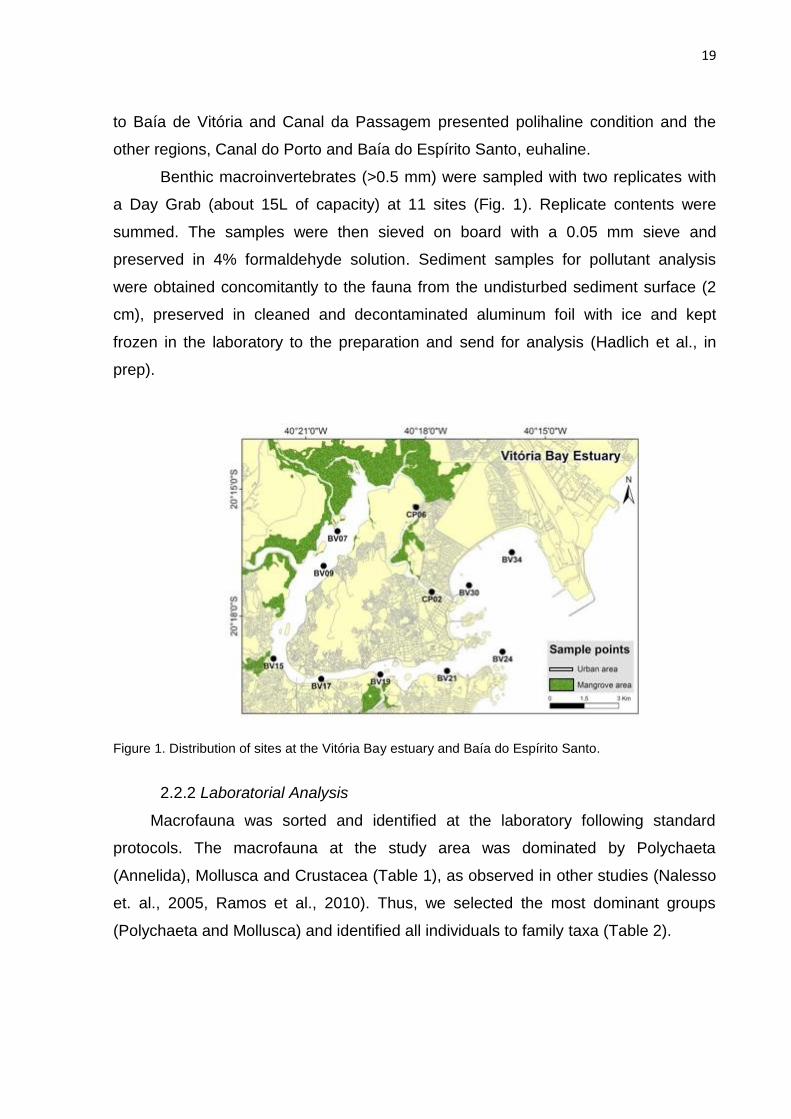
Benthic macroinvertebrates (>0.5 mm) were sampled with two replicates with
a Day Grab (about 15L of capacity) at 11 sites (Fig. 1). Replicate contents were
summed. The samples were then sieved on board with a 0.05 mm sieve and
preserved in 4% formaldehyde solution. Sediment samples for pollutant analysis
were obtained concomitantly to the fauna from the undisturbed sediment surface (2
cm), preserved in cleaned and decontaminated aluminum foil with ice and kept
frozen in the laboratory to the preparation and send for analysis (Hadlich et al., in
prep).
Figure 1. Distribution of sites at the Vitória Bay estuary and Baía do Espírito Santo.
2.2.2 Laboratorial Analysis
Macrofauna was sorted and identified at the laboratory following standard
protocols. The macrofauna at the study area was dominated by Polychaeta
(Annelida), Mollusca and Crustacea (Table 1), as observed in other studies (Nalesso
et. al., 2005, Ramos et al., 2010). Thus, we selected the most dominant groups
(Polychaeta and Mollusca) and identified all individuals to family taxa (Table 2).

20
Table 1. Number of benthic organisms sampled from dominant macrofaunal groups at points and respective region from study area.
BV 07, BV 09, BV 15 BV 17, BV 19, BV 21 BV 24, BV 30, BV 34 CP 02, CP 06
Total
Baía de Vitória Canal do Porto Baía do Espírito Santo Canal da Passagem
Annelida 1813 1277 223 376 3689
(Polychaeta)
Mollusca 561 221 18 76 876
Arthropoda 121 91 99 37 348
(Crustacea)
Others 62 76 2 80 220
Total 2557 1665 342 569 5133
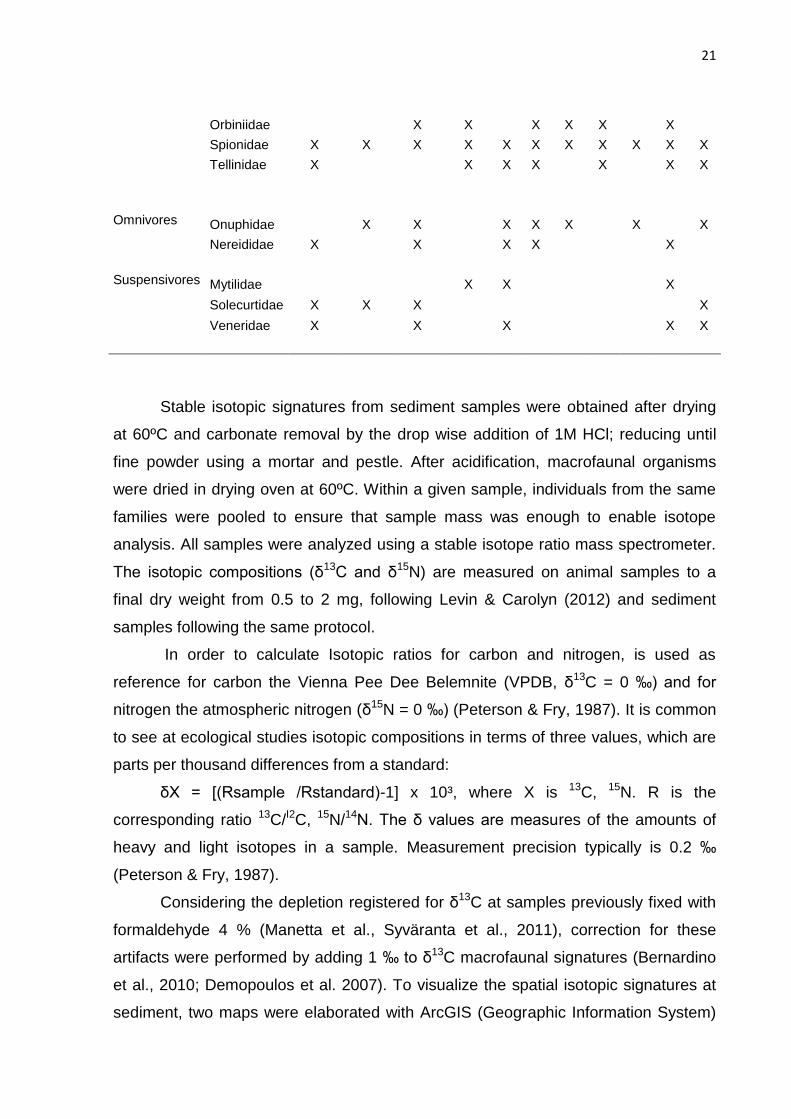
The twelve most dominant families at study area were selected for isotopic
analysis (Table 2). Feeding habits were obtained from bibliography. At the
Polychaeta group we found Capitellidae and Spionidae, deposit-feeders; Goniadidae,
carnivore; Onuphidae and Nereididae, omnivores (Jumars et al. 2015); Cirratulidae,
deposit-feeder (Amaral & Pardo, 2004) and Orbiniidae, deposit-feeder (Dean &
Blake, 2015). At Mollusca group we found Hydrobiidae, deposit-feeder (Kabat &
Hershler, 1993); Mytillidae, suspension-feeder (Mayir et al. 2011); Solecurtidae,
suspension-feeder; Tellinidae, deposit-feeder (Arruda et al., 2003) and Veneridae,
suspension-feeder (Narchi, 1972; Arruda et al. 2003).
Table 2. Twelve dominant macrofaunal families sampled at study area and selected for isotopic analysis, in each site. Empty spaces indicate the absence of the correspondent family to the
respective site.
Feeding Habit Family
BV
07
BV
09
BV
15
BV
17
BV
19
BV
21
BV
24
BV
30
BV
34
CP
02
CP
06
Carnivore Goniadidae X X X X X
X
X
Depositivores Capitellidae X X X X X X
X X
Cirratulidae
X X X X X Hydrobiidae X
X
21
Orbiniidae
X X
X X X
X Spionidae X X X X X X X X X X X
Tellinidae X
X X X
X
X X
Omnivores Onuphidae
X X
X X X
X
X
Nereididae X
X
X X
X
Suspensivores Mytilidae
X X
X Solecurtidae X X X
X
Veneridae X
X
X
X X
Stable isotopic signatures from sediment samples were obtained after drying
at 60ºC and carbonate removal by the drop wise addition of 1M HCl; reducing until
fine powder using a mortar and pestle. After acidification, macrofaunal organisms
were dried in drying oven at 60ºC. Within a given sample, individuals from the same
families were pooled to ensure that sample mass was enough to enable isotope
analysis. All samples were analyzed using a stable isotope ratio mass spectrometer.
The isotopic compositions (δ13C and δ15N) are measured on animal samples to a
final dry weight from 0.5 to 2 mg, following Levin & Carolyn (2012) and sediment
samples following the same protocol.
In order to calculate Isotopic ratios for carbon and nitrogen, is used as
reference for carbon the Vienna Pee Dee Belemnite (VPDB, δ13C = 0 ‰) and for
nitrogen the atmospheric nitrogen (δ15N = 0 ‰) (Peterson & Fry, 1987). It is common
to see at ecological studies isotopic compositions in terms of three values, which are
parts per thousand differences from a standard:
δX = [(Rsample /Rstandard)-1] x 10³, where X is 13C, 15N. R is the
corresponding ratio 13C/I2C, 15N/14N. The δ values are measures of the amounts of
heavy and light isotopes in a sample. Measurement precision typically is 0.2 ‰
(Peterson & Fry, 1987).
Considering the depletion registered for δ13C at samples previously fixed with
formaldehyde 4 % (Manetta et al., Syväranta et al., 2011), correction for these
artifacts were performed by adding 1 ‰ to δ13C macrofaunal signatures (Bernardino
et al., 2010; Demopoulos et al. 2007). To visualize the spatial isotopic signatures at
sediment, two maps were elaborated with ArcGIS (Geographic Information System)
22
(Fig 4 and 5), containing three range of values obtained by calculating three
mathematically uniform intervals comprising all values between the lowest and the
highest δ13C and δ15N at sediment.
2.2.3. Study sites
Samples for geochemical analyzes were frozen-dried and sent to the Organic
Geochemistry Laboratory of Sea Studies Center at the Federal University of Paraná
to follow analysis as proposed by Martins et al. (2008).
Fecal sterol, only, should not be considered an unambiguously attributed to
fecal matter inputs, so it does not provide an accurate assessment of the
contamination (Grimalt et al., 1990; Martins et al., 2010). Thus, is suggested using
ratios involving coprostanol with different sterols, so we used the coprostanol
concentration obtained as an indicator of pollution and the ratio II:
epicoprostanol/coprostanol, proposed by Grimalti et al. (1990). This ratio provides the
status of treated or not treated sewage, where smaller values than 0.2 µg.g -1
indicates untreated sewage.
2.2.4. Statistical analysis
A two-dimensional non-metric scaling (MDS) was performed based on a
Euclidean dissimilarity matrix (normalized variables, Primer 6.0) and used to visualize
variation between stable isotope signatures of feeding guilds and under impact
conditions. A One-Way Analysis of Variance (One-Way ANOVA) was used to test
differences between feeding guilds to δ13C and δ15N. In the aim to see how pollution
condition influences the isotopic niche distribution, Stable Isotope Bayesian Ellipses
(SIBER) analysis, were performed. SIBER analysis gives a comparison of isotopic
niche width, what could be more assertive than analysis with descriptive metrics and
it is possible to be applied to sets of data with different sample sizes (Jackson et al.
2011). This methodology allows quantify trophic diversity at food webs, including data
that may indicate niche diversification (Layman et al. 2007) and provide, to this study,
perspectives about how the macrofaunal structure is affected by organic enrichment.
We used the original metrics described by Layman et al. (2007), formulated
using Bayesian inference, a methodology that allow to generate robust measures of
isotopic niche width of both community members and entire communities, as a more
honest descriptor of community structure than usual descriptive metrics and
23
informing isotopic niche width in populations, functional groups as trophic guilds and
communities (Jackson et al. 2011). This methodology is important at this study
because, as described by the developer, could be applied to entire communities by
taking the means of members and the uncertainty in the means with small sample
size it is not a factor with introduces artifacts to the analyzes.
As exposed by Layman et al. (2007), their proposed analytical approach asses
to calculate „„community-wide‟‟ measures of trophic structure and are based on six
metrics. 1. δ15N Range (NR), distance between the two species with the most
enriched and most depleted δ15N values. It is one representation of vertical structure
within a food web. 2. δ13C range (CR), distance between the two species with the
most enriched (maximum) and most depleted (minimum) δ13C values. 3. Total area
(TA), convex hull area encompassed by all species in δ13C – δ15N bi-plot space. It is
a measure of the total amount of niche space occupied, and thus a proxy for the total
extent of trophic diversity within a food web. 4. Mean distance to centroid (CD),
average Euclidean distance of each species to the δ13C – δ15N centroids, which are
the mean δ13C and δ15N value for all species in the food web. 5. Mean nearest
neighbor distance (MNND): mean of the Euclidean distances to each species‟
nearest neighbor in bi-plot space, and thus a measure of the overall density of
species packing. 6. Standard deviation of nearest neighbor distance (SDNND), a
measure of the evenness of species packing in bi-plot space less influenced than
MNND by sample size.
These metrics were applied to present study with all fauna samples and six
sites of study area which have contrasting conditions of sewage pollution: the higher
(4.0, 5.27 and 13.8 µg.g -1) and lower (0.04, 0.2, and 0.14 µg.g-1) concentration of
coprostanol. Thus, it aims results for two conditions: contaminated and non-
contaminated. Analysis was conducted in the R statistical computing package (R
Development Core Team, 2007). At this study, these measurements show the
difference between niche spreading at two opposite conditions.
SIBER (Stable Isotope Bayesian Ellipses in R) was performed considering all
macrofauna δ13C and δ15N signatures at study area. As contaminated condition were
used three heavily contaminated sites signatures (CP 02, BV 15 and BV 19) and as
non-contaminated condition, the three lowest coprostanol concentration sites (BV 09,
BV 30 and BV 34) corresponding to not polluted results.
24
2.3. Results and Discussion
2.3.1 Study sites
Definition of pollution conditions (i.e. sewage contamination) in the study area
was carried out from the absolute concentrations of the sterol coprostanol, which
indicated seven out of eleven are contaminated (BV 15, BV 17, BV 19, BV 21, BV 24,
CP 02 and CP 06. Fig. 2)
Figure 2. Coprostanol concentration (µg.g
-1) at study area sampled points. Values >1.0 μg .g
1 indicate
sewage contamination (Grimalti, 1990).
Coprostanol concentrations varied from 0.14 to 13.8 µg.g-1 (2.95 ± 3.98) at
study area. The two sites less impacted by sewage contamination, BV 30 (0.14 µg.g-
1) and BV 34 (0.08 µg.g-1), are on the marine area near the estuary, at the Tubarão
Port, where is situated an industrial complex. BV 07 (0.38 µg.g-1) and BV 09 (0.20
µg.g-1), not heavily impacted sites, are located at the inner areas of Baía de Vitória,
where receive contribution of freshwaters from St. Maria da Vitoria and Bubu Rivers,
respectively. The higher impacted site, CP 02 (13.8 µg.g-1), is at the communication
channel between Baía de Vitória and Baía do Espírito Santo, the Canal da
Passagem, where domestic sewage, most portion in situ, is discharged from all the
neighborhood around, besides other discharge effluents from the own local sanitation
company (Jesus et al. 2004).
25
Sites BV 17, BV 19 and BV 21 presented 2.17, 5.27 and 1.40 µg.g-1
coprostanol concentrations, respectively, at the same area, Canal do Porto. These
may due to the influence of different inputs from rivers, BV 17 is close to Marinho
river, BV 19, to Aribiri River and BV 21, to the coastal area. These values may be
considered low indices of contamination when compared to other Brazilian
ecosystems, where it is possible to find an extreme of 40 µg.g-1, as demonstrate for
Carreira et al. (2014) studying the Guanabara Bay, at Rio de Janeiro, Brazil (Table
3).
Results for Ratio II (epicoprostanol/coprostanol) indicate only one site where
we cannot claim that sewage is absolutely not treated, BV 09 (0.25), so all the study
area except this site indicated presence of not treated sewage (Fig. 3). The lowest
value for ratio II (0.01) is at CP 02 site, where we found the higher concentration of
coprostanol. This suggests that this high sewage contamination is caused by not
treated sewage, discharged from urban area around the channel, as mentioned
above. The Canal do Porto sites analyzed follow the same pattern of high
concentration of coprostanol and lower value of ratio II, indicating directly relation
between discharges of not treated sewage and impacts reflected at sediment.
Figure 3. Ratio II (epicoprostanol/coprostanol) at study area sampled points. Values <0.20 indicate not treated sewage (Grimalti, 1990).

26
Table 3. Coprostanol concentration (µg.g-1) at study area and other Brazilian estuarine and coastal
areas. DL: detection limit.
Local Concentration (µg.g-1) Reference
Vitória bay estuarine complex, ES 0.2 to 13.8 Present study
Cotingachannel, PR <DL to 1.69 (Abreu et al., 2014)
Guanabara bay, RJ 0,01 to 40,0 (Carreira et al., 2004)
Sepetiba bay, RJ 0,01 to 0,42 (Carreira et al., 2009)
Guarajá bay, PA 0,06 to 7,93 (Gomes et al., 2015)
Vitória bay, ES 0,2 to 5,2 (Lehrback et al. 2016)
2.3.2. Isotopic analysis
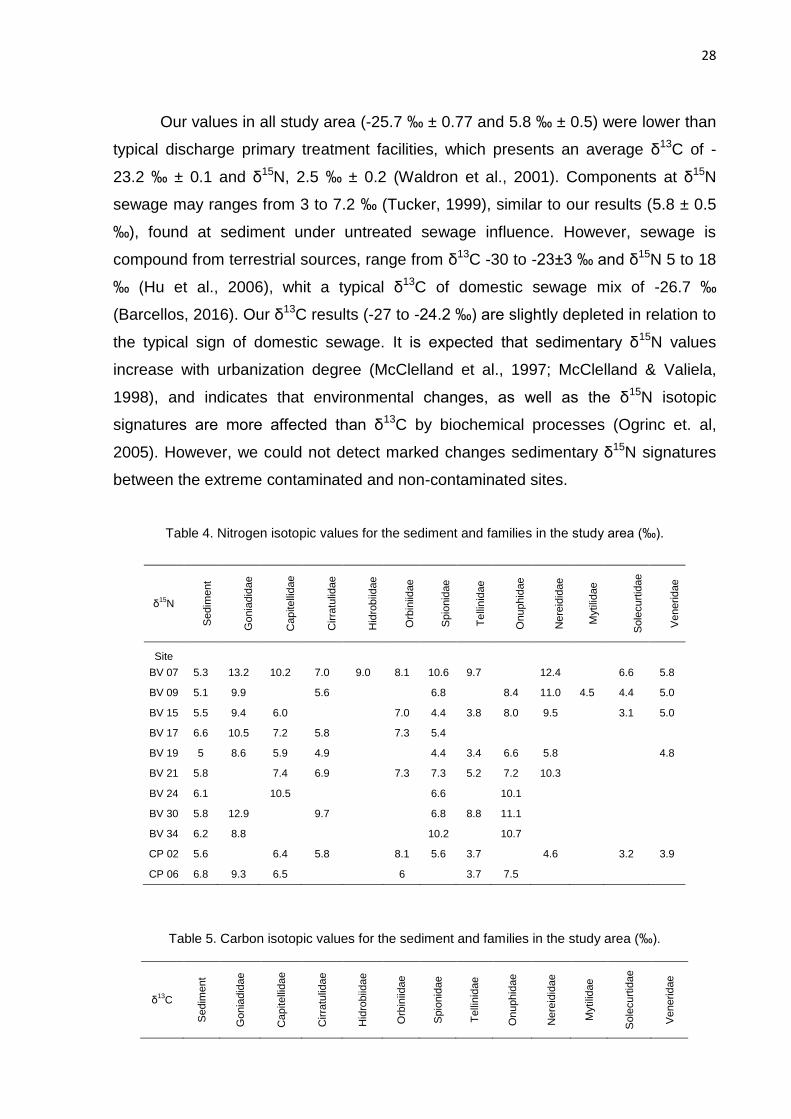
2.3.2.1 Sediment
The spatial sedimentary δ15N values ranged from 5 to 6.8 ‰, with an average
of 5.8 ± 0.5 ‰ (Table 4), which is comparable to found at other estuarine sediments
(4.6 ‰ ± 2.0, Owens, 1987; from 4.1 to 7.5 ‰, Barcellos, 2016).
In estuaries, there has been observed an increase in average δ13C values
from the inner estuary to the lower estuary (Barcellos et al. 2016). Average δ13C in
Vitória Bay estuarine complex were 25.5 ‰ (Canal do Porto), < -25.5 ‰ (Baía do
Espírito Santo) and < -26.2 ‰ (Canal da Passagem), thus this trend was not
observed to δ13C averages at the present study. The Canal do Porto and Baía do
Espírito Santo has similar sedimentary δ13C, indicating similar sources of carbon at
this two areas. Average sedimentary δ15N in the compartments of the study area
increased from the polyhaline (inner estuary) to the euhalyne (oceanic portion)
zones: 5.3 ‰ (Baía de Vitória), <5.8 ‰ (Canal do Porto), <6.0 ‰ (Baía do Espírito
Santo), <6.2 ‰ (Canal da Passagem).
The sediment δ13C signatures varied from -27 to -24.2 ‰ (-25.7 ± 0.77) (Table
5), similar to what was described by Barcellos et al. (2016), ranging from -28 to -24
‰ at an urban tropical Brazilian estuary under influence of domestic and industrial
wastes. Yu et al. (2010) observation found a bigger amplitude of signatures (-28.59
to -22.60 ‰) in comparison to our results, at a tropical estuary under significant
sewage contamination. Gao et al. (2012) described at Bohay Bay, China, sediment
δ13C from -18.23 to -25.69 ‰, and thus, suggested that anthropogenic activities have
27
a significant influence on the geochemistry of organic matter sediments besides
natural processes. The values at the present study are lower than the δ13C typical of
marine-derived organic matter (-18 to -22 ‰) (Ramaswamy et al., 2008) and higher
than sedimentary δ13C signatures at fresh water ambient, as described by Amorim et
al. (2009) in their study realized far 850 km from estuarine area (bank of Amazon
River, Brazil) where the signatures ranged between -31 and -23 ‰. Thus, the
distribution features of δ13C identified at present study suggest that organic matter in
surface sediments contents both mixed origins, derived from continental and marine,
under anthropogenic impacts influence.
At CP 02, the most contaminated site, with high coprostanol concentrations
(13.8 µg.g-1) and the lowest indices of ratio II (0.01), sedimentary δ15N (5.6 ‰) was
similar to average of all sampled sites (5.8 ± 0.5 ‰). Sedimentary δ13C was also
similar between CP 02 (-25.6 ‰) and average of all sampled sites (-25.7 ± 0.77 ‰).
CP 06, at same area than CP 02, had higher δ15N (6.8 ‰) when compared to all
other sites (values range from 5 to 6.8 ‰), what shows enrichment of 1 ‰ in
comparison to overall mean (5.8 ± 0.5 ‰). Sediments at the Canal da Passagem had
depleted δ13C average (-26.2 ± 0.78 ‰) when compared to other areas: Baía de
Vitória (-25.7 ‰ ± 0.77), Canal do Porto (-25.5 ‰ ± 0.49) and Baía do Espírito Santo
(-25.5 ‰ ± 1.42), and enriched δ15N (6.2 ±0.85 ‰) when compared to other areas at
study site: Baía de Vitória (5.3 ‰ ± 0.2), Canal do Porto (5.8 ‰ ± 0.8), Baía do
Espírito Santo (6.0 ‰ ± 0.21). Heavily contaminated sites, CP 02, BV 15 and BV 19,
showed similar δ15N signatures (5.6, 5.5 and 5 ‰, respectively), depleted in relation
to other nitrogen isotopic results at study less contaminated sites as BV 21 (5.8 ‰),
BV 24 (6.1 ‰), BV 17 (6.2 ‰), CP 06 (6.8 ‰) and one non-contaminated site (BV
34, 6.6 ‰). Heavily contaminated sites CP 02, BV 15 and BV 19 presented δ13C -
25.6 ‰, -26.1 ‰, -25.3 ‰, varying less than 0.05 ‰ to average carbon isotopic
sediments average (-25.7 ‰ ± 0.77). Site BV 34, with the smaller coprostanol
concentration (0.08 µg.g-1), a non-contaminated site, have high δ15N signature (6.2
‰), same as Canal da Passagem media and, the most depleted δ13C value (-27 ‰),
of all sites. BV 30, which presented low coprostanol concentration (0.14 µg.g-1) had
similar δ15N (5.8 ‰) to the average of all sites and the more enriched δ13C (-24.2 ‰).
BV 09, a non-contaminated site, as well as the two last mentioned, presented low
δ15N (5.1 ‰) and δ13C -25.5 ‰ value, close to media (-25.7 ‰ ± 0.77) for all sites.
28
Our values in all study area (-25.7 ‰ ± 0.77 and 5.8 ‰ ± 0.5) were lower than
typical discharge primary treatment facilities, which presents an average δ13C of -
23.2 ‰ ± 0.1 and δ15N, 2.5 ‰ ± 0.2 (Waldron et al., 2001). Components at δ15N
sewage may ranges from 3 to 7.2 ‰ (Tucker, 1999), similar to our results (5.8 ± 0.5
‰), found at sediment under untreated sewage influence. However, sewage is
compound from terrestrial sources, range from δ13C -30 to -23±3 ‰ and δ15N 5 to 18
‰ (Hu et al., 2006), whit a typical δ13C of domestic sewage mix of -26.7 ‰
(Barcellos, 2016). Our δ13C results (-27 to -24.2 ‰) are slightly depleted in relation to
the typical sign of domestic sewage. It is expected that sedimentary δ15N values
increase with urbanization degree (McClelland et al., 1997; McClelland & Valiela,
1998), and indicates that environmental changes, as well as the δ15N isotopic
signatures are more affected than δ13C by biochemical processes (Ogrinc et. al,
2005). However, we could not detect marked changes sedimentary δ15N signatures
between the extreme contaminated and non-contaminated sites.
Table 4. Nitrogen isotopic values for the sediment and families in the study area (‰).
δ15
N
Sedim
ent
Gonia
did
ae
Capitelli
dae
Cirra
tulid
ae
Hid
robiid
ae
Orb
iniid
ae
Spio
nid
ae
Te
llin
idae
Onuphid
ae
Nere
idid
ae
Mytilid
ae
Sole
curt
idae
Venerid
ae
Site BV 07 5.3 13.2 10.2 7.0 9.0 8.1 10.6 9.7
12.4
6.6 5.8
BV 09 5.1 9.9
5.6
6.8
8.4 11.0 4.5 4.4 5.0
BV 15 5.5 9.4 6.0
7.0 4.4 3.8 8.0 9.5
3.1 5.0
BV 17 6.6 10.5 7.2 5.8
7.3 5.4
BV 19 5 8.6 5.9 4.9
4.4 3.4 6.6 5.8
4.8
BV 21 5.8
7.4 6.9
7.3 7.3 5.2 7.2 10.3
BV 24 6.1
10.5
6.6
10.1
BV 30 5.8 12.9
9.7
6.8 8.8 11.1
BV 34 6.2 8.8
10.2
10.7
CP 02 5.6
6.4 5.8
8.1 5.6 3.7
4.6
3.2 3.9
CP 06 6.8 9.3 6.5
6
3.7 7.5
Table 5. Carbon isotopic values for the sediment and families in the study area (‰).
δ13
C
Sedim
ent
Gonia
did
ae
Capitelli
dae
Cirra
tulid
ae
Hid
robiid
ae
Orb
iniid
ae
Spio
nid
ae
Te
llin
idae
Onuphid
ae
Nere
idid
ae
Mytilid
ae
Sole
curt
idae
Venerid
ae
29
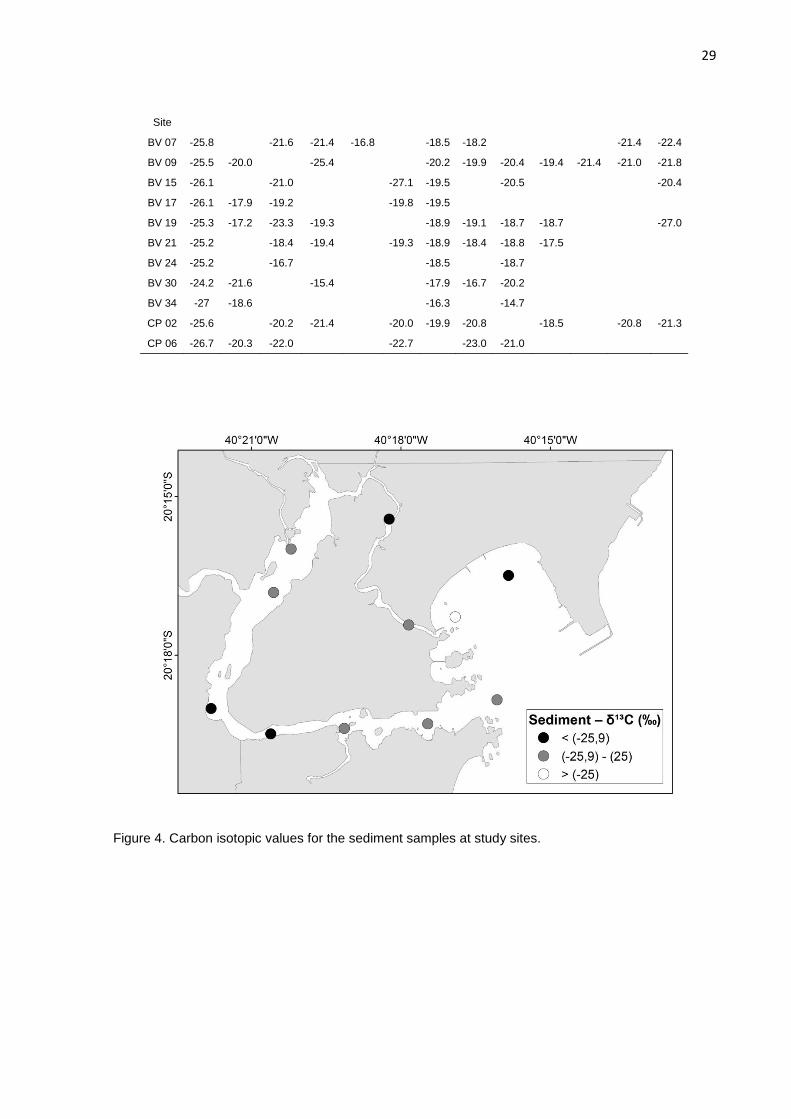
Site
BV 07 -25.8
-21.6 -21.4 -16.8
-18.5 -18.2
-21.4 -22.4
BV 09 -25.5 -20.0
-25.4
-20.2 -19.9 -20.4 -19.4 -21.4 -21.0 -21.8
BV 15 -26.1
-21.0
-27.1 -19.5
-20.5
-20.4
BV 17 -26.1 -17.9 -19.2
-19.8 -19.5
BV 19 -25.3 -17.2 -23.3 -19.3
-18.9 -19.1 -18.7 -18.7
-27.0
BV 21 -25.2
-18.4 -19.4
-19.3 -18.9 -18.4 -18.8 -17.5
BV 24 -25.2
-16.7
-18.5
-18.7
BV 30 -24.2 -21.6
-15.4
-17.9 -16.7 -20.2
BV 34 -27 -18.6
-16.3
-14.7
CP 02 -25.6
-20.2 -21.4
-20.0 -19.9 -20.8
-18.5
-20.8 -21.3
CP 06 -26.7 -20.3 -22.0 -22.7 -23.0 -21.0
Figure 4. Carbon isotopic values for the sediment samples at study sites.

30
Figure 5. Nitrogen isotopic values for sediment samples at study sites.
2.3.2.2 Macrofaunal assemblages
The δ13C and δ15N signatures of fauna ranged from -27 to -14.7 ‰ (Table 5)
and from 3.1 to 13.2 ‰ (Table 4), respectively.
Carnivores presented δ13C signatures between -21.6 to -17.2 ‰ (Table 6),
with no spatial changes from the inner to the oceanic portion along estuarine
complex. The most depleted δ13C signature (-21.6 ‰) was observed at a non-
contaminated site (BV 30) whereas the most enriched (-17.2 ‰) was observed at a
contaminated site (BV 19). The carnivores polychaeta Goniadidae presented heavier
δ15N signatures (13.2 ‰) when compared to all other families (3.1 to 12.4 ‰). δ15N
trophic fractionation is higher than at δ13C, changing about 3 ‰ per each trophic link
(Cabana & Rasmussen, 1994; Minagawa & Wada, 1984). When comparing
Goniadidae nitrogen signatures (from 8.6 to 9.4 ‰) in sites contaminated and non-
contaminated (from 8.8 to 13.2 ‰), depletion at contaminated results is observed.
At three higher coprostanol concentrations sites, depositivores presented δ15N
averages 5.9 ‰ ± 1.59 (CP 02), 5.3 ‰ ± 1.48 (BV 15) and 4.7 ‰ ± 1.06 (BV 19). At
lower coprostanol concentration sites, Depositivores δ15N averages were 6.2 ‰ ±
0.83 (BV 09), 8.4 ‰ ± 1.45 (BV 30) and value of 10.2 ‰ (BV 34), where no
31
replication was possible. Omnivores δ15N average at most contaminated sites were
4.6 ‰ (CP 02, where replication was not possible), 8.7 ‰ ± 1.0 (BV 15) and 6.2 ‰ ±
0.6 (BV 19). At lower contaminated sites, omnivore δ15N average 9.7 ‰ ± 1.8 (BV
09), 11.1 ‰ (BV 30) and 10.7 ‰ (BV 34), two last values are from sites without
replication. Suspensivores presented 3.6 ‰ ± 0.45 at CP 02, 4.0 ‰ ± 1.3 at BV 15
and 4.8 ‰ (no replication) at BV 19. Suspensivores δ15N average at BV 09 was 4.6
‰ ± 0.3 and at BV 30 and BV 34 there were no exemplars of this feeding group. So,
it is possible to observe that depositivores and omnivores presented depletion of
δ15N averages when comparing signatures between the three sites with higher
coprostanol concentrations (CP 02, BV 15 and BV 19) and the three lower
coprostanol concentrations (BV 09, BV 30 and BV 34).
Deposit-feeders average δ13C signatures ranged from -22.6 ‰ ± 0.5 to -16.7
‰ ± 1.2, similar to what Gearing (1991) observed at laboratorial experiments under
sewage conditions (-19.5 ‰ ± 1.6 to -17.7 ‰ ± 0.5). Similar δ13C signatures and
slightly depleted in relation to ours, were observed in depositivores by Sampaio
(2010), at an estuarine ecosystem under organic enrichment (δ13C -22.6 ‰ ± 1.5 to -
18.3 ‰ ± 1.1). Enriched δ13C (-15.4 ‰) signatures of depositivores were observed at
a non-contaminated site (BV 30) and the most depleted (-27.1 ‰), at a contaminated
site (BV 15). At food chains, δ13C presents little enrichment from food source to
consumer (0–1 ‰) (DeNiro & Epstein, 1978) but can vary between different
producers and, due to this, it is more commonly used as a source indicator (Abrantes
et al., 2014). Deposit-feeders ingest surface or subsurface food particles deposited in
sediments (Fauchald & Jumars, 1979), and these observations may reflect that
assimilation of carbon is different under different conditions of organic enrichment at
study area. Omnivores δ13C average ranged from -19.9 ± 0.7 ‰ to -18.1 ± 0.9 ‰
(Table 8). Benthic omnivores may simultaneously and sequentially feed on more than
one type of food (Jumars et al. 2015). In relation to sediment (-25.7 ‰ ± 0.77), group
average results (-18.9 ‰ ±1.7) are 6.8 ‰ enriched, indicating assimilation of food at
sediment and other possible sources. Suspension-feeders δ13C signatures ranged
from -22 ‰ ± 0.69 to -21‰ ± 0.35 (Table 8). These values are depleted in
comparison to Gearing (1991) laboratory experiments of sewage assimilation in
suspension feeders (-20.1 ‰ ± 0.7 to -19.8 ‰ ± 0.4).
The most depleted of all δ13C signatures (-27.1‰) were observed at a
contaminated site (BV 15) and the most enriched (-14.7 ‰), at a non-contaminated
32
(BV 34). The enriched δ13C signatures observed from carnivore (-18.6 ‰), deposit-
feeder (-15.4 ‰) and omnivores (-14.7 ‰) at non contaminated sites (BV 34, BV 30
and BV 34, respectively) suggests assimilation from different food sources than other
members of same families. Suspension-feeders had enriched values (-20.4 and -20.8
‰) at contaminated sites (BV 15 and CP 02, respectively) (Table 5). Differences
observed to contaminated and non-contaminated sites were identify by an Analysis
of Similarity (ANOSIM) between trophic groups considering the factor impact and
illustrated with a two-dimensional non-metric scaling (MDS) (Fig. 6).
33
Table 6. δ13C and δ15N signatures of Carnivore group, represented by Goniadidae taxa and means ± standard deviation of feeding guilts groups per site. Number of replication in brackets. Empty spaces correspond to sites were there was none member of certain feeding guilt.
Site Carnivore Depositivores Omnivores Suspensivores
δ13C δ15N δ13C δ15N δ13C δ15N δ13C δ15N
BV07
13.2 -19.3 ± 2.09 (5) 9.1 ± 1,36 (6)
12,4 -22 ± 0.69 (2) 6.2 ± 0.5 (2)
BV 09 -20.0 9.9 -21.9 ± 3,1 (3) 6.2 ± 0.83 (2) -19,9 ± 0,7 (2) 9,7 ± 1,8 (2) -21.4 ± 0.4 (3) 4.6 ± 0.3 (3)
BV 15
9.4 -22.5 ± 4 (3) 5.3 ± 1.48 (4) -20.5 8,7 ± 1,0 (2) -20.4 4.0 ± 1.3 (2)
BV 17 -17.9 10.5 -19,5 ± 0.3 (3) 6.4 ± 0.95 (4)
BV 19 -17.2 8.6 -20.1 ± 2.1 (4) 4.7 ± 1.06 (4) -18,7 ± 0 (2) 6,2 ± 0,6 (2) -27 4.8
BV 21
-18.9 ± 0,5 (5) 6.8 ± 0.9 (5) -18,1 ± 0,9 (2) 8,8 ± 2,2 (2)
BV 24
-17.6 ± 1.25 (2) 8.5 ± 2.7 (2) -18,7 10.1
BV 30 -21.6 12.9 -16.7 ± 1.2 (3) 8.4 ± 1.45 (3) -20.2 11.1
BV 34 -18.6 8.8 -20.4 ± 0.6 10.2 -14.7 10.7
CP 02
-20.7 ± 0.7 (3) 5.9 ± 1.59 (4) -18.5 4.6 -21 ± 0.35 (2) 3.6 ± 0.45 (2)
CP 06 -20.3 9.3 -22.6 ± 0.5 (3) 5.4 ± 1.5 (3) -21.0 7.5
34
Figure 6. Bi-plot of isotopic signatures of δ13
C and δ15
N from all feeding guilds (see table 5). Standard deviation axes were suppressed for better visualization. Sites are identified by description next to correspondant symbols.Blue dots correspond to non contaminated sites and purple rectangles correspond to contaminated sites.
2.3.3. Multivariate analysis
Analysis of similarity (ANOSIM) was performed to test spatial correlation
between isotopic signatures of fauna and impact conditions. The high variability on
stable isotope signatures between trophic groups did not indicate impact effect
between sites (Global R: 0,086, p value: 5.6 %). However, when considering only
spatial effects (contaminated and non-contaminated sites) there were significant
differences on carbon and nitrogen isotopic signatures (Figure 7; Global R: 0,147, p
value: 2.8 %). Values of δ15N were different between two trophic groups: deposit-
feeders and omnivores (ANOVA, F=3.7769, p=0.0252), what suggests that these
groups are developing different ecological roles in term of assimilation
35
Figure 7. MDS between trophic groups across impact groups, where CA: Carnivore, SF: Suspension-feeder, OMNI: Omnivore, DF: detritive-feeder, C: Contaminated and NC: non-contaminated.
SIBER analysis results indicate clearly a bigger gamma of niche possibilities to
be explored by macrofauna at non-contaminated sites in relation to contaminated.
The δ13C range at non-contaminated sites (2.90625) suggests that more types of
basal resources are available. The δ15N range indicated a higher trophic length at
non-contaminated sites (2.8488149), if compared to contaminated sites (1.4139166),
with more niche diversification at unpolluted sites (Fig. 8 and Fig. 9). These ranges
indicate that the fauna could explore more resources at non-contaminated sites than
at contaminated. Total area (TA) of the convex hull including all isotopic signatures of
the sampled macrofauna is influenced by extremes of signatures on either or both of
δ15N and δ13C axes. Total Area (TA) is a metric that measure a surface indicatin the
trophic niche width or space, is highly sensitive to variations in δ13C and δ15N ranges
(Brind‟Amour & Dubois, 2013) and at our study exhibited wider niche width at non-
contaminated sites (0.3841821) (Fig. 10).
Table 7. Layman metrics results for SIBER (Stable Isotope Bayesian Ellipses in R), applied to all families signatures of δ
13C and δ
15N for contaminated condition (sites BV 15, BV 19 and CP 02)
and non-contaminated condition (BV 09, BV 30 and BV 34).
Contaminated Non-contaminated
δ13C range 0.92075 2.90625
δ15N Range 1.4139166 2.8488149
36
TA 0.3033069 0.3841821
CD 0.7161979 1.4140589
MNND 0.7755691 1.9863103
SDNND 0.6313734 0.1985516
Figure 8. The six Layman metrics applied to all macrofaunal data to contaminated sites. Black dots represent means and red letter “x”, the corrected mean. Shaded boxes represent the 50, 75 and 95% credible intervals from dark to light grey.
37
Figure 9. The six Layman metrics applied to all macrofaunal data to non-contaminated sites.
Black dots represent means and red letter “x”, the corrected mean. Shaded boxes represent the 50, 75 and 95% credible intervals from dark to light grey.
Figure 10. TA (Total Area) calculated. Contaminated and non-contaminated results are
shown. Shaded boxes represent the 50%, 75% and 95% credible intervals from dark to light grey.
38
2.4. Conclusion
The analysis of distribuction of trophic niches between broad pollution
conditions indicated a restricted use of resources by the fauna.
Carbon isotope pattern at this study was similar to found for other author at
contaminated areas by sewage.
Nitrogen isotope stable was capable to indicate change in fauna structure
attributable to the sewage contamination.
Stable Isotopes are an important indicator of organic enrichment that should
be combined with other descriptors in the evaluation of impacts in the estuarine
environment to assure assertive conclusions.
2.5. References
Abreu-Mota, M. A., Barbozac, C. A. M., Bícegod, M. C., Martin, C. C. 2014. Sedimentary biomarkers along a contamination gradient in a human-impacted sub-estuary in Southern Brazil: A multi-parameter approach based on spatial and seasonal variability. Chemosphere 103, 156–163.
Alfaro, A. C., 2005. Benthic macro-invertebrate community composition within a mangrove/seagrass estuary in northern New Zealand. Estuarine, Coastal and Shelf Science 66, 97-110.
Alongi, D.M., 1998. Coastal ecosystem processes. CRC Press, Boca Raton, FL, USA.
Arruda, E. P., Domaneschi, O., Amaral, A. C. Z. 2003. Mollusc feeding guilds on sandy beaches in São Paulo State, Brazil. Marine Biology, 143, 691-701.
39
Barbour, M. T., Gerritsen, J., Snyder, B. D., Stribling, J. B. 1999. Rapid Bioassessment Protocols for Use in Streams and Wadeable Rivers: Periphyton, Benthic Macroinvertebrates and Fish, Second Edition, EPA 841-8-99-002.
Barros, F., Hatje, V., Figueiredo, M. B., Magalhães, W. F., Dórea, H. S., Emídio, E. S., 2008. The structure of the benthic macrofaunal assemblages and sediments characteristics of the Paraguaçu estuarine system, NE, Brazil. Estuarine, Coastal and Shelf Science 78(30), 753-762.
Bernardino, A. F., Smith, C. R., Baco, A., Altamira, I., Sumida, P. Y. G., 2010. Macrofaunal succession in sediments around kelp and wood falls in the deep NE Pacific and community overlap with other reducing habitats. Deep-Sea Research Part I 57, 708-723.
Bouillon, S., Borges, A. V., Castañeda-Moya, E.,Diele, K., Dittmar, T., Dujke N. C., Kristense, E., Lee S. Y., Marchand, C., Middleburg, J. J., Rivera-Monroy, V. H.,Smith III, T. J., Twilley, R. 2008, Mangrove production and carbon sinks: A revision of global budget estimates, Global Biogeochemical Cycles, 22. GB 2013.
Carreira, R., Wagener, A.L.R., Fileman, T.; Readman, J.W. 2001. Distribuição de coprostanol (5β(h)-colestan-3β-ol) em sedimentos superficiais da Baía de Guanabara: indicador da poluição recente por esgotos domésticos. Química Nova 24 (1), 37-42.
Carvalho, M. C. 2008. Uso dos isótopos estáveis de carbono, nitrogênio e enxofre em estudos de ecologia costeira. Oecologia Brasiliensis 12 (4), 694-705.
Chagas, L. P., J-C. Joyeux, and F. R. Fonseca. Small-scale spatial changes in estuarine fish: subtidal assemblages in tropical Brazil. Journal of the Marine Biological Association of the United Kingdom 86.4 (2006): 861-875.
Cooper, J. A. G. 2002. Anthropogenic impacts on estuaries. Encyclopedia of Life Support Systems (EOLSS).
40
Couch, C. A. 1989. Carbon and nitrogen stable isotopes of meiobenthos and their food resources. Estuarine, Coastal and Shelf Science 28, 433-441.
Dean, H. K., Blake J. A. 2015. The Orbiniidae (Annelida: Polychaeta) of Pacific Costa Rica. Zootaxa 3956 (2).
Demopoulos, A. W. J., Fry. B, Smith, C.R. 2007. Food web structure in exotic and native mangroves: a Hawaii – Puerto Rico comparison. Oecologia 153, 675–686.
Del-Pilar-Ruso, Y., De-La-Ossa-Carretero, J. A., Loya-Fernández, A., Ferrero-Vicente, L. M., Giménez-Casalduero, F., Sánchez-Lizaso, J. L. 2009. Assessment of soft-bottom Polychaeta assemblage affected by a spatial confluence of impacts: Sewage and brine discharges. Marine Pollution Bulletin 58, 765–786.
Elliot, M., Quintino, V. 2007. The Estuarine Quality Paradox, Environmental homeostasis and the difficulty of detecting anthropogenic stress in naturally stressed areas. Marine Pollution Bulletin 54, 640–645.
Fry, B., 2006. Stable Isotope Ecology.XII, 308 p. Springer, New York.
Grilo, C; F., Neti, R. R., Vicente, M. A., De Catro, E. V. R., Figueira, R. C. L., Carreira, R. S. 2013. Evaluation of the influence of urbanization processes using mangrove and fecaj markers in recent matter in a tropical tidal flat estuary. Applied Geochemistry 38, 82-91.
Grilo, C.F., Santos, C.C., Boina, C., Pinto, T. K., Barroso, G. F., Neto, R. R. A Survey of the eutrophication state of an urbanized tropical estuary, the case of the Great Vitória estuarines system, Brazil. 2016. Brazilian Journal of Aquatic Science and Technology 20, 21-28.
Gao, X.; Yang, Y.; Wang, C. 2012. Geochemistry of organic carbon and nitrogen in surface sediments of coastal Bohai Bay inferred from their ratios and stable isotopic signatures. Marine Pollution Bulletin 64 (6) 1148–1155.
41
Grimalt, J. O., Fernández, P., Bayona, J. M., Albaigés, J., 1990. Assessment of fecal sterols and ketones as indicators of urban sewage inputs to coastal waters. Environmental Science & Technology 24, 357-363.
Iken , K., Brey T., Wand, U., Voigt, J., Junghan, P. 2001. Food web structure of the benthic community at the Porcupine Abyssal Plain (NE Atlantic): a stable isotope analysis. Progress in Oceanography 50, 383-405.
Jesus, H. C, Costa, E. A., Mendonça, A. S. F., Zandonade, E., 2004. Distribuição de metais pesados em sedimentos do sistema estuarino da Ilha de Vitória - ES. Química Nova 27 (3), 378-386.
Jumars, P. A., Dorgan, K. M., Lindsay, S. M. 2015. Diet of worms emended: An update of polychaete feeding guilds. Annual Review of Marine Science 7, 20.1-20.24.
Kabat, A. R., Hershler, R. 1993. The prosobranch snail family Hydrobiidae (Gastropoda: Rissooidea): Review of classification and supraspecific taxa. Smithsonian Contributions to Zoology, 547.
Kathiresan, K..; Binghan, B. L. 2001. Biology of mangroves and mangrove ecosystems. Advances in Marine Biology 40, 81-251.
Leeming, R., Ball, A.; Jhones, G., Ashbolt, N., Nichols, P. 1994. Distinguishing between human and animal sources of faecal pollution. Water Research 30 (12), 2893-2900.
Levin, L. A., Carolyn, C. 2012. Stable isotope protocols: Sampling and sample processing. Scripps Institution of Oceanography Technical Report.
López-Gappa, J. J., Tablado, A., Magaldi, N. H. 1990. Influence of sewage pollution on a rocky intertidal community dominated by the mytilid Brachidontes rodriguezi. Marine Ecology Progress Series 63, 163-175.
42
Lotze, H. K., Lenihan, H. S., Bourque, B. J., Bradbury R. H., Cooke, R. G., Kay, M. C., Kidwell, S. M., Kirby, M. X., Peterson, C. H., Jackson, J. B. C. 2006. Depletion, degradation, and recovery potential of estuaries and coastal seas. Science. Reports 312, 1806-1809.
Maldonado, C., Venkatesan, M. I., Phillips, C. R., Bayona, J. M. 2000. Distribution of trialkylamines and coprostanol in San Pedro shelf sediments adjacent to a sewage outfall. Marine Pollution Bulletin 40(8), 680-687.
Manetta, G. I., Benedito, E., Ducatti C. 2011. Effect of alcohol and formaldehyde on the δ13C and δ15N isotopic composition of Plagioscion squamosissimus and Hypophthalmus edentatus (Pisces, Osteichthyes). Acta Scientiarum. Biological Sciences 33 (4), 393-397.
Martins, C. C., Montone, R. C., Gambá, R. C.,Pellizari, V. H. 2005. Sterols and fecal indicator microorganisms in sediments from admiralty Bay, Antarctica. Brazilian Journal Of Oceanography 53 (1/2), 1-12.
Martins, C. C., Ferreira, J. A., Taniguchi, S., Mahiques, M. M., Bícego, M. C., Montone, R. C. 2008. Spatial distribution of sedimentary linear alkylbenzenes and faecal steroids of Santos Bay and adjoining continental shelf, SW Atlantic, Brazil: Origin and fate of sewage contamination in the shallow coastal environment. Marine Pollution Bulletin 56, 1353-1376.
Martins, C. C., Braun, J. A. F., Seyffert, B. H., Machado, E. C., Fillman, G. 2010. Anthropogenic organic matter inputs indicated by sedimentary fecal steroids in a large South American tropical estuary (Paranaguá estuarine system, Brazil). Marine Pollution Bulletin 60: 2137-2143.
Mazumder D., Saintilan N., Alderson B. 2015. Hollins Inputs of anthropogenic nitrogen influence isotopic composition and trophic structure in SE Australian estuaries. Marine Pollution Bulletin 100(1), 217-23.
43
Mayr, C. C., Försterra, G., Häussermann, V., Wunderlich, A., Grau, J., Zieringer, M., Altenbach, A. V. 2011. Stable isotope variability in a Chilean fjord food web: implications for N- and C-cycles. Marine Ecology Progress Series 428, 89-104.
Montagna P., Kalke R. 1995. Ecology of infauna Mollusca in south Texas estuaries. American Malacological Bulletin 11, 163-175.
Muniz, C. D., Nieto, P. J. G., Fernández, A. J. R., Torres, J. M., Taboada, J. 2012. Detction of outliers in water quality monitoring samples using functional data analysis in San Esteban estuary (Northern Spain). Science of the Total Environment 439, 54-61.
Nalesso, R.C.,Joyeux, J-C.,Quintanal, C.O.,Torezanil E.,Oteguil, A.C.P. 2005. Soft-bottom macrobenthic communities of the Vitória bay estuarine system, south-eastern Brazil. Brazilian Journal Of Oceanography 53 (1/2), 23-38.
Narchi, W. 1972. Comparative Study of the Functional Morphology of Anomalocardia brasiliana (Gmelin, 1791) and Tivela Mactroides (Born, 1778) (Bivalvia, Veneridae). Bulletin of Marine Science 22(3).
Obade, P. T., Koedam, N., Soetaert, K., Neukermans, G., Bogaert, j., Nysse, E., Van Nedervelde, F., Berger, U., Dahdouh-Guebas, F. 2009. International Journal of Design & Nature and Ecodynamics 3 (4), 296–320.
Pardo, E. V., Amaral, A. C. Z. 2004. Feeding Behavior of the Cirratulid Cirriformia filigera (Delle Chiaje, 1825) (Annelida: Polychaeta). Brazilian Journal of Biology 64(2), 283-288.
Pearson, T. H., Rosenberg, R. 1978. Macrobenthic succession in relation to organic enrichment and pollution of the marine environment. Oceanographic and Marine Biology, An Annual Review 16, 229-31.
44
Olds, Andrew D., Connolly, Rod M., Pitt, Kylie A., Pittman, Simon J., Maxwell, Paul S., Huijbers, Chantal M., Moore, Brad R., Albert, Simon, Rissik, David, Babcock, Russell C. & Schlacher, Thomas. A. 2016. Quantifying the conservation value of seascape connectivity: a global synthesis. Global Ecology and Biogeography 25:1-13.
Peterson, B. J., Fry, B., 1987. Stable isotopes in ecosystem studies. Annual Review of Ecology and Systematics 18, 293-320.
Ramos, R. J., Travassos, M. P., Leite, G., R., 2010. Characterization of macrofauna associated with articulated calcareous algae (Corallinaceae, Rhodophyta) occurring in hydrodynamic gradient on the Espírito Santo state coast, Brazil. Brazilian Journal of Oceanography 58 (4), 275-285.
Rogers, M. K. 1999.Effects of sewage contamination on macro-algae and shellfish at Moa Point, New Zealand using stable carbon and nitrogen isotopes. New Zealand Journal of Marine and Freshwater Research 33, 181-188.
Sampaio, L., Rodrigues, A. M., Quintino, V. 2010. Carbon and nitrogen stable isotopes in coastal benthic populations under multiple organic enrichment sources. Marine Pollution Bulletin 60, 1790-1802.
Schettini, C. A. F., Pereira, Fo., J., Spillere, L. 2000. Notas Técnicas Facimar 4, 11-28.
Sterza, J. M., Fernandes, L. L. 2006. Zooplankton community of the Vitória Bay estuarine system (Southeastern Brazil): Characterization during a three-year study. Brazilian Journal of Oceanography 54 (2-3), 95-105.
Syväranta, J., Martino, A., Kopp, D., C´er´eghino, R., Santoul, F. 2011. Freezing and chemical preservatives alter the stable isotope values of carbon and nitrogen of the Asiatic clam (Corbicula fluminea). Hydrobiologia, Kluwer Academic Publishers 658, p 383-388.
45
Venkatesan, M. I.; Kaplan, I. R. 1990. Assessment of fecal sterols and ketones as indicators of urban sewage inputs to coastal waters. Environmental Sciences and Technology, 24 (2), 208-214.
Venkatesan, M. I., Mirsadeghi, F. H. 1992. Coprostanol as sewage tracer in McMurdo Sound, Antarctica.Marine Pollution Bulletin 25, 328-333.
Veronez-Junior,P., Bastos, A. C., Quaresma, V. S. 2009. Morfologia e distribuição sedimentar em um sistema estuarino tropical: Baía de Vitória, ES. Revista Brasileira de Geofísica 27(4), 609-624.
Walker, R. W., Wun, C. K., Litsky, W., Dutka, B. J. 1982. Coprostanol as an indicator of fecal pollution, C R C Critical Reviews in Environmental Control 12(2), 91-112.
Zalmon I. R., Krohling W., Ferreira, C. E. L. 2011. Abundance and diversity patterns of the sessile macrobenthic community associated with environmental gradients in Vitória Harbor, southeastern Brazil. Zoologia 28 (5), 641–652.
Recommended


![Templates%20 para%20envio%20de%20eventos%20da%20escola[1]](https://img.document.onl/doc/110x75/55c0c7a9bb61eb93198b47b4/templates20-para20envio20de20eventos20da20escola1.jpg)