Embed Size (px)
Citation preview

The Cryosphere, 9, 1223–1227, 2015
www.the-cryosphere.net/9/1223/2015/
doi:10.5194/tc-9-1223-2015
© Author(s) 2015. CC Attribution 3.0 License.
Brief Communication: Newly developing rift in Larsen C Ice Shelf
presents significant risk to stability
D. Jansen1, A. J. Luckman2, A. Cook2, S. Bevan2, B. Kulessa2, B. Hubbard3, and P. R. Holland4
1Alfred-Wegener-Institut Helmholtz-Zentrum für Polar- und Meeresforschung, Bremerhaven, Germany2Department of Geography, College of Science, Swansea University, Swansea, UK3Centre for Glaciology, Institute for Geography and Earth Sciences, Aberystwyth University, Aberystwyth, UK4British Antarctic Survey, High Cross, Cambridge, UK
Correspondence to: D. Jansen ([email protected])
Received: 5 February 2015 – Published in The Cryosphere Discuss.: 11 February 2015
Revised: 19 May 2015 – Accepted: 23 May 2015 – Published: 15 June 2015
Abstract. An established rift in the Larsen C Ice Shelf, for-
merly constrained by a suture zone containing marine ice,
grew rapidly during 2014 and is likely in the near future to
generate the largest calving event since the 1980s and result
in a new minimum area for the ice shelf. Here we investi-
gate the recent development of the rift, quantify the projected
calving event and, using a numerical model, assess its likely
impact on ice shelf stability. We find that the ice front is at
risk of becoming unstable when the anticipated calving event
occurs.
1 Introduction
The Larsen C Ice Shelf is the most northerly of the remain-
ing major Antarctic Peninsula ice shelves and is vulnerable
to changes in both ocean and atmospheric forcing (Holland
et al., 2015). It is the largest ice shelf in the region and its loss
would lead to a significant drawdown of ice from the Antarc-
tic Peninsula Ice Sheet (APIS). There have been observations
of widespread thinning (Shepherd et al., 2003; Pritchard et
al., 2012; Holland et al., 2015), melt ponding in the north-
ern inlets (Holland et al., 2011; Luckman et al., 2014), and a
speed-up in ice flow (Khazendar et al., 2011), all processes
which have been linked to former ice shelf collapses (e.g.
van den Broeke, 2005). Previous studies have highlighted
the vulnerability of Larsen C Ice Shelf to specific potential
changes in its geometry including a retreat from the Bawden
Ice Rise (Kulessa et al., 2014; McGrath et al., 2014; Holland
et al., 2015) and Gipps Ice Rise (Borstad et al., 2013). Rift
tips in the latter area have been observed to align as they ter-
minate at a confluence of flow units within the shelf. Several
studies have provided evidence for marine ice in these suture
zones (Holland et al., 2009; Jansen et al., 2013; Kulessa et
al., 2014; McGrath et al., 2014). The relatively warm, and
thus soft, marine ice has been found to act as a weak cou-
pling between flow units with different flow velocities. It has
been concluded that this ice inhibits the propagation of rifts
because it can accommodate strain in the ice without fractur-
ing further (Holland et al., 2009; Jansen et al., 2013; Kulessa
et al., 2014).
In a change from the usual pattern, a northward-
propagating rift from Gipps Ice Rise has recently penetrated
through the suture zone and is now more than halfway to-
wards calving off a large section of the ice shelf (Figs. 1
and 2). The rate of propagation of this rift accelerated during
2014. When the next major calving event occurs, the Larsen
C Ice Shelf is likely to lose around 10 % of its area to reach a
new minimum both in terms of direct observations, and pos-
sibly since the last interglacial period (Hodgson et al., 2006).
Here, using satellite imagery and numerical modelling, we
document the development of the rift over recent years, pre-
dict the area of ice that will be lost, and test the likely impact
of this future calving event on ice shelf stability.
Published by Copernicus Publications on behalf of the European Geosciences Union.
1224 D. Jansen et al.: Brief Communication: Newly developing rift in Larsen C Ice Shelf
2 Methods
2.1 Satellite observations
We use data from NASA MODIS at a pixel size of 250 m (red
band) from the near-real-time archive (http://lance-modis.
eosdis.nasa.gov/cgi-bin/imagery/realtime.cgi) to monitor the
general propagation of the rift and to explore its likely fu-
ture path (Fig. 1). These data, however, did not provide
sufficiently high spatial resolution to measure the rift tip
position with satisfactory precision. Using Landsat data at
high spatial resolution (15 m, panchromatic) from the NASA
archive (http://earthexplorer.usgs.gov/), we measure in detail
the rift’s recent propagation (Fig. 2). Growth of the rift is as-
sessed by digitizing the position of the rift tip in all Landsat
images unobscured by cloud between November 2010 and
January 2015 working within the polar stereographic map
projection in which the data were provided. The start of this
sequence is chosen to show normal behaviour of the rift over
3 years before its more rapid propagation in 2014. Between
January 2015 and the final paper submission, no additional
images showed notable further propagation. Rift length is
presented relative to the position in November 2010 prior to
the breach of the Joerg Peninsula suture zone. Rift width is
measured at the November 2010 rift tip position. These satel-
lite data are subject to variable cloud conditions and solar il-
lumination, the impact of which we minimize by optimizing
brightness and contrast in each image separately. Neverthe-
less, measurements of rift tip position and width are poten-
tially subject to error of up to a few tens of metres. A table
listing all Landsat images used for this study as well as the
measured rift lengths and widths can be found in the Supple-
ment.
To investigate a range of possible outcomes from the pro-
posed calving event, we present two scenarios for the rift tra-
jectory based on its current orientation and direction of prop-
agation, and on visual inspection of MODIS data (Fig. 1).
Surface features in these data indicate the scale and orien-
tation of existing weaknesses (e.g. basal crevasses) along
which the rift might be expected to preferentially propagate
(Luckman et al., 2012). In Scenario I the rift approaches the
calving front by the shortest route via existing weaknesses,
and so would result in a reasonable minimum estimate for
the calved area. In Scenario II the rift continues along its
current trajectory for a further 80 km before approaching the
ice front. The hypothetical turning point in this scenario is
chosen to smoothly continue the orientation of the ice front
where the rift will meet it (Fig. 1), and imitates the pattern of
calving of a large iceberg in 2008. We present these scenar-
ios as reasonable possibilities for which to test the impact of
a calving event, rather than a range for the projected calved
area. The eventual calving may be within the range we test,
or may be more extreme still.
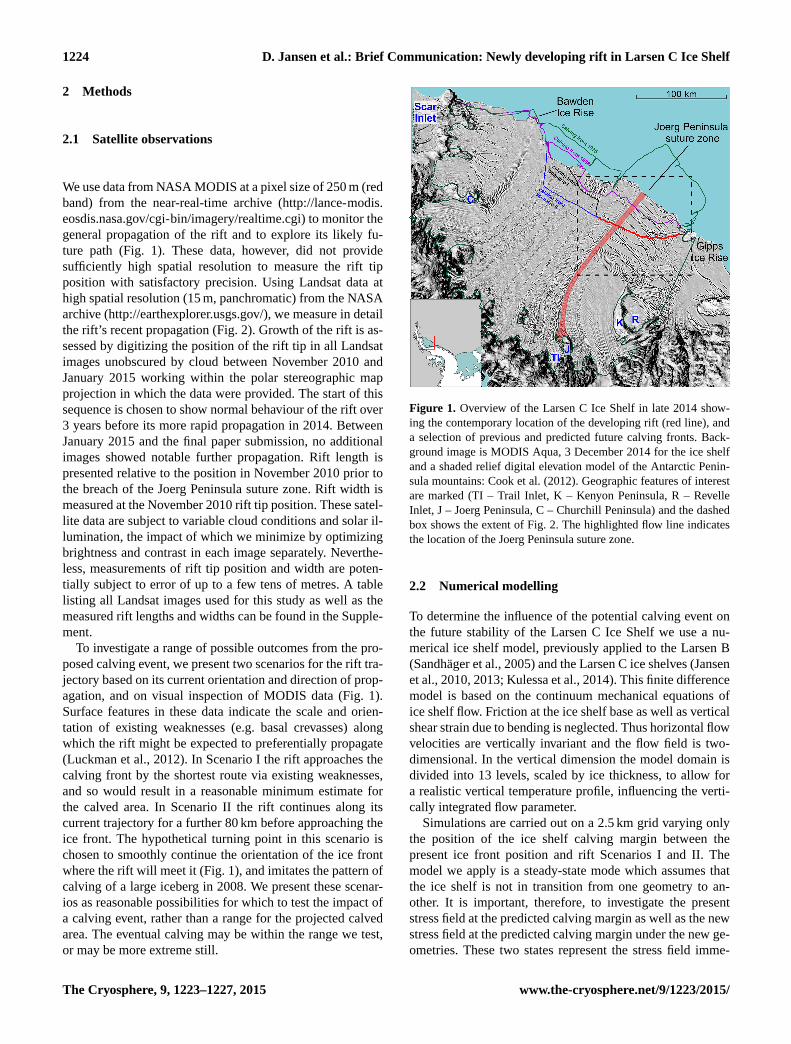
Figure 1. Overview of the Larsen C Ice Shelf in late 2014 show-
ing the contemporary location of the developing rift (red line), and
a selection of previous and predicted future calving fronts. Back-
ground image is MODIS Aqua, 3 December 2014 for the ice shelf
and a shaded relief digital elevation model of the Antarctic Penin-
sula mountains: Cook et al. (2012). Geographic features of interest
are marked (TI – Trail Inlet, K – Kenyon Peninsula, R – Revelle
Inlet, J – Joerg Peninsula, C – Churchill Peninsula) and the dashed
box shows the extent of Fig. 2. The highlighted flow line indicates
the location of the Joerg Peninsula suture zone.
2.2 Numerical modelling
To determine the influence of the potential calving event on
the future stability of the Larsen C Ice Shelf we use a nu-
merical ice shelf model, previously applied to the Larsen B
(Sandhäger et al., 2005) and the Larsen C ice shelves (Jansen
et al., 2010, 2013; Kulessa et al., 2014). This finite difference
model is based on the continuum mechanical equations of
ice shelf flow. Friction at the ice shelf base as well as vertical
shear strain due to bending is neglected. Thus horizontal flow
velocities are vertically invariant and the flow field is two-
dimensional. In the vertical dimension the model domain is
divided into 13 levels, scaled by ice thickness, to allow for
a realistic vertical temperature profile, influencing the verti-
cally integrated flow parameter.
Simulations are carried out on a 2.5 km grid varying only
the position of the ice shelf calving margin between the
present ice front position and rift Scenarios I and II. The
model we apply is a steady-state mode which assumes that
the ice shelf is not in transition from one geometry to an-
other. It is important, therefore, to investigate the present
stress field at the predicted calving margin as well as the new
stress field at the predicted calving margin under the new ge-
ometries. These two states represent the stress field imme-
The Cryosphere, 9, 1223–1227, 2015 www.the-cryosphere.net/9/1223/2015/

D. Jansen et al.: Brief Communication: Newly developing rift in Larsen C Ice Shelf 1225
Figure 2. Analysis of rift propagation using Landsat data. Back-
ground image, in which the rift is visible, is from 4 December 2014.
Inset graph shows the development of rift length with respect to the
2010 tip position, and rift width at the 2010 tip position, measured
from all available Landsat images (crosses; 15 in total). The line
joining data points illustrates only the mean propagation rate be-
tween observations. Actual propagation of the rift may be sporadic
and true propagation rates cannot be known without regular fre-
quent observations, which are not available. Circles and labels on
the map, and dotted red lines on the graph, show the positions of
notable stages of rift development.
diately after calving, and the stress field towards which the
shelf will develop in time through the process of the velocity
field adapting to the new geometry (assuming no immediate
further calving). The two stress fields may be different, and
may indicate increasing or decreasing stability under the new
geometries.
3 Results
3.1 Rift evolution and possible calving scenarios
The rift first propagated into the Joerg Peninsula suture zone
in 2012 and progressed during 2013 into a region which pre-
viously appeared to resist transverse fractures (Fig. 2). The
rate of rift propagation increased sometime between Jan-
uary and August 2014, crossing the entire Trail Inlet flow
unit ( ∼ 20 km) in just 8 months. We do not have observa-
tions within this time period so we cannot say whether the
rift propagation during this time period was uniform or was
very rapid for only a short part of it. Between August 2014
and late January 2015, the rift length increased further about
1.25 km, propagating into the next suture zone. From the start
of our measurements the width of the rift at the 2010 rift tip
position has increased at a more uniform rate than the length,
and is still growing at a rate of ∼ 40 m yr−1 (Fig. 2).
The area of Larsen C Ice Shelf after the proposed calving
event will be 4600 km2 less than at present for Scenario I,
and 6400 km2 less for Scenario II (Fig. 1). This amounts to
potential area losses of 9 and 12 % respectively.
The last large calving event of the Larsen Ice Shelf oc-
curred in 1986, where several large tabular icebergs calved
from its southern front. The location of the front after the
calving was approximately 18 km upstream of its current po-
sition (Fig. 1, see also Cook and Vaughan, 2010). The shape
of the calving front in 1988 indicated that the features in the
central front played a role for the propagation of fractures
which eventually led to calving. We designed calving Sce-
nario I to follow a similar path in the central ice shelf front.
A later calving event in 2008 was delineated by crevasses
propagating from Bawden Ice Rise towards the centre of the
ice shelf; thus a combination of the 1986 and 2008 calving
events would resemble Scenario II. However, if the calving
occurred within the next few years, the calving front position
would retreat 30 km further upstream compared to 1986.
3.2 Stress field development
To investigate the impact of the two calving scenarios on ice
shelf stability, we present fields of the difference between the
predicted directions of ice flow and of first principal stress
(the stress-flow angle; Fig. 3). This diagnostic has previously
been used to investigate ice shelf stability on the basis that ex-
isting weaknesses (rifts and crevasses) are typically oriented
across-flow (Kulessa et al., 2014). Regions of the shelf ex-
hibiting low stress-flow angles are likely to be more affected
by small-scale calving because stresses act to open existing
weaknesses; conversely, regions with a stress-flow angle ap-
proaching 90◦ are likely to be stable.
The stress-flow angles at the present (early 2015) ice front
are generally high (Fig. 3a) and, as a result, calving events
are rare and the ice front is stable (Kulessa et al., 2014). If
the ice shelf calves under Scenario I, the new ice front will,
in the immediate term, still mostly be fringed by ice with a
high stress-flow angle (Fig. 3a). However, this safety margin
is narrowed by the calving, and the centre of the new ice front
will exhibit very low stress-flow angles. Under this modest
calving scenario, if the ice shelf is able to adapt to the new
geometry (Fig. 3b), a new region of high stress-flow angles
develops, but this region remains significantly narrower than
at present. Under calving Scenario II, much more of the ice
front is immediately left without a buffer of high stress-flow
angle ice (Fig. 3a). Even if it were possible to adapt to this
new geometry (Fig. 3c), a significant section of the new ice
front would retain very low values of stress-flow angle.
An alternative measure of stability was presented by
Doake et al. (1998), whereby ice downstream of a “compres-
sive arch” represented by a contour of zero second principle
stress is subject to purely tensile stresses and regarded as a
www.the-cryosphere.net/9/1223/2015/ The Cryosphere, 9, 1223–1227, 2015

1226 D. Jansen et al.: Brief Communication: Newly developing rift in Larsen C Ice Shelf
Figure 3. Results from ice shelf flow model: stress-flow angle fields for the present-day ice front geometry (a) and for the new geometries
under Scenarios I (b) and II (c). The green dotted line represents the contour line of zero second principal stress.
passive part of the ice shelf, its presence indicating a stable
front. This is a more conservative measure of stability than
the stress-flow angle and we include it for completeness. The
dotted line in all panels of Fig. 3 represents the zero sec-
ond principal stress contour line for the reference simulation
and the two new calving fronts. For Scenario I this line is
breached by the new calving front in the south at the Gipps
Ice Rise; for Scenario II it is breached on both sides.
4 Discussion
The rift highlighted here has been present since the earli-
est satellite imagery (Glasser et al., 2009) but has recently
propagated beyond its neighbouring structures to the point
at which a large calving event is anticipated. Over the past
4 years the rate of development of the rift width has been
steady, but the length has grown intermittently with a particu-
lar acceleration during 2014 (Fig. 2). We hypothesize that the
strain which opens the rift may be relatively constant, but that
the fracture response varies with tip position. This may be a
result of variations in fracture toughness of the ice which are
likely to be related the presence of marine ice in suture zones
(Holland et al., 2009; Jansen et al., 2013) and the locations
of pre-existing weaknesses. The mean rate of rift propagation
appears to be smaller when the rift tip is within a suture zone
(Fig. 2).
Further downstream of the current rift another feature is
visible which has a similar shape (Figs. 1, 2). We assume
that this feature, which is already present in a Landsat im-
age from 1988, is most likely a surface expression of a basal
crevasse (Supplement Fig. S1, compare features described in
Luckman et al., 2012). It is isolated from the neighbouring
flow units. In contrast, the recently propagated rift is an open
fracture, widening towards the south, and crossing the Joerg
Peninsula suture zone.
The similar shape indicates that both features are initiated
in a similar stress environment. In 1988 the isolated basal
crevasse was located approximately 10 km downstream of
the position of the current rift. The currently active rift is
unique due to its connection to the wide rift reaching towards
Gipps Ice Rise.
The reduction in area of Larsen C Ice Shelf under Scenar-
ios I and II of 9 and 12 % respectively will be significant, but
will of course not contribute to immediate sea level rise since
the floating ice already displaces its own weight of seawater.
The predicted ice loss is also not unprecedented: in the late
1980s a calving event removed 14 % of Larsen C Ice Shelf
(Cook and Vaughan, 2010). The real significance of this new
rift to this ice shelf is two-fold. First, the predicted calving
will reduce its area to a new minimum both in terms of di-
rect observations, and probably since the last interglacial pe-
riod (Hodgson et al., 2006). Second, unlike during the 1980s,
but highly comparable to the development of Larsen B Ice
Shelf between 1995 and 2002, the resulting geometry may
be unstable. According to the stress-flow angle criterion, our
calving scenarios lead to a range of unstable outcomes from
partial to significant. Under our modest rift propagation Sce-
nario I, immediately following the predicted calving event,
the central part of the ice front will be unstable and prone to
persistent calving of small ice blocks as the principal strain
works to open existing fractures. It is not clear how quickly
the velocity of a real ice shelf will be able to adapt to the
new boundary conditions, but even if this is rapid, the mar-
gin of stabilizing ice becomes very narrow. Under Scenario
II, the unstable part of the new ice front is considerably larger
and, even if the flow field adapts quickly to the new geom-
etry, parts of the calving margin remain unstable and prone
to run-away calving of a similar nature to Larsen B Ice Shelf
between 1995 and 2002. Assessing the stress field according
to Doake et al. (1998), Scenario II would also be considered
as an unstable calving front.
Our model demonstrates that the newly developing rift
presents a considerable risk to the stability of the Larsen C
Ice Shelf.
The Cryosphere, 9, 1223–1227, 2015 www.the-cryosphere.net/9/1223/2015/

D. Jansen et al.: Brief Communication: Newly developing rift in Larsen C Ice Shelf 1227
5 Conclusions
We have investigated a newly developing rift in the south of
Larsen C Ice Shelf which has propagated beyond its neigh-
bours in 2013, and grew very rapidly in 2014. It seems in-
evitable that this rift will lead to a major calving event which
will remove between 9 % and 12 % of the ice shelf area and
leave the ice front at its most retreated observed position.
More significantly, our model shows that the remaining ice
may be unstable. The Larsen C Ice Shelf may be following
the example of its previous neighbour, Larsen B, which col-
lapsed in 2002 following similar events.
The Supplement related to this article is available online
at doi:10.5194/tc-9-1223-2015-supplement.
Acknowledgements. The authors would like to thank Ted Scam-
bos, Catherine Walker and Maurice Pelto for their constructive
comments, which helped to improve this manuscript. This work
was carried out as part of the MIDAS project funded by NERC
(NE/L005409/1) and continues work carried out under the NERC
SOLIS project (NE/E012914/1). D. Jansen was funded by the
HGF junior research group “The effect of deformation mechanism
for ice sheet dynamics” (VHNG 802). We are indebted to NASA
for the MODIS and Landsat data. D. Jansen would like to thank
C. Wesche for helpful discussions.
Edited by: M. van den Broeke
References
Borstad, C. P., Rignot, E., Mouginot, J., and Schodlok, M. P.: Creep
deformation and buttressing capacity of damaged ice shelves:
theory and application to Larsen C ice shelf, The Cryosphere,
7, 1931–1947, doi:10.5194/tc-7-1931-2013, 2013.
Cook, A. J. and Vaughan, D. G.: Overview of areal changes of the
ice shelves on the Antarctic Peninsula over the past 50 years, The
Cryosphere, 4, 77–98, doi:10.5194/tc-4-77-2010, 2010.
Cook, A. J., Murray, T. I., Luckman, A., Vaughan, D. G., and Bar-
rand, N. E.: Antarctic Peninsula 100 m Digital Elevation Model
Derived from ASTER GDEM. Boulder, Colorado USA: National
Snow and Ice Data Center, doi:10.7265/N58K7711, 2012.
Doake, C. S. M., Corr, H. F. J., Rott, H., Skvarca, P., and Young, N.
W.: Breakup and conditions for stability of the northern Larsen
Ice Shelf, Antarctica, Nature, 391, 778–780, 1998.
Glasser, N. F., Kulessa, B., Luckman, A., Jansen, D., King,
E. C., Sammonds, P. R., Scambos, T. A., and Jezek,
K. C.: Surface structure and stability of the Larsen C
Ice Shelf, Antarctic Peninsula, J. Glaciol., 55, 400–410,
doi:10.3189/002214309788816597, 2009.
Hodgson, D. A., Bentley, M. J., Roberts, S. J., Smith, J. A., Sug-
den, D. E., and Domack, E. W.: Examining Holocene stability
of AntarcticPeninsula ice shelves, Eos Trans. AGU 87, 305–308,
doi:10.1029/2006eo310001, 2006.
Holland, P. R., Corr, H. F. J., Vaughan, D. G., Jenkins, A., and
Skvarca, P.: Marine ice in Larsen Ice Shelf, Geophys. Res. Lett.,
36, L11604, doi:10.1029/2009GL038162, 2009.
Holland, P. R., Corr, H. F. J., Pritchard, H. D., Vaughan, D. G.,
Arthern, R. J., Jenkins, A., and Tedesco, M.: The air con-
tent of Larsen Ice Shelf, Geophys. Res. Lett., 38, L10503,
doi:10.1029/2011GL047245, 2011.
Holland, P. R., Brisbourne, A., Corr, H. F. J., McGrath, D., Pur-
don, K., Paden, J., Fricker, H. A., Paolo, F. S., and Fleming, A.
H.: Atmospheric and oceanic forcing of Larsen C Ice Shelf thin-
ning, The Cryosphere Discuss., 9, 251–299, doi:10.5194/tcd-9-
251-2015, 2015
Jansen, D., Kulessa, B., Sammonds, P. R., Luckman, A., King, E.
C., and Glasser, N. F.: Present stability of the Larsen C Ice Shelf,
Antarctic Peninsula, J. Glaciol., 56, 593–600, 2010.
Jansen, D., Luckman, A. J., Kulessa, B., Holland, P. R., and King,
E. C.: Marine ice formation in a suture zone on the Larsen C Ice
Shelf and its influence on ice shelf dynamics, J. Geophys. Res.-
Earth Surf., 118, 1–13, doi:10.10002/jgrf.20120, 2013.
Khazendar, A., Rignot, E., and Larour, E.: Acceleration and spatial
rheology of Larsen C Ice Shelf, Antarctic Peninsula, Geophys.
Res. Lett., 38, L09502, doi:10.1029/2011GL046775, 2011.
Kulessa, B., Jansen, D., Luckman, A. J., King, E. C., and Sam-
monds, P. R.: Marine ice regulates the future stability of a large
Antarctic ice shelf, Nature Comm., doi:10.1038/ncomms4707,
2014.
Luckman, A., Jansen, D., Kulessa, B., King, E. C., Sammonds, P.,
and Benn, D. I.: Basal crevasses in Larsen C Ice Shelf and impli-
cations for their global abundance, The Cryosphere, 6, 113–123,
doi:10.5194/tc-6-113-2012, 2012.
Luckman, A. J., Elvidge, A., Jansen, D., Kulessa, B., Kuipers-
Munneke, P., and King, J.: Surface melt and ponding on Larsen
C Ice Shelf and the impact of föhn winds, Antarct. Sci., 26, 625–
635, doi:10.1017/S0954102014000339, 2014.
McGrath, D., Steffen,K., Holland, P. R., Scambos, T. S., Rajaram,
H., Abdalati, W., and Rignot, E.: The structure and effect of su-
ture zones in the Larsen C Ice Shelf, Antarctica, J. Geophys.
Res.-Earth Surf., 119, 588–602, doi:10.1002/2013JF002935,
2014.
Pritchard, H. D., Ligtenberg, S. R. M., Fricker, H. A., Vaughan,
D. G., van den Broeke, M. R., and Padman, L.: Antarctic ice-
sheet loss driven by basal melting of ice shelves. Nature, 484,
502–505, 2012.
Sandhäger, H., Rack, W., and Jansen, D.: Model investigations of
Larsen B Ice Shelf dynamics prior to the breakup. Forum for Re-
search into Ice Shelf Processes (FRISP), Report, 16, 5–12, Bjerk-
nes Cent. For Clim. Res., Bergen, Norway, 2005.
Shepherd, A., Wingham, D., Payne, T., and Skvarca, P.: Larsen Ice
Shelf has progressively thinned, Science, 302, 856–859, 2003.
van den Broeke, M.: Strong surface melting preceded collapse of
Antarctic Peninsula ice shelf, Geophys. Res. Lett., 32, L12815,
doi:10.1029/2005GL023247, 2005.
www.the-cryosphere.net/9/1223/2015/ The Cryosphere, 9, 1223–1227, 2015