Embed Size (px)
Citation preview

Investor Presentation May 2014

2
Disclaimer
This notice may contain estimates for future events. These estimates merely reflect the expectations of the Company’s management, and involve risks and uncertainties. The Company is not responsible for investment operations or decisions taken based on information contained in this communication. These estimates are subject to changes without prior notice. This material has been prepared by Multiplus S.A. (“Multiplus“ or the “Company”) includes certain forward-looking statements that are based principally on Multiplus’ current expectations and on projections of future events and financial trends that currently affect or might affect Multiplus’ business, and are not guarantees of future performance. They are based on management’s expectations that involve a number of business risks and uncertainties, any of each could cause actual financial condition and results of operations to differ materially from those set out in Multiplus’ forward-looking statements. Multiplus undertakes no obligation to publicly update or revise any forward looking statements. This material is published solely for informational purposes and is not to be construed as a solicitation or an offer to buy or sell any securities or related financial instruments. Likewise it does not give and should not be treated as giving investment advice. It has no regard to the specific investment objectives, financial situation or particular needs of any recipient. No representation or warranty, either express or implied, is provided in relation to the accuracy, completeness or reliability of the information contained herein. It should not be regarded by recipients as a substitute for the exercise of their own judgment.

First mover
We are pioneers in this
industry in Brazil and we
already have a strong
partnership network,
highlighting LATAM
Airlines, all local banks
and the joint venture with
our international peer,
AIMIA Group.
2
3
Track record
Multiplus has already 3
years of proven focus on
shareholders return
with high dividend
payouts. Moreover, we are
continuously improving our
governance
structure following the
best market practices.
Early stages
Brazilian loyalty industry
has very low
penetration and
presents solid growth
drivers
1
4
Solid strategy
Our business sustainability
is based on network
diversification,
member engagement
and value delivery to
partners
Four main reasons to be confident in
Multiplus case
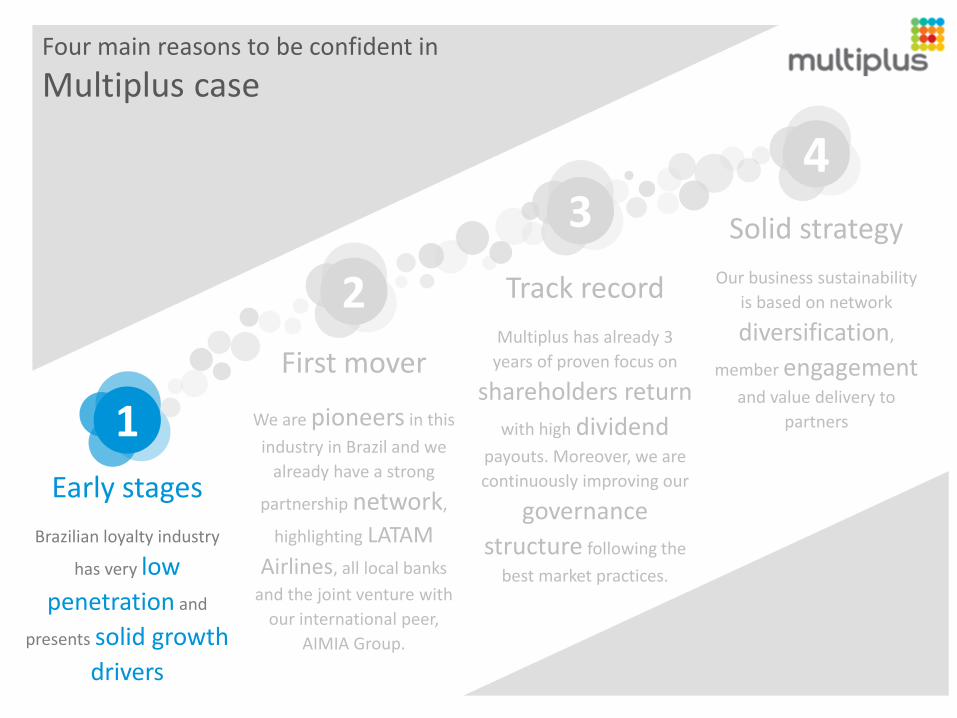
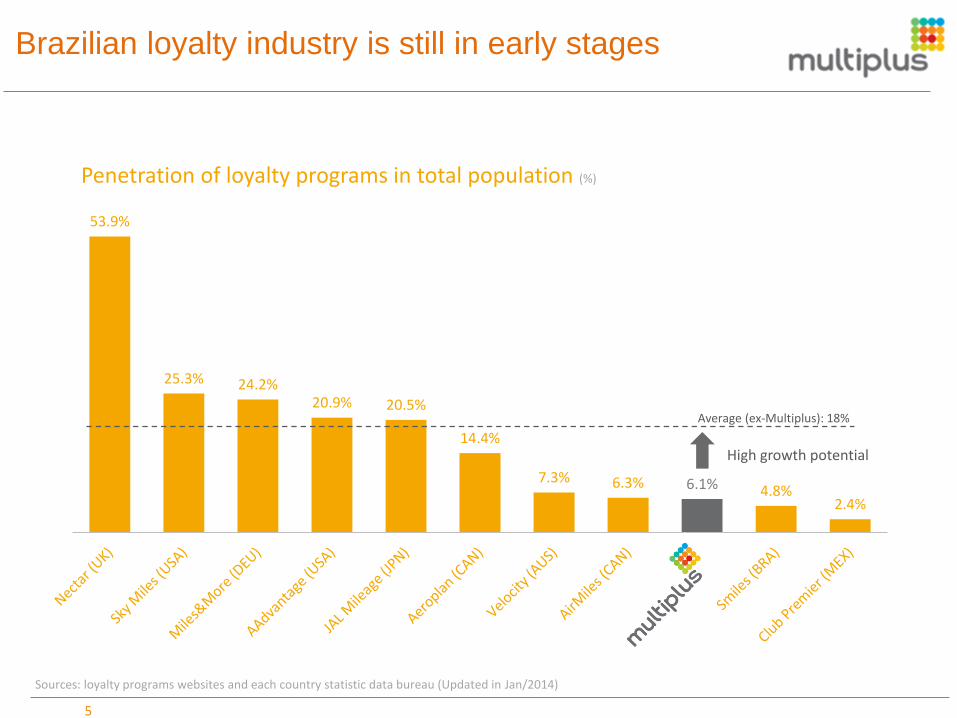
Brazilian loyalty industry is still in early stages
53.9%
25.3% 24.2% 20.9% 20.5%
14.4%
7.3% 6.3% 6.1% 4.8% 2.4%
Penetration of loyalty programs in total population (%)
Sources: loyalty programs websites and each country statistic data bureau (Updated in Jan/2014)
High growth potential
Average (ex-Multiplus): 18%
5
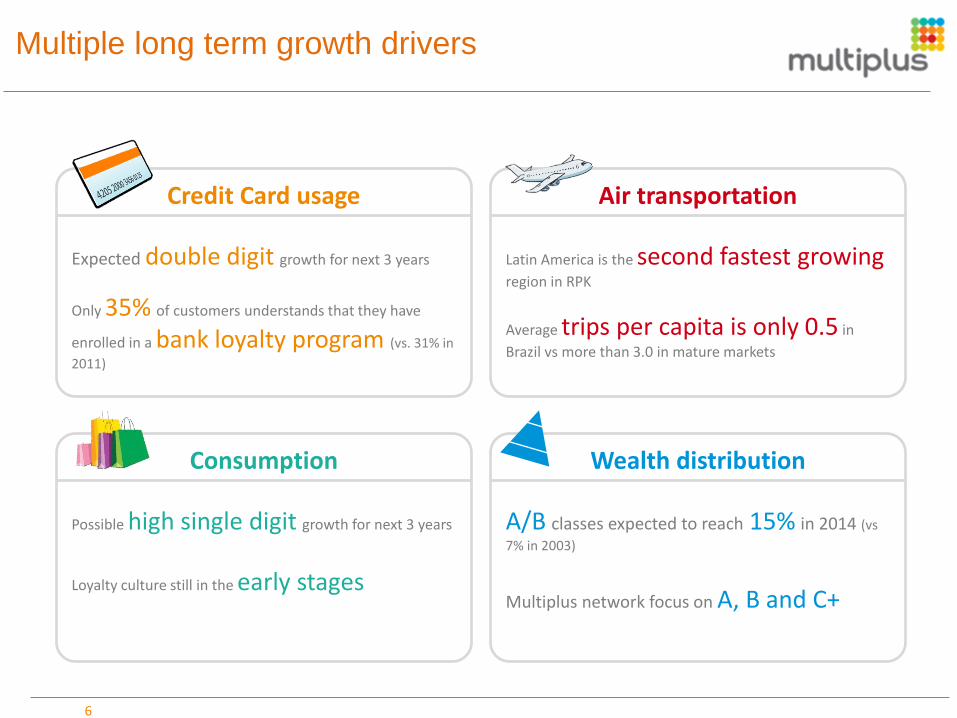
Multiple long term growth drivers
Credit Card usage
Expected double digit growth for next 3 years
Only 35% of customers understands that they have
enrolled in a bank loyalty program (vs. 31% in
2011)
Consumption
Possible high single digit growth for next 3 years
Loyalty culture still in the early stages
Air transportation
Latin America is the second fastest growing
region in RPK
Average trips per capita is only 0.5 in
Brazil vs more than 3.0 in mature markets
Wealth distribution
A/B classes expected to reach 15% in 2014 (vs
7% in 2003)
Multiplus network focus on A, B and C+
6

Sources of profit: coalition
# of months ~10 0 24
3
2
points selling redemption
unit revenue less unit cost
spread 1
CASH IN CASH OUT ~10 months float
interest income
point expiration
breakage
THREE SOURCES OF PROFIT
7

First mover
We are pioneers in this
industry in Brazil and we
already have a strong
partnership network,
highlighting LATAM
Airlines, all local banks
and the joint venture with
our international peer,
AIMIA Group.
2
3
Track record
Multiplus has already 3
years of proven focus on
shareholders return
with high dividend
payouts. Moreover, we are
continuously improving our
governance
structure following the
best market practices.
Early stages
Brazilian loyalty industry
has very low
penetration and
presents solid growth
drivers
1
4
Solid strategy
Our business sustainability
is based on network
diversification,
member engagement
and value delivery to
partners
Four main reasons to be confident in
Multiplus case
9
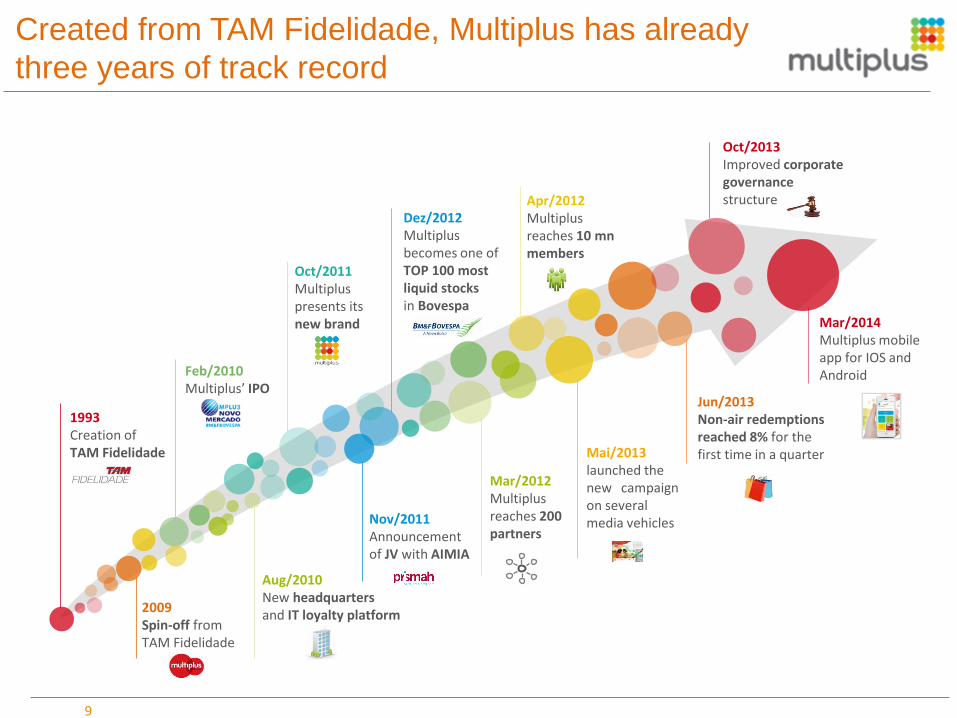
1993 Creation of TAM Fidelidade
2009 Spin-off from TAM Fidelidade
Feb/2010 Multiplus’ IPO
Oct/2011 Multiplus presents its new brand
Nov/2011 Announcement of JV with AIMIA
Dez/2012 Multiplus becomes one of TOP 100 most liquid stocks in Bovespa
Aug/2010 New headquarters and IT loyalty platform
Mar/2012 Multiplus reaches 200 partners
Apr/2012 Multiplus reaches 10 mn members
Mai/2013 launched the new‖ campaign on several media vehicles
Jun/2013 Non-air redemptions reached 8% for the first time in a quarter
Oct/2013 Improved corporate governance structure
Created from TAM Fidelidade, Multiplus has already
three years of track record
Mar/2014 Multiplus mobile app for IOS and Android
10
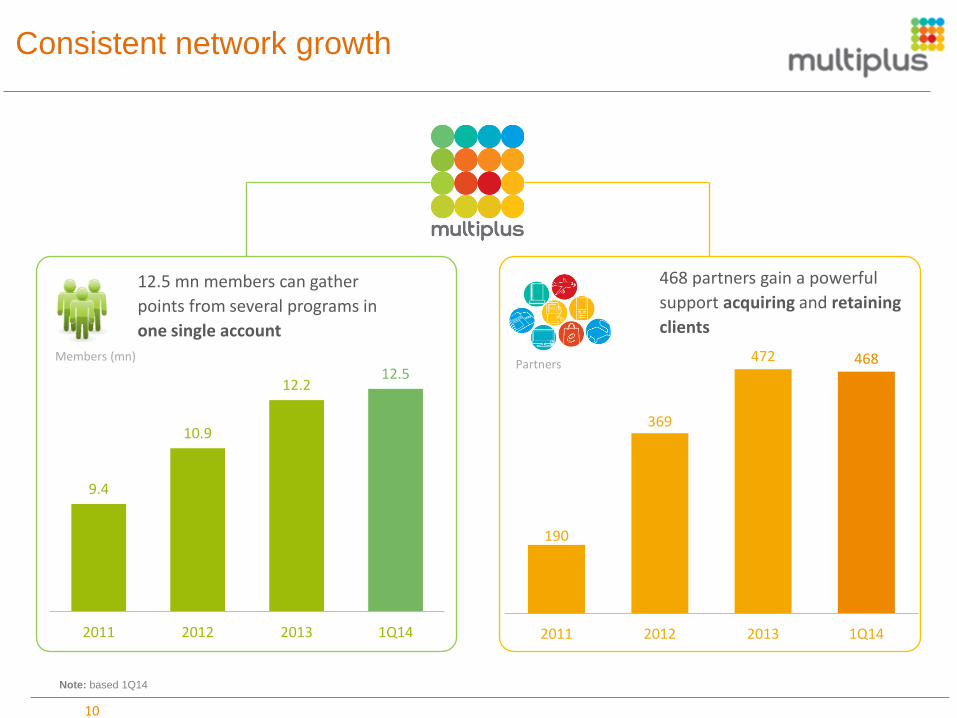
Consistent network growth
9.4
10.9
12.2 12.5
2011 2012 2013 1Q14
Partners
12.5 mn members can gather
points from several programs in
one single account
468 partners gain a powerful
support acquiring and retaining
clients
Members (mn)
190
369
472 468
2011 2012 2013 1Q14
Note: based 1Q14

11
Strong partnership network
Accrual partners Coalition partners Redemption partners
12
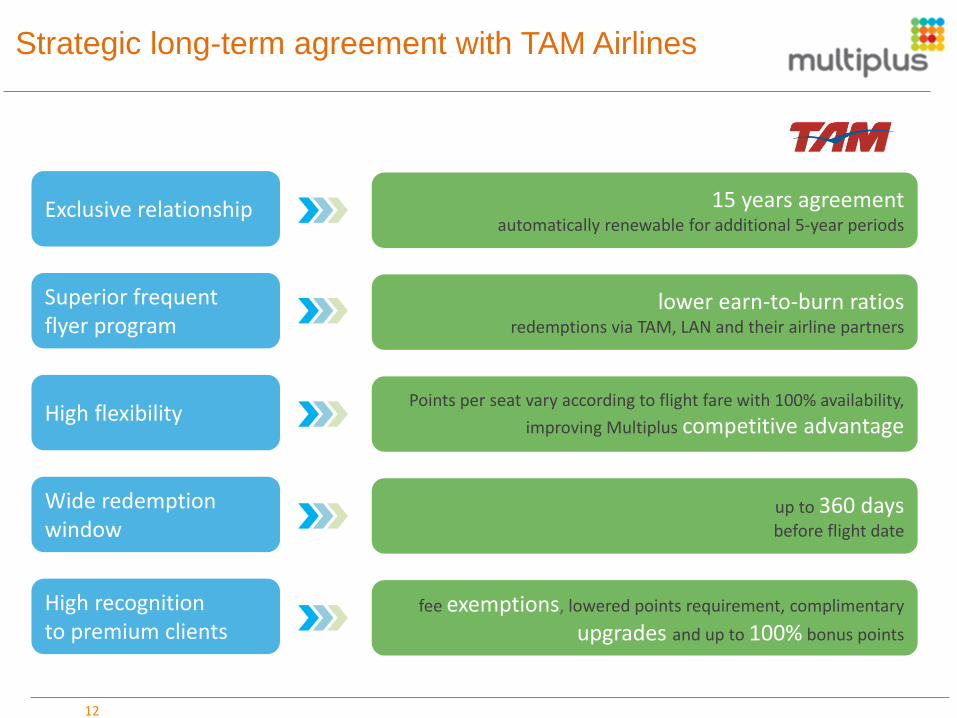
Strategic long-term agreement with TAM Airlines
15 years agreement automatically renewable for additional 5-year periods
Exclusive relationship
Points per seat vary according to flight fare with 100% availability,
improving Multiplus competitive advantage
up to 360 days before flight date
fee exemptions, lowered points requirement, complimentary
upgrades and up to 100% bonus points
High recognition to premium clients
High flexibility
Superior frequent flyer program
lower earn-to-burn ratios redemptions via TAM, LAN and their airline partners
Wide redemption window
13
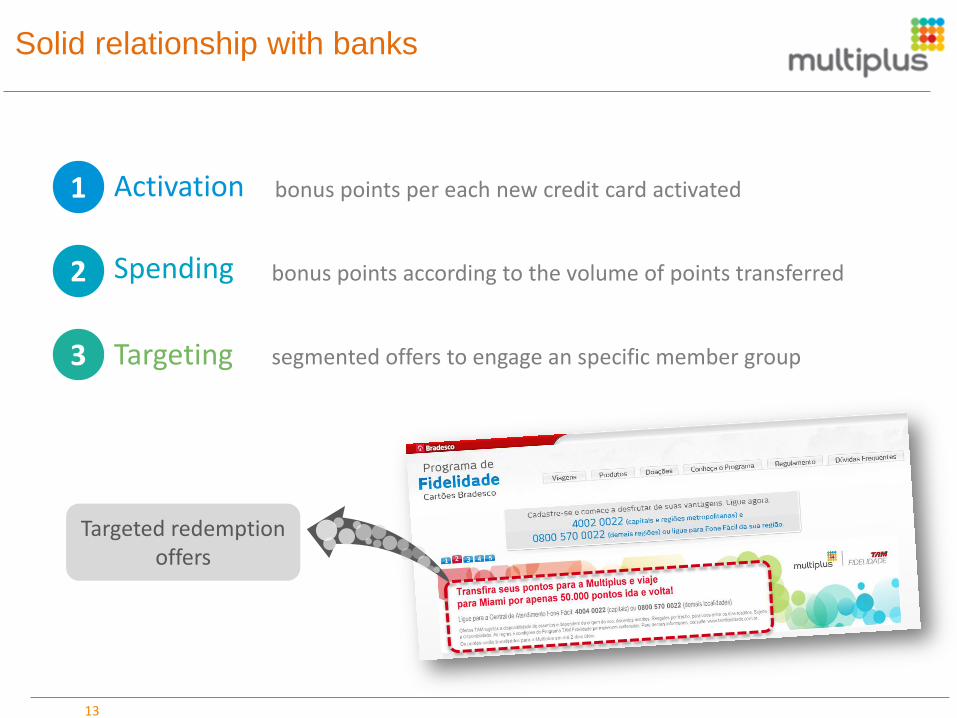
Solid relationship with banks
bonus points per each new credit card activated
Targeted redemption offers
1 Activation
bonus points according to the volume of points transferred
segmented offers to engage an specific member group
2 Spending
3 Targeting

First mover
We are pioneers in this
industry in Brazil and we
already have a strong
partnership network,
highlighting LATAM
Airlines, all local banks
and the joint venture with
our international peer,
AIMIA Group.
2
3
Track record
Multiplus has already 3
years of proven focus on
shareholders return
with high dividend
payouts. Moreover, we are
continuously improving our
governance
structure following the
best market practices.
Early stages
Brazilian loyalty industry
has very low
penetration and
presents solid growth
drivers
1
4
Solid strategy
Our business sustainability
is based on network
diversification,
member engagement
and value delivery to
partners
Four main reasons to be confident in
Multiplus case

1,119
1,525
1,871 2,009
492 538
2010 2011 2012 2013 1Q13 1Q14
15
Gross Billings (BRL mn) Points issued (bn)
53.2
76.2
85.2 83.7
21.5 21.7
2010 2011 2012 2013 1Q13 1Q14
Sales growth: consistent track record

16
Cash generation and shareholders’ return
FCF* (BRL mn) Dividends and Interest
on own capital (BRL mn)
589.0
460.6 418.1
452.6
84.0 99.7
2010 2011 2012 2013 1Q13 1Q14
112.3
861.3
222.4 232.0
44.5 70.9
2010 2011 2012 2013 1Q13 1Q14
*Excluding Dividends, Interest on Capital and variations of Prepaid Expenses and Capital (2012 and 2013 are adjusted with R$ 71.3 of anticipated settlement in Accounts Payable)
More than BRL 1.4 billion already distributed since the IPO
*Including a BRL 600 million capital reduction
*
17
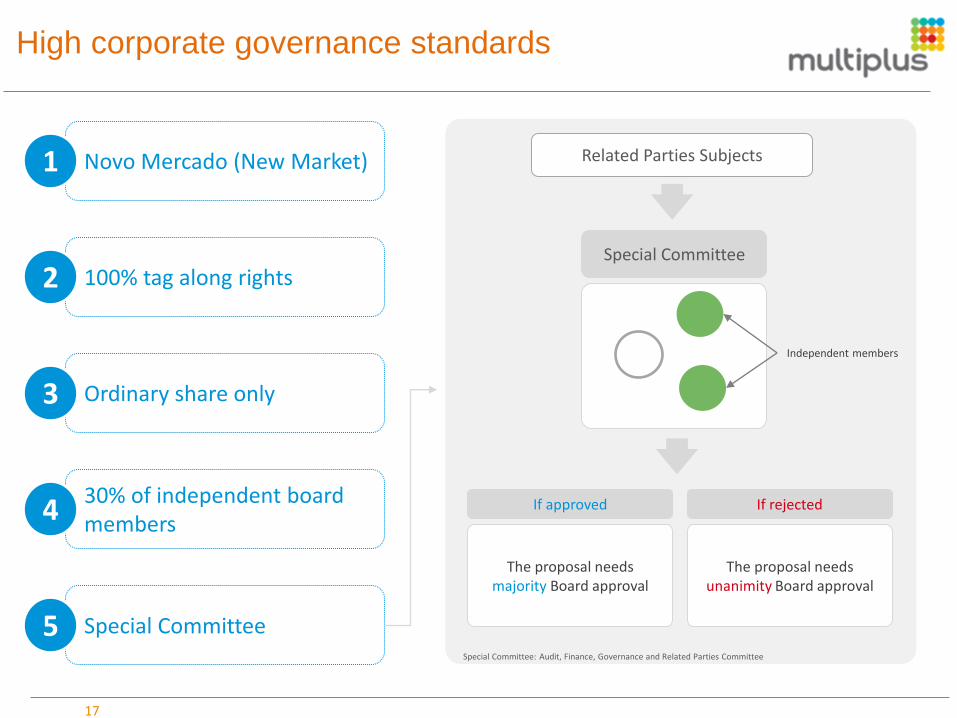
High corporate governance standards
If rejected
The proposal needs unanimity Board approval
Special Committee
Independent members
Related Parties Subjects
If approved
The proposal needs majority Board approval
Novo Mercado (New Market) 1
100% tag along rights 2
Ordinary share only 3
30% of independent board members 4
Special Committee 5 Special Committee: Audit, Finance, Governance and Related Parties Committee

First mover
We are pioneers in this
industry in Brazil and we
already have a strong
partnership network,
highlighting LATAM
Airlines, all local banks
and the joint venture with
our international peer,
AIMIA Group.
2
3
Track record
Multiplus has already 3
years of proven focus on
shareholders return
with high dividend
payouts. Moreover, we are
continuously improving our
governance
structure following the
best market practices.
Early stages
Brazilian loyalty industry
has very low
penetration and
presents solid growth
drivers
1
4
Solid strategy
Our business sustainability
is based on network
diversification,
member engagement
and value delivery to
partners
Four main reasons to be confident in
Multiplus case

19
Diversification goals
90%
10%
Current
Air Tickets Others
20%
4%
76%
Current
TAM Retail, Industry and Services Banks
Note: LTM based on 1Q14
Long term target
Long term target
10 to 15%
20 to 25%
Points redeemed
Points sold
Increased retail share will help to sustain margins and improve members engagement
Non-air redemptions growth supports unit cost control and member experience improvement
20
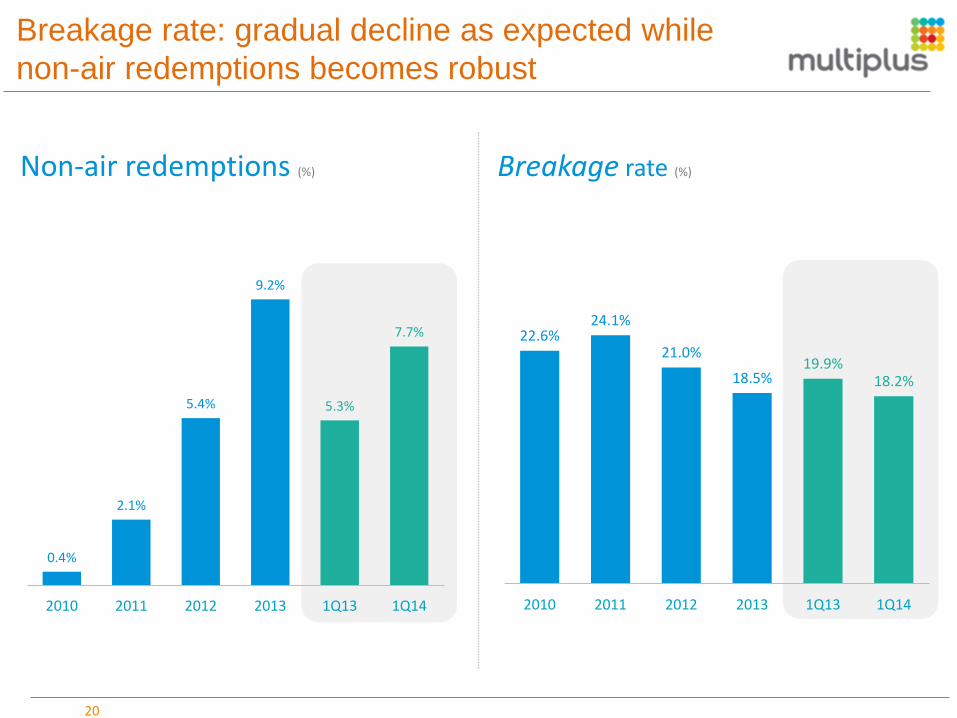
Breakage rate (%)
22.6% 24.1%
21.0%
18.5% 19.9%
18.2%
2010 2011 2012 2013 1Q13 1Q14
Non-air redemptions (%)
Breakage rate: gradual decline as expected while
non-air redemptions becomes robust
0.4%
2.1%
5.4%
9.2%
5.3%
7.7%
2010 2011 2012 2013 1Q13 1Q14
21
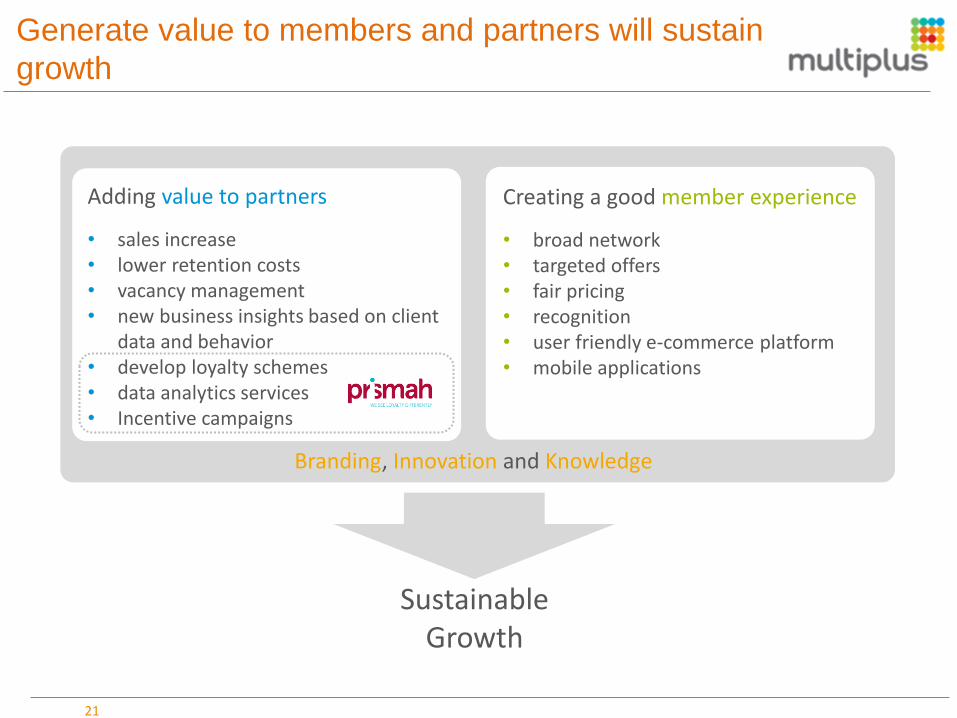
Generate value to members and partners will sustain
growth
Branding, Innovation and Knowledge
Sustainable Growth
Adding value to partners
• sales increase • lower retention costs • vacancy management • new business insights based on client
data and behavior • develop loyalty schemes • data analytics services • Incentive campaigns
Creating a good member experience
• broad network • targeted offers • fair pricing • recognition • user friendly e-commerce platform • mobile applications
22
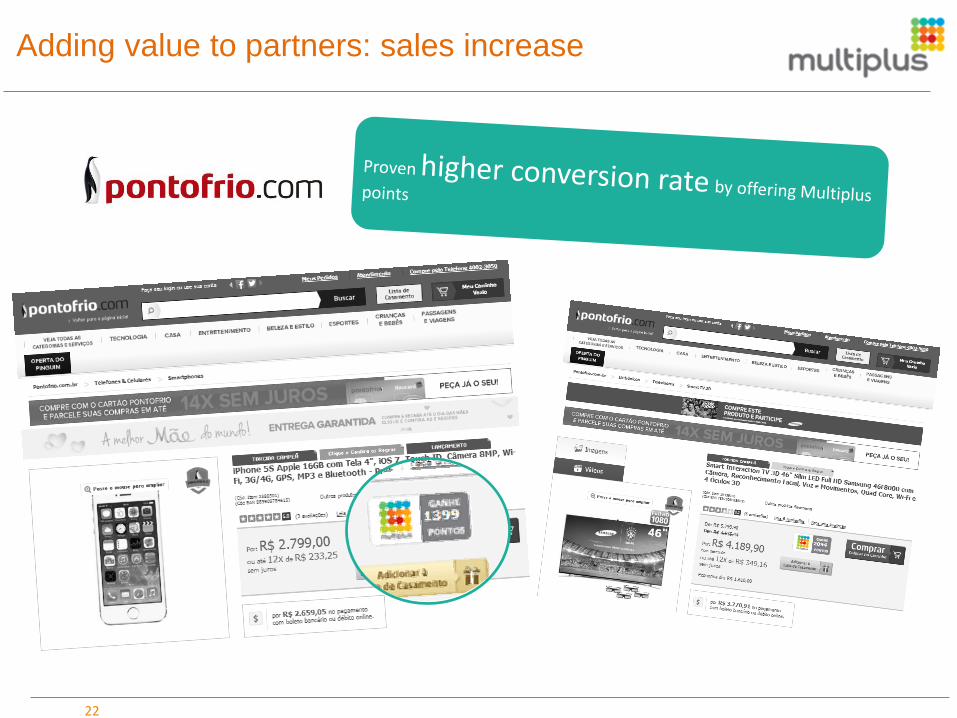
Adding value to partners: sales increase

23
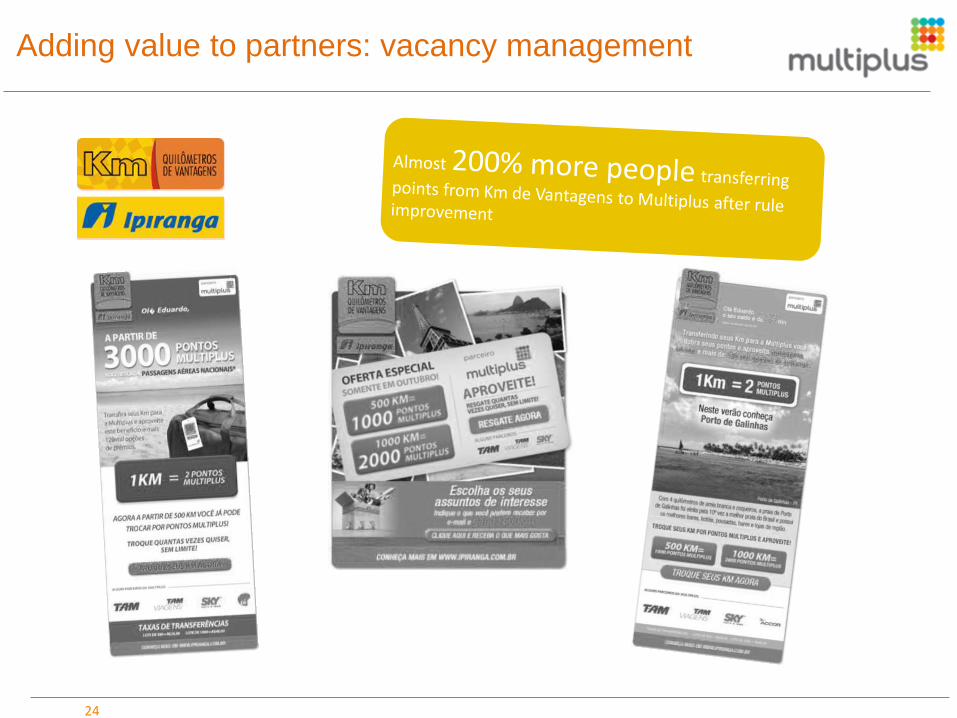
Adding value to partners: vacancy management
24
Adding value to partners: vacancy management

25
Creating a good member experience: fair pricing
Multiplus 69,400
Program B 75,647
Program C 81,800
Program D 98,400
Program E 115,800
32-Inch LED TV
Dec/2012
Program C 71,700
Program B 48,600
Multiplus 35,900
Wine cellar
Dec/2012

26
Segmented offers by a balance of points generates
attractiveness
sending offers increases in
approximately 30% the amount of
points redeemed within 3 days following the sending (vs. average)
And contributes to the
activation rate of members

27
Communication from the amount of points to expire
generates engagement
35% increase in the
number of members who joined the offers vs control group

1
28
Branding a new concept
Emotional as of Oct/2012
Functional Jan/2010 ~ Oct/2012
Strategy
You don't know what you're winning
Appendix
30
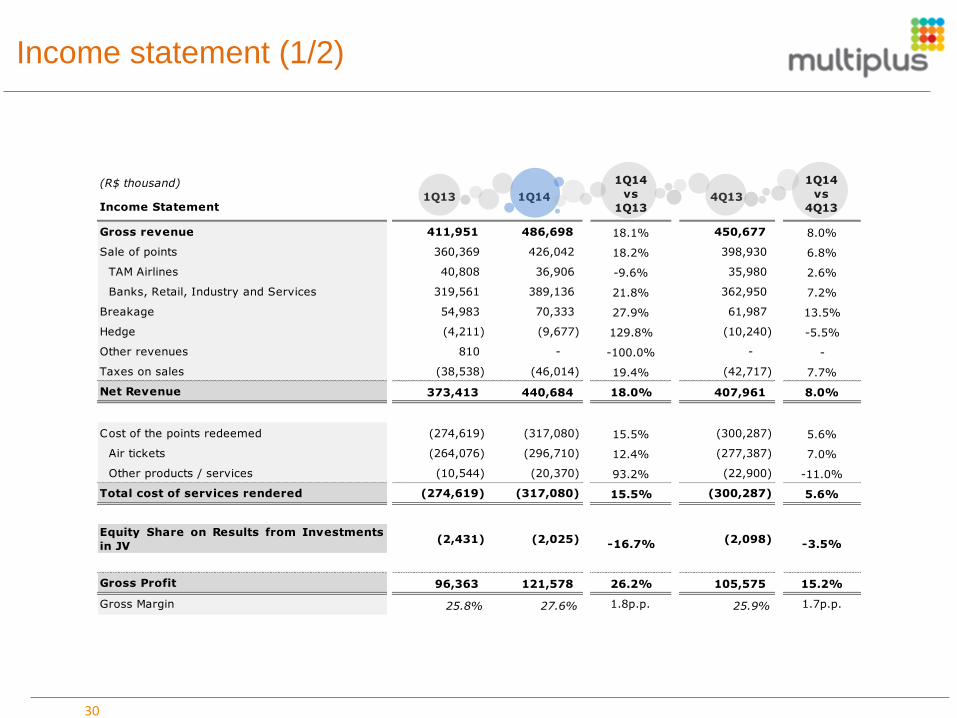
Income statement (1/2)
(R$ thousand)
Income Statement
Gross revenue 411,951 486,698 18.1% 450,677 8.0%
Sale of points 360,369 426,042 18.2% 398,930 6.8%
TAM Airlines 40,808 36,906 -9.6% 35,980 2.6%
Banks, Retail, Industry and Services 319,561 389,136 21.8% 362,950 7.2%
Breakage 54,983 70,333 27.9% 61,987 13.5%
Hedge (4,211) (9,677) 129.8% (10,240) -5.5%
Other revenues 810 - -100.0% - -
Taxes on sales (38,538) (46,014) 19.4% (42,717) 7.7%
Net Revenue 373,413 440,684 18.0% 407,961 8.0%
Cost of the points redeemed (274,619) (317,080) 15.5% (300,287) 5.6%
Air tickets (264,076) (296,710) 12.4% (277,387) 7.0%
Other products / services (10,544) (20,370) 93.2% (22,900) -11.0%
Total cost of services rendered (274,619) (317,080) 15.5% (300,287) 5.6%
Equity Share on Results from Investments
in JV(2,431) (2,025) -16.7% (2,098) -3.5%
Gross Profit 96,363 121,578 26.2% 105,575 15.2%
Gross Margin 25.8% 27.6% 1.8p.p. 25.9% 1.7p.p.
1Q13 1Q14
1Q14
vs
1Q134Q13
1Q14
vs
4Q13

31
Income statement (2/2)
(R$ thousand)
Income Statement
Gross revenue 411,951 486,698 18.1% 450,677 8.0%
Sale of points 360,369 426,042 18.2% 398,930 6.8%
TAM Airlines 40,808 36,906 -9.6% 35,980 2.6%
Banks, Retail, Industry and Services 319,561 385,769 20.7% 362,768 6.3%
Other products - 3,367 - 182 1745.5%
Breakage 54,983 70,333 27.9% 61,987 13.5%
Hedge (4,211) (9,677) 129.8% (10,240) -5.5%
Other revenues 810 - -100.0% - -
Taxes on sales (38,538) (46,014) 19.4% (42,717) 7.7%
Net Revenue 373,413 440,684 18.0% 407,961 8.0%
Cost of the points redeemed (274,619) (317,080) 15.5% (300,287) 5.6%
Air tickets (264,076) (296,710) 12.4% (277,387) 7.0%
Other products / services (10,544) (20,370) 93.2% (22,900) -11.0%
Total cost of services rendered (274,619) (317,080) 15.5% (300,287) 5.6%
Equity Share on Results from Investments
in JV(2,431) (2,025) -16.7% (2,098) -3.5%
Gross Profit 96,363 121,578 26.2% 105,575 15.2%
Gross Margin 25.8% 27.6% 1.8p.p. 25.9% 1.7p.p.
1Q13 1Q14
1Q14
vs
1Q134Q13
1Q14
vs
4Q13
Shared services (1,907) (811) -57.5% (843) -3.8%
Personnel expenses (10,806) (12,415) 14.9% (10,245) 21.2%
Marketing (1,943) (5,172) 166.2% (6,676) -22.5%
Depreciation (1,861) (3,416) 83.6% (2,457) 39.1%
Other (17,836) (14,854) -16.7% (15,449) -3.9%
Total Operating Expenses (34,353) (36,668) 6.7% (35,670) 2.8%
Total Costs and Operating Expenses (311,403) (355,773) 14.2% (338,055) 5.2%
Operating Income 62,010 84,911 36.9% 69,905 21.5%
Operating Margin 16.6% 19.3% 2.7p.p. 17.1% 2.1p.p.
Financial Income/Expenses 11,788 32,130 172.6% 32,536 -1.2%
Hedge (2,939) (2,113) -28.1% (4,448) -52.5%
Income before income tax and social
contribution70,859 114,928 62.2% 97,993 17.3%
Income tax and social contribution (24,009) (40,326) 68.0% (32,185) 25.3%
Net Income 46,850 74,602 59.2% 65,807 13.4%
Net Margin 12.5% 16.9% 4.4p.p. 16.1% 0.8p.p.

(R$ thousand)
Balance Sheet
Assets 1,426,657 1,615,511 13.2% 1,538,909 5.0%
Current assets 1,349,757 1,511,757 12.0% 1,441,476 4.9%
Cash and cash equivalentes 3,492 3,112 -10.9% 10,577 -70.6%
Financial assets at fair value through profit and loss 709,964 1,288,944 81.6% 1,253,899 2.8%
Financial assets held-to-maturity - (0) - (0) 0.0%
Accounts receivable 170,073 172,666 1.5% 131,081 31.7%
Deferred income tax and social contribution - 10,612 - 8,227 29.0%
Related Parties 433,071 17,662 -95.9% 19,176 -7.9%
Derivative instruments - (0) - (0) 0.0%
Prepaid expenses - 6,376 - 6,409 -0.5%
Other receivables 33,156 12,385 -62.6% 12,107 2.3%
Non-current assets 76,900 103,754 34.9% 97,433 6.5%
Financial assets - bank deposits - - - - -
Financial assets held-to-maturity - - - - -
Deferred income tax 8,625 1,852 -78.5% 5,974 -69.0%
Derivative financial instruments 550 - -100.0% - -
Other accounts receivable 6,821 24 -99.6% 23 6.6%
Investments 1,937 5,058 161.1% 7,083 -28.6%
Property, plant and equipment 3,208 9,231 187.8% 8,289 11.4%
Intangible assets 55,758 87,589 57.1% 76,064 15.2%
Related Parties - - - - -
1Q14
vs
4Q13
1Q14
vs
1Q131Q13 1Q14 4Q13
32
Balance sheet: assets
(R$ thousand)
Balance Sheet
Assets 1,426,657 1,615,511 13.2% 1,538,909 5.0%
Current assets 1,349,757 1,511,757 12.0% 1,441,476 4.9%
Cash and cash equivalentes 3,492 3,112 -10.9% 10,577 -70.6%
Financial assets at fair value through profit and loss 709,964 1,288,944 81.6% 1,253,899 2.8%
Financial assets held-to-maturity - (0) - (0) 0.0%
Accounts receivable 170,073 172,666 1.5% 131,081 31.7%
Deferred income tax and social contribution - 10,612 - 8,227 29.0%
Related Parties 433,071 17,662 -95.9% 19,176 -7.9%
Derivative instruments - (0) - (0) 0.0%
Prepaid expenses - 6,376 - 6,409 -0.5%
Other receivables 33,156 12,385 -62.6% 12,107 2.3%
Non-current assets 76,900 103,754 34.9% 97,433 6.5%
Financial assets - bank deposits - - - - -
Financial assets held-to-maturity - - - - -
Deferred income tax 8,625 1,852 -78.5% 5,974 -69.0%
Derivative financial instruments 550 - -100.0% - -
Other accounts receivable 6,821 24 -99.6% 23 6.6%
Investments 1,937 5,058 161.1% 7,083 -28.6%
Property, plant and equipment 3,208 9,231 187.8% 8,289 11.4%
Intangible assets 55,758 87,589 57.1% 76,064 15.2%
Related Parties - - - - -
1Q14
vs
4Q13
1Q14
vs
1Q131Q13 1Q14 4Q13
33
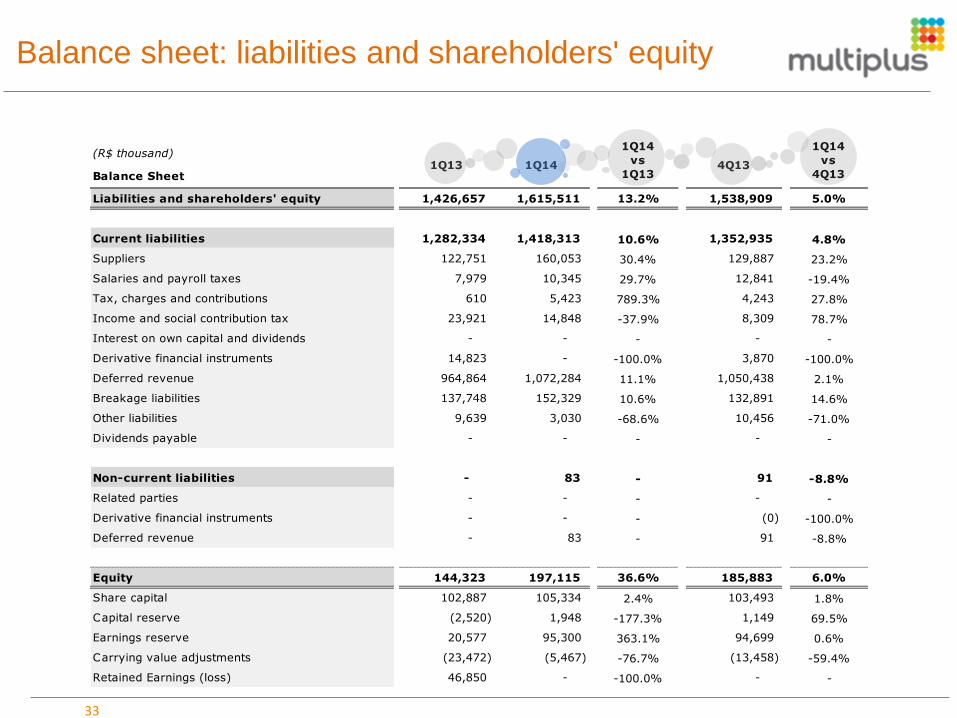
Balance sheet: liabilities and shareholders' equity
Liabilities and shareholders' equity 1,426,657 1,615,511 13.2% 1,538,909 5.0%
Current liabilities 1,282,334 1,418,313 10.6% 1,352,935 4.8%
Suppliers 122,751 160,053 30.4% 129,887 23.2%
Salaries and payroll taxes 7,979 10,345 29.7% 12,841 -19.4%
Tax, charges and contributions 610 5,423 789.3% 4,243 27.8%
Income and social contribution tax 23,921 14,848 -37.9% 8,309 78.7%
Interest on own capital and dividends - - - - -
Derivative financial instruments 14,823 - -100.0% 3,870 -100.0%
Deferred revenue 964,864 1,072,284 11.1% 1,050,438 2.1%
Breakage liabilities 137,748 152,329 10.6% 132,891 14.6%
Other liabilities 9,639 3,030 -68.6% 10,456 -71.0%
Dividends payable - - - - -
Non-current liabilities - 83 - 91 -8.8%
Related parties - - - - -
Derivative financial instruments - - - (0) -100.0%
Deferred revenue - 83 - 91 -8.8%
Equity 144,323 197,115 36.6% 185,883 6.0%
Share capital 102,887 105,334 2.4% 103,493 1.8%
Capital reserve (2,520) 1,948 -177.3% 1,149 69.5%
Earnings reserve 20,577 95,300 363.1% 94,699 0.6%
Carrying value adjustments (23,472) (5,467) -76.7% (13,458) -59.4%
Retained Earnings (loss) 46,850 - -100.0% - -
(R$ thousand)
Balance Sheet
Assets 1,426,657 1,615,511 13.2% 1,538,909 5.0%
Current assets 1,349,757 1,511,757 12.0% 1,441,476 4.9%
Cash and cash equivalentes 3,492 3,112 -10.9% 10,577 -70.6%
Financial assets at fair value through profit and loss 709,964 1,288,944 81.6% 1,253,899 2.8%
Financial assets held-to-maturity - (0) - (0) 0.0%
Accounts receivable 170,073 172,666 1.5% 131,081 31.7%
Deferred income tax and social contribution - 10,612 - 8,227 29.0%
Related Parties 433,071 17,662 -95.9% 19,176 -7.9%
Derivative instruments - (0) - (0) 0.0%
Prepaid expenses - 6,376 - 6,409 -0.5%
Other receivables 33,156 12,385 -62.6% 12,107 2.3%
Non-current assets 76,900 103,754 34.9% 97,433 6.5%
Financial assets - bank deposits - - - - -
Financial assets held-to-maturity - - - - -
Deferred income tax 8,625 1,852 -78.5% 5,974 -69.0%
Derivative financial instruments 550 - -100.0% - -
Other accounts receivable 6,821 24 -99.6% 23 6.6%
Investments 1,937 5,058 161.1% 7,083 -28.6%
Property, plant and equipment 3,208 9,231 187.8% 8,289 11.4%
Intangible assets 55,758 87,589 57.1% 76,064 15.2%
Related Parties - - - - -
1Q14
vs
4Q13
1Q14
vs
1Q131Q13 1Q14 4Q13

Thank you! Contact IR Team +55 11 5105-1847 [email protected] www.pontosmultiplus.com.br/ir
Ronald Domingues Filipe Scalco
Fernanda Camiña