Embed Size (px)
Citation preview
Low-paid employment in Brazil1
Área 12 - Economia do trabalho
Adriana Fontes2
Valéria Pero3
Resumo
Trabalhadores de baixos salários constituem um alvo importante de políticas públicas nos países
industrializados. Apesar da relevância deste grupo ainda maior em países em desenvolvimento, a questão
não tem sido investigada em profundidade. Este artigo busca analisar empiricamente a tendência, o perfil
e a mobilidade dos trabalhadores com baixos salários nas seis principais regiões metropolitanas do Brasil,
utilizando a Pesquisa Mensal do Emprego (PME/IBGE) de 2002 a 2009. Os resultados indicam que
21,5% dos assalariados nas áreas metropolitanas podem ser considerados de baixos salários uma vez que
recebiam menos de dois terços da mediana do salário-hora, em 2009. Apesar da redução na desigualdade
de renda brasileira no período, a proporção de empregados considerados com baixa remuneração se
manteve relativamente alta, com uma tendência decrescente a partir de 2005. Mulheres, não brancos,
jovens e trabalhadores de baixa escolaridade estão mais expostos à baixa remuneração do emprego. O
emprego de baixa renda tem maior instabilidade e maior risco de desemprego e inatividade. As análises
de mobilidade mostram que as transições para o desemprego ou inatividade têm relação negativa com a
duração no emprego de baixa renda, ao passo que a probabilidade de melhorar no emprego aumenta com
o tempo no emprego.
Abstract
Low-paid workers are seen as a relevant target group for public policies in industrialized countries.
Despite the importance of low wages in developing countries, the issue has not been deeply investigated
yet. This study aims at analyzing empirically the trends, profile and mobility of low-paid workers in
Brazilian metropolitan areas, using Monthly Employment Research (PME/IBGE) data from 2002 to 2009.
Results indicate that 21.5% of workers in metropolitan areas are considered low pay, i.e., earn less than
two thirds of the median hourly wage, in 2009. In spite of the reduction in Brazilian income inequality
between 2002 and 2009, the proportion of employees considered to be low paid remained relatively stable
during the period, presenting a downward trend after 2005. Female, non white, younger and less educated
workers are more exposed to low paid employment. This kind of employment has more instability and
risk of unemployment and inactivity. The mobility analysis shows that the chance of leaving low pay to
unemployment or inactivity reduces with job duration, while probability to improve in the employment
increases with time spent in low paid jobs.
Palavras-chave: economia do trabalho, nível e diferenciais de rendimentos, mobilidade.
Keywords: labor economics, wage level and differentials, mobility.
JEL Classification – J0, J31, J6.
1 This study is part of a project on low-wage work in developing countries, financed by ILO.
2 Researcher at Instituto de Estudos do Trabalho e Sociedade (IETS).
3 Lecturer at Economics Institute of Federal University of Rio de Janeiro (UFRJ) and researcher at Instituto de Estudos do
Trabalho e Sociedade (IETS).

Low-paid employment in Brazil
Introduction
Brazil has one of the highest income inequalities in the world, although it has been decreasing over time
since the beginning of the new century. For a middle-income country it means that a considerable part of
the Brazilian workforce is low-paid, which motivates per se an investigation of the issue. Moreover, the
recent changes in Brazilian economy with a new pattern of growth have had consequences in the labour
market. Positives effects can be observed in real wages, unemployment rates and specially in the level of
employment formalization. These labour market trends should affect low paid employee dynamics in the
Brazilian context.
Low paid employees are seen as a relevant target group for public policies. In developed countries, this
group has acquired rising importance with the increase in earnings inequality (Cappellari, 2007; Cuesta,
2008). The Organisation for Economic Co-operation and Development (OCDE) has already included
low-skill and low paid workers in their studies to define appropriate policies (OECD, 2009). The debate
on low-paid work is related to questions of efficiency and equity in the economy. On the one hand, low-
paid work can be an alternative to entrants in the labor market, providing job experience for the youth and
assuring more flexibility to the economy. On the other hand, if a considerable proportion of these workers
is head of households and persists in low pay jobs, equity challenges will arise.
Many studies have addressed the theme in different industrialized countries to investigate low paid profile
and mobility and better understand international differences (Cappellari, 2007; Cuesta, 2008; Salverda et
al. eds 2008; Caroli and Gautié eds 2008; Westeergaard-Nielsen ed 2008; Bosch and Weinkopf eds 2008;
LaRochelle-Côté and Dionne, 2009). First, taking in consideration countries with comparable economic
and social structures, Canada, the United States, the United Kingdom and Ireland encompass higher rates
of low-paid workers (20-25%) than other OECD countries (around 15%), and Scandinavian countries
tend to have the lower proportions of low-paid workers (around 7%).
Moreover, low educated employees, female and younger workers present higher probabilities of being
low paid employees. This profile suggests that workers are low paid because they lack some essential
characteristic which enhances productivity and earnings, like education and experience in the labor
market. In this case, the strategy has been to focus policy interventions on low educated employees in low
pay. However, state dependency accounts for a considerable aggregated persistence in low pay, which
suggests that adopting policies for all low paid workers would be more appropriate, such as increasing
minimum wages, payroll tax reductions for low-paid, among others. (Fitussi, 2000; Cappellari, 2007;
LaRochelle-Côté and Dionne, 2009)
Despite the importance of low paid occupation in developing countries, the issue has not been deeply
investigated. The debate on low paid employees in these countries, which have high degrees of inequality,
are intrinsically related to poverty, social vulnerability, informality and low productivity. These
connections in countries such as Brazil indicate a more complex subject that must be faced by public
policy.
This study aims at analyzing empirically the trends, profile and mobility of low-paid workers in Brazilian
metropolitan areas, using Monthly Employment Research (PME/IBGE) data between 2002 and 2009. The
purpose is to pursue the following research questions: Which are the trends of low pay? Who is more
exposed to low pay? Is there any gender-related pattern? Which factors can explain the identified trends
in low pay? Are low-paid jobs “dead-end” or “transitory”? Does the time a worker spend in low pay
influences mobility?
In order to answer these questions, the study is structured in five sections, besides this introduction and
the conclusions. The first section analyzes the performance of metropolitan labor market in Brazil from
2002 to 2009, considering the evolution of the labor force, unemployment rates, informality levels and
real income. Section two presents the data base and the methodology adopted. Next, a descriptive analysis
which includes individual and job characteristics of low pay is performed. This section also includes a
trend analysis of low-paid workers: the increasing or decreasing patterns over time and its changing
profile, as well as a geographical distribution. Section four estimates the determinants of low-paid
workers, applying a probit model with sample selection, focusing on the existence of a gender related
pattern. Finally, we analyse the incidence of low pay on mobility applying a multinomial logit
distinguishing between transitions to unemployment, inactivity and higher paid jobs.
Results indicate that 21.5% of the employees in metropolitan area were considered as low pay, i.e.,
receive less than two thirds of the median hourly wage, in 2009. In spite of the reduction in Brazilian
income inequality between 2002 and 2009, the proportion of employees considered as low paid remained
relatively stable in the period, with a downward trend after 2005. Female, non white, younger and less
educated workers are more exposed to low paid employment. The mobility analysis show that the
probability to leave the labor market – for unemployment or inactivity – reduces with low paid duration,
while probability of job improvement increases with time spent in low paid occupation.
1. Performance of the Brazilian metropolitan labour market
The labour market has shown during the last eight years – corresponding to President Lula’s two terms in
office – improvements in most of the main indicators for Brazilian metropolitan areas. This performance
can be explained, at least partially, by the recovery of economic activity: the average of annual gross
domestic product (GDP) growth rates between 2002 to 2009 hovered around 3,5%, while in the 1990's it
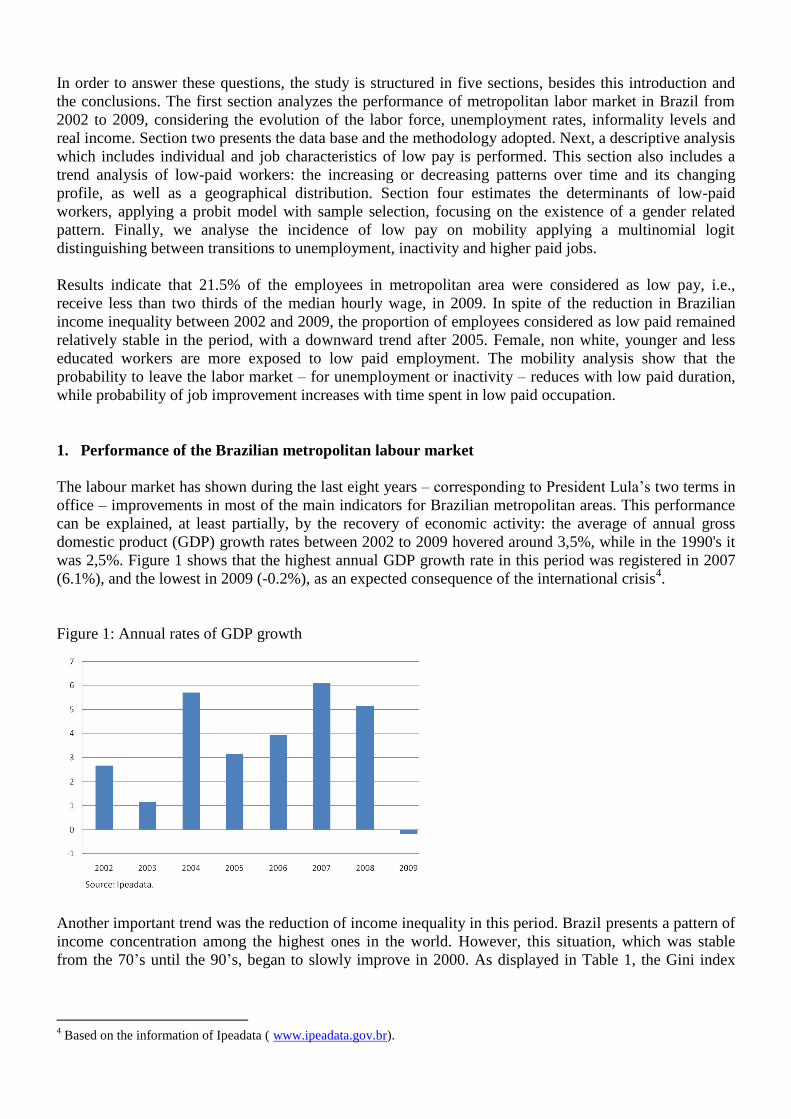
was 2,5%. Figure 1 shows that the highest annual GDP growth rate in this period was registered in 2007
(6.1%), and the lowest in 2009 (-0.2%), as an expected consequence of the international crisis4.
Figure 1: Annual rates of GDP growth
Another important trend was the reduction of income inequality in this period. Brazil presents a pattern of
income concentration among the highest ones in the world. However, this situation, which was stable
from the 70’s until the 90’s, began to slowly improve in 2000. As displayed in Table 1, the Gini index
4 Based on the information of Ipeadata ( www.ipeadata.gov.br).

dropped from 0.59 in 2002 to 0.55 in 20085. It is important to notice that, although the recent decrease in
inequality, Brazil still presents one of the highest inequality levels in the world.
Table 1: Per capita income, poverty and inequality in Brazil
Year Per capita income Percentage of poor Gini Index
2002 573.84 32.95 0.59
2003 541.83 34.22 0.58
2004 559.69 31.81 0.57
2005 594.00 29.23 0.57
2006 648.74 25.32 0.56
2007 665.71 23.82 0.56
2008 699.68 21.29 0.55 Source: Table prepared by IETS based on PNAD / IBGE.
Two factors are pointed in the economics literature as the main immediate contributors for recent
decreases in inequality. First, the improvement of social protection for the poorest, with a national cash
transfer program called Bolsa-Família. A large number of poor families now receive the benefit of
governmental cash transfers. In fact, the percentage of poor diminished from 33% to 21% of the total
population from 2002 to 2008.
Second, improvements in the distribution of labour earnings were also important to explain the recent
decrease in inequality. According to Barros et al (2007), the effect of occupational redistribution was less
important than the pro-poor redistribution of labour income. Several factors contributed to this, such as
real increases in the minimum wage, diminishing earning returns for schooling, among others.
Given this context, we will now analyze the main indicators of metropolitan Brazilian labour markets
from 2002 to 2009. First, there was a continuous increase in the Brazilian labour force from 36 million of
persons working or looking for a job in 2002 to 41 million in 2009, which means a growth rate of 14%.
This labour force growth was accompanied by a significant fall in unemployment rate over the period,
from 12.9% in 2002 to 8,0% in 2009 (Figure 2). Therefore, the growth of the labour force was primarily
in occupation, representing a very positive aspect of the recent behaviour of the metropolitan Brazilian
labour market.
Figure 2: Evolution of unemployment rate in metropolitan Brazil
7
8
9
10
11
12
13
fev/
03
abr/
03
jun
/03
ago
/03
ou
t/0
3
de
z/0
3
fev/
04
abr/
04
jun
/04
ago
/04
ou
t/0
4
de
z/0
4
fev/
05
abr/
05
jun
/05
ago
/05
ou
t/0
5
de
z/0
5
fev/
06
abr/
06
jun
/06
ago
/06
ou
t/0
6
de
z/0
6
fev/
07
abr/
07
jun
/07
ago
/07
ou
t/0
7
de
z/0
7
fev/
08
abr/
08
jun
/08
ago
/08
ou
t/0
8
de
z/0
8
fev/
09
abr/
09
jun
/09
ago
/09
ou
t/0
9
de
z/0
9
Source: PME/IBGE.
5 Data based on PNAD/IBGE and treated by IETS (www.iets.org.br).
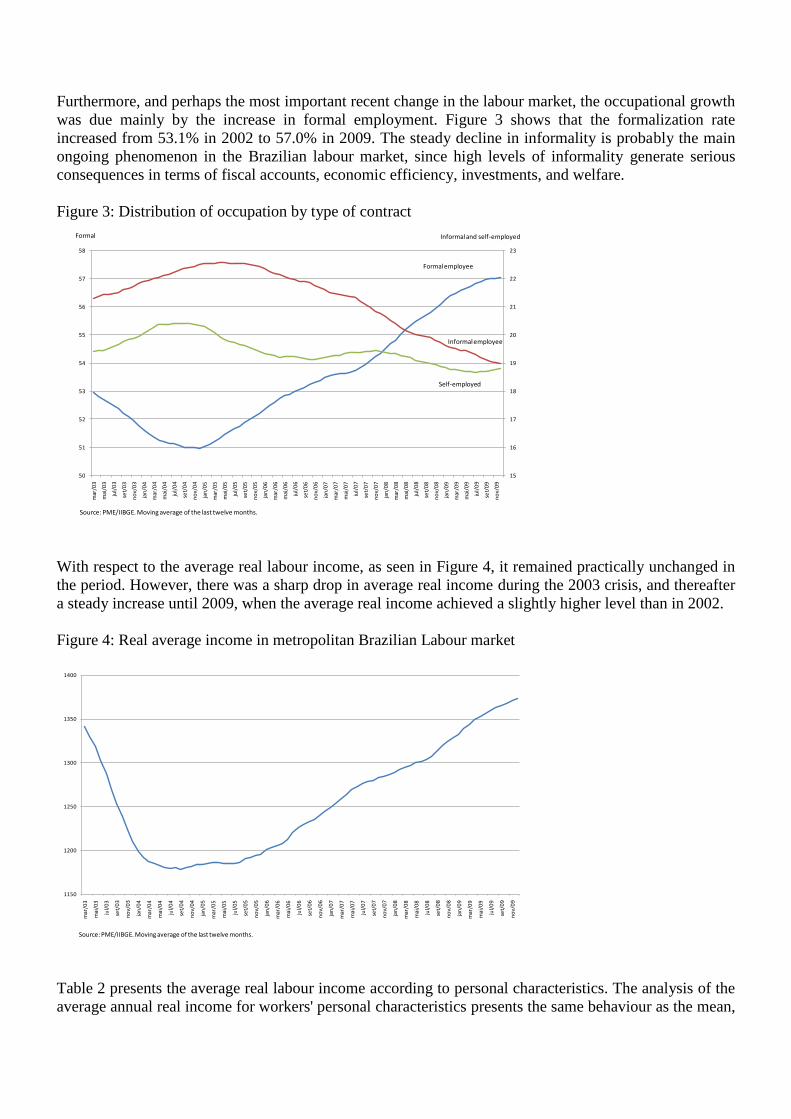
Furthermore, and perhaps the most important recent change in the labour market, the occupational growth
was due mainly by the increase in formal employment. Figure 3 shows that the formalization rate
increased from 53.1% in 2002 to 57.0% in 2009. The steady decline in informality is probably the main
ongoing phenomenon in the Brazilian labour market, since high levels of informality generate serious
consequences in terms of fiscal accounts, economic efficiency, investments, and welfare.
Figure 3: Distribution of occupation by type of contract
15
16
17
18
19
20
21
22
23
50
51
52
53
54
55
56
57
58
mar
/03
mai
/03
jul/
03
set/
03
no
v/0
3
jan
/04
mar
/04
mai
/04
jul/
04
set/
04
no
v/0
4
jan
/05
mar
/05
mai
/05
jul/
05
set/
05
no
v/0
5
jan
/06
mar
/06
mai
/06
jul/
06
set/
06
no
v/0
6
jan
/07
mar
/07
mai
/07
jul/
07
set/
07
no
v/0
7
jan
/08
mar
/08
mai
/08
jul/
08
set/
08
no
v/0
8
jan
/09
mar
/09
mai
/09
jul/
09
set/
09
no
v/0
9
Formal Informal and self-employed
Formal employee
Informal employee
Self-employed
Source: PME/IIBGE. Moving average of the last twelve months.
With respect to the average real labour income, as seen in Figure 4, it remained practically unchanged in
the period. However, there was a sharp drop in average real income during the 2003 crisis, and thereafter
a steady increase until 2009, when the average real income achieved a slightly higher level than in 2002.
Figure 4: Real average income in metropolitan Brazilian Labour market
1150
1200
1250
1300
1350
1400
mar
/03
mai
/03
jul/
03
set/
03
no
v/0
3
jan
/04
mar
/04
mai
/04
jul/
04
set/
04
no
v/0
4
jan
/05
mar
/05
mai
/05
jul/
05
set/
05
no
v/0
5
jan
/06
mar
/06
mai
/06
jul/
06
set/
06
no
v/0
6
jan
/07
mar
/07
mai
/07
jul/
07
set/
07
no
v/0
7
jan
/08
mar
/08
mai
/08
jul/
08
set/
08
no
v/0
8
jan
/09
mar
/09
mai
/09
jul/
09
set/
09
no
v/0
9
Source: PME/IIBGE. Moving average of the last twelve months.
Table 2 presents the average real labour income according to personal characteristics. The analysis of the
average annual real income for workers' personal characteristics presents the same behaviour as the mean,
i.e., it decreases in 2003-2004, then grows steadily thereafter until 2009 reaching a slightly higher value
than in 2002.
As expected, men earn more than women, whites more than blacks, household heads more than non-
household heads, older workers more than younger ones and, finally, the more educated earn more than
the less educated. More interesting, however, is to verify that the differences between these groups
decreased over the years. Returns on education reported the greatest decreases between 2002 and 2009.
These results are consistent with the decrease in income inequality observed in this period.
Table 2: Real average income in metropolitan Brazil by personal characteristics
2002 2003 2004 2005 2006 2007 2008 2009
Gender
Female 1,110.47 991.99 977.25 994.03 1,028.55 1,062.45 1,100.54 1,148.13
Male 1,578.18 1,382.73 1,353.74 1,375.36 1,429.89 1,472.59 1,514.90 1,579.75
Color
White 846.13 739.60 735.21 745.16 789.10 817.59 862.48 898.95
Non-white 1,770.87 1,547.62 1,523.05 1,562.07 1,602.25 1,657.54 1,699.68 1,779.04
Family position
Others 1,039.67 921.16 906.42 931.47 978.07 1,009.38 1,041.39 1,098.82
Household head 1,740.29 1,528.12 1,497.56 1,516.13 1,565.44 1,612.53 1,657.22 1,709.13
Age
15-24 680.22 608.87 594.13 605.70 633.71 655.46 682.41 711.99
25-49 1,479.68 1,297.18 1,267.37 1,262.99 1,303.11 1,333.23 1,356.44 1,410.48
>50 1,854.52 1,586.12 1,548.38 1,620.46 1,678.18 1,726.82 1,805.22 1,838.03
Education
up to 3 years of schooling 588.43 517.60 495.61 505.47 538.18 557.14 590.44 610.03
4-7 years of schooling 703.39 615.82 613.16 628.38 653.01 681.84 698.86 717.00
8-10 years of schooling 845.05 729.56 704.60 721.72 754.50 771.79 780.57 802.02
11 or more 2,143.79 1,861.51 1,781.15 1,761.89 1,785.02 1,801.69 1,818.65 1,864.42
Total 1,383.36 1,217.86 1,193.18 1,211.18 1,255.89 1,293.47 1,332.52 1,387.80
Personal characteristicsYear
Source: PME/IBGE.
Finally, the analysis of average real income by job characteristics can be seen in table 3. It shows, first,
that income increases with duration of employment. However, the gains from staying employed longer in
a company are decreasing over time. As there is an association between high turnover, low education and
low earnings, this behaviour of labour income may also have contributed to reducing inequality.
Brazil has huge regional differences in terms of development. The average real income of metropolitan
areas of the Northeast, the poorest region of Brazil, are lower than those in the South and Southeast
regions. Apart from the area of Recife, the behaviour of income over time was similar to the average, and
the income differences between metropolitan areas and the national average incomes reduced over time.
Although more detailed studies are needed to examine this question, these results indicate that Brazil may
be experiencing a regional income convergence.
Considering different sectors of economic activity, public administration and manufacturing are those
with the highest average incomes, while domestic services and construction have the lowest. The
behaviour over time is similar to the average and there is no clear pattern for the differences of income
between these sectors over time.
Employers, public servants and formal employees are those that, on average, earn higher wages in
Brazilian metropolitan labour market. The increases in income over time were especially strong for public
servants in this period. Among the informal segments of the labour market, employees without a formal
employment contract earn less than self-employed, but both earn more than domestic employees.
Non-white White
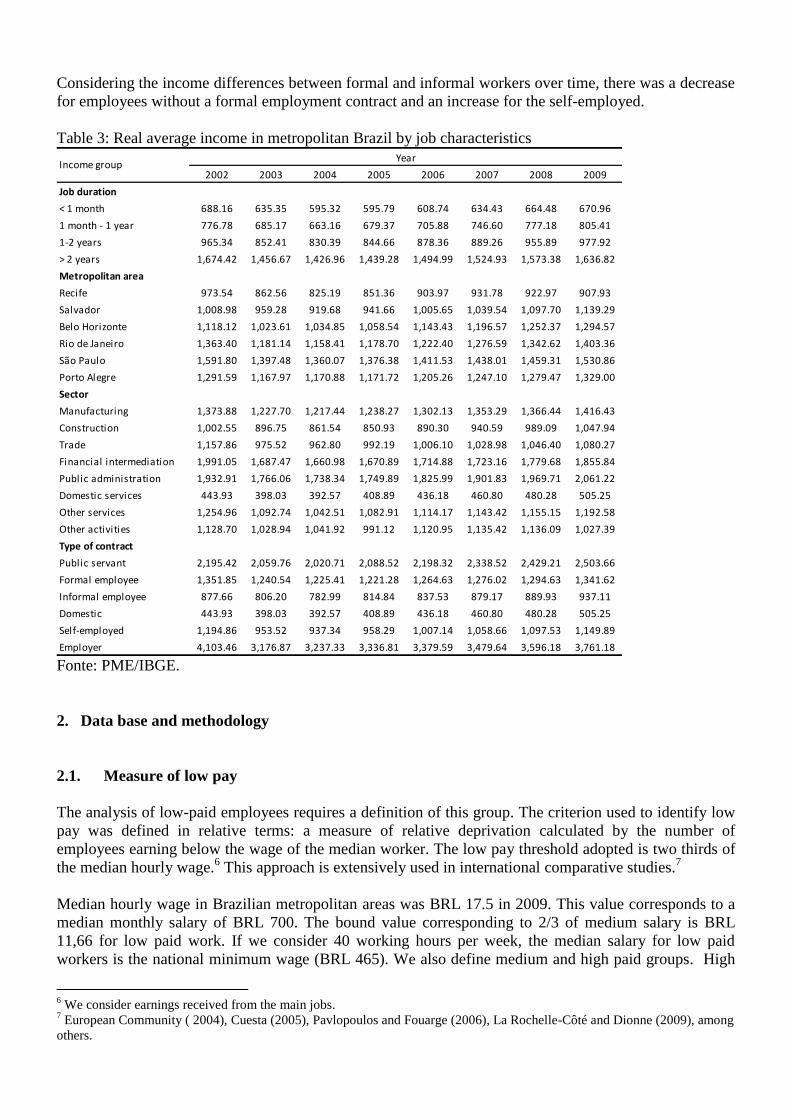
Considering the income differences between formal and informal workers over time, there was a decrease
for employees without a formal employment contract and an increase for the self-employed.
Table 3: Real average income in metropolitan Brazil by job characteristics
2002 2003 2004 2005 2006 2007 2008 2009
Job duration
< 1 month 688.16 635.35 595.32 595.79 608.74 634.43 664.48 670.96
1 month - 1 year 776.78 685.17 663.16 679.37 705.88 746.60 777.18 805.41
1-2 years 965.34 852.41 830.39 844.66 878.36 889.26 955.89 977.92
> 2 years 1,674.42 1,456.67 1,426.96 1,439.28 1,494.99 1,524.93 1,573.38 1,636.82
Metropolitan area
Recife 973.54 862.56 825.19 851.36 903.97 931.78 922.97 907.93
Salvador 1,008.98 959.28 919.68 941.66 1,005.65 1,039.54 1,097.70 1,139.29
Belo Horizonte 1,118.12 1,023.61 1,034.85 1,058.54 1,143.43 1,196.57 1,252.37 1,294.57
Rio de Janeiro 1,363.40 1,181.14 1,158.41 1,178.70 1,222.40 1,276.59 1,342.62 1,403.36
São Paulo 1,591.80 1,397.48 1,360.07 1,376.38 1,411.53 1,438.01 1,459.31 1,530.86
Porto Alegre 1,291.59 1,167.97 1,170.88 1,171.72 1,205.26 1,247.10 1,279.47 1,329.00
Sector
Manufacturing 1,373.88 1,227.70 1,217.44 1,238.27 1,302.13 1,353.29 1,366.44 1,416.43
Construction 1,002.55 896.75 861.54 850.93 890.30 940.59 989.09 1,047.94
Trade 1,157.86 975.52 962.80 992.19 1,006.10 1,028.98 1,046.40 1,080.27
Financial intermediation 1,991.05 1,687.47 1,660.98 1,670.89 1,714.88 1,723.16 1,779.68 1,855.84
Public administration 1,932.91 1,766.06 1,738.34 1,749.89 1,825.99 1,901.83 1,969.71 2,061.22
Domestic services 443.93 398.03 392.57 408.89 436.18 460.80 480.28 505.25
Other services 1,254.96 1,092.74 1,042.51 1,082.91 1,114.17 1,143.42 1,155.15 1,192.58
Other activities 1,128.70 1,028.94 1,041.92 991.12 1,120.95 1,135.42 1,136.09 1,027.39
Type of contract
Public servant 2,195.42 2,059.76 2,020.71 2,088.52 2,198.32 2,338.52 2,429.21 2,503.66
Formal employee 1,351.85 1,240.54 1,225.41 1,221.28 1,264.63 1,276.02 1,294.63 1,341.62
Informal employee 877.66 806.20 782.99 814.84 837.53 879.17 889.93 937.11
Domestic 443.93 398.03 392.57 408.89 436.18 460.80 480.28 505.25
Self-employed 1,194.86 953.52 937.34 958.29 1,007.14 1,058.66 1,097.53 1,149.89
Employer 4,103.46 3,176.87 3,237.33 3,336.81 3,379.59 3,479.64 3,596.18 3,761.18
Income groupYear
Fonte: PME/IBGE.
2. Data base and methodology
2.1. Measure of low pay
The analysis of low-paid employees requires a definition of this group. The criterion used to identify low
pay was defined in relative terms: a measure of relative deprivation calculated by the number of
employees earning below the wage of the median worker. The low pay threshold adopted is two thirds of
the median hourly wage.6 This approach is extensively used in international comparative studies.
7
Median hourly wage in Brazilian metropolitan areas was BRL 17.5 in 2009. This value corresponds to a
median monthly salary of BRL 700. The bound value corresponding to 2/3 of medium salary is BRL
11,66 for low paid work. If we consider 40 working hours per week, the median salary for low paid
workers is the national minimum wage (BRL 465). We also define medium and high paid groups. High
6 We consider earnings received from the main jobs.
7 European Community ( 2004), Cuesta (2005), Pavlopoulos and Fouarge (2006), La Rochelle-Côté and Dionne (2009), among
others.
paid workers are those earning more than one-and-a-half times the median. The bound value is BRL 26,3,
representing a median monthly salary of BRL 1,052. Finally, medium pay is defined as those workers
earning between two-thirds and one-and-a-half times the median hourly wage.8
2.2. Data
The Monthly Employment Research (PME/IBGE) is the source of information processed to study the
low-paid workers in Brazil. It is a household research, which presents a panel rotation of households and
represents the only possibility to longitudinal studies considering formal and informal sectors of the
labour market in Brazil (IBGE, 2002).
The analysis will be made for the period from 2002 to 2009, because IBGE introduced a methodological
change in the structure of the research that interrupted the continuity of the PME data series. The study
was conducted for formal and informal employees in the main occupation living in seven metropolitan
areas of Brazil, totalizing 254,328 of observations in 2009.
2.3. Methodology
First, there will be a descriptive analysis of the low paid employees profile. For that purpose, the analysis
was divided into two sets of variables: a) personal characteristics, such as age, gender, color, and
educational level and b) job characteristics, like sector of activity, type of contract and geographical
location. We will also include a trend analysis of the incidence of low-pay workers: the increasing or
decreasing over time and changing profile, as well as the geographical distribution.
After that, we will study the determinants of low-paid workers, applying a probit model, focusing on the
existence of a gender related pattern. The probit model estimates the probability of being employed in a
low-paid job, showing the relationship between dependent variables and explanatory variables. Through
this analysis, we identify the effect of each explanatory variable separately, isolating the effect of the
other variables. The model can be represented by the following equation:
kk xxGxyP ...1 110 (1)
Where y is low pay, x is the explanatory variables already described, related to individual characteristics
and their job and 10 zG , for all real numbers z the nonlinear function G is a function of standard
normal cumulative distribution ( dvvzzG z ).
Nonetheless, considering that being employed is not independent from being low paid, the estimated
results from this model would be biased. In order to treat selection bias, we apply a bivariate probit model
of the type used by Cuesta (2005), and the conditional probability of being in a low-paid job given that
the individual is employed is given by:
'
''
2 ;,1
i
i
z
zxywP
i
ii
(2)
where iw denotes the hourly earnings in the main job of the individual i, 1iy if individual i is employed,
iz is the vector of factors that influence the probability of being employed, ix is the vector of factors that
8 Unpaid workers are not included.
determines the likelihood of low-employment, is the univariate standard normal cumulative
distribution function, and 2 is the cumulative distribution function of the bivariate standard normal.
The more general probit with selectivity, described in equation (2), is needed in the case where ρ is non-
zero. The extra variables in i
z not included in ix can be viewed as instruments for the employment
selection equation.
The dependent variable is a dummy variable that takes on value 1 if the individual had a low-paid job in
2009, and takes on value 0 in the case that there was no register of a low pay job. The explanatory
variables in the equation (2) include both personal and job characteristics: gender, color, a dummy of
household head, age, schooling, part-time, duration of the low-paid job, metropolitan area of residence,
industry and type of employment. The selection equation contains the following explanatory factors:
gender, color, age, number of residents in the household and dummy variables indicating whether there
are children younger than 14 years old in the household and if he/she is the household head.
3. Trend and profile of low-paid employees in Brazil
The present section is dedicated to describe the main personal and job characteristics of the low-paid
workers in metropolitan labour market in Brazil from 2002 to 2009. As mentioned in the methodology,
workers were divided into three categories according to hourly earnings.
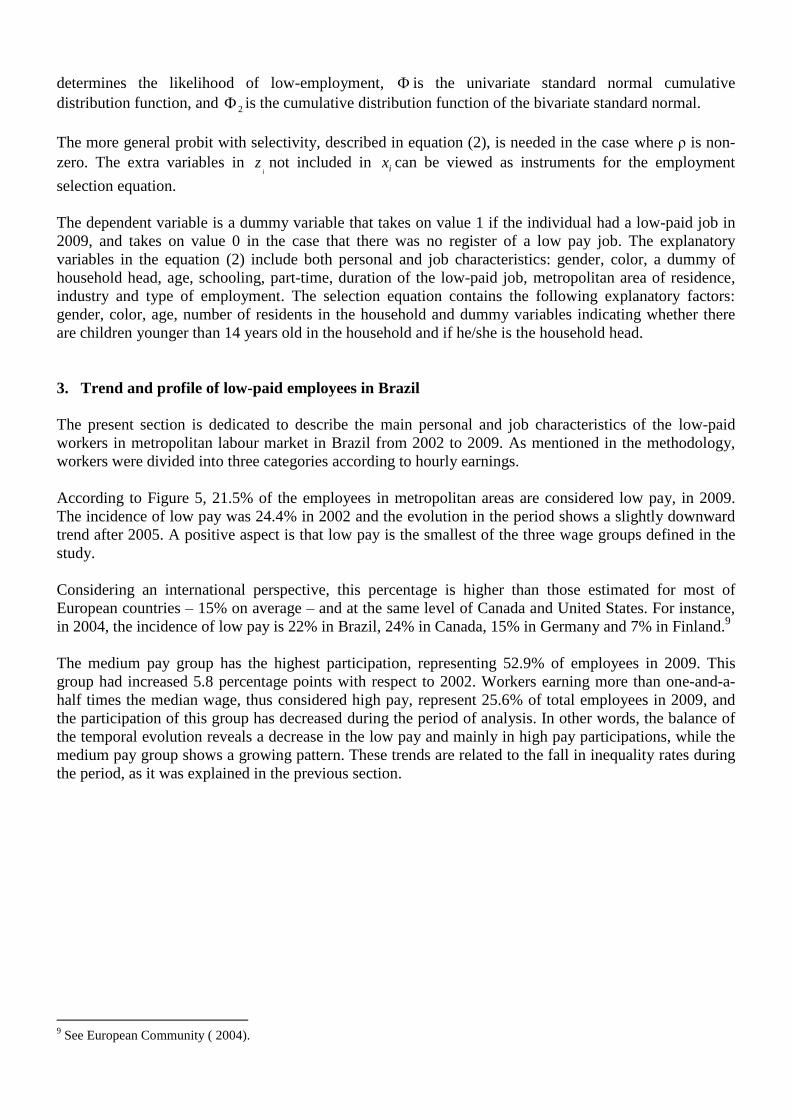
According to Figure 5, 21.5% of the employees in metropolitan areas are considered low pay, in 2009.
The incidence of low pay was 24.4% in 2002 and the evolution in the period shows a slightly downward
trend after 2005. A positive aspect is that low pay is the smallest of the three wage groups defined in the
study.
Considering an international perspective, this percentage is higher than those estimated for most of
European countries – 15% on average – and at the same level of Canada and United States. For instance,
in 2004, the incidence of low pay is 22% in Brazil, 24% in Canada, 15% in Germany and 7% in Finland.9
The medium pay group has the highest participation, representing 52.9% of employees in 2009. This
group had increased 5.8 percentage points with respect to 2002. Workers earning more than one-and-a-
half times the median wage, thus considered high pay, represent 25.6% of total employees in 2009, and
the participation of this group has decreased during the period of analysis. In other words, the balance of
the temporal evolution reveals a decrease in the low pay and mainly in high pay participations, while the
medium pay group shows a growing pattern. These trends are related to the fall in inequality rates during
the period, as it was explained in the previous section.
9 See European Community ( 2004).
Figure 5: Evolution of the distribution of low, medium and high paid employees
15
20
25
30
35
40
45
50
55
2002 2003 2004 2005 2006 2007 2008 2009
Low Medium High
%
Source: PME/IBGE.
Table 4 shows an increase in average and median wages for low, medium and high wage groups. It is
important to notice that, although there is not a strong decrease in the low paid employment, the low paid
is the group with the greater increase in average and median hourly wages. For instance, the proportion of
low paid employees decreased 12.0% from 2002 to 2009, while median hourly wage increased by 32.6%.
Table 4: Real wages and distribution of employees by wage groups
2002 2003 2004 2005 2006 2007 2008 2009
Average wage
Low 347.86 311.40 323.98 340.71 370.11 396.25 415.27 436.65
Medium 683.24 594.43 608.01 635.54 649.24 681.69 705.78 732.86
High 2,571.67 2,256.05 2,265.90 2,332.40 2,288.52 2,450.13 2,483.96 2,675.81
Total 1,137.38 1,038.05 1,015.37 1,022.99 1,064.99 1,090.28 1,118.41 1,166.64
Average hourly wage
Low 7.64 6.89 7.21 7.72 8.34 8.91 9.44 9.93
Medium 16.24 14.05 14.41 15.06 15.47 16.35 16.87 17.63
High 66.53 56.96 56.64 58.08 57.04 60.97 61.95 66.91
Total 28.42 25.53 24.79 24.91 26.00 26.61 27.32 28.59
Median hourly wage
Low 7.98 7.16 7.74 8.11 8.88 9.48 9.99 10.50
Medium 15.65 13.64 13.74 14.68 14.80 15.70 16.21 16.85
High 41.56 35.99 37.38 38.04 37.00 42.02 41.65 45.51
Total 16.09 14.34 14.52 15.06 15.65 16.55 16.68 17.49
Distribution of employees
Low 24.44 20.76 22.55 23.80 22.90 21.89 22.77 21.50
Medium 47.10 49.00 49.01 49.23 47.84 51.47 50.30 52.90
High 28.46 30.23 28.43 26.97 29.26 26.64 26.93 25.60
Total 100.00 100.00 100.00 100.00 100.00 100.00 100.00 100.00
YearWage groups
Source: PME/IBGE. Real wages (December 2009).
The incidence of low pay according to different personal characteristics from 2002 to 2009 is portrayed in
Table 5. In general, it shows a decreasing pattern of the incidence of low pay in almost all types of
employees. However, the speed of decrease is not homogeneous for all groups. In the case of gender, low
paid represents 29.0% of female and 16.7% of male employees in 2009, and the decrease of low paid
incidence was sharper for men (3.8 p.p.) than women (2.3 p.p.).
To analyze the incidence of low pay by color, we divided the workers into two groups: whites and non-
whites. Almost 29.6% of non-whites are considered low pay, while only 14.2% of white workers had
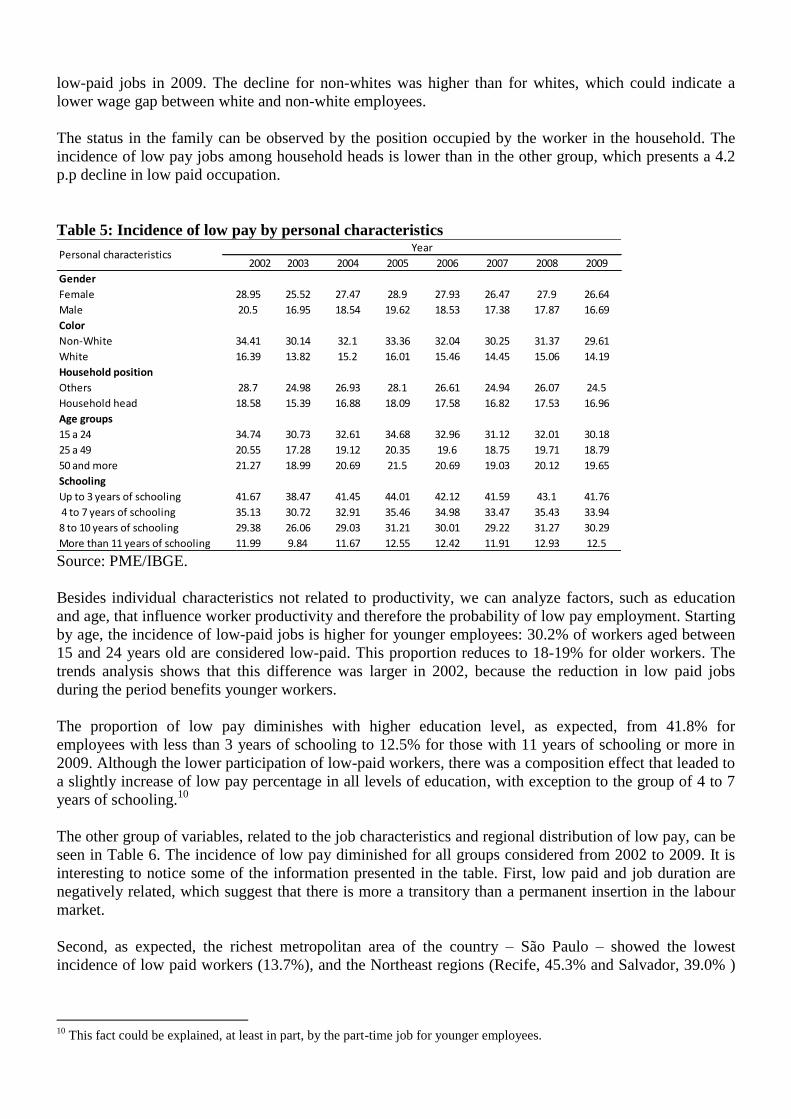
low-paid jobs in 2009. The decline for non-whites was higher than for whites, which could indicate a
lower wage gap between white and non-white employees.
The status in the family can be observed by the position occupied by the worker in the household. The
incidence of low pay jobs among household heads is lower than in the other group, which presents a 4.2
p.p decline in low paid occupation.
Table 5: Incidence of low pay by personal characteristics
2002 2003 2004 2005 2006 2007 2008 2009
Gender
Female 28.95 25.52 27.47 28.9 27.93 26.47 27.9 26.64
Male 20.5 16.95 18.54 19.62 18.53 17.38 17.87 16.69
Color
Non-White 34.41 30.14 32.1 33.36 32.04 30.25 31.37 29.61
White 16.39 13.82 15.2 16.01 15.46 14.45 15.06 14.19
Household position
Others 28.7 24.98 26.93 28.1 26.61 24.94 26.07 24.5
Household head 18.58 15.39 16.88 18.09 17.58 16.82 17.53 16.96
Age groups
15 a 24 34.74 30.73 32.61 34.68 32.96 31.12 32.01 30.18
25 a 49 20.55 17.28 19.12 20.35 19.6 18.75 19.71 18.79
50 and more 21.27 18.99 20.69 21.5 20.69 19.03 20.12 19.65
Schooling
Up to 3 years of schooling 41.67 38.47 41.45 44.01 42.12 41.59 43.1 41.76
4 to 7 years of schooling 35.13 30.72 32.91 35.46 34.98 33.47 35.43 33.94
8 to 10 years of schooling 29.38 26.06 29.03 31.21 30.01 29.22 31.27 30.29
More than 11 years of schooling 11.99 9.84 11.67 12.55 12.42 11.91 12.93 12.5
Personal characteristicsYear
Source: PME/IBGE.
Besides individual characteristics not related to productivity, we can analyze factors, such as education
and age, that influence worker productivity and therefore the probability of low pay employment. Starting
by age, the incidence of low-paid jobs is higher for younger employees: 30.2% of workers aged between
15 and 24 years old are considered low-paid. This proportion reduces to 18-19% for older workers. The
trends analysis shows that this difference was larger in 2002, because the reduction in low paid jobs
during the period benefits younger workers.
The proportion of low pay diminishes with higher education level, as expected, from 41.8% for
employees with less than 3 years of schooling to 12.5% for those with 11 years of schooling or more in
2009. Although the lower participation of low-paid workers, there was a composition effect that leaded to
a slightly increase of low pay percentage in all levels of education, with exception to the group of 4 to 7
years of schooling.10
The other group of variables, related to the job characteristics and regional distribution of low pay, can be
seen in Table 6. The incidence of low pay diminished for all groups considered from 2002 to 2009. It is
interesting to notice some of the information presented in the table. First, low paid and job duration are
negatively related, which suggest that there is more a transitory than a permanent insertion in the labour
market.
Second, as expected, the richest metropolitan area of the country – São Paulo – showed the lowest
incidence of low paid workers (13.7%), and the Northeast regions (Recife, 45.3% and Salvador, 39.0% )
10
This fact could be explained, at least in part, by the part-time job for younger employees.

the highest ones in 2009. However, the incidence of low paid in Belo Horizonte and the Northeast regions
decreased faster than in the other metropolitan regions.
Concerning the incidence of low pay by sector of economic activity, public administration has the lowest
indices of low pay (11.7%) and domestic services the highest ones (45.1%), followed by other activities,
trade and construction. The proportion of low pay also registered an improvement in the period.
Last but not least, incidence of low pay is very different depending on the work relationship. There is a
close relationship between low-pay and informality in Brazil: one third of informal employees are low
paid while the incidence among formal employees is less than half of the informal sector. The percentage
of employees, formal or informal, considered low pay has decreased in the period.
Table 6: Incidence of low pay by job characteristics
2002 2003 2004 2005 2006 2007 2008 2009
Job duration
< 1 month 44.95 39.08 42.36 45.08 43.84 41.01 41.69 41.01
1 month to 1 year 35.98 32.14 33.64 36.18 34.20 32.19 32.21 31.15
1 to 2 years 28.19 24.06 26.66 27.05 26.62 25.38 25.35 23.61
more than 2 years 17.06 14.43 16.11 17.31 16.45 15.86 17.01 16.22
Metropolitan region
Recife 50.07 44.65 46.78 47.20 46.80 45.52 47.02 45.28
Salvador 46.61 40.38 41.61 44.41 40.37 39.74 39.70 39.04
Belo Horizonte 36.41 29.80 30.66 30.99 28.32 27.60 28.36 27.15
Rio de Janeiro 26.70 21.60 24.54 26.35 24.86 23.75 24.82 23.06
São Paulo 14.22 12.84 14.56 15.95 15.77 13.74 14.99 13.66
Porto Alegre 21.46 15.18 16.14 16.18 15.27 15.71 16.71 17.46
Economic activity
Industry 18.49 13.86 15.56 15.96 14.71 13.94 14.70 14.00
Construction 28.90 26.20 28.61 31.69 28.85 27.92 27.01 24.40
Trade 28.56 24.79 27.25 28.00 27.20 27.21 28.52 26.93
Financial intermediation 15.96 13.75 14.38 15.38 14.65 13.90 15.23 14.75
Public administration 15.14 10.72 12.71 13.83 12.60 10.90 12.10 11.66
Domestic services 47.50 46.58 47.87 50.21 49.36 45.59 47.85 45.08
Other services 23.04 19.31 21.02 22.25 21.77 20.23 21.34 20.28
Other activities 48.42 41.66 45.98 51.18 48.05 44.31 47.89 43.16
Type of employment
Formal 16.27 12.04 13.30 13.98 13.20 13.43 14.45 14.28
Informal 34.99 31.48 33.71 35.97 35.50 32.50 34.63 31.98
Job characteristicsYear
Source: PME/IBGE.
4. Determinants of low-paid employees
Table 7 presents the coefficients of the estimation of the probability of being low pay in 2009. The second
column contains the results for the total sample, and in the third and fourth columns the estimated
coefficients for male and female workers are presented separately. Coefficient of the gender dummy is
negative and statistically significant. After controls for observable characteristics, women are more likely
to have a low-paid job than men. This result is consistent with the international literature (see Cuesta,
2008).
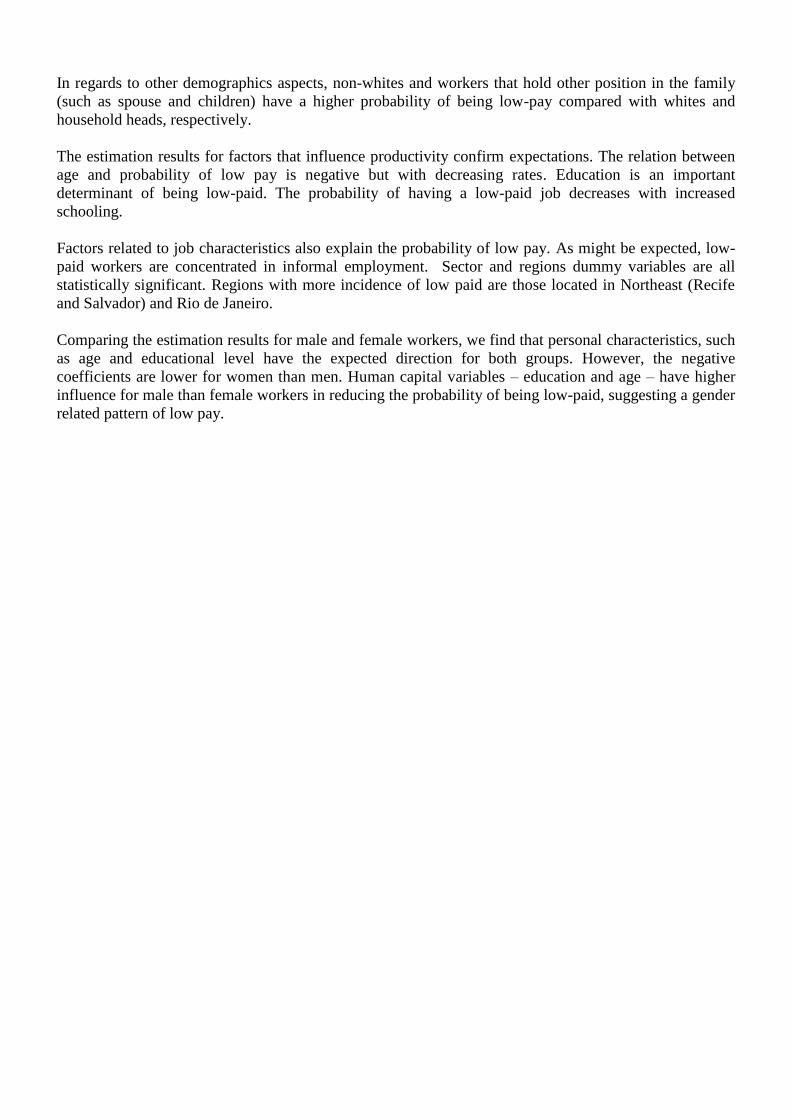
In regards to other demographics aspects, non-whites and workers that hold other position in the family
(such as spouse and children) have a higher probability of being low-pay compared with whites and
household heads, respectively.
The estimation results for factors that influence productivity confirm expectations. The relation between
age and probability of low pay is negative but with decreasing rates. Education is an important
determinant of being low-paid. The probability of having a low-paid job decreases with increased
schooling.
Factors related to job characteristics also explain the probability of low pay. As might be expected, low-
paid workers are concentrated in informal employment. Sector and regions dummy variables are all
statistically significant. Regions with more incidence of low paid are those located in Northeast (Recife
and Salvador) and Rio de Janeiro.
Comparing the estimation results for male and female workers, we find that personal characteristics, such
as age and educational level have the expected direction for both groups. However, the negative
coefficients are lower for women than men. Human capital variables – education and age – have higher
influence for male than female workers in reducing the probability of being low-paid, suggesting a gender
related pattern of low pay.
Table 7: Probit of being low-paid (with correction for sample selection) - 2009 Low-paid Total Males Females
Males -0.292***
(0.0117)
White -0.263*** -0.225*** -0.280***
(0.00609) (0.0117) (0.0101)
Household head -0.0592*** -0.301*** 0.0618***
(0.00880) (0.0258) (0.0110)
Age -0.0788*** -0.0926*** -0.0624***
(0.00131) (0.00233) (0.00206)
Age squared 0.000753*** 0.000940*** 0.000586***
(1.69e-05) (2.35e-05) (2.75e-05)
4-7 years of schooling -0.176*** -0.349*** -0.166***
(0.0141) (0.0205) (0.0269)
8-10 years of schooling -0.282*** -0.635*** -0.323***
(0.0200) (0.0388) (0.0367)
11 or more -0.691*** -1.210*** -0.731***
(0.0303) (0.0543) (0.0575)
Less than 1 year in the job 0.274*** 0.283*** 0.294***
(0.00619) (0.00853) (0.00955)
Salvador -0.173*** -0.222*** -0.147***
(0.00994) (0.0138) (0.0161)
Belo Horizonte -0.583*** -0.785*** -0.400***
(0.0100) (0.0137) (0.0148)
Rio de Janeiro -0.573*** -0.666*** -0.497***
(0.0105) (0.0142) (0.0163)
São Paulo -0.987*** -1.117*** -0.928***
(0.0122) (0.0157) (0.0181)
Porto Alegre -0.793*** -0.937*** -0.702***
(0.0120) (0.0168) (0.0178)
Informal employee 0.499*** 0.554*** 0.454***
(0.00761) (0.00972) (0.0113)
Construction -0.0196* 0.0988*** -0.450***
(0.0111) (0.0135) (0.0404)
Trade 0.296*** 0.391*** 0.211***
(0.00818) (0.0115) (0.0127)
Financial intermediation 0.0913*** 0.203*** -0.0487***
(0.00851) (0.0122) (0.0133)
Public administration -0.144*** -0.0523*** -0.228***
(0.0104) (0.0188) (0.0139)
Other services 0.119*** 0.117*** 0.117***
(0.00836) (0.0120) (0.0130)
Other activities 0.533*** 0.680*** 0.363***
(0.0338) (0.0422) (0.0711)
Partime -0.877*** -0.810*** -0.963***
(0.0119) (0.0167) (0.0173)
Constant 1.634*** 2.545*** 1.347***
(0.0611) (0.0880) (0.0940)
Observations 1025617 475407 550210
Standard errors in parentheses.
*** p<0.01, ** p<0.05, * p<0.1
5. Mobility of low-paid employees
5.1. Data and methodology
Shifting the analysis from the profile to the dynamics of low paid employees in metropolitan Brazilian
labor market, it can be demonstrated to what extent low pay is a transitory or permanent event of job
careers, therefore contributing to the formulation of appropriate income support policies for this group.
For this purpose, we first estimate the degree of mobility across the low pay threshold from month to
month and from one year to the next.
The analysis starts with the estimation of mean transition rates between the three income groups (low,
medium and highpay) for higher paid jobs as well to inactivity and unemployment. To calculate these
transition rates, PME microdata from 2003 to 2009 was used.11
The rotation panel PME follows the same
household four consecutive months, which is then left outside the sample group for the eight following
months, and then is interviewed again for another four consecutive months. Therefore, one household can
be followed for a period of up to 16 months between the first and the last interview. The PME is
subdivided into eight rotation groups. Every month, 25% of the sample of household units is replaced,
following rotation and panel schemes. Therefore, 50% of the sample from a given month appears in the
same month of the following year.
For the longitudinal analysis, thus, we selected 13 panels from January 2003 to December 2009 and the
mean transition rates for the whole period monthly (from the first to the second interviews) and annually
(the first and the fifth interviews). For monthly transitions, 286,272 observations were selected, which
represent 134 million individuals in the whole period. For the annual transitions the available sample
group was smaller, reduced to 141,101 observations. This reduced sample for longer periods, like twelve
months, could generate sample bias, given the high attrition rates.
The first step of the analysis was establishing the permanence rates (that is, the worker stayed in a low
paid job from one period to another) by personal and job characteristics. The results could contribute to
identify the more permanent groups in low pay.
However, our aim is also to study transitions out of low pay and their relation with the duration in the low
paid job. The transitions out of low pay could be to a higher paid job (in the same company or changing
employers), to unemployment or to inactivity. Let mP be the probability that individual i escapes the low-
pay (remaining in low pay is the reference group) to a status m one month after and iX denote a vector of
personal and job characteristics. The transition probability is specified by the following multinomial logit
model:
3
1
i
i
exp1
exp
m
mX
XmYP
In this model, we are more interested in estimating the relationship between duration in low paid job and
the different transitions out of the low pay. This is a retrospective variable, which the workers answer
how long they have been employed in the current job. Therefore, the estimations will report if longer job
duration in low pay is associated with higher or lower probability of transitions out of low pay.
11
Unfortunately, 2002 was the year that IBGE change the panel rotation schema, which pose some data problems in analyzing
this transition year.

5.2. Transition rates
Table 8 shows the mean transition rate estimates of the low, median and high paid employees. First, the
low paid group is the one with the lowest degree of permanence. Moreover, comparing both transition
periods, the permanence rate declines strongly (from 68.2% for one month after to 44.2% for one year
after) comparing to medium and high paid employees. These results suggest that low pay is a more
transitory state, although almost a half continues in this situation one year after.
Second, about 23.5% improve their work situation moving to higher wages, 2.6% become unemployed
and 5.7% goes to inactivity. The transition to inactivity or to unemployment for low paid workers is
higher than for medium and high paid. Comparing to high paid workers, the transition of the low paid to
unemployment is almost 5 times greater and to inactivity is 3 times greater. This means a higher
vulnerability to unemployment of low paid workers. Finally, in this same table, we can notice that
permanence rates for one year after are lower than for one month after (whatever the original situation),
as expected.
Table 8: Transition rates
Low Medium High Inactive Unemployed Total
Low 68.18 22.18 1.34 5.73 2.57 100.00
Medium 6.88 82.15 6.72 2.92 1.33 100.00
High 0.79 10.51 86.44 1.72 0.54 100.00
Total 17.04 46.59 31.97 3.08 1.32 100.00
Low Medium High Inactive Unemployed Total
Low 44.21 34.85 2.66 11.47 6.81 100.00
Medium 9.67 65.60 13.86 6.67 4.19 100.00
High 0.81 12.42 81.08 3.96 1.73 100.00
Total 14.58 40.66 33.94 6.85 3.96 100.00
t1: One month after
t2: One year after
Occupied
Occupied
Source: PME/IBGE.
The probability of leaving a low paid job could be associated to personal attributes and job characteristics.
Beginning the analysis of the transition rates by personal attributes, Table 9 reveals that female, non-
white and low schooling employees have higher permanence rates in low pay, indicating that they are
more exposed to the risk of being trapped into low pay. Nevertheless, and surprisingly, there is no
significant difference between age groups. It seems that increasing education until has the greater impact
in shifting the probability of crossing the low pay threshold.
Analyzing the transitions to unemployment and to inactivity, female workers tend to migrate relatively
more to inactivity, and male workers to unemployment, suggesting a difference in gender pattern of
transition rates. There is no important difference between white and non-with, although younger, other
position in household (like son or espouse) and low educated have higher transitions rates to inactivity.
The more educated workers have lower rates to inactivity and higher rates to unemployment than the less
educated workers.
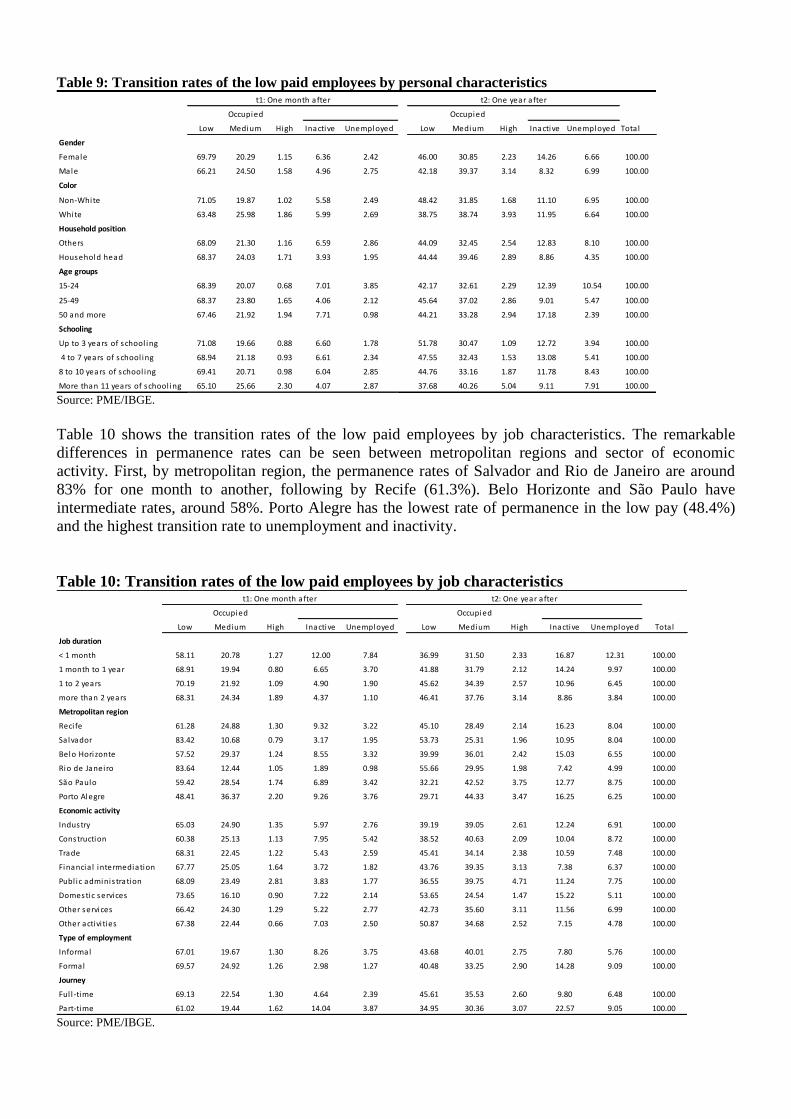
Table 9: Transition rates of the low paid employees by personal characteristics
Low Medium High Inactive Unemployed Low Medium High Inactive Unemployed Total
Gender
Female 69.79 20.29 1.15 6.36 2.42 46.00 30.85 2.23 14.26 6.66 100.00
Male 66.21 24.50 1.58 4.96 2.75 42.18 39.37 3.14 8.32 6.99 100.00
Color
Non-White 71.05 19.87 1.02 5.58 2.49 48.42 31.85 1.68 11.10 6.95 100.00
White 63.48 25.98 1.86 5.99 2.69 38.75 38.74 3.93 11.95 6.64 100.00
Household position
Others 68.09 21.30 1.16 6.59 2.86 44.09 32.45 2.54 12.83 8.10 100.00
Household head 68.37 24.03 1.71 3.93 1.95 44.44 39.46 2.89 8.86 4.35 100.00
Age groups
15-24 68.39 20.07 0.68 7.01 3.85 42.17 32.61 2.29 12.39 10.54 100.00
25-49 68.37 23.80 1.65 4.06 2.12 45.64 37.02 2.86 9.01 5.47 100.00
50 and more 67.46 21.92 1.94 7.71 0.98 44.21 33.28 2.94 17.18 2.39 100.00
Schooling
Up to 3 years of school ing 71.08 19.66 0.88 6.60 1.78 51.78 30.47 1.09 12.72 3.94 100.00
4 to 7 years of school ing 68.94 21.18 0.93 6.61 2.34 47.55 32.43 1.53 13.08 5.41 100.00
8 to 10 years of school ing 69.41 20.71 0.98 6.04 2.85 44.76 33.16 1.87 11.78 8.43 100.00
More than 11 years of school ing 65.10 25.66 2.30 4.07 2.87 37.68 40.26 5.04 9.11 7.91 100.00
t1: One month after t2: One year after
Occupied Occupied
Source: PME/IBGE.
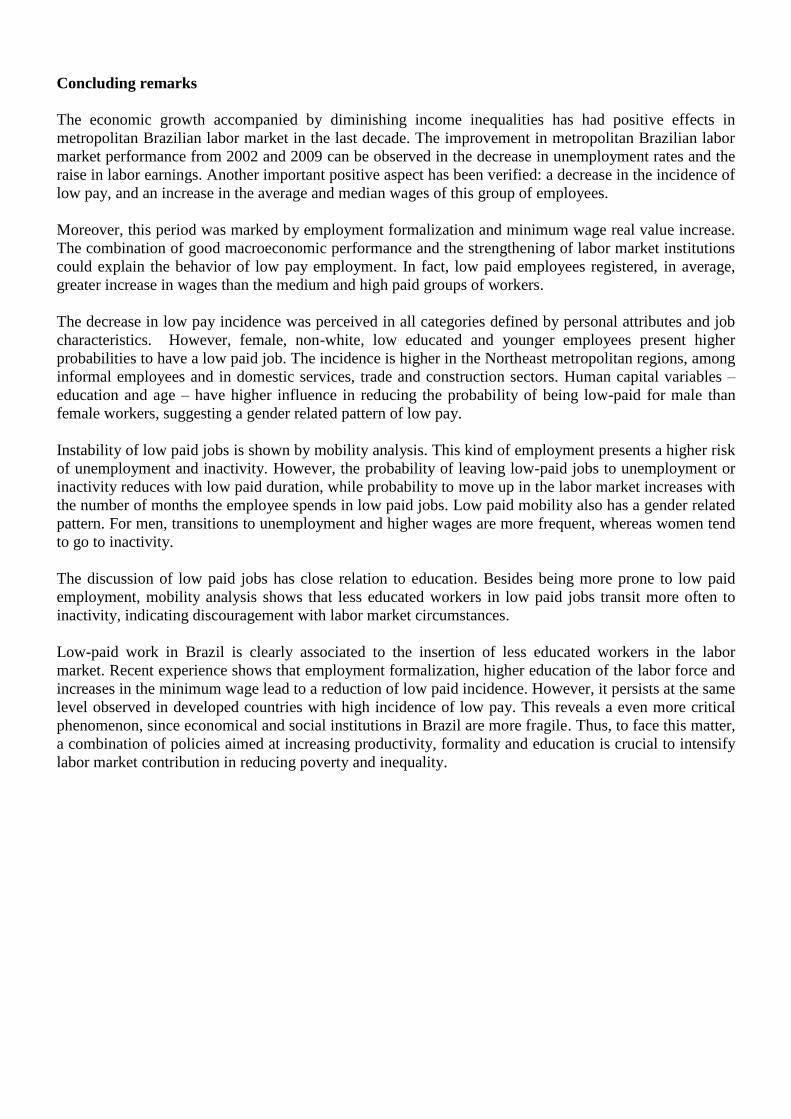
Table 10 shows the transition rates of the low paid employees by job characteristics. The remarkable
differences in permanence rates can be seen between metropolitan regions and sector of economic
activity. First, by metropolitan region, the permanence rates of Salvador and Rio de Janeiro are around
83% for one month to another, following by Recife (61.3%). Belo Horizonte and São Paulo have
intermediate rates, around 58%. Porto Alegre has the lowest rate of permanence in the low pay (48.4%)
and the highest transition rate to unemployment and inactivity.
Table 10: Transition rates of the low paid employees by job characteristics
Low Medium High Inactive Unemployed Low Medium High Inactive Unemployed Total
Job duration
< 1 month 58.11 20.78 1.27 12.00 7.84 36.99 31.50 2.33 16.87 12.31 100.00
1 month to 1 year 68.91 19.94 0.80 6.65 3.70 41.88 31.79 2.12 14.24 9.97 100.00
1 to 2 years 70.19 21.92 1.09 4.90 1.90 45.62 34.39 2.57 10.96 6.45 100.00
more than 2 years 68.31 24.34 1.89 4.37 1.10 46.41 37.76 3.14 8.86 3.84 100.00
Metropolitan region
Reci fe 61.28 24.88 1.30 9.32 3.22 45.10 28.49 2.14 16.23 8.04 100.00
Sa lvador 83.42 10.68 0.79 3.17 1.95 53.73 25.31 1.96 10.95 8.04 100.00
Belo Horizonte 57.52 29.37 1.24 8.55 3.32 39.99 36.01 2.42 15.03 6.55 100.00
Rio de Janeiro 83.64 12.44 1.05 1.89 0.98 55.66 29.95 1.98 7.42 4.99 100.00
São Paulo 59.42 28.54 1.74 6.89 3.42 32.21 42.52 3.75 12.77 8.75 100.00
Porto Alegre 48.41 36.37 2.20 9.26 3.76 29.71 44.33 3.47 16.25 6.25 100.00
Economic activity
Industry 65.03 24.90 1.35 5.97 2.76 39.19 39.05 2.61 12.24 6.91 100.00
Construction 60.38 25.13 1.13 7.95 5.42 38.52 40.63 2.09 10.04 8.72 100.00
Trade 68.31 22.45 1.22 5.43 2.59 45.41 34.14 2.38 10.59 7.48 100.00
Financia l intermediation 67.77 25.05 1.64 3.72 1.82 43.76 39.35 3.13 7.38 6.37 100.00
Publ ic adminis tration 68.09 23.49 2.81 3.83 1.77 36.55 39.75 4.71 11.24 7.75 100.00
Domestic services 73.65 16.10 0.90 7.22 2.14 53.65 24.54 1.47 15.22 5.11 100.00
Other services 66.42 24.30 1.29 5.22 2.77 42.73 35.60 3.11 11.56 6.99 100.00
Other activi ties 67.38 22.44 0.66 7.03 2.50 50.87 34.68 2.52 7.15 4.78 100.00
Type of employment
Informal 67.01 19.67 1.30 8.26 3.75 43.68 40.01 2.75 7.80 5.76 100.00
Formal 69.57 24.92 1.26 2.98 1.27 40.48 33.25 2.90 14.28 9.09 100.00
Journey
Ful l -time 69.13 22.54 1.30 4.64 2.39 45.61 35.53 2.60 9.80 6.48 100.00
Part-time 61.02 19.44 1.62 14.04 3.87 34.95 30.36 3.07 22.57 9.05 100.00
t1: One month after t2: One year after
Occupied Occupied
Source: PME/IBGE.

In regards to economic activity, domestic service and trade, not surprisingly, register higher rates of
permanence than public administration, financial intermediation and industry. Construction has a lower
permanence rate, but higher transition rates to unemployment and inactivity. It is interesting to notice that
the relationship between job duration and permanence rate seems to have an inverted-U shape, with the
lowest permanence rate for workers with less than 1 month of job duration. In fact, this group has the
highest transition rate to unemployment and to inactivity. However, this point will be more explored in
the next section.
The permanence rate is higher for formal than for informal employees, which have greater transition rates
to unemployment and to inactivity. Finally, table 10 shows that the permanence rate for full-time workers
is higher than for part-time. The transitions to employment is higher for full-time workers, while for part-
time is relatively more frequent the transitions to unemployment and, mainly, to inactivity.
Finally, both Tables 9 and 10 also reveal that the permanence rate on low paid job is lower for the one
year transition than for the one month and maintain the same pattern for all variables. The lower
permanence rates can be explained by the longer width of the one year transition, implying a larger
chance of leaving low paid as well as sample losses due to attrition problems.
5.3. Low-paid duration and mobility
Welfare impacts depend on duration of low-paid work and transition to better jobs. In this section, we
explore the transitions of low paid workers to three situations: higher wages occupation, unemployment
and inactivity. The results of multinomial logit can be observed in table 11. As we can see by coefficient
of variable duration, the chance of leaving the labor market – for unemployment or inactivity – reduces
with low paid job duration, while probability to moving up to better employment increases with time
spent in low paid. In other words, with duration of low-paid, worker's likelihood to leave labor market
into unemployment or inactivity decreases and the chance of getting a job with higher wages increases.
There are huge differences depending on individual characteristics. For men, transitions to higher wages
are more common when compared to women, who transit relatively more to unemployment and,
principally, to inactivity. Household heads move more often to unemployment or higher paid jobs than
other family position that tends to go into inactivity.
The variables of education, age and professional training indicate that productivity is associated with a
mobility of low paid employees to higher wages or unemployment. Education increases the likelihood to
move to higher wages. Age dynamics shows that experience, like education, improves the chance to go to
higher paid jobs and unemployment. Professional training also contributed to improving worker mobility
to higher wages and to unemployment.
Comparing metropolitan areas, we can notice that low pay is more permanent in Rio de Janeiro and
Salvador in comparison to Recife (reference category). In Sao Paulo and Porto Alegre it is easier to leave
a low paid situation to better earnings than in the other regions. Job sector coefficients show that while
low paid workers allocated in construction transit more to the tree situations analyzed, trade tends more to
retaining workers in low pay situation. Low paid informal job is a condition that leads to unemployment
or inactivity more often than formal jobs. Low-paid part time jobs are more transitory than fulltime jobs.
Finally, the coefficient of minimum wage variation shows that the positive variation registered in the
period contributed to low paid workers crossing the line and transiting to higher wages showing the
relevance of minimum wage policies to reduce the incidence of low-paid work.

Table 11: Determinants of low-pay transitions Low-paid Higher pay Unemployed Inactivity
Duration (months) 0.00241*** -0.0135*** -0.00120***
(9.03e-06) (6.31e-05) (1.87e-05)
Males 0.309*** -0.0132*** -0.311***
(0.00117) (0.00309) (0.00224)
White 0.144*** 0.0433*** 0.0297***
(0.00107) (0.00281) (0.00197)
Household head 0.0236*** 0.0249*** -0.459***
(0.00118) (0.00335) (0.00240)
Age 0.0860*** 0.0303*** -0.111***
(0.000235) (0.000693) (0.000328)
Age squared -0.000968*** -0.000649*** 0.00155***
(3.08e-06) (1.00e-05) (4.12e-06)
4-7 years of schooling 0.169*** 0.0834*** 0.0647***
(0.00174) (0.00494) (0.00289)
8-10 years of schooling 0.267*** 0.174*** -0.0817***
(0.00189) (0.00518) (0.00324)
11 or more 0.617*** 0.437*** -0.162***
(0.00194) (0.00533) (0.00350)
professional training 0.122*** 0.262*** -0.0594***
(0.00140) (0.00341) (0.00279)
Salvador -1.091*** -0.905*** -1.463***
(0.00228) (0.00530) (0.00385)
Belo Horizonte 0.384*** 0.0198*** -0.144***
(0.00189) (0.00460) (0.00296)
Rio de Janeiro -0.886*** -1.550*** -2.068***
(0.00187) (0.00528) (0.00364)
São Paulo 0.356*** -0.172*** -0.566***
(0.00173) (0.00419) (0.00278)
Porto Alegre 0.770*** 0.341*** 0.0137***
(0.00236) (0.00576) (0.00385)
Construction 0.287*** 0.800*** 0.581***
(0.00238) (0.00513) (0.00404)
Trade 0.00581*** -0.0362*** -0.0441***
(0.00166) (0.00428) (0.00307)
Financial intermediation 0.0716*** -0.101*** -0.162***
(0.00192) (0.00561) (0.00402)
Public administration 0.0431*** -0.367*** -0.439***
(0.00229) (0.00657) (0.00466)
Domestic services -0.334*** -0.179*** -0.141***
(0.00188) (0.00480) (0.00318)
Other services 0.101*** 0.0942*** -0.0584***
(0.00175) (0.00450) (0.00330)
Other activities -0.257*** -0.181*** -0.0978***
(0.00524) (0.0137) (0.00881)
Formal employee 0.0976*** -0.994*** -0.730***
(0.00110) (0.00322) (0.00223)
Partime 0.270*** 0.283*** 0.758***
(0.00172) (0.00355) (0.00223)
Minimum wage var. 1.702*** -0.265*** 0.284***
(0.0138) (0.0378) (0.0259)
2004 -0.0925*** -0.166*** -0.0715***
(0.00181) (0.00444) (0.00326)
2005 -0.291*** -0.503*** -0.258***
(0.00184) (0.00473) (0.00339)
2006 -0.172*** -0.205*** 0.0108***
(0.00187) (0.00455) (0.00327)
2007 -0.269*** -0.312*** -0.133***
(0.00186) (0.00461) (0.00335)
2008 0.00180 -0.189*** 0.170***
(0.00187) (0.00473) (0.00329)
2009 -0.178*** -0.234*** 0.00655*
(0.00187) (0.00478) (0.00341)
Constant -3.171*** -2.527*** 0.481***
(0.00515) (0.0134) (0.00767)
Observations
Standard errors in parentheses
*** p<0.01, ** p<0.05, * p<0.1
25,966,348
Concluding remarks
The economic growth accompanied by diminishing income inequalities has had positive effects in
metropolitan Brazilian labor market in the last decade. The improvement in metropolitan Brazilian labor
market performance from 2002 and 2009 can be observed in the decrease in unemployment rates and the
raise in labor earnings. Another important positive aspect has been verified: a decrease in the incidence of
low pay, and an increase in the average and median wages of this group of employees.
Moreover, this period was marked by employment formalization and minimum wage real value increase.
The combination of good macroeconomic performance and the strengthening of labor market institutions
could explain the behavior of low pay employment. In fact, low paid employees registered, in average,
greater increase in wages than the medium and high paid groups of workers.
The decrease in low pay incidence was perceived in all categories defined by personal attributes and job
characteristics. However, female, non-white, low educated and younger employees present higher
probabilities to have a low paid job. The incidence is higher in the Northeast metropolitan regions, among
informal employees and in domestic services, trade and construction sectors. Human capital variables –
education and age – have higher influence in reducing the probability of being low-paid for male than
female workers, suggesting a gender related pattern of low pay.
Instability of low paid jobs is shown by mobility analysis. This kind of employment presents a higher risk
of unemployment and inactivity. However, the probability of leaving low-paid jobs to unemployment or
inactivity reduces with low paid duration, while probability to move up in the labor market increases with
the number of months the employee spends in low paid jobs. Low paid mobility also has a gender related
pattern. For men, transitions to unemployment and higher wages are more frequent, whereas women tend
to go to inactivity.
The discussion of low paid jobs has close relation to education. Besides being more prone to low paid
employment, mobility analysis shows that less educated workers in low paid jobs transit more often to
inactivity, indicating discouragement with labor market circumstances.
Low-paid work in Brazil is clearly associated to the insertion of less educated workers in the labor
market. Recent experience shows that employment formalization, higher education of the labor force and
increases in the minimum wage lead to a reduction of low paid incidence. However, it persists at the same
level observed in developed countries with high incidence of low pay. This reveals a even more critical
phenomenon, since economical and social institutions in Brazil are more fragile. Thus, to face this matter,
a combination of policies aimed at increasing productivity, formality and education is crucial to intensify
labor market contribution in reducing poverty and inequality.
References
Barros, R. et al. (2007). A queda recente da desigualdade de renda no Brasil. In: Desigualdade de Renda
no Brasil: uma análise da queda recente (volume 1), Ricardo Paes de Barros, Miguel Nathan Foguel,
Gabriel Ulyssea (orgs), IPEA, Brasília.
Bosch, G. and Weinkopf, C. eds 2008, Low-Wage Work in Germany, Russell Sage Foundation.
Cappellari,L. "Earnings mobility among Italian low-paid workers," Journal of Population Economics,
Springer, vol. 20(2), pages 465-482, April 2007.
Caroli, E. and Gautié, J. eds. Low-Wage Work in France, Russell Sage Foundation.
Cuesta, M. 2008, “Low wage employment and mobility in Spain”, Labour 22 (Special Issue), pp. 115-146
European Community (2004). “Labour Market Transitions and Advancement: Temporary
Employment and Low Pay in Europe”, chap 4, in Employment in Europe, 2004.
Fitoussi, J-P. “Payroll tax reductions for low paid”. OECD Economic Studies No. 31, 2000/II.
Fontes, A. e Pero, V. (2009). Segmentação do mercado de trabalho e mobilidade de renda entre 2002 e
2007. Anais of XXXVI Encontro Nacional de Economia, Salvador, 2008.
LaRochelle-Côté, S. and Dionne, C. “International differences in low-paid work”. Perspectives, Statistics
Canada, June 2009.
Mello e Santos (2009). Aceleração educacional e a queda recente da informalidade. Boletim Mercado de
Trabalho, v. 39, may 2009, IPEA.
OECD 2009, “Is work the best antidote to poverty?” in OECD Employment Outlook, OECD.
Pavlopoulos,D. and Fouarge, D. “Escaping the low-pay trap: do labour market entrants stand a chance?”.
MPRA Paper No. 226, Munique, April 2006. http://mpra.ub.uni-muenchen.de/226
Salverda et al. eds 2008, Low-Wage Work in the Netherlands, Russell Sage Foundation.
Westergaard-Nielsen, N. ed. 2008, Low-Wage Work in Denmark, Russell Sage Foundation.


![[Apresentação] Paid, Owned e Earned Media no Facebook: o caso Sidcley e Dolores](https://img.document.onl/doc/110x75/5593fb541a28ab594f8b4622/apresentacao-paid-owned-e-earned-media-no-facebook-o-caso-sidcley-e-dolores.jpg)