Embed Size (px)
Citation preview

MAIN INDICATORS
3Q09 EARNINGS RELEASE
CONFERENCE CALL 11/11/2009 (WEDNESDAY)
English: English:
Portuguese: Portuguese:
Closing quote on 11/10/2009 - Price: R$18.95 / unit - Market Capitalization: R$ 1,182.6 million
3Q09 3Q08 Chg%
Primary and Secondary 226,600 207,700 9.1%
Pitágoras 40,892 38,382 6.5%
INED 5,065 5,006 1.2%
Post-Secondary Education 45,957 43,388 5.9%
Final Number of Students
Kroton posts net revenue growth of 31.8% and 34.7% EBITDA growth
year to date, compared to the same 2008 period.
Values in R$ (thousand) 3Q09 3Q08 Chg% 9M09 9M08 Chg%
Gross Sales Revenue 93,026 78,657 18.3% 311,395 232,231 34.1%
Net Sales Revenue 81,320 70,800 14.9% 279,350 212,002 31.8%
Net Income 9,005 7,618 18.2% 40,226 33,502 20.1%
Net Income Margin 11.1% 10.8% 0.3 p.p 14.4% 15.8% (1.4) p.p.
Adjusted EBITDA 12,503 11,441 9.3% 61,146 45,399 34.7%
Adjusted EBITDA Margin 15.4% 16.2% (0.8) p.p. 21.9% 21.4% 0.5 p.p
Adjusted Net Income 12,036 10,738 12.1% 45,003 42,572 5.7%
Adjusted Net Income Margin 14.8% 15.2% (0.4) p.p. 16.1% 20.1% (4.0) p.p.

MAIN
Assessment
Post-
Secondary
Education
Campi Belo Horizonte (MG) - 3 units Londrina (PR)Nova Lima (MG) São Luís (MA) Jundiaí (SP)Betim (MG) Vitória (ES)
Divinópolis (MG) Guarapari (ES)Ipatinga (MG) Linhares (ES)
Uberlândia (MG) Rio de Janeiro (RJ)Poços de Caldas (MG) Teixeira de Freitas (BA)
BH – Centro(MG) Venda Nova(MG) BH – Pampulha(MG) Jundiaí(SP) Guarapari(ES) Linhares (ES)
Uberlândia (MG) Rio Claro (SP) Contagem (MG)
Divinópolis(MG) Londrina (PR)
Primary
and
Secondary
Education
Learning System
- Private
654 schools in Brazil and 6 in
Japan
Colégio da Lagoa (MG)
School
Operations
Bachelor Degree
Programs
Associate Degree
Programs
Colégio Pitágoras Cidade Jardim (MG)
Colégio Pitágoras São Luis (MA)
CVRD – Carajás (PA)
Embraer – São José dos Campos (SP)
Mineração Fazenda Brasileiro – Teofilândia (BA)
Mineração Taboca – Pitinga (AM)
Mineração Onça Puma - Ourilândia do Norte(PA)
Learning System
- PublicEducational solutions for improving the
quality of public schools.
NATIONAL PRESENCE
1
39
11
2
72
92
1
1
3
8
7
12
7
13
16
120
21
22
18
2
6
344
10
69
7
2
6 2
117 Pitágoras campuses
11 INED campuses
24
13654 Primary and Secondary
Associate Schools in Brazil (+6 in Japan)
1
1
206
Primary and Secondary Education
22,7%
Post
Secondary Education
77,3%
3Q08 NET REVENUE MIX
Primary and Secondary Education
17,7%
Post
Secondary Education
82,3%
3Q09 NET REVENUE MIX

OPERATIONAL AND FINANCIAL HIGHLIGHTS
FINANCIAL FINANCIAL
OPERATING REVENUE
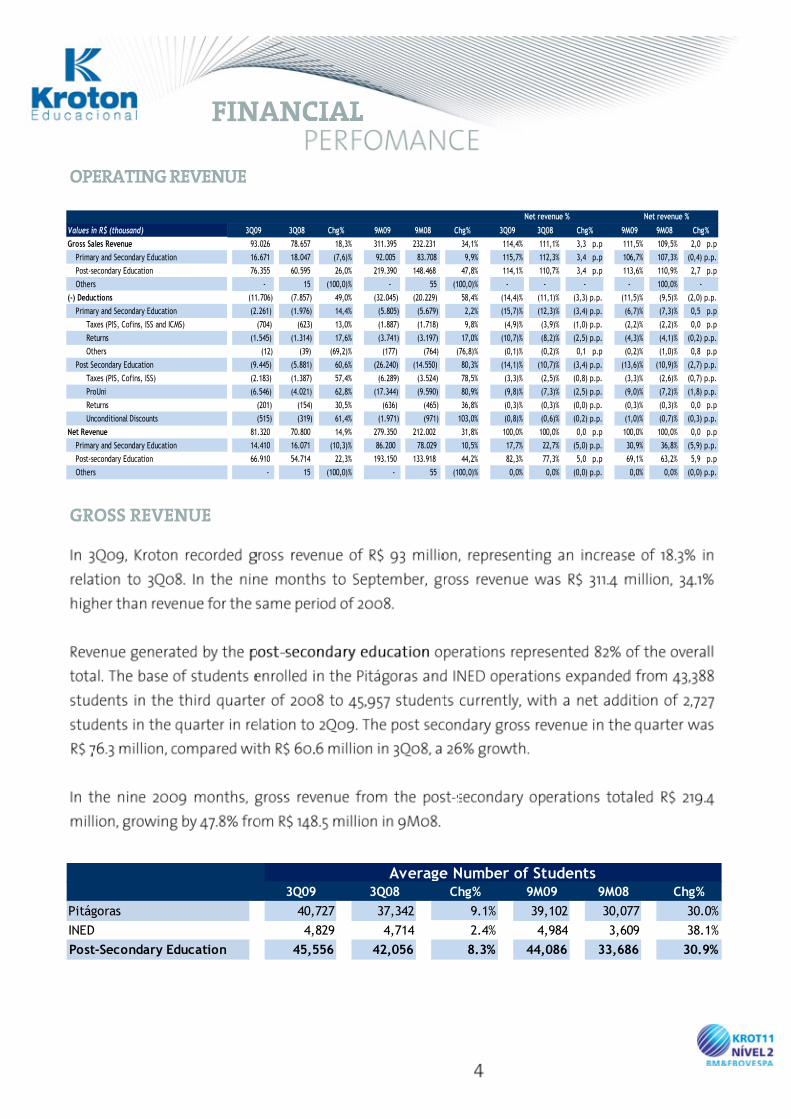
GROSS REVENUE
FINANCIAL FINANCIAL
3Q09 3Q08 Chg% 9M09 9M08 Chg%
Pitágoras # 40,727 37,342 9.1% 39,102 30,077 30.0%
INED 4,829 4,714 2.4% 4,984 3,609 38.1%
Post-Secondary Education 45,556 42,056 8.3% 44,086 33,686 30.9%
Average Number of Students
Values in R$ (thousand) 3Q09 3Q08 Chg% 9M09 9M08 Chg% 3Q09 3Q08 Chg% 9M09 9M08 Chg%
Gross Sales Revenue 93.026 78.657 18,3% 311.395 232.231 34,1% 114,4% 111,1% 3,3 p.p 111,5% 109,5% 2,0 p.p
Primary and Secondary Education 16.671 18.047 (7,6)% 92.005 83.708 9,9% 115,7% 112,3% 3,4 p.p 106,7% 107,3% (0,4) p.p.
Post-secondary Education 76.355 60.595 26,0% 219.390 148.468 47,8% 114,1% 110,7% 3,4 p.p 113,6% 110,9% 2,7 p.p
Others - 15 (100,0)% - 55 (100,0)% - - - - 100,0% -
(-) Deductions (11.706) (7.857) 49,0% (32.045) (20.229) 58,4% (14,4)% (11,1)% (3,3) p.p. (11,5)% (9,5)% (2,0) p.p.
Primary and Secondary Education (2.261) (1.976) 14,4% (5.805) (5.679) 2,2% (15,7)% (12,3)% (3,4) p.p. (6,7)% (7,3)% 0,5 p.p
Taxes (PIS, Cofins, ISS and ICMS) (704) (623) 13,0% (1.887) (1.718) 9,8% (4,9)% (3,9)% (1,0) p.p. (2,2)% (2,2)% 0,0 p.p
Returns (1.545) (1.314) 17,6% (3.741) (3.197) 17,0% (10,7)% (8,2)% (2,5) p.p. (4,3)% (4,1)% (0,2) p.p.
Others (12) (39) (69,2)% (177) (764) (76,8)% (0,1)% (0,2)% 0,1 p.p (0,2)% (1,0)% 0,8 p.p
Post Secondary Education (9.445) (5.881) 60,6% (26.240) (14.550) 80,3% (14,1)% (10,7)% (3,4) p.p. (13,6)% (10,9)% (2,7) p.p.
Taxes (PIS, Cofins, ISS) (2.183) (1.387) 57,4% (6.289) (3.524) 78,5% (3,3)% (2,5)% (0,8) p.p. (3,3)% (2,6)% (0,7) p.p.
ProUni (6.546) (4.021) 62,8% (17.344) (9.590) 80,9% (9,8)% (7,3)% (2,5) p.p. (9,0)% (7,2)% (1,8) p.p.
Returns (201) (154) 30,5% (636) (465) 36,8% (0,3)% (0,3)% (0,0) p.p. (0,3)% (0,3)% 0,0 p.p
Unconditional Discounts (515) (319) 61,4% (1.971) (971) 103,0% (0,8)% (0,6)% (0,2) p.p. (1,0)% (0,7)% (0,3) p.p.
Net Revenue 81.320 70.800 14,9% 279.350 212.002 31,8% 100,0% 100,0% 0,0 p.p 100,0% 100,0% 0,0 p.p
Primary and Secondary Education 14.410 16.071 (10,3)% 86.200 78.029 10,5% 17,7% 22,7% (5,0) p.p. 30,9% 36,8% (5,9) p.p.
Post-secondary Education 66.910 54.714 22,3% 193.150 133.918 44,2% 82,3% 77,3% 5,0 p.p 69,1% 63,2% 5,9 p.p
Others - 15 (100,0)% - 55 (100,0)% 0,0% 0,0% (0,0) p.p. 0,0% 0,0% (0,0) p.p.
Net revenue % Net revenue %

GROSS REVENUE DEDUCTIONS
FINANCIAL FINANCIAL
18.0 16.783.7 92.060.6 76.3
148.5
219.4
0,0
50,0
100,0
150,0
200,0
250,0
300,0
350,0
3Q08 3Q09 9M08 9M09
GROSS REVENUE GROWTH
(R$ million)
Primary and Secondary Education Post Secondary Education
232.2
311.4
93.078.6
311.4

TOTAL NET REVENUE
FINANCIAL FINANCIAL

COST OF PRODUCTS AND SERVICES
FINANCIAL FINANCIAL
16.1 14.4
78.0 86.254.7 66.9
133.9
193.2
0.1
0,0
50,0
100,0
150,0
200,0
250,0
300,0
3Q08 3Q09 9M08 9M09
Primary and Secondary Education Post Secondary Education Others
70.881.3
279.4
212.0
NET REVENUE GROWTH(R$ million)
279.4279.4
Values in R$ (thousand) 3Q09 3Q08 Chg% 9M09 9M08 Chg%
Cost of Products and Services (55.656) (48.547) 14,6% (168.933) (128.035) 31,9%
Cost of Products Sold (2.023) (2.088) -3,1% (12.674) (10.489) 20,8%
Cost of Services (53.633) (46.459) 15,4% (156.259) (117.546) 32,9%
Cost of Products and Services / % Net Revenue -68,4% -68,6% 0,2 p.p -60,5% -60,4% (0,1) p.p.
Cost of Products Sold / % Net Revenue -2,5% -2,9% 0,4 p.p -4,5% -4,9% 0,4 p.p
Cost of Services / % Net Revenue -66,0% -65,6% (0,4) p.p. -55,9% -55,4% (0,5) p.p.

GROSS PROFIT AND GROSS MARGIN
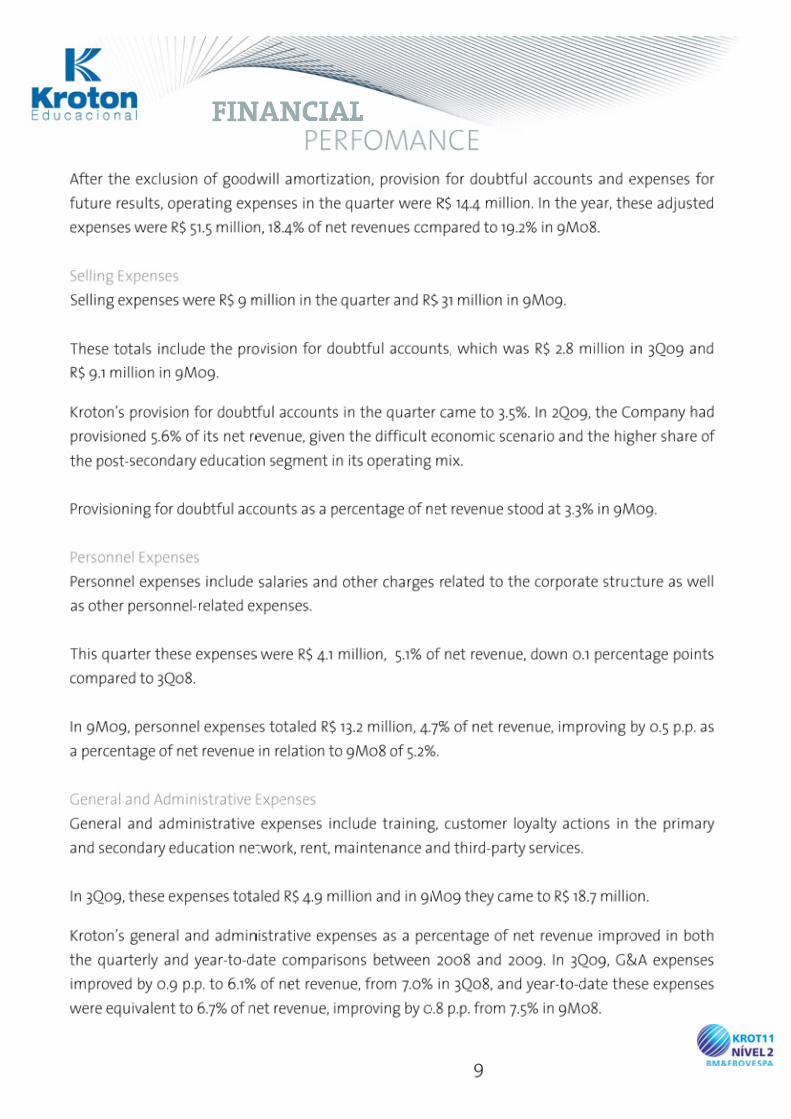
OPERATING EXPENSES
FINANCIAL FINANCIAL
Values in R$ (thousand) 3Q09 3Q08 Chg% 9M09 9M08 Chg% 3Q09 3Q08 Chg% 9M09 9M08 Chg%
Gross Revenue 93,026 78,657 18.3% 311,395 232,231 34.1% 114.4% 111.1% 3.3 p.p 111.5% 109.5% 2.0 p.p
(-) Deductions (11,706) (7,857) 49.0% (32,045) (20,229) 58.4% -14.4% -11.1% (3.3) p.p. -11.5% -9.5% (2.0) p.p.
Net Revenue 81,320 70,800 14.9% 279,350 212,002 31.8% 100.0% 100.0% 0.0 p.p 100.0% 100.0% 0.0 p.p
(-) Cost of Products and Services (55,656) (48,547) 14.6% (168,933) (128,035) 31.9% -68.4% -68.6% 0.2 p.p -60.5% -60.4% (0.1) p.p.
Gross Profit 25,664 22,253 15.3% 110,417 83,967 31.5% 31.6% 31.4% 0.2 p.p 39.5% 39.6% (0.1) p.p.
Net revenue % Net revenue %
Values in R$ (thousand) 3Q09 3Q08 Chg% 9M09 9M08 Chg% 3Q09 3Q08 Chg% 9M09 9M08 Chg%
Gross Profit 25.664 22.253 15,3% 110.417 83.967 31,5% 31,6% 31,4% 0,2 p.p 39,5% 39,6% (0,1) p.p.
Gross Margin 31,6% 31,4% 0,2 p.p 39,5% 39,6% (0,1) p.p. - - - - - -
Operating Expenses (Income) (20.542) (16.200) 26,8% (64.198) (50.844) 26,3% (25,3)% (22,9)% (2,4) p.p. (23,0)% (24,0)% 1,0 p.p
Selling Expenses (8.992) (5.718) 57,3% (30.933) (20.191) 53,2% (11,1)% (8,1)% (3,0) p.p. (11,1)% (9,5)% (1,6) p.p.
Personnel Expenses (4.120) (3.692) 11,6% (13.180) (11.018) 19,6% (5,1)% (5,2)% 0,1 p.p (4,7)% (5,2)% 0,5 p.p
General and Administrative (4.931) (4.944) (0,3)% (18.714) (15.834) 18,2% (6,1)% (7,0)% 0,9 p.p (6,7)% (7,5)% 0,8 p.p.
Expenses for future results (3.143) - - (3.143) - - 5,6% 0,0% 5,6 p.p 1,9% 0,0% 1,9 p.p.
Other Operating Income (Expenses) 799 717 11,4% 2.238 2.177 2,8% 1,0% 1,0% (0,0) p.p. 0,8% 1,0% (0,2) p.p.
Goodwill Amortization (155) (2.563) (94,0)% (466) (5.978) (92,2)% (0,2)% (3,6)% 3,4 p.p (0,2)% (2,8)% 2,6 p.p.
Operating Result Before Financial Result 5.122 6.053 (15,4)% 46.219 33.123 39,5% 6,3% 8,5% (2,2) p.p. 16,5% 15,6% 0,9 p.p.
Net revenue % Net revenue %
FINANCIAL FINANCIAL

EBITDA
FINANCIAL FINANCIAL
11.814.4
40.6
51.5
16.7%
17.7%
19.2%
18.4%
15,0%
15,5%
16,0%
16,5%
17,0%
17,5%
18,0%
18,5%
19,0%
19,5%
0,0
10,0
20,0
30,0
40,0
50,0
60,0
3Q08 3Q09 9M08 9M09
SG&A / %Net revenue*Excluding expenses for future results, Goodwill Amortizations and PDA.
SALES AND ADMINISTRATIVE EXPENSES (SG&A) & SG&A/NET REVENUE (R$ million)
Values in R$ (thousand) 3Q09 3Q08 Chg% 9M09 9M08 Chg% 3Q09 3Q08 Chg% 9M09 9M08 Chg%
Net Income 9,005 7,618 18.2% 40,226 33,502 20.1% 11.1% 10.8% 0.3 p.p 14.4% 15.8% (1.4) p.p.
(-) Income Tax and Social Contribution 762 1,427 (46.6)% 8,516 11,821 (28.0)% 0.9% 2.0% (1.1) p.p. 3.0% 5.6% (2.6) p.p.
(-) Financial Results (4,635) (2,981) 55.5% (2,438) (12,184) (80.0)% (5.7)% (4.2)% (1.5) p.p. (0.9)% (5.7)% 4.8 p.p
(+) Goodwill Amortization 155 2,563 (94.0)% 466 5,978 (92.2)% 0.2% 3.6% (3.4) p.p. 0.2% 2.8% (2.6) p.p.
(+) Depreciation and Amortization 4,073 2,815 44.7% 11,233 6,282 78.8% 5.0% 4.0% 1.0 p.p 4.0% 3.0% 1.0 p.p
(+) Expenses for future results 3,143 - - 3,143 - - 3.9% 0.0% 3.9 p.p 1.1% 0.0% 1.1 p.p
Adjusted EBITDA 12,503 11,441 9.3% 61,146 45,399 34.7% 15.4% 16.2% (0.8) p.p. 21.9% 21.4% 0.5 p.p
Adjusted EBITDA Margin 15.4% 16.2% (4.9)% 21.9% 21.4% 2.2% - - - - - -
Net revenue % Net revenue %

FINANCIAL FINANCIAL
11.4 12.5
45.4
16.2%15.4%
21.4% 21.9%
0,0%
5,0%
10,0%
15,0%
20,0%
25,0%
0,0
5,0
10,0
15,0
20,0
25,0
30,0
35,0
40,0
45,0
50,0
3Q08 3Q09 9M08 9M09
ADJUSTED EBITDA & ADJUSTED EBITDA MARGIN(R$ million)
Adjusted EBITDA Margin
61.161.1

NET FINANCIAL RESULT
INCOME TAX AND SOCIAL CONTRIBUITION ON NET PROFIT
FINANCIAL FINANCIAL
Values in R$ (thousand) 3Q09 3Q08 Chg% 9M09 9M08 Chg% 3Q09 3Q08 Chg% 9M09 9M08 Chg%
Financial Result 4,635 2,981 55.5% 2,438 12,184 (80.0)% 5.7% 4.2% 1.5 p.p 0.9% 5.7% (4.9) p.p.
Financial Revenue (i) 8,864 6,526 35.8% 15,295 21,956 (30.3)% 10.9% 9.2% 1.7 p.p 5.5% 10.4% (4.9) p.p.
Financial Expenses (4,229) (3,545) 19.3% (12,857) (9,772) 31.6% -5.2% -5.0% (0.2) p.p. -4.6% -4.6% 0.0 p.p
Bank Expenses (ii) (279) (469) (40.5)% (1,634) (2,106) (22.4)% -0.3% -0.7% 0.4 p.p -0.6% -1.0% 0.4 p.p
Interest on Loans (iii) (383) (1,005) (61.9)% (1,221) (2,088) (41.5)% -0.5% -1.4% 0.9 p.p -0.4% -1.0% 0.6 p.p
Conditional Discounts (iv) (3,106) (2,071) 50.0% (8,213) (5,578) 47.2% -3.8% -2.9% (0.9) p.p. -2.9% -2.6% (0.3) p.p.
Monetary Passive Variation (v) (461) - - (1,789) - - -0.6% 0.0% (0.6) p.p. -0.6% 0.0% (0.6) p.p.
Net revenue % Net revenue %

NET INCOME AND ADJUSTED NET INCOME
FINANCIAL FINANCIAL
Values in R$ (thousand) 3Q09 3Q08 Chg% 9M09 9M08 Chg% 3Q09 3Q08 Chg% 9M09 9M08 Chg%
Net Income 9,005 7,618 18.2% 40,226 33,502 20.1% 11.1% 10.8% 0.3 p.p 14.4% 15.8% (1.4) p.p.
Deferred Income Tax and Social Contribution (267) 557 (147.9)% 1,168 3,092 (62.2)% (0.3)% 0.8% (1.1) p.p. 0.4% 1.5% (1.0) p.p.
Goodwill Amortization 155 2,563 (94.0)% 466 5,978 (92.2)% 0.2% 3.6% (3.4) p.p. 0.2% 2.8% (2.7) p.p.
Expenses for future results 3,143 - - 3,143 - - 3.9% 0.0% 3.9 p.p 1.1% 0.0% 1.1 p.p
Adjusted Net Income 12,036 10,738 12.1% 45,003 42,572 5.7% 14.8% 15.2% (0.4) p.p. 16.1% 20.1% (4.0) p.p.
Adjusted Net Income Margin 14.8% 15.2% (2.4)% 16.1% 20.1% (19.8)% - - -
Net revenue %Net revenue %
10.7 12.0
42.6 45.0
15.2% 14.8%
20.1%16.1%
0,0%
5,0%
10,0%
15,0%
20,0%
25,0%
-
5,0
10,0
15,0
20,0
25,0
30,0
35,0
40,0
45,0
50,0
3Q08 3Q09 9M08 9M09
Adjusted Net Income Margin
ADJUSTED NET INCOME & ADJUSTED NET INCOME MARGIN(R$ million)
45.0

CAPITAL AND CASH
FINANCIAL FINANCIAL
Values in R$ (thousand) 3Q09 2Q09 Chg%
Cash and Banks 444,067 77,889 470.1%
Loans and financing 15,078 15,830 (4.8)%
Short-term Debt 5,135 5,212 (1.5)%
Long-term Debt 9,943 10,618 (6.4)%
Shareholders Equity 842,196 446,918 88.4%
Total Capitalization 857,274 462,748 85.3%
Net Cash 428,989 62,059 591.3%

CASH FLOW AND INVESTMENTS
FINANCIAL FINANCIAL
77.912.5 (0.8) 4.6 (4.2) (3.1) (15.2)
(6.8) (6.2)
444.1
(R$ million)
(57.0)(57.0)
385.4
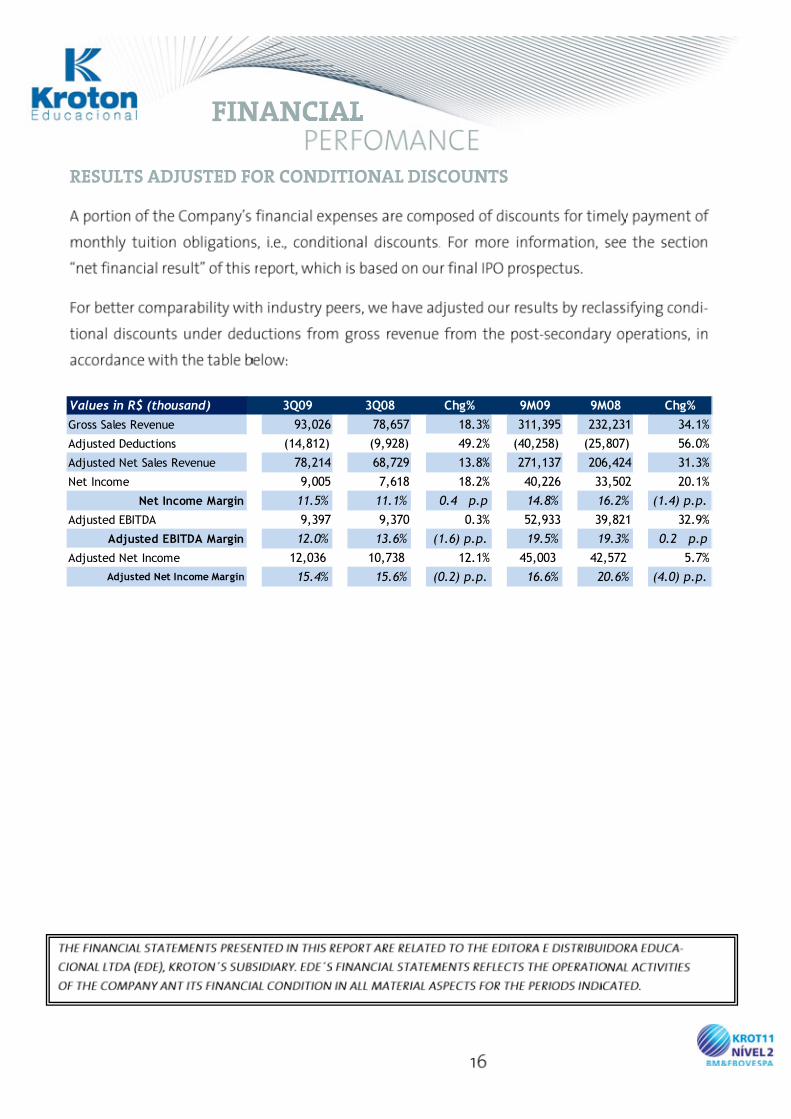
RESULTS ADJUSTED FOR CONDITIONAL DISCOUNTS
FINANCIAL FINANCIAL
Values in R$ (thousand) 3Q09 3Q08 Chg% 9M09 9M08 Chg%
Gross Sales Revenue 93,026 78,657 18.3% 311,395 232,231 34.1%
Adjusted Deductions (14,812) (9,928) 49.2% (40,258) (25,807) 56.0%
Adjusted Net Sales Revenue 78,214 68,729 13.8% 271,137 206,424 31.3%
Net Income 9,005 7,618 18.2% 40,226 33,502 20.1%
Net Income Margin 11.5% 11.1% 0.4 p.p 14.8% 16.2% (1.4) p.p.
Adjusted EBITDA 9,397 9,370 0.3% 52,933 39,821 32.9%
Adjusted EBITDA Margin 12.0% 13.6% (1.6) p.p. 19.5% 19.3% 0.2 p.p
Adjusted Net Income 12,036 10,738 12.1% 45,003 42,572 5.7%
Adjusted Net Income Margin 15.4% 15.6% (0.2) p.p. 16.6% 20.6% (4.0) p.p.

ABOUT KROTON EDUCACIONAL
KROTON

3Q09
Change
09/30/2009 Chg% 03/31/2009 Chg%Sept-09 /
June-09
Current Assets 583,100 63.6% 215,736 39.7% 170.3%
Cash and Banks 444,067 48.4% 77,889 14.3% 470.1%
Trade Accounts Receivable 99,414 10.8% 97,405 17.9% 2.1%
Inventories 9,031 1.0% 9,935 1.8% -9.1%
Recoverable Taxes 8,001 0.9% 8,017 1.5% -0.2%
Prepaid Expenses 738 0.1% 1,012 0.2% -27.1%
Other Accounts Receivable 21,849 2.4% 21,478 3.9% 1.7%
Noncurrent Assets 8,108 0.9% 9,702 1.8% -16.4%
Deferred Taxes 7,664 0.8% 7,749 1.4% -1.1%
Receivables from Related Parties 0 0.0% 1,550 0.3% -100.0%
Other 444 0.0% 403 0.1% 10.2%
Permanent Assets 326,333 35.6% 318,316 58.5% 2.5%
Fixed Assets 151,750 16.5% 148,621 27.3% 2.1%
Intangible 171,999 18.7% 167,111 30.7% 2.9%
Deferred 2,584 0.3% 2,584 0.5% 0.0%
Total Assets 917,541 100.0% 543,754 100.0% 68.7%
Liabilities and Shareholders' Equity
Current 50,631 5.5% 70,944 13.0% -28.6%
Trade Account Payable 12,338 1.3% 19,297 3.5% -36.1%
Loans and Financing 5,135 0.6% 5,212 1.0% -1.5%
Payments and Social Charges 20,250 2.2% 18,417 3.4% 10.0%
Income and Social Contribution Taxes 7,422 0.8% 6,398 1.2% 16.0%
Tax and Contribuitons Collectable 1,613 0.2% 2,221 0.4% -27.4%
Advances from Customers 1,646 0.2% 5,808 1.1% -71.7%
Others 2,227 0.2% 13,591 2.5% -83.6%
Noncurrent Liabilities 24,842 2.7% 26,008 4.8% -4.5%
Trade Account Payable 3,870 0.4% 4,269 0.8% -9.3%
Loans and Financing 9,943 1.1% 10,618 2.0% -6.4%
Debts with controlers 0 0.0% 160 0.0% -100.0%
Other Liabilities 11,029 1.2% 10,961 2.0% 0.6%
Minority Interest (128) 0.0% (116) 0.0% 10.3%
Shareholder´s Equity 842,196 91.8% 446,918 82.2% 88.4%
Capital 790,340 86.1% 404,066 74.3% 95.6%
Capital Reserves 3,760 0.4% 3,760 0.7% 0.0%
Treasury Stocks (21,436) -2.3% (21,436) -3.9% 0.0%
Profit (loss) Earnings 69,532 7.6% 60,528 11.1% 14.9%
Total Liabilities and Shareholders' Equity 917,541 100.0% 543,754 100.0% 68.7%
Period ended on
(In thousand reais, except otherwise indicated)

3Q09
Change
3Q09 Chg% 3Q08 Chg% 2008 / 2009
Gross Revenue 93,026 114.4% 78,657 111.1% 18.3%
Primary and Secondary Education 16,671 20.5% 18,047 25.5% -7.6%
Post-secondary Education 76,355 93.9% 60,595 85.6% 26.0%
Other 0 0.0% 15 0.0% -100.0%
Deductions (11,706) -14.4% (7,857) -11.1% 49.0%
Primary and Secondary Education (2,261) -2.8% (1,976) -2.8% 14.4%
Post-secondary Education (9,445) -11.6% (5,881) -8.3% 60.6%
Net Revenue 81,320 100.0% 70,800 100.0% 14.9%
Primary and Secondary Education 14,410 17.7% 16,071 22.7% -10.3%
Post-secondary Education 66,910 82.3% 54,714 77.3% 22.3%
Other 0 0.0% 15 0.0% -100.0%
Costs of Products/Services (55,656) -68.4% (48,547) -68.6% 14.6%
Cost of Products Sold (2,023) -2.5% (2,088) -2.9% -3.1%
Cost of Services (53,633) -66.0% (46,459) -65.6% 15.4%
Gross Profit 25,664 31.6% 22,253 31.4% 15.3%
Operating Income (Expenses) (20,542) -25.3% (16,200) -22.9% 26.8%
Selling Expenses (6,169) -7.6% (3,860) -5.5% 59.8%
Allowance for Doubtful Accounts (2,823) -3.5% (1,858) -2.6% 51.9%
Personnel Expenses (3,369) -4.1% (2,950) -4.2% 14.2%
General and Administrative Expenses (4,931) -6.1% (4,944) -7.0% -0.3%
Expenses for future results (3,143) -3.9% 0 0.0% -
Management Remuneration (751) -0.9% (742) -1.0% 1.2%
Other Operating Income (Expenses) 799 1.0% 717 1.0% 11.4%
Goodwill Amortization (155) -0.2% (2,563) -3.6% -94.0%
Operating Result before Financial
Result5,122 6.3% 6,053 8.5% -15.4%
Financial Results 4,635 5.7% 2,981 4.2% 55.5%
Financial Expenses (4,229) -5.2% (3,545) -5.0% 19.3%
Financial Revenues 8,864 10.9% 6,526 9.2% 35.8%
Income (Loss) before Taxes and
Social Contribution 9,757 12.0% 9,034 12.8% 8.0%
Income and Social Contribution Taxes(762)
-0.9%(1,427)
-2.0% -46.6%
Current (1,029) -1.3% (870) -1.2% 18.3%
Deferred 267 0.3% (557) -0.8% -147.9%
Minority Interests 10 0.0% 11 0.0% -9.1%
Net Income (Loss) for the Period 9,005 11.1% 7,618 10.8% 18.2%
Period ended on
(In thousand reais, except otherwise indicated)

3Q09
Change
9M09 Chg% 9M08 Chg% 2008 / 2009
Gross Revenue 311.395 111,5% 232.231 109,5% 34,1%
Primary and Secondary Education 92.005 32,9% 83.708 39,5% 9,9%
Post-secondary Education 219.390 78,5% 148.468 70,0% 47,8%
Other 0 0,0% 55 0,0% -100,0%
Deductions (32.045) -11,5% (20.229) -9,5% 58,4%
Primary and Secondary Education (5.805) -2,1% (5.679) -2,7% 2,2%
Post-secondary Education (26.240) -9,4% (14.550) -6,9% 80,3%
Net Revenue 279.350 100,0% 212.002 100,0% 31,8%
Primary and Secondary Education 86.200 30,9% 78.029 36,8% 10,5%
Post-secondary Education 193.150 69,1% 133.918 63,2% 44,2%
Other 0 0,0% 55 0,0% -100,0%
Costs of Products/Services (168.933) -60,5% (128.035) -60,4% 31,9%
Cost of Products Sold (12.674) -4,5% (10.489) -4,9% 20,8%
Cost of Services (156.259) -55,9% (117.546) -55,4% 32,9%
Gross Profit 110.417 39,5% 83.967 39,6% 31,5%
Operating Income (Expenses) (64.198) -23,0% (50.844) -24,0% 26,3%
Selling Expenses (21.817) -7,8% (15.956) -7,5% 36,7%
Allowance for Doubtful Accounts (9.116) -3,3% (4.235) -2,0% 115,3%
Personnel Expenses (10.570) -3,8% (8.971) -4,2% 17,8%
General and Administrative Expenses (18.714) -6,7% (15.834) -7,5% 18,2%
Expenses for future results (3.143) -1,1% 0 0,0% -
Management Remuneration (2.610) -0,9% (2.047) -1,0% 27,5%
Other Operating Income (Expenses) 2.238 0,8% 2.177 1,0% 2,8%
Goodwill Amortization (466) -0,2% (5.978) -2,8% -92,2%
Operating Result before Financial
Result46.219 16,5% 33.123 15,6% 39,5%
Financial Results 2.438 0,9% 12.184 5,7% -80,0%
Financial Expenses (12.857) -4,6% (9.772) -4,6% 31,6%
Financial Revenues 15.295 5,5% 21.956 10,4% -30,3%
Income (Loss) before Taxes and
Social Contribution 48.657 17,4% 45.307 21,4% 7,4%
Income and Social Contribution Taxes(8.516)
-3,0% (11.821) -5,6% -28,0%
Current (7.348) -2,6% (8.729) -4,1% -15,8%
Deferred (1.168) -0,4% (3.092) -1,5% -62,2%
Minority Interests 85 0,0% 16 0,0% 431,3%
Net Income (Loss) for the Period 40.226 14,4% 33.502 15,8% 20,1%
Period ended on
(In thousand reais, except otherwise indicated)

3Q09
September 30th June 30th
2009 2009
Cash Flow from Operating Activities
Income before Taxes and Social Contribuition 9.757 7.605
Adjustments to Reconcile Results of Cash and Banks
Depreciation and Amortization 4.228 3.735
Income on Sales of permanent asset 738 278
Changes in assets and liabilities
Decrease in Accounts Receivable (2.009) 9.583
(Increase) Decrease in Inventories 1.178 (2.254)
(Increase) in other Accounts Receivable 1.625 (4.365)
(Decrease) in Trade Accounts Payable (7.359) (2.507)
Decrease in other Accounts Payable (10.078) (12.017)
(Decrease) in Advances from Customers (4.162) (12.088)
Taxes and Social Contribuition paid (124) (532)
Net Cash Provided by (Used in) Operating Activities (6.206) (12.562)
Cash Flow from Investing Activities
Acquisition of fixed assets (6.751) (11.839)
Additions to intangible (6.232) (3.965)
Goodwill Adjustment - 2.020
Result on sales of permanent assets - -
Net Cash used in Investing Activities (12.983) (13.784)
Cash Flow from Financing Activities
Capital Increase 386.274 -
Treasury Stocks (23)
Payment of Loans and Financing (1.142) (1.142)
Payment Interests over Loans 390 390
Paid Loans - mutual (155) -
Net Cash Provided by (Used in) Financing Activities 385.367 (775)
(Decrease) in Cash 366.178 (27.121)
Cash - at Beginning of Period* 77.889 105.010
Cash - at End of Period* 444.067 77.889
(Decrease) in Cash 366.178 (27.121)
Consolidado
* In this cash flow, it was considered the cash and equivalents avaiability (cash and equivalent to cash and securities,
as described in —Explanatory Note 3).