Embed Size (px)
Citation preview
Turrialba Vol. 30, No. 4, 1980, pp, 391·398
A model to define operational irrigation frequency for maximum yield of crops* 1/ _AGUSTIN A. MILLAR**, ELIANE N. CHOUDHURY***
Resumo
Descreve-se um modelo para definir a frequencia operacional de irrigação paramáxima produção das culturas. As informações básicas usadas no modelo são respostasda planta às condições de umidade no solo, caracteristicas de retenção e movimento daágua no solo, evapotranspiração e demanda atmosférica.
Apresentam-se os resultados da aplicação do modelo nas culturas de tomate efeijão num solo franco arenoso. Discute-se o uso da informação mundial da relaçãoentre rendimento das culturas e potencial matricial de água no solo.
Introduction
O ne of the most challenging problems facingirrigated agriculture is that of improving theon-farm water management.
For an efficient water management it is necessaryto know adequately some basic data that characterizethe irrigation method under operating conditions.Besides information on soil water retention and con-ducting properties, evapotranspiration and crop yieldresponse to irrigation, and evaporative demand mustbe properly known. The flnal goal always deals withdefming a criteria to guide irrigation scheduling whichwill favor optimum crop yields and efficient wateruse.
Several methods based on soil, plant and evapora-tive measurements have been described to establishirrigation frequency of crops (6, 10). Except for theplant water indicators, most methods do not takeinto account the crop yield response to irrigation.
Received for publication May 22nd. 1980.
II Joint contribu tion from the Inter-American Institute ofAgricultural Sciences (IlCA), Irrigation DevelopmentAgency for the San Francisco Val1ey (CODEVASF),and Agricultural Research Center for the Serni-AridTropics (CPATSA) of the Brazilian Agricultural Re-search Corporation (EMBRAPA). Contracts IlCAjCODEVASF and CODEV ASFIEMBRAPA.
** Ph.D., Irrigation Specialist, IlCA, P.O. Box 04-0381,Brasília D. F. Brazil.
*** Researcher, CPATSA/EMBRAPA, P.O. Box 23, Petroli-na, PE. Brazil.
The most common way to schedule irrigation isusing the water balance of the soil profíle. Lewin (12)used a water balance for the top 90 em of the soilprofile with inputs from rainfall and irrigation,drainage of any water in excess of field capacity, anda linear relationship between evapotranspiration andstorage. He accounted for potential evapotranspira-tion and a crop factor by letting the coefficients havedifferent values for each month of the growing season.He further assumed that the decrease in yield ofwinter wheat should be related to the number of dayswhen soil water potential was less than - 1.2 bars.Similar stress days concepts have been used in manyother studies. Lewin (12) found a correlation of -0,864 between calculated number of stress daysand percentage of potential yield.
Fischbach and Sornerahlader (5) developed amethod for scheduling irrigation with the primaryobjective of gradually depleting the available soil waterduring the growing season. They estimated evapo-transpiration on the basis of weather records and cropcoefficients, using Penman equation for potentialevapotranspiration (19).
Water is the production complementary facto rthat most frequently limits crop yield. In general,most crops respond to variable conditons of soilwater. In literature, there exist a sizable volume ofexperimental results dealing with irrigation effectson crop yield (6, 17, 20). This information is usuallygiven in terms of soil suction levels for obtainingmaximum yields. These results, though useful, do notprovide elements for quantitative decisions whichwould allow a choice of a real production leveIaccording to the c1imate, crop, soil and irrigationmethod conditions and management possibilities.
391
392 TURRIALBA: VOL. 30, NUM. 4, TRIMESTRE OCTUBRE-DICIEMBRE 1980
Millar (14) presented an analysis of world data ofsoil moisture level-yield experiments which allow aquantitative definition of the yield reduction at soilwater potentials beyond optimum conditions. As aconclusion of Millar's work ít is apparent that highfrequency irrigation goes a long way towards meetingthe conflicting requirements of maintaining a highsoil water potential to attain maximum yields. Thisalso is the prospect offered by Rawlins and Raats(16). The prior conditions could only be met throughdrip, trickle, and from solid-set to traveling sprinklersystems. Due to operation and water distributionproblems, high-frequency principIes become unfeasibleunder surface irrigation conditions.
a. Climate ComponentCrop evapotranspiration (ET) is the climate input
of the mo del. ET is defined as a function of soilmatric potential of the effective rooting zone of crop,ET = ET (I/J). When this information is not available,ET can be obtained using crop coefficients and panevaporation data (7).
b. Soil ComponentsWater Retention - The relationship between the
volumetric c~~tent (e) and the soil matric. potential(I/J), I/J = ae , becomes one of the most importantinputs since ET and crop yield are defined as a func-tion of soil matric potential.
Water Conducting Properties - There are twosoil water transmission properties that are essential,the capillary conductivity (k) as a function of volu-metric water content, k = c exp (de), and the drainagerate (D), at the bottom of the root zone, as a func-tion of the water storage (L) in the above soil profile,D = r exp (sL). Both properties are related throughDarcy's Law, D = -k (dHjdZ), where dHjdZ is thehydraulic gradient. Both parameters should beobtained under yield conditions using standardmethods (2,8).
This paper deals with a model to define irrigationmanagement to obtain maximum operational cropyield under conditions of surface and high-frequencyirrigation systems.
Materiais and methods
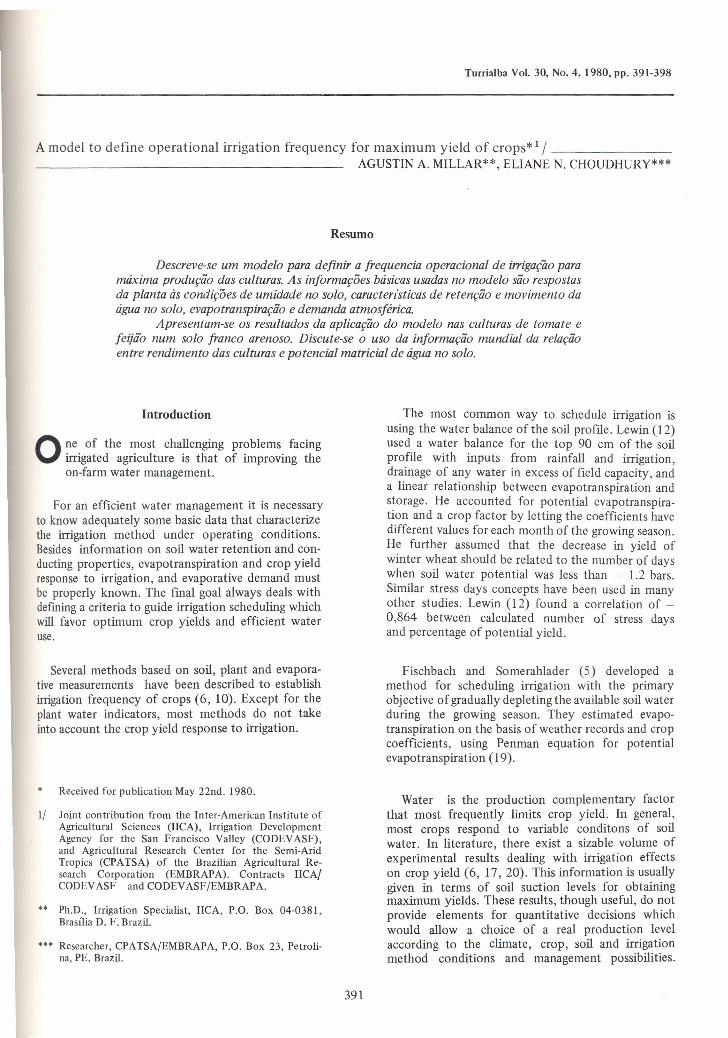
1. Model description and componentsThe mo deI uses climate, soil, crop and irrigation
management information as inputs (Figure 1).
ClIMATE SOIL CROP
WATER RETENTIONANO TRANSMISSIONPROPERTlES OF
SOIL
CROP YIELO ASA FUNCTlON OFSOIL MATRIC
POTENTIALIII KcJ,
~ = ~(e)K = K (e)
D=D{L) IRRIGATION METHOOANO ON-FARM WATERMANAGEMENTCHARACTERISTICS
ET
ET= ET{~)
$OIL WATER IRRIGATION MANAGE'--- ~::BALANCE FOR THE If----f MENT LEVEL FOR
EFFECTIVE ROOT- MAXIMUM OPERA-IN6 ZONE TIONAL CROP YIELD
1IRRIGATION FREQUENCY
TO OBTAIN MAXIMUMOPERATIONAL CROP YIELO
Fig. 1. Climate, soíl and crop components of the MOFmodel.
MILLAR Y CHOUDHURY: A MODEL TO DEFINE IRRIGATION FREQUENCY 393
The use of water storage to defme the drainage rateat the bottom of the rooting zone works properly incoarse and medium textured soils as shown by Blacket aI. (1, 2). For heavy soils the drainage rate must bedefmed as a function of existing moisture conditionsat the bottom of the root zone.
c. Crop ComponentCrop yield as a function of soil matric potential is
the essential relationship. This information becomesavailable through water trial experiments and can beinferred from world data as used by Millar (14).
The relationship is used in the model to define thebest water management level in terms of soil matricpotential to obtain maximum crop yield under theirrigation method and operational characteristics.
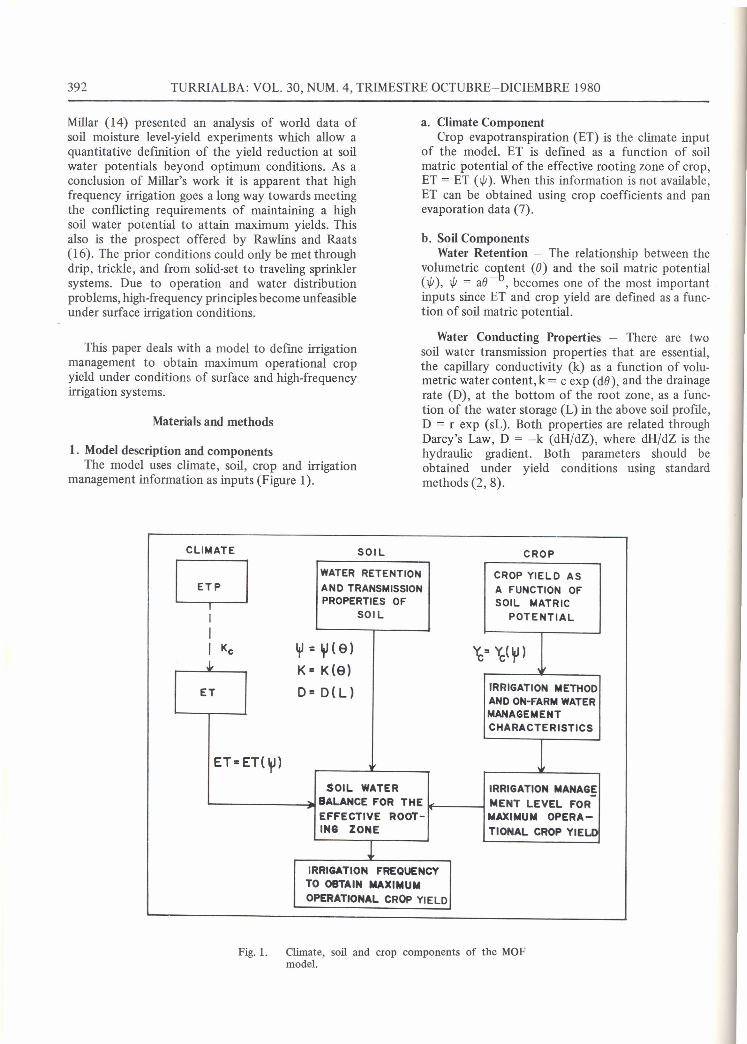
2. Model Sequence and outputsSoil water balance for the effective rooting zone is
run starting with soil water storage depth at fieldcapacity level. The sequence of the model is shownin Figure 2. The operational irrigation frequency formaximum crop yield is obtained by superimposinga minimum attainable soil matric potential (l/I) whichis a function of crop response, irrigation method andmanagement characteristics.
EQUATIONS
y = o· e-b
ET=ET( ~)
ü= r expts-LíL.:::.-'-:.:...:.:..:.=-:..::=r-....:..:..:..:...:...:=--...J
NOVx:~x(CROP. MAN-
AGEMENT)
NO
Fig. 2. Sequence of the MOF model.
3. Basic DataThe data used to test the model were collected
through several studies conducted at the BebedouroExperimental Station at the Research Center forSemi-Arid Tropics (CPATSA) in Petrolina, State ofPernambuco, Brazil.
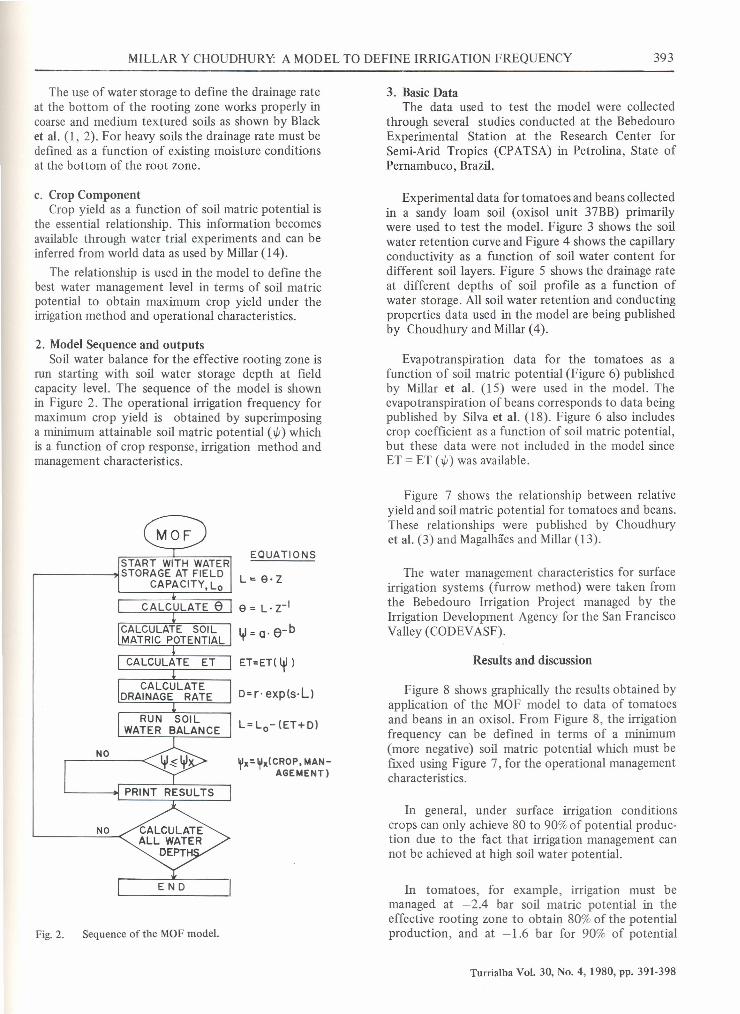
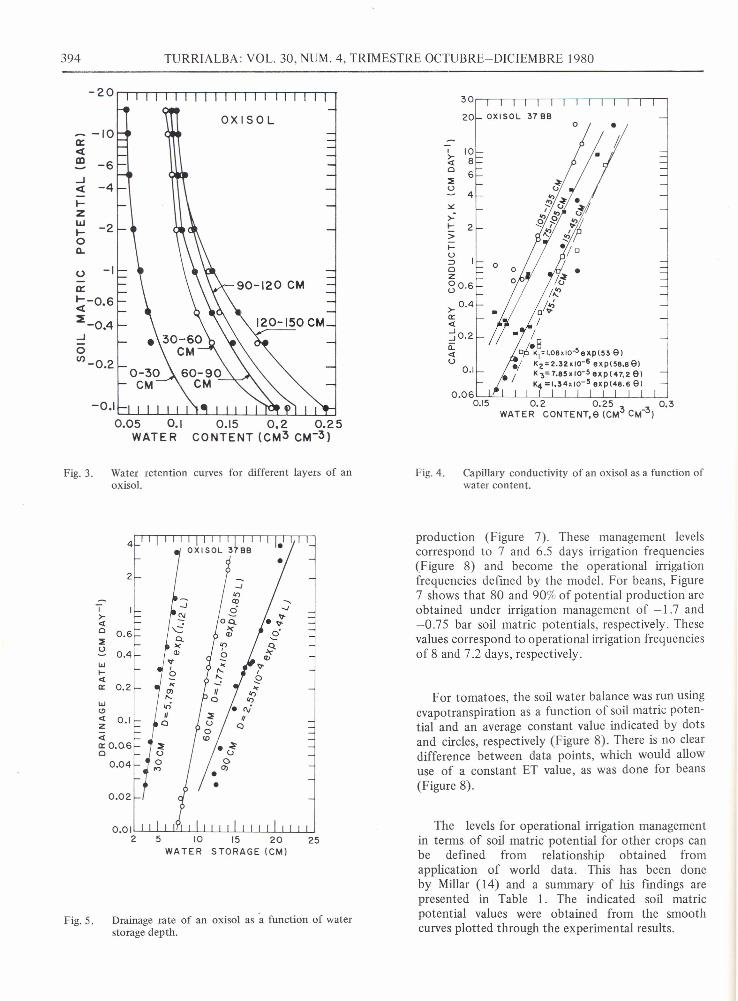
Experimental data for toinatoes and beans collectedin a sandy loam soil (oxi sol unit 37BB) primarilywere used to test the modeI. Figure 3 shows the soilwater retention curve and Figure 4 shows the capillaryconductivity as a function of soil water content fordifferent soillayers. Figure 5 shows the drainage rateat different depths of soil profile as a function ofwater storage. All soil water retention and conductingproperties data used in the model are being publishedby Choudhury and Millar (4).
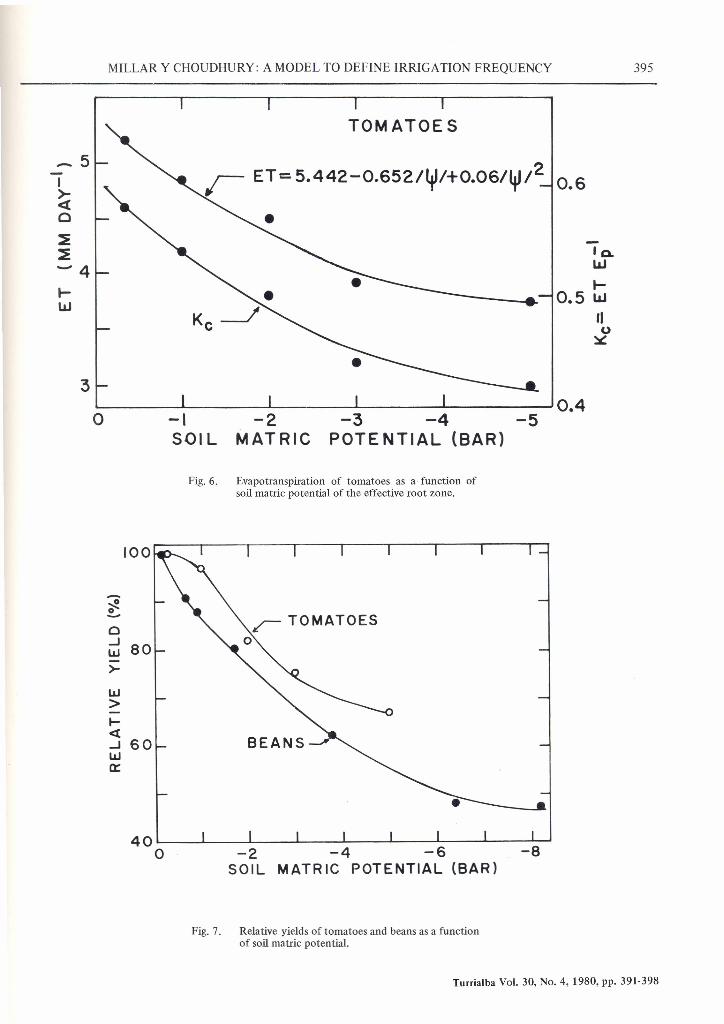
Evapotranspiration data for the tomatoes as afunction of soil matric potential (Figure 6) publishedby Millar et al. (15) were used in the model. Theevapotranspiration of beans corresponds to data beingpublished by Silva et al. (18). Figure 6 also includescrop coefficient as a function of soil matric potential,but these data were not included in the model sinceET = ET (l/I) was available.
Figure 7 shows the relationship between reiativeyield and soil matric potential for tomatoes and beans.These relationships were published by Choudhuryet al. (3) and Magalhães and Millar (13).
The water management characteristics for surfaceirrigation systems (furrow method) were taken fromthe Bebedouro Irrigation Project managed by theIrrigation Development Agency for the San FranciscoValley (CODEV ASF).
Results and discussion
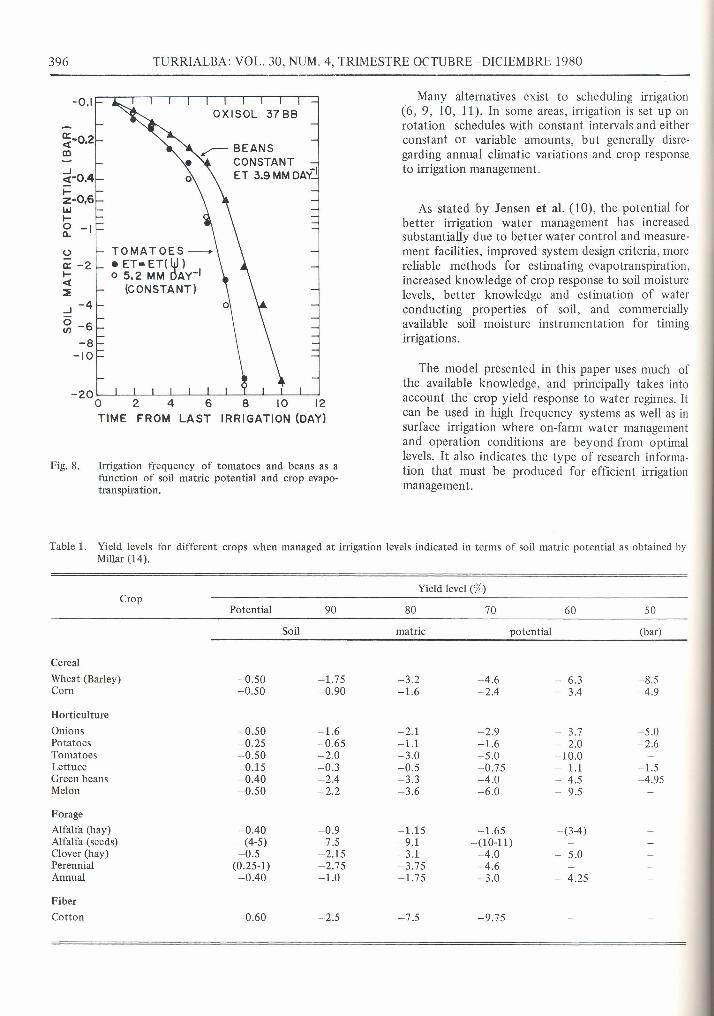
Figure 8 shows graphícally the results obtained byapplication of the MOF model to data of tomatoesand beans in an oxisol. From Figure 8, the irrigationfrequency can be defmed in terms of a rninimum(more negative) soil matric potential which must befixed using Figure 7, for the operational managementcharacteristics.
In general, under surface irrigation conditionscrops can only achieve 80 to 90% of potential produc-tion due to the fact that irrigation management cannot be achieved at high soil water potential.
In tomatoes, for example, irrigation must bemanaged at -2.4 bar soil matric potential in theeffective rooting zone to obtain 80% of the potentialproduction, and at -1.6 bar for 90% of potential
Turrialba Vol. 30, No. 4,1980, pp. 391-398
394 TURRIALBA: VOL. 30, NUM. 4, TRIMESTRE OCTUBRE-DICIEMBRE 1980
OX I S O L-10
-6-4
-2
u -Io::~-0.6
~-0.4...J
Oli) -0.2
- 4
~•...2>....U:::Joz8°·6r 0.4a:«jO.2õ:«o
0.1
-0.1 ~~~~-L~-L~~LL-LLL~-LJ0.05 0.1
WATER0.15 0.2 0.25
CONTENT (CM3 CM-3j
Fig. 3. Water retention curves for different layers of anoxisol.
I"..••.
-.J
r .:«o 0.6 o':::E '-o 0.4 ~
Cl>W 'J"I- I
« !2a: 0.2 '<
'"w '"<.!) • <li« 0.1 1/z Q
~0::0.06o
0.04
0.02
15 20 25STORAGE (eM)
Fig. 4. Capillary conductivity of an oxisol as a function ofwater content.
production (Figure 7). These management levelscorrespond to 7 and 6.5 days irrigation frequencies(Figure 8) and become the operational irrigationfrequencies defined by the mode!. For beans, Figure7 shows that 80 and 90% of potential production areobtained under irrigation management of -1.7 and-0.75 bar soil matric potentials, respectively. Thesevalues correspond to operational irrigation frequenciesof 8 and 7.2 days, respectively.
For tomatoes, the soil water balance was run usingevapotranspiration as a function of soil matric poten-tial and an average constant value indicated by dotsand circles, respectively (Figure 8). There is no cleardifference between data points, which would allowuse of a constant ET value, as was done for beans(Figure 8).
The levels for operational irrigation managementin terms of soil matric potential for other crops canbe deflned from relationship obtained fromapplication of world data. This has been doneby Millar (14) and a summary of his findings arepresented in Table 1. The indicated soil matricpotential values were obtained from the smoothcurves plotted through the experimental results.
Fig.5. Drainage rate of an oxisol as a function of waterstorage depth.
MILLAR Y CHOUDHURY: A MODEL TO DEFINE IRRIGATION FREQUENCY 395
;- ET= 5.442-0.652/~/+0.06/1fJ/20.6
TOMATOES
Ia.W
r0.5 w
"u~
o~----~L-----~-------L------~--------~0.4
-ISOIL
-2MATRIC
-3 -4 -5POTE NTIAL (BAR)
Fig, 6. Evapotranspiration of tomatoes as a function ofsoil matric potential of the effective root zone.
o...JLU
>-LU>•....<l:...JLUo::
40~ __ ~ __ ~ L-__-L__~ ~ __-L ~
O -2 -4 -6SOIL MATRIC POTENTIAL (BAR)
Fig. 7. Relative yields of toma toes and beans as a functionof soil matric potential.
Turrialba Vol. 30, No. 4, 1980, pp. 391·398
396
-0.1
TURRIALBA: VOL. 30, NUM. 4, TRIMESTRE OCTUBRE-DICIEMBRE 1980
~-0.2m
;i-oAI-z-0,6\LII-
~ -I
oa: -2I-<X~...J -4
~ -6-8
-10
Many alternatives exist to scheduling irrigation(6,9, 10, 11). ln some areas, irrigation is set up onrotation schedules with constant intervals and eitherconstant or variable amounts, but generally disre-garding annual climatic variations and crop responseto irrigation management.
~ BEANSCONSTANTET 3.9 MM OAy'1
As stated by Jensen et aI. (10), the potential forbetter irrigation water management has increasedsubstantially due to better water control and measure-ment facilities, improved system design criteria, morereliable methods for estimating evapotranspiration,increased knowledge of crop response to soi! moisturelevels, better knowledge and estimation of waterconducting properties of soi!, and commerciallyavai!able soi! moisture instrumentation for timingirrigations.
TOMATOES -eET-ET(W)o 5.2 MM DAy-1
(CONSTANT)
The model presented in this paper uses much ofthe available knowledge, and principa1ly takes intoaccount the crop yield response to water regimes. Itcan be used in high frequency systems as well as insurface irrigation where on-farm water managementand operation conditions are beyond from optimallevels. It also indicates the type of research informa-tion that must be produced for efficient irrigationmanagement.
-20~~~-L-L~--~L-~-L-L~~O 2 4 6 8 10 12TIME FROM LAST IRRIGATION (OAY)
Fig. 8. Irrigation frequency of tomatoes and beans as afunction of soil matric potential and crop evapo-transpiration.
Table 1. Yield levels for different crops when managed at irrigation levels indicated in terms of soil matric potential as obtained byMillar (14).
CropYield Ievel (%)
Potential 90 80 70 60 50
Soil matric potential (bar)
-0.50 -1.75 -3.2 -4.6 - 6.3 -8.5-0.50 -0.90 -1.6 -2.4 - 3.4 -4.9
-0.50 -1.6 -2.1 -2.9 - 3.7 -5.0-0.25 -0.65 -1.1 -1.6 - 2.0 -2.6-0.50 -2.0 -3.0 -5.0 -10.0-0.15 -0.3 -0.5 -0.75 - 1.1 -1.5-0.40 -2.4 -3.3 -4.0 - 4.5 -4.95-0.50 -2.2 -3.6 -6.0 - 9.5
-0.40 -0.9 -1.15 -1.65 -(3-4)-(4-5) -7.5 -9.1 -(iO-ll)-0.5 -2.15 -3.1 -4.0 - 5.0
(0.25-1) -2.75 -3.75 -4.6-0.40 -1.0 -1.75 -3.0 - 4.25
-0.60 -2.5 -7.5 -9.75
CerealWheat (Barley)Com
HorticultureOnionsPotatoesTomatoesLettuceGreen beansMelon
ForageAlfalfa (hay)Alfalfa (seeds)Clover (hay)PerennialAnnual
FiberCotton
MILLAR Y CHOUDHURY: A MODEL TO DEFINE IRRIGATION FREQUENCY 397
Resumen 5. FISCHBACH P. E. and B. R. SOMERAHLADER.Irrigation design requirments for com. Trans-actions of the American Society of Agricul-tural Engineering 17(1):162-165.1974.
6. HAISE, H. R. and R. M. HAGAN. Soil, plant,and evaporative measurements as criteria forscheduling irrigation. pp. 577-604. In: R. M.Hagan et aI. (ed), Irrigation of AgriculturalLands. Madison, Wisconsin, American Societyof Agronomy. (Monograph 11). 1967.
Se describe un modelo para defmir Ia frecuenciaoperacional de riego para obtener máxima producciónde los cultivos.
EI modelo usa como información básica Ia respues-ta de Ia planta a Ias condiciones de humedad en elsuelo, características de retención y movimiento delagua en el suelo, evapotranspiración y demandaatmosférica.
Se presentan los resultados de Ia aplicación dei mo-delo en cultivos de tomate y frijol, en un suelo francoarenoso. Se discute el uso de Ia información mundialde Ia relación entre rendirrúento de los cultivos y elpotencial matricial de agua en el suelo.
7. HARGREAVES, G. H. Consumptive use derivedfrom evaporation pan data. Journal of theIrrigation and Drainage Division, AmericanSociety of Civil Engineering 94 (IR 1):97-105. 1968.
Summary
8. HILLEL, D., V. D. KRENTOS and Y. STYLlA-NOU. Procedure and test of an internaldrainage method for measuring soil hydraulicconductivity "in situ". Soil Science 114:395-400.1972.
A model to define operational frequency formaxirnum yield of crops is described. Plant responseto soil moisture conditions, soil water retention andtransmission characteristics, evapotranspiration andatmospheric demand are the basic information usedin the modeI. Results of the application of the modelfor tomatoes, and beans in a sandy loam soil arepresented. The use of world data of the yield-waterrelationship is discussed.
9. JENSEN, M. C., J. E. MIDDLETON and W. o.PRUITT. Scheduling irrigation from panevaporation. Washington Agricultural Experi-ment Station. 14 p. (circular 386). 1961.
10. JENSEN, M. E., D. C. N. ROBB and C. E.FRANZOY. Scheduling irrigations usingclimate-crop-soil data. Journal of the Irriga-tion and Drainage Division, AmericanSociety of Civil Engineering 96 (IR 1):25-37. 1970.
Literature Cited 1l. JENSEN, M. E. and 1. L. WRIGHT. The role ofevapotranspiration models in irrigationscheduling. Transactions of the AmericanSociety of Agricultural Engineering 21(1):82-87.1978.
1. BLACK, T. A., W. R. GARDNER and G. W.THURTELL. The prediction of evaporation,drainage and soil water storage for a baresoil. Soil Science Society of America Pro-ceedings 33:655-660.1969. 12. LEWIN, J. A quantitative and qualitative case-
study analysis of scientific productivity inagricultural research. Israel AgrículturalResearch 22(3):129-139.1972.
2. BLACK, T. A., W. R. GARDNER and C. B.TANNER. Water storage and drainage under arow crop on a sandy soil. Agronomy Journal62:48-5l. 1970.
3. CHOUDHURY, E. N., A. A. MILLAR, M. M.CHOUDHURY e T. A. ABREU. Análiseda produção de tomate sob diferentes regi-mes de irrigação. Pesquisa Agropecuária Bra-sileira (en prensa).
13. MAGALHÃES, A. A. e A. A. MILLAR. Efeitodo déficit de água no período reprodutivosobre a produção do feijão. Pesquisa Agrope-cuária Brasileira 13(2): 55-60. 1978.
4. CHOUDHURY, E. N. e A. A. MILLAR. Carac-terísticas da retenção e movimento de águade dois oxisol irrigados. Revista Brasileirada Ciência do Solo (en prensa).
14. MILLAR, A. A. Respuesta de 10s cultivos al défi-cit de agua como información básica paramanejo de riego. Brasília, CODEV ASF jF AOjUSAIDjABID, 62 p. 1976. (Conferencia in-vitada para el Serninario sobre Manejo deAgua, Brasília, Mayo 1976).
Turrialba Vol. 30, No. 4,1980, pp. 391-398
398 TURRIALBA: VOL. 30, NUM. 4, TRIMESTRE OCTUBRE-DICIEMBRE 1980
15. MILLAR, A. A., E. N. CHOUDHURY e T. A.ABREU. Determinação da evapotranspira-ção no tomate industrial através do balançocompleto de água sob diferentes regimes deirrigação. Anais do IV Congresso Brasileirode Irrigação e Drenagem, 20 p. 1978.
18. SILVA, M. A., A. A. MILLAR, S. BERNARDOe A. CONDE. Efeito da lâmina de água eda adubação nitrogenada sobre a produçãode feijão "Macassar", utilizando o sistema deirrigação por espersão em linha. Anais do IVCongresso Brasileiro de Irrigação e Drenagem,20 p. 1978.
16. RAWLINS, S. L. and P. A. C. RAATS. Prospectfor high-frequency irrigation pp. 128-134.In: Abelson, P. H. (ed), Food: Politics,Economics, Nutrition and Research. Ameri-can Association of the Advancement ofScience. 1975.
19. TANNER, C. B. Evaporation of water fromplants and soil. pp. 73-106, In: Kozlowski,T. T. (ed), Water deficit and plant growth,volume 1, Development, Control, andMeasurement. New York, Academic PressInc.1968.
17. SALTER, P. J. and J. E. GOODE. Crop responsesto water at different stages of growth. Bucks,England, Commonwealth Agricultural Bu-reaux, Farnham Royal. 267 p. 1967.
20. TAYLOR, S. A. Managing irrigation water on thefarm. American Society of AgriculturalEngineering Transactions 8 :433-436. 1965.


![Operational consulting 2013 apresentação executiva [pt]](https://img.document.onl/doc/110x75/55701496d8b42ac0178b4fa9/operational-consulting-2013-apresentacao-executiva-pt.jpg)