Embed Size (px)
Citation preview
Universidade do MinhoEscola de Engenharia
Ana Rita Marques da Silva
outubro de 2015
Production of biohydrogen from dark fermentation of organic wastes
Ana
Rita
Mar
ques
da
Silv
a P
rod
uct
ion
of
bio
hyd
rog
en
fro
m d
ark
fe
rme
nta
tio
n o
f o
rga
nic
wa
ste
s U
Min
ho|2
015

Ana Rita Marques da Silva
outubro de 2015
Production of biohydrogen from dark fermentation of organic wastes
Universidade do MinhoEscola de Engenharia
Trabalho efetuado sob a orientação da Professora Doutora Maria Alcina Alpoim de Sousa Pereira e daDoutora Ângela Alexandra Valente de Abreu
Dissertação de Mestrado Mestrado em Bioengenharia

iii
AGRADECIMENTOS
Em primeiro lugar quero agradecer á minha orientadora Alcina Pereira, pela confiança
depositada no meu trabalho, pela orientação, partilha de conhecimento, disponibilidade total e
motivação.
À minha co-orientadora Ângela Abreu, pela troca de ideias, partilha de conhecimento, apoio,
orientação ao longo de todo o percurso, disponibilidade total e ajuda generosa no decorrer da realização
deste trabalho.
Um especial agradecimento à Andreia Salvador por todo o apoio, presença e ajuda com a parte
da biologia molecular realizada neste trabalho.
Ao Sr. Manuel Santos pelo trabalho e apoio prestados que foram imprescindíveis, bem com à
Engª. Madalena Vieira e à Aline pela sua disponibilidade em ajudar.
A todos os meus colegas do Laboratório de Biotecnologia Ambiental, com quem tive o privilégio
de trabalhar e que me ajudaram a superar alguns dos problemas laboratoriais que foram surgindo. Um
especial agradecimento ao João.
Agradeço a todos os meus amigos que me acompanharam no meu percurso académico tanto
na Licenciatura em Bioquímica como no Mestrado em Bioengenharia especialmente à Andreia, Catarina,
Sara e Paulina pela vossa amizade, apoio e companheirismo.
Quero agradecer especialmente ao Ricardo, por todo o amor e compreensão. Por me apoiar em
todas as minhas decisões e por me motivar em conquistar todos os meus sonhos. Obrigado por toda a
paciência demonstrada em todos estes anos juntos.
E Finalmente agradeço aos meus pais e irmão por todo o apoio, amor, compreensão e
inesgotável paciência.


v
RESUMO
Atualmente, o hidrogénio é uma alternativa promissora aos combustíveis fósseis devido á sua
elevada conversão, reciclabilidade e natureza não poluente. Vários investigadores estudam outras fontes
de combustível, inclusive o uso de hidrogénio como fonte de energia. A utilização de processos biológicos
como a dark fermentation para a produção de hidrogénio é uma das possibilidades. Este processo é
considerado um dos processos mais promissores, sustentável e “amigo” do ambiente. O
armazenamento de energia é, atualmente, um assunto de extrema importância. A procura por novos
métodos para o armazenamento de hidrogénio é um importante aspeto para as suas aplicações
energéticas. Os zeólitos são um dos materiais mais promissores para o armazenamento deste gás.
Estudos preliminares sobre a produção de hidrogénio por dark fermentation na presença de zeólitos
revelaram um aumento significativo na produção deste. Nesta dissertação, foram testadas três razões
diferentes de zeólitos/biomassa, 0.26, 0.13 e 0.065 g g-1 (VS).
Foram realizados ensaios em modo batch com dois meios diferentes (meio complexo e simples)
e com arabinose e glucose como substrato. Em ambos os casos, o aumento na produção de hidrogénio
na presença de 0.26 g zeólito g-1 (VS) biomassa foi significativamente superior do que o obtido para o
controlo (sem zeólito). A produção de hidrogénio máxima obtida para as fermentações em meio complexo
e simples foram respetivamente 1.27 mmol e 0.87 mmol. Nestes ensaios, o lactato, acetato e o ácido
fórmico foram os únicos produtos solúveis de fermentação (PSF) formados durante o processo dark
fermentation. O aumento na produção de hidrogénio pelos zeólitos foi também observado em modo
batch com o Sargassum sp., como substrato. Neste caso foi atingida uma produção máxima de
hidrogénio de 0.62 mmol para a razão de 0.13 g zeólito g-1 (VS) biomassa. Vários produtos solúveis de
fermentação foram produzidos neste ensaio, uma vez que foi utilizado uma biomassa marinha que é um
substrato bastante complexo. Contudo, o acetato e o lactato foram os PSF predominantes.
O efeito dos zeólitos em contínuo foi também testado. Nesta fase, duas operações foram
realizadas uma com arabinose e glucose como substrato (RA + G) e outra com glucose (RG). A presença
de 0.26 g zeólito g-1 (VS) biomassa no bioreator melhorou a taxa de produção de hidrogénio, observando-
se um máximo de 430 mL H2 L-1 d-1 e 250 mL H2 L-1 d-1, respetivamente. O lactato foi o produto solúvel
de fermentação predominante, no entanto a formação de outros ácidos foi também observada.
Palavras-Chave: Biohidrogénio, Zeólitos, Bioreator, Sargassum sp., Dark fermentation.


vii
ABSTRACT
Nowadays hydrogen is a promising alternative to fossil fuels mainly due to its high conversion,
recyclability and nonpolluting nature. Several researchers study other sources of fuel, including the use
of hydrogen as energy source. The utilization of biological process, such as Dark fermentation is one of
the possibilities for the hydrogen production. This process is considered one of the most promising,
sustainable and environmentally friendly. Currently, energy storage has become an extremely important
issue. So the search for new hydrogen-storage methods has become an important aspect in hydrogen
energy applications. Zeolites is one of the most promising material for hydrogen storage. Preliminary
studies using zeolites for biohydrogen dark fermentation in batch mode, revealed an improvement on the
biohydrogen production. Three different ratios zeolites/biomass, 0.26, 0.13 and 0.065 g g-1 (VS), were
tested.
The batch assays were performed with two different medium (complex and a simple medium)
and with arabinose and glucose as substrate. In both cases the increase on cumulative hydrogen
production in the presence of 0.26 g zeolite g-1 (VS) biomass was significantly higher than the obtained
for the control (without zeolites). A maximum hydrogen production of 1.27 mmol and 0.87 mmol was
achieved for the fermentation with a complex and simple medium, respectively. Lactate, acetate and
formic acid were the only soluble fermentation products (SFP) formed during dark fermentation process.
The improvement of hydrogen production by zeolites was also observed in batch mode with the marine
biomass, Sargassum sp., as substrate. In this case a maximum hydrogen production of 0.62 mmol was
achieved in the presence of 0.13 g zeolite g-1 (VS) biomass. Due the use of a complex substrate many
soluble fermentation products were formed during Sargassum sp. dark fermentation. However acetate
and lactate were the most prevalent of SFP.
The effect of zeolites in continuous mode, performed with glucose and arabinose as substrate
(RA + G) and with only glucose (RG), was also studied. The presence of zeolites (0.26 g zeolite g-1 (VS)
biomass) improve the hydrogen production rate in the two operations, reaching a maximum of 430 mL
H2 L-1 d-1 and 250 mL H2 L-1 d-1, respectively. The largest amount of soluble microbial products produced
for the two operations was for lactic acid. The acetate, formic acid, propionic acid and n-butyric acid
formation was also observed.
KEYWORDS: BIOHYDROGEN, ZEOLITES, BIOREACTOR, SARGASSUM SP., DARK FERMENTATION.


ix
TABLE OF CONTENTS
Agradecimentos .................................................................................................................................. iii
Resumo............................................................................................................................................... v
Abstract............................................................................................................................................. vii
List of figures .................................................................................................................................... xiii
List of Tables ..................................................................................................................................... xv
List of symbols and abbreviations ..................................................................................................... xvii
1. Chapter State of Art ................................................................................................................... 19
1.1 Importance of Hydrogen production ................................................................................ 21
1.2 Biohydrogen production ................................................................................................. 22
1.2.1 Dark fermentation ......................................................................................................... 22
1.2.2 Hydrogenases............................................................................................................ 23
1.2.3 Fermentative pathways and metabolites for biohydrogen production ........................... 24
1.3 Bioreactors for hydrogen production ............................................................................... 27
1.3.1 Type of Bioreactors .................................................................................................... 27
1.3.2 Type of inoculum ....................................................................................................... 28
1.3.3 Advantages of using granular-sludge systems ............................................................. 29
1.3.4 Feedstocks and nutrients requirement ....................................................................... 29
1.4 Parameters influencing the activity of hydrogen-producing bacteria ................................... 31
1.4.1 pH Control ................................................................................................................. 31
1.4.2 Temperature control .................................................................................................. 31
1.4.3 Hydraulic retention time (HTR) control ....................................................................... 32
1.4.4 Hydrogen partial pressure (p(H2)) .............................................................................. 32
1.5 Importance of hydrogen storage materials ....................................................................... 33
1.5.1 Zeolites ..................................................................................................................... 33
2. Chapter Objective ...................................................................................................................... 35
3. Chapter Material and Methods ................................................................................................... 39
3.1 Zeolites.......................................................................................................................... 41
3.2 Hydrogen production assays with simple sugars .............................................................. 41

x
3.2.1 Inoculum ................................................................................................................... 41
3.2.2 Experiment Set-up with simple sugars ........................................................................ 41
3.3 Hydrogen production assays with Sargassum sp. ............................................................ 42
3.3.1 Inoculum ................................................................................................................... 42
3.3.2 Residue characterization ............................................................................................ 43
3.3.3 Experiment set-up ...................................................................................................... 43
3.3.4 Experiment set-up with Zeolites .................................................................................. 44
3.4 Operation of the Hydrogen producing reactors ................................................................. 44
3.4.1 Inoculum ................................................................................................................... 44
3.4.2 Glucose and Arabinose reactor ................................................................................... 45
3.4.3 Glucose reactor ......................................................................................................... 45
3.5 Analytical methods ......................................................................................................... 46
3.6 Molecular Methods......................................................................................................... 46
3.6.1 PCR-DGGE and Sequencing ....................................................................................... 46
4. Chapter Results and Discussion ................................................................................................ 49
4.1 Biohydrogen dark fermentation with simple sugars .......................................................... 51
4.1.1 Zeolites effect on biohydrogen dark fermentation performed with a complex reaction
medium 51
4.1.2 Zeolites effect on biohydrogen dark fermentation performed with a simple reaction
medium 54
4.2 Biohydrogen dark fermentation of Sargassum sp. ............................................................ 57
4.3 Zeolites effect on biohydrogen dark fermentation of Sargassum sp. .................................. 60
4.4 Effect of HRT and zeolites in continuous hydrogen production in an EGSB bioreactor ........ 63
4.4.1 Hydrogen production in an EGSB bioreactor using glucose and arabinose ................... 64
4.4.2 Hydrogen production in an EGSB bioreactor using glucose ......................................... 69
4.5 MICROBIAL COMMUNITY PROFILES.......................................................................................... 71
4.6 MICROBIAL DIVERSITY ......................................................................................................... 74
5. Chapter Conclusion ................................................................................................................... 81
CONCLUSION ................................................................................................................................... 83

xi
6. Chapter Bibliography ................................................................................................................. 85
Bibliography ..................................................................................................................................... 87


xiii
LIST OF FIGURES
Figure 1. Schematic representation of dark fermentation biohydrogen production .............................. 22
Figure 2. Hydrogen producing fermentation pathways involved in glucose and arabinose fermentation, in
mixed cultures, obtained from (Abreu, Karakashev, Angelidaki, Sousa, & Alves, 2012). ...................... 25
Figure 3. (a) Schematic representation of a pore of the zeolite NaX. (b) SEM images of zeolites NaX. . 34
Figure 4. Zeolites of NaX family, correspondent of type 13X. .............................................................. 41
Figure 5. Cumulative hydrogen production for each ratio zeolites/biomass tested. The error bars represent
one standard deviation of triplicate bottles. ........................................................................................ 51
Figure 6. Arabinose (a) and glucose (b) utilization. Lactate (c), acetate (d) and formic acid (e) formation
during hydrogen dark fermentation process for each ratio zeolites/biomass tested. Error bars represent
one standard deviation of duplicate bottles. ....................................................................................... 52
Figure 7. Cumulative hydrogen production for each ratio zeolites/biomass tested. The error bars represent
one standard deviation of triplicate bottles. ........................................................................................ 54
Figure 8. Arabinose (a) and glucose utilization (b). Lactate (c), acetate (d) and formic acid (e) formation
during hydrogen dark fermentation process, for each ratio zeolite/inoculum tested. Errors bars represent
standard deviation of duplicate bottles. ............................................................................................. 55
Figure 9. Cumulative hydrogen production for each ratio biomass/substrate tested. The errors bars
represent one standard deviation of triplicate bottles. ........................................................................ 57
Figure 10. Soluble fermentation products (SFP) formed during hydrogen dark fermentation process for
each ratio biomass/Sargassum sp. tested. Error bars represent one standard deviation of duplicate
bottles. ............................................................................................................................................. 58
Figure 11. Cumulative hydrogen production for each ratio zeolites/biomass tested. Error bars represent
one standard deviation of triplicate bottles. ........................................................................................ 61
Figure 12. Soluble fermentation products (SFP) formed during hydrogen dark fermentation process from
Sargassum sp. for each ratio zeolites/biomass tested. Error bars represent one standard deviation of
duplicate bottle. ................................................................................................................................ 62
Figure 13. Effect of HRT and zeolites on the performance of RA + G. (a) Hydrogen production rate and
HRT. (b) Hydrogen content. .............................................................................................................. 64
Figure 14. Effect of HRT and zeolites on (a) arabinose and glucose utilization, (b) soluble fermentation
products (SFP). ................................................................................................................................ 65

xiv
Figure 15. Effect of HRT and zeolites on the performance of RG. a) Hydrogen production rate and HRT.
(b) Hydrogen content. ....................................................................................................................... 69
Figure 16. Effect of HRT and zeolites on (a) arabinose and glucose utilization (b) soluble fermentation
products. .......................................................................................................................................... 70
Figure 17. DGGE profile of bacterial community present in the granular biomass of RA + G (arabinose
and glucose as substrate) and RG (glucose as substrate) before and after zeolites addition. ............... 72
Figure 18. Dendrograma calculated by Dice correlation of the DGGE profile of bacterial community present
in the granular biomass of RA + G (arabinose and glucose as substrate) and RG (glucose as substrate)
before and after zeolites addition. ..................................................................................................... 73
Figure 19. Taxonomic composition of microbial community present in RA + G before zeolites addition. 76
Figure 20. Taxonomic composition of microbial community present in RA + G after zeolites addition. .. 77
Figure 21. Taxonomic composition of bacterial community present in of RG before zeolites addition. .. 78
Figure 22. Taxonomic composition of microbial community present in RG after zeolites addition. ....... 80

xv
LIST OF TABLES
Table 1. Principal characteristics of zeolites 13X................................................................................ 41
Table 2. Ratios zeolites and biomass (g g-1 (VS)) tested in batch assays performed with simple sugars
and with Sargassum sp.. .................................................................................................................. 42
Table 3. Characterization of Sargassum sp. obtained from (Costa et al., 2015). ................................. 43
Table 4. Ratios of biomass/Sargassum sp. tested on batch assays. ................................................... 44
Table 5. Maximum hydrogen partial pressure (p(H2)), maximum hydrogen yield (mmol mmol-1 substrate)
and COD balance (%) obtained for each ratio zeolite/biomass tested and for the control. ................... 53
Table 6. Maximum hydrogen partial pressure (p(H2)), maximum hydrogen yield (mmol mmol-1 substrate)
and COD balance (%) obtained for each ratio zeolite/biomass tested. ................................................ 56
Table 7. Maximum hydrogen partial pressure (p(H2)), maximum hydrogen yield (mmol g-1 (VS)
Sargassum sp.) and COD balance (%) obtained for each ratio biomass/ Sargassum sp. tested. .......... 59
Table 8. Maximum hydrogen partial pressure (p(H2)), maximum yield (mmol g-1 (VS) Sargassum sp.)
and COD balance (%) obtained for each ratio biomass/Sargassum sp. tested. ................................... 61
Table 9. Process performance of RA + G. .......................................................................................... 66
Table 10. Process performance of RG. .............................................................................................. 71
Table 11. Similarities calculated by Dice correlation of the DGGE profiles of bacterial community present
in the granular biomass of RA + G (arabinose and glucose as substrate) and RG (glucose as substrate)
before and after zeolites addition. ..................................................................................................... 73
Table 12. Taxonomic diversity of 16S rRNA RA + G and RG before and after zeolites addition. ............ 75


xvii
LIST OF SYMBOLS AND ABBREVIATIONS
BES - 2-Bromoethanesulfonate
ATP - Adenosine triphosphate
NAD+/NADH - Oxidized/reduced forms of nicotinamide adenine dinucleotide
DNA - Desoxyribonucleic acid
CoA - Coenzyme A
H2ase - Hydrogenase
Fd(ox)/Fd(red) - Oxidized/reduced forms of ferredoxin
PFL - Pyruvate: Formate lyase
PFOR - Pyruvate: Ferredoxin oxidoreductase
COD - Chemical oxygen demand
p(H2) - Hydrogen partial pressure
HRT - Hydraulic retention time
HY – Hydrogen yield
D - Dilution rate
CSTR - Continuously stirred tank reactor
EGSB - Expanded granular sludge bed
AnGSB - Anaerobic granular sludge bed
AFBR - Anaerobic fluidized bed reactor
UASB - Up-flow anaerobic sludge bed
AF - Anaerobic filter
GC - Gas chromatography
HPLC - High-performance liquid chromatography
VS - Volatile solids
VSS - Volatile suspended solid
TS - Total solids
TKN - Total Kjeldahl Nitrogen
VFA - Volatile fatty acid
v - Volume
w - Weight

xviii
PCR - Polymerase chain reaction
rRNA - Ribosomal ribonucleic acid

19
1. CHAPTER STATE OF ART


1.Chapter State of Art
21
1.1 Importance of Hydrogen production
In our days, several studies have been conducted to search alternative energy sources, including
hydrogen. Hydrogen is been considered an important energy carrier since it is environmental friendly and
water is the only product of its combustion. Additionally, hydrogen contains the highest value of energy
per mass (142 MJ/Kg) of any known fuel (Gaffron & Rubin, 1942). Although, hydrogen is considered a
sustainable energy carrier only if it is produced from renewable sources.
There are different hydrogen production methods using biological and thermo-chemical processes.
Biological hydrogen production methods include: dark fermentation; or the use of algae deprived of sulfur
to produce hydrogen in a bioreactor. Cyanobacteria and microalgae are among the algae that possess
the ability to produce hydrogen with the help of the hydrogenase enzyme. The hydrogen producing
efficiency due to this process is reported to be 10-20% (Gaffron & Rubin, 1942). Water thermolysis and
electrolysis are examples of thermo-chemical methods for hydrogen production. In the first case, which
water is covalently bonded, energy is necessary to break this molecule apart into hydrogen and oxygen
by using heat as the source (Baykara & Bilgen, 1989). This method is less preferred on industrial and
commercial scale due to material constraints. Hydrogen can also be made via electrolysis of water, which
means using electricity to split water molecules to create pure hydrogen and oxygen. The advantage of
this process is that it can be made anywhere. For example, hydrogen can be produced from tap water
and then it can be used to fuel a car. However, this method is not efficient because the electricity
consumed is more valuable than the produced hydrogen (Baykara & Bilgen, 1989). If this process is
carried out at high temperature is designated as high temperature electrolysis. This method has been
carried out at the laboratory scale, however, fails at the commercial level because of lower quality making
it unsuitable for fuel cells (Niaz, Manzoor, & Pandith, 2015).
Biohydrogen production processes are found to be more environmental friendly. The utilization of
cheaper feedstocks allows the possibility of scale-up production of biohydrogen (N. Ren, Guo, Liu, Cao,
& Ding, 2011).The production of biohydrogen is influenced by different factors such as local availability
of feedstock, the maturity of the technology that it is used for the production, market applications and
demand, policy issues and costs (Abreu, 2011).
Currently, biohydrogen technology is not ready for industrial scale application because it needs
more research projects to explore the opportunities for scale-up production (Abreu, 2011).

Production of biohydrogen from dark fermentation of organic wastes
22
1.2 Biohydrogen production
1.2.1 Dark fermentation
Dark fermentation is a metabolic process for production of organic acids and alcohols, releasing
H2 and CO2 from biomass by anaerobic microorganisms (Figure 1) (Rittmann & Herwig, 2012). The
microorganisms involved in this process, can be pure or mixed cultures. The control of biohydrogen
production by dark fermentation is selected by the used feedstock and the applied reactor conditions
(Abreu, 2011). For the production of hydrogen by dark fermentation is necessary to suppress the
hydrogen consuming organisms (such as methanogenic archaea, homoacetogens, nitrate and sulphate
reducers) by maintaining the pH inside of the reactor around 5.
Figure 1. Schematic representation of dark fermentation biohydrogen production.
Inside of the reactor it is developed a microbial consortium that will affect the distribution of the
bioproducts, including the make-up of the gas. Usually, mixed communities of microorganisms are used
because they have more advantages than pure cultures. They are generally more stable and more
adaptable to changes in the environment and in the feedstock, making them better suited for continuous
operations and waste stream applications (Abreu, 2011). Dark fermentation is a biological process that

1.Chapter State of Art
23
allows a continuous hydrogen production and the generation of commercially valuable metabolites (such
as organic acids). The limitations of dark fermentation are the low yields and rates of hydrogen generation
when compared with non-biological hydrogen production methods (Abreu, 2011).
Although the great diversity of metabolic pathways and the several hydrogenases available, the
major problem with the existing pathways is that just 1/3 of substrate can be used for hydrogen
production. The other 2/3 are used for acetyl-CoA production, creating other fermentative products such
as: butanol, ethanol, butyrate and acetate. For the growth and survival of the microorganism the formation
of some of these products is essential. For example, the acetate allows the ATP formation, while the
formation of other reduced products allows the NADH oxidation, and that is fundamental for the cellular
metabolism (P. C. Hallenbeck, Abo-Hashesh, & Ghosh, 2012). Nowadays, it is important to do more
studies in order to identify the most suitable feedstocks, to isolate and develop efficient hydrogen-
producing strains through genetic engineering and to optimize reactor configurations and operating
strategies. The, objective of this is to increase the yields of hydrogen production through dark fermentation
(Abreu, 2011).
1.2.2 Hydrogenases
The enzyme involved in the process of hydrogen production is the hydrogenase (H2ase). This is
a very complex enzyme responsible for the reversible oxidation of hydrogen into elementary particles, two
protons (H+) and two electrons (e-), represented in the follow reaction (Hexter, Grey, Happe, Climent, &
Armstrong, 2012):
Hydrogenases are classified according with the metals present in the active sites. They can be
classified into two main groups: the Fe-H2ase that contains Fe and those with Ni, Fe and occasionally Se,
[Ni-Fe] H2ase and [Ni-Fe-Se] H2ase (Vignais, Billoud, & Meyer, 2001).
Fe-H2ase has two functions in the cell: the utilization of hydrogen as a growth substrate or in the
combination of electrons with protons to form hydrogen (H2 production). This enzyme has a cytoplasmatic
form that is responsible for the removal of equivalents reducers in excess, produced during fermentations
and carried out by strict anaerobic bacteria (Peters, 1998). On the other hand the [Ni-Fe]-H2ase functions

Production of biohydrogen from dark fermentation of organic wastes
24
are the uptake hydrogenase that provides reducing power via hydrogen oxidation (P. Hallenbeck, 2002).
Several electron carriers are implicated in the reduction of hydrogenase such as ferredoxin and flavodoxin.
The activity can be influenced by some environmental factors such as pH, temperature and iron
concentration. This last have a direct influence on the activity of the enzyme in the hydrogen production
process: The higher the iron concentration, the higher will be the activity of the enzyme (Abreu, 2011).
The optimum hydrogen production rate was achieved at thermophilic conditions. So the bioreactors used
were operated at high temperatures using thermophilic microorganisms (Abreu, Karakashev, Angelidaki,
Sousa, & Alves, 2012).
1.2.3 Fermentative pathways and metabolites for biohydrogen production
Carbohydrates are the most effective substrate for dark fermentation H2 production. Currently,
carbohydrate-rich waste and wastewater, such as food manufacturing wastes, cheese whey, sugar factory
wastewater, among others, appear to be suitable feedstocks for the production of H2. Biohydrogen
production have been investigated via batch experiments using solutions of simple carbohydrates such
as glucose, arabinose and sucrose. Usually fermentative H2 production follows two main metabolic
pathways: the acetate pathway where the theoretical biogas composition is around 67% of H2; and the
butyrate pathway, 50% of H2 (P. C. Hallenbeck, 2009).
In glycolysis, glucose is broken down to pyruvate, generating ATP and NADH. Pyruvate is then
converted to acetyl-CoA, and depending upon the microrganism, this pathway can follow two ways: the
formate production, through the PFL pathway; or the production of reduced ferredoxin and CO2, through
the PFOR pathway (P. C. Hallenbeck, 2009).
Formate can be converted to hydrogen and CO2, by either the formate hydrogen lyase pathway,
which contains a [NiFe] hydrogenase (the Ech hydrogenase) or possible in some other organisms another
pathway which contains a formate dependent [FeFe] hydrogenase. Organisms which only have the
pyruvate formate lyase (PFL) pathway cannot access NADH for hydrogen production and thus are limited
to 2 mol of hydrogen per mole of glucose. In another way organisms that use the pyruvate oxidoreductase
(POR) pathway can potentially derive some hydrogen from NADH oxidation using different [FeFe]
hydrogenases (P. C. Hallenbeck et al., 2012).
NADH, generated during glycolysis, is oxidized through the production of various reduced carbon
compounds, such as ethanol and butyrate. They can be used in another pathway to produce H2. Excess

1.Chapter State of Art
25
NADH is used to produce other reduced fermentation products. In both cases, acetyl-CoA can also be
used to produce ATP in another pathway to produce H2 Figure 2 (P. C. Hallenbeck et al., 2012).
Figure 2. Hydrogen producing fermentation pathways involved in glucose and arabinose fermentation, in mixed cultures, obtained from (Abreu et al., 2012).
Several studies reported that extreme thermophilic bacteria, such as Caldicellulosiruptor
saccharolyticus, approach the theorical maximum yield of 4 mol H2 mol-1 (glucose) (Costa, Oliveira,
Pereira, Alves, & Abreu, 2015).
The highest hydrogen yield (HY) possible, from the breakdown of 1 mol of glucose is obtained
through the acetate pathway which generates 2 mol of acetate and 4 mol of H2 (Reaction 1)).

Production of biohydrogen from dark fermentation of organic wastes
26
This stoichiometric HY is only reached under near-equilibrium conditions, which implies slow
growth rates at very low partial pressures of H2, that is very difficult to achieve (P. Hallenbeck, 2002). In
fact, experimental HYs were largely lower than the maximum theoretical value for dark fermentation. The
discrepancy between the experimental and theoretical values of HY can be explained by: (i) several
metabolic pathways that can improve the H2 production yield while several other pathways can consume
it; (ii) a fraction of the substrate is consumed for biomass production; (iii) a fraction of H2 produced is
consumed for the production of other by-products (Costa et al., 2015).
When butyrate is the fermentation product, the maximum hydrogen theoretical yield becomes 2
mol of H2 per mol of glucose consumed, according to the Reaction 2.
Homoacetogenic bacteria had the capacity to consume H2 to produce acetate as shown in
Reaction 3).
Several studies reveal that higher concentration of propionate was often associated with lower
H2 production (Arriaga, Rosas, Alatriste-Mondragón, & Razo-Flores, 2011; Lee, Lin, & Chang, 2006)
because the propionate fermentation (Reaction 4)), consumes the substrate and the H2 lowering the HYs.
Several authors have demonstrated that a fraction of the substrate may be also converted to lactate
without the production of H2 (Fritsch, Hartmeier, & Chang, 2008; Peintner, Zeidan, & Schnitzhofer,
2010). Thus leading to a further decrease in experimental HYs compared to the theoretical values for
acetate and butyrate pathways. The metabolism shifted from lactate reduce the dissolved H2
concentration and decrease the pH below 6.

1.Chapter State of Art
27
1.3 Bioreactors for hydrogen production
1.3.1 Type of Bioreactors
Bioreactors are necessary for the production of hydrogen by dark-fermentation. The design of the
reactor and optimization of operation are essential for the process efficiency. The reactors used for the
production of hydrogen through the anaerobic fermentation processes can operate in two ways: batch or
continue.
Continuous reactors are usually preferred than batch reactors for full scale applications because, if
well designed and operated, they may give continuous biohydrogen production under steady-state
conditions, avoiding the feeding and emptying steps of batch reactors (Show, Lee, & Chang, 2011).
The fermentative production of hydrogen in continues processes can also occur in immobilized
systems or in suspension (Oh, Iyer, Bruns, & Logan, 2004). The systems in suspension allow a better
transference of mass between the substrates and the microorganisms. However, for lower HRT is very
likely to occur washout of hydrogen producer bacteria (C. C. Chen, Lin, & Chang, 2001).
There are various types of reactors with several advantages and disadvantages for the production of
hydrogen by microorganisms, such as continuously stirred tank reactor (CSTR), granular sludge bed
reactor (EGSB), anaerobic granular sludge bed (AnGSB), anaerobic fluidized bed reactor (AFBR), up-flow
anaerobic sludge bed (UASB) and anaerobic filter (AF).
The CSTR is a very usual reactor once it has a simple construction, easy operation, easy control of
temperature and pH, and allows o homogeneous mix (Abreu, 2011). These are usually used for the
optimization of continue production of hydrogen through the various substrates. The specific configuration
of a particular type of reactor can influence the fermentation process through the retention of biomass
(N. Ren et al., 2011). Several studies demonstrate, for example, that an attached-sludge CSTR is more
stable than a suspended-sludge CSTR. This related to pH, efficiency in the utilization of substrate and in
production of hydrogen and others metabolites, once it manages to maintain elevated concentrations of
biomass that confers resilience (N. Ren et al., 2011; N.-Q. Ren, Tang, Liu, & Guo, 2010).
An AnGSB has a high capability of hydrogen production compared with the traditional CSTR (Lo, Lee,
Lin, & Chang, 2009). Comparing a CSTR to an AFBR in a suspended and immobilized cells system, the
formation of biofilms granules increase the retention of biomass that is proportional to the hydrogen
production rate (Show et al., 2010). In this way, the hydrogen production raises in reactors that support
the biofilms formation opposing to those where the growth is in suspension. The UASB and AF reactors
have a stable performance for lower HRT (Kongjan & Angelidaki, 2010). The formation of granules and

Production of biohydrogen from dark fermentation of organic wastes
28
biofilms allows to maintain the concentrations of biomass even for the organisms of lower growth (N. Ren
et al., 2011). The principal operational parameters of the reactors are: substrate concentration (feed),
chemical oxygen demand (CDO), pH, hydrogen partial pressure (p(H2)), flow, temperature,
microorganisms rate and HRT (N. Ren et al., 2011).
Although there are several current studies about the production of hydrogen through different types
of reactors, a direct comparison between the performances of the different types is not possible because
the operational parameters, as well as its configurations, are quite different in the diverse studies (Abreu,
2011).
1.3.2 Type of inoculum
In biohydrogen production, it is frequent to use mixed cultures of microorganisms instead of pure
cultures, once it brings more advantages to an industrial scale. The control and operation of the process
is facilitated because medium sterilization is not required, reducing the overall cost and allowing a wide
choice of feedstocks (Valdezvazquez, Riosleal, Esparzagarcia, Cecchi, & Poggivaraldo, 2005). For the
production of biohydrogen, it is very important the control of microbial consortia to obtain the best yields.
The pH condition in the bioreactor, is very important for biohydrogen production, maintaining a different
microbial consortia (parameter that be around 5.5–6.5) (Z. Liu et al., 2013). However, depending on the
complexity of the substrates to be fermented, several microorganisms are involved, leading to different
H2 yields.
An important issue about mixed cultures is the necessity to avoid the development of hydrogen-
consuming microorganisms in the bioreactor (Z. Liu et al., 2013). The viability of the process can be
reduced by non-hydrogen producing species such as methanogens, homoacetogens and lactic acid
bacteria that could eventually lead to process failure (Abreu, 2011). To minimize this problems, the
pretreatment of the inoculums, the maintenance of environmental and operational conditions, will favor
the growth of hydrogen producing species (Abreu, 2011). Hydrogenotrophic methanogens might be still
active under acidic conditions, and one possible controlling approach is to maintain the hydrogen
fermentation under thermophilic condition. Several studies demonstrate that the operation of the reactors
under thermophilic condition leads to greater production of hydrogen.(Chu et al., 2008; H. Zheng, Zeng,
& Angelidaki, 2008).

1.Chapter State of Art
29
1.3.3 Advantages of using granular-sludge systems
In granular sludge systems cell immobilization occur, under certain conditions, in the absence of
a support material by self-aggregation of anaerobic microorganisms into granules. A major disadvantage
in hydrogen producing granule formation is the long start-up period, which requires several months (Mu
& Yu, 2006). An attractive alternative to this problem is to use engineering microbial mixed communities
that already form anaerobic granules, by means of environmental pressure, towards improved hydrogen
production. The bacterial community structure of hydrogen-producing systems have been characterized.
Several studies report diverse mesophiles and thermophiles affiliated with the classes Clostridia and
Bacilli in the phylum Firmicutes (Wu et al., 2006). However, there are only a few studies on community
structure of hydrogen-producing anaerobic microflora at temperatures higher than 60 °C (Othong,
Prasertsan, Karakashev, & Angelidaki, 2008; Yokoyama et al., 2007).
Processes using seed sludge are usually preferred for pilot scale application because they are
easier to operate and control compared to pure cultures (Li & Fang, 2007). They contain a large diversity
of microorganisms, including H2 producers and H2 consumers like methanogens (Wong, Wu, & Juan,
2014). For this reason, the sludge is usually pre-treated to suppress H2 consumers before to be used as
inoculum in the bioreactors. One of the most important characteristics of H2 producing bacteria is that
they are usually spore-forming conducing to a better chance to survive under hard conditions of
temperature and pH, compared to H2 consumers, which are usually non-spore-forming (Wong et al.,
2014).
1.3.4 Feedstocks and nutrients requirement
For the production of hydrogen, through fermentative processes, there are several renewable
feedstocks that can be used allowing a sustainable production without environmental consequences,
such as lignocellulosic materials, industrial organic waste and domestic waste. All of these substrates
have a low commercial value, making the production of composts, as the hydrogen, a valuable utility for
mankind (Fernandes, Peixoto, Albrecht, Saavedra del Aguila, & Zaiat, 2010).
The most common sugars used for production of hydrogen by fermentative processes are
glucose, sucrose, xilose, arabinose and lactose. They are simple sugars and therefore readily
biodegradable and commonly used as model substrates (Engenharia, 2011; Z. Liu et al., 2013). A great
diversity of microorganisms have the capability of using simple sugars to produce H2 through metabolic
processes such as dark fermentation (Z. Liu et al., 2013). Carbohydrates are the main source of hydrogen

Production of biohydrogen from dark fermentation of organic wastes
30
during fermentative processes, and for that reason waste such as food wastes, and biomass are
nowadays potential feedstocks for biohydrogen generation. They are very complex materials consisting of
carbohydrates, proteins and lipids and are abundant organic materials in cities and in the food industry
(Z. Liu et al., 2013). Feedstocks such as molasses, cassava stillage and olive pulp had also been used
for hydrogen and methane fermentation (Luo et al., 2010; Park, Jo, Park, Lee, & Park, 2010).
Lignocellulosic materials can also be used as renewable feedstock for fermentative hydrogen
production. This includes agricultural residues, such as sugar cane and wheat straw and forestry residues,
such as wood trimmings (Abreu, 2011; N. Ren et al., 2011). These materials possess high levels of
carbohydrates polymers such as cellulose and hemicellulose, which are tightly bonded to lignin. These
polymers are hydrolised and function as sugar sources, such as pentoses and hexoses, which have a
high potential in biofuel production (N. Ren et al., 2011).
One possible feedstock to use for biohydrogen production is Sargassum sp., a genus of brown
macroalgae that is very abundant in the Portuguese coastline during spring, summer and autumn. This
macroalgae is a carbohydrate-rich source and have many advantages, for example its cultivation does
not involve the use of feed, fertilizer, pesticides or other chemicals. The macroalgae growth is fuelled only
by natural nutrients in seawater as well as solar energy and carbon dioxide. Moreover, macroalgae contain
easily hydrolysable sugars and proteins, low fractions of lignin and high fractions of hemicellulose and a
good hydrolysis yield making this biomass suitable for anaerobic fermentation (Nkemka & Murto, 2010).
The energy potential of marine biomass is estimated to be more than 100 EJ yr-1, significantly higher
than the terrestrial biomass (22 EJ yr-1) or municipal solid waste (7 EJ yr-1) (Costa et al., 2015).
The choice of the feedstock used for fermentative biohydrogen production is influenced by
availability, cost, carbohydrate content, biodegradability and concentration of inhibitory compounds
(Abreu, 2011).
Currently there are several ethical problems associated with the use of food as a feedstock for the
production of hydrogen as biofuel. As it was mentioned, it is possible to produce hydrogen through
industrial and agricultural waste meaning that there is a viable alternative to the process (Abreu, 2011).
For hydrogen production through fermentation processes it is necessary nutrients for bacterial
metabolism, growth and activity. The principal nutrients required are nitrogen, phosphate and some trace
elements such as magnesium, sodium, zinc and iron (Abreu, 2011).

1.Chapter State of Art
31
1.4 Parameters influencing the activity of hydrogen-producing bacteria
1.4.1 pH Control
The pH is one of the parameters that should be controlled in the bioreactors once it affects the
growth rate of microorganisms. pH variations can cause changes in the microbial constitution of
consortium that will change the production rate of hydrogen. The pH affects the microorganism
metabolism in the carbon and energy sources utilization levels, in the synthesis reactions and in the
extracellular metabolites production.
It is necessary to know which pH maximizes the global efficiency of the process, knowing that
the different species of bacteria presents a maximum activity in different pH values. The methanogenic
bacteria have high activity for pH between 6.6 and 7.6 (Zehnder, Huser, Brock, & Wuhrmann, 1980). As
previously mentioned, for the production of hydrogen is necessary to maintain the bioreactor pH between
5.5 and 6.2 avoiding the activity of bacterial species that consume hydrogen such as methanogens. In
this range of pH is intended to, simultaneously, favor the activity of hydrogen producers bacteria. The
control of pH can be realized by adding sodium bicarbonate (NaHCO3) to the feeding.
1.4.2 Temperature control
Temperature is, also, an important parameter in bioreactors control because it influences the
activity of hydrogen-producing bacteria. Dark fermentation is an anaerobic process that is controlled by
temperature and takes place in a wide range. Fermentation, under extreme thermophilic conditions (70°
C), started to attract attention due to: much better pathogen destruction for residues coming from
anaerobic fermentation process; lower risk of contamination with methanogenic organisms (Van
Groenestijn, Hazewinkel, Nienoord, & Bussmann, 2002) and higher rate of hydrolysis (Lu, Gavala,
Skiadas, Mladenovska, & Ahring, 2008); and higher hydrogen yield (Kádár et al., 2004).
Hydrogen production with mixed cultures can be performed under mesophilic (26-40°C) or
thermophilic (45-60°C) conditions. However, nowadays many researchers prefer termophilic conditions
because the risk of contamination by methanogenic archaea is lower and allows a more extensive
destruction of pathogens (Van Groenestijn et al., 2002).
Biohydrogen fermentation at extreme thermophilic temperatures (over 70°C) is more
thermodynamically advantageous over mesophilic fermentation. Allowing a greater yield of hydrogen

Production of biohydrogen from dark fermentation of organic wastes
32
production, and at higher temperatures, the effect of hydrogen partial pressure is less significant (Abreu,
2011).
1.4.3 Hydraulic retention time (HTR) control
Hydraulic retention time (HRT) corresponds to the ratio between the volume of the reactor and
the volumetric flow. It can also be defined by the inverse of the dilution rate (D) (Abreu, 2011). The HRT
is an important parameter in bioreactor control. The ideal HRT depends on the operational conditions
such as substrate, type of inoculum and temperature. Only the microbial populations with growth rates
larger than the dilution rate (μmax > D) can remain in the reactor, so this is a very important control
(Abreu, 2011). One of the possibilities to obtain the best yield in hydrogen production by dark fermentation
is to decrease the HRT and verify the changes in the microbial population and yield of hydrogen over
time.
1.4.4 Hydrogen partial pressure (p(H2))
Hydrogen partial pressure (p(H2)) is an important parameter in biohydrogen production, since it
affects thermodynamic equilibrium of the reaction involving the reversible oxidation of the coenzyme
nicotinamide adenine dinucleotide (NAD), which is a coenzyme produced by the microorganisms that
plays a fundamental role in the pathway of molecular H2 production (Reaction 5)).
p(H2) is an extremely important factor for continuous hydrogen synthesis because the metabolic
pathways of biohydrogen production are very sensitive to hydrogen concentrations and are subject to end-
product inhibition. When hydrogen concentration in the liquid increases, the re-oxidation of reduced
ferredoxin and hydrogen carrying enzymes become less favourable leading to a decrease of hydrogen
production. This way the metabolic pathways shift to the production of more reduced substrates such as
lactate, ethanol, acetone, butanol, or alanine (Abreu, 2011).
When the H2 partial pressure is less than 102 Pa at 25 °C, NADH2 can be re-oxidised and the
reaction (5) can proceed from the right to the left (Ruzicka, 1996). It was reported that simple sugars, as
glucose and sucrose showed higher p(H2) than real wastewater and more complex carbohydrates,
probably because the maximum p(H2) depends on the complexity of carbohydrates present in the
substrate (W. Chen, Chen, Kumarkhanal, & Sung, 2006).

1.Chapter State of Art
33
1.5 Importance of hydrogen storage materials
Nowadays, energy storage has become an extremely important issue, once the energy sources
such as fossil fuels and natural gas are not infinitely available. Hydrogen is one of the most promising
alternative as energy source, so the search for new hydrogen-storage methods has become an important
aspect in hydrogen energy applications.
Currently, hydrogen storage is being done on a larger scale in order to develop safe, reliable,
compact and cost-effective materials which can be used for fuel cell technology. Some of the most
innovating ways to store hydrogen are compressed hydrogen, liquid hydrogen and storage material (Niaz
et al., 2015).
Hydrogen can be stored in vast variety of materials under diverse conditions of pressure and
temperature; or it can be made to store in case of certain materials using the process of chemical storage;
or by physisorption. This process involves molecular adsorption, diffusion, chemical bonding and Van der
Waals attraction and dissociation.
The most widely studied materials are porous materials, such as carbon materials (nanotubes),
zeolites and many others (Niaz et al., 2015).
1.5.1 Zeolites
Zeolites is one of the most promising material for hydrogen storage. The word “Zeolites” derived
from the two Greek words “zeo”, meaning “to boil”, and “lithos”, meaning “stone”. It is a large class of
highly crystalline aluminosilicate materials, defined by a network of linked cavities and pores, with a
variety of molecular dimensions that gives rise to their molecular sieving properties (Figure 3) (Niaz et al.,
2015). They are used in various industrial applications, such as separation of hydrocarbons and the
removal of impurities from gas streams (Niaz et al., 2015).
Currently, zeolites are used for treatment of wastewater contaminated with metals since it have
positively charged exchangeable ions, which can be replaced by heavy metals. Due to this net negative
charge, zeolites have a strong affinity for transition metal cations but, much lower affinity for anions
allowing the removal of metals from contaminated water (Silva, Figueiredo, Quintelas, Neves, & Tavares,
2012).
The adsorption of gases by zeolites occur by physisorption where the H2 molecules gated weakly
adsorbed at the surface of the material. Recently, physisorption has attracted more attention because the
adsorption is reversible and thus the adsorbent can be recycle and offers the possibility of high hydrogen-

Production of biohydrogen from dark fermentation of organic wastes
34
storage capacity and quick desorption (Barrer & Vaughan, 1967). This process has many advantages,
such as the low cost, susceptible to impurities, possess low reversible gravimetric capacity and undergoes
desorption at higher temperatures (600 K) (Niaz et al., 2015).
Previously studies revealed that zeolites contain sodalite cages, so the H2 is forced to move into
the cavities of the molecular sieve under elevated temperatures and pressure (Barrer & Vaughan, 1967).
It was described that under the conditions of 573 K and 10.0 MPa the hydrogen storage capacity it is 9.2
cm3 g-1 (Niaz et al., 2015). The principal advantages of this material is the high thermal stability, low cost
and adjustable composition (Langmi et al., 2005). Many parameters affect the hydrogen storage in
microporous materials, including the specific surface area, the interaction of molecular hydrogen with the
internal surfaces of the micropores, the stability of the molecular adducts and the optimal storage
temperature (Zecchina et al., 2005).
The most important factor is the channel diameter that determine the hydrogen capacity under
high pressure. An effective porous hydrogen-storage material should possess a large pore volume and a
channel diameter close to the kinetic diameter of the hydrogen molecule (dH= 2.89Å) (Dong, Wang, Xu,
Zhao, & Li, 2007). Nowadays, there are three principal families of synthetic zeolites A,X,Y.
Figure 3. (a) Schematic representation of a pore of the zeolite NaX. (b) SEM images of zeolites NaX (Dong et al., 2007).
a. b.

35
2. CHAPTER OBJECTIVE


2.Chapter Objective
37
The main goal of this project is to develop an efficient system for the generation of biohydrogen
using dark fermentation process from organic wastes. The fermentative process will be conducted in
EGBS reactors at extreme thermophilic conditions (70°C) for a high hydrogen production and carried out
by a mixed microbial consortium (anaerobic sludge). The zeolites effect on biohydrogen production
performance, in batch and continuous mode will be evaluated with glucose and arabinose as substrate
and with the marine biomass, Sargassum sp., as substrate.


39
3. CHAPTER MATERIAL AND METHODS


3.Chapter Material and Methods
41
3.1 Zeolites
The zeolites used in this work were obtained from Sigma Aldrich and consisted of the type 13X
with a composition of 1 Na2O: 1 Al2O3: 2.8 ± 0.2 SiO2: xH2O (Figure 4). The sodium form represents the
basic structure and have an effective pore opening in the 910¼ range. In the table 1 are represented the
principal characteristics of zeolites 13X.
Figure 4. Zeolites of NaX family, correspondent of type 13X.
Table 1. Principal characteristics of zeolites 13X.
3.2 Hydrogen production assays with simple sugars
3.2.1 Inoculum
Anaerobic granular sludge from a brewery industry was used as inoculum in the hydrogen
production assays. The sludge contained a volatile solids (VS) concentration of 0.08 ± 0.01 g g-1.
3.2.2 Experiment Set-up with simple sugars
Batch experiments were performed in two different medium: a complex medium containing 0.75
g L-1 HK2PO4, 1.5 g L-1 K2HPO4, 20 mL L-1 trace-elements stock solution (H+ and OH-), 15 mM BES, 0.6
Type Form Bead or particle size
Regeneration temperature (°C)
Pore diameter (Å)
13X Bead 4-8 mesh 200-315 10

Production of biohydrogen from dark fermentation of organic wastes
42
mL g-1 (COD) of macronutrients, 10 mM Sodium bicarbonate and a simple medium containing 15 mM
BES, 0.6 mL g-1 (COD) of macronutrients and 10 mM Sodium bicarbonate. The initial biomass
concentration was approximately 7.72 g L-1 of volatile suspended solids.
The batch experiments were conducted in 120 mL serum bottles, with a working volume of 56
mL. The pH of the medium was adjusted to 7.0-7.2 with NaOH or HCL 2 mol L-1. Two different substrates
were used, L-Arabinose and Glucose monohydrated, both in a final concentration of 12.5 mM. The bottles
were sealed and the headspace flushed with N2. Cysteine, in a final concentration of 1 g L-1, was used to
reduce the medium. The bottles were incubated at 70 °C and each experiment was conducted in
triplicate.
The zeolite ratios used in this experiment are described in Table 2. In this experiment, were also
included a blank assay without biomass (substrate + zeolites) and a control without zeolites (biomass +
substrate). The hydrogen, accumulated in the headspace of the sealed bottles, was measured by gas
chromatography (GC) and the soluble fermentation products and residual arabinose and glucose were
measured by high performance liquid chromatography (HPLC).
Table 2. Ratios zeolites and biomass (g g-1 (VS)) tested in batch assays performed with simple sugars and with Sargassum sp..
Zeolites (g) Biomass g (VS) L-1 Ratios (g (zeolite) g-1 (VS) biomass) 0.09 7.72
0.26
0.06 7.72 0.13
0.03 7.72 0.065
3.3 Hydrogen production assays with Sargassum sp.
3.3.1 Inoculum
Anaerobic granular sludge from a brewery industry was used as inoculum in the hydrogen
production assays. The sludge contained a VS concentration of 0.08 ± 0.01 g g-1.

3.Chapter Material and Methods
43
3.3.2 Residue characterization
Sargassum sp. was collected in the spring of 2013 from a location in the north coastline of
Portugal (Póvoa de Varzim). The macroalgae was dried at room temperature and then milled into pieces
with less than 0.5 cm according to (Costa et al., 2015). Sargassum sp. biomass was characterized in
terms of total and soluble Chemical Oxygen Demand (COD), total solids (TS), volatile solids (VS), Total
Kjeldahl Nitrogen (TKN), fat content, Klason lignin, glucan and xylan content Table 3. A pre-treatment was
applied to increase the soluble COD. Therefore Sargassum sp. was autoclaved at 121 °C and 1 bar for
10 min, after autoclaving the soluble COD increased 10x, corresponding to more than 25% of the total
COD (Costa et al., 2015).
Table 3. Characterization of Sargassum sp. obtained from (Costa et al., 2015).
Sargassum sp.* Before autoclave After autoclave
CODtotal (mg g-1) 600 ± 62 562 ± 84 CODsoluble (mg g-1) 15 ± 0 154 ± 1 TS (mg g-1) 896 ± 2 VS (mg g-1) 490 ± 8 TKN (mg N g-1) 20 ± 0 Fat content (mg g-1) 13 ± 0 Klason Lignin (%VS) 3.3 ± 0.9 Glugan (%VS) 32.9 ± 2.6 Xylan (%VS) 11.7 ± 1.3
*Macroalgae dried at room temperature and milled into pieces with less than 0.5 cm.
3.3.3 Experiment set-up
Batch experiments were performed in a simple medium containing 0.6 mL g-1 (COD) of
macronutrients, 10 mM Sodium bicarbonate and 15 mM BES. The initial biomass concentration was
approximately 7.72 g (VS) L-1 of volatile suspended solids. The batch experiments were conducted in 120
mL serum bottles, with a working volume of 59 mL. The pH of the medium was corrected to 7.0-7.2 with
NaOH or HCL 2 mol L-1.Three different concentrations of Sargassum sp. described on Table 4, were
tested. The bottles were sealed and the headspace flushed with N2. Cysteine at final concentration of 1
g L-1 was used to reduce the medium. The bottles were incubated at 70 °C and each experiment was
conducted in triplicate. A blank assay to discount for the residual substrate present in the inoculum were
also performed. Total and soluble COD of Sargassum sp. were determined at the beginning and end of

Production of biohydrogen from dark fermentation of organic wastes
44
the assay. The hydrogen accumulated in the headspace of the closed bottles was measured by gas
chromatography (GC) and the soluble fermentation products were measured by HPLC.
Table 4. Ratios of biomass/Sargassum sp. tested on batch assays.
Residue (g (VS) L-1) Biomass (g (VS) L-1) Ratios (g (VS) biomass g-1 (VS) residue)
15 7.72 0.51
10 7.72 0.77
5 7.72 1.54
3.3.4 Experiment set-up with Zeolites
Batch experiments were performed with a simple medium containing 0.6 mL g-1 (COD) of
macronutrients, 10 mM Sodium bicarbonate, 15 mM BES. The initial inoculum concentration was
approximately 7.72 g (VS) L-1 of volatile suspended solids. The batch experiments were conducted in 120
mL serum bottles, with a working volume of 59 mL. The pH of the medium was adjusted to 7.0-7.2 with
NaOH or HCL 2 mol L-1. For this assay, it was used the ratio 1.54 g (VS) biomass g-1 (VS) Sargassum sp.
since it was the best yield in the previous batch assay. The bottles were sealed and the headspace flushed
with N2. Cysteine at final concentration of 1 g L-1 was used to reduce the medium. The bottles were
incubated at 70 °C and each experiment were conducted in triplicate. The ratios of zeolites and biomass
used are described in the Table 2. A blank assay to discount the hydrogen produced from the residual
substrate present in the inoculum and a control without zeolites (biomass + substrate) were also
performed. Total and soluble COD of Sargassum sp. were determined at the beginning and end of the
assay. The hydrogen accumulated in the headspace of the closed bottles was measured by gas
chromatography (GC) and the soluble fermentation products were measured by HPLC.
3.4 Operation of the Hydrogen producing reactors
3.4.1 Inoculum
Anaerobic granular sludge from a brewery industry was previously acclimated for two months on
an EGSB reactor at extreme thermophilic conditions and pH 5.5 in order to select hydrogen producers.
The collected granular sludge was used as inoculum for the EGSB reactors. The sludge contained a VS
concentration of 0.08 ± 0.01 g g-1. One bioreator was operated with arabinose and glucose as carbon

3.Chapter Material and Methods
45
source, RA + G, and another with only glucose RG. In both operations the bioreactor was inoculated with
300 mL of anaerobic granular sludge.
3.4.2 Glucose and Arabinose reactor
The continuous experiments were carried out in EGSB reactor made of stainless steel with an
internal diameter of 5.65 cm. Total liquid volume was 2.68 L inclusive reaction-zone volume of 2.14 L.
The EGSB reactor was operated with a stable temperature of 70 ± 1 °C by means of an external jacket
for water circulation. The EGSB reactor designed by RA + G was operated in a continuous mode for 72
days and feed with Glucose monohydrated and L-Arabinose with a ratio 1:1 (w/w) at final concentration
of 4.4 g COD L-1. The feedstock was supplemented with macronutrients, with the following composition:
MgSO4.6H2O; KH2PO4; NH4CL; KCL. The macronutrients were added to the influent feed by addition of
0.6 ml g-1 COD fed. The feedstock was stored at 4 °C, to minimize acidification. During the first month
of continuous mode, RA + G was operated with a hydraulic retention time (HRT) of 12h and then decreased
for 6h. After reached a critical value of hydrogen production, a ratio 0.26 g zeolites g-1 (VS) biomass was
introduced in the reactor. The continuous operation occurred for 22 days at a HRT of 6h, to determine
the effect of zeolites in a continuous hydrogen production. The pH of the bioreactor was maintained at
5.5. The hydrogen produced was measured by gas chromatography (GC) and the soluble fermentation
products and residual arabinose and glucose were measured by HPLC.
3.4.3 Glucose reactor
An EGSB reactor was operated in a continuous mode for 19 days and feed with Glucose
monohydrated at final concentration of 4 g COD L-1. The feedstock was supplemented with 0.6 mL g-1
COD fed macronutrients with the same composition and stored at 4 °C.
During the first 7 days of continuous mode, RG was operated with a hydraulic retention time (HRT)
of 12h and then decreased to 6h. After 7 days at this HRT a ratio 0.26 g zeolites g-1 (VS) biomass of
zeolites was applied to the bioreactor. The continuous operation occurred for 5 days, at a HRT of 6h, to
verify the effect of zeolites on continuous hydrogen production. The pH of the bioreactor was maintained
at 5.5. The hydrogen produced was measured by gas chromatography (GC) and the soluble fermentation
products and residual glucose were measured by high HPLC.

Production of biohydrogen from dark fermentation of organic wastes
46
3.5 Analytical methods
Determinations of Total and soluble COD of Sargassum sp. were realized using a standard kits
(Hach Lange, Düsseldorf, Germany). Hydrogen and methane concentration in batch assays and in
continuous operation was determined by GC using a column molsieve (MS-13 x 80/100 mesh) and
thermal conductivity detector Bruker Scion 456 Chromatograph, (Bruker, Massachusetts, USA) with
argon (30 mL min-1) as the carrier gas. The injector, detector and column temperatures were 100, 130,
and 35 °C, respectively. VFA, lactic acid and sugars (arabinose; glucose) were determined by high
performance liquid chromatography using an HPLC (Jasco, Japan) with an Aminex ® column (HPX-87H
Ion 300 mm x 7.8 mm2); Sulfuric acid (0.01 N) at a flow rate of 0.7 mL min-1 was used as mobile phase.
Column temperature was set at 60 °C and was used a retention time of 50 min. Detection of VFA’s and
lactic acid was made through a UV detector at 210 nm, and the detection of glucose and arabinose was
made by using an RI detector.
3.6 Molecular Methods
3.6.1 PCR-DGGE and Sequencing
Representative granular sludge samples were collected from the EGSB reactor after and before
zeolites addition and stored at -20°C. Total genomic DNA was extracted from approximately 500 μL of
sample by using the FastDNA SPIN kit for soil (MP Biomedicals LLC, Santa Ana, CA). 16S rRNA gene
fragments of approximately 450 bp were amplified for DGGE analysis by PCR using a Taq DNA
polymerase kit (ThermoFisher ScientificTM) and the primer set 968-f (5’- AAC GCG AAG AAC CTTAC-3’)
plus GC-Clamp (5’-CGC CCG GGG CGC GCC CCG GGC GGG GCG GGG GCA CGG GGG G-3’) described
by (Muyzer, de Waal, & Uitterlinden, 1993) and 1401-r (5’-CGG TGT GTA CAA GAC CC-3’), as previously
described by (Nübel et al., 1996).
The size of the obtained PCR products was checked by comparison with appropriate size and
mass standard (Thermo Scientific Gene ruler 1 Kb Plus DNA ladder), by electrophoresis on 1% (w/v)
agarose gel and SYBR® Safe staining. Gels ran at a constant voltage of 100 V in an agarose gel
electrophoresis system (Bio-Rad mini-sub® Cell GT).
Nucleic acids were detected through an UV transilluminator (BioRad, Hercules, CA, USA). DGGE
analysis of the amplicons was done by using the DCode system (Bio-Rad). PCR products were
electrophoresed in a 0.5 × Trisacetate-EDTA buffer for 16 h at 85 V and 60°C on polyacrylamide gel (8%)
3.Chapter Material and Methods
47
containing a linear gradient ranging from 30% to 60% denaturant. Silver staining of DGGE gels was
performed as previously described by (Sanguinetti, Dias Neto, & Simpson, 1994). DGGE gels were
scanned at 400 dpi and the profiles compared by using the Bionumerics 5.0 software package (Applied
Maths, Gent, Belgium). The diversity of the similarity indices (Si) of the compared profiles was determined
by clustering analyses using Dice correlation. DNA amplications were sequenced by illumina, using the
protocol illumina two-step. The bacteria/archaeal primers pair used were 515-f (5’-
AATGATACGGCGACCACCGAGATCTACACXXXXXXXXXXXXATGGTAATTGTGTGYCAGCMGCCGCGGTAA-3’)
and 806-r (5’-CAAGCAGAAGACGGCATACGAGATAGTCAGTCAGCCGGACTACNVGGGTWTCTAAT-3’)
(Caporaso et al., 2012). The data analysis was made by RTL (Research testing Laboratory, Texas, US) in
a homemade pipeline that consists in two major stages, the denoising and chimera detection stage and
the microbial diversity analysis stage.


49
4. CHAPTER RESULTS AND DISCUSSION


4.Chapter Results and Discussion
51
4.1 Biohydrogen dark fermentation with simple sugars
In a first stage of this study, the effect of zeolites on hydrogen production from a mixture of
arabinose and glucose (12.5 mM) was studied in batch reactors with a complex medium and a simple
medium.
4.1.1 Zeolites effect on biohydrogen dark fermentation performed with a complex reaction medium
Cumulative hydrogen production for the ratios 0.26 g zeolite g-1 (VS) biomass and 0.065 g zeolite
g-1 (VS) biomass are shown in Figure 5.The highest hydrogen production, 1.27 mmol H2, was achieved
for the ratio 0.26 g zeolite g-1 (VS) biomass of zeolites. The increase on cumulative hydrogen production
in the presence of 0.26 g zeolite g-1 (VS) biomass was significantly higher (P (bi-caudal) < 0.004223987:
t-test) than the obtained for the control (without zeolites) which reached 0.94 mmol H2. Production of
methane was not detected suggesting an effective inhibition of methanogenic archaea by BES.
Figure 5. Cumulative hydrogen production for each ratio zeolites/biomass tested. The error bars represent one standard deviation of triplicate bottles.
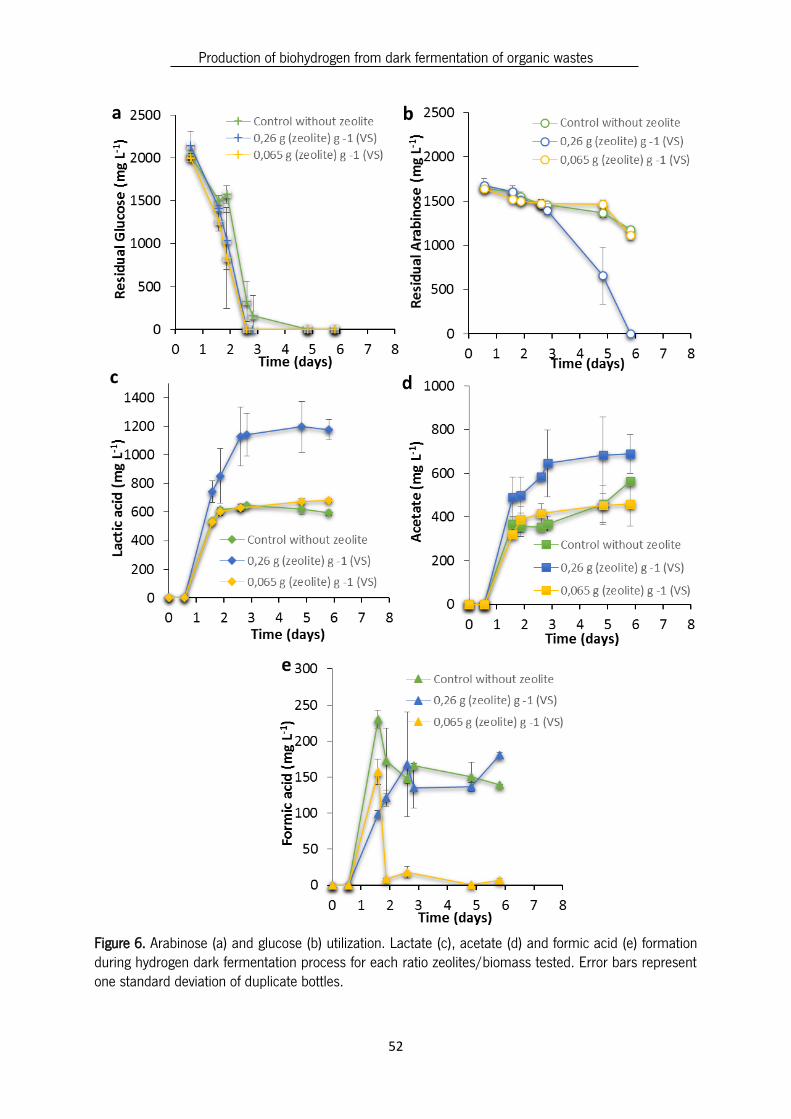
Soluble fermentation products (SFP), released during fermentation, are often used to evaluate
the efficacy of hydrogen production. SFP of all ratios zeolites/biomass and control (without zeolites) are
shown in Figure 6 (c), (d) and (e). Glucose and arabinose utilization is shown on Figure 6. (a) and (b).
The COD balance for each ratio zeolites/biomass indicated that all of the metabolic products were
identified (Table 5).
Production of biohydrogen from dark fermentation of organic wastes
52
Figure 6. Arabinose (a) and glucose (b) utilization. Lactate (c), acetate (d) and formic acid (e) formation during hydrogen dark fermentation process for each ratio zeolites/biomass tested. Error bars represent one standard deviation of duplicate bottles.

4.Chapter Results and Discussion
53
Table 5. Maximum hydrogen partial pressure (p(H2)), maximum hydrogen yield (mmol mmol-1 substrate)
and COD balance (%) obtained for each ratio zeolite/biomass tested and for the control.
Ratios zeolites/biomass
(g g-1 (VS))
Hydrogen partial
pressure (p(H2)) (Pa)*
Hydrogen yield (mmol mmol-1 substrate)
COD balance (%)**
Control without
zeolites
44.2 0.79 116
0.26 50.1 0.89 94
0.065 42.0 0.75 109
*The hydrogen partial pressure shown represents the maximum p(H2) reached during the assay.
**The COD balance shown represents the soluble COD of the detected SFP.
In this study the SFP profile was also analysed in order to understand if the improvement of
hydrogen production by zeolites is related to metabolic changes. Glucose, an easily degradable sugar,
was totally consumed both in the presence and in the absence of zeolites. On the other hand, arabinose
was totally consumed when zeolite was present at a ratio of 0.26 g zeolite g-1 (VS) biomass, but not in
the control without zeolites and with the ratio 0.065 g zeolite g-1 (VS) biomass. The arabinose consumed
in the control assay was 62.9 % and in the assay with the ratio 0.065 g zeolite g-1 (VS) biomass was 59.6
%. Lactic acid was the most prevalent of SFP for the control and ratios of zeolites/biomass tested. The
ratio 0.26 g zeolite g-1 (VS) biomass produced the highest lactic acid concentration (1175.2 mg L-1),
which corresponded to 28 % (in COD) of the detected SFP, because in this case glucose and arabinose
was totally consumed.
The highest acetic acid production was obtained for the ratio 0.26 g zeolite g-1 (VS) biomass
(689.5 mg L-1), which corresponds to the highest H2 yield (0.89 mmol mmol-1 substrate) (Table 5).
Formic acid was detected in the presence and in the absence of zeolites, once the biomass used
consisted of mixed cultures so Enteric bacteria could be present, converting pyruvate to acetyl-CoA and
formic acid. The formic acid was released in lower concentrations than acetic acid in the control and in
the presence of zeolites. As previously mentioned, formic acid is degraded into hydrogen and carbon
dioxide (Figure 2 Chapter 1). The theoretical hydrogen yields obtained from formic acid are lower,
compared to those obtained from acetate production (Sikora, Baszczyk, Jurkowski, & Zielenkiewicz,
2013). The highest HY possible, from the breakdown of 1 mol of glucose is obtained through the acetate

Production of biohydrogen from dark fermentation of organic wastes
54
pathway which generates 2 mol of acetate and 4 mol of H2 (Li & Fang, 2007).Therefore, despite the
formic acid production the produced hydrogen resulted mainly from the acetic acid formed.
4.1.2 Zeolites effect on biohydrogen dark fermentation performed with a simple reaction medium
The effect of zeolites on hydrogen production was also evaluated with a simple reaction medium,
similar to the usually used as bioreactor feedstock. The purpose was to study if in this conditions zeolites
had the same effect on hydrogen production, or if its effect was only related to some component of the
complex medium, and to predict zeolites behaviour in a continuous operation. A new ratio
zeolites/biomass of 0.13 g g-1 (VS), was tested in this assay.
Cumulative hydrogen production for the ratios zeolites/biomass and for the control (without
zeolites) are shown in Figure 7.The highest hydrogen production was achieved for the zeolites ratio of
0.26 g zeolite g-1 (VS) biomass, 0.87 mmol H2, followed by the ratio 0.065 g g-1 (VS) (0.81 mmol H2).
The improvement of hydrogen production was compared by the control (without zeolites) which reached
0.68 mmol H2. The increase on cumulative hydrogen production in the presence of 0.26 g zeolite g-1
(VS) biomass and 0.065 g zeolite g-1 (VS) biomass was significantly higher than the obtained for the
control, P(bi-caudal) <0,00406259: t-test and P(bi-caudal) <3,39155E-05: t-test, respectively. Production
of methane was not detected, suggesting an effective inhibition of methanogenic archaea by BES.
Figure 7. Cumulative hydrogen production for each ratio zeolites/biomass tested. The error bars represent one standard deviation of triplicate bottles.

4.Chapter Results and Discussion
55
Figure 8. Arabinose (a) and glucose utilization (b). Lactate (c), acetate (d) and formic acid (e) formation during hydrogen dark fermentation process, for each ratio zeolite/inoculum tested. Errors bars represent standard deviation of duplicate bottles.

Production of biohydrogen from dark fermentation of organic wastes
56
Table 6. Maximum hydrogen partial pressure (p(H2)), maximum hydrogen yield (mmol mmol-1 substrate)
and COD balance (%) obtained for each ratio zeolite/biomass tested.
Ratios zeolites/biomass
(g g-1 (VS))
Hydrogen partial
pressure (p(H2)) (Pa)*
Hydrogen yield (mmol mmol-1 substrate)
COD balance (%)**
Control without
zeolites
56.2 0.55 84.7
0.26 69.1 0.68 110.8
0.13 57.9 0.57 94.2
0.065 63.2 0.61 93.0
*The hydrogen partial pressure shown represents the maximum p(H2) reached during the assay.
**The COD balance shown represents the soluble COD of the detected SFP.
SFP of all ratios zeolites/biomass tested and control are shown in Figure 8 (c), (d) and (e). Glucose
and arabinose utilization is shown on Figure 8. (a) and (b).
The COD balance for each ratio zeolites/biomass indicated that all of the metabolic products were
identified (Table 6).
Glucose and arabinose were totally consumed in the presence and in the absence of zeolites (Figure
8. (a) and (b)). Acetic acid was the most prevalent of SFP for the control and for each ratios of
zeolites/biomass tested. The highest concentration of acetic acid, 3284.6 mg L1, was achieved for the
ratio 0.26 g zeolite g-1 (VS) biomass, as well as the highest hydrogen yield (0.68 mmol mmol-1 substrate)
(Table 2). The highest lactic acid production was also obtained for the ratio 0.26 g zeolite g-1 (VS) (1489.2
mg L-1). For the other ratios zeolites/biomass and for the control, this fermentation product was produced
in a similar concentration corresponding to approximately 28.9 % (in COD) of the detected SFP.
Formic acid was detected in the presence and in the absence of zeolites, the same as the results
obtained for the batch assays with a complex medium. In this case, formic acid was produced in a high
concentration in the first 3 days of the batch operation, decreasing along time and suggesting that the
metabolism for the formic acid production only occurs in the first days of operation. Therefore, almost
every formic acid was converted to hydrogen and carbon dioxide, decreasing the concentration over time.
Despite the formic acid production, the produced hydrogen resulted, mainly, from the acetic acid
production, since its concentration in the medium was always much higher than formic acid.

4.Chapter Results and Discussion
57
The analysis of the produced SFP does not allowed to obtain a conclusion about the possible
effect of zeolites in hydrogen production. The SFP profile, with a complex and with a simple medium, was
similar, since the same SFP were produced: lactic acid, acetic acid and formic acid.
The hydrogen production obtained in this assay for the ratio 0.26 g (zeolite) g-1 (VS) biomass was
smaller, i.e. 0.86 mmol H2, when compared to the obtained for the batch assay with a complex medium,
1.27 mmol H2 (Figure 5). Differences in lactic acid production can be the explanation because, with a
simple medium, the concentration of this SFP was higher than the obtained for the complex medium,
1489.2 mg L-1 and 1175 mg L-1, respectively. Also, the complex medium was enriched with FeCl3.6H2O
in a final concentration of 0.05 g L-1, that is the cofactor of hydrogenase.
4.2 Biohydrogen dark fermentation of Sargassum sp.
Biohydrogen production from Sargassum sp. was studied, and three ratios biomass/Sargassum
sp. (0.51, 0.77 and 1.54 g (VS) biomass g-1 (VS) Sargassum sp.) were tested.
Cumulative hydrogen production for each ratio biomass/substrate tested is shown in Figure 9.
Figure 9. Cumulative hydrogen production for each ratio biomass/substrate tested. The errors bars represent one standard deviation of triplicate bottles.
The ratios biomass/substrate (Sargassum sp.) tested achieved a similar hydrogen production.
The ratio 0.51 g (VS) biomass g-1 (VS) Sargassum sp. obtained a hydrogen production of 0.67 mmol, the
ratio 0.77 g (VS) biomass g-1 (VS) Sargassum sp., 0.71 mmol and the ratio 1.54 g (VS) biomass g-1 (VS)
Sargassum sp., 0.80 mmol. This results suggest that none of the Sargassum sp. concentrations tested
represent a limit for the hydrogen production.

Production of biohydrogen from dark fermentation of organic wastes
58
Figure 10. Soluble fermentation products (SFP) formed during hydrogen dark fermentation process for each ratio biomass/ Sargassum sp. tested. Error bars represent one standard deviation of duplicate bottles.

4.Chapter Results and Discussion
59
Production of methane was not observed, suggesting an effective inhibition of methanogenic
archaea by BES.
The results obtained for the hydrogen production of Sargassum sp. suggest that the residue
concentration is not the major factor affecting hydrogen production, as previously related by Ângela Abreu.
These authors showed that the inoculum concentration is the main factor for hydrogen production from
Sargassum sp., independently of the ratio inoculum/substrate used. The SFP profile for all ratios
biomass/Sargassum sp. tested are shown in Figure 10.
The COD balance, for each ratio, indicate that all of the metabolic products were identified (Table
7). The highest hydrogen production yield, 3.1 mmol H2 g-1 (VS) Sargassum sp., was achieved for the
ratio 0.51 g (VS) biomass g-1 (VS) residue, corresponding to a hydrogen production of 0.67 mmol and a
Sargassum sp. concentration of 5 g (VS) L-1 (Table 7).
Table 7. Maximum hydrogen partial pressure (p(H2)), maximum hydrogen yield (mmol g-1 (VS) Sargassum
sp.) and COD balance (%) obtained for each ratio biomass/ Sargassum sp. tested.
Ratios biomass/Sargassum sp.
g (VS) g-1 (VS)
Hydrogen partial
pressure (p(H2))
(Pa)*
Hydrogen yield (mmol g-1 (VS) Sargassum
sp.)
COD balance (%)**
0.51 21.8 3.10 112
0.77 22.5 1.59 100.4
1.54 21.3 1.0 114.1
*The hydrogen partial pressure shown represents the maximum p(H2) reached during the assay.
**The COD balance shown represents the soluble COD of the detected SFP.
Acetic acid was the most prevalent of SFP, for all ratios biomass/Sargassum sp. tested. The ratio
0.77 g (VS) biomass g-1 (VS) Sargassum sp. reached the higher acetate concentration (2337.3 mg L-1).
As showed in Figure 10, the highest lactate concentrations were obtained for the highest
Sargassum sp. concentrations used. Lactic acid was produced in a higher concentration for the ratios
0.77 g (VS) biomass g-1 (VS) Sargassum sp. (1269 mg L-1) and 1.54 g (VS) biomass g-1 (VS) Sargassum
sp. (481.5 mg L-1). The lower lactic acid concentration was achieved for the ratio 0.51 g (VS) biomass g-
1 (VS) Sargassum sp. (40.9 mg L-1). As previously mentioned, when hydrogen partial pressure is high,
the NADH can be used by lactate dehydrogenase to produce lactate instead of acetate and hydrogen (van
de Werken et al., 2008). The hydrogen production achieved for the ratio 0.51 g (VS) biomass g-1 (VS)

Production of biohydrogen from dark fermentation of organic wastes
60
Sargassum sp. was similar to those obtained on the other ratios tested. These results suggest that for
higher concentrations of Sargassum sp., the NADH is used for lactate production in high quantities, not
allowing to reach higher hydrogen productions.
The metabolite analyses revealed the presence of various fermentation products in the final of
the assay, underlining the presence of different metabolic pathways producing and consuming H2. The
SFP profile acquired for biohydrogen production of Sargassum sp. was very different than the obtained
from glucose and arabinose fermentation. The propionic acid, n-butyric acid and the iso-butyric acid were
produced has a result of using a complex residue as substrate, leading to a different range of fermentation
products. The metabolic pathway for iso-butyric acid production is one of the most important road for
hydrogen production (Barca, Soric, Ranava, Giudici-Orticoni, & Ferrasse, 2015).
The highest propionate concentration was achieved for the ratio 1.54 g (VS) biomass g-1 (VS)
Sargassum sp. (618.6 mg L-1). Several authors found that higher concentration of propionate are often
associated with lower H2 production, because the propionate fermentation consumes substrate and
hydrogen, lowering the HY (Barca et al., 2015). Therefore, the lower HY (1.0 mmol H2 g -1(VS) Sargassum
sp.) was obtained for the ratio 1.54 g (VS) biomass g-1 (VS).
4.3 Zeolites effect on biohydrogen dark fermentation of Sargassum sp.
The effect of zeolites on hydrogen production was evaluated using Sargassum sp. as substrate.
In the previously assay, the best yield was achieve for the ratio 0.51 g (VS) biomass g-1 (VS) Sargassum
sp, corresponding to a Sargassum sp. concentration of 5 g L-1. Therefore, this concentration of
Sargassum sp. was used in this assay. Three ratios of zeolites/biomass were tested (0.26, 0.13 and
0.065 g g-1 (VS) biomass). Cumulative hydrogen production is shown in Figure 11.
The highest hydrogen production, i.e. 0.62 mmol H2, was achieved for the ratio 0.13 g zeolite g-
1 (VS) biomass. The improvement of hydrogen production was compared by the control (without zeolites),
0.44 mmol H2. The increase on cumulative hydrogen production in the presence of 0.13 g (zeolite) g-1
(VS) biomass was significantly higher (P (bi-caudal) < 0.005154723: t-test) than the obtained for the
control.
No methane was detected suggesting an effective inhibition of methanogenic archaea by BES.
The SFP profile for all ratios biomass/Sargassum sp. tested are shown in Figure 12. The COD
balance for each ratio zeolites/biomass indicate that all of the metabolic products were identified (Table
8).

4.Chapter Results and Discussion
61
Figure 11. Cumulative hydrogen production for each ratio zeolites/biomass tested. Error bars represent one standard deviation of triplicate bottles.
The highest hydrogen production yield, 3.10 mmol H2 g-1 (VS) Sargassum sp., was achieved for
the ratio 0.13 g (zeolite) g-1 (VS) biomass, corresponding to a hydrogen production of 0.66 mmol (Table
8).
Table 8. Maximum hydrogen partial pressure (p(H2)), maximum yield (mmol g-1 (VS) Sargassum sp.) and
COD balance (%) obtained for each ratio biomass/Sargassum sp. tested.
Ratios
zeolites/biomass
g g-1 (VS)
Hydrogen partial
pressure (p(H2)) (Pa)*
Hydrogen yield (mmol g-1 (VS) Sargassum
sp.))
COD balance (%)**
Control without
zeolites
26.4 2.62 95.3
0.26 18.1 2.58 99.0
0.13 22.2 3.15 81.5
0.065 25.7 1.8 90.4
*The hydrogen partial pressure shown represents the maximum p(H2) reached during the assay.
**The COD balance shown represents the soluble COD of the detected SFP.
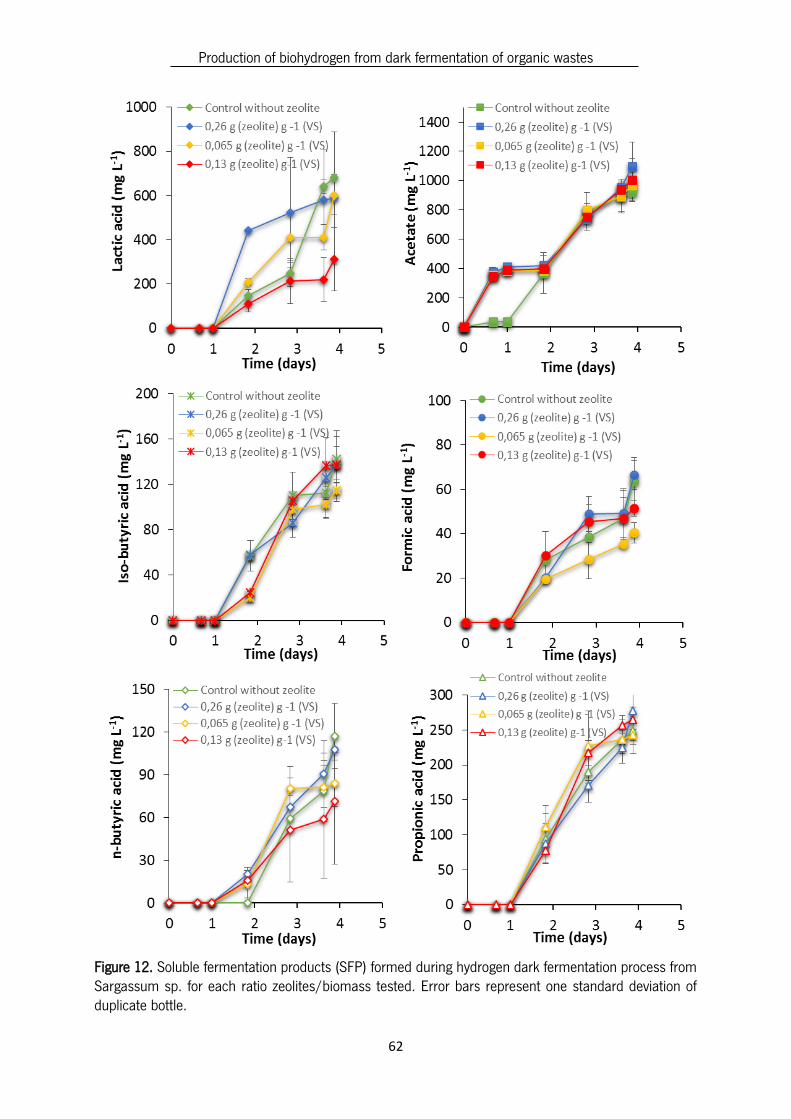
Production of biohydrogen from dark fermentation of organic wastes
62
Figure 12. Soluble fermentation products (SFP) formed during hydrogen dark fermentation process from Sargassum sp. for each ratio zeolites/biomass tested. Error bars represent one standard deviation of duplicate bottle.

4.Chapter Results and Discussion
63
Acetic acid was the most prevalent of SFP for the control and for each ratios of zeolites/biomass.
This SFP was produced in a similar concentration corresponding to 39.5 % (in COD) of the detected SFP,
in the presence and absence of zeolites.
The highest lactic acid production was obtained for the control without zeolites, 682.9 mg L-1.
The lower concentration of this SFP, i.e. 312.0 mg L-1, was achieved for the ratio 0.13 g (zeolite)
g-1 (VS) biomass. This result suggest that, in this case, the NADH generated during glycoses was mostly
used for acetate and hydrogen production. For this ratio the acetate produced was similar of the control
and the other ratios zeolites/biomass tested, however was observed a lower lactic acid formation which
can suggest a pathway for anaerobic lactic acid degradation. Oude Elferink et al., 2001 reported that
lactic acid bacteria have the ability to form lactic acid, but also are able to degrade lactic acid under
anoxic conditions in the presence of alternative electron acceptors. Acetic acid, ethanol, CO2, H2 and 1,2-
propanediol are some of the fermentation products for this pathway.
Others SFPs were also formed, such as propionic acid, formic acid, n-butyric acid and the iso-
butyric acid as result of using a complex residue as substrate. The behaviour of these SFPs was similar
in the presence and absence of zeolites.
The SFP profile of the control and for all ratios zeolites/biomass tested, was similar, not explaining
the possible effect of zeolites on the improvement of hydrogen production
4.4 Effect of HRT and zeolites in continuous hydrogen production in an EGSB bioreactor
In a first operation, represented by RA + G, the effect of zeolites in continuous hydrogen production
was studied with arabinose and glucose as substrate. These simple sugars were used as a model since
they are the product of lignocellulosic materials hydrolyse. The aim of this operation was to evaluate the
effect of HRT and zeolites addition in a continuous hydrogen production.
In a second operation, represented by RG the substrate was changed to glucose only. The objective
was to evaluate the effect of HRT and confirm the effect of zeolites in continuous hydrogen production
with a more easily degraded substrate.

Production of biohydrogen from dark fermentation of organic wastes
64
4.4.1 Hydrogen production in an EGSB bioreactor using glucose and arabinose
The effect of HRT and zeolites addition in hydrogen production rate with glucose and arabinose
as substrate is represented in Figure 13.
Figure 13. Effect of HRT and zeolites on the performance of RA + G. (a) Hydrogen production rate and
HRT. (b) Hydrogen content.
In the first stage, the bioreactor initiated with a HRT of 12 h and reached a maximum hydrogen
production rate of 1015.9 mL H2 L-1 d-1. In the first days of the operation it can be observed some instable
variation on hydrogen production rate because the granular sludge used as inoculum probably needed
some time to adapt to the thermophilic conditions of the operation. After stabilization around
approximately 800 mL H2 L-1 d-1 that occurs after approximately 25 days the HRT was decreased to 6 h.
As represented in Figure 13 (a) with the decreases of HRT the hydrogen production rate decreased over
time, reaching a critical value of 140 mL H2 L-1 d-1 after approximately 45 days of operation. This result

4.Chapter Results and Discussion
65
was expected, since a high organic loading rate was applied to the bioreactor not allowing sufficient time
for conversion of the substrates to H2 and other metabolites (Abreu et al., 2010). The residual glucose
increased after the decrease of the HRT reaching a maximum value of 476 mg L-1 as showed in Figure
14.
Figure 14. Effect of HRT and zeolites on (a) arabinose and glucose utilization, (b) soluble fermentation products (SFP).
After reaching a critical hydrogen production rate zeolites were added to the bioreactor in the
ratio of 0.26 g zeolites g-1 (VS) biomass. As shown in Figure 13 the addition of zeolites reversed the
tendency of the decrease in hydrogen production rate. The increased hydrogen production after the
zeolites addition reached a maximum value of approximately 430 mL H2 L-1 d-1 on 56 day. No methane
was detected in the gas phase along the operation time indicating an efficient removal of methanogenic
archaea from the inoculum due to the pH and thermophilic conditions of the operation. The hydrogen
content with a HRT of 12 h reached a maximum value of approximately 41% after 16 days of operation,

Production of biohydrogen from dark fermentation of organic wastes
66
(Figure 13 (b)). After decreasing the HRT to 6 h, the hydrogen content decreased along time reaching a
critical value of 18% on day 46 for the same reason described above. Zeolites addition improved the
hydrogen content reaching a maximum value of 37% at day 70. The Figure 14 shows the sugars
profiles and the soluble fermentation products, along the RA + G operation period. The COD balance for
each HRT (12 h and 6 h) is shown in Table 9 and indicated that all of the metabolic products were
identified.
Table 9. Process performance of RA + G.
**The COD balance shown represents the soluble COD of the detected SFP.
Glucose was almost totally consumed for HRT of 12 h. However, after the decrease of HRT the
residual glucose increased to a maximum value of 476 mg L-1. Uptake of arabinose was less than glucose
independently of the HRT applied. Immediately after HRT decrease for 6 h the arabinose consumption
increase lightly to 1575 mg L-1. However, residual arabinose gradually decreased and stabilized around
1465 mg L-1. This results suggest that the organic loading rate applied to the bioreactor at a HRT of 6 h
was very high, not allowing the total substrate consumption and, therefore, a decrease on hydrogen
production rate, as previously reported by (Abreu et al., 2010). This results indicate that glucose is
preferentially consumed, more than arabinose, along the entire time of operation. The slightly increase
of residual arabinose, immediately after lowering the HRT, suggest that the system needs some adaption
time to a new arabinose loading condition as reported by (Abreu et al., 2010). The differences observed
in glucose and arabinose uptake (Figure 14 (a)) can be explained by the different metabolic pathway of
each sugar. Arabinose and glucose are a pentose and a hexose, respectively, so their catabolism is very
different. The complexity of metabolic pathways and the involvement of many enzymes can be one of the
reasons for the preferential consumption of glucose. Is also possible to occur the phenomenon “the
glucose effect” (Strobel, 1993), where the presence of a rapidly biodegradable carbon, such as glucose,
can inhibit the synthesis of enzymes involved in the metabolism of other carbon-containing compounds,
HRT Zeolites g g-1 (VS) biomass
Hydrogen production rate
(L L-1 d-1)
COD balance (%)**
12 h Na 796.1 103.6
6 h Na 142.9 111
6 h 0.26 415.0 114.7

4.Chapter Results and Discussion
67
such as arabinose (Abreu et al., 2010). Glucose, isomers of hexoses, or polymers in the form of starch
or cellulose, lead to different yield amounts of H2 per mole of glucose, depending on the fermentation
pathway and end-product(s) (Levin, 2004).
Regarding the soluble fermentation products, the RA + G showed a very stable profile with a HRT
of 12 h. The acetic acid and the lactic acid were the most dominant fermentation product. However, the
lactic acid became dominant with the application of the HRT of 6 h. Propionate and n-butyrate acid were
present in the bioreactor but the concentration in most of the operation time was less than 70 mg L-1.
The increase of lactic acid with the decrease in the HRT can be deemed as an indicator of organic
overloading and consequently induces the inhibition for hydrogen fermentation process (D. Liu, Zeng, &
Angelidaki, 2008). In this case the pyruvate obtained from glycoses along with the oxidation of 2 NADH
is use to produce lactic acid (Figure 2 chapter 1). Therefore, with the application of HRT 6 h, the hydrogen
production yield decreases along with an increase on lactic acid production, suggesting that the system
was probably overloaded.
The increase of lactic acid can be also associated with the increase of hydrogen partial pressure.
The H2 partial pressure (p(H2)) is an extremely important factor for continuous H2 synthesis. Hydrogen
synthesis pathways are sensitive to H2 concentrations and are subject to end-product inhibition.
Therefore, as H2 concentration increases, H2 synthesis decreases and metabolic pathways shift to
production of more reduced substrates such as lactate (Levin, 2004).
Acetic acid was one of the major SFP produced along all the operation time. With a HRT of 12 h
a maximum of 430 mg L-1 was achieve. However, after the decrease of HRT to 6 h it can be seen a
slightly decrease of acetate to approximately 330 mg L-1 (Figure 14 (c)). This result can be explained by
the increase on lactic acid production, since the pyruvate was mostly used to the metabolic pathway of
this SFP, leading to a decrease on acetate and, consequently, biohydrogen production. When acetic acid
is the end-product, a theoretical maximum of 4 mole H2 per mole of glucose is obtained. Therefore, with
a hydraulic retention time of 12 h the metabolic pathway for acetate production is privileged leading to
higher hydrogen production rates.
After zeolites addition, acetate production has not changed, showing a very stable profile.
However, an unstable profile of lactic acid can be observed as well as an increase in formic acid
production, reaching a maximum of 470 mg L-1. In the mixed acid-fermentation, also known as formic
acid fermentation, the pyruvate formate lyase (PFL) converts pyruvate to acetyl-CoA and formic acid
(Figure 2 Chapter 1), this fermentation is realized by the Enteric bacteria. The formic acid can be degraded
into hydrogen and carbon dioxide by the formate hydrogen lyase (FHL). However, the theoretical hydrogen

Production of biohydrogen from dark fermentation of organic wastes
68
yields during mixed acid fermentation are lower than those described for the clostridia type fermentation
(Sikora et al., 2013). Therefore, one possible reason for zeolites to increase hydrogen production rate
can be the improvement of Enteric bacteria metabolism as a result of interaction or removal of ions in
the reaction medium. As previously mentioned, zeolites are used for treatment of wastewater
contaminated with metals because of its exchangeable ions that can be replaced.
Another possible reason, for the increase of hydrogen production rate after zeolites addition, can
be the decrease of homoacetogenesis. In this process, hydrogen is consumed to produce acetate and
others VFA’s in less concentration. The granular sludge used to inoculated RA + G has many types of
microorganisms, such as the hydrogen producing bacteria and also homoacetogenic bacteria. The
operation conditions are ideals to hydrogen production, but also to homoacetogenesis not allowing the
inhibition of homoacetogenic bacteria that remains active. This assumption can be explained by the fact
that at 45 day, before zeolites addition, the hydrogen production rate was 142.9 mL H2 L-1 d-1 and the
acetate production was 311 mg L-1. After zeolites addition, at day 65, the acetate production was 351.1
mg L-1 and the hydrogen production rate, 413 mL H2 L-1 d-1. Therefore, after zeolites addition the
hydrogen production rate increases, but not the acetate production remaining practically constant. With
these results, it’s possible to suppose that zeolites can interfere with the homoacetogenesis metabolism,
preventing the hydrogen consumption for the production of acetate, and thereby allowing a higher
hydrogen production rate for the same retention time. An interaction or removal of ions in the reaction
medium, by the exchangeable ions on zeolites structure, can also be the reason for this theory. To support
these two theories of possible zeolites effect, the microbial community has to be analysed.
Hydrogen partial pressure (p(H2)) is an extremely important factor for continuous hydrogen
synthesis because the metabolic pathways of biohydrogen production are very sensitive to hydrogen
concentrations and are subject to end-product inhibition. Therefore, a decrease in hydrogen partial
pressure can also be a reason for zeolites effect on hydrogen production rate. As previously mentioned,
the H2 molecules gated weakly adsorbed at the surface of the zeolites, which can lead to a decreased on
p(H2), since high hydrogen concentrations are not reached to lead end-product inhibition. In this case, it
is not possible to observe a decrease on lactic acid production, since with a HRT of 6 h the system was
overloaded.

4.Chapter Results and Discussion
69
4.4.2 Hydrogen production in an EGSB bioreactor using glucose
To prove the effect of zeolites on hydrogen production rate in an EGSB bioreactor, a second
operation was performed with only glucose as substrate, RG. The aim was to verify if zeolites would also
improve hydrogen production with this substrate. By this reason, this was a short operation of only 18
days.
The effect of HRT and zeolites in hydrogen production rate with glucose as substrate is
represented in Figure 15.
Figure 15. Effect of HRT and zeolites on the performance of RG. a) Hydrogen production rate and HRT.
(b) Hydrogen content.
The bioreactor was initiated with a HRT of 12 h, reaching a maximum hydrogen production rate
of 361.6 mL H2 L-1 d-1. After 7 days of operation, the HRT was changed to 6 h resulting in a decrease of
the hydrogen production rate, as observed in RA + G. After reaching a critical value, 138.7 mL H2 L-1 d-1,
zeolites at a ratio of 0.26 g g-1 (VS) biomass were added to the EGSB bioreactor. As shown in Figure 15
(a) zeolites increased hydrogen production rate, reaching a maximum value of 250.2 mL H2 L-1 d-1 after
18 days of operation. Hydrogen content had a similar behaviour as in RA + G. With a HRT of 12 h the

Production of biohydrogen from dark fermentation of organic wastes
70
maximum hydrogen content was 30.5%. With the change of HRT to 6 h, the hydrogen content decreased
along time reaching a critical value of 6.69% after 14 days of operation. Zeolites addition increased, once
again, the hydrogen content (maximum of 25% at day 18).
Figure 16. Effect of HRT and zeolites on (a) arabinose and glucose utilization (b) soluble fermentation products.
Figure 16 shows the sugars profiles and the soluble fermentation products, along the RG operation period.
The COD balance for each HRT (12 h and 6 h) is shown in Table 10 and indicated that all of the metabolic
products were identified.

4.Chapter Results and Discussion
71
Table 10. Process performance of RG.
**The COD balance shown represents the soluble COD of the detected SFP.
The behaviour of RG with a HRT of 12 h and 6 h, before and after zeolites addition, was very
similar to the behaviour of RA + G.
The maximum hydrogen rate obtained from RG, 361.6 mL H2 L-1 d-1 (Table 10) was low, when
compared with the maximum obtained from RA + G, 1015.9 mL H2 L-1 d-1 (Table 9). According to (Abreu,
2011), the presence of glucose may possibly decrease the overall hydrogen yield in continuous operation,
particularly when higher organic loading rates are applied. Lower hydrogen production is likely associated
with high lactate production, so an increment in glucose concentration can cause an increase in lactate
production (Abreu, 2011).
As shown in Figure 16 (a), glucose was not totally consumed. The uptake of glucose remained
stable (1339.2 mg L-1) along all time of operation, even after zeolites addition. The SFP profile showed
that lactic acid was the most dominant fermentation product. Propionate acid was present in RG, but the
concentration in all operation time was less than 60 mg L-1. Acetic and formic acid showed a very stable
profile along all operation time with an average value of 365.2 mg L-1 and 239.5 mg L-1, respectively.
The high residual glucose concentration, either with a HRT of 12 h or 6 h, allows the supposition
of system overload. And, therefore, have leaded to high lactic acid concentrations and low hydrogen
production rate.
The RG operation time was very short, not allowing to draw conclusions about the cause of the
increase in hydrogen production rate after zeolites addition.
4.5 MICROBIAL COMMUNITY PROFILES
Granules, before and after zeolites addition in the operations of the bioreactor with arabinose and
glucose as substrate (RA + G without zeolites and R A + G with zeolites, respectively) and only with glucose
as substrate (RG without zeolites and RG with zeolites, respectively), were analysed in terms of bacterial
HRT Zeolites g g-1 (VS) biomass
Hydrogen production rate (L
L-1 d-1)
COD balance (%)**
12 h Na 361.6 112.5
6 h Na 162.9 114.9
6 h 0.26 250.2 99.6

Production of biohydrogen from dark fermentation of organic wastes
72
community composition. The diversity of the similarity indices (Si) of the compared bacteria DGGE profiles
was determined by clustering analyses using Dice correlation. Before and after zeolites addition, samples
were taken and their bacterial community composition was analysed (Figure 17).
Figure 17. DGGE profile of bacterial community present in the granular biomass of RA + G (arabinose and
glucose as substrate) and RG (glucose as substrate) before and after zeolites addition.
The corresponding similarity index dendrograms were calculated and are presented in Figure 18.
The similarity matrices were also calculated and are summarize in Table 5.
A change in the community composition, after zeolites addition in RA + G (with arabinose and
glucose as substrate) can be observed in Figure 17 due to the existence of more bands in the community
profile when compared to the DGGE profile before the addition of the material to the bioreactor.
The similarity index between these two samples is only 66.7% (Table 5). The similarity dendrogram
also shows that the community composition of R A + G with zeolites is the most distant in terms of similarity
when compared with the DGGE profiles of the others samples (Figure 18). These results evidence that
the addition of zeolites to the bioreactor not only increase biohydrogen production, but also cause an
effect on the microbial community profile showing modifications after a long operation time.

4.Chapter Results and Discussion
73
Figure 18. Dendrograma calculated by Dice correlation of the DGGE profile of bacterial community present in the granular biomass of RA + G (arabinose and glucose as substrate) and RG (glucose as substrate)
before and after zeolites addition.
In the second EGSB operation with only glucose as substrate, a change in the microbial
community after zeolites addition was not observed. The DGGE profiles of samples RG without and with
zeolites are very similar, with a similarity of 94.7%. The dendrogram shows that these samples are very
similar on their microbial community when compared with the others samples. The high similarity can
be explain by a short operation time, only 18 days, that was not enough to change the microbial
community of the bioreactor. For zeolites to have an effect it is probably necessary a much longer
operation time, since changes on the community of a bioreactor it is a process that requires a long
operation time for the microorganisms to be in contact with the surface of the material.
In the analysis of the DGGE profiles of samples RA + G without zeolites and RG without and with
zeolites it is possible to observe the similarities on their microbial community. This is confirmed by a
similarity of 83.3% and 78.3%, respectively. These high similarities can be also explain by a short
Table 11. Similarities calculated by Dice correlation of the DGGE profiles of bacterial community present in the granular biomass of RA + G (arabinose and glucose as substrate) and RG (glucose as substrate)
before and after zeolites addition.
R G with
zeolites
R G without
zeolites
RA + G without
zeolites
RA + G with
zeolites
R G with zeolites 100
R G without zeolites 94,7 100
RA + G without zeolites 78,3 83,3 100
RA + G with zeolites 72,0 69,2 66,7 100

Production of biohydrogen from dark fermentation of organic wastes
74
operation time with only glucose as substrate not allowing enough time to change the microbial
community as a result of substrate modification.
The fact that the microbial communities’ composition in RA + G changed after zeolites addition,
suggests that the improvement in hydrogen production is related to bacterial community shifts. However
this theory only can be supported by further analysis of the taxonomy of the bacterial groups present.
4.6 MICROBIAL DIVERSITY
Granules samples from RA + G and RG, before and after zeolites addition, were submitted to Illumina-
based 16S rRNA gene sequencing. The taxonomic composition of the microbial community present in RA
+ G is illustrated by Krona graphics, shown in Figure 19 and 20. The percentage for all 16S rRNA gene
sequences detected in each samples are shown in Table 12. The percentages are related to the total
number of sequences found in each of the samples.
The most predominant bacteria in RA + G before zeolites addition were Klebsiella sp. (78%),
Thermoanaerobacter thermohydrosulfuricus (7%). Bacillus coagulans (2%), Sphingobium yanoikuyae (2%)
and Pseudomonas sp. (1%) (Figure 19).
Biohydrogen production has been reported under dark-fermentation by pure strains of Bacillus,
Clostridium and Klebsiella (Afsar et al., 2011; Porwal et al., 2008). Each microorganisms has limitation
towards H2 production under different fermentative conditions.
Klebsiella sp. and Bacillus coagullans are able to produce hydrogen and lactate, among others
products, from a variety of carbon sources (Karadag & Puhakka, 2010; Kotay & Das, 2007). Bacillus
coagullans is a hydrogen producer and has been used to optimized hydrogen production when co-culture
with Enterobacter. Recent studies suggest that H2 production, occurs perhaps through formate
dehydrogenase than via hydrogenase (Kalia, Lal, Ghai, Mandal, & Chauhan, 2003; Kumar, Patel, Lee, &
Kalia, 2013). However, hydrogenase genes are present in Bacillus sp. (Kumar et al., 2013).

4.Chapter Results and Discussion
75
Table 12. Taxonomic diversity of 16S rRNA RA + G and RG before and after zeolites addition.
Species RA + G (%) RA + G + Zeolites
(%) RG (%) RG + Zeolites (%)
Methanobacterium sp 0.013 0.003 Corynebacterium sp 0.075
Arthrobacter sp 0.134 Nocardioides sp 0.056
Dysgonomonas sp 0.010
Flavobacterium sp 0.245 0.201 0.045 0.022 Sphingobacterium sp 0.006 0.111 0.018
Halospirulina sp 0.055 0.013 0.202
Amphibacillus xylanus 0.048 Bacillus coagulans 1.676 14.13 1.015 0.850 Sporolactobacillus
nakayamae 0.066 0.845 1.349 2.344 Staphylococcus aureus 0.003 0.153 Enterococcus faecalis 0.015 0.073 0.038
Leuconostoc mesenteroides 0.012
Lactococcus lactis 0.006 0.244 0.419 0.535 Streptococcus sp 0.037 Caloramator sp 0.112 0.053 0.206 0.164
Clostridium beijerinckii 0.333 6.622 0.222 0.689 Clostridium sp 0.018 0.5764 0.050 0.026
T. thermohydrosulfuricus 7.158 9.885 8.489 16.92 T. thermosaccharolyticum 0.439 5.378 0.122 Thermodesulfovibrio sp 1.061 1.042 4.106 4.860 Brevundimonas nasdae 0.019 0.027 0.018
Brevundimonas sp 0.035 0.016 Ochrobactrum sp 0.029 0.011 0.041 Agrobacterium sp 0.122 0.462 0.243 0.453
Sphingobium yanoikuyae 1.603 0.020 0.356 0.303 Comamonas sp 0.153 0.167
Delftia tsuruhatensis 0.076 0.083 0.064 0.205 Janthinobacterium sp 0.019
Desulfovibrio sp 0.001 0.036 0.020
Aeromonas sp 0.121
Escherichia sp 0.010 0.030 0.001 0.007 Klebsiella sp 75.50 45.21 63.31 46.41
Yersinia kristensenii 0.136 0.046 0.104 0.101 Acinetobacter sp 0.214 0.072 0.064
Enhydrobacter aerosaccus 0.071 Pseudomonas sp 1.077 0.415 1.096 0.996
Stenotrophomonas sp 0.027 0.016 0.116 0.052 Fervidobacterium sp 0.163 1.939

Production of biohydrogen from dark fermentation of organic wastes
76
Figure 19. Taxonomic composition of microbial community present in RA + G before zeolites addition.
Anaerobic conditions applied to the bioreactor favoured hydrogen production by Klebsiella sp.. This
microorganisms is known to convert glucose to hydrogen at a high hydrogen rate and yield, and to
produce many volatile acids such as acetate and butyrate (Niu, Zhang, Tan, & Zhu, 2010).
Sphingobium yanoikuyae have several genes involved in the carotenoid biosynthetic pathway and
it is responsible to produce a yellow-pigmented designed by zeaxanthin and hydrogen peroxide (X. Liu,
Gai, Tao, Tang, & Xu, 2012).
Thermoanaerobacter thermohydrosulfuricus is a hydrogen producer and the major fermentation
end-products from simple sugars (glucose and xylose) are acetate and ethanol. However, its production
varied depending on the substrate supplied. Ethanol production increases when xylose is used as
substrate. Several studies reported that many bacteria within the genera Thermoanaerobacter have great
potential for hydrogen production, through the acetate pathway from complex lignocellulosic biomass
(Cook & Morgan, 1994).

4.Chapter Results and Discussion
77
Figure 20. Taxonomic composition of microbial community present in RA + G after zeolites addition.
After zeolites addition in RA + G, the most predominant bacteria were Klebsiella sp. (52%), Bacillus
coagulans (14%) and Thermoanaerobacter thermohydrosulfuricus (10%). In addition, in the presence of
zeolites new microorganisms were also detected such as: Thermoanaerobacter saccharolyticum (5%),
Clostridium beijerinckii (7%) and Anoxybacillus contaminants (1%) (Figure 20).
The most common bacteria, used in dark fermentation to produce hydrogen, are Clostridium and
Thermoanaerobacterium (O-Thong, Prasertsan, & Birkeland, 2009). Clostridium beijerinckii is a hydrogen
producer and is capable of digest a wide range of carbon and nitrogen sources for hydrogen production
(An, Li, Wang, Yang, & Guo, 2014). This microorganism can use simple sugars (glucose; xylose; lactose)
but also many complex carbohydrates (cellulose) to produce hydrogen. The genome of
Thermoanaerobacter saccharolyticum have many genes that encode metabolic enzymes involved in
pyruvate conversion. The gene for L-lactate dehydrogenase is present, indicating the possibility of pyruvate
reduction to lactate. However, genes codifying subunits of enzymes related to pyruvate-ferredoxin
oxidoreductases and NADH oxidoreductases are also present. Several studies allowed to identify several

Production of biohydrogen from dark fermentation of organic wastes
78
pathways that would lead to the generation of lactate, acetate, ethanol, hydrogen, and carbon dioxide.
Studies reported that this microorganism have many genes that encode several enzymes involved in POR
pathway, leading to high amounts of acetic acid and ethanol production (Joe Shaw, Jenney, Adams, &
Lynd, 2008).
Anoxybacillus sp. is a genus of bacteria that have a great potential for biohydrogen production from
mixed sugars hydrolysate (Hniman, O-Thong, & Prasertsan, 2011).
A reduced amount of Archaea (0.02%) was detected in RA +G, correspondent to the species
Methanobacterium sp. and Methanothermobacter thermautotrophicus after zeolites addition. However,
these microorganisms may no longer be active since no methane was detected in gas phase.
The taxonomic composition of the microbial community present in RG is illustrated by Krona
graphics, shown in Figure 21 and 22. The percentages are relative to the total number of sequences
found in each of the samples.
Figure 21. Taxonomic composition of bacterial community present in of RG before zeolites addition.

4.Chapter Results and Discussion
79
The most predominant bacteria in RG before zeolites addition were Klebsiella sp. (65%), Bacillus
coagulans (1%), Sporolactobacillus nakayamar (1%), Thermoanaerobacter thermohydrosulfuricus
(8%),Thermodesulfovibrio sp. (4%) and Pseudomonas sp. (1%) (Figure 21).The microbial diversity detected
is similar to the obtained for RA + G before zeolites addition. However, new species were detected such
as: Sporolactobacillus nakayamae and Thermodesulfovibrio sp..
Sporolactobacillus nakayamae is a homofermentative lactic acid bacterium that is capable of
efficient D-lactic acid production from glucose (L. Zheng, Bai, Xu, & He, 2012). This microorganism can
be one of the reasons for the high lactic acid production obtained for RG.
Thermodesulfovibrio sp. is a genera of thermophilic sulfate-reducing bacteria’s capable of oxidizing
acetate in the course of syntrophic growth with H2-utilizing (Nazina et al., 2006). The presence of
hydrogen consumer microorganisms in the microbial consortium of RG can be one of the causes for the
low hydrogen yield in the presence of glucose. The microbial diversity of RG after zeolites addition can be
observed in Figure 22.
After zeolites addition in RG, Klebsiella sp. (49%), Thermoanaerobacter thermohydrosulfuricus
(17%), Sporolactobacillus nakayamae (2%), Thermodesulfovibrio sp. (5%), Pseudomonas (1%),
Clostridium beijerinckii (0.7%) and species of the family Bacillaceae (Bacillus coagulans and Anoxybacillus
contaminants) were also detected. However, in the presence of zeolites a new genera appeared, i.e.,
Fervidobacterium sp. (Figure 22).
Fervidobacterium sp. are hydrogen producers through the fermentation of organic carbon. Acetate
and carbon dioxide are one of the fermentative products that can be found in the presence of
Fervidobacterium sp. suggesting the use of POR pathway for hydrogen production (Otaki, Everroad,
Matsuura, & Haruta, 2012).
After zeolites addition, the microbial diversity in both reactors changed. However, the major
differences were observed for RA + G, once the operational time of RG was very short not allowing enough
time for more significant changes in the microbial consortium.

Production of biohydrogen from dark fermentation of organic wastes
80
Figure 22. Taxonomic composition of microbial community present in RG after zeolites addition.
The fact that the microbial communities’ composition in the reactors change in the presence of
zeolites, suggests that the improvement in hydrogen production rate can be a consequence of bacterial
community shifts.

81
5. CHAPTER CONCLUSION


5.Chapter Conclusion
83
CONCLUSION
The batch experiments with simple sugars and Sargassum sp. showed that the presence of
zeolites improve the hydrogen production. The SFP profile obtained in the experiments performed with
simple sugars does not allow a conclusion about the possible effect of zeolites in hydrogen production,
since the fermentation products behaviour (lactic acid, acetic acid and formic acid) was similar in the
presence and absence of zeolites. The SFP profile obtained in the experiments with Sargassum sp. in the
presence of zeolites was similar for all the ratios and for the control. However, the ratio of
zeolites/Sargassum sp. that leaded to a higher hydrogen production achieved a lower lactic acid
concentration, which can suggest that the microorganisms are following more complex metabolic
pathways, such as anaerobic lactic acid degradation.
In continuous mode, zeolites had also a positive effect on hydrogen production rate. The
improvement of Enteric bacteria metabolism or the inhibition of homoacetogenesis, as a result of the
interaction or removal of certain ions in the reaction medium could be two of the possible reasons. A
decrease in hydrogen partial pressure could also be one of the possibilities for the improvement in
hydrogen production rate.
Microbial diversity of RA + G and RG changed after zeolites addition suggesting that the improvement
in hydrogen production rate could be a consequence of bacterial community shifts.
The obtained results do not allow to establish the exact cause for zeolites effect in hydrogen
production. It can be assumed that many complex metabolic pathways for H2 production are involved
and the zeolites have a positive effect.
Therefore, it is necessary to study in detail the microorganisms involved in this process, especially
the ones that lost or won dominance in the microbial consortium in the presence of zeolites. Batch
experiments with each of the microorganisms can be performed in future studies. In this case, is
important to follow all the fermentation products in order to understand which metabolic pathways for H2
production are involved. Batch experiments with Klebsiella sp., Thermoanaerobacter
thermohydrosulfuricus, Bacillus coagulans, Clostridium beijerinckii and Thermoanaerobacter
saccharolyticum are some of the possibilities.
To further studies, is also important to observe zeolites effect in continuous mode, in order to
understand if the hydrogen production rate increases more or if it stabilizes. This experiment is important

Production of biohydrogen from dark fermentation of organic wastes
84
for understanding if zeolites have a positive and continuous effect in hydrogen production or if it loses
viability after a long time.

85
6. CHAPTER BIBLIOGRAPHY


6.Chapter Bibliography
87
BIBLIOGRAPHY
Abreu, A. A., Alves, J. I., Pereira, M. A., Karakashev, D., Alves, M. M., & Angelidaki, I. (2010). Engineered heat treated methanogenic granules: A promising biotechnological approach for extreme thermophilic biohydrogen production. Bioresource Technology, 101(24), 9577–9586. http://doi.org/10.1016/j.biortech.2010.07.070
Abreu, A. A., Karakashev, D., Angelidaki, I., Sousa, D. Z., & Alves, M. (2012). Biohydrogen production from arabinose and glucose using extreme thermophilic anaerobic mixed cultures. Biotechnology for Biofuels, 5(1), 6. http://doi.org/10.1186/1754-6834-5-6
Afsar, N., Özgür, E., Gürgan, M., Akköse, S., Yücel, M., Gündüz, U., & Eroglu, I. (2011). Hydrogen productivity of photosynthetic bacteria on dark fermenter effluent of potato steam peels hydrolysate. International Journal of Hydrogen Energy, 36(1), 432–438. http://doi.org/10.1016/j.ijhydene.2010.09.096
An, D., Li, Q., Wang, X., Yang, H., & Guo, L. (2014). Characterization on hydrogen production performance of a newly isolated Clostridium beijerinckii YA001 using xylose. International Journal of Hydrogen Energy, 39(35), 19928–19936. http://doi.org/10.1016/j.ijhydene.2014.10.014
Arriaga, S., Rosas, I., Alatriste-Mondragón, F., & Razo-Flores, E. (2011). Continuous production of hydrogen from oat straw hydrolysate in a biotrickling filter. International Journal of Hydrogen Energy, 36(5), 3442–3449. http://doi.org/10.1016/j.ijhydene.2010.12.019
Barca, C., Soric, A., Ranava, D., Giudici-Orticoni, M.-T., & Ferrasse, J.-H. (2015). Anaerobic biofilm reactors for dark fermentative hydrogen production from wastewater: A review. Bioresource Technology, 185, 386–398. http://doi.org/10.1016/j.biortech.2015.02.063
Barrer, R. M., & Vaughan, D. E. W. (1967). Solution and diffusion of helium and neon in tridymite and cristobalite. Transactions of the Faraday Society, 63, 2275. http://doi.org/10.1039/tf9676302275
Baykara, S., & Bilgen, E. (1989). An overall assessment of hydrogen production by solar water thermolysis. International Journal of Hydrogen Energy, 14(12), 881–891. http://doi.org/10.1016/0360-3199 (89)90075-X
Caporaso, J. G., Lauber, C. L., Walters, W. A., Berg-Lyons, D., Huntley, J., Fierer, N., Owens, SM., Betley, J., Fraser, L., Bauer, M., Gormley, N., Gilbert, JA., Smith, G., Knight R. (2012). Ultra-high-throughput microbial community analysis on the Illumina HiSeq and MiSeq platforms. The ISME Journal, 6(8), 1621–1624. http://doi.org/10.1038/ismej.2012.8
Chen, C. C., Lin, C. Y., & Chang, J. S. (2001). Kinetics of hydrogen production with continuous anaerobic cultures utilizing sucrose as the limiting substrate. Applied Microbiology and Biotechnology, 57(1-2), 56–64.
Chen, W., Chen, S., Kumarkhanal, S., & Sung, S. (2006). Kinetic study of biological hydrogen production by anaerobic fermentation. International Journal of Hydrogen Energy, 31(15), 2170–2178. http://doi.org/10.1016/j.ijhydene.2006.02.020
Chu, C.-F., Li, Y.-Y., Xu, K.-Q., Ebie, Y., Inamori, Y., & Kong, H.-N. (2008). A pH- and temperature-phased two-stage process for hydrogen and methane production from food waste. International Journal of Hydrogen Energy, 33(18), 4739–4746. http://doi.org/10.1016/j.ijhydene.2008.06.060
Cook, G. M., & Morgan, H. W. (1994). Hyperbolic growth of Thermoanaerobacter thermohydrosulfuricus (Clostridium thermohydrosulfuricum) increases ethanol production in pH-controlled batch culture. Applied Microbiology and Biotechnology, 41(1), 84–89. http://doi.org/10.1007/BF00166086

Production of biohydrogen from dark fermentation of organic wastes
88
Costa, J. C., Oliveira, J. V., Pereira, M. A., Alves, M. M., & Abreu, A. A. (2015). Biohythane production from marine macroalgae Sargassum sp. coupling dark fermentation and anaerobic digestion. Bioresource Technology, 190, 251–256. http://doi.org/10.1016/j.biortech.2015.04.052
Dong, J., Wang, X., Xu, H., Zhao, Q., & Li, J. (2007). Hydrogen storage in several microporous zeolites. International Journal of Hydrogen Energy, 32(18), 4998–5004. http://doi.org/10.1016/j.ijhydene.2007.08.009
Engenharia, E. De. (2011). Universidade do Minho Escola de Engenharia Ângela Alexandra Valente de Abreu Optimization of dark fermentation processes for biohydrogen production from sugars.
Fernandes, B. S., Peixoto, G., Albrecht, F. R., Saavedra del Aguila, N. K., & Zaiat, M. (2010). Potential to produce biohydrogen from various wastewaters. Energy for Sustainable Development, 14(2), 143–148. http://doi.org/10.1016/j.esd.2010.03.004
Fritsch, M., Hartmeier, W., & Chang, J. (2008). Enhancing hydrogen production of Clostridium butyricum using a column reactor with square-structured ceramic fittings. International Journal of Hydrogen Energy, 33(22), 6549–6557. http://doi.org/10.1016/j.ijhydene.2008.07.070
Gaffron, H., & Rubin, J. (1942). FERMENTATIVE AND PHOTOCHEMICAL PRODUCTION OF HYDROGEN IN ALGAE. The Journal of General Physiology, 26(2), 219–240.
Hallenbeck, P. (2002). Biological hydrogen production; fundamentals and limiting processes. International Journal of Hydrogen Energy, 27(11-12), 1185–1193. http://doi.org/10.1016/S0360-3199 (02)00131-3
Hallenbeck, P. C. (2009). Fermentative hydrogen production: Principles, progress, and prognosis. International Journal of Hydrogen Energy, 34(17), 7379–7389. http://doi.org/10.1016/j.ijhydene.2008.12.080
Hallenbeck, P. C., Abo-Hashesh, M., & Ghosh, D. (2012). Strategies for improving biological hydrogen production. Bioresource Technology, 110, 1–9. http://doi.org/10.1016/j.biortech.2012.01.103
Hexter, S. V., Grey, F., Happe, T., Climent, V., & Armstrong, F. A. (2012). Electrocatalytic mechanism of reversible hydrogen cycling by enzymes and distinctions between the major classes of hydrogenases. Proceedings of the National Academy of Sciences, 109(29), 11516–11521. http://doi.org/10.1073/pnas.1204770109
Hniman, A., O-Thong, S., & Prasertsan, P. (2011). Developing a thermophilic hydrogen-producing microbial consortia from geothermal spring for efficient utilization of xylose and glucose mixed substrates and oil palm trunk hydrolysate. International Journal of Hydrogen Energy, 36(14), 8785–8793. http://doi.org/10.1016/j.ijhydene.2010.09.067
Joe Shaw, A., Jenney, F. E., Adams, M. W. W., & Lynd, L. R. (2008). End-product pathways in the xylose fermenting bacterium, Thermoanaerobacterium saccharolyticum. Enzyme and Microbial Technology, 42(6), 453–458. http://doi.org/10.1016/j.enzmictec.2008.01.005
Kádár, Z., de Vrije, T., van Noorden, G. E., Budde, M. A. W., Szengyel, Z., Réczey, K., & Claassen, P. A. M. (2004). Yields from glucose, xylose, and paper sludge hydrolysate during hydrogen production by the extreme thermophile Caldicellulosiruptor saccharolyticus. Applied Biochemistry and Biotechnology, 113-116, 497–508.
Kalia, V. C., Lal, S., Ghai, R., Mandal, M., & Chauhan, A. (2003). Mining genomic databases to identify novel hydrogen producers. Trends in Biotechnology, 21(4), 152–156. http://doi.org/10.1016/S0167-7799 (03)00028-3
Karadag, D., & Puhakka, J. A. (2010). Direction of glucose fermentation towards hydrogen or ethanol production through on-line pH control. International Journal of Hydrogen Energy, 35(19), 10245–10251. http://doi.org/10.1016/j.ijhydene.2010.07.139

6.Chapter Bibliography
89
Kongjan, P., & Angelidaki, I. (2010). Extreme thermophilic biohydrogen production from wheat straw hydrolysate using mixed culture fermentation: Effect of reactor configuration. Bioresource Technology, 101(20), 7789–7796. http://doi.org/10.1016/j.biortech.2010.05.024
Kotay, S. M., & Das, D. (2007). Microbial hydrogen production with Bacillus coagulans IIT-BT S1 isolated from anaerobic sewage sludge. Bioresource Technology, 98(6), 1183–1190. http://doi.org/10.1016/j.biortech.2006.05.009
Kumar, P., Patel, S. K. S., Lee, J.-K., & Kalia, V. C. (2013). Extending the limits of Bacillus for novel biotechnological applications. Biotechnology Advances, 31(8), 1543–1561. http://doi.org/10.1016/j.biotechadv.2013.08.007
Langmi, H. W., Book, D., Walton, A., Johnson, S. R., Al-Mamouri, M. M., Speight, J., Edwards, P.P., Harris, I.R., Anderson, P. A. (2005). Hydrogen storage in ion-exchanged zeolites. Journal of Alloys and Compounds, 404-406, 637–642. http://doi.org/10.1016/j.jallcom.2004.12.193
Lee, K., Lin, P., & Chang, J. (2006). Temperature effects on biohydrogen production in a granular sludge bed induced by activated carbon carriers. International Journal of Hydrogen Energy, 31(4), 465–472. http://doi.org/10.1016/j.ijhydene.2005.04.024
Levin, D. (2004). Biohydrogen production: prospects and limitations to practical application. International Journal of Hydrogen Energy, 29(2), 173–185. http://doi.org/10.1016/S0360-3199(03)00094-6
Li, C., & Fang, H. H. P. (2007). Fermentative Hydrogen Production From Wastewater and Solid Wastes by Mixed Cultures. Critical Reviews in Environmental Science and Technology, 37(1), 1–39. http://doi.org/10.1080/10643380600729071
Liu, D., Zeng, R. J., & Angelidaki, I. (2008). Effects of pH and hydraulic retention time on hydrogen production versus methanogenesis during anaerobic fermentation of organic household solid waste under extreme-thermophilic temperature (70°C). Biotechnology and Bioengineering, 100(6), 1108–1114. http://doi.org/10.1002/bit.21834
Liu, X., Gai, Z., Tao, F., Tang, H., & Xu, P. (2012). Carotenoids Play a Positive Role in the Degradation of Heterocycles by Sphingobium yanoikuyae. PLoS ONE, 7(6), e39522. http://doi.org/10.1371/journal.pone.0039522
Liu, Z., Zhang, C., Lu, Y., Wu, X., Wang, L., Wang, L., Han, B., Xing, X. H. (2013). States and challenges for high-value biohythane production from waste biomass by dark fermentation technology. Bioresource Technology, 135, 292–303. http://doi.org/10.1016/j.biortech.2012.10.027
Lo, Y.-C., Lee, K.-S., Lin, P.-J., & Chang, J.-S. (2009). Bioreactors configured with distributors and carriers enhance the performance of continuous dark hydrogen fermentation. Bioresource Technology, 100(19), 4381–4387. http://doi.org/10.1016/j.biortech.2009.04.024
Lu, J., Gavala, H. N., Skiadas, I. V., Mladenovska, Z., & Ahring, B. K. (2008). Improving anaerobic sewage sludge digestion by implementation of a hyper-thermophilic prehydrolysis step. Journal of Environmental Management, 88(4), 881–889. http://doi.org/10.1016/j.jenvman.2007.04.020
Luo, G., Xie, L., Zou, Z., Wang, W., Zhou, Q., & Shim, H. (2010). Anaerobic treatment of cassava stillage for hydrogen and methane production in continuously stirred tank reactor (CSTR) under high organic loading rate (OLR). International Journal of Hydrogen Energy, 35(21), 11733–11737. http://doi.org/10.1016/j.ijhydene.2010.08.033
Mu, Y., & Yu, H.-Q. (2006). Biological hydrogen production in a UASB reactor with granules. I: Physicochemical characteristics of hydrogen-producing granules. Biotechnology and Bioengineering, 94(5), 980–987. http://doi.org/10.1002/bit.20924
Muyzer, G., de Waal, E. C., & Uitterlinden, A. G. (1993). Profiling of complex microbial populations by denaturing gradient gel electrophoresis analysis of polymerase chain reaction-amplified genes coding for 16S rRNA. Applied and Environmental Microbiology, 59(3), 695–700.
Production of biohydrogen from dark fermentation of organic wastes
90
Nazina, T. N., Shestakova, N. M., Grigor’yan, A. A., Mikhailova, E. M., Tourova, T. P., Poltaraus, A. B., Feng, C., Belyaev, S. S. (2006). Phylogenetic diversity and activity of anaerobic microorganisms of high-temperature horizons of the Dagang oil field (P. R. China). Microbiology, 75(1), 55–65. http://doi.org/10.1134/S0026261706010115
Niaz, S., Manzoor, T., & Pandith, A. H. (2015). Hydrogen storage: Materials, methods and perspectives. Renewable and Sustainable Energy Reviews, 50, 457–469. http://doi.org/10.1016/j.rser.2015.05.011
Niu, K., Zhang, X., Tan, W.-S., & Zhu, M.-L. (2010). Characteristics of fermentative hydrogen production with Klebsiella pneumoniae ECU-15 isolated from anaerobic sewage sludge. International Journal of Hydrogen Energy, 35(1), 71–80. http://doi.org/10.1016/j.ijhydene.2009.10.071
Nkemka, V. N., & Murto, M. (2010). Evaluation of biogas production from seaweed in batch tests and in UASB reactors combined with the removal of heavy metals. Journal of Environmental Management, 91(7), 1573–1579. http://doi.org/10.1016/j.jenvman.2010.03.004
Nübel, U., Engelen, B., Felske, A., Snaidr, J., Wieshuber, A., Amann, R. I., Ludwig, W., Backhaus, H. (1996). Sequence heterogeneities of genes encoding 16S rRNAs in Paenibacillus polymyxa detected by temperature gradient gel electrophoresis. Journal of Bacteriology, 178(19), 5636–5643.
Oh, S.-E., Iyer, P., Bruns, M. A., & Logan, B. E. (2004). Biological hydrogen production using a membrane bioreactor. Biotechnology and Bioengineering, 87(1), 119–127. http://doi.org/10.1002/bit.20127
Otaki, H., Everroad, R. C., Matsuura, K., & Haruta, S. (2012). Production and Consumption of Hydrogen in Hot Spring Microbial Mats Dominated by a Filamentous Anoxygenic Photosynthetic Bacterium. Microbes and Environments, 27(3), 293–299. http://doi.org/10.1264/jsme2.ME11348
O-Thong, S., Prasertsan, P., & Birkeland, N.-K. (2009). Evaluation of methods for preparing hydrogen-producing seed inocula under thermophilic condition by process performance and microbial community analysis. Bioresource Technology, 100(2), 909–918. http://doi.org/10.1016/j.biortech.2008.07.036
Othong, S., Prasertsan, P., Karakashev, D., & Angelidaki, I. (2008). High-rate continuous hydrogen production by Thermoanaerobacterium thermosaccharolyticum PSU-2 immobilized on heat-pretreated methanogenic granules. International Journal of Hydrogen Energy, 33(22), 6498–6508. http://doi.org/10.1016/j.ijhydene.2008.07.060
Oude Elferink, S. J. W. H., Krooneman, J., Gottschal, J. C., Spoelstra, S. F., Faber, F., & Driehuis, F. (2001). Anaerobic Conversion of Lactic Acid to Acetic Acid and 1,2-Propanediol by Lactobacillus buchneri. Applied and Environmental Microbiology, 67(1), 125–132. http://doi.org/10.1128/AEM.67.1.125-132.2001
Park, M. J., Jo, J. H., Park, D., Lee, D. S., & Park, J. M. (2010). Comprehensive study on a two-stage anaerobic digestion process for the sequential production of hydrogen and methane from cost-effective molasses. International Journal of Hydrogen Energy, 35(12), 6194–6202. http://doi.org/10.1016/j.ijhydene.2010.03.135
Peintner, C., Zeidan, A. A., & Schnitzhofer, W. (2010). Bioreactor systems for thermophilic fermentative hydrogen production: evaluation and comparison of appropriate systems. Journal of Cleaner Production, 18, S15–S22. http://doi.org/10.1016/j.jclepro.2010.06.013
Peters, J. W. (1998). X-ray Crystal Structure of the Fe-Only Hydrogenase (CpI) from Clostridium pasteurianum to 1.8&nbsp;Angstrom Resolution. Science, 282(5395), 1853–1858. http://doi.org/10.1126/science.282.5395.1853
Porwal, S., Kumar, T., Lal, S., Rani, A., Kumar, S., Cheema, S., Purohit, H.J., Sharma, R., Patel, S.K.S., Kalia, V. C. (2008). Hydrogen and polyhydroxybutyrate producing abilities of microbes from

6.Chapter Bibliography
91
diverse habitats by dark fermentative process. Bioresource Technology, 99(13), 5444–5451. http://doi.org/10.1016/j.biortech.2007.11.011
Ren, N., Guo, W., Liu, B., Cao, G., & Ding, J. (2011). Biological hydrogen production by dark fermentation: Challenges and prospects towards scaled-up production. Current Opinion in Biotechnology, 22(3), 365–370. http://doi.org/10.1016/j.copbio.2011.04.022
Ren, N.-Q., Tang, J., Liu, B.-F., & Guo, W.-Q. (2010). Biological hydrogen production in continuous stirred tank reactor systems with suspended and attached microbial growth. International Journal of Hydrogen Energy, 35(7), 2807–2813. http://doi.org/10.1016/j.ijhydene.2009.05.010
Rittmann, S., & Herwig, C. (2012). A comprehensive and quantitative review of dark fermentative biohydrogen production. Microbial Cell Factories, 11(1), 115. http://doi.org/10.1186/1475-2859-11-115
Ruzicka, M. (1996). The effect of hydrogen on acidogenic glucose cleavage. Water Research, 30(10), 2447–2451. http://doi.org/10.1016/0043-1354(96)00112-1
Sanguinetti, C. J., Dias Neto, E., & Simpson, A. J. (1994). Rapid silver staining and recovery of PCR products separated on polyacrylamide gels. BioTechniques, 17(5), 914–921.
Show, K.-Y., Lee, D.-J., & Chang, J.-S. (2011). Bioreactor and process design for biohydrogen production. Bioresource Technology, 102(18), 8524–8533. http://doi.org/10.1016/j.biortech.2011.04.055
Show, K.-Y., Zhang, Z.-P., Tay, J.-H., Liang, D. T., Lee, D.-J., Ren, N., & Wang, A. (2010). Critical assessment of anaerobic processes for continuous biohydrogen production from organic wastewater. International Journal of Hydrogen Energy, 35(24), 13350–13355. http://doi.org/10.1016/j.ijhydene.2009.11.110
Sikora, A., Baszczyk, M., Jurkowski, M., & Zielenkiewicz, U. (2013). Lactic Acid Bacteria in Hydrogen-Producing Consortia: On Purpose or by Coincidence? In J. M. Kongo (Ed.), Lactic Acid Bacteria - R & D for Food, Health and Livestock Purposes. InTech. Retrieved from http://www.intechopen.com/books/lactic-acid-bacteria-r-d-for-food-health-and-livestock-purposes/lactic-acid-bacteria-in-hydrogen-producing-consortia-on-purpose-or-by-coincidence-
Silva, B., Figueiredo, H., Quintelas, C., Neves, I. C., & Tavares, T. (2012). Improved biosorption for Cr(VI) reduction and removal by Arthrobacter viscosus using zeolite. International Biodeterioration & Biodegradation, 74, 116–123. http://doi.org/10.1016/j.ibiod.2012.05.026
Strobel, H. J. (1993). Evidence for catabolite inhibition in regulation of pentose utilization and transport in the ruminal bacterium Selenomonas ruminantium. Applied and Environmental Microbiology, 59(1), 40–46.
Valdezvazquez, I., Riosleal, E., Esparzagarcia, F., Cecchi, F., & Poggivaraldo, H. (2005). Semi-continuous solid substrate anaerobic reactors for H production from organic waste: Mesophilic versus thermophilic regime. International Journal of Hydrogen Energy, 30(13-14), 1383–1391. http://doi.org/10.1016/j.ijhydene.2004.09.016
van de Werken, H. J. G., Verhaart, M. R. A., VanFossen, A. L., Willquist, K., Lewis, D. L., Nichols, J. D., Goorissen, H.P., Mongodin, E.F., Nelson, K.E., Van Niel, E.W., Ward, D., Stams, A.J., Ward, D.E., Devos, W.M., Van der Oost, J,. Kelly, R.M., Kengen, S. W. M. (2008). Hydrogenomics of the Extremely Thermophilic Bacterium Caldicellulosiruptor saccharolyticus. Applied and Environmental Microbiology, 74(21), 6720–6729. http://doi.org/10.1128/AEM.00968-08
Van Groenestijn, J. W., Hazewinkel, J. H. O., Nienoord, M., & Bussmann, P. J. T. (2002). Energy aspects of biological hydrogen production in high rate bioreactors operated in the thermophilic temperature range. International Journal of Hydrogen Energy, 27(11-12), 1141–1147.
Vignais, P. M., Billoud, B., & Meyer, J. (2001). Classification and phylogeny of hydrogenases. FEMS Microbiology Reviews, 25(4), 455–501.

Production of biohydrogen from dark fermentation of organic wastes
92
Wong, Y. M., Wu, T. Y., & Juan, J. C. (2014). A review of sustainable hydrogen production using seed sludge via dark fermentation. Renewable and Sustainable Energy Reviews, 34, 471–482. http://doi.org/10.1016/j.rser.2014.03.008
Wu, S.-Y., Hung, C.-H., Lin, C.-N., Chen, H.-W., Lee, A.-S., & Chang, J.-S. (2006). Fermentative hydrogen production and bacterial community structure in high-rate anaerobic bioreactors containing silicone-immobilized and self-flocculated sludge. Biotechnology and Bioengineering, 93(5), 934–946. http://doi.org/10.1002/bit.20800
Yokoyama, H., Moriya, N., Ohmori, H., Waki, M., Ogino, A., & Tanaka, Y. (2007). Community analysis of hydrogen-producing extreme thermophilic anaerobic microflora enriched from cow manure with five substrates. Applied Microbiology and Biotechnology, 77(1), 213–222. http://doi.org/10.1007/s00253-007-1144-0
Zecchina, A., Bordiga, S., Vitillo, J. G., Ricchiardi, G., Lamberti, C., Spoto, G., Bjorgen, M., Lillerud, K. P. (2005). Liquid hydrogen in protonic chabazite. Journal of the American Chemical Society, 127(17), 6361–6366. http://doi.org/10.1021/ja050276c
Zehnder, A. J. B., Huser, B. A., Brock, T. D., & Wuhrmann, K. (1980). Characterization of an acetate-decarboxylating, non-hydrogen-oxidizing methane bacterium. Archives of Microbiology, 124(1), 1–11. http://doi.org/10.1007/BF00407022
Zheng, H., Zeng, R. J., & Angelidaki, I. (2008). Biohydrogen production from glucose in upflow biofilm reactors with plastic carriers under extreme thermophilic conditions (70°C). Biotechnology and Bioengineering, 100(5), 1034–1038. http://doi.org/10.1002/bit.21826
Zheng, L., Bai, Z., Xu, T., & He, B. (2012). Glucokinase contributes to glucose phosphorylation in d-lactic acid production by Sporolactobacillus inulinus Y2-8. Journal of Industrial Microbiology & Biotechnology, 39(11), 1685–1692. http://doi.org/10.1007/s10295-012-1176-z