Embed Size (px)
Citation preview

Cellular scaling rules for rodent brainsSuzana Herculano-Houzel*†, Bruno Mota‡, and Roberto Lent*
*Departamento de Anatomia, Instituto de Ciencias Biomedicas, Universidade Federal do Rio de Janeiro, 21941-590, Rio de Janeiro, Brazil;and ‡Centro Brasileiro de Pesquisas Fısicas, 22290-180, Rio de Janeiro, Brazil
Communicated by Jon H. Kaas, Vanderbilt University, Nashville, TN, June 16, 2006 (received for review March 15, 2006)
How do cell number and size determine brain size? Here, we showthat, in the order Rodentia, increased size of the cerebral cortex,cerebellum, and remaining areas across six species is achievedthrough greater numbers of neurons of larger size, and muchgreater numbers of nonneuronal cells of roughly invariant size,such that the ratio between total neuronal and nonneuronal massremains constant across species. Although relative cerebellar sizeremains stable among rodents, the number of cerebellar neuronsincreases with brain size more rapidly than in the cortex, such thatthe cerebellar fraction of total brain neurons increases with brainsize. In contrast, although the relative cortical size increases withtotal brain size, the cortical fraction of total brain neurons remainsconstant. We propose that the faster increase in average neuronalsize in the cerebral cortex than in the cerebellum as these structuresgain neurons and the rapidly increasing glial numbers that gener-ate glial mass to match total neuronal mass at a fixed glia�neurontotal mass ratio are fundamental cellular constraints that lead tothe relative expansion of cerebral cortical volume across species.
allometry � brain size � comparative neuroanatomy � number of glia �number of neurons
Brain size varies by a factor of �100,000 across mammalianspecies (1, 2), and, although the cellular composition of the
brain is one of the major determinants of its computationalcapacities (3), little is known about how the cellular compositionvaries with brain size. What are the cellular scaling rules thatdetermine brain allometry? How do numbers of neuronal andnonneuronal cells contribute to structure size? What are therelative contributions of these cells across species of different brainsizes?
Glia are said to be the most numerous cell type in the brain (4,5) and to be 10–50 times more numerous than neurons in humans(6). Evidence for this assertion, however, is scant. The ratio betweenthe total number of glial and neuronal cells (glia�neuron ratio) inthe cerebral cortex has been shown to increase with brain size (1,7). However, the numeric expansion of glial cells relative to neuronsseems to contradict the observation that the neuronal need formetabolic support remains similar across species (8). Data on howneuronal and glial cell sizes scale with brain size might help solvethis discrepancy, but such data are lacking in the literature.
Not much is known, either, about the total numbers of neuronaland nonneuronal cells in the brains of different species, becausemethodological limitations have largely restricted comparativestudies of brain anatomy to analyses of volumetric data publishedby a small number of laboratories. Strikingly, analyses of the samedata yield conflicting conclusions. For instance, although theneocortical fraction of brain volume increases from 14% in basalinsectivores to 80% in humans (9), the cerebellar fraction varieslittle across individuals of different mammalian orders (10), adiscrepancy that the latter authors take to argue against thehypothesis that the cerebellum works in service of the neocortex.However, cerebellar and cerebral cortices increase concertedly inboth surface area (11) and volume (12), parameters used in theliterature to indicate computational capacity, and this evidence hasbeen taken to suggest a functional dependence of one structure onthe other. A conciliatory view holds that the cerebellum andneocortex evolved together but with the cerebellum evolving moreslowly than the neocortex (12).
These conflicting interpretations demonstrate that cortical vol-ume and surface, although informative measurements and widelyused in the literature, particularly in relation to intelligence, cog-nitive abilities, and versatility (13–15), are only indirect indicators ofcomputational capacity. A comparison of direct estimates of num-bers of neurons in these structures might be a better tool to clarifythe issue of how cerebral and cerebellar cortices are structurally andfunctionally related.
Here, we use the isotropic fractionator (16), a nonstereologicalmethod, to determine total numbers of neuronal and nonneuronalcells in the cerebral cortex, cerebellum, and remaining areas of thebrain and to examine how they scale across six species of the sameorder, Rodentia, from mouse to the giant Amazonian capybara.
ResultsAcross the six rodent species we studied, body mass varies �1,000-fold, from �40 g in the mouse to �40 kg in the capybara, whereasbrain mass varies by a factor of �200, accompanied by a smallerincrease of 45 times in total number of cells, and an even smaller22-times increase in the total number of neurons (Table 1). We findthat body mass (MBO) in adult individuals relates to total brain mass(MBR) by a power function, such that MBR � MBO
0.773 (see Fig. 5,which is published as supporting information on the PNAS website), in accordance with observations in rodents (17) and othermammalian orders (18), reporting that body size increases fasterthan brain size in phylogeny. Total brain mass also increases as apower function of the total number of cells (NC) in the brain of thesespecies (MBR � NC
1.323) and can be expressed as a steeper powerfunction of the total number of neurons with exponent 1.587.
Fractional Distribution of Cells and Neurons. The relative size of thecerebral cortex, expressed as the fraction of brain mass containedin this structure, increases significantly with brain size in theserodent species, whereas relative cerebellar mass remains constant,and relative mass of the remaining structures decreases, as de-scribed in the literature (10, 19) (Fig. 1). Interestingly, the fractionof neurons contained in each of these divisions behaves differently:Regardless of total brain size, the cerebral cortex in all six speciescontains a relatively stable 17.8 � 3.4% of all brain neurons (Fig.1a, � � �0.171; P � 0.5212, Spearman rank correlation). Incontrast, larger cerebella hold increasing fractions of total brainneurons, from 59.0 � 5.0% in the mouse to 72.4 � 3.3% in thecapybara (Fig. 1b, � � 0.739; P � 0.0057), whereas the fraction oftotal brain neurons contained in the remaining areas decreases withincreasing brain size (Fig. 1c, � � �0.807; P � 0.0025). These datasuggest that different neuronal scaling rules apply to the cerebralcortex, cerebellum, and remaining brain structures.
Structure Size as a Function of the Number of Neuronal and Nonneu-ronal Cells. We next assessed cellular scaling rules for these threebrain divisions by examining how tissue mass covaries with NC
Conflict of interest statement: No conflicts declared.
†To whom correspondence should be addressed at: Departamento de Anatomia, Institutode Ciencias Biomedicas, Universidade Federal do Rio de Janeiro, Avenida BrigadeiroTrompowski, s�n, Ilha do Fundao, RJ 21941-590, Rio de Janeiro, Brazil. E-mail:[email protected].
© 2006 by The National Academy of Sciences of the USA
12138–12143 � PNAS � August 8, 2006 � vol. 103 � no. 32 www.pnas.org�cgi�doi�10.1073�pnas.0604911103
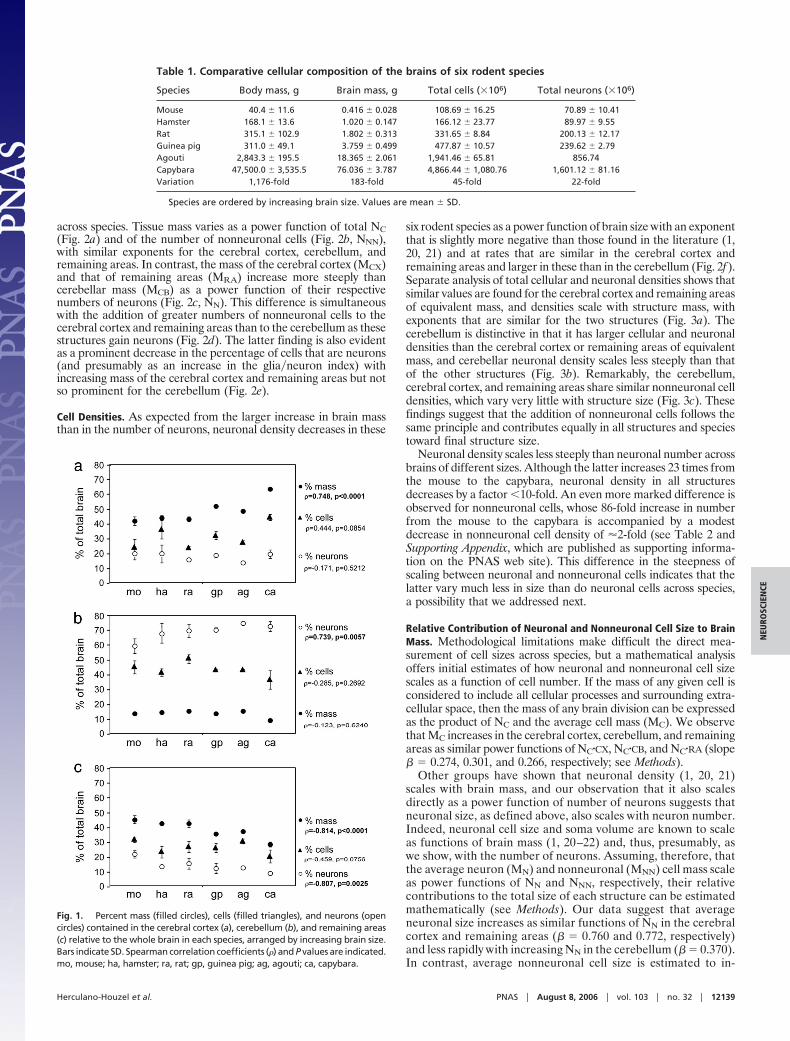
across species. Tissue mass varies as a power function of total NC(Fig. 2a) and of the number of nonneuronal cells (Fig. 2b, NNN),with similar exponents for the cerebral cortex, cerebellum, andremaining areas. In contrast, the mass of the cerebral cortex (MCX)and that of remaining areas (MRA) increase more steeply thancerebellar mass (MCB) as a power function of their respectivenumbers of neurons (Fig. 2c, NN). This difference is simultaneouswith the addition of greater numbers of nonneuronal cells to thecerebral cortex and remaining areas than to the cerebellum as thesestructures gain neurons (Fig. 2d). The latter finding is also evidentas a prominent decrease in the percentage of cells that are neurons(and presumably as an increase in the glia�neuron index) withincreasing mass of the cerebral cortex and remaining areas but notso prominent for the cerebellum (Fig. 2e).
Cell Densities. As expected from the larger increase in brain massthan in the number of neurons, neuronal density decreases in these
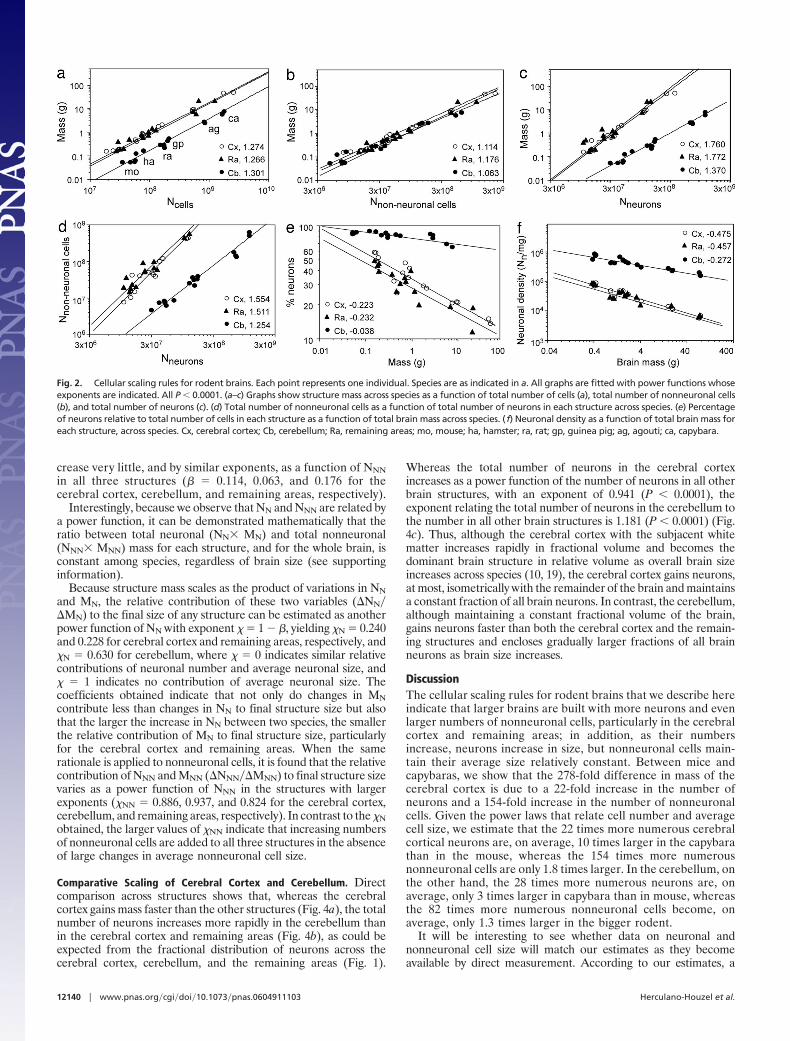
six rodent species as a power function of brain size with an exponentthat is slightly more negative than those found in the literature (1,20, 21) and at rates that are similar in the cerebral cortex andremaining areas and larger in these than in the cerebellum (Fig. 2f).Separate analysis of total cellular and neuronal densities shows thatsimilar values are found for the cerebral cortex and remaining areasof equivalent mass, and densities scale with structure mass, withexponents that are similar for the two structures (Fig. 3a). Thecerebellum is distinctive in that it has larger cellular and neuronaldensities than the cerebral cortex or remaining areas of equivalentmass, and cerebellar neuronal density scales less steeply than thatof the other structures (Fig. 3b). Remarkably, the cerebellum,cerebral cortex, and remaining areas share similar nonneuronal celldensities, which vary very little with structure size (Fig. 3c). Thesefindings suggest that the addition of nonneuronal cells follows thesame principle and contributes equally in all structures and speciestoward final structure size.
Neuronal density scales less steeply than neuronal number acrossbrains of different sizes. Although the latter increases 23 times fromthe mouse to the capybara, neuronal density in all structuresdecreases by a factor �10-fold. An even more marked difference isobserved for nonneuronal cells, whose 86-fold increase in numberfrom the mouse to the capybara is accompanied by a modestdecrease in nonneuronal cell density of �2-fold (see Table 2 andSupporting Appendix, which are published as supporting informa-tion on the PNAS web site). This difference in the steepness ofscaling between neuronal and nonneuronal cells indicates that thelatter vary much less in size than do neuronal cells across species,a possibility that we addressed next.
Relative Contribution of Neuronal and Nonneuronal Cell Size to BrainMass. Methodological limitations make difficult the direct mea-surement of cell sizes across species, but a mathematical analysisoffers initial estimates of how neuronal and nonneuronal cell sizescales as a function of cell number. If the mass of any given cell isconsidered to include all cellular processes and surrounding extra-cellular space, then the mass of any brain division can be expressedas the product of NC and the average cell mass (MC). We observethat MC increases in the cerebral cortex, cerebellum, and remainingareas as similar power functions of NC�CX, NC�CB, and NC�RA (slope� � 0.274, 0.301, and 0.266, respectively; see Methods).
Other groups have shown that neuronal density (1, 20, 21)scales with brain mass, and our observation that it also scalesdirectly as a power function of number of neurons suggests thatneuronal size, as defined above, also scales with neuron number.Indeed, neuronal cell size and soma volume are known to scaleas functions of brain mass (1, 20–22) and, thus, presumably, aswe show, with the number of neurons. Assuming, therefore, thatthe average neuron (MN) and nonneuronal (MNN) cell mass scaleas power functions of NN and NNN, respectively, their relativecontributions to the total size of each structure can be estimatedmathematically (see Methods). Our data suggest that averageneuronal size increases as similar functions of NN in the cerebralcortex and remaining areas (� � 0.760 and 0.772, respectively)and less rapidly with increasing NN in the cerebellum (� � 0.370).In contrast, average nonneuronal cell size is estimated to in-
Table 1. Comparative cellular composition of the brains of six rodent species
Species Body mass, g Brain mass, g Total cells (�106) Total neurons (�106)
Mouse 40.4 � 11.6 0.416 � 0.028 108.69 � 16.25 70.89 � 10.41Hamster 168.1 � 13.6 1.020 � 0.147 166.12 � 23.77 89.97 � 9.55Rat 315.1 � 102.9 1.802 � 0.313 331.65 � 8.84 200.13 � 12.17Guinea pig 311.0 � 49.1 3.759 � 0.499 477.87 � 10.57 239.62 � 2.79Agouti 2,843.3 � 195.5 18.365 � 2.061 1,941.46 � 65.81 856.74Capybara 47,500.0 � 3,535.5 76.036 � 3.787 4,866.44 � 1,080.76 1,601.12 � 81.16Variation 1,176-fold 183-fold 45-fold 22-fold
Species are ordered by increasing brain size. Values are mean � SD.
Fig. 1. Percent mass (filled circles), cells (filled triangles), and neurons (opencircles) contained in the cerebral cortex (a), cerebellum (b), and remaining areas(c) relative to the whole brain in each species, arranged by increasing brain size.Bars indicate SD. Spearman correlation coefficients (�) and P values are indicated.mo, mouse; ha, hamster; ra, rat; gp, guinea pig; ag, agouti; ca, capybara.
Herculano-Houzel et al. PNAS � August 8, 2006 � vol. 103 � no. 32 � 12139
NEU
ROSC
IEN
CE
crease very little, and by similar exponents, as a function of NNNin all three structures (� � 0.114, 0.063, and 0.176 for thecerebral cortex, cerebellum, and remaining areas, respectively).
Interestingly, because we observe that NN and NNN are related bya power function, it can be demonstrated mathematically that theratio between total neuronal (NN� MN) and total nonneuronal(NNN� MNN) mass for each structure, and for the whole brain, isconstant among species, regardless of brain size (see supportinginformation).
Because structure mass scales as the product of variations in NNand MN, the relative contribution of these two variables (�NN��MN) to the final size of any structure can be estimated as anotherpower function of NN with exponent � � 1 � �, yielding �N � 0.240and 0.228 for cerebral cortex and remaining areas, respectively, and�N � 0.630 for cerebellum, where � � 0 indicates similar relativecontributions of neuronal number and average neuronal size, and� � 1 indicates no contribution of average neuronal size. Thecoefficients obtained indicate that not only do changes in MNcontribute less than changes in NN to final structure size but alsothat the larger the increase in NN between two species, the smallerthe relative contribution of MN to final structure size, particularlyfor the cerebral cortex and remaining areas. When the samerationale is applied to nonneuronal cells, it is found that the relativecontribution of NNN and MNN (�NNN��MNN) to final structure sizevaries as a power function of NNN in the structures with largerexponents (�NN � 0.886, 0.937, and 0.824 for the cerebral cortex,cerebellum, and remaining areas, respectively). In contrast to the �Nobtained, the larger values of �NN indicate that increasing numbersof nonneuronal cells are added to all three structures in the absenceof large changes in average nonneuronal cell size.
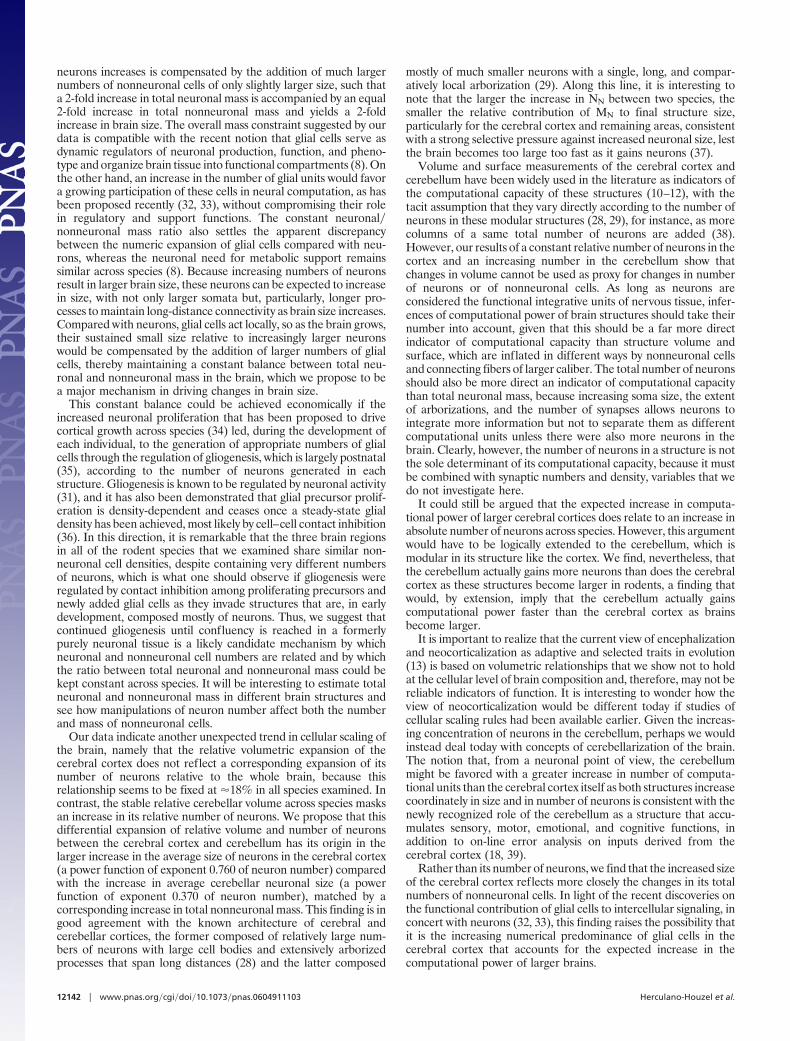
Comparative Scaling of Cerebral Cortex and Cerebellum. Directcomparison across structures shows that, whereas the cerebralcortex gains mass faster than the other structures (Fig. 4a), the totalnumber of neurons increases more rapidly in the cerebellum thanin the cerebral cortex and remaining areas (Fig. 4b), as could beexpected from the fractional distribution of neurons across thecerebral cortex, cerebellum, and the remaining areas (Fig. 1).
Whereas the total number of neurons in the cerebral cortexincreases as a power function of the number of neurons in all otherbrain structures, with an exponent of 0.941 (P � 0.0001), theexponent relating the total number of neurons in the cerebellum tothe number in all other brain structures is 1.181 (P � 0.0001) (Fig.4c). Thus, although the cerebral cortex with the subjacent whitematter increases rapidly in fractional volume and becomes thedominant brain structure in relative volume as overall brain sizeincreases across species (10, 19), the cerebral cortex gains neurons,at most, isometrically with the remainder of the brain and maintainsa constant fraction of all brain neurons. In contrast, the cerebellum,although maintaining a constant fractional volume of the brain,gains neurons faster than both the cerebral cortex and the remain-ing structures and encloses gradually larger fractions of all brainneurons as brain size increases.
DiscussionThe cellular scaling rules for rodent brains that we describe hereindicate that larger brains are built with more neurons and evenlarger numbers of nonneuronal cells, particularly in the cerebralcortex and remaining areas; in addition, as their numbersincrease, neurons increase in size, but nonneuronal cells main-tain their average size relatively constant. Between mice andcapybaras, we show that the 278-fold difference in mass of thecerebral cortex is due to a 22-fold increase in the number ofneurons and a 154-fold increase in the number of nonneuronalcells. Given the power laws that relate cell number and averagecell size, we estimate that the 22 times more numerous cerebralcortical neurons are, on average, 10 times larger in the capybarathan in the mouse, whereas the 154 times more numerousnonneuronal cells are only 1.8 times larger. In the cerebellum, onthe other hand, the 28 times more numerous neurons are, onaverage, only 3 times larger in capybara than in mouse, whereasthe 82 times more numerous nonneuronal cells become, onaverage, only 1.3 times larger in the bigger rodent.
It will be interesting to see whether data on neuronal andnonneuronal cell size will match our estimates as they becomeavailable by direct measurement. According to our estimates, a
Fig. 2. Cellular scaling rules for rodent brains. Each point represents one individual. Species are as indicated in a. All graphs are fitted with power functions whoseexponents are indicated. All P � 0.0001. (a–c) Graphs show structure mass across species as a function of total number of cells (a), total number of nonneuronal cells(b), and total number of neurons (c). (d) Total number of nonneuronal cells as a function of total number of neurons in each structure across species. (e) Percentageof neurons relative to total number of cells in each structure as a function of total brain mass across species. (f) Neuronal density as a function of total brain mass foreach structure, across species. Cx, cerebral cortex; Cb, cerebellum; Ra, remaining areas; mo, mouse; ha, hamster; ra, rat; gp, guinea pig; ag, agouti; ca, capybara.
12140 � www.pnas.org�cgi�doi�10.1073�pnas.0604911103 Herculano-Houzel et al.

rodent brain with a human-sized cerebellum would be expected tohave �900 times more cerebellar nonneuronal cells that are, onaverage, only 1.5 times larger than in the mouse cerebellum. Recentmeasurements of human astrocytes have shown that they are only3 times larger than mouse astrocytes,§ which seems to be goodevidence that nonneuronal cell size indeed changes very little withcell number. Similarly, Purkinje cells are 50 times more numerousin the human (24) than in the rat cerebellum (25) and would,therefore, be expected to be 4.2 times larger in the former,according to our estimates; in the literature, these cells have beenfound to have a 2.5 times bigger perykaryon (26), which falls closeenough to the expected value, given that the arborizations were notconsidered in that study.
So far, we have been unable to analyze separate neuronalsubpopulations. Although our estimates refer to the total popula-tion of neurons, the literature suggests that similar scaling lawsapply to some aspects of different neuronal populations within each
structure. For example, neuronal density scales in all three cere-bellar layers, of strikingly different cellular compositions, as powerfunctions of cerebellar weight with similar exponents, even thoughthe ratio between numbers of granular and Purkinje cells changes(27). To the extent that the organization of both cerebral (28) andcerebellar (29) cortices is modular, with the same basic laminar,tangential, and connective organization throughout in columnarfunctional units along the surface, some aspects of cellular allom-etry can be expected to scale at similar rates among neuronalsubtypes as more modules are added, and it will be informative todetermine which aspects do and which do not.
Our data suggest that cell number and mass are regulated in sucha way that the ratio between total neuronal and total nonneuronalmass is kept constant in the brain, even though the glia�neuronindex increases along with brain mass (30, 31). This finding meansthat the significant increase in neuronal size as the number of
§Oberheim, N. E., Wang, X., Xu, Q., Takano, T. & Nedergaard, M. (2005) Soc. Neurosci.Abstr., abstr. 386.9.
Fig. 3. Variation intotal (a),neuronal (b), andnonneuronal (c) celldensity inthecerebral cortex, cerebellum, and remaining areas as a function of structure mass.All graphs are fitted with power functions whose exponents are indicated. (a andb) All P � 0.0001. (c) P � 0.0009 (Cx and Cb); P � 0.0611 (Ra). Fig. 4. Variation inmass (a)andtotalnumberofneurons (bandc)ofcerebellum
and remaining areas as a function of these values in the cerebral cortex (a and b)and in the other structures (c). Power function exponents are indicated. P �0.0001 (a) and P � 0.0005 (b and c). Notice that, although cerebellar massincreases at a smaller rate than cerebral cortical mass, the total number ofcerebellar neurons grows more rapidly than that in the cerebral cortex.
Herculano-Houzel et al. PNAS � August 8, 2006 � vol. 103 � no. 32 � 12141
NEU
ROSC
IEN
CE
neurons increases is compensated by the addition of much largernumbers of nonneuronal cells of only slightly larger size, such thata 2-fold increase in total neuronal mass is accompanied by an equal2-fold increase in total nonneuronal mass and yields a 2-foldincrease in brain size. The overall mass constraint suggested by ourdata is compatible with the recent notion that glial cells serve asdynamic regulators of neuronal production, function, and pheno-type and organize brain tissue into functional compartments (8). Onthe other hand, an increase in the number of glial units would favora growing participation of these cells in neural computation, as hasbeen proposed recently (32, 33), without compromising their rolein regulatory and support functions. The constant neuronal�nonneuronal mass ratio also settles the apparent discrepancybetween the numeric expansion of glial cells compared with neu-rons, whereas the neuronal need for metabolic support remainssimilar across species (8). Because increasing numbers of neuronsresult in larger brain size, these neurons can be expected to increasein size, with not only larger somata but, particularly, longer pro-cesses to maintain long-distance connectivity as brain size increases.Compared with neurons, glial cells act locally, so as the brain grows,their sustained small size relative to increasingly larger neuronswould be compensated by the addition of larger numbers of glialcells, thereby maintaining a constant balance between total neu-ronal and nonneuronal mass in the brain, which we propose to bea major mechanism in driving changes in brain size.
This constant balance could be achieved economically if theincreased neuronal proliferation that has been proposed to drivecortical growth across species (34) led, during the development ofeach individual, to the generation of appropriate numbers of glialcells through the regulation of gliogenesis, which is largely postnatal(35), according to the number of neurons generated in eachstructure. Gliogenesis is known to be regulated by neuronal activity(31), and it has also been demonstrated that glial precursor prolif-eration is density-dependent and ceases once a steady-state glialdensity has been achieved, most likely by cell–cell contact inhibition(36). In this direction, it is remarkable that the three brain regionsin all of the rodent species that we examined share similar non-neuronal cell densities, despite containing very different numbersof neurons, which is what one should observe if gliogenesis wereregulated by contact inhibition among proliferating precursors andnewly added glial cells as they invade structures that are, in earlydevelopment, composed mostly of neurons. Thus, we suggest thatcontinued gliogenesis until confluency is reached in a formerlypurely neuronal tissue is a likely candidate mechanism by whichneuronal and nonneuronal cell numbers are related and by whichthe ratio between total neuronal and nonneuronal mass could bekept constant across species. It will be interesting to estimate totalneuronal and nonneuronal mass in different brain structures andsee how manipulations of neuron number affect both the numberand mass of nonneuronal cells.
Our data indicate another unexpected trend in cellular scaling ofthe brain, namely that the relative volumetric expansion of thecerebral cortex does not reflect a corresponding expansion of itsnumber of neurons relative to the whole brain, because thisrelationship seems to be fixed at �18% in all species examined. Incontrast, the stable relative cerebellar volume across species masksan increase in its relative number of neurons. We propose that thisdifferential expansion of relative volume and number of neuronsbetween the cerebral cortex and cerebellum has its origin in thelarger increase in the average size of neurons in the cerebral cortex(a power function of exponent 0.760 of neuron number) comparedwith the increase in average cerebellar neuronal size (a powerfunction of exponent 0.370 of neuron number), matched by acorresponding increase in total nonneuronal mass. This finding is ingood agreement with the known architecture of cerebral andcerebellar cortices, the former composed of relatively large num-bers of neurons with large cell bodies and extensively arborizedprocesses that span long distances (28) and the latter composed
mostly of much smaller neurons with a single, long, and compar-atively local arborization (29). Along this line, it is interesting tonote that the larger the increase in NN between two species, thesmaller the relative contribution of MN to final structure size,particularly for the cerebral cortex and remaining areas, consistentwith a strong selective pressure against increased neuronal size, lestthe brain becomes too large too fast as it gains neurons (37).
Volume and surface measurements of the cerebral cortex andcerebellum have been widely used in the literature as indicators ofthe computational capacity of these structures (10–12), with thetacit assumption that they vary directly according to the number ofneurons in these modular structures (28, 29), for instance, as morecolumns of a same total number of neurons are added (38).However, our results of a constant relative number of neurons in thecortex and an increasing number in the cerebellum show thatchanges in volume cannot be used as proxy for changes in numberof neurons or of nonneuronal cells. As long as neurons areconsidered the functional integrative units of nervous tissue, infer-ences of computational power of brain structures should take theirnumber into account, given that this should be a far more directindicator of computational capacity than structure volume andsurface, which are inflated in different ways by nonneuronal cellsand connecting fibers of larger caliber. The total number of neuronsshould also be more direct an indicator of computational capacitythan total neuronal mass, because increasing soma size, the extentof arborizations, and the number of synapses allows neurons tointegrate more information but not to separate them as differentcomputational units unless there were also more neurons in thebrain. Clearly, however, the number of neurons in a structure is notthe sole determinant of its computational capacity, because it mustbe combined with synaptic numbers and density, variables that wedo not investigate here.
It could still be argued that the expected increase in computa-tional power of larger cerebral cortices does relate to an increase inabsolute number of neurons across species. However, this argumentwould have to be logically extended to the cerebellum, which ismodular in its structure like the cortex. We find, nevertheless, thatthe cerebellum actually gains more neurons than does the cerebralcortex as these structures become larger in rodents, a finding thatwould, by extension, imply that the cerebellum actually gainscomputational power faster than the cerebral cortex as brainsbecome larger.
It is important to realize that the current view of encephalizationand neocorticalization as adaptive and selected traits in evolution(13) is based on volumetric relationships that we show not to holdat the cellular level of brain composition and, therefore, may not bereliable indicators of function. It is interesting to wonder how theview of neocorticalization would be different today if studies ofcellular scaling rules had been available earlier. Given the increas-ing concentration of neurons in the cerebellum, perhaps we wouldinstead deal today with concepts of cerebellarization of the brain.The notion that, from a neuronal point of view, the cerebellummight be favored with a greater increase in number of computa-tional units than the cerebral cortex itself as both structures increasecoordinately in size and in number of neurons is consistent with thenewly recognized role of the cerebellum as a structure that accu-mulates sensory, motor, emotional, and cognitive functions, inaddition to on-line error analysis on inputs derived from thecerebral cortex (18, 39).
Rather than its number of neurons, we find that the increased sizeof the cerebral cortex reflects more closely the changes in its totalnumbers of nonneuronal cells. In light of the recent discoveries onthe functional contribution of glial cells to intercellular signaling, inconcert with neurons (32, 33), this finding raises the possibility thatit is the increasing numerical predominance of glial cells in thecerebral cortex that accounts for the expected increase in thecomputational power of larger brains.
12142 � www.pnas.org�cgi�doi�10.1073�pnas.0604911103 Herculano-Houzel et al.

In any case, given the discrepancies we show between theprevious volumetric and the cellular scaling rules for rodent brains,our findings suggest that the cognitive and ecological significance ofspecies differences in brain size should be reevaluated by examiningdirectly the numbers of neuronal and nonneuronal cells and not justvolume or surface area.
MethodsAnimals. Adult male Swiss mice (Mus musculus, n � 4), goldenhamsters (Mesocrycetus auratus, n � 2), and Wistar rats (Rattusnorvegicus, n � 4; data from this species appeared in a previousmethods paper) (16) were bred at the colony at the Instituto deCiencias Biomedicas, Universidade Federal do Rio de Janeiroand were 2–5 months of age by the time of the experiments. Twoyoung adult, 1-month-old male guinea pigs (Cavia porcellus)were supplied by Carlos Virgınio Coda (Rio de Janeiro). Threeadult agoutis (Dasyprocta primnolopha, one female) and twoadult female capybaras (Hydrochoerus hydrochoeris) of undeter-mined age were donated by the Federal University of Para andthe Brazilian Institute for Environmental Protection (IBAMA,Belem, Brazil), respectively.
Dissection. All animals were killed by inhalation of ether, weighed,and perfused transcardially with 0.9% saline, followed by 4%phosphate-buffered paraformaldehyde. The brains were removedfrom the skulls by using the foramen magnum as the lower limit anddissected free of dura mater and superficial blood vessels, weighed,and postfixed for 2 weeks to 12 months by immersion in 4%phosphate-buffered paraformaldehyde. The cerebellum was dis-sected by cutting the cerebellar peduncles at the surface of thebrainstem. The cerebral cortex in all animals was defined as allcortical regions lateral to the olfactory tract, including the hip-pocampus, and was dissected from each hemisphere by peeling thecerebral cortex away from the striatum and other subcorticalstructures under a stereomicroscope. All other brain structures,including the olfactory bulb, were pooled and processed together as‘‘remaining areas.’’ In mice, hamsters, rats, and guinea pigs, the twohemispheres were counted together; in agoutis and capybaras, onlyone of the two hemispheres was processed, and results weremultiplied by 2 to estimate numbers for the whole brain.
Isotropic Fractionator. Total numbers of cells, neurons, and non-neuronal cells were estimated as described by using the isotropicfractionator method (16). Briefly, each dissected brain divisionis turned into an isotropic suspension of isolated nuclei of known,defined volume, kept homogeneous by agitation. The totalnumber of nuclei in suspension and, therefore, the total numberof cells in the original tissue, is estimated by determining thedensity of nuclei in small aliquots stained with the fluorescent
DNA marker DAPI (4-6-diamidino-2-phenylindole dihydro-chloride) under the microscope. Once the total cell number wasknown, the proportion of neurons was determined by immuno-cytochemical detection of neuronal nuclear antigen (NeuN),expressed in all nuclei of most neuronal cell types and not innonneuronal cells (23, 40). Estimates of the proportion ofNeuN-positive nuclei are considered reliable, because the coef-ficient of variation among animals of the same species is typically�0.15 (see supporting information). Numbers of nonneuronalcells are derived by subtraction.
Data Analysis. All statistical analyses and regressions were per-formed in Statview (SAS, Cary, NC). Nonparametric Spearmanrank correlations were calculated for fractional distributions ofmass, number of cells, and number of neurons across speciesbecause there was no way to ascertain that the variables werenormally distributed.
Estimates of Scaling of Average Cell Size. Considering that total brainmass (MBR) can be expressed as the product of the total number ofcells (NcBR) and their average size (or mass, Mc), here consideredto include all cellular processes and surrounding extracellular space,it is possible to estimate the relative contributions of cell numberand average cell size to final brain mass. Because MBR � NcBR �Mc, the slopes (�) of the power function Mc � Nc
� for each structurecan be inferred from the slopes (�) of the power functions relatingM � Nc
� in Fig. 3, as � � � � 1.
Estimates of Scaling of Average Neuronal and Nonneuronal Cell Size.The contributions of average neuronal (MN) and nonneuronal(MNN) cell mass to the total size of each structure can also beestimated by assuming that MN and MNN vary as power functionsof neuronal (NN) and nonneuronal (NNN) cell number, respectively,which is warranted by estimates of changes in cell size with brainmass (1, 19, 20) and by the finding that neuronal density decreaseswith increasing brain mass (1, 20, 21). Based on this assumption, ifM � NN � MN NNN � MNN and the exponents � relating M �NN
� and M � Nnn� are known, the slopes (�) of the power functions
MN � NN� and MNN � NNN
� can also be inferred from the slopes(�) in Fig. 3, as � � � � 1 (see supporting information).
We thank Jean-Christophe Houzel [Universidade Federal do Rio deJaneiro (UFRJ)], Cristovam Picanco-Diniz, Ivanira Dias, CarlomagnoBahia (Universidade Federal do Para, Brazil), and the Instituto Brasileirodo Meio Ambiente for providing agouti and capybara specimens; CristianoNascimento Costa for help in some experiments; Adiel Nascimento forexpert animal care; Elizabeth de Moraes and Antonia Lima Carvalho fortechnical assistance; Vivaldo Moura-Neto, Flavia Gomes, and Jose GarciaAbreu (UFRJ) for providing materials; and Robert H. Miller for bringingdensity-dependent gliogenesis to our attention. This work was supported bythe Fundacao Carlos Chagas Filho de Amparo a Pesquisa do Estado do Riode Janeiro Primeiros Projetos and CNPq-PRONEX.
1. Stolzenburg, J. U., Reichenbach, A & Neumann, M. (1989) Glia 2, 78–84.2. Tower, D. B. (1954) J. Comp. Neurol. 101, 19–51.3. Williams, R. W. & Herrup, K. (1988) Annu. Rev. Neurosci. 11, 423–453.4. Doetsch, F. (2003) Nat. Neurosci. 6, 1127–1134.5. Nishiyama, A., Yang, Z. & Butt, A. (2005) J. Anat. 207, 687–693.6. Kandel, E., Schwartz, J. & Jessel, T. (2000) Principles of Neural Science (McGraw–Hill, New
York) 4th Ed., p. 20.7. Hawkins, A. & Olszewski, J. (1957) Science 126, 76–77.8. Nedergaard, M., Ransom, B. & Goldman, S. A. (2003) Trends Neurosci. 26, 523–530.9. Frahm, H. D., Stephan, H. & Stephan, M. (1982) J. Hirnforsch. 23, 375–389.
10. Clark, D. A., Mitra, P. P. & Wang, S. S. (2001) Nature 411, 189–193.11. Sultan, F. (2002) Nature 415, 133–134.12. Barton, R. A. (2002) Nature 415, 134–135.13. Jerison, H. J. (1985) Philos. Trans. R. Soc. London Ser. B 308, 21–35.14. Reader, S. M. & Laland, K. N. (2002) Proc. Natl. Acad. Sci. USA 99, 4436–4441.15. Sol, D., Duncan, R. P., Blackburn, T. M., Cassey, P. & Lefebvre, L. (2005) Proc. Natl. Acad.
Sci. USA 102, 5460–5465.16. Herculano-Houzel, S. & Lent, R. (2005) J. Neurosci. 25, 2518–2521.17. Fox, J. H. & Wilczynski, W. (1986) Brain Behav. Evol. 28, 157–169.18. Martin, R. D. (1981) Nature 293, 57–60.19. Stephan, H., Frahm, H. & Baron, G. (1981) Folia Primatol. 35, 1–29.20. Haug, H. (1987) Am. J. Anat. 180, 126–142.
21. Tower, D. B. & Elliot, K. A. C. (1952) Am. J. Physiol. 168, 747–759.22. Shariff, G. A. (1953) J. Comp. Neurol. 98, 381–400.23. Gittins, R. & Herrison, P. J. (2004) Brain Res. Bull. 63, 155–160.24. Andersen, B. B., Korbo, L. & Pakkenberg, B. (1992) J. Comp. Neurol. 326, 549–560.25. Korbo, L., Andersen, B. B., Ladefoged, O. & Moller, A. (1993) Brain Res. 609, 262–268.26. Korbo, L. & Andersen, B. B. (1995) Neuroscience 69, 151–158.27. Lange, W. (1975) Cell Tiss. Res. 157, 115–124.28. Douglas, R. J. & Martin, K. A. C. (2004) Annu. Rev. Neurosci. 27, 419–451.29. Leiner, H. C., Leiner A. L. & Dow, R. S. (1991) Behav. Brain Res. 44, 113–128.30. Tower, D. B. & Young, O. M. (1973) J. Neurochem. 20, 269–278.31. Reichenbach, A. (1989) Glia 2, 71–77.32. Allen, N. J. & Barres, B. A. (2005) Curr. Opin. Neurobiol. 15, 542–548.33. Volterra, A. & Meldolesi, J. (2005) Nat. Rev. Neurosci. 6, 626–640.34. Rakic, P. (1995) Trends Neurosci. 18, 383–388.35. Sauvageot, C. M. & Stiles, C. D. (2002) Curr. Opin. Neurobiol. 12, 244–249.36. Zhang, H. & Miller, R. H. (1996) J. Neurosci. 16, 6886–6895.37. Harrison, K. H., Hof, P. R. & Wang, S. S. (2002) J. Neurocytol. 31, 289–298.38. Rockel, A. J., Hiorns, R. W. & Powell, T. P. (1980) Brain 103, 221–244.39. Andreasen, N. C., O’Leary, D. S., Cizadlo, T., Arndt, S., Rezai, K., Boles Ponto, L. L.,
Watkins, G. L. & Hichwa, R. D. (1996) Proc. Natl. Acad. Sci. USA 93, 9985–9990.40. Mullen, R. J., Buck, C. R. & Smith, A. M. (1992) Development (Cambridge, U.K.) 116,
201–211.
Herculano-Houzel et al. PNAS � August 8, 2006 � vol. 103 � no. 32 � 12143
NEU
ROSC
IEN
CE