Embed Size (px)
Citation preview
Characterization of particulate organic matter in a Guanabara Bay-coastal ocean transect using elemental, isotopic and molecular
markers
JULIANNA M. A. MARTINS1, TAISSA S. M. SILVA1, ALEXANDRE M. FERNANDES2,CARLOS G. MASSONE1 & RENATO S. CARREIRA1*
1 Pontifícia Universidade Católica do Rio de Janeiro, Departamento de Química, Laboratório de EstudosMarinhos e Ambientais. Rua Marquês de São Vicente, 225, Rio de Janeiro, RJ, CEP: 22451-900, Brazil. 2 Universidade do Estado do Rio de Janeiro, Faculdade de Oceanografia. Rua São Francisco Xavier, 524,Rio de Janeiro, RJ, CEP: 20550-900, Brazil
*Corresponding author: [email protected]
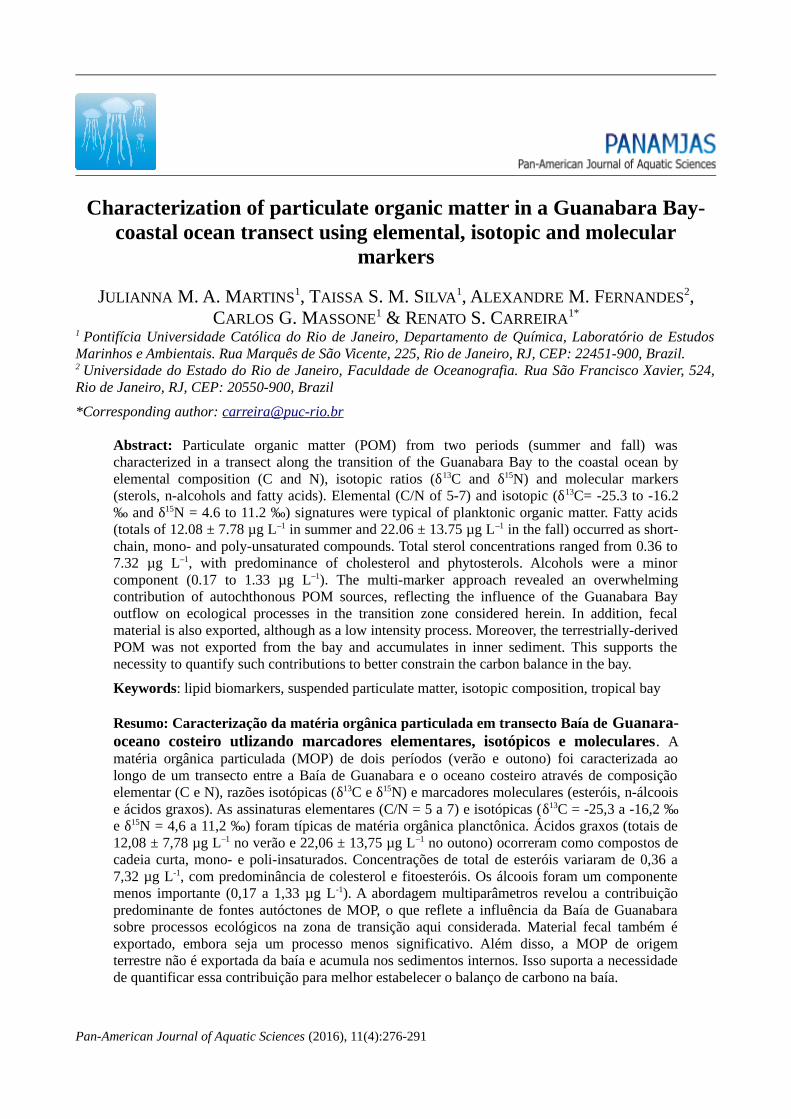
Abstract: Particulate organic matter (POM) from two periods (summer and fall) wascharacterized in a transect along the transition of the Guanabara Bay to the coastal ocean byelemental composition (C and N), isotopic ratios (δ13C and δ15N) and molecular markers(sterols, n-alcohols and fatty acids). Elemental (C/N of 5-7) and isotopic (δ13C= -25.3 to -16.2‰ and δ15N = 4.6 to 11.2 ‰) signatures were typical of planktonic organic matter. Fatty acids(totals of 12.08 ± 7.78 µg L–1 in summer and 22.06 ± 13.75 µg L–1 in the fall) occurred as short-chain, mono- and poly-unsaturated compounds. Total sterol concentrations ranged from 0.36 to7.32 µg L–1, with predominance of cholesterol and phytosterols. Alcohols were a minorcomponent (0.17 to 1.33 µg L–1). The multi-marker approach revealed an overwhelmingcontribution of autochthonous POM sources, reflecting the influence of the Guanabara Bayoutflow on ecological processes in the transition zone considered herein. In addition, fecalmaterial is also exported, although as a low intensity process. Moreover, the terrestrially-derivedPOM was not exported from the bay and accumulates in inner sediment. This supports thenecessity to quantify such contributions to better constrain the carbon balance in the bay.
Keywords: lipid biomarkers, suspended particulate matter, isotopic composition, tropical bay
Resumo: Caracterização da matéria orgânica particulada em transecto Baía de Guanara-oceano costeiro utlizando marcadores elementares, isotópicos e moleculares. Amatéria orgânica particulada (MOP) de dois períodos (verão e outono) foi caracterizada aolongo de um transecto entre a Baía de Guanabara e o oceano costeiro através de composiçãoelementar (C e N), razões isotópicas (δ13C e δ15N) e marcadores moleculares (esteróis, n-álcooise ácidos graxos). As assinaturas elementares (C/N = 5 a 7) e isotópicas (δ13C = -25,3 a -16,2 ‰e δ15N = 4,6 a 11,2 ‰) foram típicas de matéria orgânica planctônica. Ácidos graxos (totais de12,08 ± 7,78 µg L–1 no verão e 22,06 ± 13,75 µg L–1 no outono) ocorreram como compostos decadeia curta, mono- e poli-insaturados. Concentrações de total de esteróis variaram de 0,36 a7,32 µg L-1, com predominância de colesterol e fitoesteróis. Os álcoois foram um componentemenos importante (0,17 a 1,33 µg L-1). A abordagem multiparâmetros revelou a contribuiçãopredominante de fontes autóctones de MOP, o que reflete a influência da Baía de Guanabarasobre processos ecológicos na zona de transição aqui considerada. Material fecal também éexportado, embora seja um processo menos significativo. Além disso, a MOP de origemterrestre não é exportada da baía e acumula nos sedimentos internos. Isso suporta a necessidadede quantificar essa contribuição para melhor estabelecer o balanço de carbono na baía.
Pan-American Journal of Aquatic Sciences (2016), 11(4):276-291
Eutrophic bay influence on the coastal ocean 277
Palavras-chave: lipídios biomarcadores, material particulado em suspensão, composiçãoisotópica, baía tropical.
IntroductionRivers, estuaries/bays, tidal
wetlands/mangroves and the coastal ocean representa continuum of distinct but connected ecosystemsthat play an important role in the global carbon cycle(Hedges & Keil 1995; Bianchi & Canuel 2011;Bauer et al. 2013). Estuaries, in particular, are highlydynamic transitional regions where the mixture ofriver and sea water results in strong gradients ofphysico-chemical and chemical properties (Hobbie2000). Therefore, estuaries are not only conduits ofmaterials exchanged from land to sea reservoirs, butthey also produce, transform, accumulate and/orexport organic matter (Canuel et al. 2012). Carbonfluxes and cycling in estuaries are controlled bychanges in precipitation, estuarine geomorphologyand the magnitude and stoichiometry of nutrientinput (Canuel et al. 2012; Bauer et al. 2013).Dissolved organic carbon (DOC) and particulateorganic carbon (POC) in estuaries are derived fromterrestrial, marine and estuarine primaryproductions. In situ production of OC in someestuarine waters can be significant to the coastalcarbon budget because it can equal or exceed riveror marine supplies. Estuaries also experiencesignificant losses of OC owing to the combinedinfluences of microbial degradation andphotochemical oxidation, scavenging,sedimentation, and salinity-induced flocculation ofDOC and POC (Canuel et al. 2012; Bauer et al.2013).
Molecular biomarkers are organic compoundswhose origin and/or chemical transformation may berelated to a particular source of organic matter (OM)(Bianchi 2011). Lipids are less abundant in OM thanproteins and other compounds, but they are the mostcommon molecular markers in organic geochemistrybecause of their source-specificity and higherresistance to diagenesis than other organic groups(Volkman 2006; Bianchi & Canuel 2011). A benefitof using lipid biomarkers is that these compoundsprovide the ability to trace OM from phytoplankton,zooplankton, bacteria, and vascular plants,simultaneously. Different lipid classes, such ashydrocarbons, n-alkanes, fatty acids, sterols, n-alcohols and many others have been extensivelyused as molecular markers to assess the inputs ofnatural and anthropogenic OM to coastalenvironments (see reviews in Volkman 2006;Bianchi & Canuel 2011; Bianchi & Bauer 2012).
Lipid biomarkers and isotopic and elementalcompositions have been considered to trace theinputs of natural and anthropogenic OM to severaldifferent aquatic systems along the Brazilian coast.These include estuaries and/or coastal bays (e.g.,Martins et al. 2011; de Abreu-Mota et al. 2014;Richard et al. 2014; Carreira et al. 2016), lagoons(Carreira et al. 2011; Costa et al. 2011; Silva &Madureira 2012), mangroves (Mater et al. 2004) andalong the continental margin (Carreira et al. 2012;Carreira et al. 2015a,b). Among then, the GuanabaraBay, in the Rio de Janeiro metropolitan region, is ofspecial interest due to its economic, social, historicand environmental relevance.
The environmental changes in the GuanabaraBay were noticed in the early 1800’s, but intensifiedin the last half of the 20th century. Information isavailable, for example, regarding the input ofsewage and eutrophication (Kjerfve et al. 1997;Carreira et al. 2004; Lazzari et al. 2016),contamination of water, sediment and/or biota bytoxic metals (Neto et al. 2006; Rangel et al. 2011;Abreu et al. 2016; de Carvalho Aguiar et al. 2016),hydrocarbons (Wagener et al. 2012; Mauad et al.2015) and persistent organic pollutants (Dorneles etal. 2013), as well as changes in pelagic and benthiccommunities (Valentin et al. 1999; Eichler et al.2003; Guenther et al. 2008; Vieira et al. 2008;Guenther et al. 2012; Fistarol et al. 2015).
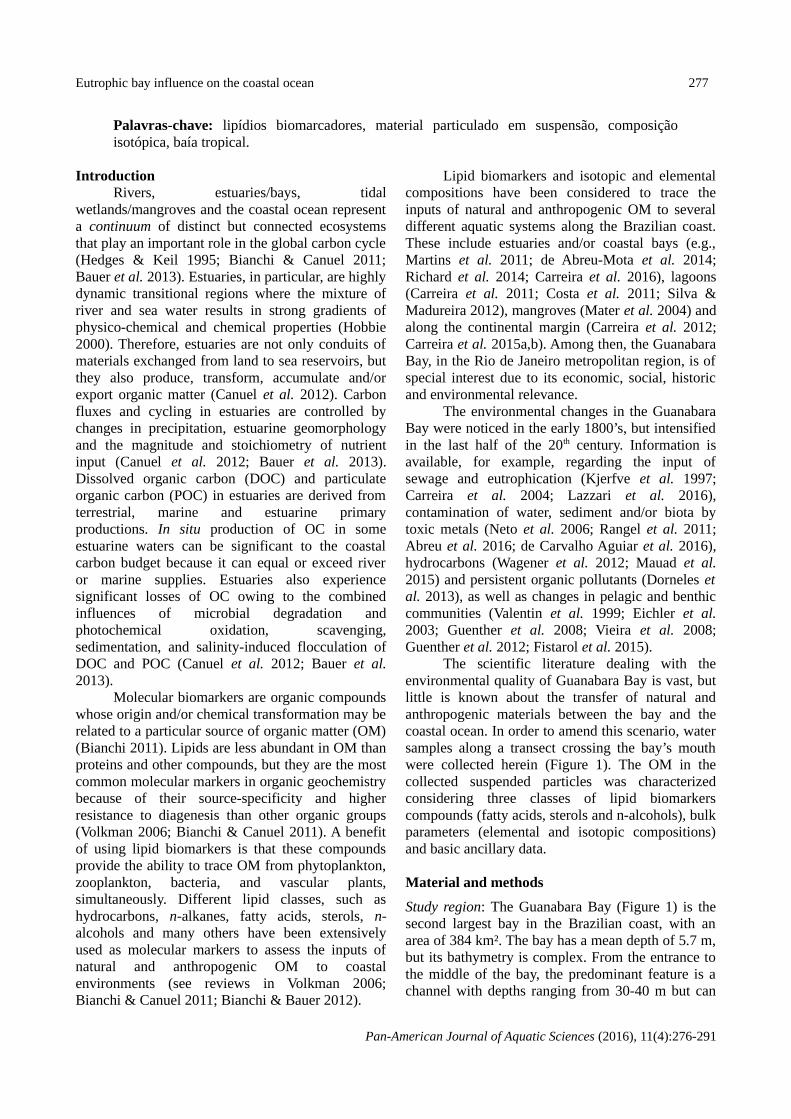
The scientific literature dealing with theenvironmental quality of Guanabara Bay is vast, butlittle is known about the transfer of natural andanthropogenic materials between the bay and thecoastal ocean. In order to amend this scenario, watersamples along a transect crossing the bay’s mouthwere collected herein (Figure 1). The OM in thecollected suspended particles was characterizedconsidering three classes of lipid biomarkerscompounds (fatty acids, sterols and n-alcohols), bulkparameters (elemental and isotopic compositions)and basic ancillary data.
Material and methods
Study region: The Guanabara Bay (Figure 1) is thesecond largest bay in the Brazilian coast, with anarea of 384 km². The bay has a mean depth of 5.7 m,but its bathymetry is complex. From the entrance tothe middle of the bay, the predominant feature is achannel with depths ranging from 30-40 m but can
Pan-American Journal of Aquatic Sciences (2016), 11(4):276-291
278 J. M. A. MARTINS ET AL.
reach over 50 m in some depressions, whereas in thenorth-western sector depths as low as 0.5 m areobserved (Catanzaro et al. 2004). The hydrographicbasin extending over 4,000 km2 includes 45 rivers,six of which are responsible for 85% of the meanannual runoff of 100 59 m3 s-1 (Kjerfve et al.1997). The climate in the region is tropical humid,with a rainy summer and a dry winter; the meanannual temperature and rainfall are, respectively,23.7 ºC and 1500 mm (JICA 1994).
Tidal currents define the water circulationpattern in the bay, although gravitational currents arealso important (Kjerfve et al. 1997). Maxima currentvelocities of 80-150 cm s-1 have been observed at theentrance of the bay, whereas in the middle bay theyvary around 30-50 cm-1, while current velocitiesbelow 30 cm s-1 are observed in the inner bay (JICA1994). Tidal amplitude averages at 0.7 m, but variesfrom 1.1 to 0.3 cm s-1 during spring and neap tides,respectively. The estimated short mean half-watervolume renewal is 11.4 days, although in some partsof the bay this time is considerably higher (Kjerfveet al. 1997).
Sampling and field measurements: Samples werecollected in January 2014 (summer) and May 2014(fall) at six stations distributed along the north-southaxis of Guanabara Bay (Figure 1). A large volume insitu McLane (model LTV-08) pump was used tocollect suspended particles at 1 m water depth ontopre-combusted (450 ºC overnight) glass microfiberfilters (Whatman type GF/F, 142 mm, 0.7 µmparticle retention). The pump operated at a flow rateof 7 L min–1 and stopped when the flow decreased to4 L min-1. Between 12 and 50 L were filtered at eachstation. Filters were stored in pre-combusted Petridishes and kept refrigerated on ice until arrival at thelaboratory.
Total suspended particulate matter (SPM),particulate organic carbon, particulate total nitrogen(TN) and isotopic (δ13C and δ15N) compositions ofthe particulate organic matter (POM) weredetermined in the water samples sampled at threedepths – surface, middle water and close to thebottom. A glass bottle of 4 L that opened only at thedesired depth was used. Water samples for SPM,POC, TN, δ13C and δ15N were kept refrigerated inthe field and filtered in the laboratory using pre-combusted glass microfiber filters (Whatman typeGF/F, 47 mm, 0.7 µm particle retention). All filterswere stored at -20 ºC until chemical analysis.
Temperature and salinity vertical profiles wereperformed at each station using a specific probe
(CTD Castway from Sontek, with samplingfrequency of 5Hz). The measurement accuracieswere 0.05 °C and 0.1, respectively. The verticalmeasurement intervals were about 0.3 m for alltemperature and salinity profiles. The raw data wereplotted and visually inspected for removal ofspurious temperature and salinity values using theMatlab Software.
Figure 1. Sampling stations (1 to 6) in the GuanabaraBay-coastal ocean transect.
Reagents and chemicals: The 5α-androstan-3β-ol(98% purity), 5α-cholestane (99% purity), 5β-cholestan-3β-ol (> 98% minimum purity), 5β-cholestan-3α-ol (> 95% minimum purity), cholest-5-en-3β-ol (94% purity), 5α-cholestan-3β-ol (95%purity), 24-ethylcholest-5,22E-dien-3β-ol (95%purity), 24-methylcholest-5-en-3β-ol (ca. 65%purity), 24-ethylcholest-5-en-3β-ol (98% purity), 24-methylcholesta-5,22-dien-3β-ol, 5β-cholestan-one,1-octadecanol (≥ 99.5% purity), 1-nonadecanol(99% purity), 1-tetracosanol ( ≥ 99% purity) , 1-hexacosanol (≥ 97% purity), tetracosane-d50 (98%purity), methyl nonadecanoate (≥ 98% purity) andSupelco® 37 Component FAME Mix standards werepurchased from Sigma Aldrich. Hexanes (95%purity), dichloromethane (99.9% purity) andacetonitrile (99.8% purity) were supplied byMallinckrodt; methanol (99.96% purity) and toluene(99.8% purity) by J. Baker; acetone (99.8% purity)by Qhemis and ethyl acetate (99.7% purity) by
Pan-American Journal of Aquatic Sciences (2016), 11(4):276-291

Eutrophic bay influence on the coastal ocean 279
Sigma Aldrich. Sodium sulfate anhydride (> 99%purity) was purchased from Sigma Aldrich and silica(silica gel 60, 0.063-0.200 mm) was supplied byMerck. N,O-bis(trimethylsilyl) trifluoroacetamide(BSTFA) was purchased from Supelco.Elemental (POC, TN) and isotopic (13C, 15N)compositions: Suspended particulate matter (SPM)was measured gravimetrically (± 0.01 mg) on thesmall (47 mm) freeze-dried filters. Sub-samples (2cm2) of these filters were analyzed in duplicate forPOC and TN on a Thermo Flash EA ElementalAnalyser. Acid treatment with HCl vapor for 24 hremoved the inorganic carbon prior to analysis(Hedges & Stern 1984). The final results representthe means of both analyses of each filter.Quantification was performed by the response factorrelative to the cystine standard. The precision of thePOC and TN analyses was always higher than 10%.
The carbon and nitrogen isotopic compositionof the bulk particulate organic matter were analyzedin two additional sub-samples (2 cm2) of the small(47 mm) filters. The carbonate-free residues on thesub-samples were converted on a catalytic column inexcess of pure oxygen to CO2, N2 and H2O on aThermo Flash EA Elemental Analyser. Water wasremoved with an anhydrous magnesium perchloratetrap. The other gases were directed to a ThermoDelta Plus stable isotope ratio mass spectrometer.Carbon and nitrogen isotopic compositions wereexpressed as the δN E=(Rsample/Rstandard-1), where N isthe heavy isotope of element E and R is theabundance ratio of heavy to light isotopes of theelements (13C/12C; 15N/14N). The standard USGS40(L-glutamic acid) was used for instrumentcalibration and the final results were expressedrelative to the Pee Dee (Belemnite) for δ13C andatmospheric N2 for δ15N. Precision of replicateanalyses was 0.1 ‰.
Lipid biomarkers: Lipid biomarkers weredetermined only in the large (142 mm) filterscollected at 1 m water depth, following procedurespublished elsewhere (Carreira et al. 2015b; Rada etal. 2016). Filters were freeze-dried and extractedwith dichloromethane/methanol (9:1, v/v) using anASE-200 Accelerated Solvent Extractor (Dionex®)at 80 °C and 1500 Psi (2 x 8 min cycles), afteraddition of androstanol (5α-androstan-3β-ol), methylnonadecanoate (C19-fatty acid methyl ester or C19-FAME) and 1-nonadecanol (C19-alcohol) assurrogate standards.
Bulk extracts were saponified (110º for 2h) inReacti-VialsTM using an aqueous methanolic KOH 1
mol L-1 solution. The reaction was stopped in an icebath. Neutral lipids were extracted from thesaponified extract with n-hexane (3 x 5 mL) at pH >12. Sterols and n-alcohols in the neutral lipids wereisolated by adsorptive chromatography on silica gelwith dichloromethane:methanol (1:1, v/v) andfinally derivatized with bis-trimethylsilyl-trifluoroacetamide (BSTFA, 70 ºC for 1h). Fattyacids were recovered from the saponified extractresidues at pH < 2.0 using n-hexane. Aftermethylation with 3% boron trifluoride in methanol(BF3-MeOH, 85 ºC for 1h), the fatty acids werepurified by adsorption chromatography with silica-gel following a published method (Canuel &Martens 1993).
Derivatized sterols and n-alcohols weredetermined by gas chromatography coupled to massspectrometry (Trace GC Ultra, MS: ISQ withautomatic sampler). An Agilent J&W DB-5 typecolumn (5% methyl-phenyl siloxane, 30 m × 0.32mm × 0.25 μm film) was used with helium as thecarrier gas (maintained at a constant flow rate of 1.4mL min–1) and the following oven temperatureprogram: 60 °C for 1 min, from 60 to 220 °C at 20°C min–1, up to 280 °C at 1 °C min–1 and, finally, to300 °C at 20 °C min–1 with an isothermal hold of 5min. The GC/MS system operated in electronionization (EI) (70 eV) and full scan (m/z 50-550)modes. GC/MS quantification was performed usinga calibration curve (100 ng mL–1 to 5,000 ng mL−1)with commercial standards (1-octadecanol, 1-nonadecanol, 1-tetracosanol, 1-hexacosanol, 5β-cholestan-3β-ol, cholest-5-en-3β-ol, 5α- cholestan-3β-ol, 24-ethylcholesta-5,22-dien-3β-ol, 24-ethylcholest-5-en-3β-ol, 24-methylcholesta-5,22-dien-3β-ol, 24-methylcholest-5-en-3β-ol, 5β-cholestan-one and androstan-3β-ol) and byconsidering the peak areas of key ions (m/z 69.3,83.4, 129.3, 215.5, 217, 231.5, 333.5 or 370.5 forsterols and m/z 103.3 for n-alcohols and phytol) andrelative response factors vs. the internal standard 5α-cholestane (m/z 217). Similar response factors ofkey ions were assumed for structurally relatedcompounds for which standards were unavailable.GC/MS component identification was based on fullscan spectra obtained from the available standards(see above) or by comparison with spectra reportedin the literature for the other compounds.
Fatty acids as methyl-esters derivatives weredetermined by gas chromatography/flame ionizationdetection. An Agilent J&W DB-23 type column(50%-Cyanopropyl)-methylpolysiloxane, 60 m ×0.25 mm × 0.25 μm film) was used with helium as
Pan-American Journal of Aquatic Sciences (2016), 11(4):276-291
280 J. M. A. MARTINS ET AL.
the carrier gas (maintained at a constant flow rate of1.4 mL min–1) and the following oven temperatureprogram: 170 °C at 30 °C min–1, up to 170 to 215 °Cat 2 °C min–1, and, finally, to 240 °C at 20 °C min–1.GC/FID quantification was performed using acalibration curve (500 ng mL –1 to 50,000 ng mL−1)with commercial standards (Supelco® 37Components FAME Mix) and methyl nonadecanoateand relative response factors vs. the internal standardtetracosane-d50. Other fatty acids not included in thestandard mixture were quantified using responsefactors to compounds with similar structures.
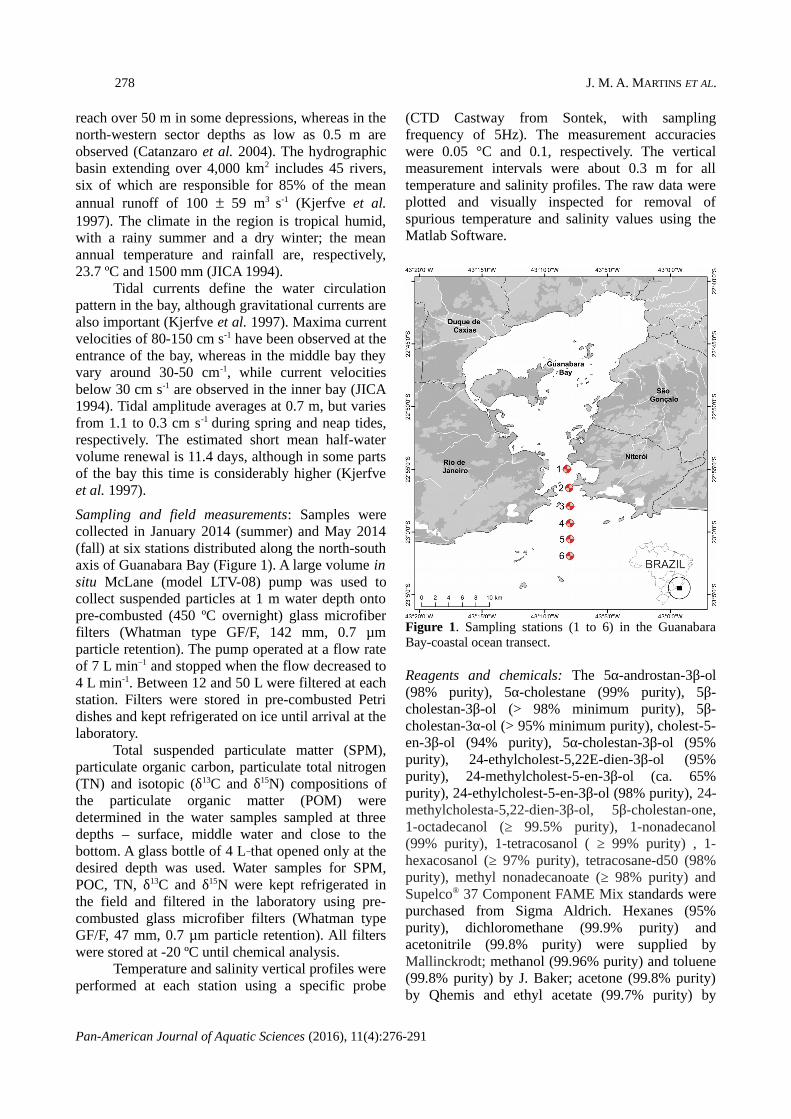
ResultsWater temperature and salinity profiles: The meanwater column temperatures in the summer(Jan/2014) and fall (May/2014) were 17.2 ± 2.7 °Cand 20.4 ± 2.3 °C. The salinity had a mean value of35.0 ± 0.8 for both campaigns. The complete datasetobtained by the CTD can be provided upon request.An overall increase in temperature and a decrease insalinity toward lower depths for all stations in bothcampaigns was observed (Fig. 2). Particularly, forthe deepest stations (5 and 6), located outside thebay, this vertical decrease in salinity toward lowerdepths was due to the larger offshore excursion ofthe estuarine outflow plume during ebb tides, as was
the case for both campaigns. In these outsidestations, the plume mixes with oceanic waters,mainly on surface levels, reducing the salinitydifferences from top to bottom. The stations 5 and 6also display a larger temperature range from top tobottom, compared to the other stations, due to thestronger presence of cold oceanic subsurface watersas discussed later. Bulk properties of suspended particles and organicmatter: The data for suspended particulate matter(SPM), particulate organic carbon (POC) and totalnitrogen (TN), C/N molar ratio and isotopiccomposition of organic matter (δ13C and δ15N) aredisplayed in Tables I and II. The SPM meanconcentrations and range in January/2014 (14.1 ±5.14 mg L-1 / 7.51 to 26.8 mg L–1) were lower than inMay/2014 (21.6 ± 7.26 mg L-1 / 11.9 to 39.1 mg L–1).In both samplings, the highest SPM values wereobserved at stations inside the bay (i.e., 1, 2 and 3)and at depths of 1 m and 5 m in most cases.
The mean and range of POC content inJanuary/2014 samples (0.33 ± 0.17 mg L–1, rangefrom 0.16 to 0.92 mg L-1) were similar to the valuesobserved in May/2014 (0.36 ± 0.15 mg L-1, rangefrom 0.17 to 0.77 mg L-1). As observed for SPM,samples at 1 m and 5 m from stations 1, 2, 3 and 4had relatively higher POC concentrations.
Figure 2. Vertical temperature and salinity during the January/2014 and May/2014 samplings.
Pan-American Journal of Aquatic Sciences (2016), 11(4):276-291

Eutrophic bay influence on the coastal ocean 281
Table I. January/2014. Suspended particulate matter (SPM), particulate organic carbon (POC; mg L–1 and % of SPM),total nitrogen (TN), C/N molar ratio and carbon (δ13C) and nitrogen (δ15N) isotopic composition of the particulateorganic matter in the Guanabara bay transect.
StationSampling depth (m)
SPM (mg L-1)
POC (mg L-1)
POC (%)
TN (mg L-1)
C/N(molar)
δ13C (‰)
δ15N (‰)
1 1 26.8 0.27 1.00 0.06 5.32 -25.3 7.75 22.9 0.54 2.34 0.09 6.70 -21.0 7.0
8 10.3 0.30 2.87 0.05 6.37 -21.1 7.22 1 16.2 0.35 2.17 0.06 6.55 -21.1 6.5 5 12.1 0.29 2.42 0.05 6.56 -21.4 7.1 15 12.1 0.19 1.54 0.04 5.49 -23.1 5.03 1 19.4 0.92 4.73 0.17 6.19 -20.0 7.5 5 15.7 0.33 2.10 0.06 6.24 -22.2 6.6 13 17.1 0.29 1.72 0.05 6.48 -22.3 6.74 1 16.8 0.42 2.53 0.08 5.88 -20.2 7.5 5 11.5 0.25 2.18 0.05 6.00 -21.6 6.8 18 13.1 0.23 1.79 0.04 6.42 -23.6 5.15 1 12.5 0.24 1.95 0.05 5.49 -22.8 6.0 5 12.9 0.24 1.87 0.05 5.95 -22.2 4.9 20 7.51 0.40 5.39 0.08 5.95 -20.3 8.96 1 8.29 0.19 2.26 0.04 6.17 -20.9 5.9 5 10.8 0.33 3.05 0.05 7.45 -20.5 4.6 30 8.02 0.16 1.96 0.03 5.42 -24.9 4.6
Table II. May/2014. Suspended particulate matter (SPM), particulate organic carbon (POC; mg L–1 and % of SPM),total nitrogen (TN), C/N molar ratio and carbon (δ13C) and nitrogen (δ15N) isotopic composition of the particulateorganic matter in the Guanabara bay transect (nd = not detected).
StationSamplingdepth (m)
SPM (mg L-1)
POC (mg L-1)
POC (%)TN
(mg L-1)C/N
(molar)δ13C(‰)
δ15N (‰)
1 1 26.4 0.37 1.40 0.09 5.07 -18.6 10.8 5 26.3 0.46 1.77 0.10 5.70 -18.5 10.2 8 23.4 0.40 1.71 0.09 5.40 -17.7 11.22 1 26.3 0.42 1.60 0.10 4.94 -16.6 9.20 5 23.0 0.46 1.99 0.08 6.35 -16.2 8.80
15 22.7 0.39 1.71 0.08 5.76 -16.5 10.23 1 28.1 0.43 1.52 0.08 6.24 -16.6 9.80
5 28.6 0.77 2.70 0.15 5.99 -16.8 10.513 nd Nd nd nd nd nd Nd
4 1 18.8 0.36 1.91 0.07 6.04 -17.1 10.35 39.1 0.47 1.21 0.10 5.72 -16.5 9.1018 20.5 0.32 1.58 0.07 5.46 -17.2 10.3
5 1 12.6 0.20 1.61 0.04 5.57 -18.4 10.45 14.3 0.28 1.92 0.06 5.31 -18.4 10.120 13.1 0.22 1.71 0.05 5.56 -18.7 10.2
6 1 17.5 0.17 0.97 0.04 5.65 -19.7 10.35 14.8 0.19 1.30 0.04 6.32 -19.7 10.630 11.9 0.18 1.53 0.03 6.93 -19.3 9.50
When POC is expressed as a percentage of SPM,slightly enriched OM particles were collected inJanuary/2014 (2.4 ± 1.1 %) in comparison toMay/2014 (1.6 ± 0.38 %). A high and positivecorrelation between POC and TN was observed in
both samplings (Figure 3), suggesting a commonorigin for both elements in the suspended particulatematter. The C/N molar ratio was very similar in bothsamplings (6.1 ± 0.50 in Jan/2014 and 5.8 ± 0.50 inMay/2014), with no trend regarding position along
Pan-American Journal of Aquatic Sciences (2016), 11(4):276-291

282 J. M. A. MARTINS ET AL.
the transect in the water column. These values aretypical of planktonic OM and were similar to the C/Nmeans of 6.7 ± 1.3 observed in samples collectedinside the bay during 2009/2010 (Kalas et al. 2009).
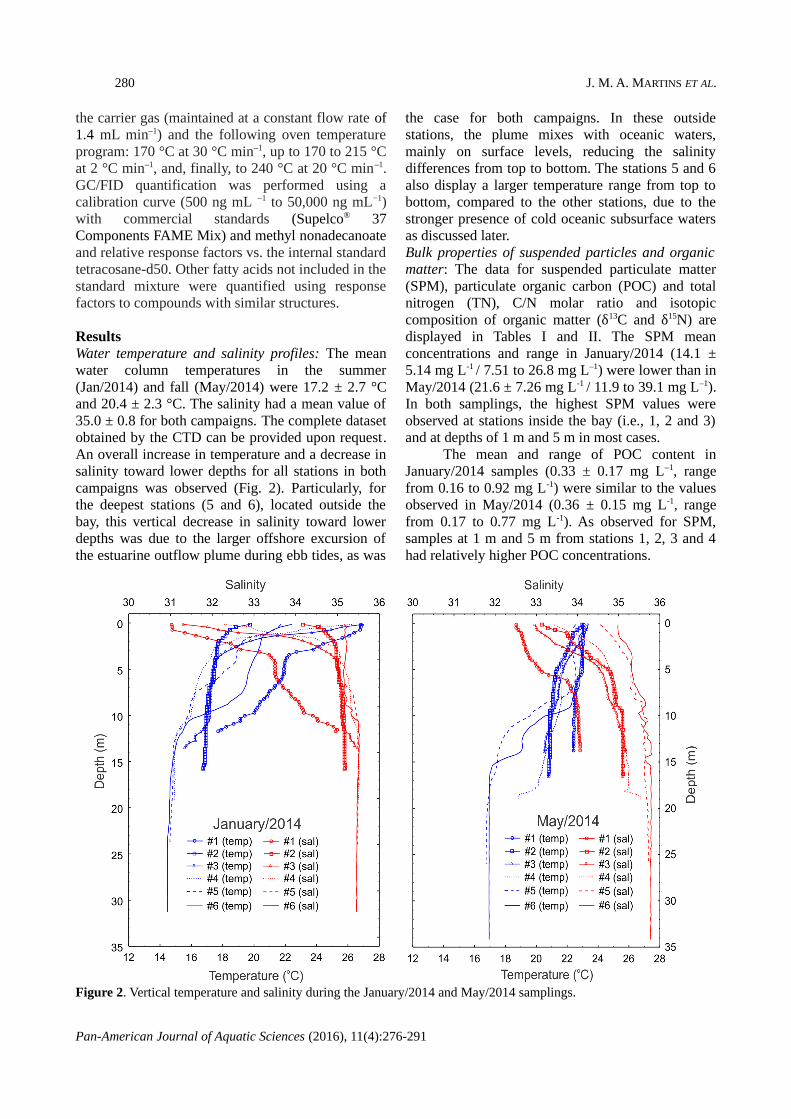
The carbon isotopic composition (δ13C) ofPOC showed distinct values in the two samplings(Tables I and II). In January/2014, δ13C averaged-21.9 ± 1.5 (-20.0 to -25.3 ‰). In May/2014, on theother hand, enriched values of 13C were measured,with δ13C of -17.8 ± 1.2 ‰ (-16.2 to 19.7 ‰). Theδ15N values were also different between the twosamplings: 6.4 ± 1.2 ‰ (4.6 to 8.9 ‰) inJanuary/2014 and 10.1 ± 0.6 ‰ (8.8 to 11.2 ‰) inMay/2014. No clear trend for δ15N with respect tostations in the transect of the sampling depth wasobserved. Composition and distribution of lipid biomarkers:Lipid biomarkers in the present study included 35fatty acids (saturated, mono-unsaturated,polyunsaturated and branched compounds), 12sterols (unsaturated and saturated compounds) and11 alcohols (saturated straight chain compounds).The results for the two samplings are listed in TableIII. Detailed compositions of fatty acids and n-alcohols are provided as Supplementary Material(Tables S1 and S2).
Fatty acids, as methyl esters or FAMEs, werethe most abundant class of compounds, with meansof 12.1 ± 7.78 µg L-1 (75.6% of total quantifiedlipids) in January/2014 and 22.1 ± 13.7 µg L-1 (92.1% of total quantified lipids) in May/2014. Thesecond most abundant class was composed ofsterols, with 2.61 ± 2.34 µg L-1 (17% of total) and1.32 ± 1.12 µg L-1 (5.85% of total) in January/2014
and May/2014, respectively. Finally, n-alcoholsvaried between 0.87 ± 0.30 µg L-1 (7.36% of total)and 0.62 ± 0.54 µg L-1 (2.0% of total) in the twosamplings. Total quantified lipid concentrationsvaried from 6.02 to 46.25 µg L-1 considering allsamples (Table III), with no clear trend among thestations. The higher values of total quantified lipidsat stations 5 and 6 in January/2014 and 3 and 4 inMay/2014 are noteworthy.
Fatty acids (FAs) occurred as compounds witha predominance of even-numbered chains rangingfrom 14 to 26 C atoms (C14 – C26). Short-chain andsaturated compounds (SCFA, C14-C18) represented onaverage 30.2 ± 7.5% and 56.0 ± 10.6% of total FAsin each sampling. Higher SCFA concentrations weremeasured in the second sampling, particularly atstation 3 (Table 3). Monounsaturated FAs with C16,C17, C18, C20 and C22 (MUFAs) contributed withsimilar proportions in the two samplings, averaging17.2 ± 6.0 % and 14.0 ± 3.9 % of total FAs inJanuary/2014 and May/2014. The most abundantMUFA was C16:1. Long-chain fatty acids (LCFA),saturated compounds with chain-length ≥ C24 werevirtually absent in the first sampling and representedless than 0.5 % of total FAs in the second sampling.On the other hand, polyunsaturated FAs (PUFAs),with 18, 20 and 22 carbon atoms and 2 to 6unsaturations, were abundant, representing circa 20% of total FAs in the two samplings. Finally,branched FAs (iso- and anteiso-C15, C17 and 10-methyl-C16) were more abundant in the firstsampling (6.2 ± 7.5% of total FAs) when comparedto the second one (2.6 ± 0.8% of total FAs).
Figure 3. Linear correlation between POC and TN in (a) January/2014 and (b) May/2014 considering samples collectedat 1 m, 5 m and close to the bottom
Pan-American Journal of Aquatic Sciences (2016), 11(4):276-291

Eutrophic bay influence on the coastal ocean 283
Table III. Lipid biomarkers (fatty acids, n-alcohols and sterols) in the suspended organic matter in the two samplings(January and May of 2014) in the Guanabara bay transect (na = not analyzed).
C1 (Jan/2014) C2 (May/2014)
Station 1 2 3 4 5 6 1 2 3 4 5 6AFatty acids (μg L−1)
Total 13.89 4.38 8.08 5.01 24.45 16.66 na 27.91 41.47 22.75 11.09 7.09SCFA 4.54 1.69 2.64 2.06 12.00 7.39 na 18.37 20.31 11.65 5.53 5.45LCFA nd nd nd nd 0.05 nd na 0.00 0.19 0.08 0.03 0.03MUFA 3.88 1.07 2.11 1.28 1.52 5.10 na 4.62 5.67 3.26 2.18 0.68PUFA 4.61 1.35 2.73 1.39 4.85 3.42 na 3.19 14.03 4.59 2.83 0.66Branched 0.69 0.19 0.46 0.19 5.67 0.41 na 1.05 0.75 2.95 0.34 0.17
BAlcohols (μg L−1)Total 0.99 0.56 0.94 1.05 0.44 1.20 1.33 na 1.07 0.17 0.22 0.31SCOH 0.06 0.23 0.39 0.44 0.15 0.24 0.75 na 0.12 0.01 0.03 0.14LCOH 0.25 0.11 0.18 0.19 0.12 0.33 0.04 na 0.05 < lq 0.01 0.01Phytol 0.61 0.18 0.31 0.34 0.13 0.54 0.49 na 0.76 0.13 0.14 0.11
CSterols (μg L−1)Total 2.24 1.08 1.60 1.56 1.75 7.29 2.38 na 3.70 0.75 0.63 0.8026Δ5,22 0.01 0.03 0.02 0.02 0.05 0.29 0.06 na 0.06 0.02 0.02 0.0227Δ0,5b 0.07 0.06 0.05 0.05 0.05 0.08 0.14 na 0.08 0.02 0.03 0.0127Δ5 0.51 0.28 0.37 0.36 0.51 1.62 0.32 na 0.21 0.06 0.07 0.0827Δ5,22 0.11 0.07 0.09 0.08 0.15 0.58 0.12 na 0.10 0.03 0.04 0.0428Δ5 0.03 0.02 0.02 0.02 0.04 1.39 0.07 na 0.07 0.02 0.01 0.0228Δ5,22 0.30 0.16 0.21 0.23 0.28 1.08 0.23 na 0.23 0.06 0.07 0.0928Δ5,24(28) 0.28 0.16 0.18 0.20 0.38 1.48 0.25 na 0.28 0.12 0.16 0.1929Δ5 0.30 0.10 0.19 0.16 0.11 0.35 0.13 na 0.11 0.03 0.03 0.0329Δ5,22 0.09 0.03 0.06 0.06 0.06 0.16 0.08 na 0.08 0.02 0.02 0.0230Δ22 0.40 0.13 0.29 0.28 0.06 0.13 0.91 na 2.47 0.36 0.17 0.2927Δ0 0.08 0.03 0.06 0.06 0.03 0.08 0.04 na 0.02 0.01 0.01 0.0129Δ0 0.06 0.02 0.05 0.04 0.02 0.05 0.01 na <lq <lq <lq <lq
Total lipids (µg L-1)
17.12 6.02 10.62 7.61 26.64 25.15 na na 46.25 23.67 11.94 8.20
nd = not detected; <lq = below limit of detection (0.01 µg L-1); AShort-chain (SCFAs < C22), long-chain (LCFA ≥ C24), monounsaturated (MUFAs: C16, C17, C18, C20 and C22), polyunsaturated (PUFAs: C20:2, C20:3,C22:2, C22:6) and branched fatty acids (iso and anteiso- C15 and C17
and 10-methyl-C17); B Short-chain (SCOH ≤ C22) and long-chain (LCOH ≥ C24) alcohols
C The symbol aΔb,c(a = number of C atoms; b,c = position of the usaturation in the C structure) stands for: 24-norcholesta-5.22-dien-3β-ol (26Δ5.22),5β-cholestan-3β-ol (27Δ0,5b, coprostanol), cholest-5-en-3β-ol (27Δ5; cholesterol), cholesta-5,22E-dien-3β-ol (27Δ5,22), 24-methylcholest-5-en-3β-ol(28Δ5), 24-methylcholesta-5,22E-dien-3β-ol (28Δ5,22), 24-methylcholesta-5,24(28)-dien-3β-ol (28Δ5,24(28)), 24-ethylcholest-5-en-3β-ol (29Δ5), 24-ethylcholesta-5,22E-dien-3β-ol (29Δ5,22), 4α-23,24-trimethyl-5α-cholest-22(E)-en-3β-ol (30Δ22), 5α-cholestan-3β-ol (27Δ0; cholestanol) and 24-ethyl-5α-cholestan-3β-ol (29Δ0)
Twelve sterols were found containing betweenC26 and C30 at total concentrations averaging 2.59 ±2.34 µg L-1 in January/2014 and 1.41 ± 1.35 µg L-1
in May/2014 (Table 3). The large standarddeviations of the means were caused by very highconcentrations at station 6 in the first sampling (7.30µg L-1 of total sterols) and at stations 3 and 4 (2.38and 3.70 µg L-1 of total sterols, respectively). In thefirst sampling, cholest-5en-3β-ol (cholesterol; 275)was the most abundant sterol (24.5 ± 2.7 % of totalsterols), followed by 24-methylcholesta-5,24(28)-dien-3β-ol (285,24(28) ; 15.5 ± 4.33 %), 24-methylcholesta-5,22E-dien-3β-ol (285,22; 14.5 ± 1.1%) and 4α,23,24-trimethylcholest-22-en-3β-ol(dinosterol, 3022; 11.9 ± 7.4 %). However, duringthe second sampling, a high prevalence of dinosterolwas observed, contributing to 43.4 ± 15.2 % of thetotal sterols, whereas the other abundant sterols inthe first sampling represented between 9.5 and 16.4% of the total sterols, on average.
Other usually abundant sterols in aquaticsystems, such as 24-ethylcholest-5-en-3β-ol(sitosterol; 295) and 24-ethylcholesta-5,22-dien-3β-ol (295,22, stigmasterol) (Bianchi & Canuel 2011),were relatively less important, with an overallcontribution of 3-6 % of the total sterols. Theseresults are consistent with those observed by Kalaset al. (2009), who showed a higher contribution of295 and 295,22 to the SPM only at stations in thenorthern portions of the bay, but not at its mouth.Saturated sterols (5α-cholestan-3β-ol and 5α-24-ethylcholest-3β-ol) were found in minorconcentrations. Lastly, the fecal sterol 5β-cholest-3β-ol (Bianchi & Canuel 2011) were detected in allstations, at concentrations typically below 0.08 µg L-
1, but reaching 0.138 µg L-1 at station 1 in the secondsampling (Table 3).
The last class of quantified lipid biomarkers(alcohols) was marked by the large predominance ofphytol (3,7,11,15-tetramethyl-2-hexadecene-1-ol)
Pan-American Journal of Aquatic Sciences (2016), 11(4):276-291

284 J. M. A. MARTINS ET AL.
and the C16-alcohol, both summing up circa 70 % oftotal alcohols. Regarding long-chain alcohols(LCOH; ≥C22), they were only detected inappreciable amounts in January/2014, particularlyC24OH (ca 10 % of total alcohols) and C30OH (4.5 –9.0 % of total alcohols).
DiscussionWater types in the studied region: Temperature-Salinity (TS) diagrams displayed, on bothcampaigns, the presence of two water masses in thestudied region, as indicated by the relatively linearshape of the TS curves (Figure 4). The Coastal Water(CW) is indicated by salinities lower than 33 (Castroet al. 2006), whereas the presence of South AtlanticCentral Water (SACW) is indicated by temperaturesabove 6 °C and below 20 °C and salinities between34.6 and 36.2 (Miranda 1985). Mixing of these twowater masses are seen to occur at the subsurface.The Tropical Water (TW), usually found at thesurface, outside the bay mouth (Bergamo 2006), wasnot detected because the larger estuarine outflow,during the ebb tide, pushes TW offshore. This largeroutflow intensifies the mixing of CW and TW thenreducing the surface salinity values below 36.2 asverified at stations 5 and 6.
On January/2014, lower salinity values occurat surface on the bay as the result of larger riverdischarges during the wet season, from November toApril, than during the dry season, from May toOctober. Also, easterly winds that blow over thecontinental shelf, predominantly during the australspring and summer (Castro et al. 2006) causessurface Ekman transport towards the ocean. Thiscontributes to a stronger presence of SACW atshallow depths along the inner shelf with eventualintrusions in the Guanabara Bay (Melo 2004), whereit was outstandingly observed very near the surfaceon station 2 (Figure 4). As a result, on Fig. 4, the TSdiagram displays a larger presence of SACW onJanuary in comparison to May of 2014.
On January/2014, lower salinity values occurat surface on the bay as the result of larger riverdischarges during the wet season, from November toApril, than during the dry season, from May toOctober. Also in January, the prevailing easterlywinds that blow over the continental shelfcontributed to a stronger presence of SACW atshallow depths along the inner shelf and also withinthe Guanabara Bay, where it was outstandinglyobserved very near the surface on station 2 (Figure4). Bulk geochemical properties of particulate organic
carbon: Mean C/N molar ratio values of suspendedparticles were similar in both samplings (6.1 ± 0.50in Jan/2014 and 5.8 ± 0.51 in May/2014). Thesevalues suggest the predominance of autochthonousrather than allochthonous contribution to the pool ofparticulate organic matter (Meyers 1997;Maksymowska et al. 2000; Bianchi & Canuel 2011;Wakeham & McNichol 2014). The carbon andnitrogen isotopic compositions of the particulateorganic matter (POM) also ranged within valuesusually ascribed to autothochonous organic matter(δ13C = -19.9 ± 2.5 ‰ and δ15N = 8.2 ± 2.1 ‰).However, both δ13C and δ15N showed significantly (p< 0.001) different values between samplings (Figure5). All POM samples in January/2014 had depleted13C (δ13C < -20.0 ‰) and 15N (δ15N < 8.0, except forone sample), but in May/2014 the opposite trend wasobserved, of enriched 13C (-20.0 < δ13C < -16.0 ‰)and 15N (8.8 < δ15N < 11.2 ‰).
The results of the isotopic compositionbetween samplings described above may beexplained by changes in the autotrophic activity ofeach sampling. Lower fractionation towards theheavy isotope occurs when photosynthetic activity ishigh, resulting in an isotopically-enrichedphytoplanktonic organic matter (Fogel & Cifuentes1993). This was the case of samples collected inMay/2014 (Figure 5). For carbon, there wasincorporation of 13C-enriched HCO3
- resulting in lessnegative δ13C, whereas for nitrogen the heavyisotope enrichment is probably caused by theincorporation ammonium produced by themineralization of organic matter (Middelburg &Nieuwenhuize 2001).
It is noteworthy that Kalas et al. (2009) alsofound isotopically-enriched POM in stations insidethe bay. Therefore, our results indicate events ofhigher phytoplanktonic activity occurring in thetransition area from the Guanabara Bay to thecoastal ocean. One last point to be addressed is thedepleted 13C (δ13C < 23.0 ‰) values for bottomsamples at stations 2, 4 and 6 in January/2014(Figure 5), which may be related to some influenceof resuspension of more refractory OM deposited inthe sediment.Characterization of suspended organic matter usinglipid biomarkers: The lipid biomarker compositionof surface samples was considered in order tocharacterize in further details the source ofparticulate organic matter in the bay-coastal oceantransect. Due to the relatively limited dataset, thetraditional multivariate statistical analysis approach(e.g., Canuel 2001; Yunker et al. 2005) was not
Pan-American Journal of Aquatic Sciences (2016), 11(4):276-291

Eutrophic bay influence on the coastal ocean 285
considered herein. Instead, lipids were groupedaccording to their assignment to specific sources oforganic matter (McCallister et al. 2006; Yoshinagaet al. 2008; Schmidt et al. 2010).
Figure 4. Temperature-salinity diagrams of waterscollected in (a) January/2014 and (b) May/2014 at sixstations at the transect along the Guanabara Bay-coastalocean transition. Data for stations 5 and 6 are highlighted.Two types of water masses are marked by dashed-lines:CW = Coastal Water and SACW = South Atlantic CentralWaters. See text for further information about watermasses constraints.
Our lipid biomarker data allowed for the definitionof four groups, as follows: (i) primary production orautochthonous sources: sum of cholest-5-en-3β-ol(27Δ5), cholesta-5,22-dien-3β-ol (27Δ5,22), 24-methycholesta-5,22-dien-3β-ol (28Δ5,22), 4α,23,24-trimethylcholest-22-en-3β-ol (30Δ22), 24-
methylcholesta-5,24(28)-dien-3β-ol (28Δ5,24(28)) and24-norcholesta-5,22-dien-3β-ol (26Δ5,22); (ii)terrestrial/riverine: sum of long-chain fatty acids(LCFA) and long-chain n-alcohols (LCOH); (iii)zooplankton: sum of cholesterol (27Δ5) and mono-unsaturated fatty acid C18:1w9; (iv) bacteria: sum ofiso- and anteiso- branched fatty acids C15 and C17.
Figure 6 displays the resulting lipidbiomarker-based groups of organic matter, includingrepresentations as a percentage of each group (Fig.6-a) and as POC-normalized concentrations (Fig.6-b). An overwhelming contribution of OM producedby primary production in both samplings isobserved, followed by an important contribution ofsecondary production (i.e., zooplankton). Thisreveals enhanced eutrophication caused by an excessof nutrients and consequent high rates ofaccumulation of organic matter in sediment not onlyinside the bay (Carreira et al. 2002; Cotovicz Jr etal. 2015), but elevated phytoplankton activity is alsoobserved in the bay-coastal ocean transition zone.This finding is consistent with recent estimates of a0.01 % contribution by Guanabara Bay to the totalglobal carbon influx to the ocean associated withnutrients exported by the bay (Lazzari et al. 2016).
Another interesting feature observed inFigure 6-a is the very low contribution of terrestrial-riverine OM in suspended particles. This suggestsretention in of OM delivered by the drainage basinin the bay sediment. Only in January/2014 were atmost stations (except station 5) a relatively highercontribution of 4.7 ± 1.4 % from terrestrial-riverineOM observed, which can be derived from a higherinfluence of runoff during the rainy summerseason. In fact, the relatively low salinities ofsurface water during the January/2014 samplings(values between 31-33; Figure 2), which was notobserved in May/2014, are consistent with a higherinfluence of continental runoff in the samplingregion. The contribution of bacterially-derived OMin suspended particles represented a relativelyimportant fraction of 7.0 ± 2.0%, if sample 5collected in January/2014 is excluded. The veryhigh contribution (44.1%) of bacteria to POC atstation 5 in January/2014 was caused by thebranched iso-C17 fatty acid. Our data is consistentwith previous observations that bacterioplanktonmetabolism in surface waters at the entrance to theGuanabara Bay is responsible, alongsidephytoplankton, for producing particulate organiccarbon (Guenther et al. 2008).
Pan-American Journal of Aquatic Sciences (2016), 11(4):276-291

286 J. M. A. MARTINS ET AL.
Figure 5. Plots of the C/N and δ13C (a,b) and δ13C and δ15N (c,d) results for January and May/2014
An additional way to evaluate the contribution ofgroups to the pool of suspended organic matter is byevaluating POC-normalized concentrations of lipidbiomarkers (Figure 6-b). Unfortunately, stations 1and 2 in May/2014 could not be displayed becausepart of the data was lost. The higher contribution oflipids to POC in May/2014 compared toJanuary/2014 is consistent with the isotopiccomposition data discussed previously, whichsuggests an enhanced primary production activityduring the second sampling. In addition, during thefieldwork in January/2014, the water at stations 5and 6 was clearly altered by a massivephytoplankton bloom. This event caused an increasein POC-normalized lipid concentrations at stations 5and 6 when compared to the other stations in the
same sampling. Similarly, this algal bloom might beresponsible for the high contribution of bacterial-derived OM observed at station 5 in January/2014,although we cannot explain why a similar influenceon station 6 was not observed (Figure 6-b).
No similar previous information of fatty acids,sterols and alcohols for suspended particulate matteroutside the Guanabara Bay is available for comparison.However, Kalas et al. (2009) found 1 to 4 µg mg POC-
1 of sterols in samples collected inside the bay in2009/2010, whereas our samples collected in 2014 atthe mouth and outside Guanabara Bay showed highervalues, ranging between 2 and 8.7 µg mg POC-1.Considering that most sterols in both studies arederived from plankton, this difference in POC-normalized sterols might be ascribed to an increase
Pan-American Journal of Aquatic Sciences (2016), 11(4):276-291

Eutrophic bay influence on the coastal ocean 287
Figure 6. Lipid grouping according to sources ofparticulate organic matter (bacteria, primary production,zooplankton and terrestrial/riverine) in (a) percentage and(b) normalized concentrations. See text for detailsregarding the group-definition criteria.
in the contribution of primary production to thePOM pool in the studied area over time.Contribution of sewage-derived OM: Coprostanol(5β-cholestan-3β-ol) is a traditional tracer of fecalmaterial in aquatic systems (Takada & Eganhouse1998). Many studies regarding sewagecontamination in Guanabara Bay waters andsediments using coprostanol and other fecal sterolsare available (Carreira et al. 2004; Costa & Carreira2005; Cordeiro et al. 2008; Santos et al. 2008; Kalaset al. 2009), but this is the first report of coprostanolin suspended particles of waters outside the bay(Table III). The mean concentration of coprostanolwas 0.06 ± 0.03 µg L-1, considering the twosamplings. Lazzari et al. (2016) found higher valuesof coprostanol in SPM (0.45 ± 0.20 µg L-1 to 0.65 ±0.30 µg L-1) in the vicinity of our station 1, in theinner bay. Therefore, the sewage particles areefficiently ‘diluted’ by other types of OM and/orcoprostanol is degraded during transport in theoxygenated water column (Bianchi & Canuel 2011).
Notwithstanding the low concentrations ofcoprostanol in the bay-coastal water transect, the
consideration of diagnostic indexes can aid inconfirming the relevance of sewage contamination.One such index is formed by the coprostanol tocoprostanol plus cholestanol ratio (Grimalt et al.1990): values above 0.7 confirm the fecal origin ofcoprostanol, while below 0.3 fecal contamination isnot confirmed. Herein, the overall means of thisindex was 0.62 ± 0.13, very similar to the thresholdproposed in the literature, confirming contaminationof suspended particles by fecal material. In fact, inthe second sampling the values of this ratio werehigher than the overall means, ranging between 0.62and 0.78, indicating a high influence of fecalmaterial on suspended particles in May/2014.
ConclusionThe isotopic and lipid biomarker approach
successfully allowed for the characterization of thesuspended particulate organic matter in theGuanabara Bay-coastal ocean transition zone. Theisotopic composition (δ13C and δ15N) indicated thatthe bulk of the organic matter is strongly influencedby autotrophic processes, which can occur both byin situ production and the contribution of materialoriginated from the bay. This scenario wasconfirmed through lipid biomarkers, and allows forthe conclusion that the Guanabara Bay is directly(by the export of autochthonous OM) and/orindirectly (by the export of nutrients) responsible forthe increment in phytoplanktonic production in thewater column in the coastal waters adjacent to thebay. Importantly, the autotrophic processes variedwidely between the two sampling periods, indicatingthat the study area is strongly influenced byprevailing oceanographic conditions. It was alsopossible to identify direct export of fecal material inparticulate form to the coastal ocean, although thisseems to be a low intensity process. Anotherimportant result is the finding that the organic matterof terrestrial and/or water origin is retained in thebay and probably accumulates in the sediments. Thequantification of this allochtonous sourcecontribution needs to be identified to betterunderstand the processes that lead to the increase inOM storage in the bay’s sediment.
AcknowledgmentsThe authors would like to thank the Brazilian
Research Council for financial support (proc. n.402459/2012-1) and for the doctorate fellowshipawarded to J.M.A. Martins and a scientific initiationfellowship (PIBIC) to T.S.M.Silva. R.S.Carreira waspartially supported by a CNPq research fellowship
Pan-American Journal of Aquatic Sciences (2016), 11(4):276-291

288 J. M. A. MARTINS ET AL.
(proc. n. 304543/2013-6). The authors also thank theINCT Pro-Oceano for financial support. The authorsthank the comments of two anonymous reviewersthat improved the quality of the manuscript.
ReferencesAbreu, I. M., Cordeiro, R. C., Soares-Gomes, A.,
Abessa, D. M. S., Maranho, L. A. & Santelli,R. E. 2016. Ecological risk evaluation ofsediment metals in a tropical Euthrophic Bay,Guanabara Bay, Southeast Atlantic. MarinePollution Bulletin, 109: 435-445.
Bauer, J. E., Cai, W.-J., Raymond, P. A., Bianchi, T.S., Hopkinson, C. S. & Regnier, P. A. G. 2013.The changing carbon cycle of the coastalocean. Nature, 504: 61-70.
Bergamo, A. L. 2006. Características hidrográficas,da circulação e dos transportes de volume esal na Baía de Guanabara (RJ): variaçõessazonais e moduladas pela maré. PhD Thesis.Instituto Oceanográfico, Universidade de SãoPaulo, São Paulo, Brazil, 200 p.
Bianchi, T. S. 2011. The role of terrestrially derivedorganic carbon in the coastal ocean: achanging paradigm and the priming effect.Proceedings of the National Academy ofSciences, 108: 19473-19481.
Bianchi, T. S. & Bauer, J. E. 2012. Particulateorganic carbon cycling and transformation.Pp. 69-117. In: Wolanski, E. & McLusky, D.S. (Eds.). Treatise on estuarine and coastalscience, vol. 5. Academic Press, USA, 342 p.
Bianchi, T. S. & Canuel, E. A. 2011. Chemicalbiomarkers in aquatic ecosystems.Princeton University Press.
Canuel, E. A. 2001. Relations between river flow,primary production and fatty acid compositionof particulate organic matter in San Franciscoand Chesapeake Bays: a multivariateapproach. Organic Geochemistry, 32: 563-583.
Canuel, E. A., Cammer, S. S., McIntosh, H. A. &Pondell, C. R. 2012. Climate change impactson the organic carbon cycle an the land-seainterface. Annual Review of Earth andPlanetary Sciences, 40: 685-711.
Canuel, E. A. & Martens, C. S. 1993. Seasonalvariations in the sources and alteration oforganic matter associated with recently-deposited sediments. Organic Geochemistry,20: 563-577.
Carreira, R. S., Wagener, A. L. R., Fileman, T.,Readman, J., Macko, S. A. & Veiga, A. 2002.
Changes in sedimentary organic carbon poolof a fertilized tropical estuary, Guanabara Bay,Brazil: an elemental, isotopic and molecularmarker approach. Marine Chemistry, 79:207-227.
Carreira, R., Wagener, A. & Readman, J. 2004.Sterols as markers of sewage contamination ina tropical urban estuary (Guanabara Bay,Brazil): space-time variations. Estuarine,Coastal and Shelf Science, 60: 587-598.
Carreira, R. S., Araújo, M. P., Costa, T. L. F., Spörl,G. & Knoppers, B. A. 2011. Lipids in thesedimentary record as markers of the sourcesand deposition of organic matter in a tropicalBrazilian estuarine-lagoon system. MarineChemistry, 127: 1-11.
Carreira, R. S., Canuel, E. A., Macko, S. A., Lopes,M. B., Luz, L. G. & Jasmim, L. N. 2012. Onthe accumulation of organic matter on thesoutheastern Brazilian continental shelf: acase study based on a sediment core from theshelf off Rio de Janeiro. Brazilian Journal ofOceanography, 60: 75-87.
Carreira, R. S., Albergaria-Barbosa, A. C. R.,Arguelho, M. L. P. M. & Garcia, C. A. B.2015a. Evidence of sewage input to innershelf sediments in the NE coast of Brazilobtained by molecular markers distribution.Marine Pollution Bulletin, 90: 312-316.
Carreira, R. S., Cordeiro, L. G. M. S., Oliveira, D. R.P., Baêta, A. & Wagener, A. L. R. 2015b.Source and distribution of organic matter insediments in the SE Brazilian continentalshelf influenced by river discharges: Anapproach using stable isotopes and molecularmarkers. Journal of Marine Systems, 141:80-89.
Carreira, R. S., Cordeiro, L. G. M. S., Bernardes, M.C. & Hatje, V. 2016. Distribution andcharacterization of organic matter using lipidbiomarkers: A case study in a pristine tropicalbay in NE Brazil. Estuarine, Coastal andShelf Science, 168: 1-9.
Castro, B. M., Lorenzzetti, J. A., Silveira, I. C. A. &Miranda, L. B. 2006. Estrutura termohalina ecirculação na região entre o Cabo de SãoTomé (RJ) e o Chuí (RS). Pp. 11-120. In:Rossi-Wongtschowski, L. S. P. & Madureira,L. S. P. (Eds.). O ambiente oceanográfico daplataforma continental e do talude naregião sudeste-sul do Brasil. Editora daUniversidade de São Paulo, São Paulo, Brazil,466 p.
Pan-American Journal of Aquatic Sciences (2016), 11(4):276-291

Eutrophic bay influence on the coastal ocean 289
Catanzaro, L. F., Baptista-Neto, J. A. & Guimarães,M. S. D. 2004. Distinctive sedimentaryprocess in Guanabara Bay - SE/Brazil, basedon the analysis of echo-character (7.kHz).Revista Brasileira de Geofisica, 22: 69-83.
Cordeiro, L. G. S. M., Carreira, R. S. & Wagenera,A. L. R. 2008. Geochemistry of fecal sterolsin a contaminated estuary in southeasternBrazil. Organic Geochemistry, 39: 1097-1103.
Costa, R. L. d. & Carreira, R. S. 2005. A comparisonbetween faecal sterols and coliform counts inthe investigation of sewage contamination insediments. Brazilian Journal ofOceanography, 53: 157-167.
Costa, T. L. F., Araujo, M. P., Knoppers, B. A. &Carreira, R. S. 2011. Sources and distributionof particulate organic matter of a tropicalestuarine-lagoon system from NE-Brazil asindicated by lipid biomarkers. AquaticGeochemistry, 17: 1-19.
Cotovicz Jr, L. C., Knoppers, B. A., Brandini, N.,Costa Santos, S. J. & Abril, G. 2015. A strongCO2 sink enhanced by eutrophication in atropical coastal embayment (Guanabara Bay,Rio de Janeiro, Brazil). Biogeosciences, 12:6125-6146.
de Abreu-Mota, M. A., de Moura Barboza, C. A.,Bícego, M. C. & Martins, C. C. 2014.Sedimentary biomarkers along acontamination gradient in a human-impactedsub-estuary in Southern Brazil: A multi-parameter approach based on spatial andseasonal variability. Chemosphere, 103: 156-163.
de Carvalho Aguiar, V. M., de Lima, M. N.,Abuchacra, R. C., Abuchacra, P. F. F., Neto, J.A. B., Borges, H. V. & de Oliveira, V. C.2016. Ecological risks of trace metals inGuanabara Bay, Rio de Janeiro, Brazil: Anindex analysis approach. Ecotoxicology andEnvironmental Safety, 133: 306-315.
Dorneles, P. R., Sanz, P., Eppe, G., Azevedo, A. F.,Bertozzi, C. P., Martinez, M. A., Secchi, E. R.,Barbosa, L. A., Cremer, M., Alonso, M. B.,Torres, J. P., Lailson-Brito, J., Malm, O.,Eljarrat, E., Barcelo, D. & Das, K. 2013. Highaccumulation of PCDD, PCDF, and PCBcongeners in marine mammals from Brazil: aserious PCB problem. Science of The TotalEnvironment, 463-464: 309-318.
Eichler, P. P. B., Eichler, B. B., Miranda, L. B.,Pereira, E. R. M., Kfouri, P. B. P., Pimenta, F.
M., Bérgamo, A. L. & Vilela, C. G. 2003.Benthic foraminiferal response to variations intemperature, salinity, dissolved oxygen andorganic carbon, in the Guanabara bay, Rio deJaneiro, Brazil. Anuário do Instituto deGeociências - UFRJ, 26: 36-51.
Fistarol, G. D. O., Coutinho, F. H., Moreira, A. P. B.,Venas, T., Canovas, A., de Paula Jr, S. E. M.,Coutinho, R., de Moura, R. L., Valentin, J. L.,Tenenbaum, D. R., Paranhos, R., Valle, R.,THOMPSON, C., Salomon, P. & Thompson,F. 2015. Environmental and sanitaryconditions of Guanabara Bay, Rio de Janeiro.Frontiers in Microbiology, 6.
Fogel, M. & Cifuentes, L. 1993. Isotopefractionation during primary production. Pp.101-117. In: Engel, M. & Macko, S. A. (Eds.).Organic Geochemistry: Principles andApplications, Plenun Press, New York, USA.832 p.
Grimalt, J. O., Fernandez, P., Bayona, J. M. &Albaiges, J. 1990. Assessment of fecal sterolsand ketones as indicators of urban sewageinputs to coastal waters. EnvironmentalScience & Technology, 24: 357-363.
Guenther, M., Lima, I., Mugrabe, G., Tenenbaum, D.R., Gonzalez-Rodriguez, E. & Valentin, J. L.2012. Small time scale plankton structurevariations at the entrance of a tropicaleutrophic bay (Guanabara Bay, Brazil).Brazilian Journal of Oceanography, 60:405-414.
Guenther, M., Paranhos, R., Rezende, C. E.,Gonzalez-Rodrigues, E. & Valentin, J. L.2008. Dynamics of bacterial carbonmetabolism at the entrance of a tropicaleutrophic bay influenced by tidal oscillation.Aquatic Microbial Ecology, 50: 123-133.
Hedges, J. I. & Keil, R. G. 1995. Sedimentaryorganic matter preservation: an assessmentand speculative synthesis. MarineChemistry, 49: 81-115.
Hedges, J. I. & Stern, J. H. 1984. Carbon andnitrogen determinations of carbonate-containing solids. Limnology andOceanography, 29: 657-663.
Hobbie, J. E. 2000. Estuarine Science - a syntheticapproach to research and practice. IslandPress, Washington, 527 p.
JICA 1994. The study on recuperation of theGuanabara Bay ecosystem. JapanInternational Cooperation Agency, Rio deJaneiro, Brazil, 537 p.
Pan-American Journal of Aquatic Sciences (2016), 11(4):276-291

290 J. M. A. MARTINS ET AL.
Kalas, F. A., Carreira, R. S., Macko, S. A. & R.Wagener, A. L. 2009. Molecular and isotopiccharacterization of the particulate organicmatter from an eutrophic coastal bay in SEBrazil. Continental Shelf Research, 29:2293-2302.
Kjerfve, B., Ribeiro, C. A., Dias, G. T. M., Filippo,A. & Quaresma, V. S. 1997. Oceanographiccharacteristics of an impacted coastal bay:Baía de Guanabara, Rio de Janeiro, Brazil.Continental Shelf Research, 17: 1609-1643.
Lazzari, L., Wagener, A. L. R., Farias, C. O., Baêta,A. P., Mauad, C. R., Fernandes, A. M.,Paranhos, R. & Carreira, R. S. 2016. Estuaryadjacent to a megalopolis as potentialdisrupter of carbon and nutrient budgets in thecoastal ocean. Journal of the BrazilianChemical Society, 27: 1750-1765.
Maksymowska, D., Richard, P., Piekarek-Jankowska, H. & Riera, P. 2000. Chemicaland isotopic composition of the organic mattersources in the Gulf of Gdansk (southern BalticSea). Estuarine Coastal Shelf Science, 51:585-598.
Martins, C. C., Seyffert, B. H., Braun, J. A. F. &Fillmann, G. 2011. Input of organic matter ina large south american tropical estuary(Paranaguá Estuarine System, Brazil)indicated by sedimentary sterols andmultivariate statistical approach. Journal ofthe Brazilian Chemical Society, 22: 1585-1594.
Mater, L., Alexandre, M. R., Hansel, F. A. &Madureira, L. A. S. 2004. Assessment of lipidcompounds and phosphorus in mangrovesediments of Santa Catarina Island, SC,Brazil. Journal of the Brazilian ChemicalSociety, 15: 725-734.
Mauad, C. R., Wagener, A. d. L. R., Massone, C. G.,Aniceto, M. d. S., Lazzari, L., Carreira, R. S.& Farias, C. d. O. 2015. Urban rivers asconveyors of hydrocarbons to sediments ofestuarine areas: Source characterization, flowrates and mass accumulation. Science of TheTotal Environment, 506–507: 656-666.
McCallister, S. L., Bauer, J. E., Ducklow, H. W. &Canuel, E. A. 2006. Sources of estuarinedissolved and particulate organic matter: Amulti-tracer approach. OrganicGeochemistry, 37: 454-468.
Melo, G. V. 2004. Transporte de metais pesados nosedimento em suspensão na Baía deGuanabara, em um ciclo de maré. Master
Dissertation. Federal Fluminense University,Niteroi, Brazil, 102 p.
Meyers, P. A. 1997. Organic geochemical proxies ofpaleoceanographic, paleolimnologic, andpaleoclimatic processes. OrganicGeochemistry, 27: 213-250.
Middelburg, J. J. & Nieuwenhuize, J. 2001. Nitrogenisotope tracing of dissolved inorganic nitrogenbehaviour in tidal estuaries. Estuarine,Coastal and Shelf Science, 53: 385-391.
Miranda, L. B. 1985. Forma de correlação T-S demassa d´água da regiões costeira e oceânicaentre o cabo de São Tomé (RJ) e a Ilha de SãoSebastião (SP, Brasil). Boletim InstitutoOceanográfico, 33: 105-119.
Neto, J., Gingele, F., Leipe, T. & Brehme, I. 2006.Spatial distribution of heavy metals insurficial sediments from Guanabara Bay: Riode Janeiro, Brazil. Environmental Geology,49: 1051-1063.
Rada, J. P., Duarte, A. C., Pato, P., Cachada, A. &Carreira, R. S. 2016. Sewage contamination ofsediments from two Portuguese Atlanticcoastal systems, revealed by fecal sterols.Marine Pollution Bulletin, 103: 319-324.
Rangel, C. M. A., Baptista Neto, J. A., Fonseca, E.M., McAlister, J. & Smith, B. J. 2011. Studyof heavy metal concentration and partitioningin the Estrela River: implications for thepollution in Guanabara Bay - SE Brazil.Anais da Academia Brasileira de Ciências,83: 801-816.
Richard, E. C., Hamacher, C., Farias, C. O., Dore,M. P., Ribeiro, N. C. M., Passos, M. A.,Martinho, P. F., Godoy, J. M. & Carreira, R. S.2014. Historical Evolution of Organic MatterAccumulation in a Coastal Bay in the SWAtlantic, Brazil: Use of Sterols and n-Alcohols as Molecular Markers. Journal ofthe Brazilian Chemical Society, 25: 1380-1390.
Santos, E. S., Carreira, R. d. S. & Knoppers, B. A.2008. Sedimentary sterols as indicators ofenvironmental conditions in SoutheasternGuanabara Bay, Brazil. Brazilian Journal ofOceanography, 56: 97-113.
Schmidt, F., Hinrichs, K.-U. & Elvert, M. 2010.Sources, transport, and partitioning of organicmatter at a highly dynamic continentalmargin. Marine Chemistry, 118: 37-55.
Silva, C. A. & Madureira, L. A. S. 2012. Sourcecorrelation of biomarkers in a mangroveecosystem on Santa Catarina Island in
Pan-American Journal of Aquatic Sciences (2016), 11(4):276-291

Eutrophic bay influence on the coastal ocean 291
southern Brazil. Anais da AcademiaBrasileira de Ciências, 84: 589-604.
Takada, H. & Eganhouse, R. P. 1998. Molecularmarkers of anthropogenic waste. Pp. 2883-2940. In: Meyers, R. A. (Ed.). Encyclopediaof Environmental Analysis andRemediation. John Wiley & Sons, Inc., NewYork, USA, 5488 p.
Valentin, J., Tenenbaum, D., Bonecker, A.,Bonecker, S., Nogueira, C., Paranhos, R. &Villac, M.-C. 1999. Caractéristiqueshydrobiologiques de la Baie de Guanabara(Rio de Janeiro, Brésil). Journal duRecherche Océanographique, 24: 33-41.
Vieira, R. P., Gonzalez, A. M., Cardoso, A. M.,Oliveira, D. N., Albano, R. M., Clementino,M. M., Martins, O. B. & Paranhos, R. 2008.Relationships between bacterial diversity andenvironmental variables in a tropical marineenvironment, Rio de Janeiro. EnvironmentalMicrobiology, 10: 189-199.
Volkman, J. K. 2006. Lipid markers for marineorganic matter. Pp. 27-70. In: Volkman, J. K.(Ed.). Handbook of EnvironmentalChemistry, Volume 2: Reactions and
Processes 2 (N). Springer, Berlin, 673 p.Wagener, A. d. L. R., Meniconi, M. d. F. G.,
Hamacher, C., Farias, C. O., da Silva, G. C.,Gabardo, I. T. & Scofield, A. d. L. 2012.Hydrocarbons in sediments of a chronicallycontaminated bay: The challenge of sourceassignment. Marine Pollution Bulletin, 64:284-294.
Wakeham, S. G. & McNichol, A. P. 2014. Transferof organic carbon through marine watercolumns to sediments - insights from stableand radiocarbon isotopes of lipid biomarkers.Biogeosciences, 11: 6895-6914.
Yoshinaga, M. Y., Sumida, P. Y. G. & Wakeham, S.G. 2008. Lipid biomarkers in surfacesediments from an unusual coastal upwellingarea from the SW Atlantic Ocean. OrganicGeochemistry, 39: 1385-1399.
Yunker, M. B., Belicka, L. L., Harvey, H. R. &Macdonald, R. W. 2005. Tracing the inputsand fate of marine and terrigenous organicmatter in Arctic Ocean sediments: Amultivariate analysis of lipid biomarkers.Deep Sea Research Part II: Topical Studiesin Oceanography, 52: 3478-3508.
Received: October 2016Accepted: November 2016
Published: January 2017
Pan-American Journal of Aquatic Sciences (2016), 11(4):276-291

Characterization of particulate organic matter in a Guanabara Bay-coastal ocean transect using elemental, isotopic and molecular
markers
JULIANNA M. A. MARTINS1, TAISSA S. M. SILVA1, ALEXANDRE M. FERNANDES2,CARLOS G. MASSONE1 & RENATO S. CARREIRA1
Supplementary Material
Table S1. Distribution of individual fatty acids in the suspended particles in the two namplings. Values in µg L-1.
January/2014 May/2014Station 1 2 3 4 5 6 1 2 3 4 5 6Fatty acids*14:0 1.20 0.53 0.72 0.56 4.68 3.12 na 1.78 1.64 1.20 0.84 0.8214:1 0.16 0.02 0.08 0.03 0.07 0.03 na 0.08 0.05 0.27 0.02 0.01i15 0.46 0.11 0.27 0.13 0.26 0.18 na 0.53 0.37 2.66 0.16 0.08a15 0.20 0.06 0.14 0.07 0.15 0.12 na 0.40 0.29 0.22 0.14 0.0715:0 0.11 0.05 0.08 0.06 0.25 0.18 na 0.27 0.16 0.14 0.08 0.0515:1 <lq <lq 0.04 <lq <lq <lq na <lq 0.07 <lq <lq 0.0216:0 3.21 1.06 1.83 1.50 6.93 4.08 na 15.08 17.20 9.60 4.37 4.2216:17 2.59 0.82 1.51 0.96 0.07 4.34 na 1.77 1.69 1.20 1.00 0.14i17 <lq <lq 0.04 <lq 5.10 0.11 na 0.05 0.06 0.04 0.03 0.01a17 0.03 0.01 0.02 <lq 0.16 <lq na 0.06 0.03 0.03 0.02 0.0117:0 0.04 0.03 0.03 0.02 0.01 0.10 na 0.18 0.11 0.09 0.04 0.0317:1 0.39 0.02 0.03 0.02 0.43 0.08 na 0.29 0.10 0.11 0.08 0.0418:0 0.12 0.09 0.08 <lq 0.40 0.18 na 1.51 1.39 0.80 0.32 0.4118:19t 0.04 0.02 <lq <lq 0.09 0.10 na <lq 0.02 <lq <lq 0.03
18:19c 0.65 0.19 0.42 0.27 0.82 0.53 na 2.48 3.63 1.69 0.98 0.4218:26t 0.03 <lq 0.03 <lq 0.01 <lq na 0.14 <lq 0.05 0.03 0.02
18:26c 0.55 0.13 0.30 0.17 0.61 0.42 na 1.40 3.13 1.16 0.54 0.3018:36 0.07 0.02 0.05 0.03 0.11 0.09 na 0.27 0.58 0.16 0.05 0.01
18:33 1.66 0.31 0.99 0.49 1.15 0.51 na 0.49 0.83 0.64 0.70 0.2720:0 <lq <lq <lq <lq 0.04 <lq na <lq <lq <lq 0.03 0.0320:1 0.03 <lq 0.02 <lq 0.03 0.02 na <lq 0.05 <lq 0.08 0.0120:2 <lq <lq <lq <lq 0.01 0.03 na <lq <lq <lq <lq <lq20:36 <lq <lq 0.02 <lq 0.03 0.03 na <lq <lq <lq <lq <lq20:33 0.14 0.05 0.09 0.04 0.10 0.12 na 0.02 <lq 0.03 0.03 0.02
20:46 0.03 <lq <lq <lq 0.02 <lq na <lq <lq <lq 0.01 0.0320:53 1.13 0.54 0.74 0.43 1.82 1.63 na 0.65 4.90 1.46 0.78 0.0122:0 <lq <lq <lq <lq <lq <lq na <lq 0.08 0.05 <lq <lq22:19 0.02 <lq 0.02 <lq 0.02 <lq na <lq 0.06 <lq 0.02 <lq22:2 <lq <lq <lq <lq <lq <lq na 0.06 0.09 0.05 <lq <lq23:0 0.02 <lq 0.03 <lq 0.05 0.05 na 0.23 0.25 <lq 0.05 <lq24:0 <lq <lq <lq <lq 0.05 <lq na <lq 0.14 0.08 0.03 0.0322:63 1.00 0.30 0.50 0.25 0.97 0.61 na 0.16 4.50 1.03 0.67 <lq24:1 <lq <lq <lq <lq <lq <lq na <lq <lq <lq <lq <lq26:0 <lq <lq <lq <lq <lq <lq na <lq 0.05 <lq <lq <lq28:0 <lq <lq <lq <lq <lq <lq na <lq <lq <lq <lq <lq
* nomenclature of fatty acids: a:bc, where a = number of carbons in the chain, b = number of insaturation; c = position of the first insaturation in the carbono chain; “i” refers to “iso” and “a” refers to “ante-iso” homologs of a particular fatty acid.na = not analyzed; < lq = below limit of quantification (0.01 g L-1)
Pan-American Journal of Aquatic Sciences (2016), 11(4): 276-291 Annex I-i
000 J. M. A. MARTINS ET AL.
Table S2. Distribution of individual n-alcohols. Values in µg L-1.
January/2014 May/2014Station E1 E2 E3 E4 E5 E6 E1 E2 E3 E4 E5 E6
n-alcohols*C14-OH <lq <lq <lq <lq <lq 0.03 0.09 na <lq <lq <lq <lqC16-OH 0.06 0.04 0.06 0.08 0.02 0.21 0.17 na 0.12 0.02 0.03 0.04C18-OH <lq 0.19 0.33 0.37 0.13 <lq 0.49 na <lq <lq <lq 0.11C20-OH 0.05 0.03 0.05 0.06 0.03 0.07 0.04 na 0.08 0.02 0.03 0.04C22-OH 0.02 0.01 0.02 0.02 0.01 0.03 0.02 na 0.08 <lq 0.02 <lqC24-OH 0.10 0.05 0.10 0.10 0.05 0.13 0.01 na 0.02 <lq <lq <lqC26-OH 0.02 0.01 0.02 0.02 0.01 0.04 0.01 na 0.02 <lq <lq <lqC28-OH 0.01 0.01 0.01 0.01 0.01 0.01 <lq na <lq <lq <lq <lqC30-OH 0.09 0.03 0.04 0.05 0.04 0.11 0.01 na 0.01 <lq <lq <lqC32-OH 0.03 0.01 0.01 0.02 0.01 0.04 <lq na <lq <lq <lq <lq
*nomenclature: Cn-OH, where n is the number of C in the linear chain
Pan-American Journal of Aquatic Sciences (2016), 11(4): 276-291 Annex I-ii