Embed Size (px)
Citation preview
ANDRÉS FELIPE CHAMORRO RENGIFO
DETERMINAÇÃO DAS FORÇAS MOTRIZ ES DE FORMAÇÃO E PARTIÇÃO EM SISTEMAS AQUOSOS BIFÁSICOS
MACROMOLÉCULA + SAL
Dissertação apresentada à Universidade Federal de Viçosa, como parte das exigências do Programa de Pós-Graduação em Agroquímica, para obtenção do título de Magister Scientiae.
VIÇOSA MINAS GERAIS – BRASIL
2015
Ficha catalográfica preparada pela Biblioteca Central da UniversidadeFederal de Viçosa - Câmpus Viçosa
T
Chamorro Rengifo, Andrés Felipe, 1989-
C448d2015
Determinação das forças motrizes de formação e partiçãoem sistemas aquosos bifásicos macromolécula + sal / AndrésFelipe Chamorro Rengifo. – Viçosa, MG, 2015.
ix, 89f. : il. (algumas color.) ; 29 cm.
Orientador: Luis Henrique Mendes da Silva.
Dissertação (mestrado) - Universidade Federal de Viçosa.
Inclui bibliografia.
1. Sistemas aquosos bifásicos. 2. Separação (Tecnologia).3. Extração (Química). 4. Purificação. 5. Enzimas. 6. Proteínas.7. Quimosina. I. Universidade Federal de Viçosa. Departamentode Química. Programa de Pós-graduação em Agroquímica.II. Título.
CDD 22. ed. 547
ANDRÉS FELIPE CHAMORRO RENGIFO
DETERMINAÇÃO DAS FORÇAS MOTRIZ ES DE FORMAÇÃO E PARTIÇÃO EM SISTEMAS AQUOSOS BIFÁSICOS
MACROMOLÉCULA + S AL
Dissertação apresentada à Universidade Federal de Viçosa, como parte das exigências do Programa de Pós-Graduação em Agroquímica, para obtenção do título de Magister Scientiae.
APROVADA: 20 de Julho de 2015
_________________________________ _____________________________
Profa. Ana Clarissa dos Santos Pires Prof. Gustavo Costa Bressan
____________________________________ Prof. Luis Henrique Mendes da Silva
(Orientador)

ii
Dedico à
Juliana Chamorro Rengifo e
Carlos Henrique Oliveira Silva.
Obrigado por tudo
iii
AGRADECIMENTOS
À Universidade Federal de Viçosa e ao Programa de Pós-graduação em
Agroquímica pela oportunidade;
À Coordenação de Aperfeiçoamento de pessoal de Nível Superior (CAPES)
pela bolsa de estudos;
Ao Instituto Nacional de Ciências e Tecnologias Analíticas Avançadas
(INCTAA), à Fundação de Amparo a Pesquisa do Estado de Minas Gerais
(FAPEMIG), à Financiadora de Estudos e Projetos (FINEP) e ao Conselho Nacional
de Desenvolvimento Científico e Tecnológico (CNPq) pelo apoio financeiro;
Aos professores Luis Henrique Mendes da Silva e Maria do Carmo
Hespanhol da Silva pela orientação, discussões teóricas e apoio;
À professora Ana Clarissa dos Santos Pires e ao professor Gustavo Costa
Bressan pela participação na banca e suas sugestões.
Ao Guilherme Max e ao Gabriel Max pelo aporte experimental, conceitual e
ortográfico nos três capítulos deste documento.
Aos integrantes do Grupo QUIVECOM e família pelo apoio.

iv
RESUMO
CHAMORRO RENGIFO, Andrés Felipe, M.Sc., Universidade Federal de Viçosa, Julho de 2015. Determinação das forças motrizes de formação e partição em sistemas aquosos bifásicos macromolécula + sal. Orientador: Luis Henrique Mendes da Siva. Coorientadora: Maria do Carmo Hespanhol da Silva.
Sistemas aquosos bifásicos (SABs) são reconhecidos como eficientes na extração e
purificação de diferentes compostos. Entretanto, as forças motrizes que dirigem a
distribuição de diferentes solutos nos SABs ainda são pouco estabelecidas,
principalmente porque existem poucos trabalhos focados em estudar os parâmetros
termodinâmicos de partição de diferentes solutos. Isso impede a obtenção de
conhecimentos científicos necessários para a modulação das propriedades fisico-
químicas dos SABs afim de otimizar sua aplicação para a extração e purificação.
Para abordar esta problemática, foram formados novos SABs com sais orgânicos
(citrato de sódio, tartarato de sódio e succinato de sódio) ambientalmente seguros e
poli(oxido de etileno), PEO, com massa molares 10000 e/ou 35000 g mol-1 nas
temperaturas de 283,15, 298,15 e 313,15 K (capítulo 2). Além disso, um conjunto de
SABs reportados na literatura e obtidos neste trabalho foi utilizado para avaliar o
comportamento de partição da enzima quimosina (capítulo 3), avaliando a variação
da energia livre de Gibbs de transferência ( ), a variação da entalpia de
transferência ) e a variação da entropia de transferência ( ). Os
resultados do segundo capítulo mostram que o processo de segregação de fase para
todos os SABs obtidos foi endotérmico e entropicamente dirigido. A região bifásica
do diagrama de fases aumentou na ordem citrato > tartarato > succinato, tornando-se
maior com o incremento da massa molar do PEO. No capitulo 3 foi descoberto que a
transferência da quimosina da fase inferior para a fase superior dos SABs avaliados
v
foi entalpicamente dirigida com e A transferência da quimo-
sina é um processo entalpica-entropicamente compensado com valores do potencial
termodinâmico de partição compreendidos entre, . Também foi observado que o processo de partição da enzima é
dependente da linha de amarração, natureza do cátion e do ânion, balanço
hidrofóbico/hidrofílico e a massa molar da macromolécula.
vi
ABSTRACT
CHAMORRO RENGIFO, Andrés Felipe, M.Sc., Universidade Federal de Viçosa, Julho de 2015. Determination of the driven forces in the formation and partition in macromolecule + salt aqueous two-phase systems. Adviser: Luis Henrique Mendes da Siva. Co-Adviser: Maria do Carmo Hespanhol da Silva.
Aqueous two-phase systems (ATPSs) are recognized as efficient for the extraction
and puritication of different compounds. However, the motriz power that governs the
distribution of different solutes in ATPSs are few understood, mainly because are
few researches focused on the study of the partition thermodynamic of different
solutes in these systems. This makes difficult to obtain the scientific knowledge
necessary to the physic-chemistry properties modulation of ATPSs for optimizer
their application for extraction and purification of solutes. In this sense, new ATPSs
formed by organic salts (sodium citrate, sodium tartrate and sodium succinate)
environmentally safe and poly (ethylene oxide), PEO, with molar mass 10,000 or
35,000 g mol-1 at 283.15, 298.15 and 313.15 K were formed (chapter 2). In addition,
several ATPSs reported in the literature and obtained here were used for evaluate the
behavior of enzyme chymosin (chapter 3). The transfer free energy change ( ),
transfer enthalpy change ) and transfer entropy change ( ) were
obtained. The second chapter results showed that the segregation process of phase for
all ATPSs obtained was endothermic and entropic driven. The biphasic region on the
phase diagrams increased follow: citrate > tartrate > succinate and increased as PEO
mass molar increase. In the chapter 3, it was discovered that chymosin transfer from
the bottom to top phase in the ATPS studies was enthalpically driven with and . The chymosin transfer process is enthalpy-entropy
vii
compensate with the partition thermodynamic potential values, between . It was also observed that the enzyme partition
process depend of tie line, the cation/anion nature, hydrophobic/hydrophilic balance
and macromolecule molar mass.
viii
SUMARIO
CAPÍTULO 1. ........................................................................................................ 1
1. INTRODUÇÃO ................................................................................................. 1 2. REVISÃO DE LITERATURA ............................................................................... 2
2.1 Quimosina................................................................................................... 2 2.1.1 Métodos de extração e obtenção de quimosina ...................................... 4
2.2 Sistemas aquosos bifásicos: Histórico e conceitos ....................................... 6 2.2.1 Diagrama de fases e características dos SABs ....................................... 8 2.2.2 Extração de biosolutos com SABs. ......................................................10
2.3 Termodinâmica de partição de solutos em SABs (ITC) ...............................17 2.4. Determinação da entalpia de diluição de solutos ( ) ..........................23 2.5 Modelo de Johansson (contribuição entálpica e entrópica para o valor K) 24
3. CONSIDERAÇÕES FINAIS DO CAPÍTULO 1 .........................................................28 4. REFERÊNCIAS ...................................................................................................29
CAPÍTULO 2: PHASE DIAGRAMS, DENSITIES AND REFRACTIVE INDEXES OF POLY(OXIDE ETHYLENE) + ORGANIC SALTS + WATER AQUEOUS TWO-PHASE SYSTEMS: EFFECT OF TEMPERATURE, ANION AND MOLAR MASS ..............................................................................32
ABSTRACT ..........................................................................................................32
1. INTRODUCTION .............................................................................................33 2. MATERIALS AND METHODS ...........................................................................34
2.1 Materials ...............................................................................................34 2.2 Preparation of ATPS .............................................................................34 2.3 Construction of phase diagrams ............................................................35 2.4 Density and Refractive Index Measurements .........................................36
3. RESULTS AND DISCUSSION ............................................................................36 4. CONCLUSION ................................................................................................50 5. REFERENCES .................................................................................................51
CAPÍTULO 3: DRIVING FORCES FOR CHYMOSIN PARTITIONING ON THE MACROMOLECULE-SALT AQUEOUS TWO PHASE SYSTEM. ........55
ABSTRACT ..........................................................................................................55
1. INTRODUCTION .............................................................................................56 2. EXPERIMENTAL SECTION ...............................................................................59
2.1 Materials ...............................................................................................59 2.2 Determination of chymosin partition coefficient ....................................59 2.3 Thermodynamic parameters of chymosin transfer..................................60
2.3.1 Chymosin transfer Gibbs free energy change ( ) .......................60 2.3.2 Chymosin transfer enthalpy change ( ) ..................................61 2.3.3 Chymosin transfer entropy change ( )......................................62
ix
2.4 Dilution enthalpy change for the infinite dilution condition ...................62 3. RESULTS AND DISCUSSION .............................................................................63
3.1 Chymosin partition behavior .................................................................63 3.2 Cation effect on chymosin partition behavior.........................................69 3.3 Anion effect on the chymosin partition behavior ....................................73 3.4 Polymer hydrophobicity effect on the chymosin partition behavior ........77 3.5 Polymer size effect on chymosin partition behavior ...............................80
4. CONCLUSIONS ...............................................................................................83 5. REFERENCES .................................................................................................84 6. CONSIDERAÇÕES FINAIS ................................................................................89
1
CAPÍTULO 1.
1. Introdução
Enzimas são substâncias orgânicas de natureza proteica produzida pelos
organismos vivos. Tais substâncias têm a capacidade de diminuir a energia de
ativação em diferentes reações químicas, atuando como catalisadores em importantes
processos industriais como, por exemplo, na indústria de produtos lácteos.
A quimosina é uma enzima com ação catalítica sobre k-caseína o que a torna
amplamente utilizada na indústria de produtos lácteos para a fabricação do queijo.
Ela é extraída dos abomasos de ruminantes, existindo diferentes metodologias para
sua obtenção. Entretanto todas essas metodologias são caracterizadas por apresentar
múltiplas etapas (extração, separação e purificação), bem como tempos longos no
processo de produção e alto custo. Os longos tempos associados ao processo têm
como consequência a diminuição da atividade biológica da enzima e em alguns casos
a sua desnaturação. Nesse sentido, torna-se necessário desenvolver novas
metodologias com alta efetividade, reprodutibilidade, baixo custo e baixo impacto
ambiental, substituindo as metodologias tradicionais.
Uma alternativa para extração e purificação de quimosina são os sistemas
aquosos bifásicos (SABs). Os SABs provaram-se ser eficientes na purificação e
extração de solutos biológicos (células, enzimas, vírus, proteínas, etc.). Estes
sistemas são formados por compostos não inflamáveis e possuem facilidade de
aplicação em grande escala industrial. Mas, para poder propor uma nova metodologia
de extração utilizando SABs, é importante estudar e compreender como acontece a
distribuição da quimosina nestes sistemas e que interações intermoleculares estão
presentes durante seu processo de transferência. Isto significa analisar o
2
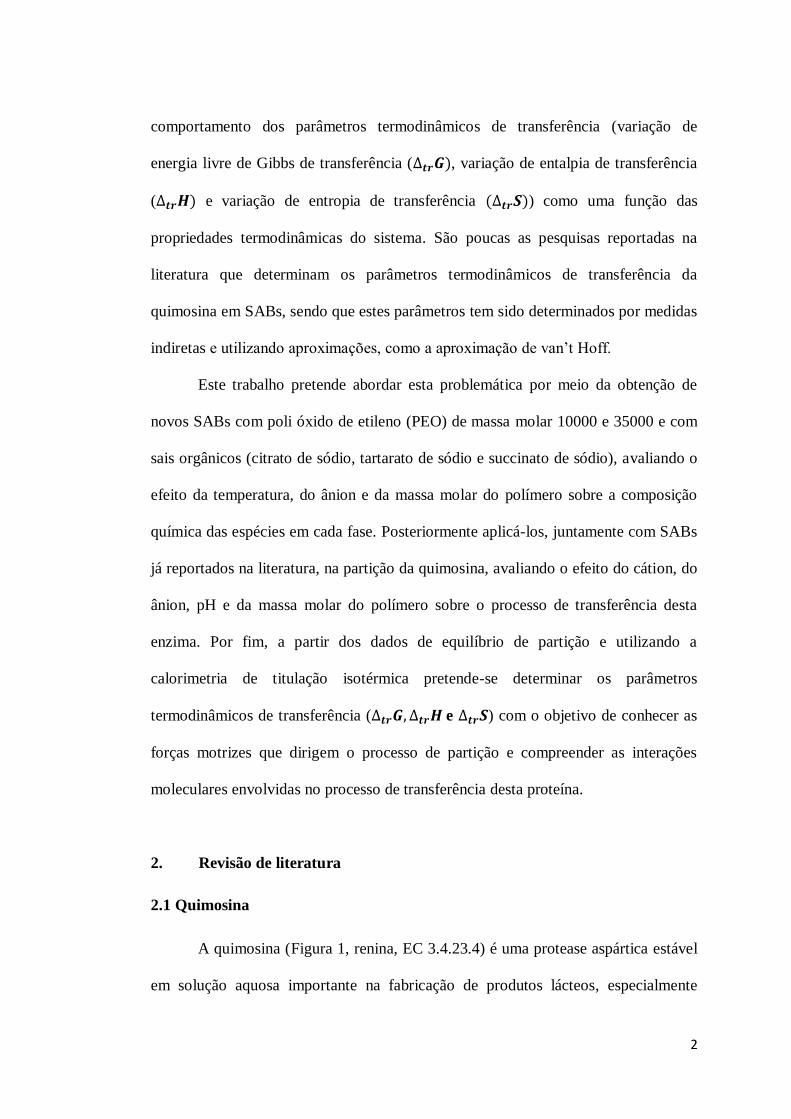
comportamento dos parâmetros termodinâmicos de transferência (variação de
energia livre de Gibbs de transferência ( , variação de entalpia de transferência
( e variação de entropia de transferência ) como uma função das
propriedades termodinâmicas do sistema. São poucas as pesquisas reportadas na
literatura que determinam os parâmetros termodinâmicos de transferência da
quimosina em SABs, sendo que estes parâmetros tem sido determinados por medidas
indiretas e utilizando aproximações, como a aproximação de van’t Hoff.
Este trabalho pretende abordar esta problemática por meio da obtenção de
novos SABs com poli óxido de etileno (PEO) de massa molar 10000 e 35000 e com
sais orgânicos (citrato de sódio, tartarato de sódio e succinato de sódio), avaliando o
efeito da temperatura, do ânion e da massa molar do polímero sobre a composição
química das espécies em cada fase. Posteriormente aplicá-los, juntamente com SABs
já reportados na literatura, na partição da quimosina, avaliando o efeito do cátion, do
ânion, pH e da massa molar do polímero sobre o processo de transferência desta
enzima. Por fim, a partir dos dados de equilíbrio de partição e utilizando a
calorimetria de titulação isotérmica pretende-se determinar os parâmetros
termodinâmicos de transferência ( e ) com o objetivo de conhecer as
forças motrizes que dirigem o processo de partição e compreender as interações
moleculares envolvidas no processo de transferência desta proteína.
2. Revisão de literatura
2.1 Quimosina
A quimosina (Figura 1, renina, EC 3.4.23.4) é uma protease aspártica estável
em solução aquosa importante na fabricação de produtos lácteos, especialmente
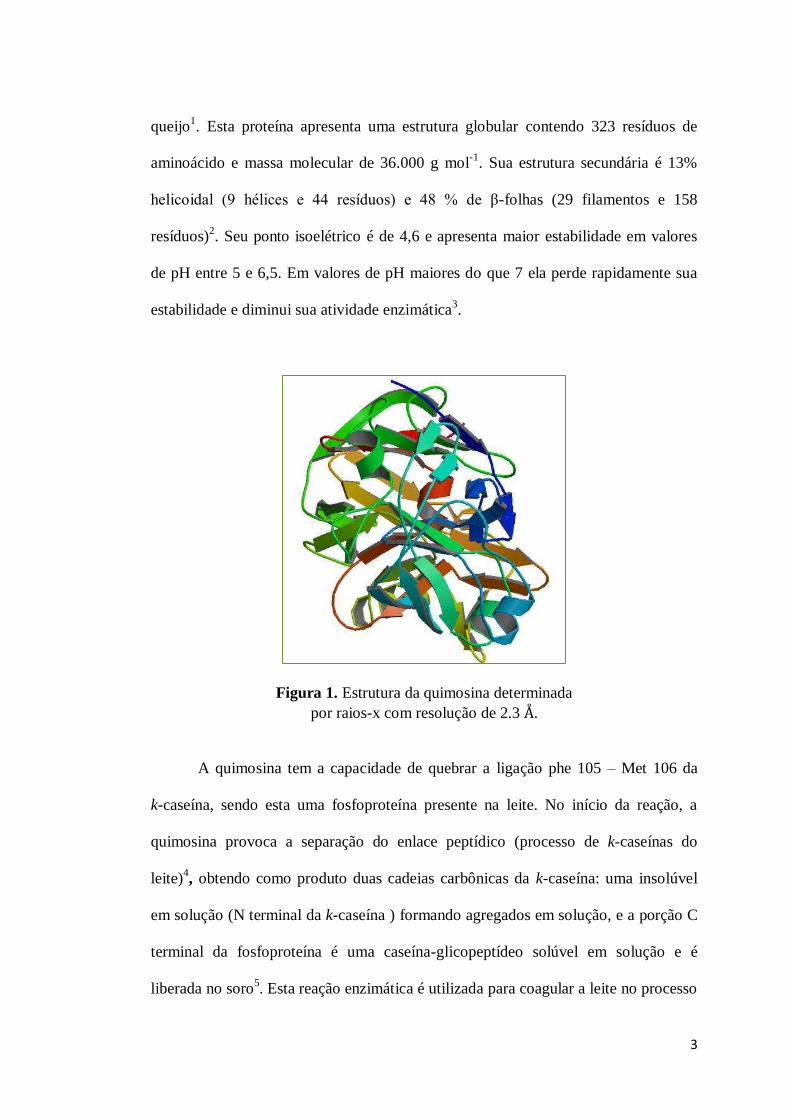
3
queijo1. Esta proteína apresenta uma estrutura globular contendo 323 resíduos de
aminoácido e massa molecular de 36.000 g mol-1. Sua estrutura secundária é 13%
helicoidal (9 hélices e 44 resíduos) e 48 % de β-folhas (29 filamentos e 158
resíduos)2. Seu ponto isoelétrico é de 4,6 e apresenta maior estabilidade em valores
de pH entre 5 e 6,5. Em valores de pH maiores do que 7 ela perde rapidamente sua
estabilidade e diminui sua atividade enzimática3.
Figura 1. Estrutura da quimosina determinada por raios-x com resolução de 2.3 .
A quimosina tem a capacidade de quebrar a ligação phe 105 – Met 106 da
k-caseína, sendo esta uma fosfoproteína presente na leite. No início da reação, a
quimosina provoca a separação do enlace peptídico (processo de k-caseínas do
leite)4, obtendo como produto duas cadeias carbônicas da k-caseína: uma insolúvel
em solução (N terminal da k-caseína ) formando agregados em solução, e a porção C
terminal da fosfoproteína é uma caseína-glicopeptídeo solúvel em solução e é
liberada no soro5. Esta reação enzimática é utilizada para coagular a leite no processo
4
da fabricação do queijo, por esse motivo a quimosina é uma enzima de interesse
industrial.
No Brasil, a produção de queijo aumenta a cada ano. De acordo com ABIQ
(Associação Brasileira das Indústrias de Queijo) o consumo de queijo subiu em 67,35
% de 2006 até 2014. Considerando estas estatísticas e o fato de que a quimosina é
utilizada no processo de fabricação do queijo de coagulação enzimática, é necessário
elevar sua produção. Para cumprir estes objetivos são necessárias novas
metodologias de extração, que sejam eficientes, econômicas e ambientalmente
responsáveis. Uma revisão das metodologias utilizadas recentemente é feita a seguir.
2.1.1 Métodos de extração e obtenção de quimosina
O processo de produção de queijo é altamente dependente da pureza da
quimosina e de sua atividade enzimática (conformação estrutural): quanto maior a
pureza da enzima, maior será a eficiência da ação enzimática sobre as ligações
peptídicas da k-caseína6. Nesse sentido, é importante utilizar metodologias que
preservem a estrutura molecular da enzima associados a um alto rendimento de
extração e com pureza elevada. Na literatura, encontram-se vários métodos para
extração e purificação de quimosina os quais podem ser divididos em dois grupos: i)
com base na clonagem do gen da quimosina e sua posterior expressão numa bactéria
e ii) na extração dos abomasos de bezerros lactentes, cerdos, cordeiros, búfalos7.
O método de clonagem do gem atualmente é muito utilizado, e bactérias tais
como Aspergillus oryzae e Mucor pussillus são comumente utilizadas para expressar
o gem da quimosina. Já os métodos de extração do abomasos apresentam
normalmente 3 etapas: extração, separação e purificação 8. Na etapa de extração, o
abomaso é deixado em uma solução extratante por vários dias, como descrito na
5
metodologia utilizada por Houen e et al. 9, que utilizaram água fria como solução
extratora (5 mg/g de tecido). Outros trabalhos reportam a utilização de uma solução
de NaCl com pH 5 com o objetivo de incrementar a porcentagem de extração. O
inconveniente destes processos é o tempo de duração que pode chegar a
aproximadamente 40 dias10.
Posteriormente à etapa de extração, a quimosina é separada por filtração ou
mais comumente centrifugação (12000g durante 15 minutos e 5oC)9. Embora o
segundo procedimento seja o mais efetivo, é também o mais caro pois necessita do
uso de uma centrífuga com controle de temperatura, fazendo com que a filtração seja
um procedimento mais viável.
Por último, o processo de purificação é o mais caro e que exige maior cuidado
porque é onde pode ocorrer a maior perda da atividade biológica da enzima. Nesta
etapa podem se utilizar procedimentos de precipitação com sulfato de alumínio e
hidrogêno fosfato de sódio com posterior separação por diálise, cromatografia
(cromatografia iônica e cromatografia de coluna) ou eletroforese9-11.
Nas técnicas de separação e purificação utilizadas na última etapa, podem ser
utilizados diferentes eluentes, como corantes12 e solventes hidrofóbicos13, além de
soluções contendo compostos inorgânicos como fosfato de sódio, acetato de amônio
em pH 5,3, ácido clorídrico 10 mM e tampão acetato de sódio pH 5,69.
Referente ao que foi discutido, as metodologias utilizadas tradicionalmente
envolvem altos custos, diminuem a atividade enzimática da quimosina, além de
terem uma eluição lenta na corrida cromatográfica, fazendo com elas não sejam
adequadas para a purificação em grande escala11,14.
Uma alternativa para substituir os procedimentos de filtração e separação nas
metodologias tradicionais são os SABs. Estes são catalogados por RajniHatti-Kaul15
6
como sistemas com alta eficiência e de baixo custo para a extração e purificação de
solutos biológicos.
2.2 Sistemas aquosos bifásicos: Histórico e conceitos
Os SABs consistem em duas fases imiscíveis formadas pela mistura de
diferentes combinações: polímero-polímero, polímero-sal ou sal-sal, sob
determinadas condições específicas de concentração dos componentes formadores,
pressão e temperatura16. Estes sistemas utilizam compostos não inflamáveis e não
voláteis, o que diminui o risco de acidentes de trabalho. Além disso, contém como
componente principal água (60-90 %) reduzindo o impacto ambiental em
comparação às metodologias utilizadas para a extração de quimosina17.
Os SABs foram primeiramente reportados por Beijerinck em 1896, que
observou que a mistura de soluções aquosas de ágar e gelatina ou amido e gelatina
em uma faixa de temperatura e concentrações específicas levava à formação de uma
mistura turva que, após passar por um processo de segregação alcançava o equilíbrio
termodinâmico com a coexistência de duas fases18,19.
Posteriormente, Ostwald e Hertel, misturando soluções aquosas de diferentes
amidos (com diferentes porcentagens de amilose e amilopectina) demostraram que
diferenças estruturais das espécies químicas misturadas posuem influência sobre as
composições das fases no equilíbrio termodinâmico, porque mudam as interações
intermoleculares entre os componentes do sistema20,21. A partir destes
descobrimentos, os trabalhos de pesquisa têm buscado novos sistemas aquosos e
buscado determinar suas propriedades termodinâmicas. Por exemplo, Ryden e
Albertsson em 1971, determinaram a tensão interfacial de sistemas formados com
diferentes composições de poli(óxido de etileno) (PEO) e dextrana a fim de
7
encontrar sistemas com baixos valores desta propriedade os quais permitiriam a
transferência de solutos biológicos de uma fase para outra sem alterar sua estrutura
molecular como se verifica nos sistemas clássicos óleo/água17. Os autores
encontraram que existe relação entre a concentração dos componentes em cada fase e
a tensão interfacial entre as duas fases e verificaram que os SABs apresentam
menores valores de tensão interfacial que os sistemas clássicos, sendo uma boa
ferramenta para a partição destes solutos22.
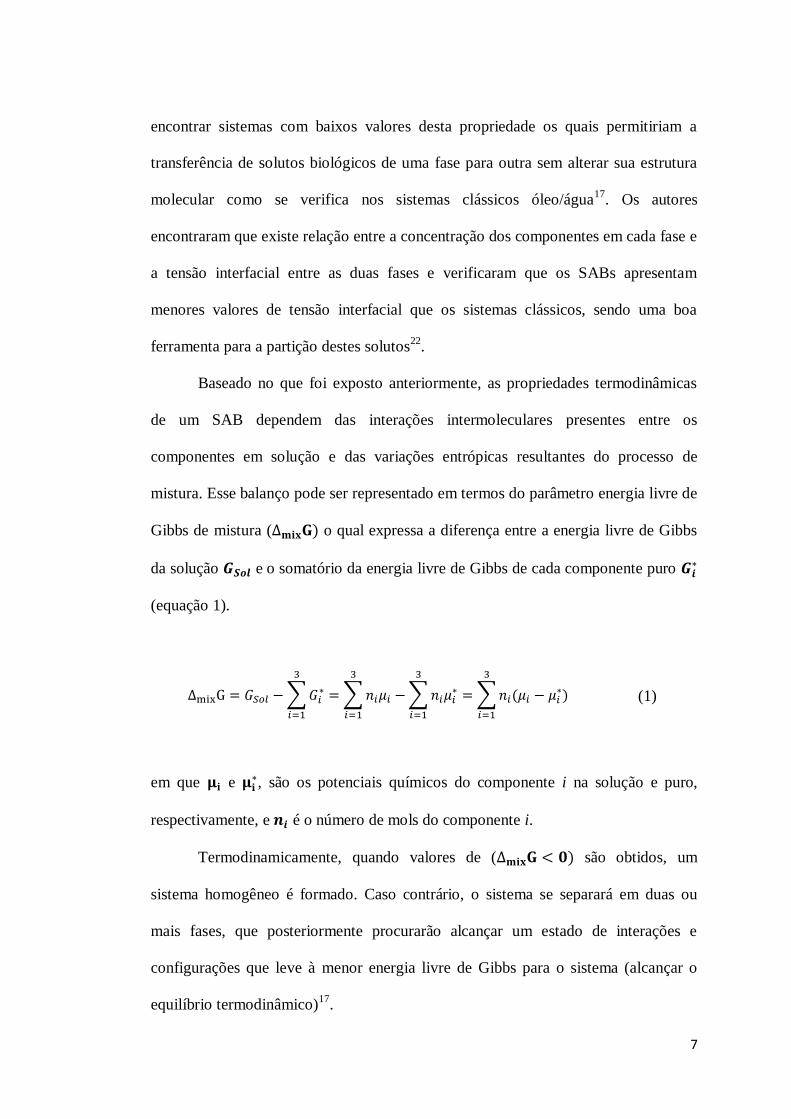
Baseado no que foi exposto anteriormente, as propriedades termodinâmicas
de um SAB dependem das interações intermoleculares presentes entre os
componentes em solução e das variações entrópicas resultantes do processo de
mistura. Esse balanço pode ser representado em termos do parâmetro energia livre de
Gibbs de mistura ( o qual expressa a diferença entre a energia livre de Gibbs
da solução e o somatório da energia livre de Gibbs de cada componente puro (equação 1).
∑ ∑
∑ ∑
(1)
em que e , são os potenciais químicos do componente i na solução e puro,
respectivamente, e é o número de mols do componente i.
Termodinamicamente, quando valores de ( são obtidos, um
sistema homogêneo é formado. Caso contrário, o sistema se separará em duas ou
mais fases, que posteriormente procurarão alcançar um estado de interações e
configurações que leve à menor energia livre de Gibbs para o sistema (alcançar o
equilíbrio termodinâmico)17.
8
Uma maneira de avaliar as condições termodinâmicas que levam a formação
de SABs é através de seu diagrama de fases, como discutido a seguir.
2.2.1 Diagrama de fases e características dos SABs
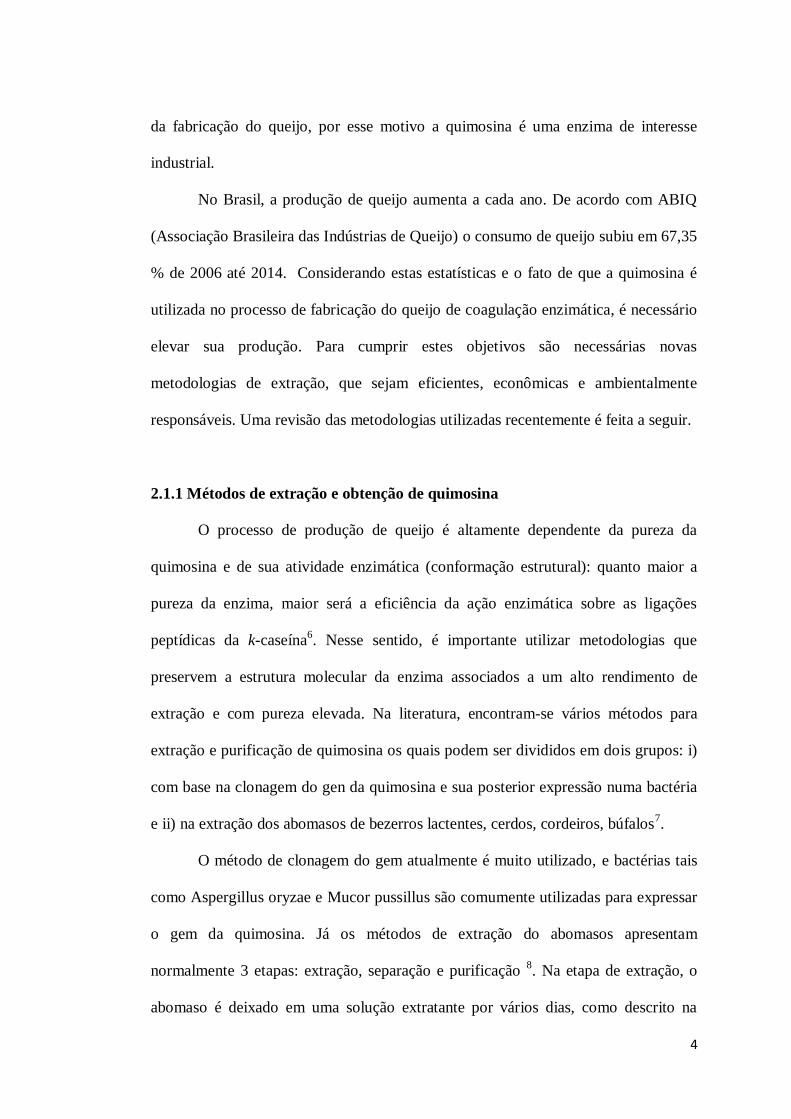
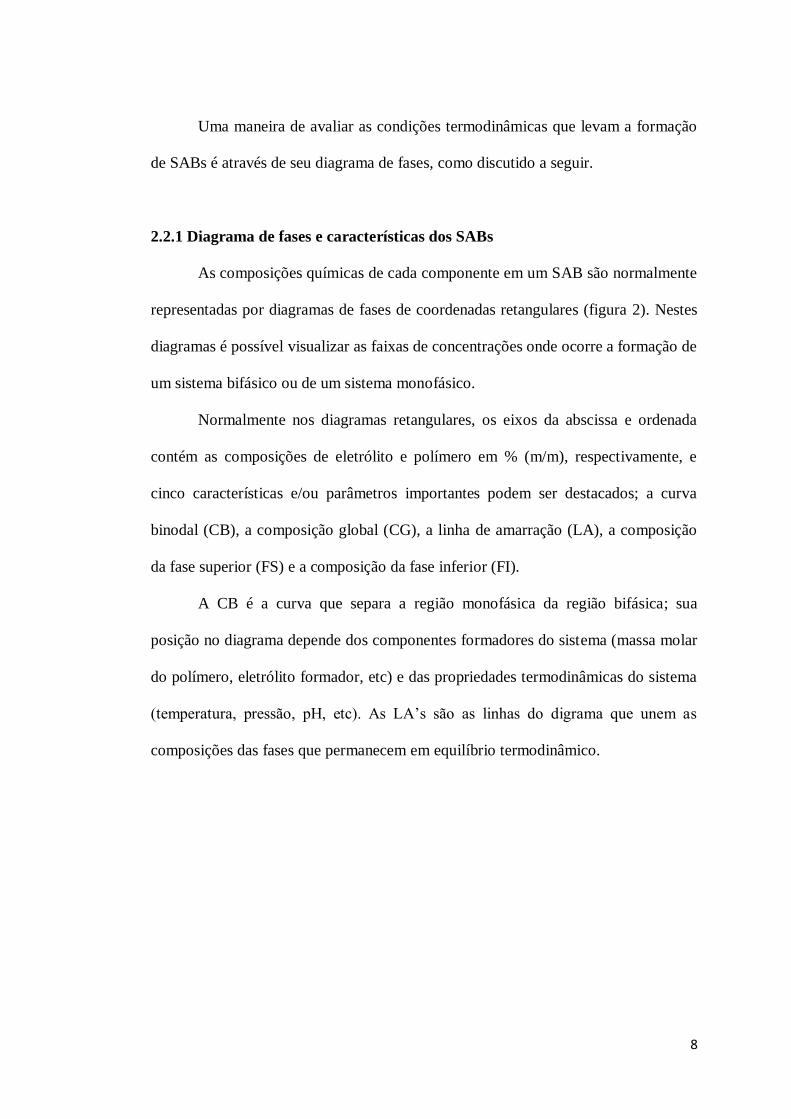
As composições químicas de cada componente em um SAB são normalmente
representadas por diagramas de fases de coordenadas retangulares (figura 2). Nestes
diagramas é possível visualizar as faixas de concentrações onde ocorre a formação de
um sistema bifásico ou de um sistema monofásico.
Normalmente nos diagramas retangulares, os eixos da abscissa e ordenada
contém as composições de eletrólito e polímero em % (m/m), respectivamente, e
cinco características e/ou parâmetros importantes podem ser destacados; a curva
binodal (CB), a composição global (CG), a linha de amarração (LA), a composição
da fase superior (FS) e a composição da fase inferior (FI).
A CB é a curva que separa a região monofásica da região bifásica; sua
posição no diagrama depende dos componentes formadores do sistema (massa molar
do polímero, eletrólito formador, etc) e das propriedades termodinâmicas do sistema
(temperatura, pressão, pH, etc). As LA’s são as linhas do digrama que unem as
composições das fases que permanecem em equilíbrio termodinâmico.

9
0 5 10 15 20 25 30
0
10
20
30
40
50
(CB)
Sistema Monofásico
Sistema bifásico
(CG)
(LA)
(FI)
(FS)
wC1
wC2
Figura 2. Diagrama de fase em coordenadas retangulares de um SAB. FS; Fase superior, FI; Fase inferior, CB; curva binodal, CG; composição global, LA;
linhas de amarração.
O comprimento da linha de amarração (CLA) pode ser obtido a partir da
equação 2.
[( ) ( ) ] ⁄ (2)
Na equação 2, e são as concentrações de polímero em % (m/m) na fase
superior e inferior, respectivamente, enquanto e são as concentrações de sal
em % (m/m) na fase superior e inferior, respectivamente23. O CLA é um parâmetro
muito importante porque permite comparar a capacidade de extração ou de partição
de dois ou mais sistemas que apresentam o mesmo valor de CLA.
Quando se percorre no diagrama sobre uma mesma LA, todos os pontos sobre
essa linha apresentam fases superior e inferior com mesmas propiedades
termodinâmicas intesivas (composição, densidade, etc), no entanto contém diferentes
10
propriedades termodinâmicas extensivas (volumem, massa, etc). Por outro lado,
quanto maior é o CLA, maior é a difereça das propriedades termodinâmicas
intensivas das fases que coexistem em equilíbrio 24,25.
Apesar destas diferenças, os SABs apresentam baixos valores de tensão
interfacial comparado aos sistemas clássicos (solventes orgânicos)/água. Esta
característica facilita a transferência de um soluto biológico de uma fase para outra.
A seguir uma breve revisão da aplicação dos SABs na extração de solutos biológicos.
2.2.2 Extração de biosolutos com SABs.
As vantagem dos SABs para purificação/extração de solutos biológicos foram
utilizadas primeiramente em 1950 por Per-Åke Albertsson et al. para purificar e
extrair solutos biológicos de interesse industrial, especialmente proteínas e células.
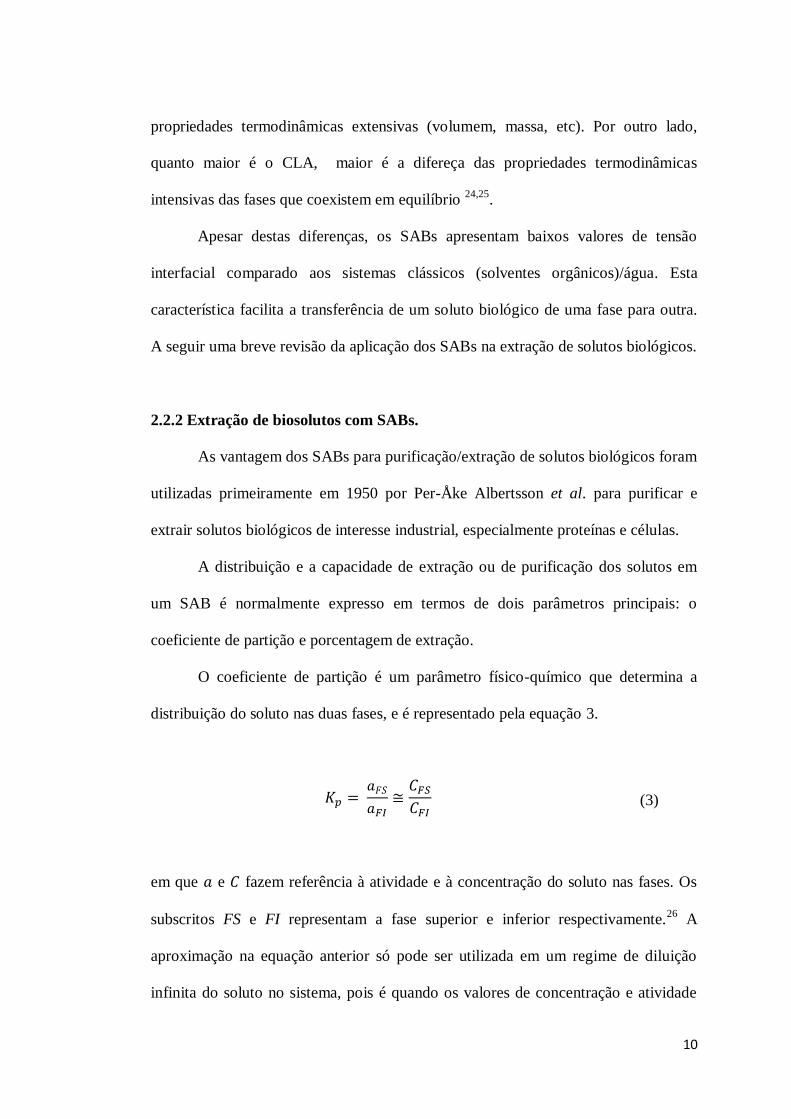
A distribuição e a capacidade de extração ou de purificação dos solutos em
um SAB é normalmente expresso em termos de dois parâmetros principais: o
coeficiente de partição e porcentagem de extração.
O coeficiente de partição é um parâmetro físico-químico que determina a
distribuição do soluto nas duas fases, e é representado pela equação 3.
(3)
em que e fazem referência à atividade e à concentração do soluto nas fases. Os
subscritos FS e FI representam a fase superior e inferior respectivamente.26 A
aproximação na equação anterior só pode ser utilizada em um regime de diluição
infinita do soluto no sistema, pois é quando os valores de concentração e atividade
11
são muito próximos 17.
O mecanismo que governa a distribuição de um soluto entre as fases de um
SAB é muito dependente das propriedades termodinâmicas do sistema e pode ser
afetado por diversas variáveis. No entanto, Asenjo e Andrews 27, publicaram quatro
prováveis causas da partição:
i. Diferença de hidrofobicidade: quando uma fase apresenta uma maior
hidrofobicidade do que a outra e é usada para levar um soluto biológico
hidrofóbico para essa fase.
ii. Eletroquímica: Ocorre devido ao isolamento do soluto com carga elétrica
definida em uma fase. Isto pode acontecer se existe uma ampla diferença
de potencial elétrico entre fases.
iii. Tamanho do soluto: Ocorre um processo de exclusão molecular do soluto
de uma fase por seu tamanho.
iv. Interações específicas: quando existem interações específicas entre o
soluto e um componente presente majoritariamente em uma das fases.
Em um estudo de partição de um soluto em SABs é importante determinar
qual das causas anteriores predomina em sua partição. Conhecer o mecanismo de
partição do soluto nestes sistemas facilita desenvolver metodologias para aplicar
SABs na extração e purificação em escala do laboratório ou escala industrial 28.
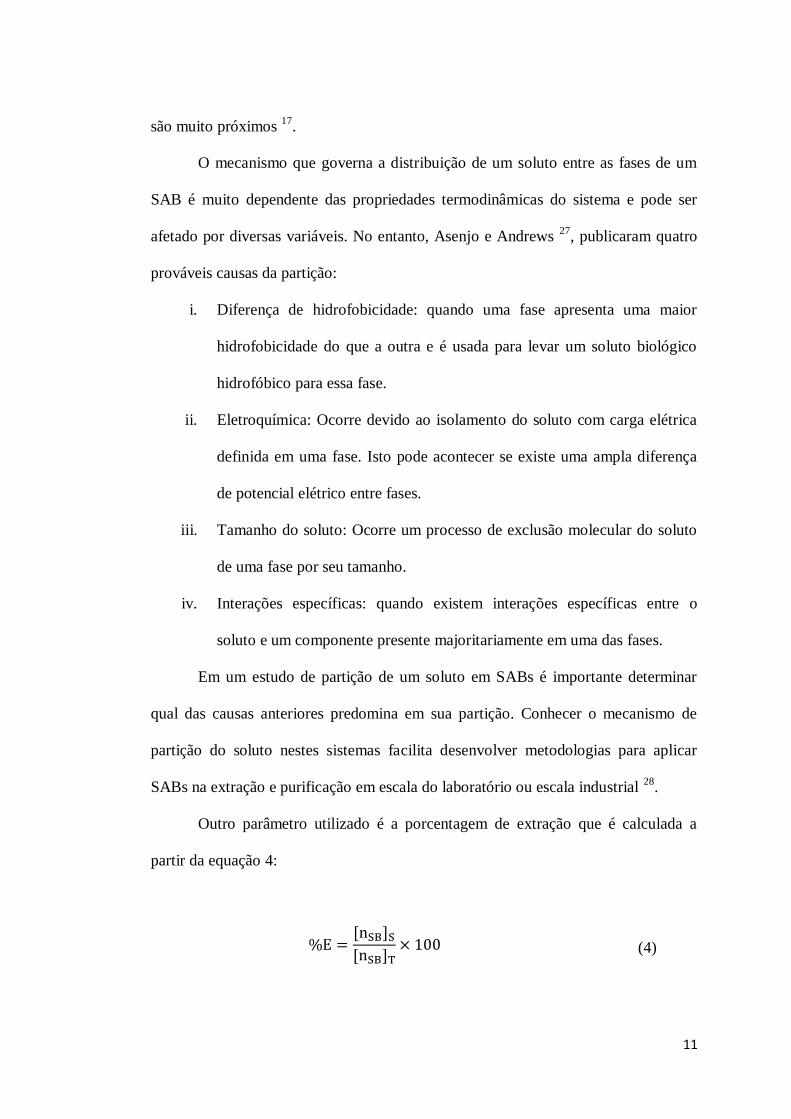
Outro parâmetro utilizado é a porcentagem de extração que é calculada a
partir da equação 4:
(4)
12
em que é a quantidade do soluto na fase superior e é a quantidade total
do soluto no sistema29.
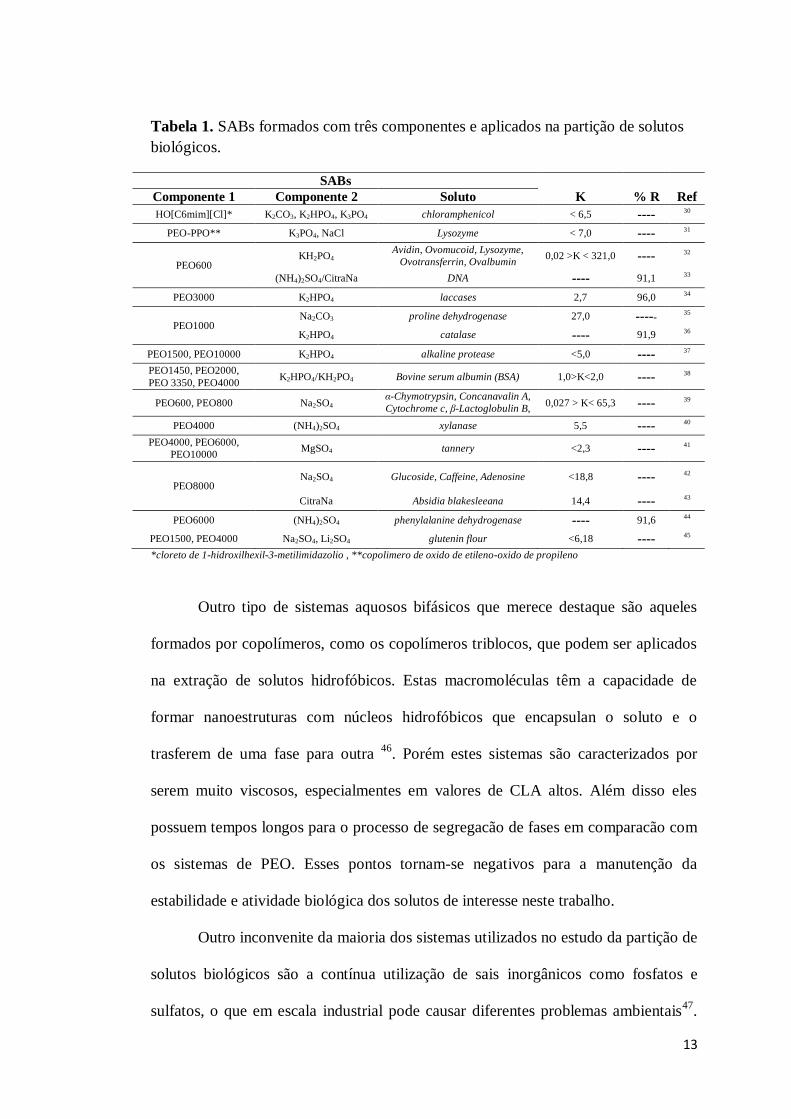
Na literatura é possivel encontrar uma alta tendência na aplicação de SABs
para a partição de solutos biológicos. Nestes estudos, destaca-se a utilização de
sistemas formados com polímeros PEO de diferentes massas molares e sais
inorgânicos (tabela 1). Além disso, nestes sistemas são avaliados diferentes fatores
que facilitam a compressão das interações intermoleculares do processo de
segregação, como também permitem a optimização das metodologias de extração ou
purificação. Entre estes fatores, destaca-se: o efeito da massa molar do polímero
formador do sistema, natureza dos sais (sais orgânicas, inorgânicas), pH , efeito do
cátion e do ânion formador do SAB, o efeito da razão entre as fases, etc27.
Outros sistemas reportados na tabela 1, são formados com líquidos iônicos
(LIs) ou copolímeros tribloco com sais inorgânicos. Fatores expostos anteriormente,
normalmente também são avaliados na partição de solutos nestes sistemas, mas até o
momento, estes têm sido pouco explorados.
Os sistemas formados com PEO têm sido caraterizados como sistemas de alta
capacidade de particionar os solutos para a fase superior (K>1) com altas
porcentagens de extração (> 90 %). Além disto, estes são mais econômicos que os
sistemas formados com LIs ou copolímeros tribloco. Por outro lado, falando em
termos de facilidade de trabalho, tem-se reportado na literatura que os sistemas
formados por LIs são menos viscosos que os formados com polímeros e copolímeros
facilitando o trabalho no laborátorio, apesar de serem poucos os estudos das
consequências dos LIs sobre o meio ambiente (meios naturais, animais, plantas, etc)
sendo um possivel problema ambiental utilizá-lo em escala industrial.
13
Tabela 1. SABs formados com três componentes e aplicados na partição de solutos biológicos.
SABs Componente 1 Componente 2 Soluto K % R Ref HO[C6mim][Cl]* K2CO3, K2HPO4, K3PO4 chloramphenicol < 6,5 ---- 30
PEO-PPO** K3PO4, NaCl Lysozyme < 7,0 ---- 31
PEO600 KH2PO4
Avidin, Ovomucoid, Lysozyme, Ovotransferrin, Ovalbumin
0,02 >K < 321,0 ---- 32
(NH4)2SO4/CitraNa DNA ---- 91,1 33
PEO3000 K2HPO4 laccases 2,7 96,0 34
PEO1000 Na2CO3 proline dehydrogenase 27,0 ----- 35
K2HPO4 catalase ---- 91,9 36
PEO1500, PEO10000 K2HPO4 alkaline protease <5,0 ---- 37
PEO1450, PEO2000, PEO 3350, PEO4000
K2HPO4/KH2PO4 Bovine serum albumin (BSA) 1,0>K<2,0 ---- 38
PEO600, PEO800 Na2SO4 α-Chymotrypsin, Concanavalin A, Cytochrome c, β-Lactoglobulin B,
β-Lactoglobulin A
0,027 > K< 65,3 ---- 39
PEO4000 (NH4)2SO4 xylanase 5,5 ---- 40
PEO4000, PEO6000, PEO10000
MgSO4 tannery <2,3 ---- 41
PEO8000 Na2SO4 Glucoside, Caffeine, Adenosine <18,8 ---- 42
CitraNa Absidia blakesleeana 14,4 ---- 43
PEO6000 (NH4)2SO4 phenylalanine dehydrogenase ---- 91,6 44
PEO1500, PEO4000 Na2SO4, Li2SO4 glutenin flour <6,18 ---- 45
*cloreto de 1-hidroxilhexil-3-metilimidazolio , ** copolimero de oxido de etileno-oxido de propileno
Outro tipo de sistemas aquosos bifásicos que merece destaque são aqueles
formados por copolímeros, como os copolímeros triblocos, que podem ser aplicados
na extração de solutos hidrofóbicos. Estas macromoléculas têm a capacidade de
formar nanoestruturas com núcleos hidrofóbicos que encapsulan o soluto e o
trasferem de uma fase para outra 46. Porém estes sistemas são caracterizados por
serem muito viscosos, especialmentes em valores de CLA altos. Além disso eles
possuem tempos longos para o processo de segregacão de fases em comparacão com
os sistemas de PEO. Esses pontos tornam-se negativos para a manutenção da
estabilidade e atividade biológica dos solutos de interesse neste trabalho.
Outro inconvenite da maioria dos sistemas utilizados no estudo da partição de
solutos biológicos são a contínua utilização de sais inorgânicos como fosfatos e
sulfatos, o que em escala industrial pode causar diferentes problemas ambientais47.
14
Nesse contexto, uma alternativa para diminuir o impacto ambiental é a utilização de
sais orgânicos tais como citrato de sódio, tartaratro de sódio e succinato de sódio, que
são catalogados como sais econômicos e de baixo impacto sobre o meio ambiente48.
Existem diferentes sistemas formados com sais orgânicos entre os quais os
formados por citrato de sódio e PEO de diferentes massas molares (600, 1500,
2000)33,48, são os mais comuns. No entanto, estes sistemas têm sido pouco aplicados
na partição de solutos biológicos. Um exemplo de aplicação é na extração de
Escherichia Coli. em SAB de PEO1000-CitNa-H2O, em que porcentagens de
extração de 92% tem sido reportadas49. Por outro lado, Gomes e colaboradores
extraíram DNA de Escherichia coli. com sistemas formardos com 4 componentes:
PEO600-CitNa-(NH4)2SO4-H2O33. Nestes experimentos utilizaram dois sais, uma
orgânico e outro inorgânicos com o objetivo de diminuir o impacto ambiental dos
resíduos do processo sem afetar a efetividade na extração do DNA (91,1% de
extração).
As pesquisas até então relatadas demostram que SABs formados por sais
orgânicos podem ser uma alternativa para a extracão de solutos biológicos com altas
porcentagens de recuperacão. Deste modo, é importante propor novos SABs com sais
orgânicos e polímeros de baixo impacto ambiental como o PEO para posteriormente
aplicá-los na extracão e purifação de solutos de interesse indutrial, como a
quimosina.
2.2.3 Aplicação de SABs na extracão de quimosina
Os SABs foram aplicados para a extração de quimosina pela primeira vez no
ano de 2005 por Spelzini et al 50. Nesta pesquisa eles estudaram o efeito da
porcentagem de PEO no sistema para diferentes massas molares do polímero (1450,
15
3350 e 6000), em sistemas do tipo PEO-K2HPO4/KH2PO4-H2O, em pH 7 e 4 oC. Na
metodologia aplicada, os autores determinaram o coeficiente de partição e a
porcentagem de extração utilizando espectroscopia de fluorescência molecular como
técnica de detecção. Os pesquisadores encontraram coeficientes de partição na faixa
de 10 a 20 (81-95% de extração), com um aumento linear do coeficiente de partição
com a porcentagem de PEO no sistema. O comportamento anterior foi atribuído à
interação favorável PEO-quimosina, que provoca a transferência de fase da enzima
para a fase rica na macromolécula. Mas, contrariamente ao esperado, os
pesquisadores reportaram valores de entalpia e entropia positivos calculados a partir
da equação de van’t Hoff, mostrando que o processo é entalpicamente desfavorável e
entropicamente dirigido. Por outro lado, determinaram por meio de dicroísmo
circular que o incremento da massa molecular gera uma maior estabilidade da
enzima na fase superior. Isto foi confirmado por teste de atividade enzimática da
proteína em cada fase.
Um ano depois14, os mesmos pesquisadores reportaram o efeito da massa
molar (1450, 3350, 6000, 8000) e da razão da massa das fases em equilíbrio do
mesmo sistema, mas com uma temperatura de 8 oC. Neste trabalho utilizaram a
mesma metodologia e encontraram que para um mesmo CLA, o incremento da massa
molar de 1450 até 3350 incrementa o coeficiente de partição de 38 até 48 e
posteriormente diminuí com o incremento da massa molar até aproximadamente 30.
Este comportamento foi atribuído à interação favorável PEO-enzima que provoca a
transferência de fase em massas moleculares baixas. No entanto, com o incremento
da massa molar, o efeito de exclusão molecular do polímero na fase superior
aumenta, consequentemente promovendo o aumento da fração de quimosina na fase
inferior. Os pesquisadores encontraram que o aumento da razão da massa entre as
16
fases de 0,2 até 1, aumenta a porcentagem de extração de aproximadamente 85 %
para aproximadamente 96%, sendo este comportamento observado para todas as
massas molares.
Reh et al51 também estudaram o efeito da concentração de NaCl na partição
da quimosina em SABs de PEO (massas molares 1450, 3350 e 6000)-
K2HPO4/KH2PO4-H2O e PEO-Maltodestrina1900 gmol-1-H2O. A metodologia
aplicada foi similar àquela utilizada nos trabalhos de Spelzini 14,50, com a diferença
de utilizar pH 6.5 e uma temperatura de 20 oC. Os resultados demonstraram que na
ausência de NaCl o sistema de fosfato apresentam K entre 0 e 3 para as diferentes
massas molares e para o sistema de maltodestrina um K de aproximadamente 3,5.
Com o incremento da concentração de sal até 8 % (m/m), o K aumentou até 4 e 10
para os sistemas de fosfatos e para 6 no sistema de maltodestrina. Os resultados
foram atribuídos à exposição de zonas da enzima que favorece a interação com os
componentes da fase superior e assim aumenta sua distribuição nessa fase.
Estes trabalhos demostram que são poucas as pesquisas avaliando a partição
da quimosina em SABs e as interações dela com os componentes do sistema.
Portanto, são necessárias pesquisas que avaliem fatores como o efeito da massa
molecular do polímero formador do sistema, natureza dos sais (sais orgânicos,
inorgânicos), pH, efeito do cátion e do ânion formador do SAB para compreender
tais processo. Da mesma forma, determinar parâmetros termodinâmicos de
transferência ( , ) utilizando técnicas diretas, como a calorimetria de
titulação isotérmica (ITC), é fundamental para compreender e otimizar estes
processos.
17
2.3 Termodinâmica de partição de solutos em SABs (ITC)
Atualmente, por meio da análise estrutural de moléculas e um estudo
computacional, é possível determinar que grupos de uma molécula ou
macromolécula apresentem interação molecular em um processo termodinâmico.
Como também é possível determinar valores aproximados de entalpia e entropias de
uma interação. Mas estes procedimentos podem gerar valores com altas porcentagens
de erro e, além disso, requer um tratamento matemático que só pode ser realizado por
computadores 52.
Para determinar a força motriz que provoca um processo termodinâmico, é
necessário analisar o processo de interação em termos energéticos. Para que um
processo termodinâmico (interação intermolecular, transferência de um soluto em um
SABs, etc.) ocorra espontaneamente, a energia livre de Gibbs do processo
deve ser negativa na temperatura de estudo.
No processo de partição de um soluto em um SABs, o potencial químico do
soluto i na fase superior ( é igual ao potencial químico do componente i na fase
inferior , quando o sistema se encontra no equilíbrio termodinâmico, ou seja: (5)
O potencial químico do soluto na fase superior e inferior são expressos pela
equações 6 e 7 respectivamente:
(6) (7)
18
Sendo e o potencial químico padrão do soluto i na fase
superior e inferior respetivamente, a atividade do soluto i em cada uma das
fases, R é a constante dos gases ideais e T a temperatura absoluta do sistema. Ao
igualar as equações 6 e 7, é possível obter a equação 8:
(8)
Nesta equação o termo da esquerda representa a variação da energia livre de Gibbs
de transferência ( ), quando um mol de soluto no sistema bifásico é transferido
da fase inferior para a fase superior do sistema. Como foi mostrado na equação 3, a
razão das atividades do soluto particionado em cada fase é igual á K (equação 9).
(9)
Portanto, conhecendo a constante de partição do soluto em uma temperatura
especifica é possível determinar a . Esta função de estado é dependente i) das
interações intermoleculares no sistema e ii) dos estados configuracionais dos
componentes do sistema.
No processo de transferência da quimosina em um SAB, a variação de
entalpia de transferência, , é uma função de estado que permite conhecer em que
fase encontram-se os componentes com os quais a quimosina apresenta interações
intermoleculares mais favoráveis. A , pode ser determinada por uma
metodologia indireta, utilizando a equação de van’t Hoff (equação 10).
19
(10)
em que e são as constantes de partição do soluto na temperatura T1 e
na temperatura T2, respectivamente, é a constante dos gases ideais. Esta equação
foi desenvolvida a partir da equação fundamental de Gibbs e com a consideração que e não variam com a temperatura.
Spelzini e Reh utilizaram a equação de van’t Hoff para determinação de
na partição da quimosina em SABs 50,51. Mas apesar de sua ampla utilização, esta
metodologia não é precisa, sobretudo em processos onde a temperatura tem uma
influência no resultado 50.
Outra forma de determinar é utilizando a calorimetria de titulação
isotérmica (ITC) que determina diretamente e sem aproximações o valor da variação
de entalpia de interação. Para compreender o funcionamento do calorímetro e que
determina, é necessário demostrar a que é numericamente igual à entalpia em um
processo a pressão constante. Consideremos a equação 11, que é a equação
simplificada da primeira lei da termodinâmica:
(11)
em que , e são a variação infinitesimal da energia interna do sistema, a
energia na forma de calor transferido ou absorvido pelo sistema e o trabalho
realizado pelo ou sobre sistema, respectivamente. Se o sistema estiver restrito a
realizar trabalho de expansão e compressão com pressão constante, tem-se:
(12)
20
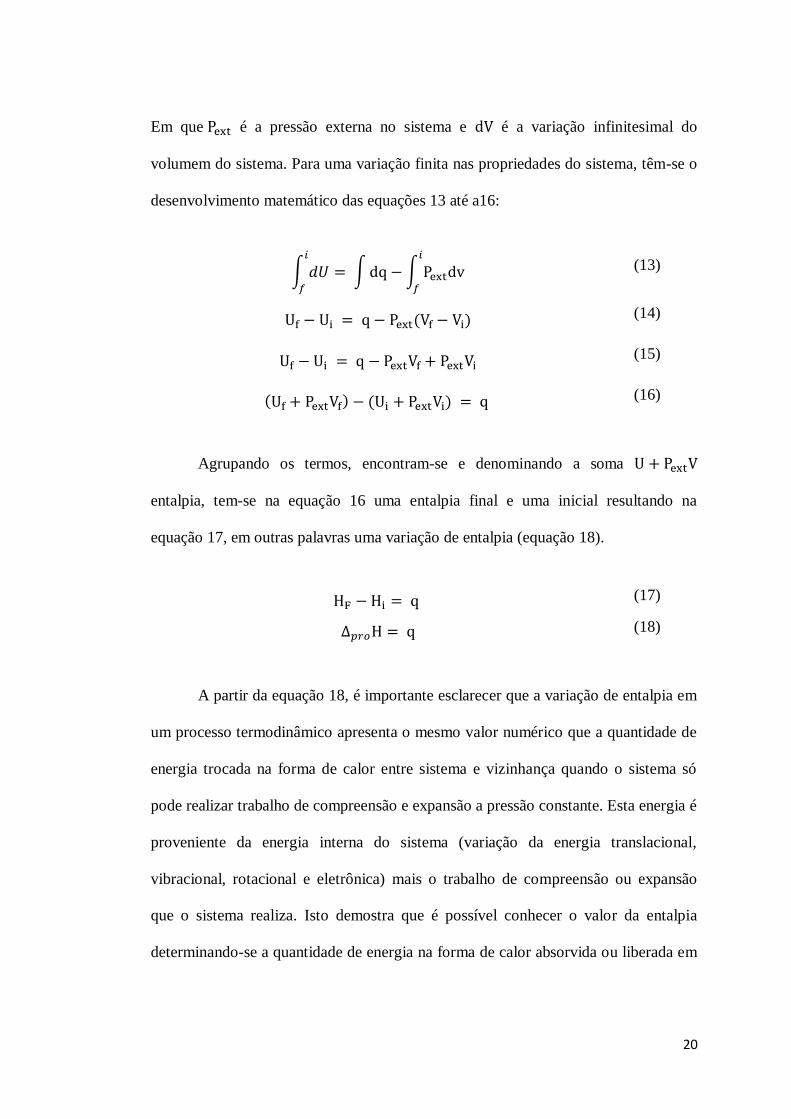
Em que é a pressão externa no sistema e é a variação infinitesimal do
volumem do sistema. Para uma variação finita nas propriedades do sistema, têm-se o
desenvolvimento matemático das equações 13 até a16:
∫ ∫ ∫
(13)
(14)
(15)
(16)
Agrupando os termos, encontram-se e denominando a soma
entalpia, tem-se na equação 16 uma entalpia final e uma inicial resultando na
equação 17, em outras palavras uma variação de entalpia (equação 18).
(17) (18)
A partir da equação 18, é importante esclarecer que a variação de entalpia em
um processo termodinâmico apresenta o mesmo valor numérico que a quantidade de
energia trocada na forma de calor entre sistema e vizinhança quando o sistema só
pode realizar trabalho de compreensão e expansão a pressão constante. Esta energia é
proveniente da energia interna do sistema (variação da energia translacional,
vibracional, rotacional e eletrônica) mais o trabalho de compreensão ou expansão
que o sistema realiza. Isto demostra que é possível conhecer o valor da entalpia
determinando-se a quantidade de energia na forma de calor absorvida ou liberada em
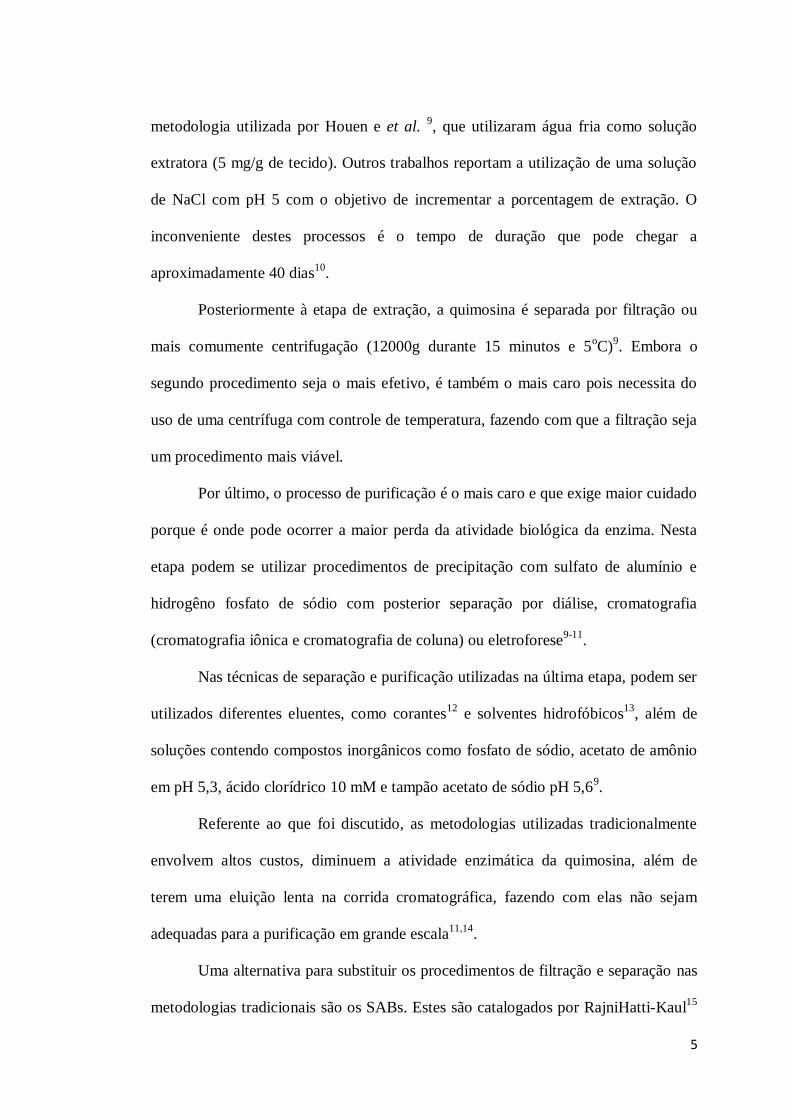
21
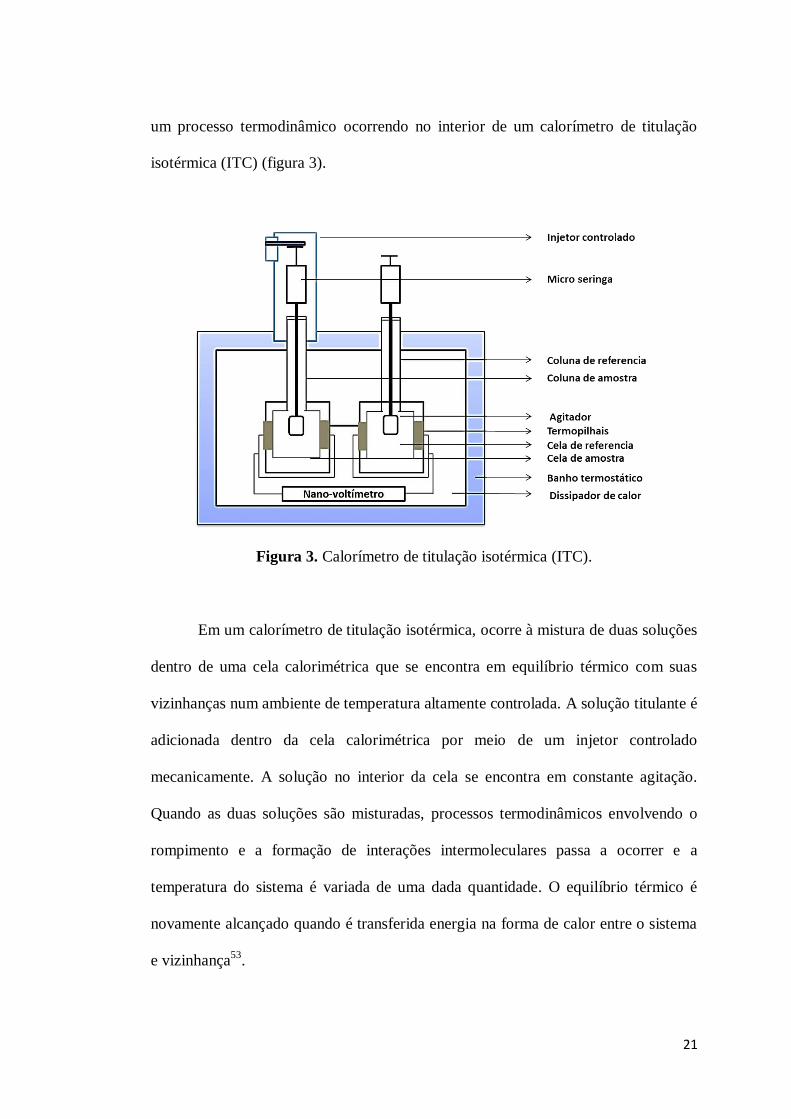
um processo termodinâmico ocorrendo no interior de um calorímetro de titulação
isotérmica (ITC) (figura 3).
Figura 3. Calorímetro de titulação isotérmica (ITC).
Em um calorímetro de titulação isotérmica, ocorre à mistura de duas soluções
dentro de uma cela calorimétrica que se encontra em equilíbrio térmico com suas
vizinhanças num ambiente de temperatura altamente controlada. A solução titulante é
adicionada dentro da cela calorimétrica por meio de um injetor controlado
mecanicamente. A solução no interior da cela se encontra em constante agitação.
Quando as duas soluções são misturadas, processos termodinâmicos envolvendo o
rompimento e a formação de interações intermoleculares passa a ocorrer e a
temperatura do sistema é variada de uma dada quantidade. O equilíbrio térmico é
novamente alcançado quando é transferida energia na forma de calor entre o sistema
e vizinhança53.
22
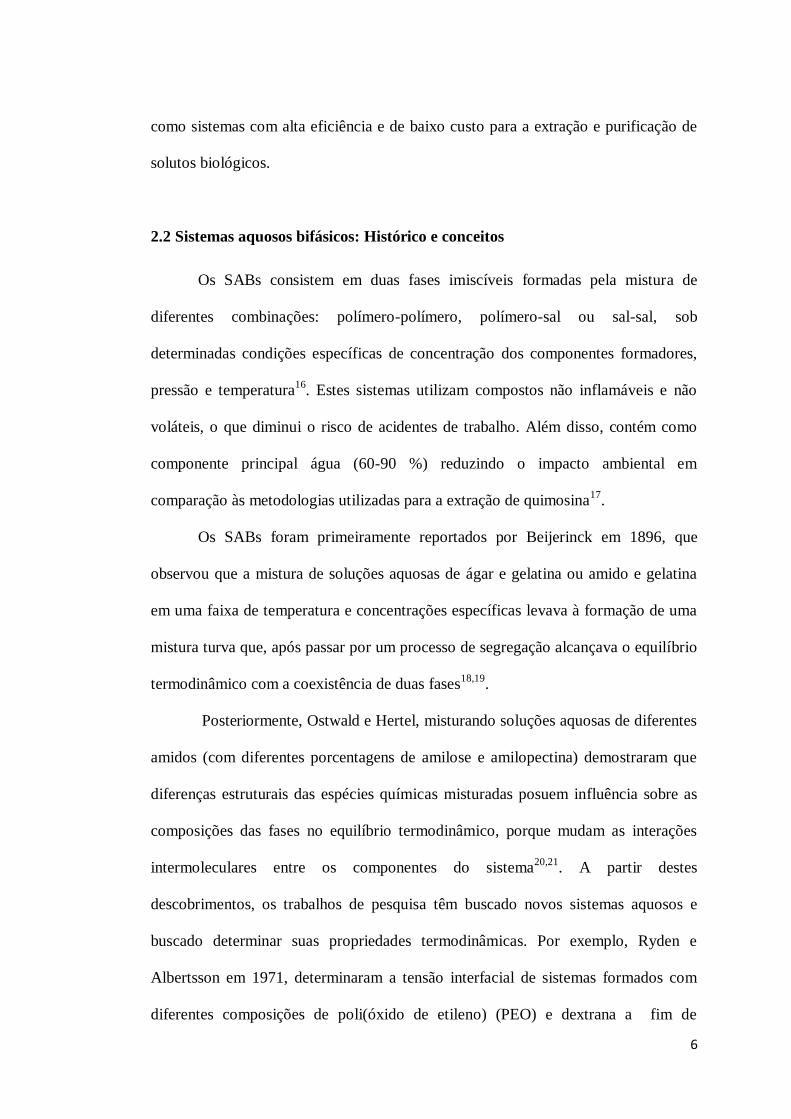
Esta quantidade de energia é detectada por termopilhas localizadas
lateralmente às celas calorimétricas, provocando uma diferença de potencial elétrico
entre seus terminais, permitindo determinar a quantidade de energia na forma de
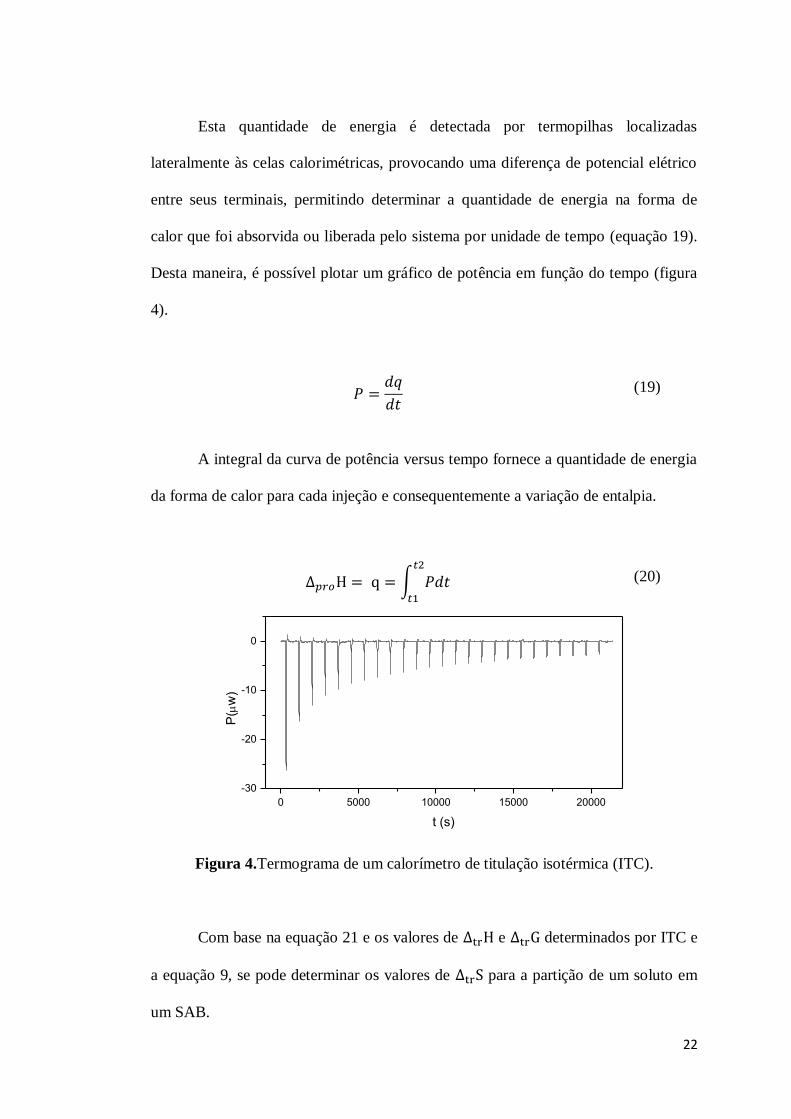
calor que foi absorvida ou liberada pelo sistema por unidade de tempo (equação 19).
Desta maneira, é possível plotar um gráfico de potência em função do tempo (figura
4).
(19)
A integral da curva de potência versus tempo fornece a quantidade de energia
da forma de calor para cada injeção e consequentemente a variação de entalpia.
∫ (20)
0 5000 10000 15000 20000
-30
-20
-10
0
t (s)
P(w
)
Figura 4.Termograma de um calorímetro de titulação isotérmica (ITC).
Com base na equação 21 e os valores de e determinados por ITC e
a equação 9, se pode determinar os valores de para a partição de um soluto em
um SAB.

23
(21)
O termo determinado por ITC é o somatório das diferentes
contribuições entálpicas das interações intermoleculares; quimosina-sal ( , agua-sal ( , quimosina-macromolécula ) e agua –
macromolécula ( ), como expresso na equação 22.
(22)
A partir da determinação de entalpia de diluição ( ) dos componentes
envolvidas nas interações é possível determinar a contribuição de cada termo
( ) sobre a , como descrito a seguir.
2.4. Determinação da entalpia de diluição de solutos ( )
No processo de dissolução de um soluto em um determinado solvente,
energia na forma de calor é absorbida ou liberada no processo. A troca de energia
neste processo à pressão constante é conhecida como entalpia de solução. Portanto, a
entalpia de solução é definida como a variação de entalpia que ocorre quando um
mol de soluto é dissolvido em uma quantidade definida de solvente em uma
temperatura dada. Quando se deseja comparar as energias de interação soluto-
solvente sem ter em conta a quantidade de solvente, o calor de solução é usualmente
definido para uma solução infinitamente diluída. Assim, a entalpia de diluição
infinita é a energia na forma de calor liberada ou absorbia pelo sistema
quando um mol de soluto é dissolvido em uma grande quantidade de solvente.
24
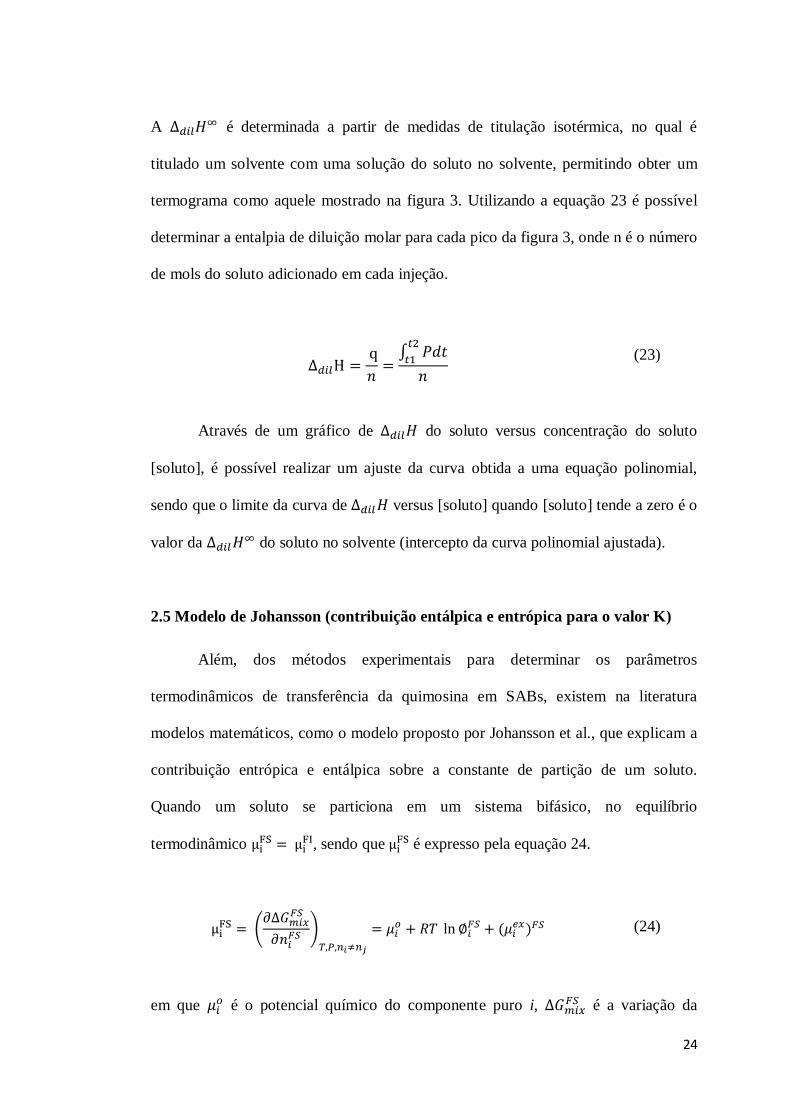
A é determinada a partir de medidas de titulação isotérmica, no qual é
titulado um solvente com uma solução do soluto no solvente, permitindo obter um
termograma como aquele mostrado na figura 3. Utilizando a equação 23 é possível
determinar a entalpia de diluição molar para cada pico da figura 3, onde n é o número
de mols do soluto adicionado em cada injeção.
∫ (23)
Através de um gráfico de do soluto versus concentração do soluto
[soluto], é possível realizar um ajuste da curva obtida a uma equação polinomial,
sendo que o limite da curva de versus [soluto] quando [soluto] tende a zero é o
valor da do soluto no solvente (intercepto da curva polinomial ajustada).
2.5 Modelo de Johansson (contribuição entálpica e entrópica para o valor K)
Além, dos métodos experimentais para determinar os parâmetros
termodinâmicos de transferência da quimosina em SABs, existem na literatura
modelos matemáticos, como o modelo proposto por Johansson et al., que explicam a
contribuição entrópica e entálpica sobre a constante de partição de um soluto.
Quando um soluto se particiona em um sistema bifásico, no equilíbrio
termodinâmico , sendo que é expresso pela equação 24.
(24)
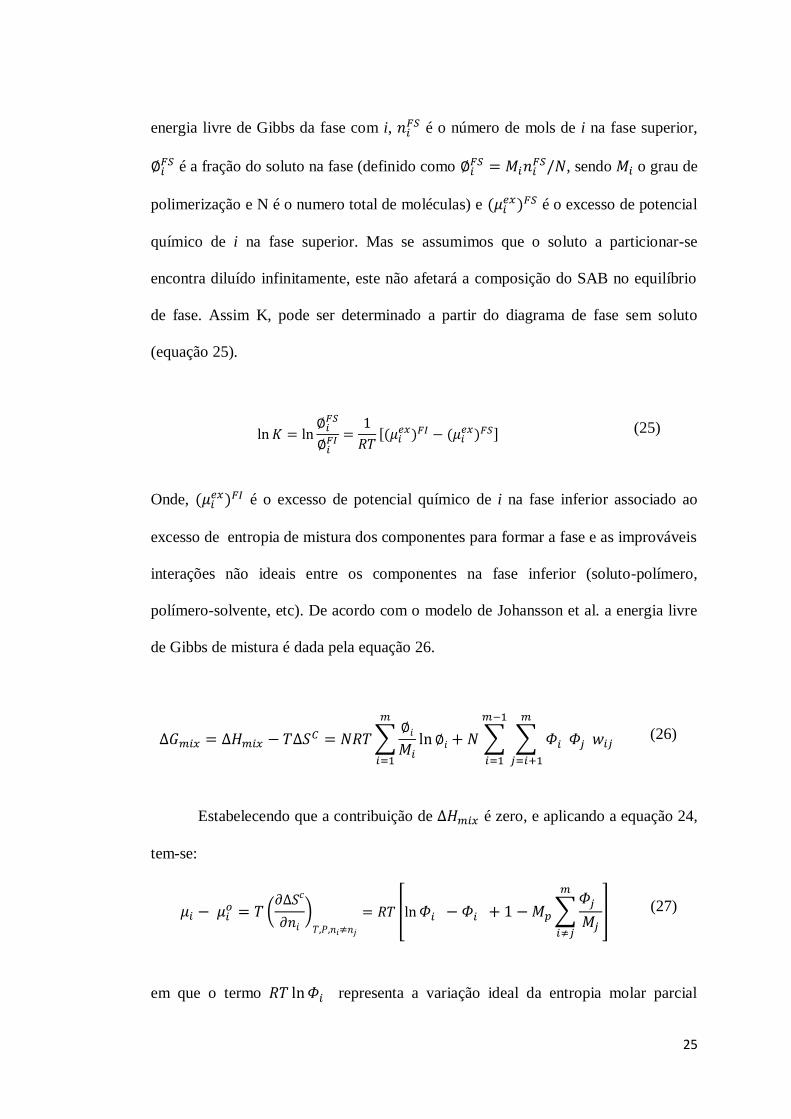
em que é o potencial químico do componente puro i, é a variação da
25
energia livre de Gibbs da fase com i, é o número de mols de i na fase superior, é a fração do soluto na fase (definido como , sendo o grau de
polimerização e N é o numero total de moléculas) e é o excesso de potencial
químico de i na fase superior. Mas se assumimos que o soluto a particionar-se
encontra diluído infinitamente, este não afetará a composição do SAB no equilíbrio
de fase. Assim K, pode ser determinado a partir do diagrama de fase sem soluto
(equação 25).
(25)
Onde, é o excesso de potencial químico de i na fase inferior associado ao
excesso de entropia de mistura dos componentes para formar a fase e as improváveis
interações não ideais entre os componentes na fase inferior (soluto-polímero,
polímero-solvente, etc). De acordo com o modelo de Johansson et al. a energia livre
de Gibbs de mistura é dada pela equação 26.
∑
∑ ∑
(26)
Estabelecendo que a contribuição de é zero, e aplicando a equação 24,
tem-se:
( ) ∑ (27)
em que o termo representa a variação ideal da entropia molar parcial
26
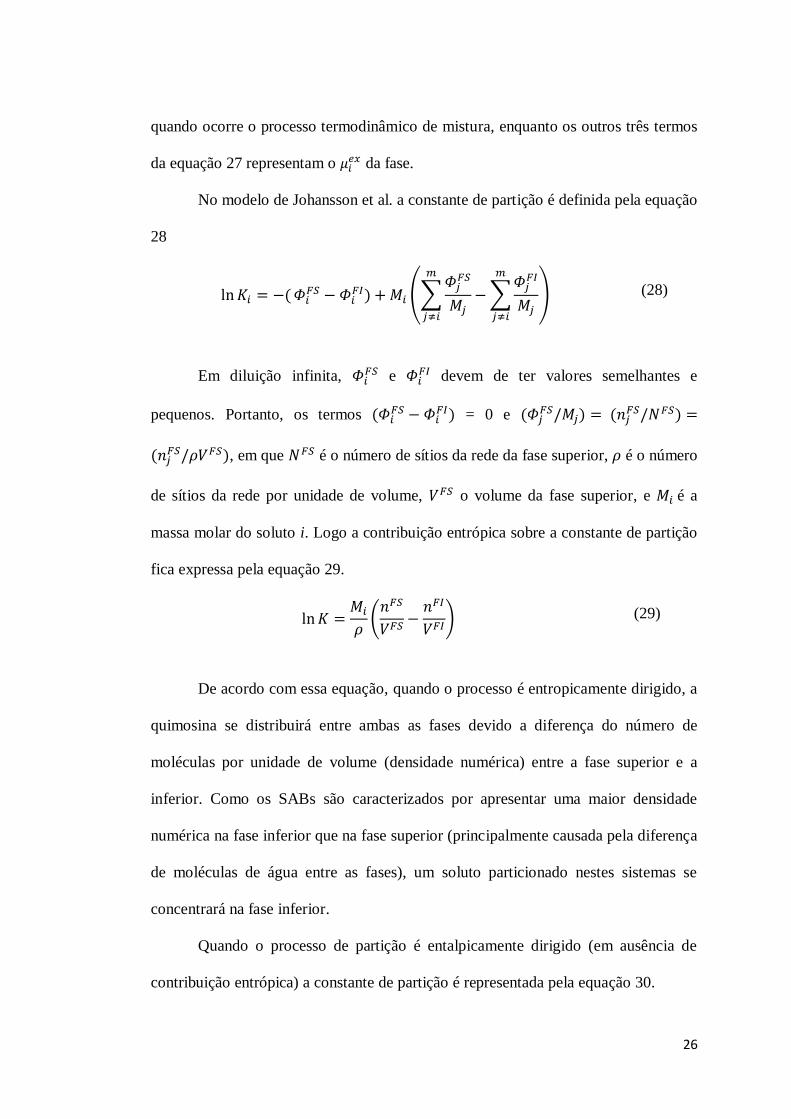
quando ocorre o processo termodinâmico de mistura, enquanto os outros três termos
da equação 27 representam o da fase.
No modelo de Johansson et al. a constante de partição é definida pela equação
28
∑ ∑
(28)
Em diluição infinita, e devem de ter valores semelhantes e
pequenos. Portanto, os termos = 0 e , em que é o número de sítios da rede da fase superior, é o número
de sítios da rede por unidade de volume, o volume da fase superior, e é a
massa molar do soluto i. Logo a contribuição entrópica sobre a constante de partição
fica expressa pela equação 29.
(29)
De acordo com essa equação, quando o processo é entropicamente dirigido, a
quimosina se distribuirá entre ambas as fases devido a diferença do número de
moléculas por unidade de volume (densidade numérica) entre a fase superior e a
inferior. Como os SABs são caracterizados por apresentar uma maior densidade
numérica na fase inferior que na fase superior (principalmente causada pela diferença
de moléculas de água entre as fases), um soluto particionado nestes sistemas se
concentrará na fase inferior.
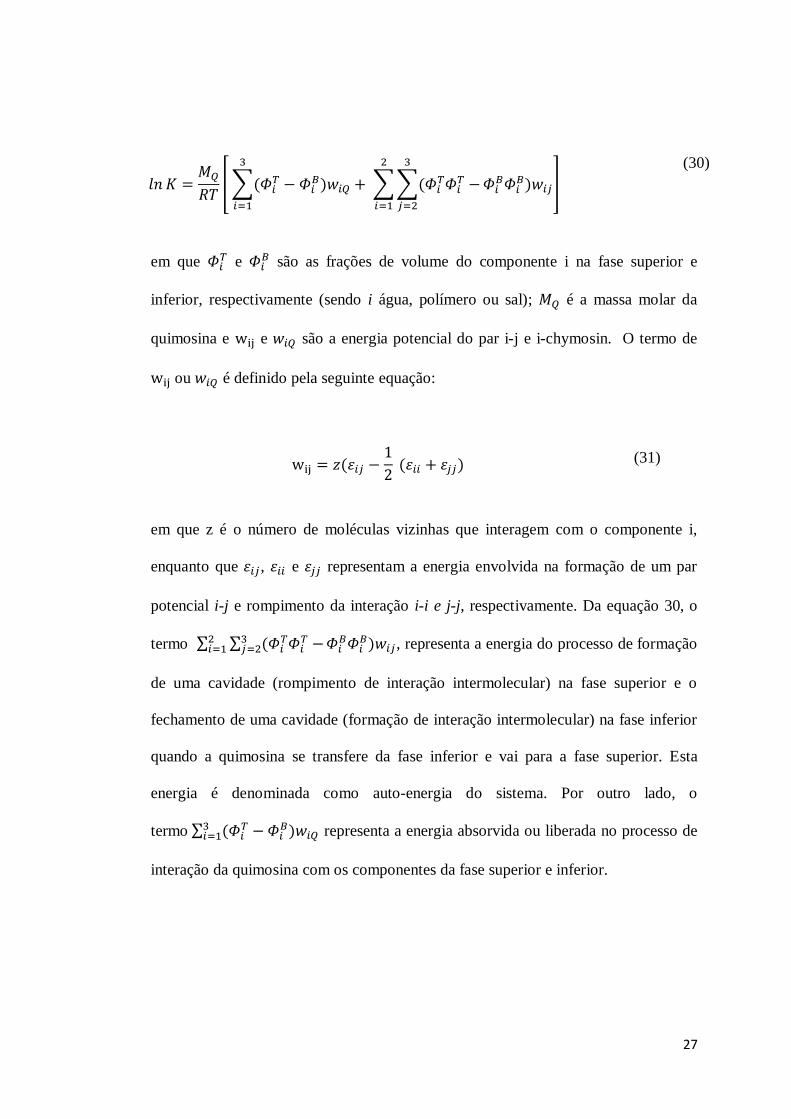
Quando o processo de partição é entalpicamente dirigido (em ausência de
contribuição entrópica) a constante de partição é representada pela equação 30.
27
∑ ∑∑
(30)
em que e são as frações de volume do componente i na fase superior e
inferior, respectivamente (sendo i água, polímero ou sal); é a massa molar da
quimosina e e são a energia potencial do par i-j e i-chymosin. O termo de ou é definido pela seguinte equação:
(31)
em que z é o número de moléculas vizinhas que interagem com o componente i,
enquanto que , e representam a energia envolvida na formação de um par
potencial i-j e rompimento da interação i-i e j-j, respectivamente. Da equação 30, o
termo ∑ ∑ , representa a energia do processo de formação
de uma cavidade (rompimento de interação intermolecular) na fase superior e o
fechamento de uma cavidade (formação de interação intermolecular) na fase inferior
quando a quimosina se transfere da fase inferior e vai para a fase superior. Esta
energia é denominada como auto-energia do sistema. Por outro lado, o
termo ∑ representa a energia absorvida ou liberada no processo de
interação da quimosina com os componentes da fase superior e inferior.
28
3. Considerações finais do capítulo 1
Neste capitulo, fez-se uma revisão de literatura abordando aspectos da formação dos
SABs, a sua aplicação na extração e purificação de solutos biológicos e de diferentes
modelos e aproximações que tentam explicar as variações dos parâmetros
termodinâmicos de transferência de solutos nos SABs. Este resumo de literatura
cientifica nesta área de pesquisa mostrou que existem poucas pesquisas focadas em
determinar os parâmetros termodinâmicos de transferência. Assim, os capítulos
posteriores fornecem a obtenção de novos SABs macromolécula + sal orgânica +
agua para aplicação na determinação dos parâmetros termodinâmicos de
transferência da enzima quimosina. Esta é uma questão estratégica no sentido de
podermos modular as propriedades físico-químicas dos SABs pra otimizá-los como
sistemas de extração de solutos biológicos.
29
4. Referências
1. Frerix, A.; Schönewald, M.; Geilenkirchen, P.; Müller, M.; Kula, M. R.;
Hubbuch, J. Langmuir 2006, 22.
2. Palmer, D. S.; Christensen, A. U.; Sørensen, J.; Celik, L.; Qvist, K. B.; Schiøtt,
B. Biochemistry. 2010, 49, 2563-2573.
3. Narita, Y.; Oda, S. I.; Moriyama, A.; Kageyama, T. Arch. Biochem. Biophys.
2002, 404, 177-185.
4. Kulaguin-Chicaroux, A.; Zeiner, T. Fluid Phase Equilibr. 2014, 362, 1-10.
5. Callebaut, I.; Schoentgen, F.; Prat, K.; Mornon, J. P.; Jollés, P. Biochim.
Biophys. Acta 2005, 1749, 75.
6. Hsieh, J. F.; Pan, P. H. J. Agric. Food Chem. 2012, 60, 2039-2045.
7. Chitpinityol, S.; Crabbe, M. J. C. Food Chem. 1998, 61, 395-418.
8. Rampilli, M.; Larsen, R.; Harboe, M. Int. Dairy. J. 2005, 15, 1130-1137.
9. Houen, G.; Madsen, M. T.; W., H. K.; Foltmann, P. B. Int. J. Biochem. Cell
Bid. 1996, 28, 667-675.
10. Abdel, M. C. A.; Abou, I. F. G.; Vukashinovic, V.; Zalunin, I. A.; Timokhina,
E. A.; Lavrenova, G. I.; Stepanov, V. M. Comp. Biochem. Physiol. 1996, 113B,
57-62.
11. Burton, S. C.; Haggarty, N. W.; Harding, D. R. K. Biotechnol. Bioeng. 1997,
56, 45-55.
12. Strop, P.; Sedlacek, J.; Stys, J.; Kaderabkova, Z.; Blaha, I.; Pavlickova, L.; J.,
P. Biochemistry. 1990, 29, 9863-9871.
13. Voutsinas, L. P.; Nakai, S. J. Dairy. Sci. 1983, 66, 694-703.
14. Spelzini, D.; Picó, G.; Farruggia, B. Colloid. Surface. B. 2006, 51, 80-85.
15. Zafarani-Moattar, M. T.; Hamzehzadeh, S. J. Chem. Eng. Data 2007, 52, 1686-
1692.
16. Freire, M. G.; Claudio, A. F.; Araujo, J. M.; Coutinho, J. A.; Marrucho, I. M.;
Canongia Lopes, J. N.; Rebelo, L. P. Chem. Soc. Rev. 2012, 41, 4966-4995.
17. da Silva, L. H. M.; Loh, W. Quim. Nova 2006, 29, 1345-1351.
18. Beijerinck, M. W. Zbl. Bakt. II Natur. 1896, 627, 698.
19. Beijerinck, M. W. Kolloid Z. Z. Polym. 1910, 7, 16.
20. Ostwald, W.; Hertel, R. H. Kolloid Z. Z. Polym. 1929, 47, 258.
30
21. Ostwald, W.; Hertel, R. H. Kolloid Z. Z. Polym. 1929, 47, 357.
22. Ryden, J.; Albertsson, P. A. J. Colloid Interface Sci. 1971, 37, 219.
23. Mageste, A. B.; Rodrigues, L.; Ferreira, G. M.; da Silva, M. C. H.; da Silva, L.
H. M.; Ferreira, R. C.; Minim, L. A. J. Chromatogr. A 2009, 1216, 7623-7629.
24. da Silva, T. L. Equilíbrio líquido-líquido de sistemas aquosos constituídos por
copolímero tribloco e sal em diferentes temperaturas. Universidade Federal de
Viçosa, Viçosa, MG-Brazil, 2009.
25. Oliveira, R. L. L. Termodinâmica de partição do corante natural carmim de
cochonilha em diferentes sistemas aquosos bifásicos. Universidade Federal de
Viçosa, Viçosa, MG-Brasil, 2010.
26. Waziri, S. M.; Abu-Sharkh, B. F.; Ali, S. A. Biotechnol. Prog. 2004, 20, 526.
27. Asenjo, J. A.; Andrews, B. A. J. Chromatogr. A 2011, 1218, 8826-8835.
28. Rito-Palomares, M. J. Chromatogr. B. 2004, 807, 3-11.
29. da Silva, M. C. H.; da Silva, L. H. M.; Paggioli, J. F.; Coimbra, J. S. R.;
Minim, L. A. Quim. Nova, 2006, 29, 1332-1339.
30. Liu, C.; Ren, C. J. Chem. Eng. Data 2009, 54, 3296–3299.
31. Govindarajan, R.; Perumalsamy, M. J. Chem. Eng. Data. 2013, 58, 2952-2958.
32. de Andrade, V. M.; Rodrigues, G. D.; de Carvalho, R. M. M.; da Silva, L. H.
M.; da Silva, M. C. H. Chem. Eng. J. 2011, 171, 9-15.
33. Gomes, G. A.; Azevedo, A. M.; Aires-Barros, M. R.; Prazeres, D. M. F. Sep.
Purif. Technol. 2009, 65, 22-30.
34. de Lemos, L. R.; Patrício, P. R.; Rodrigues, G. D.; de Carvalho, R. M. M.; da
Silva, M. C. H.; da Silva, L. H. M. Fluid Phase Equilibr. 2011, 305, 19-24.
35. Martins, J. P.; Coimbra, J. S. R.; de Oliveira, F. C.; Sanaiotti, G.; da Silva, C.
A. S.; da Silva, L. H. M.; da Silva, M. C. H. J. Chem. Eng. Data 2010, 55,
1247–1251.
36. Rodrigues, G. D.; da Silva, M. C. H.; da Silva, L. H. M.; Teixeira, L. S.; de
Andrade, V. M. J. Chem. Eng. Data 2009, 54, 1894–1898.
37. Patrício, P. R.; Mageste, A. B.; de Lemos, L. R.; de Carvalho, R. M. M.; da
Silva, L. H. M.; da Silva, M. C. H. Fluid Phase Equilibr. 2011, 305, 1-8.
38. Martins, J. P.; Mageste, A. B.; da Silva, M. C. H.; da Silva, L. H. M.; Patrício,
P. R.; Coimbra, J. S. R.; Minim, L. A. J. Chem. Eng. Data 2009, 54, 2891–
2894.
31
39. Rodrigues, G. D.; da Silva, L. T.; Ferreira, G. M. D.; da Silva, M. C. H.; da
Silva, L. H. M.; de Carvalho, R. M. M. J. Chem. Eng. Data 2010, 55, 1158-
1165.
40. Othmer, D. F.; Tobias, P. E. Ind. Eng. Chem. 1942, 34, 693-696.
41. Saravanan, S.; Rao, J. R.; Murugesan, T.; Nair, B. U.; Ramasami, T. Chem.
Eng. Sci. 2007, 62, 969-978.
42. Santos, I. J. B.; de Carvalho, R. M. M.; da Silva, M. C. H.; da Silva, L. H. M.
J. Chem. Eng. Data 2012, 57, 274-279.
43. Neves, M. L. C.; Porto, T. S.; Souza-Motta, C. M.; Spier, M. R.; Soccol, C. R.;
Moreira, K. A.; Porto, A. L. F. Fluid. Phase. Equilibr. 2012, 318, 34-39.
44. Mohamadia, H. S.; Omidiniab, E. J. Chromatogr. B 2007, 854, 273-278.
45. Barberino, I. S.; Coimbra, J. S.; Martins, J. P.; da Silva, L. H. M.; Ferreira, R.
C.; Pirozzi, M. R.; Cinquini, A. J. Cereal. Sci. 2010, 52, 270-274.
46. da Silva, L. H. M.; da Silva, M. C. H.; Júnior, J. A.; Martins, J. P.; Reis
Coimbra, J. S.; Minim, L. A. Sep. Purif. Technol. 2008, 60, 103-112.
47. Regupathi, I.; Srikanth, C. K.; Sindhu, N. J. Chem. Eng. Data. 2011, 56, 3643-
3650.
48. Patrício, P. R.; Mageste, A. B.; de Lemos, L. R.; de Carvalho, R. M. M.; da
Silva, L. H. M.; da Silva, M. C. H. Fluid. Phase. Equilibr. 2011, 305, 1-8.
49. Callebaut, I.; Schoentgen, F.; Prat, K.; Mornon, J. P.; Jolles, P. Biochim
Biophys Acta 2005, 1749, 75-80.
50. Spelzini, D.; Farruggia, B.; Pico, G. J Chromatogr B Analyt Technol Biomed
Life Sci 2005, 821, 60-66.
51. Reh, G.; Spelzini, D.; Tubío, G.; Picó, G.; B., F. J. Chromatogr. B. 2007, 860
98-105.
52. Reh, G.; Spelzini, D.; Tubio, G.; Pico, G.; Farruggia, B. J Chromatogr B
Analyt Technol Biomed Life Sci 2007, 860, 98-105.
53. Freire, E.; Mayorga, O. L.; Straume, M. Anal. Chem. 1990, 62, 949-959.
32
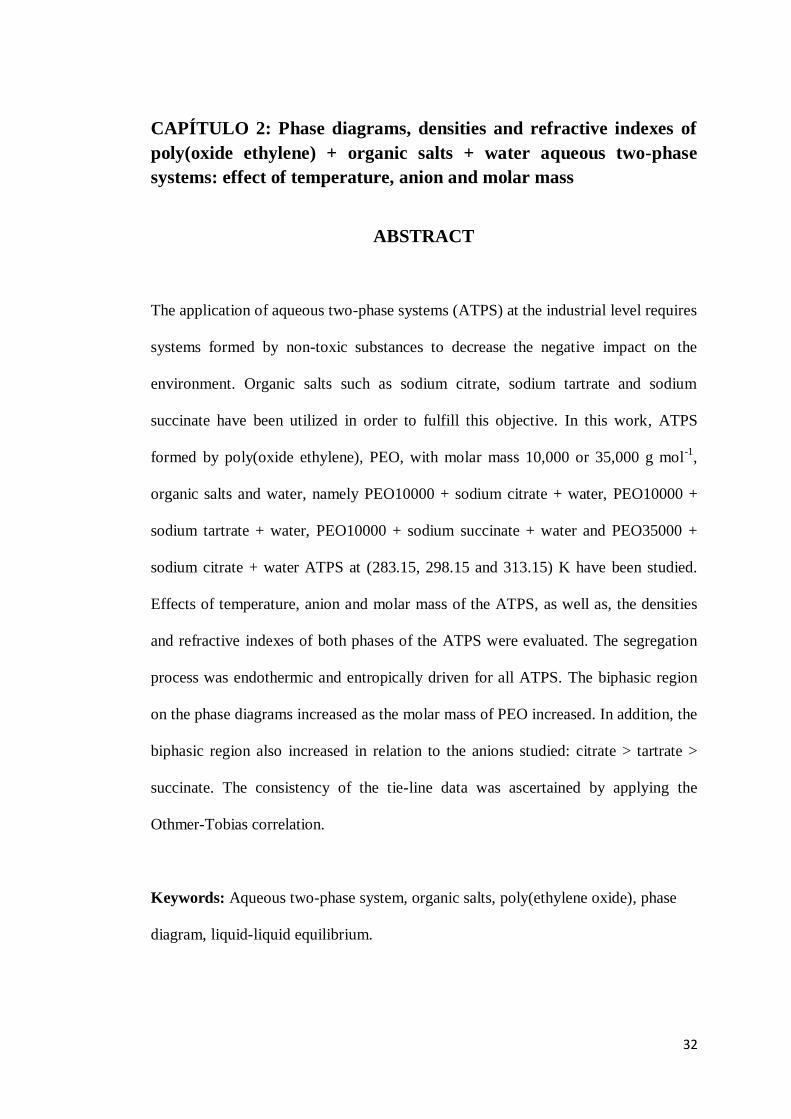
CAPÍTULO 2: Phase diagrams, densities and refractive indexes of poly(oxide ethylene) + organic salts + water aqueous two-phase systems: effect of temperature, anion and molar mass
ABSTRACT
The application of aqueous two-phase systems (ATPS) at the industrial level requires
systems formed by non-toxic substances to decrease the negative impact on the
environment. Organic salts such as sodium citrate, sodium tartrate and sodium
succinate have been utilized in order to fulfill this objective. In this work, ATPS
formed by poly(oxide ethylene), PEO, with molar mass 10,000 or 35,000 g mol-1,
organic salts and water, namely PEO10000 + sodium citrate + water, PEO10000 +
sodium tartrate + water, PEO10000 + sodium succinate + water and PEO35000 +
sodium citrate + water ATPS at (283.15, 298.15 and 313.15) K have been studied.
Effects of temperature, anion and molar mass of the ATPS, as well as, the densities
and refractive indexes of both phases of the ATPS were evaluated. The segregation
process was endothermic and entropically driven for all ATPS. The biphasic region
on the phase diagrams increased as the molar mass of PEO increased. In addition, the
biphasic region also increased in relation to the anions studied: citrate > tartrate >
succinate. The consistency of the tie-line data was ascertained by applying the
Othmer-Tobias correlation.
Keywords: Aqueous two-phase system, organic salts, poly(ethylene oxide), phase
diagram, liquid-liquid equilibrium.

33
1. Introduction
Aqueous two-phase system (ATPS) have been used for the extraction,
separation and purification of biological solutes such as proteins [1], enzymes [2],
amino acids [3], antibiotics [4], nucleic acids [5], ions [6-9] and nanomaterials [10],
as well as, of organic molecules [11-13].
ATPS can be formed by mixing water, in high concentration, 55 - 90 %
(m/m), with two structurally different polymers [14], or a polymer and an electrolyte
[15,16], or two electrolytes [17], under specific thermodynamic conditions. Some of
the important characteristics of ATPS include low cost and toxicity, low value of
interfacial tension, and high water content, which allow for a friendly environment in
which solutes can be separated and purified [1, 18].
The transfer of the solute from one phase to the other phase, in the ATPS,
depends strongly on the components within the system, as well as, of the intensive
thermodynamic properties of the two phases in equilibrium [19] In this sense,
modulating these thermodynamic properties is fundamental in order to obtain the
best conditions for the purification of solutes and the creation of news ATPS.
ATPS formed with polymer (or copolymer) and inorganic salt have been
reported in the literature since these components are inexpensive, highly soluble in
water, nonflammable and nonvolatile [20-22]. Nevertheless, continuous application
of inorganic salts, mainly phosphate and sulfate salts, in industrial processes can lead
to several environmental problems. In view of decreasing the negative impact on the
environment and increasing the application of ATPS at the industrial level, organic
salts such as sodium citrate, sodium tartrate and sodium succinate have been
employed [15, 16, 21, 23-25]. These systems have allowed the study of the effect of
34
hydrophobicity on the partitioning of different solutes in ATPS formed with organic
salts. However, to our best knowledge, there is no research in literature that describes
phase diagrams of ATPS composed of poly(ethylene oxide), PEO, with a high molar
mass of 10,000 or 35,000 g mol-1 (PEO10000 or PEO35000).
In this work, the phase equilibrium data for PEO10000 + organic salts +
water and PEO35000 + sodium citrate + water ATPS were obtained at different
temperatures (283.15, 298.15, 313.15) K. The anion effect on the binodal curve was
evaluated using the electrolytes sodium citrate, sodium tartrate and sodium succinate.
Densities and refractive index for both phases of the ATPS also were obtained.
2. Materials and Methods
2.1 Materials
Poly(ethylene oxide), PEO, molar mass 10000 g mol−1 and 35000 g mol−1
were obtained from Aldrich (USA). Sodium tartrate (Na2C4H4O6·2H2O), sodium
succinate (Na2C4H4O4·6H2O) and sodium citrate (Na3C6H5O7·2H2O) were purchased
from Vetec (Brazil). Milli-Q water (Millipore, USA) was used to prepare all ATPS.
2.2 Preparation of ATPS
Stock solutions of polymer and salt were prepared using an analytical balance
(Shimadzu, AG 220 with an uncertainty of ±0.0001 g). Appropriate amount of these
stock solutions were weighed in glass vessels, and were vigorously stirred. The
systems became turbid and were allowed to settle for (24–72) h at (283.15, 298.15 or
313.15) K in a temperature controlled bath (Microquimica, MQBTC 99-20, with an
uncertainty of ±0.1 K). When the systems reached the thermodynamic equilibrium,
35
aliquot of the top phase (TP) and of the bottom phase (BP) were collected with a
syringe for quantification of the components of the system.
2.3 Construction of phase diagrams
The polymer concentration was measured by refractive index (Analytic Jena
AG Abbe, model 09-2011, Germany, with a resolution ± 0.0001) and the salt
concentration was obtained by conductimetry (Schott CG853, Mainz, Germany, with
an uncertainty of ±0.01). Each phase of the ATPS was appropriately diluted with
water and the measurements were performed at 298.15 K. Salt solutions showed the
same conductivity in water or diluted polymer solutions and the salt concentration
was determined in the range of 1.00 10−3 to 2.50 10−2 % (m/m).
The polymer concentration was determined by subtracting the salt
concentration, wsalt, from the total concentration (salt concentration plus polymer
concentration), wtotal, (equation 1). wtotal was determinate by total refractive index.
(1)
Equation 1 can be used because the validity of the principle of refractive
index addition was confirmed within the interval of concentration studied. Standard
curves of refractive index versus polymer composition (or salt composition) in
aqueous medium were obtained and the refractive index of an aqueous mixture
containing “X” % (m/m) of polymer and “Y” % (m/m) of salt was equal to the
refractive index of a “X” % (m/m) polymer solution (in the absence of salt) plus the
refractive index of a “Y” % (m/m) salt solution (in the absence of polymer) [26],
with X and Y varying between 0.0 and 6.0 % (m/m).
36
For the determination of water, 1.000 ± 0.100 g of each phase of ATPS was
transferred into 2 mL glass vials and allowed to dry at 70 ºC until the mass of the
system was constant. Then, mass percentage of water was calculated by equation 2.
(2)
In this equation, is the mass of phase and is the phase mass after
drying.
For each phase, in all ATPS, mass balances were determined by sum of
concentrations of salt, polymer and water with values in the range of 98-101 %
(m/m).
2.4 Density and Refractive Index Measurements
Density measurements were realized for each phase of the ATPS using a
density meter (Anton Par, model DMA 5000M, Austria) with an uncertainty of ±
0.001 kg·m−3. The density meter was calibrated with the surrounding air and water.
Refractive indexes for each phase were carried out using the refractometer. All
measurements were repeated at least three times with no appreciable variation and
the temperature was thermostatically controlled at 298.15 K.
3. Results and Discussion
Formation of the ATPS depends on the molecular interactions among the
components of the system (salt, polymer and water) and can be expressed in terms of
Gibbs free energy of the mixture ( . When two or more components are
37
mixed, negative or positive values can be obtained leading to the formation of
homogeneous or two phases systems. Phase diagrams can be used to determine the
concentrations of polymer, salt and water that are necessary to obtain positive,
negative or zero values of , by referring to the concentrations of the
components of system on the binodal curve [27]. When , a segregation
process between polymer molecules and salt ions occurs and leads to the formation
of a top phase and a bottom phase that are enriched with polymer and salt,
respectively [28]. The phase diagram also provides the tie-line length (TLL). The tie-
line connects the composition of the top phase to the composition of the bottom
phase when the two phases are in thermodynamic equilibrium.
The tie-line length numerically expresses the difference of intensive
thermodynamic proprieties between both phases in equilibrium, at a constant
pressure and temperature, and is calculated using equation 3 [29].
[( ) ]
(3)
In this equation, TPC and B
PC are the polymer concentrations in the TP and
BP, respectively, and TSC and B
SC are salt concentrations in the TP and BP,
respectively. The concentrations are mass percentages.
The experimental liquid-liquid equilibrium data for PEO 10000 + sodium
citrate + water, PEO10000 + sodium tartrate + water, PEO10000 + sodium succinate
+ water and PEO35000 + sodium citrate + water obtained at (283.15, 298.15, 313.15)
K are show in tables 1 through 4. Concentrations are reported when the system is in
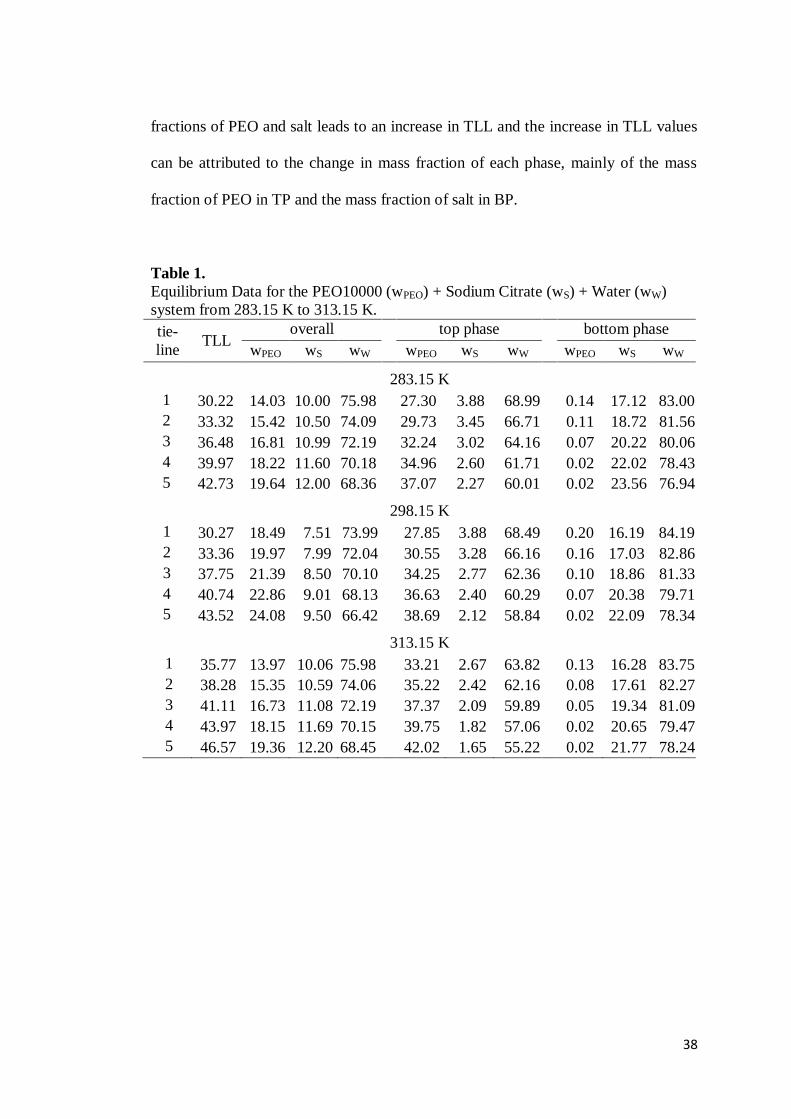
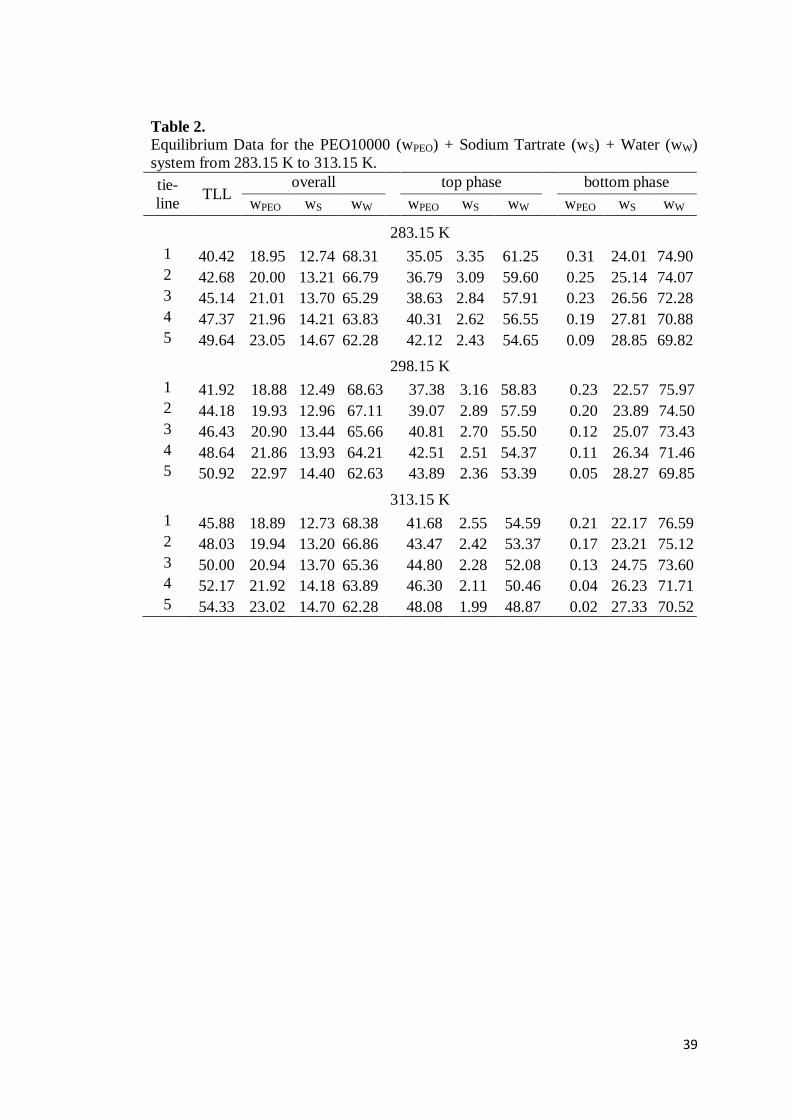
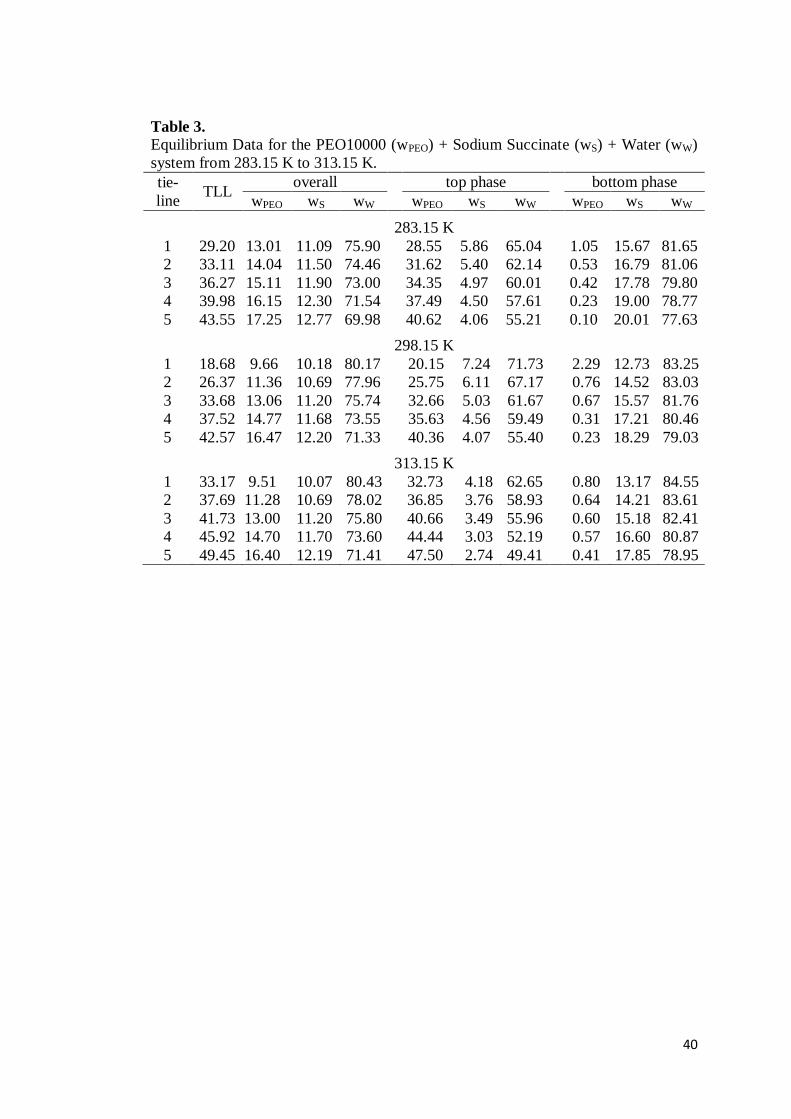
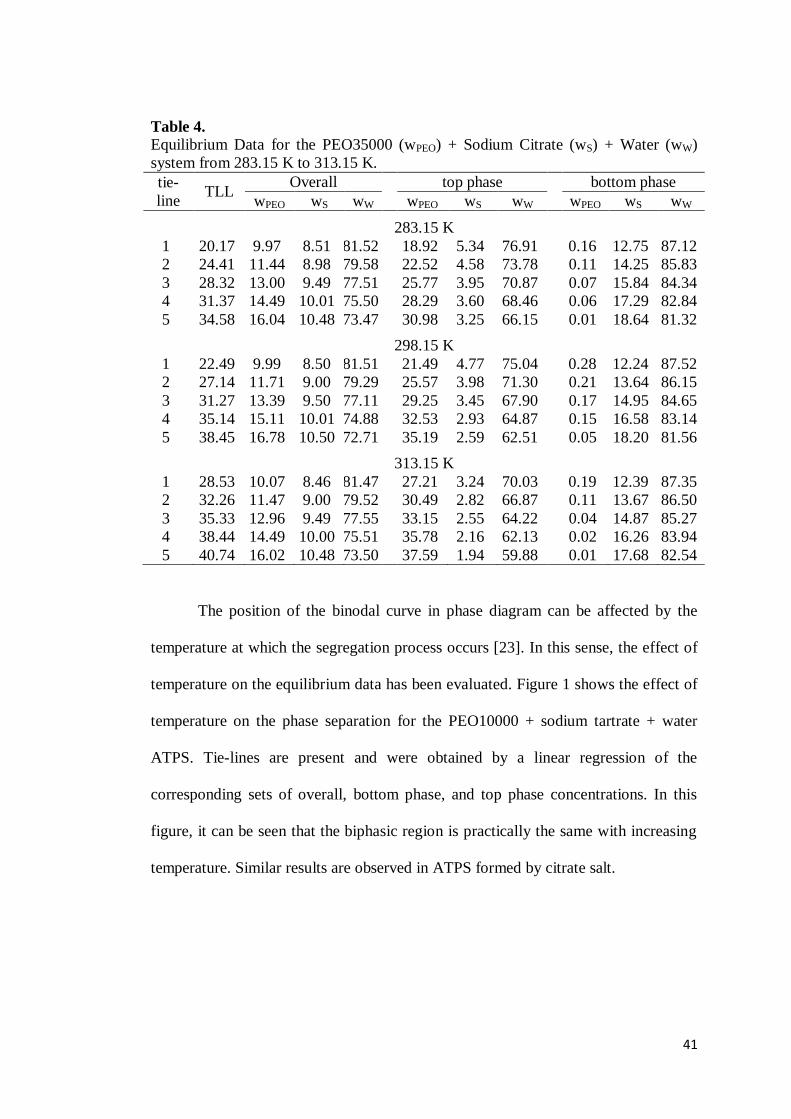
thermodynamic equilibrium condition. For all ATPS, an increase in the global mass
38
fractions of PEO and salt leads to an increase in TLL and the increase in TLL values
can be attributed to the change in mass fraction of each phase, mainly of the mass
fraction of PEO in TP and the mass fraction of salt in BP.
Table 1. Equilibrium Data for the PEO10000 (wPEO) + Sodium Citrate (wS) + Water (wW) system from 283.15 K to 313.15 K. tie-line
TLL overall top phase bottom phase
wPEO wS wW wPEO wS wW wPEO wS wW
283.15 K 1 30.22 14.03 10.00 75.98 27.30 3.88 68.99 0.14 17.12 83.00 2 33.32 15.42 10.50 74.09 29.73 3.45 66.71 0.11 18.72 81.56 3 36.48 16.81 10.99 72.19 32.24 3.02 64.16 0.07 20.22 80.06 4 39.97 18.22 11.60 70.18 34.96 2.60 61.71 0.02 22.02 78.43 5 42.73 19.64 12.00 68.36 37.07 2.27 60.01 0.02 23.56 76.94
298.15 K 1 30.27 18.49 7.51 73.99 27.85 3.88 68.49 0.20 16.19 84.19 2 33.36 19.97 7.99 72.04 30.55 3.28 66.16 0.16 17.03 82.86 3 37.75 21.39 8.50 70.10 34.25 2.77 62.36 0.10 18.86 81.33 4 40.74 22.86 9.01 68.13 36.63 2.40 60.29 0.07 20.38 79.71 5 43.52 24.08 9.50 66.42 38.69 2.12 58.84 0.02 22.09 78.34
313.15 K 1 35.77 13.97 10.06 75.98 33.21 2.67 63.82 0.13 16.28 83.75 2 38.28 15.35 10.59 74.06 35.22 2.42 62.16 0.08 17.61 82.27 3 41.11 16.73 11.08 72.19 37.37 2.09 59.89 0.05 19.34 81.09 4 43.97 18.15 11.69 70.15 39.75 1.82 57.06 0.02 20.65 79.47 5 46.57 19.36 12.20 68.45 42.02 1.65 55.22 0.02 21.77 78.24
39
Table 2. Equilibrium Data for the PEO10000 (wPEO) + Sodium Tartrate (wS) + Water (wW) system from 283.15 K to 313.15 K. tie-line
TLL overall top phase bottom phase
wPEO wS wW wPEO wS wW wPEO wS wW
283.15 K 1 40.42 18.95 12.74 68.31 35.05 3.35 61.25 0.31 24.01 74.90 2 42.68 20.00 13.21 66.79 36.79 3.09 59.60 0.25 25.14 74.07 3 45.14 21.01 13.70 65.29 38.63 2.84 57.91 0.23 26.56 72.28 4 47.37 21.96 14.21 63.83 40.31 2.62 56.55 0.19 27.81 70.88 5 49.64 23.05 14.67 62.28 42.12 2.43 54.65 0.09 28.85 69.82
298.15 K 1 41.92 18.88 12.49 68.63 37.38 3.16 58.83 0.23 22.57 75.97 2 44.18 19.93 12.96 67.11 39.07 2.89 57.59 0.20 23.89 74.50 3 46.43 20.90 13.44 65.66 40.81 2.70 55.50 0.12 25.07 73.43 4 48.64 21.86 13.93 64.21 42.51 2.51 54.37 0.11 26.34 71.46 5 50.92 22.97 14.40 62.63 43.89 2.36 53.39 0.05 28.27 69.85
313.15 K 1 45.88 18.89 12.73 68.38 41.68 2.55 54.59 0.21 22.17 76.59 2 48.03 19.94 13.20 66.86 43.47 2.42 53.37 0.17 23.21 75.12 3 50.00 20.94 13.70 65.36 44.80 2.28 52.08 0.13 24.75 73.60 4 52.17 21.92 14.18 63.89 46.30 2.11 50.46 0.04 26.23 71.71 5 54.33 23.02 14.70 62.28 48.08 1.99 48.87 0.02 27.33 70.52
40
Table 3. Equilibrium Data for the PEO10000 (wPEO) + Sodium Succinate (wS) + Water (wW) system from 283.15 K to 313.15 K. tie-line
TLL overall top phase bottom phase
wPEO wS wW wPEO wS wW wPEO wS wW
283.15 K 1 29.20 13.01 11.09 75.90 28.55 5.86 65.04 1.05 15.67 81.65 2 33.11 14.04 11.50 74.46 31.62 5.40 62.14 0.53 16.79 81.06 3 36.27 15.11 11.90 73.00 34.35 4.97 60.01 0.42 17.78 79.80 4 39.98 16.15 12.30 71.54 37.49 4.50 57.61 0.23 19.00 78.77 5 43.55 17.25 12.77 69.98 40.62 4.06 55.21 0.10 20.01 77.63
298.15 K 1 18.68 9.66 10.18 80.17 20.15 7.24 71.73 2.29 12.73 83.25 2 26.37 11.36 10.69 77.96 25.75 6.11 67.17 0.76 14.52 83.03 3 33.68 13.06 11.20 75.74 32.66 5.03 61.67 0.67 15.57 81.76 4 37.52 14.77 11.68 73.55 35.63 4.56 59.49 0.31 17.21 80.46 5 42.57 16.47 12.20 71.33 40.36 4.07 55.40 0.23 18.29 79.03
313.15 K 1 33.17 9.51 10.07 80.43 32.73 4.18 62.65 0.80 13.17 84.55 2 37.69 11.28 10.69 78.02 36.85 3.76 58.93 0.64 14.21 83.61 3 41.73 13.00 11.20 75.80 40.66 3.49 55.96 0.60 15.18 82.41 4 45.92 14.70 11.70 73.60 44.44 3.03 52.19 0.57 16.60 80.87 5 49.45 16.40 12.19 71.41 47.50 2.74 49.41 0.41 17.85 78.95
41
Table 4. Equilibrium Data for the PEO35000 (wPEO) + Sodium Citrate (wS) + Water (wW) system from 283.15 K to 313.15 K. tie-line
TLL Overall top phase bottom phase
wPEO wS wW wPEO wS wW wPEO wS wW
283.15 K 1 20.17 9.97 8.51 81.52 18.92 5.34 76.91 0.16 12.75 87.12 2 24.41 11.44 8.98 79.58 22.52 4.58 73.78 0.11 14.25 85.83 3 28.32 13.00 9.49 77.51 25.77 3.95 70.87 0.07 15.84 84.34 4 31.37 14.49 10.01 75.50 28.29 3.60 68.46 0.06 17.29 82.84 5 34.58 16.04 10.48 73.47 30.98 3.25 66.15 0.01 18.64 81.32
298.15 K 1 22.49 9.99 8.50 81.51 21.49 4.77 75.04 0.28 12.24 87.52 2 27.14 11.71 9.00 79.29 25.57 3.98 71.30 0.21 13.64 86.15 3 31.27 13.39 9.50 77.11 29.25 3.45 67.90 0.17 14.95 84.65 4 35.14 15.11 10.01 74.88 32.53 2.93 64.87 0.15 16.58 83.14 5 38.45 16.78 10.50 72.71 35.19 2.59 62.51 0.05 18.20 81.56
313.15 K 1 28.53 10.07 8.46 81.47 27.21 3.24 70.03 0.19 12.39 87.35 2 32.26 11.47 9.00 79.52 30.49 2.82 66.87 0.11 13.67 86.50 3 35.33 12.96 9.49 77.55 33.15 2.55 64.22 0.04 14.87 85.27 4 38.44 14.49 10.00 75.51 35.78 2.16 62.13 0.02 16.26 83.94 5 40.74 16.02 10.48 73.50 37.59 1.94 59.88 0.01 17.68 82.54
The position of the binodal curve in phase diagram can be affected by the
temperature at which the segregation process occurs [23]. In this sense, the effect of
temperature on the equilibrium data has been evaluated. Figure 1 shows the effect of
temperature on the phase separation for the PEO10000 + sodium tartrate + water
ATPS. Tie-lines are present and were obtained by a linear regression of the
corresponding sets of overall, bottom phase, and top phase concentrations. In this
figure, it can be seen that the biphasic region is practically the same with increasing
temperature. Similar results are observed in ATPS formed by citrate salt.
42
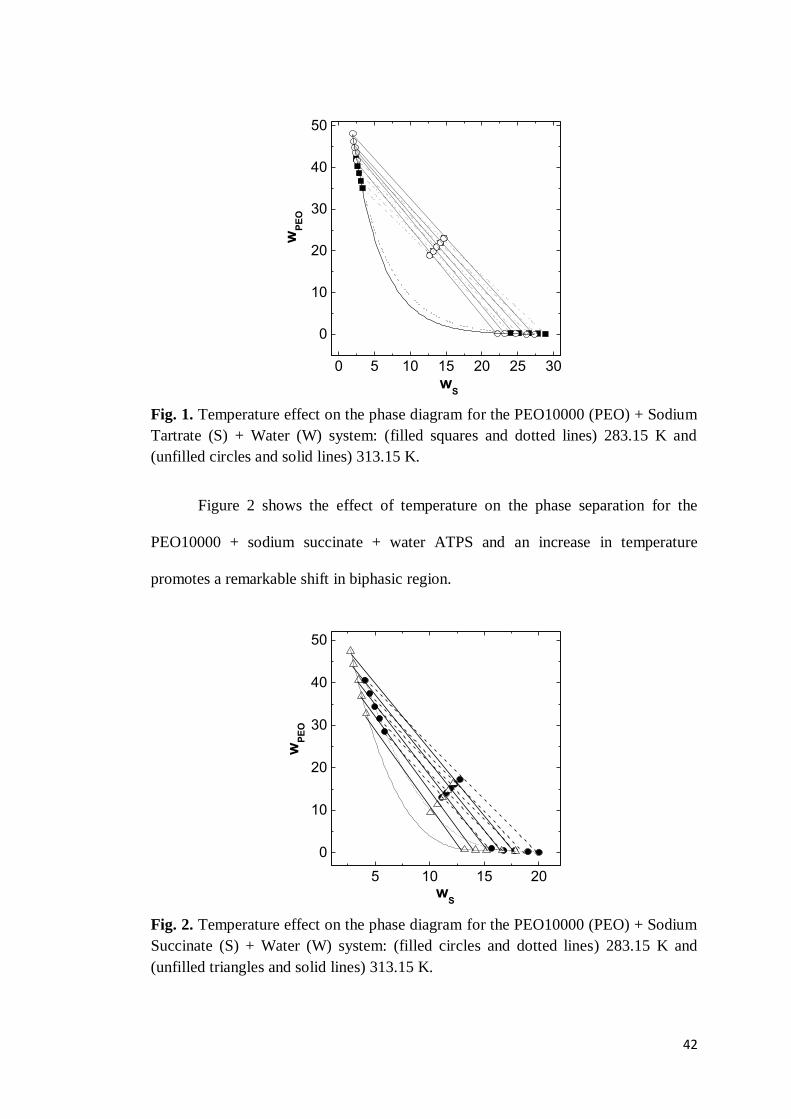
Fig. 1. Temperature effect on the phase diagram for the PEO10000 (PEO) + Sodium Tartrate (S) + Water (W) system: (filled squares and dotted lines) 283.15 K and (unfilled circles and solid lines) 313.15 K.
Figure 2 shows the effect of temperature on the phase separation for the
PEO10000 + sodium succinate + water ATPS and an increase in temperature
promotes a remarkable shift in biphasic region.
Fig. 2. Temperature effect on the phase diagram for the PEO10000 (PEO) + Sodium Succinate (S) + Water (W) system: (filled circles and dotted lines) 283.15 K and (unfilled triangles and solid lines) 313.15 K.
0 5 10 15 20 25 30
0
10
20
30
40
50
wP
EO
wS
5 10 15 20
0
10
20
30
40
50
wP
EO
wS
43
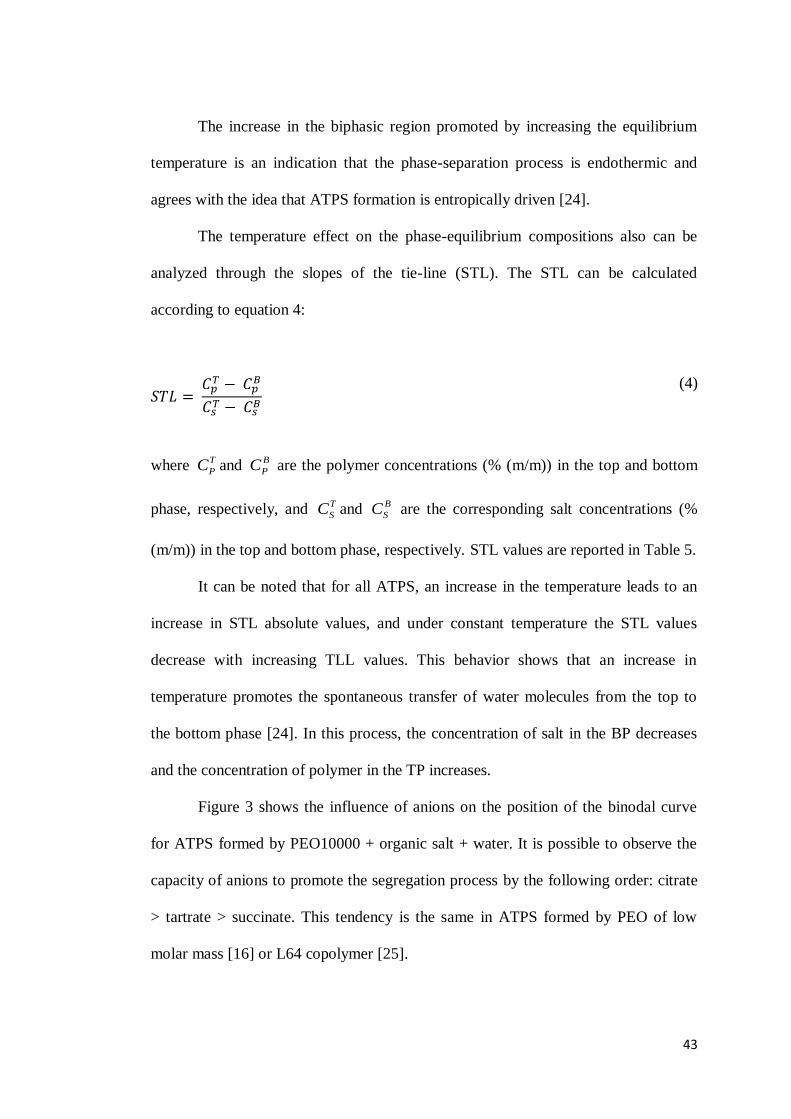
The increase in the biphasic region promoted by increasing the equilibrium
temperature is an indication that the phase-separation process is endothermic and
agrees with the idea that ATPS formation is entropically driven [24].
The temperature effect on the phase-equilibrium compositions also can be
analyzed through the slopes of the tie-line (STL). The STL can be calculated
according to equation 4:
(4)
where TPC and B
PC are the polymer concentrations (% (m/m)) in the top and bottom
phase, respectively, and TSC and BSC are the corresponding salt concentrations (%
(m/m)) in the top and bottom phase, respectively. STL values are reported in Table 5.
It can be noted that for all ATPS, an increase in the temperature leads to an
increase in STL absolute values, and under constant temperature the STL values
decrease with increasing TLL values. This behavior shows that an increase in
temperature promotes the spontaneous transfer of water molecules from the top to
the bottom phase [24]. In this process, the concentration of salt in the BP decreases
and the concentration of polymer in the TP increases.
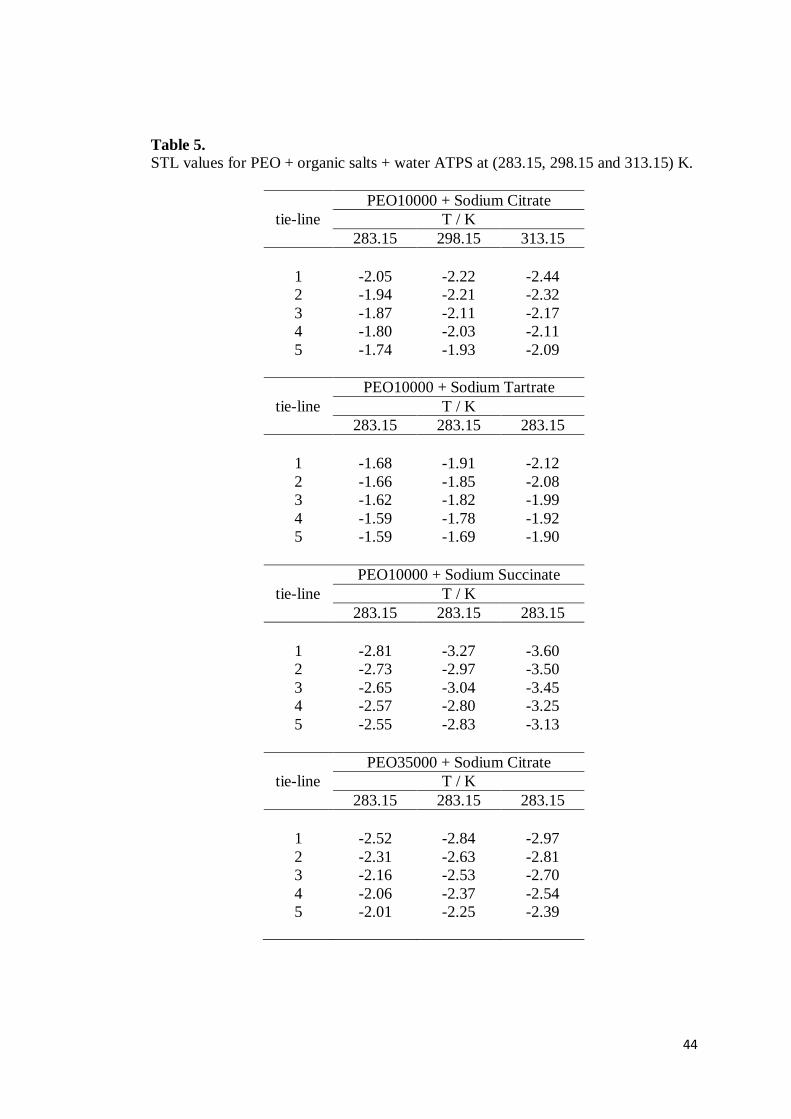
Figure 3 shows the influence of anions on the position of the binodal curve
for ATPS formed by PEO10000 + organic salt + water. It is possible to observe the
capacity of anions to promote the segregation process by the following order: citrate
> tartrate > succinate. This tendency is the same in ATPS formed by PEO of low
molar mass [16] or L64 copolymer [25].
44
Table 5. STL values for PEO + organic salts + water ATPS at (283.15, 298.15 and 313.15) K.
tie-line PEO10000 + Sodium Citrate
T / K 283.15 298.15 313.15
1 -2.05 -2.22 -2.44 2 -1.94 -2.21 -2.32 3 -1.87 -2.11 -2.17 4 -1.80 -2.03 -2.11 5 -1.74 -1.93 -2.09
tie-line PEO10000 + Sodium Tartrate
T / K 283.15 283.15 283.15
1 -1.68 -1.91 -2.12 2 -1.66 -1.85 -2.08 3 -1.62 -1.82 -1.99 4 -1.59 -1.78 -1.92 5 -1.59 -1.69 -1.90
tie-line PEO10000 + Sodium Succinate
T / K 283.15 283.15 283.15
1 -2.81 -3.27 -3.60 2 -2.73 -2.97 -3.50 3 -2.65 -3.04 -3.45 4 -2.57 -2.80 -3.25 5 -2.55 -2.83 -3.13
tie-line PEO35000 + Sodium Citrate
T / K 283.15 283.15 283.15
1 -2.52 -2.84 -2.97 2 -2.31 -2.63 -2.81 3 -2.16 -2.53 -2.70 4 -2.06 -2.37 -2.54 5 -2.01 -2.25 -2.39
45
This result can be interpreted based on a model proposed by da Silva and Loh
[30] which suggest that the ATPS formation process is based on the interaction and
formation of electrolyte-polymer binding. First, when the salt and polymer solutions
are mixed, the ions interact with the polymer, causing dessolvation of the molecular
chain of the polymer and entropy increase of system. Second, the interaction of the
ions and polymer continues until it reaches a saturation point from which there is no
increase entropy and the phase separation is favored.
Fig. 3. Influence of anion on phase diagram for PEO10000 (PEO) + Salt (S) + Water (W) systems, at 298.15 K: (○) Citrate; (▲) Succinate and (■) Tartrate.
According to this model, as the salt-PEO interaction becomes more intense,
the salt can more effectively induce phase separation. Based on this phenomenon, the
interaction between PEO and the succinate anion is weaker than tartrate anion and,
the citrate anion provides the strongest interaction. This is due to the higher negative
charge of the citrate anion, as well as the greater number of carboxylic groups in its
molecular structure making the formation of a hydrogen bond possible [16]. The
biphasic region using the succinate anion is smaller than the tartrate anion and the
0 5 10 15 20 25 30
0
10
20
30
40
wP
EO
wS
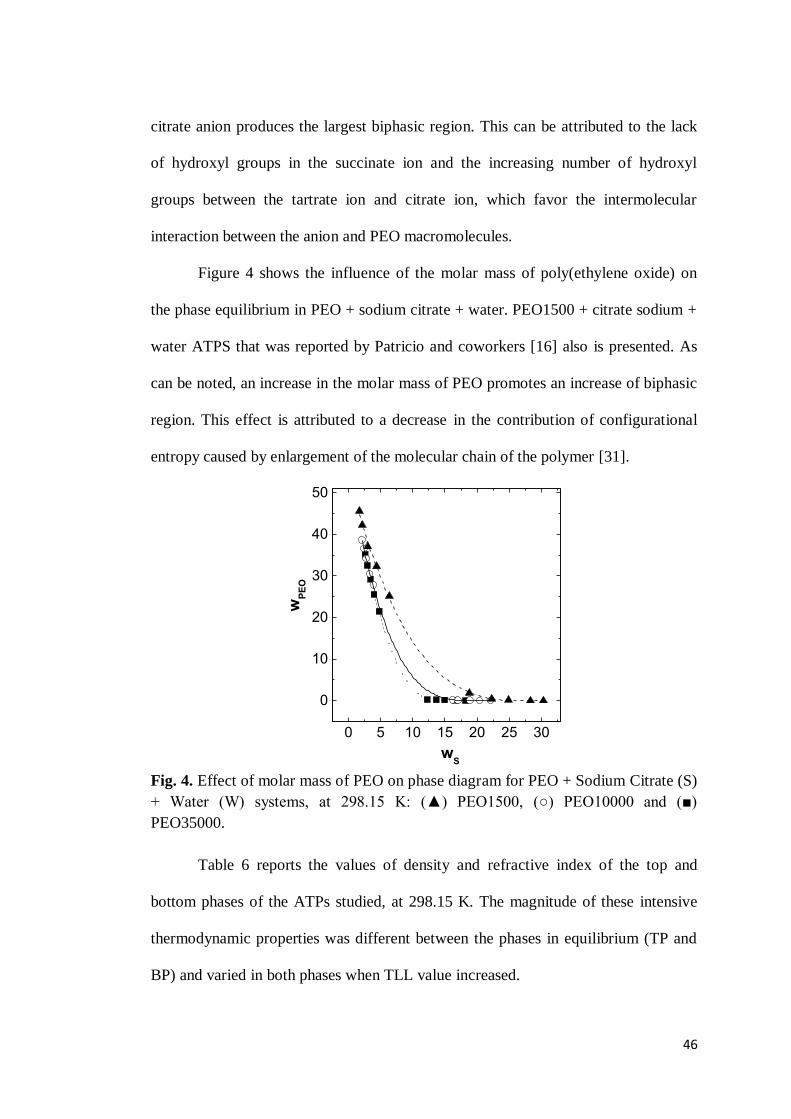
46
citrate anion produces the largest biphasic region. This can be attributed to the lack
of hydroxyl groups in the succinate ion and the increasing number of hydroxyl
groups between the tartrate ion and citrate ion, which favor the intermolecular
interaction between the anion and PEO macromolecules.
Figure 4 shows the influence of the molar mass of poly(ethylene oxide) on
the phase equilibrium in PEO + sodium citrate + water. PEO1500 + citrate sodium +
water ATPS that was reported by Patricio and coworkers [16] also is presented. As
can be noted, an increase in the molar mass of PEO promotes an increase of biphasic
region. This effect is attributed to a decrease in the contribution of configurational
entropy caused by enlargement of the molecular chain of the polymer [31].
Fig. 4. Effect of molar mass of PEO on phase diagram for PEO + Sodium Citrate (S) + Water (W) systems, at 298.15 K: (▲) PEO1500, (○) PEO10000 and (■) PEO35000.
Table 6 reports the values of density and refractive index of the top and
bottom phases of the ATPs studied, at 298.15 K. The magnitude of these intensive
thermodynamic properties was different between the phases in equilibrium (TP and
BP) and varied in both phases when TLL value increased.
0 5 10 15 20 25 30
0
10
20
30
40
50
wP
EO
wS
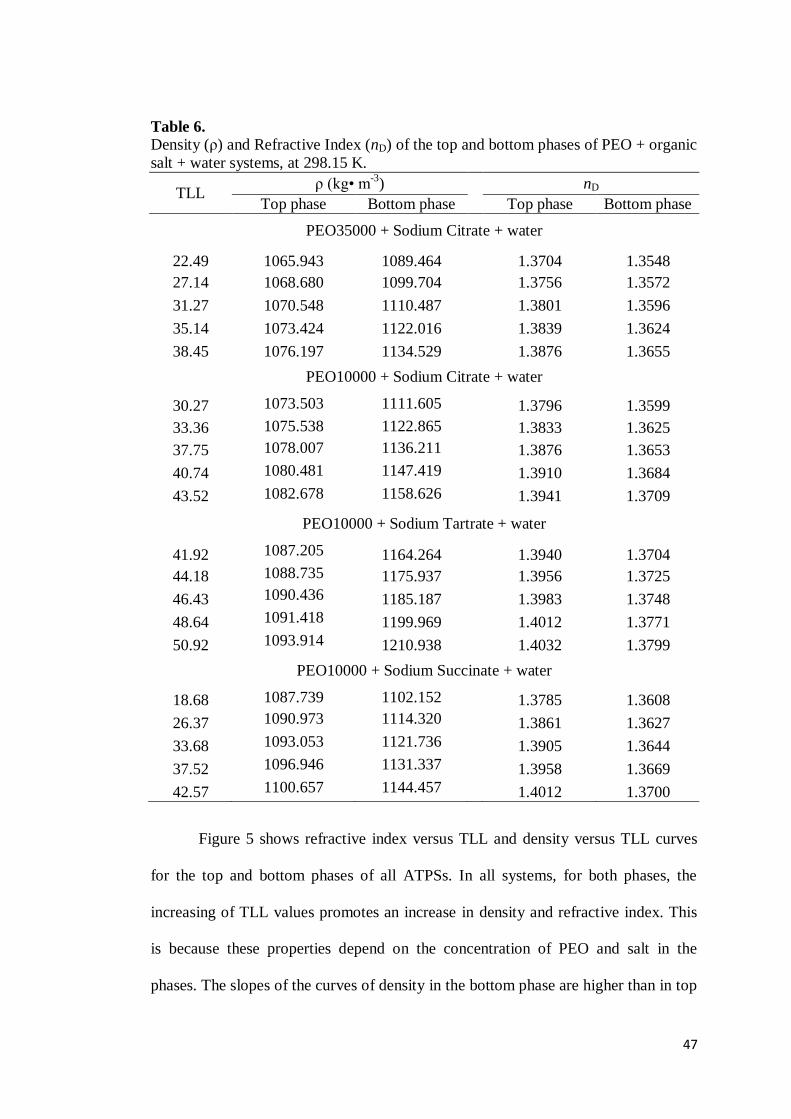
47
Table 6. Density (ρ) and Refractive Index (nD) of the top and bottom phases of PEO + organic salt + water systems, at 298.15 K.
TLL ρ (kg• m-3)
nD
Top phase Bottom phase Top phase Bottom phase
PEO35000 + Sodium Citrate + water
22.49 1065.943 1089.464 1.3704 1.3548 27.14 1068.680 1099.704 1.3756 1.3572
31.27 1070.548 1110.487 1.3801 1.3596
35.14 1073.424 1122.016 1.3839 1.3624
38.45 1076.197 1134.529 1.3876 1.3655
PEO10000 + Sodium Citrate + water
30.27 1073.503 1111.605 1.3796 1.3599 33.36 1075.538 1122.865 1.3833 1.3625
37.75 1078.007 1136.211 1.3876 1.3653
40.74 1080.481 1147.419 1.3910 1.3684
43.52 1082.678 1158.626 1.3941 1.3709
PEO10000 + Sodium Tartrate + water
41.92 1087.205 1164.264 1.3940 1.3704 44.18 1088.735 1175.937 1.3956 1.3725
46.43 1090.436 1185.187 1.3983 1.3748
48.64 1091.418 1199.969 1.4012 1.3771
50.92 1093.914 1210.938 1.4032 1.3799
PEO10000 + Sodium Succinate + water
18.68 1087.739 1102.152 1.3785 1.3608
26.37 1090.973 1114.320 1.3861 1.3627
33.68 1093.053 1121.736 1.3905 1.3644
37.52 1096.946 1131.337 1.3958 1.3669
42.57 1100.657 1144.457 1.4012 1.3700
Figure 5 shows refractive index versus TLL and density versus TLL curves
for the top and bottom phases of all ATPSs. In all systems, for both phases, the
increasing of TLL values promotes an increase in density and refractive index. This
is because these properties depend on the concentration of PEO and salt in the
phases. The slopes of the curves of density in the bottom phase are higher than in top
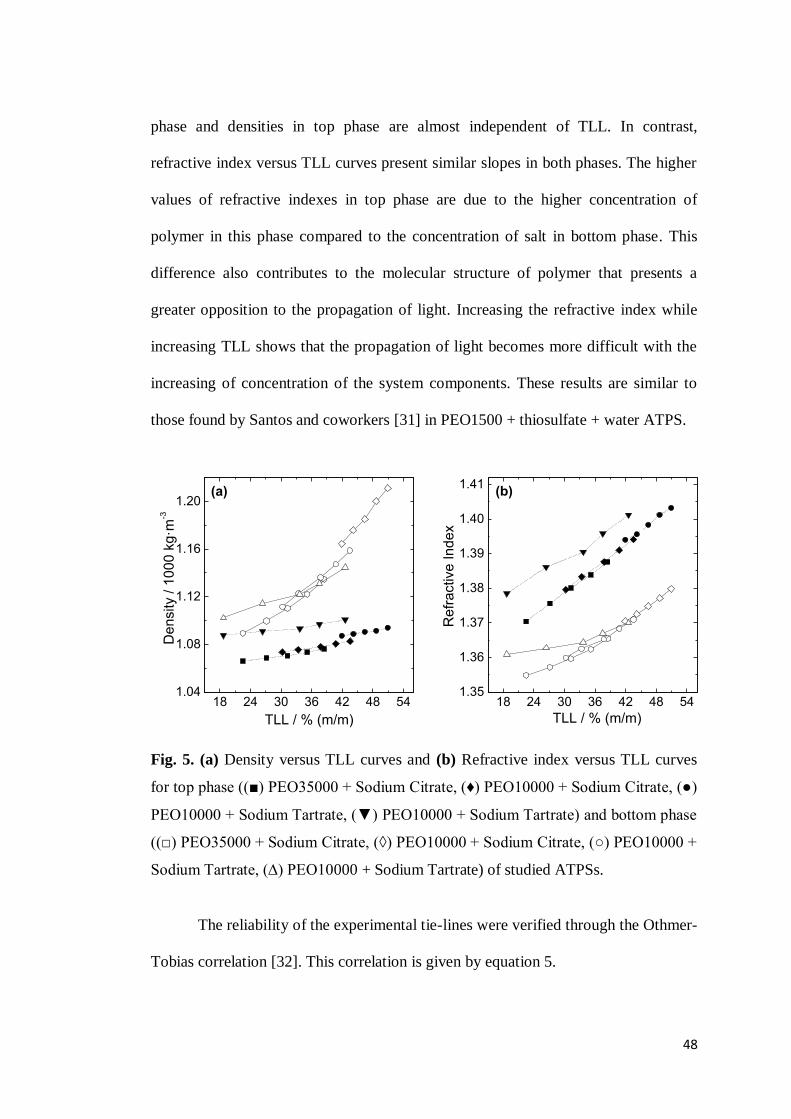
48
phase and densities in top phase are almost independent of TLL. In contrast,
refractive index versus TLL curves present similar slopes in both phases. The higher
values of refractive indexes in top phase are due to the higher concentration of
polymer in this phase compared to the concentration of salt in bottom phase. This
difference also contributes to the molecular structure of polymer that presents a
greater opposition to the propagation of light. Increasing the refractive index while
increasing TLL shows that the propagation of light becomes more difficult with the
increasing of concentration of the system components. These results are similar to
those found by Santos and coworkers [31] in PEO1500 + thiosulfate + water ATPS.
Fig. 5. (a) Density versus TLL curves and (b) Refractive index versus TLL curves
for top phase ((■) PEO35000 + Sodium Citrate, (♦) PEO10000 + Sodium Citrate, (●)
PEO10000 + Sodium Tartrate, (▼) PEO10000 + Sodium Tartrate) and bottom phase
((□) PEO35000 + Sodium Citrate, (◊) PEO10000 + Sodium Citrate, (○) PEO10000 +
Sodium Tartrate, (∆) PEO10000 + Sodium Tartrate) of studied ATPSs.
The reliability of the experimental tie-lines were verified through the Othmer-
Tobias correlation [32]. This correlation is given by equation 5.
18 24 30 36 42 48 541.04
1.08
1.12
1.16
1.20
De
nsity / 1
000
kg·m
-3
TLL / % (m/m)
(a)
18 24 30 36 42 48 541.35
1.36
1.37
1.38
1.39
1.40
1.41
Re
fractive
Ind
ex
TLL / % (m/m)
(b)
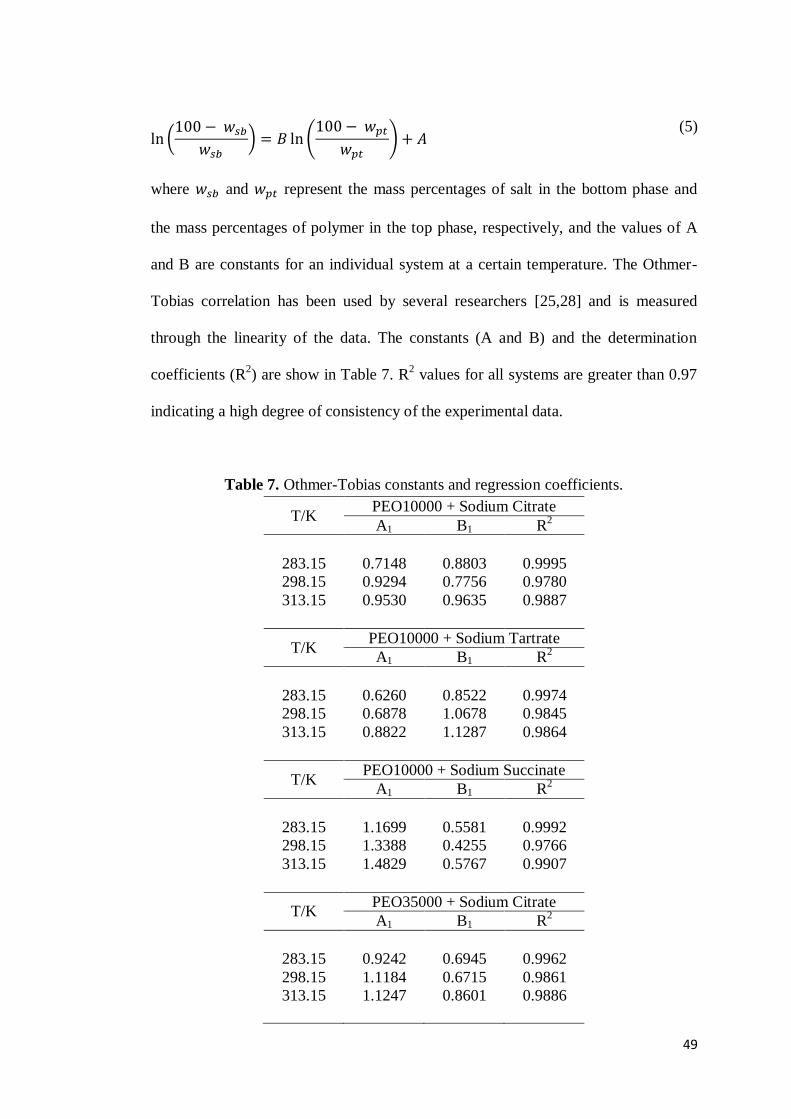
49
( ) (5)
where and represent the mass percentages of salt in the bottom phase and
the mass percentages of polymer in the top phase, respectively, and the values of A
and B are constants for an individual system at a certain temperature. The Othmer-
Tobias correlation has been used by several researchers [25,28] and is measured
through the linearity of the data. The constants (A and B) and the determination
coefficients (R2) are show in Table 7. R2 values for all systems are greater than 0.97
indicating a high degree of consistency of the experimental data.
Table 7. Othmer-Tobias constants and regression coefficients.
T/K PEO10000 + Sodium Citrate A1 B1 R2
283.15 0.7148 0.8803 0.9995 298.15 0.9294 0.7756 0.9780 313.15 0.9530 0.9635 0.9887
T/K PEO10000 + Sodium Tartrate A1 B1 R2
283.15 0.6260 0.8522 0.9974 298.15 0.6878 1.0678 0.9845 313.15 0.8822 1.1287 0.9864
T/K PEO10000 + Sodium Succinate
A1 B1 R2
283.15 1.1699 0.5581 0.9992 298.15 1.3388 0.4255 0.9766 313.15 1.4829 0.5767 0.9907
T/K PEO35000 + Sodium Citrate A1 B1 R2
283.15 0.9242 0.6945 0.9962 298.15 1.1184 0.6715 0.9861 313.15 1.1247 0.8601 0.9886
50
4. Conclusion
Equilibrium data for PEO10000 + sodium citrate + water, PEO10000 +
sodium tartrate + water, PEO10000 + sodium succinate + water and PEO35000 +
sodium citrate + water ATPSs have been obtained at (283.15, 298.15 and 313.15) K
using a gravimetry, conductometry and refractometry techniques.
For all systems, an increase in temperature promotes the increase in the
biphasic region as well as the increase of the slope of tie-lines. This result suggests
that the phase separation process is endothermic and ATPS formation is entropically
driven. The capacity of an anion to induce the phase separation follows the following
order: citrate > tartrate > succinate and this tendency is attributed to intensity of the
salt-PEO interaction. The study of the influence of the molar mass of poly(ethylene
oxide) on phase equilibrium shows that an increase in molar mass of PEO promotes
an increase in the biphasic region and this result is attributed to an entropic
contribution.
The reliability of the experimental equilibrium data was ascertained using the
Othmer–Tobias correlation. The results were satisfactory and showed consistency in
the data obtained.
51
5. References
[1] J.A. Asenjo, B.A. Andrews, Aqueous two-phase systems for protein
separation: a perspective, J. Chromatogr. A 1218 (2011) 8826-8835.
[2] S.C. Silvério, L.A. Ferreira, J.A. Martins, J.C. Marcos, E.A. Macedo, J.A.
Teixeira, Lysozyme and bovine serum albumin partitioning in polyethylene
glycol–phenylalanine conjugate polymer/salt aqueous two-phase systems,
Fluid Phase Equilibr. 322-323 (2012) 19-25.
[3] D.P. de Barros, S.R. Campos, P.P. Madeira, A.M. Azevedo, A.M. Baptista,
M.R. Aires-Barros, Modeling the partitioning of amino acids in aqueous two
phase systems, J. Chromatogr. A 1329 (2014) 52-60.
[4] P.A. Rosa, I.F. Ferreira, A.M. Azevedo, M.R. Aires-Barros, Aqueous two-
phase systems: A viable platform in the manufacturing of
biopharmaceuticals, J. Chromatogr. A. 1217 (2010) 2296-2305.
[5] S.C. Silverio, O. Rodriguez, J.A. Teixeira, E.A. Macedo, Solute partitioning
in polymer-salt ATPS: The Collander equation, Fluid Phase Equilibr. 296
(2010) 173-177.
[6] R.D. Rogers, C.B. Bauer, Partitioning behavior of Group 1 and 2 cations in
poly(ethylene glycol)-based aqueous biphasic systems, J. Chromatogr. B
680 (1996) 237-241.
[7] L.H.M. da Silva, M.C.H. da Silva, K.R. Francisco, M.V.C. Cardoso, L.A.
Minim, J.S.R. Coimbra, PEO-[M(CN)5NO]x- (M = Fe, Mn, or Cr)
interaction as a driving force in the partitioning of the
pentacyanonitrosylmetallate anion in ATPS: Strong effect of the central
atom, J. Phys. Chem. B 112 (2008) 11669-11678.
[8] P.D. Patricio, M.C. Mesquita, L.H.M. da Silva, M.C.H. da Silva,
Application of aqueous two-phase systems for the development of a new
method of cobalt(II), iron(III) and nickel(II) extraction: a green chemistry
approach, J. Hazard. Mater. 193 (2011) 311-318.
[9] L.H.M. da Silva, M.D.H. da Silva, J. Amin, J.P. Martins, J.S.D. Coimbra,
L.A. Minim, Hydrophobic effect on the partitioning of [Fe(CN)5(NO)]2− and
[Fe(CN)6]3− anions in aqueous two-phase systems formed by triblock
copolymers and phosphate salts, Sep. Purif. Technol. 60 (2008) 103-112.
52
[10] M.S.Y. Tang, P.L. Show, Y.K. Lin, K.L. Woon, C.P. Tan, T.C. Ling,
Separation of single-walled carbon nanotubes using aqueous two-phase
system, Sep. Purif. Technol., 125 (2014) 136-141.
[11] R.D. Rogers, H.D. Willauer, S.T. Griffin, J.G. Huddleston, Partitioning of
small organic molecules in aqueous biphasic systems, J. Chromatogr. B. 711
(1998) 255-263.
[12] A.B. Mageste, T.D.A. Senra, M.C.H. da Silva, R.C.F. Bonomo, L.H.M. da
Silva, Thermodynamics and optimization of norbixin transfer processes in
aqueous biphasic systems formed by polymers and organic salts, Sep. Purif.
Technol., 98 (2012) 69-77.
[13] G.D. Rodrigues, L.R. de Lemos, P.D. Patricio, L.H.M. da Silva, M.D.H. da
Silva, Aqueous two-phase systems: A new approach for the determination of
p-aminophenol, J. Hazard. Mater. 192 (2011) 292-298.
[14] A. Kulaguin-Chicaroux, T. Zeiner, Novel aqueous two-phase system based
on a hyperbranched polymer, Fluid Phase Equilibr. 362 (2014) 1-10.
[15] R. Govindarajan, M. Perumalsamy, Phase equilibrium of PEG 2000 +
triammonium citrate + water system relating PEG molecular weight, cation,
anion with effective excluded volume, Gibbs free energy of hydration, size
of cation, and type of anion at (298.15, 308.15, and 318.15) K, J. Chem.
Eng. Data 58 (2013) 2952-2958.
[16] P.D. Patricio, A.B. Mageste, L.R. de Lemos, R.M.M. de Carvalho, L.H.M.
da Silva, M.C.H. da Silva, Phase diagram and thermodynamic modeling of
PEO+organic salts+H2O and PPO+organic salts+H2O aqueous two-phase
systems, Fluid Phase Equilibr. 305 (2011) 1-8.
[17] M.T. Zafarani-Moattar, S. Hamzehzadeh, Liquid-liquid equilibria of
aqueous two-phase systems containing 1-butyl-3-methylimidazolium
bromide and potassium phosphate or dipotassium hydrogen phosphate at
298.15 K, J. Chem. Eng. Data 52 (2007) 1686-1692.
[18] G.D. Rodrigues, L.R. de Lemos, L.H.M. da Silva, M.C.H. da Silva,
Application of hydrophobic extractant in aqueous two-phase systems for
selective extraction of cobalt, nickel and cadmium, J. Chromatogr. A 1279
(2013) 13-19.
53
[19] F. Ruiz-Ruiz, J. Benavides, O. Aguilar, M. Rito-Palomares, Aqueous two-
phase affinity partitioning systems: current applications and trends, J.
Chromatogr. A 1244 (2012) 1-13.
[20] J.P. Martins, M.D.H. da Silva, L.H.M. da Silva, T.D.A. Senra, G.M.D.
Ferreira, J.S.D. Coimbra, L.A. Minim, Liquid-liquid phase equilibrium of
triblock copolymer F68, poly(ethylene oxide)-b-poly(propylene oxide)-b-
poly(ethylene oxide), with sulfate salts, J. Chem. Eng. Data 55 (2010) 1618–
1622.
[21] S.C. Silverio, O. Rodriguez, J.A. Teixeira, E.A. Macedo, The effect of salts
on the liquid–liquid phase equilibria of PEG600+salt aqueous two-phase
systems, J. Chem. Eng. Data 58 (2013) 3528-3535.
[22] L.R. de Lemos, P.D. Patricio, G.D. Rodrigues, R.M.M. de Carvalho, M.C.H.
da Silva, L.H.M. da Silva, Liquid–liquid equilibrium of aqueous two-phase
systems composed of poly(ethylene oxide) 1500 and different electrolytes
((NH4)2SO4, ZnSO4 and K2HPO4): Experimental and correlation, Fluid
Phase Equilibr. 305 (2011) 19-24.
[23] G.D. Rodrigues, L.D. da Silva, G.M.D. Ferreira, M.D.H. da Silva, L.H.M.
da Silva, R.M.M. de Carvalho, Phase diagrams of aqueous two-phase
systems with organic salts and F68 triblock copolymer at different
temperatures, J. Chem. Eng. Data 55 (2010) 1158-1165.
[24] J.P. Martins, A.B. Mageste, M.D.H. da Silva, L.H.M. da Silva, P.D. Patricio,
J.S.D. Coimbra, L.A. Minim, Liquid-liquid equilibria of an aqueous two-
phase system formed by a triblock copolymer and sodium salts at different
temperatures, J. Chem. Eng. Data 54 (2009) 2891–2894.
[25] V.M. de Andrade, G.D. Rodrigues, R.M.M. de Carvalho, L.H.M. da Silva,
M.C.H. da Silva, Aqueous two-phase systems of copolymer L64+organic
salt+water: Enthalpic L64-salt interaction and Othmer-Tobias, NRTL and
UNIFAC thermodynamic modeling, Chem. Eng. J. 171 (2011) 9-15.
[26] M. Svensson, P. Linse, F. Tjerneld, Phase behavior in aqueous twophase
system containing micelle-forming block copolymers, Macromolecules 28
(1995) 3597-3603.
[27] L.R. de Lemos, I.J.B. Santos, G.D. Rodrigues, G.M.D. Ferreira, M.D.H. da
54
Silva, L.H.M. da Silva, R.M.M. de Carvalho, Phase compositions of
aqueous two-phase systems formed by L35 and salts at different
temperatures, J. Chem. Eng. Data 55 (2010) 1193–1199.
[28] I.J.B. Santos, R.M.M. de Carvalho, M.C.H. da Silva, L.H.M. da Silva, Phase
diagram, densities, and the refractive index of new aqueous two-phase
system formed by PEO1500 + thiosulfate + H2O at different temperatures, J.
Chem. Eng. Data 57 (2012) 274-279.
[29] J.P. Martins, J.S.D. Coimbra, F.C. de Oliveira, G. Sanaiotti, C.A.S. da Silva,
L.H.M. da Silva, M.D.H. da Silva, Liquid-liquid equilibrium of aqueous
two-phase system composed of poly(ethylene glycol) 400 and sulfate salts,
J. Chem. Eng. Data 55 (2010) 1247–1251.
[30] L.H.M. da Silva, W. Loh, Calorimetric Investigation of the Formation of
Aqueous Two-Phase Systems in Ternary Mixtures of Water, Poly(ethylene
oxide) and Electrolytes (Or Dextran), J. Phys. Chem. B 104 (2000) 10069-
10073.
[31] L.H.M. da Silva, M.C.H. da Silva, R.A.N. de Aquino, K.R. Francisco,
M.V.C. Cardoso, L.A. Minim, J.S.R. Coimbra, Nitroprusside-PEO enthalpic
interaction as a driving force for partitioning of the [Fe(CN)5NO]2- anion in
aqueous two-phase systems formed by poly(ethylene oxide) and sulfate
salts, J. Phys. Chem. B 110 (2006) 23540-23546.
[32] D.F. Othmer, P.E. Tobias, Tie line correlation, Ind. Eng. Chem. 34 (1942)
693-696
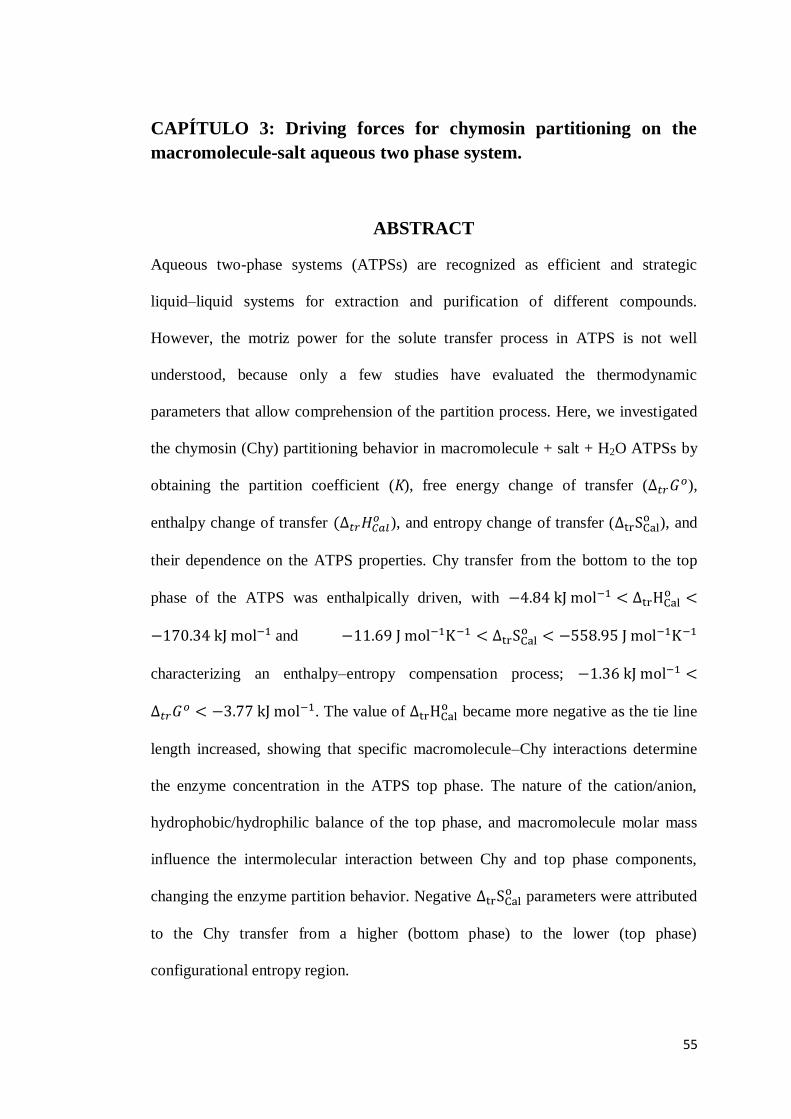
55
CAPÍTULO 3: Driving forces for chymosin partitioning on the macromolecule-salt aqueous two phase system.
ABSTRACT
Aqueous two-phase systems (ATPSs) are recognized as efficient and strategic
liquid–liquid systems for extraction and purification of different compounds.
However, the motriz power for the solute transfer process in ATPS is not well
understood, because only a few studies have evaluated the thermodynamic
parameters that allow comprehension of the partition process. Here, we investigated
the chymosin (Chy) partitioning behavior in macromolecule + salt + H2O ATPSs by
obtaining the partition coefficient (K), free energy change of transfer ( ),
enthalpy change of transfer ), and entropy change of transfer ( ), and
their dependence on the ATPS properties. Chy transfer from the bottom to the top
phase of the ATPS was enthalpically driven, with and
characterizing an enthalpy–entropy compensation process; . The value of became more negative as the tie line
length increased, showing that specific macromolecule–Chy interactions determine
the enzyme concentration in the ATPS top phase. The nature of the cation/anion,
hydrophobic/hydrophilic balance of the top phase, and macromolecule molar mass
influence the intermolecular interaction between Chy and top phase components,
changing the enzyme partition behavior. Negative parameters were attributed
to the Chy transfer from a higher (bottom phase) to the lower (top phase)
configurational entropy region.
56
1. Introduction
Aqueous two-phase systems (ATPSs) are recognized as efficient, economic,
and environmentally safe liquid–liquid systems for extraction and purification of a
great number of solutes, such as metals1,2, proteins3, enzymes4,5, genetic material6,
natural dyes7,8, cells9, nanoparticles10, and carbon nanotubes11,12. However, the
driving forces that determine the partitioning behavior of the solutes in these ATPSs
are not very well understood, mainly because there are few thermodynamic studies
describing the motriz power for solute distribution in both ATPS phases. To optimize
the application of the ATPSs in the purification of solutes, it is important to develop
a systematic thermodynamic approach, from a theoretical and experimental point of
view, to determine the intermolecular interactions responsible for the solute transfer
process in these systems.
Theoretical models explaining the solute distribution in ATPS are derived
mainly from the Flory-Huggins theory, and use a thermodynamic statistical approach
to determine how the transfer thermodynamic parameters depend on the ATPS
properties13, such as the tie line length (TLL), pH, and temperature. Madeira et al.14
used a mathematical function (linear solvation energy relationship) to describe the
solute–solvent interactions that govern solute transfer. Other authors, such as
Berggren et al.15, used a linear function associated with the protein surface
hydrophobicity and/or to electrostatic contribution to describe the protein ATPS
component interaction within this approach, to determine biopolymer partition
behavior. Johansson et al.16 have proposed a model that describes the ATPS solute
transfer process in terms of an entropic and enthalpic contribution to the solute
partition coefficient values, allowing an understanding of the motriz power that
drives the distribution process of different species in ATPSs. However, this semi-
57
qualitative model constitutes only a guide to a better realization of the intermolecular
interactions governing partitioning behavior of the solute in those systems. To
confirm and/or to improve these theoretical models, obtaining the experimental
thermodynamic parameters of transference, such as , , and , for
different solutes in distinct ATPSs is fundamental, however there are few systematic
studies determining the thermodynamics of the transfer process of solutes in ATPS.
Da Silva et al.17 used the van’t Hoff approximation to determine for
[Fe(CN)5(NO)]2− and [Fe(CN)6]3− ions in ATPSs formed by triblock copolymers and
phosphate salts, showing that the transfer process for these anions is exothermic and
enthalpically driven ( < 0). Like those inorganic complexes, biological
solutes, such as the glutenin protein from flour18, partitioned in ATPSs of
poly)ethylene oxide (PEO) + sulfate salts + H2O release enthalpic energy during the
transfer processes, with values between −21.39 and −16.21 kJ mol-1.
However, exothermicity of biopolymer transfer processes is not a general trend. For
example, Pico and coworkers19-21 reported three studies of chymosin (Chy) partition
in a PEO + phosphate salt + H2O ATPS. The authors finding in two of these papers
that the enzyme partition is endothermic, with values between 32 kJ mol−1
and 96 kJ mol−1, concluding that the Chy partitioning in this ATPS is entropically
driven.
Isothermal titration microcalorimetry is the only technique capable of directly
determining the change of transfer enthalpy ( ), and various papers report a
discrepancy between the and values for various thermodynamic
process22. For the ATPS solute transfer process specifically, da Silva et al.23
determined the and values of pentacyanonitrosylmetalate complexes
([M(CN)5NO]-3, where M = Fe, Mn, Cr), showing that a great difference exists
58
between the two methodologies, where the decreases and is
practically constant with increasing TLL. Thus, it is important to measure the values for biopolymers, and to compare their values with results
found in literature. Chy (EC 3.4.23.4) can be used as a model biopolymer for this
purpose. Chy is a neonatal gastric aspartic proteinase important in the cheese
industry24. This enzyme is obtained from bovine calf stomachs or by the gene
chymosin cloned and expressed in suitable bacteria. It causes the rupture of the Phe
105 – Met 106 bond of k-casein, generating two carbon chains; one chain is a portion
of the insoluble N-terminal casein (cheese) and the other is the C-terminal casein that
is soluble in solution25. Many studies have described the structure, conformation, and
stability of Chy in solution. It has a molar mass equal to 36000 g mol-1, with 323
amino acid units structured in a globular form. It is stable at pH values between 5.3
and 6.3. At pH values lower than 3, Chy loses its activity, and at pH above 9.8, an
irreversible conformational change occurs20,26,27.
The aim of this paper is to discover the motriz power for Chy partitioning in a
macromolecule (PEO or Copolymer) + electrolyte (organic or inorganic salts) + H2O
ATPS, determining Chy thermodynamic parameters ( , and )
and their dependence on the following ATPS properties; i.e., TLL values, cation and
anion structure, hydrophobic/hydrophilic balance, and the molar mass of the
macromolecule.

59
2. Experimental section
2.1 Materials
PEO, with a molar mass of 1500 g mol-1 was purchased from Synth (Brazil).
PEO with molar masses of 10000 g mol-1 and the triblock copolymer F68 with a
molar mass equal to 8400 g mol-1 were purchased from Aldrich (Germany). The
organic salts sodium tartrate (TartNa; Na2C4H4O6·2H2O; 99.5%), and sodium citrate
(CitNa; Na3C6H5O7·2H2O; 99.0%), and the inorganic salts sodium sulfate (Na2SO4;
99.0%) and lithium sulfate (Li2SO4; 99.0%) were all purchased from Vetec (Brazil).
Chy was obtained from DSM (99.0%). All chemicals were used without further
purification. Distilled water was used to prepare all aqueous solutions.
2.2 Determination of chymosin partition coefficient
Chy partition coefficients were determined as follows. ATPSs with a desired
global composition and a total mass of 5.00 g were prepared by mixing stock
solutions of a polymer (or copolymer) and a salt. The global compositions of the
ATPSs (PEO 1500 + sodium tartrate + H2O, PEO 1500 + sodium citrate + H2O, PEO
1500 + sodium sulfate + H2O, PEO 1500 + lithium sulfate + H2O, PEO 10000 +
sodium citrate + H2O and F68 + sodium citrate + H2O) were obtained from phase
diagrams reported in the literature28-30. At least four different global compositions
were chosen from each phase diagram. The stock solutions were mixed with 50 μL of
Chy, and the obtained systems were stirred. The system was allowed to equilibrate
for 24 h in a temperature controlled bath (Microquimica, MQBTC 99-20, 298.15 ±
0.1 K). Aliquots of the top and the bottom phases were collected with a syringe, and
adequately diluted with distilled water for a spectrophotometric analysis at 260 nm
60
using a Shimadzu digital double beam spectrometer (UV-2550). The Chy partition
coefficient (K) was calculated using the following equation:
(1)
where and are the absorbances of the diluted top phase and the
diluted bottom phase, respectively, discounting the absorbances of the corresponding
blanks, and and are the dilution factors of the phases.
K was studied for different TLL values of each ATPS investigated. The TLL
numerically expresses the difference in the intensive thermodynamic functions
between the top and the bottom phases, at constant pressure and temperature. It is
calculated using equation 2:
[( ) ] (2)
where and are the polymer concentrations in the top and bottom phases,
respectively, and and are the corresponding salt concentrations in the top and
bottom phases, respectively.
2.3 Thermodynamic parameters of chymosin transfer
2.3.1 Chymosin transfer Gibbs free energy change ( )
The transfer Gibbs free energy change ( ) is the molar Gibbs free energy
change associated with the transfer of Chy from the bottom phase to the top phase of
61
the ATPS. This thermodynamic parameter was calculated from values of the Chy
partition coefficient of all TLL values using the equation 3:
(3)
where R is the real gas constant, T is the absolute temperature, and K is the Chy
partition coefficient.
2.3.2 Chymosin transfer enthalpy change ( )
The value for each ATPS studied was determined by isothermal
titration calorimetry (ITC) measurements using a microcalorimeter CSC-4200
(Science Corp. Calorimeter). The values were obtained after three titration
experiments. Aliquots containing 0.90 mL of the top and the bottom phase were first
added to the reference and sample cells of the microcalorimeter. Five injections of 5
µL of Chy 1.50 mmol L-1 prepared in the bottom phase were then titrated into the
sample cell. A gastight Hamilton syringe (250 μL) controlled by an instrument was
utilized for the injections, and a stirrer helix stirring at 300 rpm was used throughout
the experiment. The flow of energy registered during the whole process was recorded
as a power versus time curve, which was integrated to obtain the heat flow associated
to the enthalpy change of each system ( ). To discount the energy associated
with friction effects ( ), a similar procedure was performed by titrating the
bottom phase in the absence of the enzyme in the sample cell containing the ATPS.
Additionally, the energy associated with dilution effects ( ) was determined by
filling the reference and the sample cells with 1.80 mL of the bottom phase and
titrating the solution with five injections of 5 µL of Chy 1.50 mmol L-1 prepared in
62
the bottom phase. The values were then calculated by using the following
relationship:
(4)
where n is the amount of Chy transferred from the bottom to the top phase after each
injection.
2.3.3 Chymosin transfer entropy change ( )
The values were determined through the classic thermodynamic
relationship:
(5)
where and are values already known.
2.4 Dilution enthalpy change for the infinite dilution condition
The dilution enthalpy change of Chy for the infinite dilution condition
( ) was determined in different solvents using ITC. A 2.97 mmol L-1 Chy
solution was diluted titrating 5 µL aliquots of the Chy solution in 2.70 mL of solvent
in the sample cell of the calorimeter. The solvents utilized were pure water, 0.72 mol
L-1 aqueous citrate solution, 0.72 mol L-1 aqueous tartrate solution, the top phase of
the PEO 1500 + tartrate + water [TLL = 34.95% (w/w)] system, and the top phase of
the PEO 1500 + citrate + water [TLL = 36.54% (m/m)] system. The molar enthalpy
changes ( ) were plotted as a function of the Chy concentration ([Chy]), and the values were calculated extrapolating [Chy] to zero. A similar procedure
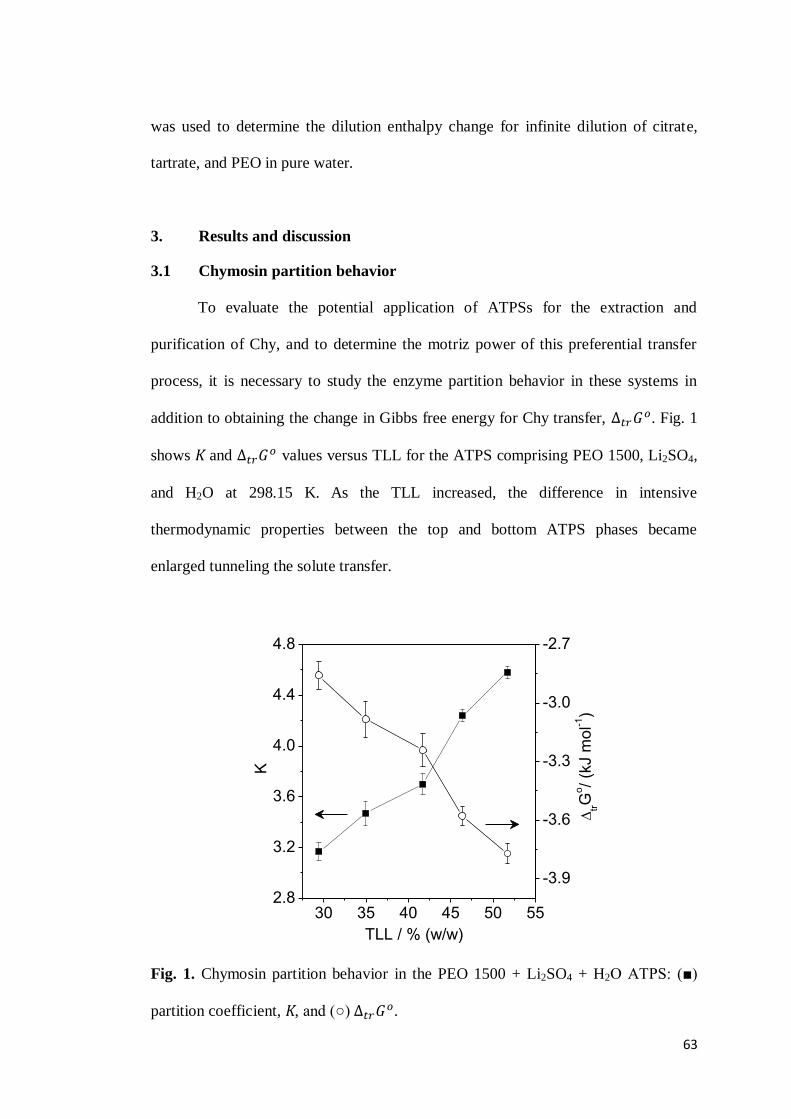
63
was used to determine the dilution enthalpy change for infinite dilution of citrate,
tartrate, and PEO in pure water.
3. Results and discussion
3.1 Chymosin partition behavior
To evaluate the potential application of ATPSs for the extraction and
purification of Chy, and to determine the motriz power of this preferential transfer
process, it is necessary to study the enzyme partition behavior in these systems in
addition to obtaining the change in Gibbs free energy for Chy transfer, . Fig. 1
shows K and values versus TLL for the ATPS comprising PEO 1500, Li2SO4,
and H2O at 298.15 K. As the TLL increased, the difference in intensive
thermodynamic properties between the top and bottom ATPS phases became
enlarged tunneling the solute transfer.
2.8
3.2
3.6
4.0
4.4
4.8
30 35 40 45 50 55
-3.9
-3.6
-3.3
-3.0
-2.7
K
TLL / % (w/w)
tr
Go/ (k
J m
ol-1
)
Fig. 1. Chymosin partition behavior in the PEO 1500 + Li2SO4 + H2O ATPS: (■)
partition coefficient, K, and (○) .
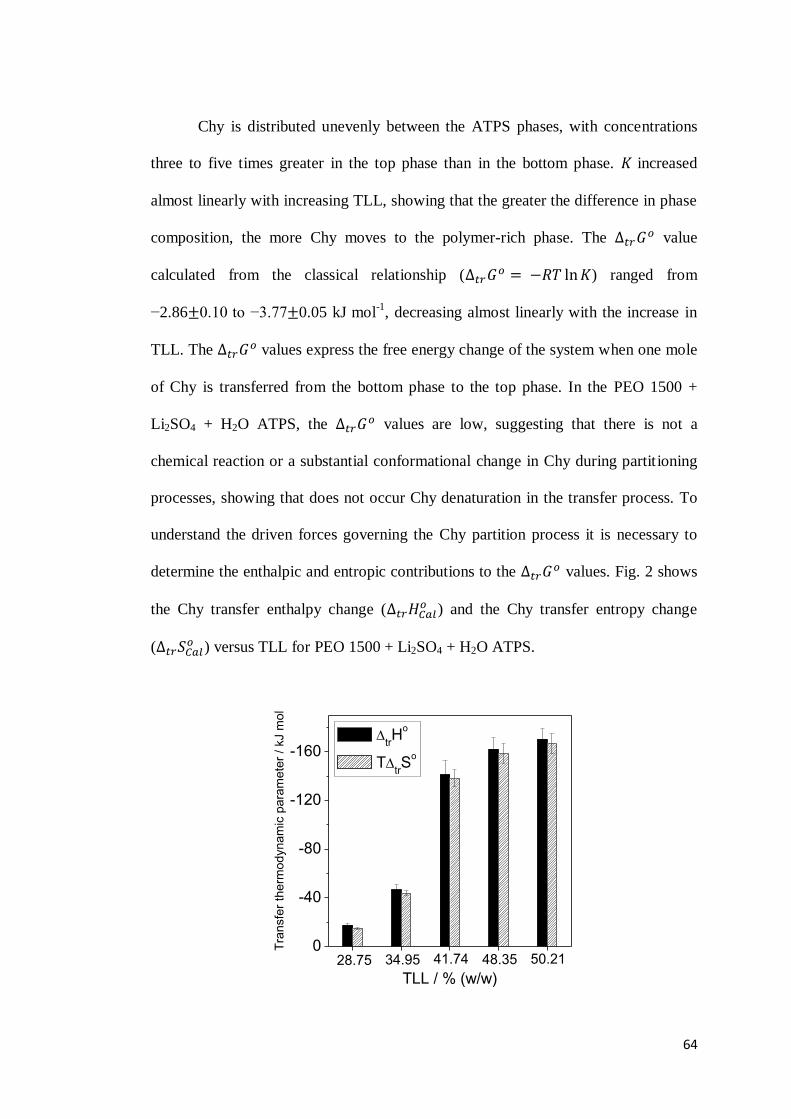
64
Chy is distributed unevenly between the ATPS phases, with concentrations
three to five times greater in the top phase than in the bottom phase. K increased
almost linearly with increasing TLL, showing that the greater the difference in phase
composition, the more Chy moves to the polymer-rich phase. The value
calculated from the classical relationship ( ) ranged from
−2.86 0.10 to −3.77 0.05 kJ mol-1, decreasing almost linearly with the increase in
TLL. The values express the free energy change of the system when one mole
of Chy is transferred from the bottom phase to the top phase. In the PEO 1500 +
Li2SO4 + H2O ATPS, the values are low, suggesting that there is not a
chemical reaction or a substantial conformational change in Chy during partit ioning
processes, showing that does not occur Chy denaturation in the transfer process. To
understand the driven forces governing the Chy partition process it is necessary to
determine the enthalpic and entropic contributions to the values. Fig. 2 shows
the Chy transfer enthalpy change ( ) and the Chy transfer entropy change
( ) versus TLL for PEO 1500 + Li2SO4 + H2O ATPS.
0
-40
-80
-120
-160
50.2148.3541.7434.95
Tra
nsfe
r th
erm
od
yna
mic
pa
ram
ete
r /
kJ m
ol-1
TLL / % (w/w)
trH
o
TtrS
o
28.75
65
Fig. 2. Enthalpic and entropic contributions for chymosin partition in the PEO 1500
+ Li2SO4 + H2O ATPS.
While the values are low, the values have almost the same
magnitude as and the partition process occurs with an enthalpic-entropic
compensation. Both the enthalpic and entropic transfer parameters are negative, and
their values decrease as the TLL values increase, showing that the Chy transfer
process is enthalpically driven. To the best of our knowledge, these results are the
first direct enthalpic measurement of the Chy transfer process in an ATPS. Spelzini
and coworkers19,20 used the van’t Hoff approximation to determine the Chy transfer
enthalpy change ( ) in the ATPS formed by PEO (molar mass of 1450, 3350.
and 6000 g mol-1) + potassium phosphate + H2O or diblock copolymer PEO-PPO
(molar mass of 8400 g mol-1) + maltodextrin + H2O, and reported values of that
parameter ranging from 32 kJ mol-1 to 96 kJ mol-1. These endothermic values were
attributed to the breaking of intermolecular water-enzyme and macromolecule-water
interactions when the enzyme is transferred from the bottom phase to the top phase.
In addition, the authors concluded that Chy partitioning in these ATPSs is
entropically driven. Despite the difference between the ATPSs used here and in the
previous studies19,20, our thermodynamic results lead to distinct conclusions with
respect to the mechanisms involved in the Chy partition in ATPSs. In general, the
van’t Hoff and calorimetric enthalpies of transference are different in magnitude
and/or signal. For instance, da Silva et al.23 found values ranging from -101
kJ mol-1 to 7 kJ mol-1, and values between -28 kJ mol-1 and 7 kJ mol-1 for the
partition of pentacyanonitrosylmetalate anions in the PEO 1500 + Na2SO4 + H2O
ATPS. The authors attributed the differences obtained between and
66
values to changes in the entropic state of the system when the transfer process
occurs. When , the transfer process is considered to be a two-state
process in which the entropic difference is great and finite. Conversely, when , the transfer process is considered to take place in a sequence of
multistep processes, occurring between consecutive states with a very small entropy
difference31,32. The Chy partition probably occurs in a multistep process associated
with the conformational changes of both the enzyme and the ATPS-macromolecule,
the molecular dehydration of ATPS components, aggregate formation, and water
transfer between the ATPS phases.
To understand the and values from a molecular view point,
we have interpreted all of these thermodynamic parameters through a molecular
model developed by Johansson et al.16 These authors have suggested that the
partition process of a solute in ATPS can be divided into entropic and enthalpic
contributions to the K values, and demonstrated that the entropic contribution to the
Chy partition can be expressed by equation 6.
(6)
where and are the total number of molecules in the top and bottom phase,
respectively, is Chy molar mass, is the number of lattice sites per unit
volume, and and are the volumes of the top phase and bottom phase,
respectively. According to equation 6, when the entropy is the solely responsible for
the solute transfer; i.e., the system entropy increases during the partition process; the
solute will concentrate in the phase with the higher molecular numerical density. The
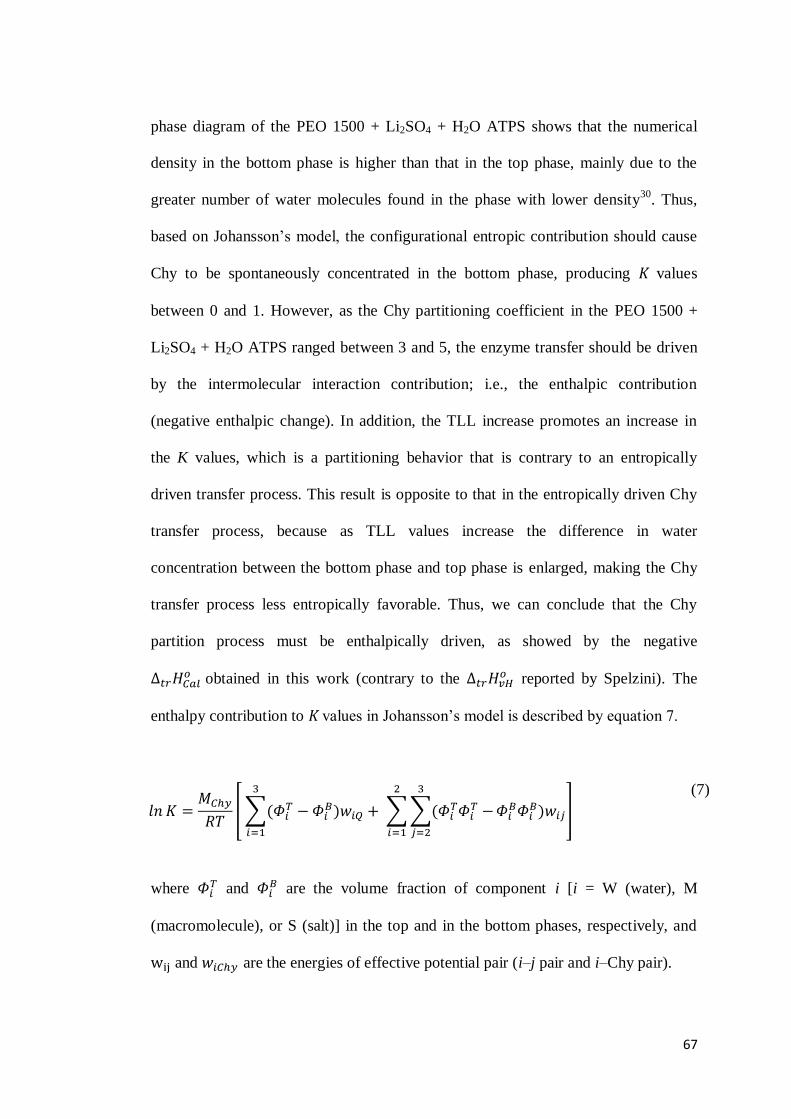
67
phase diagram of the PEO 1500 + Li2SO4 + H2O ATPS shows that the numerical
density in the bottom phase is higher than that in the top phase, mainly due to the
greater number of water molecules found in the phase with lower density30. Thus,
based on Johansson’s model, the configurational entropic contribution should cause
Chy to be spontaneously concentrated in the bottom phase, producing K values
between 0 and 1. However, as the Chy partitioning coefficient in the PEO 1500 +
Li2SO4 + H2O ATPS ranged between 3 and 5, the enzyme transfer should be driven
by the intermolecular interaction contribution; i.e., the enthalpic contribution
(negative enthalpic change). In addition, the TLL increase promotes an increase in
the K values, which is a partitioning behavior that is contrary to an entropically
driven transfer process. This result is opposite to that in the entropically driven Chy
transfer process, because as TLL values increase the difference in water
concentration between the bottom phase and top phase is enlarged, making the Chy
transfer process less entropically favorable. Thus, we can conclude that the Chy
partition process must be enthalpically driven, as showed by the negative obtained in this work (contrary to the reported by Spelzini). The
enthalpy contribution to K values in Johansson’s model is described by equation 7.
∑ ∑∑
(7)
where and are the volume fraction of component i [i = W (water), M
(macromolecule), or S (salt)] in the top and in the bottom phases, respectively, and and are the energies of effective potential pair (i–j pair and i–Chy pair).
68
The term ∑ ∑ represents the net energy absorbed
or released when Chy is transferred from the bottom phase to the top phase due to a
closed-cavity process in the bottom phase (Chy move-out) and an open-cavity
process in the top phase (Chy move-in). This net energy difference does not consider
the interactions between Chy and the ATPS components. It essentially arises from
the molecular interactions that occur between the bottom phase components and the
molecular interactions broken between top-phase components when the enzyme is
transferred. Its value depends on the solute molecular volume and makes little
contribution to K values, as shown by da Silva et al.33 Therefore, the term ∑ should determine the Chy partition in the ATPS.
The term ∑ expresses Chy partitioning in the ATPS, and
is the principal contribution to the parameter, because it represents the
difference in energy between Chy-top phase components and Chy-bottom phase
components interactions. According to this term, the negative values (Fig. 2)
indicate that the interactions between the Chy-top phase components are more
enthalpically favorable than those of the Chy-bottom phase components. Since water
is the major component in both phases, it is reasonable to think that the Chy
hydration shell is not greatly changed by the enzyme partitioning. Thus, these values should be attributed to the difference between the Chy–
macromolecule interactions and the Chy–salt interaction, showing that the energy of
the effective potential pair that is predominant in the top phase ( is
more intense (i.e., more negative, or less positive) than the energy of the potential
pair that is predominant in the bottom phase ( . Furthermore, as TLL values
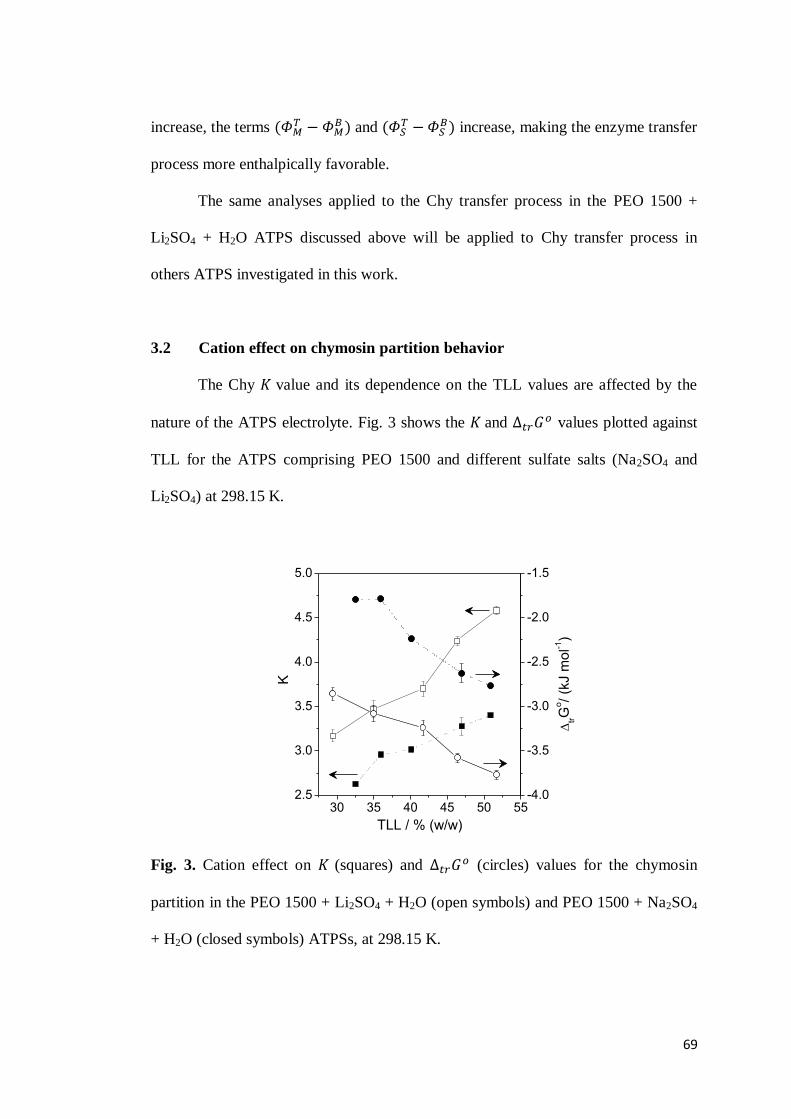
69
increase, the terms and increase, making the enzyme transfer
process more enthalpically favorable.
The same analyses applied to the Chy transfer process in the PEO 1500 +
Li2SO4 + H2O ATPS discussed above will be applied to Chy transfer process in
others ATPS investigated in this work.
3.2 Cation effect on chymosin partition behavior
The Chy K value and its dependence on the TLL values are affected by the
nature of the ATPS electrolyte. Fig. 3 shows the K and values plotted against
TLL for the ATPS comprising PEO 1500 and different sulfate salts (Na2SO4 and
Li2SO4) at 298.15 K.
2.5
3.0
3.5
4.0
4.5
5.0
30 35 40 45 50 55-4.0
-3.5
-3.0
-2.5
-2.0
-1.5
K
TLL / % (w/w)
tr
Go/ (k
J m
ol-1
)
Fig. 3. Cation effect on K (squares) and (circles) values for the chymosin
partition in the PEO 1500 + Li2SO4 + H2O (open symbols) and PEO 1500 + Na2SO4
+ H2O (closed symbols) ATPSs, at 298.15 K.
70
The capacity of Li2SO4 salt to promote Chy transfer from the bottom phase to
the top phase is higher than that of Na2SO4 salt. Since the anion of these salts is the
same, we can attribute this salt effect on the Chy partitioning to the cation. The same
cation effect ( ) was observed in the partitioning of other solutes in
ATPSs, e.g. caseinomacropeptide34, glutenin flour protein18, ovomucoid35, carmine
dye36, and [M(CN)5NO]-3 (M=Fe, Mn, Cr) anions23. However, this trend has not
previously been observed in Chy partitioning, since only three studies have applied
ATPSs for Chy extraction, and each used only potassium phosphate salts
(K2PO4/KHPO4) as the electrolyte19-21.
The cation effect on the K values of Chy can be explained considering the
model proposed by da Silva and Loh to describe the formation process of an ATPS37.
According to these authors, the determination of the enthalpy change of interaction
between cation (M+) and PEO segments ( ) allows the following
molecular mechanism for the splitting of phases in ATPS to be proposed. When an
aqueous salt solution is mixed with an aqueous polymer solution, an intermolecular
interaction between the cation and the ethylene oxide groups of the polymer occurs,
which is entropically driven ( ) due mainly to the release of water
molecules solvating the interacting particles. This electrolyte-polymer binding occurs
until saturation of the polymer surface, after which no further entropy gain by the
water release process is possible. In order to decrease the Gibbs free energy of the
system, a separation producing a top phase enriched with polymer chains adsorbed
by cations (pseudopolycation species) must occur. The authors have showed that
lithium has a higher capacity to generate positive charge density on the PEO
molecular chain than sodium.
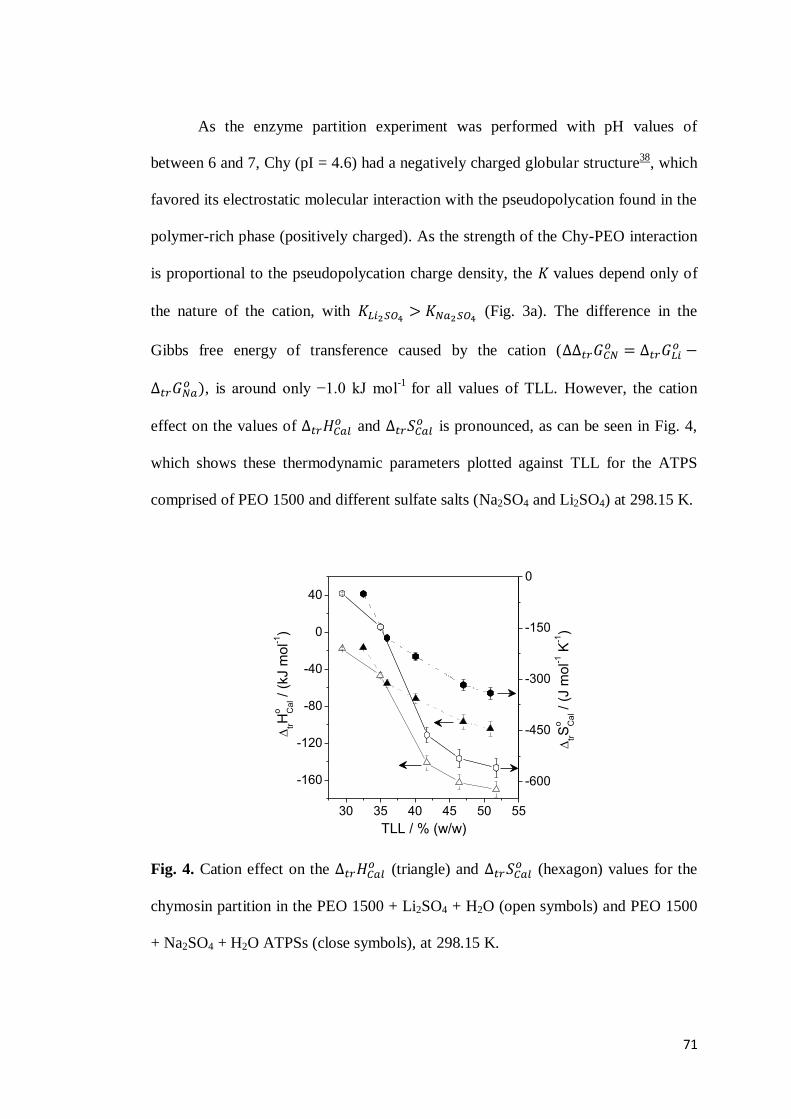
71
As the enzyme partition experiment was performed with pH values of
between 6 and 7, Chy (pI = 4.6) had a negatively charged globular structure38, which
favored its electrostatic molecular interaction with the pseudopolycation found in the
polymer-rich phase (positively charged). As the strength of the Chy-PEO interaction
is proportional to the pseudopolycation charge density, the K values depend only of
the nature of the cation, with (Fig. 3a). The difference in the
Gibbs free energy of transference caused by the cation ( , is around only −1.0 kJ mol-1 for all values of TLL. However, the cation
effect on the values of and is pronounced, as can be seen in Fig. 4,
which shows these thermodynamic parameters plotted against TLL for the ATPS
comprised of PEO 1500 and different sulfate salts (Na2SO4 and Li2SO4) at 298.15 K.
-160
-120
-80
-40
0
40
30 35 40 45 50 55
-600
-450
-300
-150
0
trH
o Cal /
(kJ m
ol-1
)
TLL / % (w/w)
tr
So C
al /
(J m
ol-1
K-1)
Fig. 4. Cation effect on the (triangle) and (hexagon) values for the
chymosin partition in the PEO 1500 + Li2SO4 + H2O (open symbols) and PEO 1500
+ Na2SO4 + H2O ATPSs (close symbols), at 298.15 K.
72
The and values are negative, decreasing in magnitude with
increasing TLL, showing that for both ATPSs the Chy transfer process is
enthalpically driven. In addition, for all TLL values, and are more
negative in the ATPS formed by Li2SO4 than that formed by Na2SO4, demonstrating
that Chy–Li+ pseudopolycation interaction is more enthalpically intense than the
Chy–Na+ pseudopolycation interaction. The difference in enthalpy caused by
replacing Li+ with Na+ ( ) is dependent on the TLL
value, varying from −1.00 ± 0.05 to −66.00 ± 4.60 kJ mol-1, showing that the cation
effect on the Chy–M+ pseudopolycation interaction increases as the salt and polymer
concentrations increase in the ATPS.
Regarding to values, the Johansson model predicts that the decrease
in the entropy of the system promoted by Chy transfer from the higher density phase
to the lower density phase should be due to the small configurational entropy of the
top phase caused by its lower water content. However, the difference in the water
concentrations between the ATPS phases is similar for the PEO 1500 + Li2SO4 +
H2O and PEO 1500 + Na2SO4 + H2O systems, which negates the configurational
entropy difference as the explanation for the more negative in Li+ ATPSs
than in Na+ ATPSs. This cation effect on the values should probably be
attributed to the greater strength of the Chy-Li+ pseudopolycation interaction
compared to the Chy-Na+ pseudopolycation interaction, which causes two molecular
process to occur more intensively: firstly, the decrease of the degree of translational
freedom for both enzyme and PEO; and secondly, the conformational change of the
PEO from a random coil structure to more linear conformation.
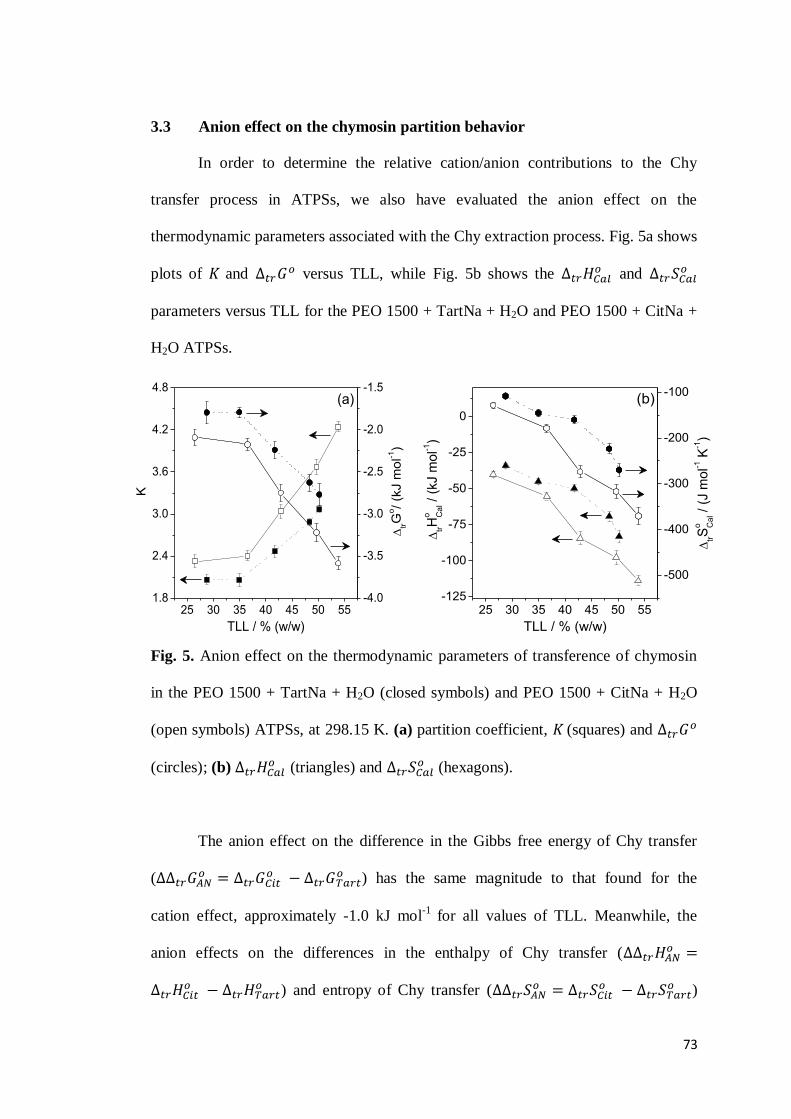
73
3.3 Anion effect on the chymosin partition behavior
In order to determine the relative cation/anion contributions to the Chy
transfer process in ATPSs, we also have evaluated the anion effect on the
thermodynamic parameters associated with the Chy extraction process. Fig. 5a shows
plots of K and versus TLL, while Fig. 5b shows the and
parameters versus TLL for the PEO 1500 + TartNa + H2O and PEO 1500 + CitNa +
H2O ATPSs.
1.8
2.4
3.0
3.6
4.2
4.8
25 30 35 40 45 50 55-4.0
-3.5
-3.0
-2.5
-2.0
-1.5
K
TLL / % (w/w)
tr
Go/ (k
J m
ol-1
)(a)
-125
-100
-75
-50
-25
0
25 30 35 40 45 50 55
-500
-400
-300
-200
-100
trH
o Cal /
(kJ m
ol-1
)
TLL / % (w/w)
tr
So C
al /
(J m
ol-1
K-1)
(b)
Fig. 5. Anion effect on the thermodynamic parameters of transference of chymosin
in the PEO 1500 + TartNa + H2O (closed symbols) and PEO 1500 + CitNa + H2O
(open symbols) ATPSs, at 298.15 K. (a) partition coefficient, K (squares) and
(circles); (b) (triangles) and (hexagons).
The anion effect on the difference in the Gibbs free energy of Chy transfer
( ) has the same magnitude to that found for the
cation effect, approximately -1.0 kJ mol-1 for all values of TLL. Meanwhile, the
anion effects on the differences in the enthalpy of Chy transfer ( ) and entropy of Chy transfer ( )
74
are smaller than those of the cation effect; i.e., ( > ) and ( > ).
The increase in TLL promotes an increase in the K values and makes the , , and values more negative. The thermodynamic parameters
of Chy transfer for citrate ATPSs are more negative than those for tartrate ATPSs. As
observed for the cation effect, was negative, which makes enthalpy decrease
the motriz power of Chy partition in the PEO 1500 + TartNa + H2O and PEO 1500 +
CitNa + H2O ATPS.
Thus, to gain a better understanding of the anion effect, it is necessary to
analyze the molecular interactions that drive the Chy distribution in both ATPS
phases. We can consider that the magnitude of arises from different
interaction process, as showed by equation 8.
(8)
where is the enthalpy change associated with the interaction between
components i and j. Components i and j can be W, S, Mac or Chy, representing
water, salts (cation and anion), macromolecules and Chy, respectively. When the
enzyme is transferred from the bottom phase to the top phase, salt-Chy and
macromolecule-water intermolecular interactions must be broken in the bottom and
the top phase, respectively (endothermic process). Consequentially, the
and terms contribute to positive values. Conversely, because Chy-
macromolecule interactions in the top phase and salt-water interactions in the bottom
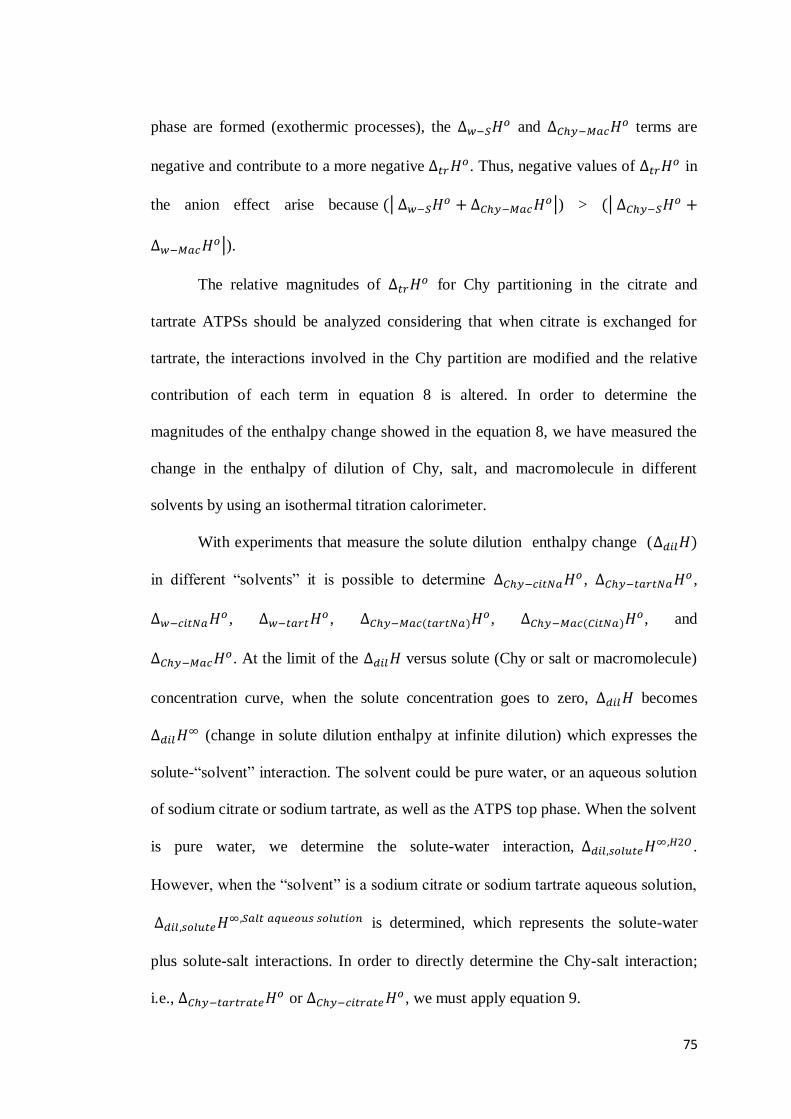
75
phase are formed (exothermic processes), the and terms are
negative and contribute to a more negative . Thus, negative values of in
the anion effect arise because | |) > | |). The relative magnitudes of for Chy partitioning in the citrate and
tartrate ATPSs should be analyzed considering that when citrate is exchanged for
tartrate, the interactions involved in the Chy partition are modified and the relative
contribution of each term in equation 8 is altered. In order to determine the
magnitudes of the enthalpy change showed in the equation 8, we have measured the
change in the enthalpy of dilution of Chy, salt, and macromolecule in different
solvents by using an isothermal titration calorimeter.
With experiments that measure the solute dilution enthalpy change ( in different “solvents” it is possible to determine , , , , , , and . At the limit of the versus solute (Chy or salt or macromolecule)
concentration curve, when the solute concentration goes to zero, becomes (change in solute dilution enthalpy at infinite dilution) which expresses the
solute-“solvent” interaction. The solvent could be pure water, or an aqueous solution
of sodium citrate or sodium tartrate, as well as the ATPS top phase. When the solvent
is pure water, we determine the solute-water interaction, .
However, when the “solvent” is a sodium citrate or sodium tartrate aqueous solution, is determined, which represents the solute-water
plus solute-salt interactions. In order to directly determine the Chy-salt interaction;
i.e., or , we must apply equation 9.
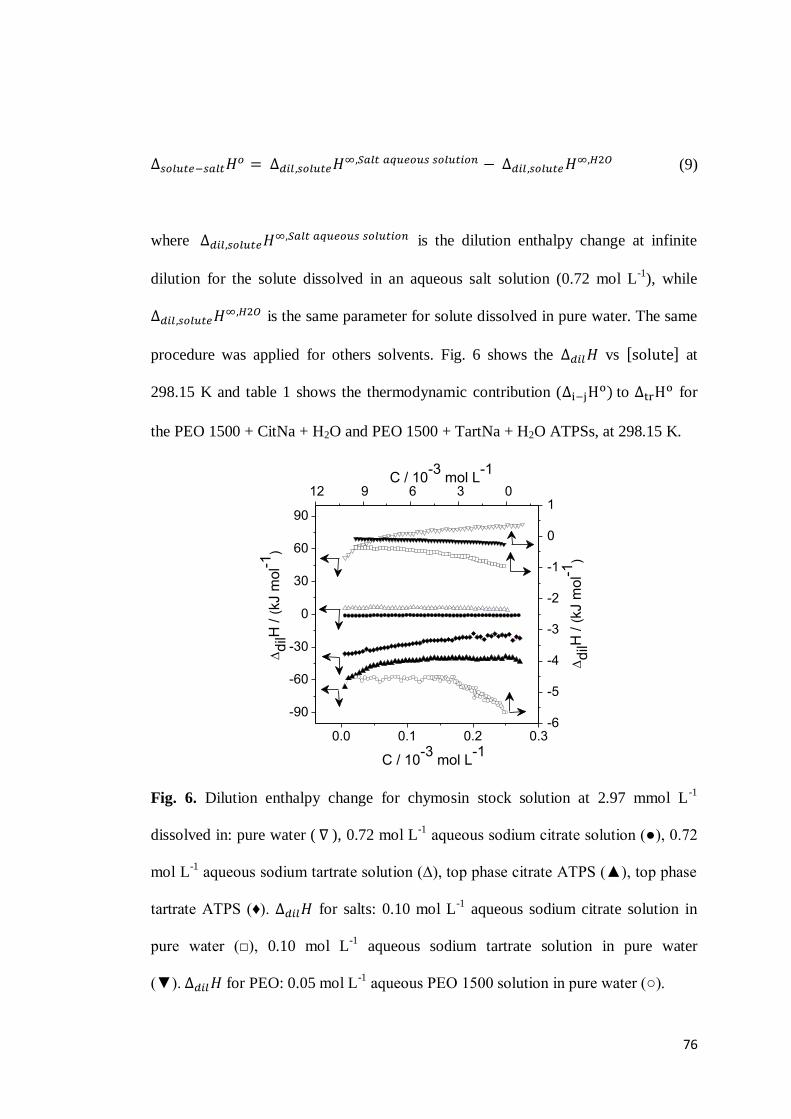
76
(9)
where is the dilution enthalpy change at infinite
dilution for the solute dissolved in an aqueous salt solution (0.72 mol L-1), while is the same parameter for solute dissolved in pure water. The same
procedure was applied for others solvents. Fig. 6 shows the vs at
298.15 K and table 1 shows the thermodynamic contribution ( to for
the PEO 1500 + CitNa + H2O and PEO 1500 + TartNa + H2O ATPSs, at 298.15 K.
0.0 0.1 0.2 0.3
-90
-60
-30
0
30
60
90
12 9 6 3 0
-6
-5
-4
-3
-2
-1
0
1
C / 10-3
mol L-1
C / 10-3
mol L-1
dilH
/ (
kJ m
ol-1
)
dilH
/ (
kJ m
ol-1
)
Fig. 6. Dilution enthalpy change for chymosin stock solution at 2.97 mmol L-1
dissolved in: pure water ( ), 0.72 mol L-1 aqueous sodium citrate solution (●), 0.72
mol L-1 aqueous sodium tartrate solution (∆), top phase citrate ATPS (▲), top phase
tartrate ATPS (♦). for salts: 0.10 mol L-1 aqueous sodium citrate solution in
pure water (□), 0.10 mol L-1 aqueous sodium tartrate solution in pure water
(▼). for PEO: 0.05 mol L-1 aqueous PEO 1500 solution in pure water (○).
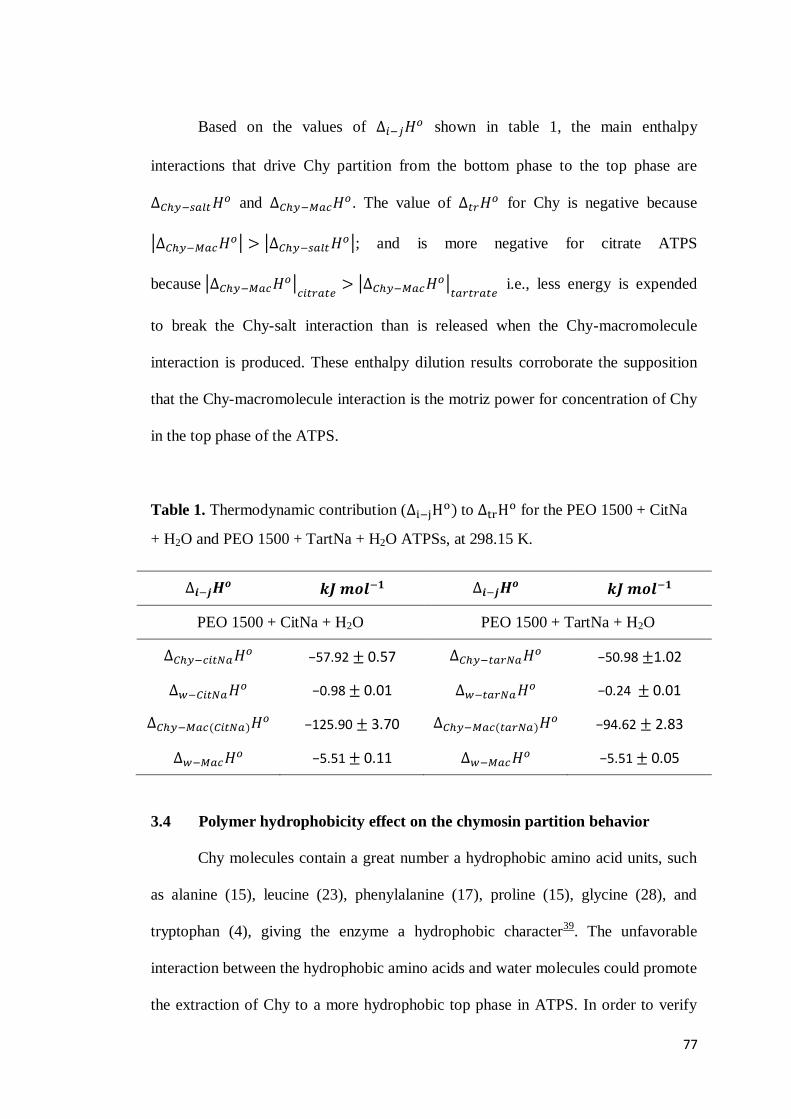
77
Based on the values of shown in table 1, the main enthalpy
interactions that drive Chy partition from the bottom phase to the top phase are and . The value of for Chy is negative because | | | |; and is more negative for citrate ATPS
because | | | | i.e., less energy is expended
to break the Chy-salt interaction than is released when the Chy-macromolecule
interaction is produced. These enthalpy dilution results corroborate the supposition
that the Chy-macromolecule interaction is the motriz power for concentration of Chy
in the top phase of the ATPS.
Table 1. Thermodynamic contribution ( to for the PEO 1500 + CitNa
+ H2O and PEO 1500 + TartNa + H2O ATPSs, at 298.15 K.
PEO 1500 + CitNa + H2O PEO 1500 + TartNa + H2O −57.92 0.57 −50.98 1.02 −0.98 0.01 −0.24 0.01 −125.90 3.70 −94.62 2.83 −5.51 0.11 −5.51 0.05
3.4 Polymer hydrophobicity effect on the chymosin partition behavior
Chy molecules contain a great number a hydrophobic amino acid units, such
as alanine (15), leucine (23), phenylalanine (17), proline (15), glycine (28), and
tryptophan (4), giving the enzyme a hydrophobic character39. The unfavorable
interaction between the hydrophobic amino acids and water molecules could promote
the extraction of Chy to a more hydrophobic top phase in ATPS. In order to verify
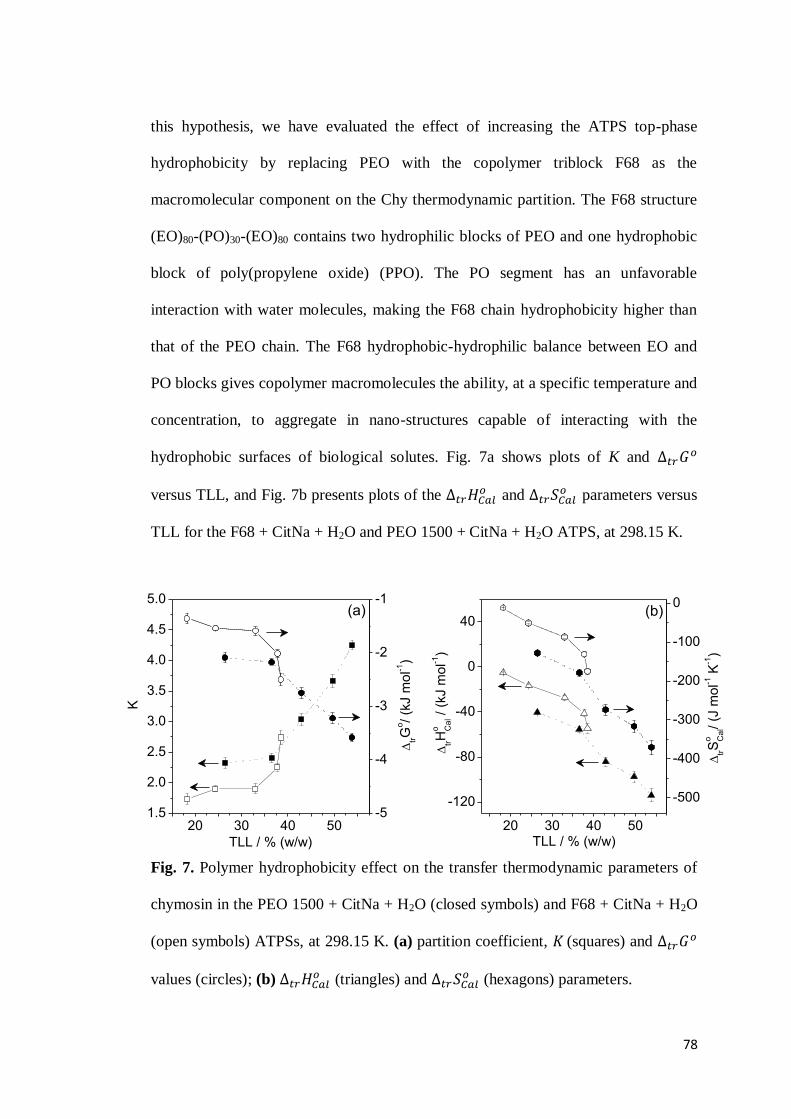
78
this hypothesis, we have evaluated the effect of increasing the ATPS top-phase
hydrophobicity by replacing PEO with the copolymer triblock F68 as the
macromolecular component on the Chy thermodynamic partition. The F68 structure
(EO)80-(PO)30-(EO)80 contains two hydrophilic blocks of PEO and one hydrophobic
block of poly(propylene oxide) (PPO). The PO segment has an unfavorable
interaction with water molecules, making the F68 chain hydrophobicity higher than
that of the PEO chain. The F68 hydrophobic-hydrophilic balance between EO and
PO blocks gives copolymer macromolecules the ability, at a specific temperature and
concentration, to aggregate in nano-structures capable of interacting with the
hydrophobic surfaces of biological solutes. Fig. 7a shows plots of K and
versus TLL, and Fig. 7b presents plots of the and parameters versus
TLL for the F68 + CitNa + H2O and PEO 1500 + CitNa + H2O ATPS, at 298.15 K.
1.5
2.0
2.5
3.0
3.5
4.0
4.5
5.0
20 30 40 50-5
-4
-3
-2
-1
K
TLL / % (w/w)
trG
o/ (k
J m
ol-1
)
(a)
-120
-80
-40
0
40
20 30 40 50
-500
-400
-300
-200
-100
0
trH
o Cal /
(kJ m
ol-1
)
TLL / % (w/w)
tr
So C
al/
(J m
ol-1
K-1)
(b)
Fig. 7. Polymer hydrophobicity effect on the transfer thermodynamic parameters of
chymosin in the PEO 1500 + CitNa + H2O (closed symbols) and F68 + CitNa + H2O
(open symbols) ATPSs, at 298.15 K. (a) partition coefficient, K (squares) and
values (circles); (b) (triangles) and (hexagons) parameters.
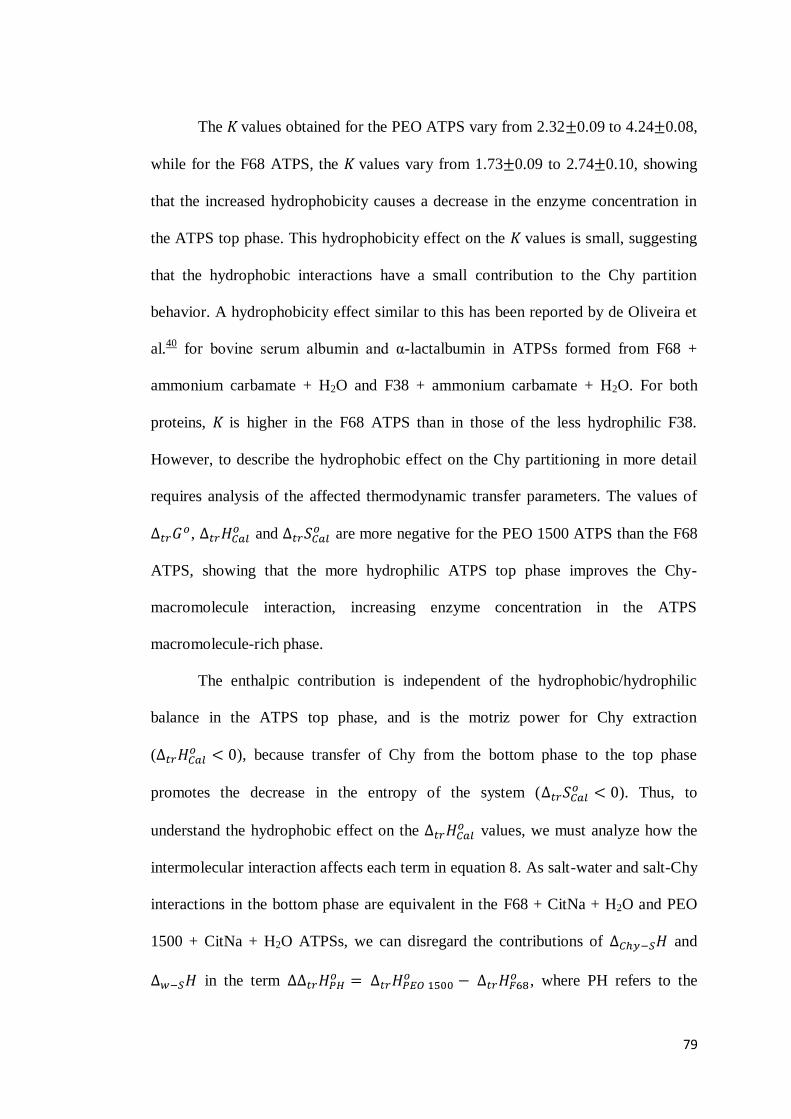
79
The K values obtained for the PEO ATPS vary from 2.32 0.09 to 4.24 0.08,
while for the F68 ATPS, the K values vary from 1.73 0.09 to 2.74 0.10, showing
that the increased hydrophobicity causes a decrease in the enzyme concentration in
the ATPS top phase. This hydrophobicity effect on the K values is small, suggesting
that the hydrophobic interactions have a small contribution to the Chy partition
behavior. A hydrophobicity effect similar to this has been reported by de Oliveira et
al.40 for bovine serum albumin and α-lactalbumin in ATPSs formed from F68 +
ammonium carbamate + H2O and F38 + ammonium carbamate + H2O. For both
proteins, K is higher in the F68 ATPS than in those of the less hydrophilic F38.
However, to describe the hydrophobic effect on the Chy partitioning in more detail
requires analysis of the affected thermodynamic transfer parameters. The values of , and are more negative for the PEO 1500 ATPS than the F68
ATPS, showing that the more hydrophilic ATPS top phase improves the Chy-
macromolecule interaction, increasing enzyme concentration in the ATPS
macromolecule-rich phase.
The enthalpic contribution is independent of the hydrophobic/hydrophilic
balance in the ATPS top phase, and is the motriz power for Chy extraction
( ), because transfer of Chy from the bottom phase to the top phase
promotes the decrease in the entropy of the system ( ). Thus, to
understand the hydrophobic effect on the values, we must analyze how the
intermolecular interaction affects each term in equation 8. As salt-water and salt-Chy
interactions in the bottom phase are equivalent in the F68 + CitNa + H2O and PEO
1500 + CitNa + H2O ATPSs, we can disregard the contributions of and in the term , where PH refers to the
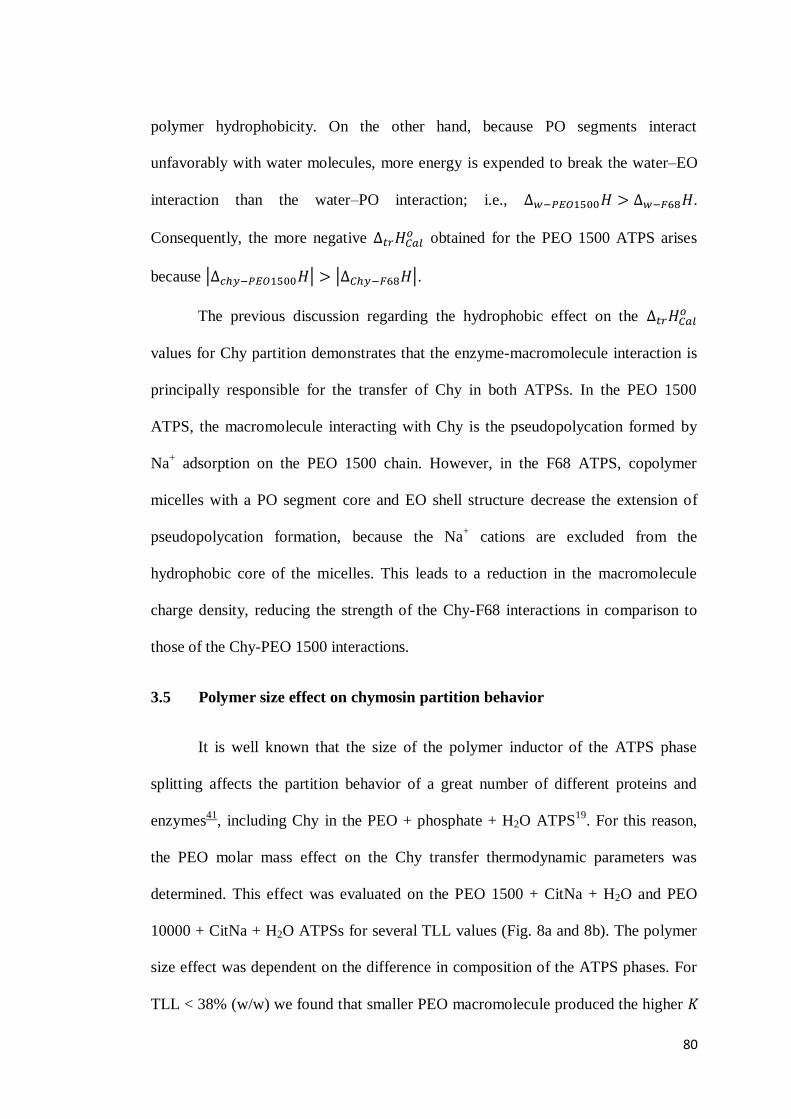
80
polymer hydrophobicity. On the other hand, because PO segments interact
unfavorably with water molecules, more energy is expended to break the water–EO
interaction than the water–PO interaction; i.e., .
Consequently, the more negative obtained for the PEO 1500 ATPS arises
because | | | |. The previous discussion regarding the hydrophobic effect on the
values for Chy partition demonstrates that the enzyme-macromolecule interaction is
principally responsible for the transfer of Chy in both ATPSs. In the PEO 1500
ATPS, the macromolecule interacting with Chy is the pseudopolycation formed by
Na+ adsorption on the PEO 1500 chain. However, in the F68 ATPS, copolymer
micelles with a PO segment core and EO shell structure decrease the extension of
pseudopolycation formation, because the Na+ cations are excluded from the
hydrophobic core of the micelles. This leads to a reduction in the macromolecule
charge density, reducing the strength of the Chy-F68 interactions in comparison to
those of the Chy-PEO 1500 interactions.
3.5 Polymer size effect on chymosin partition behavior
It is well known that the size of the polymer inductor of the ATPS phase
splitting affects the partition behavior of a great number of different proteins and
enzymes41, including Chy in the PEO + phosphate + H2O ATPS19. For this reason,
the PEO molar mass effect on the Chy transfer thermodynamic parameters was
determined. This effect was evaluated on the PEO 1500 + CitNa + H2O and PEO
10000 + CitNa + H2O ATPSs for several TLL values (Fig. 8a and 8b). The polymer
size effect was dependent on the difference in composition of the ATPS phases. For
TLL < 38% (w/w) we found that smaller PEO macromolecule produced the higher K
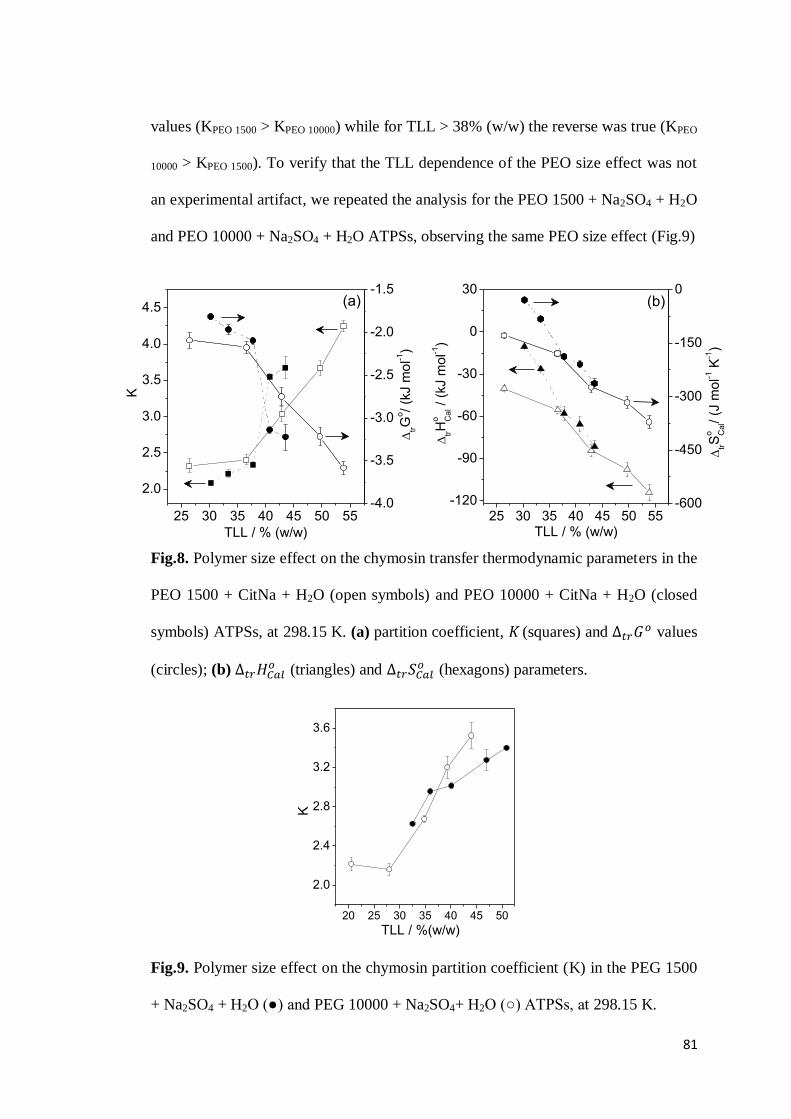
81
values (KPEO 1500 > KPEO 10000) while for TLL > 38% (w/w) the reverse was true (KPEO
10000 > KPEO 1500). To verify that the TLL dependence of the PEO size effect was not
an experimental artifact, we repeated the analysis for the PEO 1500 + Na2SO4 + H2O
and PEO 10000 + Na2SO4 + H2O ATPSs, observing the same PEO size effect (Fig.9)
2.0
2.5
3.0
3.5
4.0
4.5
25 30 35 40 45 50 55-4.0
-3.5
-3.0
-2.5
-2.0
-1.5
K
TLL / % (w/w)
tr
Go/ (k
J m
ol-1
)
(a)
-120
-90
-60
-30
0
30
25 30 35 40 45 50 55-600
-450
-300
-150
0
trH
o Cal /
(kJ m
ol-1
)
TLL / % (w/w)
tr
So C
al/
(J m
ol-1
K-1)
(b)
Fig.8. Polymer size effect on the chymosin transfer thermodynamic parameters in the
PEO 1500 + CitNa + H2O (open symbols) and PEO 10000 + CitNa + H2O (closed
symbols) ATPSs, at 298.15 K. (a) partition coefficient, K (squares) and values
(circles); (b) (triangles) and (hexagons) parameters.
20 25 30 35 40 45 50
2.0
2.4
2.8
3.2
3.6
TLL / %(w/w)
K
xxx
Fig.9. Polymer size effect on the chymosin partition coefficient (K) in the PEG 1500
+ Na2SO4 + H2O (●) and PEG 10000 + Na2SO4+ H2O (○) ATPSs, at 298.15 K.
82
The PEO size effect on the Chy values was very small, with | | | | around 0.5 kJ mol-1, where subscript PS
refers to the polymer size. For TLL < 38% (w/w), values are negative,
while for TLL > 38% (w/w) they are positive. However, is negative for all TLL studied, with values ranging from -29.90 1.06 to
-2.79 0.83 kJ mol-1, and increasing as TLL values increase. The same trend with
PEO size was observed for , with values
ranging from −157 4.50 to −11.57 1.12 kJ mol-1K-1.
Despite the substantial values of and , the values of are
small, showing that during the Chy transfer process an enthalpic-entropic
compensation occurs. In general, thermodynamic processes, such as protein
denaturation, which occur in multiple steps, lead to this entropy-enthalpy
compensation42. For TLL < 38% (w/w) is smaller for Chy-PEO 1500 system
because it possesses more interaction sites than the Chy-PEO 10000 system. The
smaller number of sites for Chy-PEO interaction observed with PEO 10000 is due to
entanglement of the longer polymer chains. As macromolecule concentration
increases; i.e., for TLL > 38% (w/w); the entanglement density in both PEO 1500
and PEO 10000 increased, causing a decrease in the number of interaction sites
available for Chy-PEO interaction. Hence, decreased. However, for
PEO 1500 system is even more negative than that for the PEO 10000 system. In
general, it is recognized that PEO of higher molar mass decreases the partitioning of
different solutes through a molecular exclusion mechanism, which is associated with
the large decrease in entropy caused by the transfer process8. However, our results
reveal that in the case of Chy the entropy decrease is higher for PEO 1500 than for
83
PEO 10000, demonstrating that factors other than the configurational entropy
change, such as intermolecular interaction, determine the PEO size effect on the Chy
transfer process and contribute to the motriz power of the system.
4. Conclusions
We evaluated the chymosin partition behavior by determining its transfer
thermodynamic parameters in ATPSs of different macromolecules + salts + water.
By analyzing , , and it was possible to determine the driving
forces responsible for concentrating the enzyme in the ATPS top phase. The motriz
power for chymosin transfer from the bottom to the top ATPS phase was the specific
and intense chymosin-macromolecule interaction, which increased with increasing
TLL, increasing hydrophilicity in the ATPS top phase, decreasing macromolecule
molar mass, and the use of lithium salts in ATPS. Our goal was the development of a
thermodynamic approach based on the determination of the solute that enables
all of the chymosin-ATPS component interactions participating in the enzyme
transfer process to be ascertained. We believe that this thermodynamic procedure can
be applied to others studies investigating solute partition in different ATPSs. Finally,
our detailed thermodynamic study of the chymosin partitioning in ATPSs can
contribute to the development of new theoretical models that more precisely describe
the driving forces associated with the partition of biological solutes in ATPSs.
84
5. References
[1] G.D. Rodrigues, L.R. de Lemos, L.H.M. da Silva, M.C.H. da Silva, Application of
hydrophobic extractant in aqueous two-phase systems for selective extraction of
cobalt, nickel and cadmium, J. Chromatogr. A. 1279 (2013) 13-19.
[2] L.R. de Lemos, R.A. Campos, G.D. Rodrigues, L.H.M. da Silva, M.C.H. da Silva,
Green separation of copper and zinc using triblock copolymer aqueous two-phase
systems, Sep. Purif. Technol. 115 (2013) 107-113.
[3] L.A.P. Alcântara, I.V. Amaral, R.C.F. Bonomo, L.H.M. da Silva, M.D.H. da
Silva, V.P.R. Minim, L.A. Minim, Partitioning of α-lactalbumin and β-
lactoglobulin from cheese whey in aqueous two-phase systems containing
poly (ethylene glycol) and sodium polyacrylate, Food. bioprod. process. 92
(2014) 409–415.
[4] S. Moreira, S.C. Silvério, E.A. Macedo, A.M.F. Milagres, J.A. Teixeira, S.I.
Mussatto, Recovery of Peniophora cinerea laccase using aqueous two-
phase systems composed by ethylene oxide/propylene oxide copolymer and
potassium phosphate salts, J. Chromatogr. A. 1321 (2013) 14– 20.
[5] H.S. Mohammadi, E. Omidinia, Process integration for the recovery and
purification of recombinant Pseudomonas fluorescens proline
dehydrogenase using aqueous two-phase systems, J. Chromatogr. B. 929
(2013) 11– 17.
[6] T. Matos, H.O. Johansson, J.A. Queiroz, L. Bulow, Isolation of PCR DNA
fragments using aqueous two-phase systems, Sep. Purif. Technol. 122
(2014) 144-148.
[7] J.M. de Alvarenga, R.A. Fideles, M.V. da Silva, G.F. Murari, J.G. Taylor,
L.R. de Lemos, G.D. Rodrigues, A.B. Mageste, Partition study of textile dye
Remazol Yellow Gold RNL in aqueous two-phase systems, Fluid. Phase.
Equilibr. 391 (2015) 1-8.
[8] A.B. Mageste, T.D.A. Senra, M.C.H. da Silva, R.C.F. Bonomo, L.H.M. da
Silva, Thermodynamics and optimization of norbixin transfer processes in
aqueous biphasic systems formed by polymers and organic salts, Sep. Purif.
Technol. 98 (2012) 69-77.
[9] L.M. Dominak, E.L. Gundermann, C.D. Keating, Microcompartmentation
85
in artificial cells: pH-induced conformational changes alter protein
localization, Langmuir. 26(8) (2010) 5697-5705.
[10] I. Fischer, C. Morhardt, S. Heissler, M. Franzreb, Partitioning behavior of
silica-coated nanoparticles in aqueous micellar two-phase systems: evidence
for an adsorption-driven mechanism from QCM-D and ATR-FTIR
measurements, Langmuir. 28 (2012) 15789−15796.
[11] G.Y. Ao, C.Y. Khripin, M. Zheng, DNA-controlled partition of carbon
nanotubes in polymer aqueous two-phase systems, J. Am. Chem. Soc. 136
(2014) 10383−10392.
[12] N.K. Subbaiyan, A.N.G. Parra-Vasquez, S. Cambre, M.A.S. Cordoba, S.E.
Yalcin, C.E. Hamilton, N.H. Mack, J.L. Blackburn, S.K. Doorn, J.G. Duque,
Bench-top aqueous two-phase extraction of isolated individual single-walled
carbon nanotubes, Nano. Res. 8(5) (2015) 1755–1769.
[13] D.P.C. de Barros, S.R.R. Campos, P.P. Madeira, A.M. Azevedo, A.M.
Baptista, M.R. Aires-Barros, Modeling the partitioning of amino acids in
aqueous two phase systems, J. Chromatogr. A. 1329 (2014) 52– 60.
[14] P.P. Madeiraa, A. Bessaa, D.P.C. de Barros, M.A. Teixeira, L. Álvares-
Ribeiro, M.R. Aires-Barros, A.E. Rodrigues, A. Chaite, B.Y. Zaslavskye,
Solvatochromic relationship: Prediction of distribution of ionic solutes in
aqueous two-phase systems, J. Chromatogr. A. 1271 (2013) 10-16.
[15] K. Berggren, A. Wolf, J.A. Asenjo, B.A. Andrews, F. Tjerneld, The surface
exposed amino acid residues of monomeric proteins determine the
partitioning in aqueous two-phase systems, Biochim. Biophys. Acta. 1596
(2002) 253-268.
[16] H.O. Johansson, G. Karlstrom, F. Tjerneld, C.A. Haynes, Driving forces for
phase separation and partitioning in aqueous two-phase systems, J.
Chromatogr. B. 711 (1998) 3–17.
[17] L.H.M. da Silva, M.D.H. da Silva, J. Amin, J.P. Martins, J.S.D. Coimbra,
L.A. Minim, Hydrophobic effect on the partitioning of [Fe(CN)5(NO)]2−
and [Fe(CN)6]3− anions in aqueous two-phase systems formed by triblock
copolymers and phosphate salts, Sep. Purif. Technol. 60 (2008) 103-112.
[18] I.S.B. do Nascimento, J.S.R. Coimbra, J.P. Martins, L.H.M. da Silva,
86
R.C.F. Bonomo, M.R. Pirozzi, A. Cinquini, Partitioning of glutenin flour of
special wheat using aqueous two-phase systems, J. Cereal Sci. 52 (2010)
270-274.
[19] G. Reh, D. Spelzini, G. Tubio, G. Pico, B. Farruggia, Partition features and
renaturation enhancement of chymosin in aqueous two-phase systems, J.
Chromatogr. B. Analyt. Technol. Biomed. Life. Sci. 860 (2007) 98-105.
[20] D. Spelzini, B. Farruggia, G. Pico, Features of the acid protease partition in
aqueous two-phase systems of polyethylene glycol-phosphate: chymosin
and pepsin, J. Chromatogr. B. Analyt. Technol. Biomed. Life. Sci. 821
(2005) 60-66.
[21] D. Spelzini, G. Pico, B. Farruggia, Dependence of chymosin and pepsin
partition coefficient with phase volume and polymer pausidispersity in
polyethyleneglycol-phosphate aqueous two-phase system, Colloid. Surface.
B. 51 (2006) 80-85.
[22] W.Y. Chen, H.M. Huang, C.C. Lin, F.Y. Lin, Y.C. Chan, Effect of
temperature on hydrophobic interaction between proteins and hydrophobic
adsorbents: studies by isothermal titration calorimetry and the van’t Hoff
equation, Langmuir. 19 (2003) 9395-9403.
[23] L.H.M. da Silva, M.C.H. da Silva, K.R. Francisco, M.V.C. Cardoso, L.A.
Minim, J.S.R. Coimbra, PEO-[M(CN)5NO]x- (M = Fe, Mn, or Cr)
interaction as a driving force in the partitioning of the
pentacyanonitrosylmetallate anion in ATPS: Strong effect of the central
atom, J. Phys. Chem. B 112 (2008) 11669–11678.
[24] F. Gustavsson, M. Glantz, A.J. Buitenhuis, H. Lindmark-Månsson, H.
Stålhammar, A. Andrén, M. Paulsson, Factors influencing chymosin-
induced gelation of milk from individual dairy cows: Major effects of casein
micelle size and calcium, Int. Dairy J. 39 (2014) 201-208.
[25] N. Wanga, K.Y. Wang, G.Q. Li, W.F. Guo, D.u. Liu, Expression and
characterization of camel chymosin in Pichia pastoris, Protein. Expres.
Purif. 111 (2015) 75–81.
[26] D.S. Palmer, A.U. Christensen, J. Sorensen, L. Celik, K.B. Qvist, B. Schiott,
Bovine chymosin: a computational study of recognition and binding of
87
bovine kappa-casein, Biochemistry. 49 (2010) 2563–2573.
[27] J.F. Hsieh, P.H. Pan, Proteomic profiling of the coagulation of milk proteins
induced by chymosin, J. Agric. Food. Chem. 60 (2012) 2039-2045.
[28] G.D. Rodrigues, L.D. Teixeira, G.M.D. Ferreira, M.D.H. da Silva, L.H.M.
da Silva, R.M.M. de Carvalho, Phase diagrams of aqueous two-phase
systems with organic salts and F68 triblock copolymer at different
temperatures, J. Chem. Eng. Data 55 (2010) 1158–1165.
[29] P.D. Patrício, A.B. Mageste, L.R. de Lemos, R.M.M. de Carvalho, L.H.M.
da Silva, M.C.H. da Silva, Phase diagram and thermodynamic modeling of
PEO+organic salts+H2O and PPO+organic salts+H2O aqueous two-phase
systems, Fluid. Phase. Equilibr. 305 (2011) 1-8.
[30] J.P. Martins, C.D. Carvalho, L.H.M. da Silva, J.S.D. Coimbra, M.D.H. da
Silva, G.D. Rodrigues, L.A. Minim, Liquid–liquid equilibria of an aqueous
two-phase system containing poly(ethylene) glycol 1500 and sulfate salts at
different temperatures, J. Chem. Eng. Data 53 (2008) 238–241.
[31] A. Bakk, R. Metzler, Two states do not necessarily correspond to a two-
state transition: van't Hoff enthalpy in the case of a small entropy difference
between the states, Chem. Phys. Let. 398 (2004) 190–193.
[32] R.I. Boysen, Y. Wang, H.H. Keah, M.T.W. Hearn, Observations on the
origin of the non-linear van’t Hoff behaviour of polypeptides in
hydrophobic environments, Biophys. Chem. 77 (1999) 79-97.
[33] L.H.M. da Silva, M.C.H. da Silva, R.A.N. de Aquino, K.R. Francisco,
M.V.C. Cardoso, L.A. Minim, J.S.R. Coimbra, Nitroprusside-PEO enthalpic
interaction as a driving force for partitioning of the [Fe(CN)5NO]2- anion in
aqueous two-phase systems formed by poly(ethylene oxide) and sulfate
salts, Journal of Physical Chemistry B 110 (2006) 23540-23546.
[34] C.A.S. da Silva, J.S.R. Coimbra, E.E.G. Rojas, L.A. Minim, L.H.M. da
Silva, Partitioning of caseinomacropeptide in aqueous two-phase systems, J.
Chromatogr. B. Analyt. Technol. Biomed. Life. Sci. 858 (2007) 205-210.
[35] F.C. de Oliveira, J.S.D. Coimbra, L.H.M. da Silva, E.E.G. Rojas, M.D.H.
da Silva, Ovomucoid partitioning in aqueous two-phase systems, Biochem.
Eng. J. 47 (2009) 55-60.
88
[36] A.B. Mageste, L.R. de Lemos, G.M.D. Ferreira, M.D.H. da Silva, L.H.M.
da Silva, R.C.F. Bonomo, L.A. Minim, Aqueous two-phase systems: An
efficient, environmentally safe and economically viable method for
purification of natural dye carmine, J. Chromatogr. A. 1216 (2009) 7623-
7629.
[37] L.H.M. da Silva, W. Loh, Calorimetric investigation of the formation of
aqueous two-phase systems in ternary mixtures of water, poly(ethylene
oxide) and electrolytes (Or Dextran), J. Phys. Chem. B 104 (2000) 10069-
10073.
[38] M. Rampilli, R. Larsen, M. Harboe, Natural heterogeneity of chymosin and
pepsin in xtracts of bovine stomachs, Int. Dairy J. 15 (2005) 1130-1137.
[39] C.A.A. Malak, I.F.G. AbouElAdab, V. Vukashinovic, I.A. Zalunin, E.A.
Timokhina, G.I. Lavrenova, V.M. Stepanov, Buffalo (Bos buffali L.)
chymosin purification and properties, Comp. Biochem. Physiol. 113B
(1996) 57-62.
[40] M.C. de Oliveira, M.A.N. de Abreu, P.D. Pessoa, Phase equilibrium and
protein partitioning in aqueous two-phase systems containing ammonium
carbamate and block copolymers PEO–PPO–PEO, Biochem. Eng. J. 37
(2007).
[41] J.A. Asenjo, B.A. Andrews, Aqueous two-phase systems for protein
separation: A perspective, J. Chromatogr. A. 1218 (2011) 8826– 8835.
[42] J.C. Huang, Liquid crystal solutions at infinite dilution: Enthalpy–entropy
compensation of solutes transfer properties between phases, Fluid. Phase.
Equilibr. 372 (2014) 1-6.
89
6. Considerações finais
Novos sistemas aquosos bifásicos (SABs) Macromolécula + sal orgânico +
água foram formados neste trabalho (capitulo 1) devido à falta de SABs
ambientalmente seguros para sua aplicação em nível industrial. As diferentes etapas
da pesquisa mostraram que estes sistemas precisam de menor concentração de sal e
polímero que os sistemas formados com sais inorgânicos. Por outro lado, os sistemas
formados foram entropicamente dirigidos, sendo que o processo de segregação de
fases é endotérmico e favorecido pela temperatura. Além disso, foi demostrado que o
sal orgânico formador do SAB afeta a posição da curva binodal do diagrama de
fases.
Alguns dos novos sistemas obtidos juntamente com SABs reportados na
literatura foram aplicados no estudo termodinâmico de transferência da enzima
quimosina. Demonstramos nesta pesquisa que o processo de transferência da enzima
é entalpicamente dirigido e ocorre com compensação entrópica/entálpica. A partir da
técnica de calorimetria de titulação isotérmica foi proposto um método para
determinar as contribuições energéticas das principais interações intermoleculares
que ocorrem no processo de partição sobre a entalpia de transferência da quimosina,
mostrando que a interação quimosina-macromolécula é a responsável pela
transferência da quimosina da fase inferior para a fase superior. Espera-se que este
método seja aplicado nos processos de partição de diferentes solutos biológicos e
inorgânico, para compreender o porquê da transferência destes solutos nos SABs.