Embed Size (px)
Citation preview
Diversidade Genética e Padrões Filogeográficos da
Lontra Neotropical (Lontra longicaudis [Olfers, 1818]);
(Mammalia: Mustelidae)
Cristine Silveira Trinca

Pontifícia Universidade Católica do Rio Grande do Sul
Faculdade de Biociências
Programa de Pós-Graduação em Biociências - Zoologia
Diversidade Genética e Padrões Filogeográficos da
Lontra Neotropical (Lontra longicaudis [Olfers, 1818]);
(Mammalia: Mustelidae)
Cristine Silveira Trinca
Orientador: Prof. Dr. Eduardo Eizirik
Dissertação de Mestrado
Porto Alegre – RS – Brasil
2007

Agradecimentos
Agradeço a todos os colegas do Genoma, por tornarem o ambiente tão agradável e
descontraído para trabalhar e por sempre estarem dispostos a ajudar. Um agradecimento
especial a Lari, pela ajuda nas análises dos microssatélites e a Cladi, por quebrar todos os
galhos e fazer com muita eficiência o seu trabalho, deixando o nosso um pouco mais fácil.
Às minhas amigas queridas, colegas de trabalho e parceiras de futebol Taia e Aninha,
que fazem do laboratório não só um local de trabalho, mas também um lugar para rir, chorar e
fazer terapia de grupo. Muito obrigada por toda a ajuda e por serem pessoas tão especiais
que eu tive a sorte de conhecer.
Ao Manoel, amigo e colega, por me ensinar as regras básicas do funcionamento do
Genoma, por toda a ajuda e também pela amizade e carinho.
A todo o grupo de “carnivorólogos”, um grupo formado há pouco tempo, mas bastante
unido, que sempre contribuiu com discussões científicas permeadas por momentos de intensa
descontração.
À Ana Paula Brandt e a Tatiane C. Trigo, à primeira por me apresentar às lontras, e à
segunda pela paciência em ensinar extrair DNA e a fazer PCR; as duas, sem saber, mudaram
todo o caminho que eu havia planejado.
A todos os pesquisadores e instituições que colaboraram com o projeto através do
envio de amostras.
Aos amigos que trabalham em campo, e que se lembravam de mim ao encontrar uma
lontra atropelada ou uma amostra de fezes e prontamente coletavam material.
Ao Professor Thales R. O. de Freitas por me aceitar em seu laboratório no começo da
graduação, me dando a oportunidade de conhecer e trabalhar na área que me fascina, a
genética da conservação.
Ao Duda, meu orientador e amigo, pela confiança, pelo grande aprendizado, por me
ensinar a ser mais autônoma e confiante de minhas capacidades.

Às amigas Paula Rohr, Andréa Wieck e Fernanda Pedone pela amizade, pelos momentos
de ócio e stress compartilhado, pelas discussões filosóficas, pelos questionamentos sobre o
futuro e também pelas orgias gastronômicas e bagunças feitas juntas.
Ao Ernesto, por me ajudar na elaboração das figuras para esta dissertação bem como
na revisão dos textos, mas principalmente por todo amor, carinho, companheirismo, amizade e
também pela imensa paciência nos últimos meses. Por estar sempre presente comemorando as
minhas vitórias e me animando sempre que preciso.
À Família Schmidt, pelo carinho e por me tratar quase como filha.
À minha família, em especial à minha mãe, por toda a compreensão, carinho e amizade e
que apesar de não entender bem o que eu faço, ao menos tenta, e ao meu pai, por todo o apoio,
preocupação e amor. À minha irmã querida, que mesmo à distância sempre transmite seu amor
através de palavras de carinho e incentivo, e diz a verdade, mesmo quando não é exatamente o
que eu quero ouvir.
Às lontras, por serem organismos tão interessantes e desafiadores.
Ao CNPq pela bolsa de mestrado concedida.
Ao Instituto Pró-Carnívoros, pelo apoio financeiro.

Sumário
Resumo .......................................................................................................................................... VI
Capítulo I – Introdução Geral ........................................................................................................ VII
Capítulo II – Artigo: “Phylogeographic Patterns and Evolutionary History of the Neotropical otter (Lontra longicaudis)”.................................... XIV
Abstract …………………………………………………………….… XVII
Introduction ………………………………………………………….. XVIII
Materials and Methods …………………………………………….... XIX
Results ………………………………………………………………. XXIII
Discussion………………………………………………………….. XXVIII
References ………………………………………………………..… XXXI
Figure Legends ………………………………………………….. XXXVIII
Tables ……………………………………………………………...…… XL
Figures ........................................................................................ XLVII
Capítulo III – Discussão Geral ..................................................................................................... LVII
Capítulo IV – Referências Bibliográficas ..................................................................................... LXII

VI
Resumo
O conhecimento sobre a estruturação geográfica da diversidade genética em populações
naturais permite inferir os processos históricos atuantes sobre as espécies e é fundamental para o
planejamento de estratégias eficazes de conservação biológica. Neste contexto, o presente
estudo é o primeiro a identificar e caracterizar a variabilidade genética, padrões de estruturação
populacional e história demográfica de Lontra longicaudis. Para tanto, foram utilizados três
segmentos do DNA mitocondrial (mtDNA; porção hipervariável I da região controladora, gene
ATP8 e gene ND5), bem como 12 locos de microssatélite, em indivíduos amostrados em
diferentes regiões de sua distribuição geográfica. Ambos os marcadores revelaram moderados a
altos níveis de variabilidade genética e padrões filogeográficos claros, os quais sugerem que as
populações brasileiras desta espécie encontram-se geneticamente diferenciadas das outras
regiões amostradas a Noroeste da América do Sul. As análises de mtDNA indicam a provável
existência de quatro entidades filogeográficas: Colômbia, Bolívia, Guiana Francesa/Peru e Brasil.
Colômbia e Bolívia foram representadas por apenas um indivíduo cada, os quais revelaram
grande divergência genética dos outros indivíduos amostrados, sugerindo profunda subdivisão
filogeográfica envolvendo estas regiões. A alopatria entre Guiana Francesa e Brasil é quase
completa, sugerindo que a incongruência entre filogenia e geografia possa ser decorrente de um
processo de colonização ancestral no sentido Norte-Sul. A inferência de diferenciação genética
entre Brasil e as outras áreas amostradas na América do Sul são apoiadas pelas análises de
microssatélite. Os resultados obtidos a partir das análises de mtDNA indicam ausência de
estruturação genética no Brasil e são indicativos de um cenário de expansão populacional recente
nesta região. Os padrões observados neste estudo têm implicações para a conservação de
populações naturais de Lontra longicaudis. As quatro entidades filogeográficas reconhecidas
demonstram-se suficientemente diferenciadas e deveriam, portanto, ser conservadas e manejadas
independentemente. Estudos adicionais são necessários para melhorar o conhecimento sobre
estas populações, bem como para investigar a existência de outras unidades demográficas ao
longo da distribuição da lontra Neotropical.

Capítulo I – Introdução Geral

VIII
A Família Mustelidae
A Família Mustelidae compreende atualmente 25 gêneros e 67 espécies (Nowak 1999)
colocadas em cinco subfamílias: Mustelinae, Melinae, Taxiidinae, Mellivorinae e Lutrinae (Dragoo
& Honeycutt 1997; Koepfli & Wayne 2003; Flynn et al. 2005; Fulton & Strobeck 2006). Esta família
compreende carnívoros de médio porte, dentre os quais se encontram os furões, texugos, lontras,
martas e doninhas. Os membros desta família apresentam geralmente o corpo alongado, as patas
relativamente curtas, e normalmente possuem uma cauda longa (Eisenberg & Redford 1999).
Mustelídeos habitam todos os continentes, exceto Austrália e Antártica, e não ocorrem em
Madagascar nem em ilhas oceânicas. Membros desta família podem ser encontrados em
ambiente terrestre, de água doce ou marinho. São principalmente carnívoros, e várias espécies
incluem uma grande diversidade de vertebrados e invertebrados em sua dieta (Nowak 1999; Sato
et al. 2003).
A Subfamília Lutrinae
A subfamília Lutrinae compreende 13 espécies de lontras, distribuídas em seis gêneros:
Aonyx, Enhydra, Lutrogale, Pteronura, Lutra e Lontra (Kruuk 2006). Recentemente, Zyll de Jong
(1987) forneceu evidências filogenéticas de que as lontras do Novo Mundo (exceto Pteronura), até
então incluídas no gênero Lutra, deveriam passar a compor um novo gênero, Lontra, o qual inclui
quatro espécies: Lontra provocax, L. felina, L. canadensis e L. longicaudis (Kruuk 2006).
As lontras encontram-se distribuídas por todos os continentes, exceto Austrália e Antártica
(Foster-Turley et al. 1990). Na região Neotropical ocorrem quatro espécies de lontras: Lontra
provocax, L. felina, L. longicaudis e Pteronura brasiliensis (Chehébar 1990). Duas destas espécies
de lontras ocorrem no Brasil, a lontra neotropical (Lontra longicaudis) e a ariranha ou lontra
gigante (Pteronura brasiliensis) (Chehébar 1990), sendo que em algumas regiões do país estas
ocorrem em simpatria. Ambas foram intensamente caçadas para utilização da pele até a década
de 1980 (Duarte & Rebelo 1985), apesar de a caça ter se tornado uma atividade proibida por lei
desde 1967, em todo o território nacional.
A Lontra Neotropical
A lontra neotropical é um carnívoro de médio porte, de coloração marrom-pardacenta,
quase preta, tendo apenas o lado ventral e o focinho amarelados. Possui grandes vibrissas que
auxiliam na localização de presas embaixo d’água (Cimardi 1996). Suas patas apresentam

IX
membranas interdigitais e sua cauda é longa e levemente achatada na extremidade, sendo ambas
as estruturas adaptadas para a locomoção na água (Silva 1994).
É uma espécie de hábito semi-aquático, ocorrendo em uma grande variedade de habitats,
em rios, lagos, pequenos canais, banhados e também ambientes marinhos associados a cursos
d’água (p.ex. nos Estados de Santa Catarina e Rio de Janeiro) (Blacher 1987; Mason 1990;
Fonseca et al. 1994); pode ser encontrada em uma ampla faixa de gradiente altitudinal (desde
regiões litorâneas até cerca de 3.000 m de altitude) (Emmons 1990; IBAMA 1997). A dieta desta
espécie, como a da maioria das espécies de lontras, consiste basicamente de peixes, crustáceos
e moluscos, podendo ser complementada por aves, pequenos mamíferos, anfíbios e insetos
(Chebez 1999).
Trata-se de uma das espécies de lontras menos conhecidas, sendo que as pesquisas
realizadas até o momento são geograficamente restritas e direcionadas a estudos do hábito
alimentar (Gallo 1986, 1989, 1997; Passamani & Camargo 1995; Spinola & Vaughan 1995; Parera
1996; Soldateli & Blacher 1996; Helder & De Andrade 1997; Pardini 1998; Colares & Waldemarin
2000; Quadros & Monteiro-Filho 2000, 2001; Utreras et al. 2002), distribuição local (Waldemarin
1997; Lacomba et al., 2001), uso de abrigos como tocas e locais de descanso (Gallo 1989;
Spinola & Vaughan 1995; Pardini 1999; Waldemarin & Colares 2000) e freqüência de marcação
(Soldateli & Blacher 1996; Spinola & Vaughan 1995). Além disso, estudos sobre reprodução e
fisiologia da espécie foram realizados apenas em cativeiro (Colares & Silva 1987; Colares & Best
1991; Parera 1996).
A distribuição geográfica atual da espécie é pouco conhecida, embora seja descrita como
ocorrendo amplamente, ao longo de uma faixa contínua que inicia no México, cobrindo
praticamente todo continente sul-americano e terminando no nordeste da Província de Buenos
Aires (Argentina) e sul do Uruguai, alcançando também o norte do Peru (Chehébar 1990; Chebez
1999; Eisenberg & Redford 1999), e estando distribuída em todo o território brasileiro (Emmons
1990).
Em termos de status de conservação em nível internacional, L. longicaudis é considerada
como tendo “Dados Insuficientes” pela IUCN (IUCN 2006), e está incluída no Apêndice I
(“Espécies ameaçadas”) da CITES (“Convention on International Trade in Endangered Species of
Wild Fauna and Flora”) (IUCN 2006). No Brasil, esta espécie é categorizada como “Quase
Ameaçada” (IBAMA 2004), embora em Estados como Minas Gerais, São Paulo, Paraná e Rio
Grande do Sul esteja classificada como “Vulnerável” (Paraná 1995; Machado et al. 1998; São
Paulo 1998; Indrusiak & Eizirik 2003).
Dentre as principais ameaças a esta espécie encontram-se os conflitos com pescadores e
proprietários de criadouros de peixes, o desmatamento e outras alterações antrópicas das

X
margens dos rios (Macdonald & Mason 1985). A poluição das águas também é uma grave
ameaça à espécie, uma vez que pode ter influência indireta ou direta na estabilidade das
populações de lontras. Danos indiretos referem-se à diminuição do estoque de alimento e
contaminação do ambiente. Efeitos diretos causam impacto no animal, resultando em sua morte
ou reduzindo seu sucesso reprodutivo (Macdonald & Mason 1990). Além disso, freqüentemente
são mortas por atropelamentos em estradas (Macdonald & Mason 1990) e a alta densidade
populacional humana também é citada como um fator que pode levar ao seu desaparecimento
(Fonseca et al. 1994; IBAMA 1997).
Estruturação Geográfica de Populações Naturais – Inferências Evolutivas e
Implicações para a Conservação
Uma das principais metas da Biologia da Conservação é a preservação da biodiversidade
e a manutenção dos padrões e processos evolutivos que a geraram; para tal, é necessário
elaborar programas adequados de conservação, nos quais deve ser decidido o que e como
proteger (Johnson et al. 2001). Assim, uma área recente da Biologia, conhecida como Genética da
Conservação, tem auxiliado na tomada destas decisões geralmente através da utilização de
marcadores moleculares, os quais são em parte responsáveis pela possibilidade de estudar
aspectos complexos de espécies e populações ameaçadas em condições naturais. A utilização de
técnicas moleculares para este fim tem se expandido muito nas últimas duas décadas, sendo
acompanhada também de uma crescente aceleração no desenvolvimento de métodos
laboratoriais e analíticos empregados nestas abordagens (Frankham et al. 2002; Hey & Machado
2003; Luikart et al. 2003; DeSalle & Amato 2004; DeYoung & Honeycutt 2005; Kohn et al. 2006).
O conceito de filogeografia foi introduzido por Avise et al. (1987) para designar o estudo da
distribuição da variabilidade genética de uma espécie em uma escala espacial e temporal. Os
estudos filogeográficos têm por objetivo revelar a história evolutiva de uma linhagem,
relacionando-a com sua distribuição geográfica, através, principalmente, das diferenças entre
seqüências de DNA mitocondrial (mtDNA) (Avise 2000), utilizando as explicações geográficas
históricas para interpretar as relações evolutivas entre os taxa (Stevens & Hogg 2003). Análises
de padrões filogeográficos permitem a verificação de estruturação genética e a interpretação das
possíveis barreiras ao fluxo gênico dentro e entre as espécies (p.ex. Eizirik et al. 2001), gerando
um aumento do conhecimento sobre os processos históricos biogeográficos.
Além da análise dos níveis de diversidade genética, o acesso à distribuição geográfica
desta variabilidade dentro de uma espécie é também de extrema importância para identificar e
priorizar áreas nas quais programas de manejo e conservação devem ser elaborados (Moritz &
Faith 1998). É fundamental avaliar se a espécie apresenta uma distribuição homogênea da

XI
variabilidade genética ou algum grau de subdivisão, pois, no primeiro caso, qualquer área de sua
distribuição é representativa da espécie enquanto que, havendo estruturação, a
representatividade de cada sub-população deve ser preservada.
Assim, a partir de estudos de filogeografia podem-se identificar dois tipos de linhagens
evolutivas para fins de manejo: (i) Unidades Evolutivamente Significativas (“Evolutionarily
Significant Units” - ESUs) e (ii) Unidades de Manejo (“Management Units” - MUs). As primeiras
são constituídas por unidades demográficas infra-específicas, distintas geograficamente e que se
apresentam diferenciadas geneticamente (implicando isolamento histórico) de outras unidades
semelhantes contidas na mesma espécie. As Unidades de Manejo estão contidas nas ESUs, e
são formadas por populações regionais com restrita conexão demográfica entre si, mas não
necessariamente com diferenciação genética profunda. Entretanto, em uma escala de tempo curta
(uma ou poucas gerações), o contato entre estas populações através de migração ou re-
colonização torna-se escasso, transformando-as em entidades ecológicas relativamente
separadas, e que deveriam ser manejadas de forma independente ou coordenada (Ryder 1986;
Moritz 1994; Eizirik 1996; Crandall et al. 2000; Fraser & Bernatchez 2001; Frankham et al. 2002)
Utilização de Marcadores Moleculares em Estudos Evolutivos e Populacionais
Entre os marcadores moleculares mais freqüentemente empregados em estudos
populacionais, evolutivos e/ou voltados para conservação destaca-se o DNA mitocondrial
(mtDNA), como marcador de diversidade genética, sendo também muito útil em investigações
sobre relações filogenéticas entre diferentes taxa e identificação de subdivisão geográfica entre
unidades populacionais (Avise et al. 1987; Bermingham & Moritz 1998; Avise 2000).
Duas razões justificam a ampla utilização do polimorfismo de mtDNA na reconstrução de
filogenias moleculares: primeiro, o mtDNA representa a parte mais bem conhecida do genoma
animal e, segundo, a taxa de evolução do mtDNA é 5 a 10 vezes mais rápida do que a dos locos
nucleares de cópia única na maioria das espécies de mamíferos (Avise et al. 1992; Baker et al.
1993; Martin & Palumbi 1993; Ballard & Whitlock 2004).
De um modo geral, mtDNA animal apresenta duas características que podem ser vistas em
alguns contextos como vantagens sobre os marcadores nucleares: (i) a relação filogenética do
mtDNA reflete a história de linhagens maternas dentro de uma população ou espécie; (ii) o
tamanho efetivo da população do genoma mitocondrial é de ¼ comparada aos genes
autossômicos, levando a uma maior taxa de diferenciação local por deriva aleatória (Neigel &
Avise 1986).
Além do mtDNA, o DNA nuclear tem se tornado cada vez mais utilizado em estudos
evolutivos e populacionais. Dentre os marcadores nucleares mais amplamente empregados
XII
encontram-se os microssatélites. Estes marcadores consistem de segmentos curtos de DNA (1-6
pares de bases), que se repetem em número variável em tandem, sendo em sua maioria,
repetições de mono, tetra ou, principalmente, dinucleotídeos, apresentando-se como locos
altamente polimórficos dispersos amplamente em genomas eucarióticos (Schlötterer 1998;
Schlötterer 2004).
As características apresentadas pelos microssatélites (alto nível de polimorfismo, alta taxa
de mutação, e tendência à neutralidade seletiva) permitem a sua utilização em estudos como
comparação da variação genética entre espécies e populações (Johnson et al. 1999; Wisely et al.
2002), grau de estrutura das populações e migração (Ciofi & Bruford 1999; Waits et al. 2000;
Cegelski et al. 2003) e determinação de parentesco e estrutura social (Nesje et al. 2000), os quais
são extremamente necessários para o desenho de estratégias para a conservação de espécies
ameaçadas. Além disso, permitem a utilização de DNA altamente fragmentado, em pequenas
quantidades ou até mesmo de amostras antigas (Bruford & Wayne 1993).
Estudos Genéticos e Moleculares com Mustelídeos
O papel dos carnívoros na regulação de comunidades e manutenção da biodiversidade
vem sendo amplamente discutido nas últimas décadas (Kitching 1986; Fonseca & Robinson 1988;
Terborgh 1990, 1992; Wright et al. 1994; Asquith et al. 1997). Estudos realizados com a lontra
marinha (Enhydra lutris), por exemplo, identificaram a importância desta espécie na manutenção
da biodiversidade das comunidades marinhas onde vive (Kitching 1986). A lontra neotropical, por
sua vez, além de ser um carnívoro, é uma das únicas espécies de maior porte que ocupa esta
posição nas cadeias alimentares de ambientes aquáticos onde ocorre e, assim, pode
desempenhar uma importante função na regulação das comunidades destes sistemas. Apesar de
ter sofrido com a caça excessiva no passado, atualmente a lontra neotropical parece estar
distribuída de forma ampla no Brasil, ocorrendo inclusive em áreas moderadamente urbanizadas e
onde problemas ambientais como poluição orgânica e desmatamento da mata ciliar estão
presentes. No entanto, os registros de extinções locais sofridas pela lontra euro-asiática (Lutra
lutra) em vários países europeus, e pela lontra norte-americana (Lontra canadensis) em diversas
localidades dos Estados Unidos, demonstram que mesmo espécies altamente adaptáveis e
flexíveis podem sofrer declínios populacionais extremos perante modificações ambientais intensas
(Foster-Turley et al. 1990; Swimley et al. 1998; Reuther et al. 2000). Embora a lontra neotropical
seja uma espécie considerada como apresentando algum grau de tolerância à presença humana,
pouco se sabe sobre os efeitos desta aproximação sobre as populações de L. longicaudis.
Estudos genéticos e moleculares sobre os mustelídeos realizados até o momento são
principalmente direcionados à lontra euro-asiática (Lutra lutra) (Dallas & Piertney 1998; Dallas et
XIII
al. 1999; Mucci et al. 1999; Dallas et al. 2000; Dallas et al. 2002; Randi et al. 2003; Arrendal et al.
2004; Huang et al. 2005), lontra norte-americana (L. canadensis) (Serfass et al. 1998; Blundell et
al. 2002; Beheler et al. 2004; Beheler et al. 2005), texugo euro-asiático (Meles meles) (Frantz et al.
2003; Pope et al. 2005), glutão ou carcaju (Gulo gulo) (Walker et al. 2001; Kyle & Strobeck 2001) e
marta-americana (Martes americana) (Broquet et al. 2006).
Os únicos estudos genéticos incluindo L. longicaudis publicados até o momento são
análises filogenéticas da família Mustelidae e da Subfamília Lutrinae como um todo, os quais não
abordam quaisquer aspectos específicos desta lontra em particular (Zyll de Jong 1987; Koepfli &
Wayne 1998; Marmi et al. 2004; Koepfli & Wayne 2003). Sendo assim, não existe até o momento
qualquer estudo publicado voltado para a investigação de parâmetros genéticos das populações
de L. longicaudis.
O presente estudo tem por objetivo, através da utilização da variação em seqüências do
mtDNA e microssatélites, (1) identificar e caracterizar subdivisões geográficas em populações de
Lontra longicaudis, e (2) a partir dos padrões observados inferir os processos históricos que
atuaram sobre esta espécie, bem como comparar os padrões encontrados com aqueles descritos
para outras espécies de vertebrados, além de avaliar o desempenho destes marcadores para
estudos evolutivos e populacionais de mustelídeos.

Capítulo II - Artigo

XV
“Phylogeographic Patterns and Evolutionary History of the
Neotropical otter (Lontra longicaudis)”
CRISTINE S. TRINCA, HELEN F. WALDEMARIN, KLAUS-PETER KOEPFLI, BENOIT DE THOISY and
EDUARDO EIZIRIK
A ser submetido à revista ‘Molecular Ecology’

XVI
Phylogeographic Patterns and Evolutionary History of the Neotropical otter 1
(Lontra longicaudis) 2
CRISTINE S. TRINCA 1, HELEN F. WALDEMARIN 2, KLAUS-PETER KOEPFLI 3, BENOIT 3
DE THOISY 4, EDUARDO EIZIRIK1, 5 4
5
1 Faculdade de Biociências, PUCRS, Porto Alegre, Brazil. 6
2 Projeto Ecolontras/Associação Ecológica Ecomarapendi, Rio de Janeiro, Brazil; 7
3 Department of Organismic Biology, Ecology and Evolution, University of California, Los 8
Angeles, USA; 9
4 Institute Pasteur de la Guyane, French Guiana; 10
5 Instituto Pró-Carnívoros, Brazil. 11
12
Corresponding author: 13
Dr. Eduardo Eizirik 14
Faculdade de Biociências - PUCRS 15
Av. Ipiranga 6681, CEP 90619-900 Porto Alegre, RS, Brazil 16
Telephone number: 55 (51) 3320.3500 Ext. 4717 17
Fax number: 55 (51) 3320.3612 18
Email: [email protected] 19
20
Running title: Phylogeography of Lontra longicaudis 21
Keywords: Lontra longicaudis, mitochondrial DNA, microssatellite, genetic diversity, 22
population structure, phylogeographic patterns 23

XVII
Abstract 24
The Neotropical otter (Lontra longicaudis) is a medium-sized carnivore with a broad 25
distribution in the Neotropical region. This species, as well as other otter species, suffered 26
with hunting in parts of its range until 1960s due to the high value of its pelts. Despite being 27
apparently common in many areas, it is one of the least known otters, and genetic studies on 28
this species are scarce. Here we have investigated its genetic diversity, population structure 29
and demographic history across part of its geographic range by analyzing 1472 base pairs 30
(bp) of mitochondrial DNA (mtDNA) and 12 microsatellite loci. L. longicaudis exhibits high 31
levels of mtDNA and microsatellite diversity. Both mitochondrial and nuclear data revealed a 32
consistent phylogeographic pattern, indicating that Brazilian populations are genetically 33
distinct from sampled populations distributed in Northwestern South America. The mtDNA 34
data indicates the probable existence of four phylogroups occurring in Brazil, French 35
Guiana/Peru, Bolivia and Colombia, respectively. The single Colombian haplotype was the 36
most basal relative to all other lineages, suggesting a substantial isolation of this phylogroup. 37
No substantial geographic substructure is observed within the Brazilian cluster, but a 38
demographic expansion is inferred. Inferences on the history of these phylogroups and 39
possible causes of such patterns are drawn, based on phylogenetic and population-genetic 40
approaches. Implications of the observed patterns for the conservation of L. longicaudis are 41
addressed, highlighting the finding that broad geographic regions contain differentiated 42
population segments that likely warrant independent management status. 43
44

XVIII
Introduction 45
Phylogeographic studies of widely distributed semi-aquatic mammals can provide a 46
natural link between the geological and biotic evolution of an area, since dispersal of these 47
species is largely related to the direct connection among basins, and the history of basin 48
interconnections is a result of geological processes (Bermingham & Martin 1998). In this 49
context, mitochondrial DNA (mtDNA) genealogies have been used extensively to infer 50
processes at population levels and the phylogenetic diversification of taxa in relation to their 51
geographical distribution (Avise et al. 1987; Avise 2000). However, mtDNA reflects only a 52
portion of the total historical record of a matriarchal component of the organismal pedigree 53
(Avise 1994), and thus a more complete view can be obtained by additional investigation of 54
nuclear loci. In this context, microsatellites have an interesting informative potential for 55
demographic analysis, due to their rapid mutation rate and a biparental inheritance 56
(Frankham et al. 2002). 57
Processes in the demographic history of populations, such as expansions or 58
contractions, leave recognizable signatures in the pattern of molecular diversity (Harpending 59
et al. 1998; Schneider & Excoffier 1999). Historical events can affect population size, and 60
may result in low levels of genetic diversity in current populations even if these populations 61
do not present small size. Moreover, climatic changes as occurred during the Pleistocene 62
have been responsible for the current patterns of genetic variation in many species (Lessa et 63
al. 2003). 64
So far, few studies have addressed the evolutionary history of Neotropical taxa from 65
an intra-specific phylogeography perspective, so that most of the evolutionary aspects still 66
need to be investigated. Some studies have investigated phylogeographic patterns in 67
Neotropical vertebrates (Eizirik et al. 1998; Lovejoy & de Araújo 2000; Eizirik et al. 2001; 68
Cantanhede et al. 2005; Vianna et al. 2006; Grazziotin et al. 2006; Marquéz et al. 2006; 69
Tchaicka et al. 2007), but the region has still been poorly characterized with respect to widely 70
distributed semi-aquatic mammals. 71
Lontra Longicaudis is a medium-size semi-aquatic carnivore, a relatively common 72
species widely distributed in the Neotropical region that exhibits a fish-based diet, 73
complemented by crustaceans and mollusks (Chebez 1999). In the past, and especially 74
during the last two centuries, humans made heavy use of otters for skins. Otter pelts were 75
very much in demand in the international market during the first half of the 20th century 76
(Chehébar 1990). Although some illegal hunting continues, this species has been relatively 77
free of exploitation since the 1960s, when the hunting pressure declined significantly, due to 78
the growing concern for wildlife conservation and because of the Latin American countries 79

XIX
enforcing CITES regulations (Chehébar 1990). However, throughout this range, this mustelid 80
has been subjected to persecution because its supposed predation on fish stocks 81
(Macdonald & Mason 1990) and are also heavily killed on roads. Despite that, the species is 82
considered as “Data Deficient” by IUCN (2006), but in several localities of its distribution it is 83
categorized as “Near Threatened” or “Vulnerable” (Chehébar 1990). 84
Most otter species are poorly known and are important targets for conservation due to 85
be indicator of healthy aquatic environments. As otters are typical animals at the top of the 86
food chain, they are among the first species to refuse and disappear when the environment 87
is degraded (Foster-Turley et al. 1990). However, even basic information is difficult to obtain 88
because otters are rarely observed, and are very difficult to trap, mark and recapture (Dallas 89
& Piertney 1998). Some studies have addressed aspects of intra-specific genetic diversity 90
and population structure of basically three otter species (Bodkin et al. 1999; Blundell et al. 91
2002; Dallas et al. 2002; Larson et al. 2002; Pérez-Haro et al. 2005); however, no large-scale 92
study has yet been published on the Neotropical otter (Lontra longicaudis). 93
The present study aims to characterize the genetic structure and evolutionary history 94
of Neotropical otter populations on a broad geographic scale, based on the analysis of 95
independent loci that represent both the nuclear and mitochondrial genomes. 96
Phylogeographic partitions and estimated population genetic parameters are used to infer 97
the evolutionary history of this species. Since this is the first phylogeographic study of a 98
Neotropical semi-aquatic mammal, we aimed to test whether the observed patterns were 99
congruent with those observed in terrestrial taxa (e.g. other carnivores, small mammals - 100
Eizirik et al. 1998; Eizirik et al. 2001; Costa 2003; Tchaicka et al. 2007) or aquatic species 101
(e.g. manatees, fish, caimans – Lovejoy & de Araújo 2000; Sivasundar et al. 2001; 102
Cantanhede et al. 2005; Vianna et al. 2006; de Thoisy et al. 2006), or yet presented unique 103
features not yet detected in other organisms. 104
105
Materials and Methods 106
Sample collection 107
Biological samples were collected from 45 Neotropical otters across a large area of 108
the species’ range (Fig. 1; Table 1). Blood samples were obtained from captive individuals 109
(with known geographic origin). Tissue samples were collected opportunistically by 110
collaborators from road-killed animals. Scat samples were collected by field researchers and 111
from captive individuals. A hair sample was obtained from one dead animal. Blood samples 112
were preserved in a salt saturated solution (100mM Tris, 100mM EDTA, 2% SDS) and 113
muscle and scat samples were preserved in ethanol 96%. All samples were stored at -20°C 114

XX
prior to DNA extraction. Samples of Lontra canadensis, Aonyx cinereus and Pteronura 115
brasiliensis were also included to be used as outgroups in some of the analyses. 116
117
DNA extraction and molecular analyses 118
Genomic DNA was extracted from blood and tissue samples using a standard 119
Proteinase-K digestion and phenol-chloroform-isoamyl alcohol protocol (Sambrook et al. 120
1989). DNA from hairs was extracted using the ChargeSwitch® Forensic DNA Purification Kit 121
(Invitrogen). DNA from scats was extracted using the QIAamp DNA Stool Mini Kit (Qiagen) 122
following the manufacturer’s instructions. The scat DNA extractions were carried out in a 123
separate laboratory area, in a UV-sterilized laminar flow hood, dedicated to the DNA analysis 124
of non-invasive samples. 125
Three segments of the mitochondrial DNA were amplified by the Polymerase Chain 126
Reaction (PCR, Saiki et al. 1985): (I) the 5’ portion of the mtDNA control region (CR), 127
containing the first hypervariable segment, using primers MTLPRO2 (5’-128
CACTATCAGCACCCAAAGCTG-3’) and CCR-DR1 (5’-CTGTGACCATTGACTGAATAGC-129
3’); (II) a segment of the ATP8 gene using primers ATP8-DF1 (5’-130
AGAAGCTAAATAAGCATTACCTTTTA-3’) and ATP8-DR1 (5’-131
CCAGTATTTGTTTTGATGTTAGTTG-3’); and (III) a segment of the ND5 gene using primers 132
ND5-DF1 (5’-TTGGTGCAACTCCAAATAAAAGT-3’) and ND5-DR1 (5’-133
AGGAGTTGGGCCTTCTATGG-3’). 134
Since fecal samples tend to present degraded DNA, hindering the sequencing of long 135
fragments, we designed internal primers for the control region dividing it into three shorter, 136
overlapping fragments (each one with ca. 250 bp). Through this strategy it was possible to 137
obtain a complete sequence of the CR fragment from fecal samples. These primers are: 138
LonCR-R1 (used in combination with MTLPRO2) (5’-ATGGTTTCTCGAGGCATGGT-3’), 139
LonCR-F2 (used in combination with CCR-DR1) (5’-AACTATACCTGGCATCTGGTTCTT-3’), 140
and the internal pair LonCR-F1 (5’- GGTTTGCCCCATGCATATAA-3’) + LonCR-R2 (5’-141
TGTGTGATCATGGGCTGATT-3’). The scat samples were amplified only for the mtDNA 142
control region. 143
Each 20ul PCR reaction contained 1-2 ul of DNA, 1x PCR Buffer (Invitrogen), 1.5 - 144
2.0 mM MgCl2, 200 uM dNTPs, 0.2uM of each primer and 0.5 unit of Taq DNA Polymerase 145
(Invitrogen). The PCR conditions were the same for the three mitochondrial segments, and 146
began with 10 cycles (Touchdown) of 94°C for 45s, 60-51°C for 45s, 72°C for 1.5 min; this 147
was followed by 30 cycles of 94°C for 45s, 50°C for 45s, 72°C for 1.5 min and final extension 148
of 72°C for 3 min. Products were visualized on a 1% agarose gel stained with ethidium 149

XXI
bromide, purified with PEG8000, sequenced using the DYEnamic ET Dye Terminator 150
Sequencing Kit (Amersham Biosciences), and analyzed in a MegaBACE 1000 automated 151
sequencer (Amersham Biosciences). Sequences were deposited in GenBank under 152
accession numbers XXXX-XXXX. 153
DNA extracts were also typed by PCR for 12 microsatellite loci (Lut453, Lut733, 154
Lut782, Lut701, Lut818, RIO06, RIO07, RIO11, RIO17, RIO18, RIO19 and RIO20), 155
developed for two other species of otters (Lutra lutra and Lontra canadensis) (Dallas et al. 156
1998; Beheler et al. 2004, 2005). Every forward primer was 5’-tailed with an M13 sequence 157
(5’- CACGACGTTGTAAAACGAC-3’) (Boutin-Ganache et al. 2001), and used in combination 158
with an M13 primer that had the same sequence but was dye-labeled on its 5’ end. The PCR 159
reactions were performed in 10ul reactions containing 0.5 – 1.5 ul of empirically diluted DNA, 160
1x PCR Buffer (Invitrogen), 1.5 - 2 mM MgCl2, 200 uM dNTPs, 0.2 uM of the reverse and 161
M13-fluorescent primers, 0.0133 uM of the M13-tailed forward primer, and 0.5 unit of Taq 162
DNA Polymerase. The PCR conditions were the same as for the mitochondrial segments, 163
except for a 30min final extension at 72°C. PCR reactions were carried out for each locus 164
separately, and products from 1 to 3 loci were diluted and pooled together based on yield, 165
size range and fluorescent dye, and then analyzed in a MegaBACE 1000 automated 166
sequencer. 167
168
Sequence analysis 169
Sequences were visually checked and manually corrected using CHROMAS 2.0 170
(http://www.thecnelysium.com.au/chromas.html) and aligned with the CLUSTALW algorithm 171
implemented in MEGA 3.1 (Kumar et al. 2004), with the resulting alignments edited by hand. 172
MEGA was also used to perform initial sequence comparisons and computations of 173
variability. 174
Phylogenetic analyses were performed separately for the mtDNA control region (CR), 175
coding fragments (ATP8+ND5), and full concatenation (CR+ATP8+ND5). The data sets were 176
assessed for the most appropriate model of nucleotide substitution using the Akaike 177
Information Criterion (AIC) as implemented in Modeltest 3.07 (Posada & Crandall 1998). We 178
inferred phylogenetic relationships among haplotypes using PAUP* 4.0b10 (Swofford 2002) 179
for three different optimality criteria: (i) maximum likelihood (ML) employing the selected 180
model and estimated parameters, with a heuristic search started from a neighbor-joining (NJ) 181
tree and using the nearest-neighbor interchange (NNI) branch-swapping method; (ii) 182
distance-based, using the (NJ) algorithm and ML genetic distances; and (iii) maximum 183
parsimony (MP) using heuristic searches with 50 replicates of random taxon addition and 184

XXII
tree-bisection-reconnection (TBR) branch-swapping. Group support for all of the above 185
methods was evaluated with 100 nonparametric bootstrap replicates. Additionally, we 186
performed Bayesian phylogenetic analyses (BI) with MrBayes 3.1 (Huelsenbeck & Ronquist 187
2001), with four Metropolis-coupled Markov Chain Monte Carlo (MCMC) chains run for 1 188
million generations. Trees were sampled every 100 generations, discarding the first 2,500 189
trees as burn-in. Two independent runs were performed for each data set to evaluate 190
convergence. We used Lontra canadensis, Aonyx cinereus and Pteronura brasiliensis as 191
outgroups in the phylogenetic analyses. 192
A median-joining network (Bandelt et al 1999) was constructed using Network 4.1.1.2 193
(www.fluxus-engineering.com) to depict phylogenetic, geographic, and potential ancestor-194
descendent relationships among the sequences. Divergence times between inferred clades 195
were estimated using a distance-based linearized tree method implemented in MEGA, 196
employing a molecular calibration of 5.9 million years ago (MYA) (credibility interval (CI): 4 - 197
8.3 MYA) for the evolutionary separation between the Aonyx and Lontra lineages (E. Eizirik 198
et al. unpublished). 199
Population structure analyses were performed assuming broad geographic units 200
based on the observed phylogeographic pattern (see Results). The testing of additional, 201
alternative scenarios of geographic subdivision could not be adequately performed with this 202
approach due to limitations of sample size for some of the included areas. As measures of 203
differentiation among populations, we estimated fixation indices (FST) (Wright 1965), using an 204
Analysis of Molecular Variance (AMOVA) approach (Excoffier et al. 1992) implemented in 205
ARLEQUIN 2.0 (Schneider et al. 2000). 206
A Mantel test (Mantel 1967) as implemented in AIS 1.0 (Miller 2005) was performed 207
to test the null hypothesis of no correlation between geographic and genetic distances. 208
Statistical significance was tested using 1000 random permutations. Statistics such as 209
nucleotide (π) and haplotype (h) diversity, neutrality tests such as Tajima’s D (Tajima 1989), 210
Fu and Li’s F* & D* (Fu & Li 1993), and Fu’s Fs (Fu 1997), and Mismatch Distribution 211
Analyses (Rogers & Harpending 1992) were computed using DnaSP (Rozas et al. 2003) and 212
ARLEQUIN. 213
214
Microsatellite analyses 215
Microsatellite genotyping was performed using the software Genetic Profiler 2.2 216
(Amersham Biosciences). We calculated observed (HO) and expected (HE) heterozygosity for 217
each locus and tested for evidence of deviation from Hardy-Weinberg equilibrium (HWE) and 218
linkage equilibrium (LE) using CERVUS 2.0 (Marshall et al. 1998) and ARLEQUIN. To 219

XXIII
correct for multiple comparisons, Bonferroni adjustments (Rice 1989) with an original α level 220
of 0.05 were carried out for all tabulated results. Using the unlinked loci that were in HWE, 221
we performed a G-test to evaluate the null hypothesis that allelic frequencies were identical 222
across populations (Sokal & Rohlf 1981). 223
The degree of population genetic structure was estimated with the FST index using an 224
Analysis of Molecular Variance (AMOVA) approach implemented in ARLEQUIN. For 225
comparison, we also calculated RST, an analogous measure designed for microsatellite data 226
that incorporates a stepwise mutation model (Slatkin 1995). As an independent measure of 227
the partitioning of genetic variation among groups, the program STRUCTURE 2.0 (Pritchard 228
et al. 2000) was used to cluster individuals into subpopulations and to reveal patterns of 229
gene flow across the sampled area. STRUCTURE uses an iterative approach to cluster 230
microsatellite genotypes into K populations regardless of the geographic locations of 231
individuals. The approach is based on the assumptions of Hardy-Weinberg and linkage 232
equilibrium within the resulting clusters, so that the likelihood of K is estimated from the 233
genotype data alone. The highest likelihood value indicates the most likely number of 234
populations in the sample. Individuals can be assigned to one or more populations, including 235
the possibility of admixture. The first step of this analysis involved estimating the numbers of 236
populations (K). Five independent runs each of K = 1-5 were performed with 104 – 105 237
MCMC iterations after a burn-in of 104 – 105, using no prior information and assuming 238
uncorrelated allele frequencies and allowing admixture. In the second step of the analysis, 239
individuals were assigned to each original geographic sample group (using K = 2; see 240
Results). To evaluate the STRUCTURE results in determining how indicative an individual’s 241
genotype was of the population from which it was sampled, we performed an assignment test 242
(Paetkau et al. 1995) as implemented in ARLEQUIN. 243
A Mantel test was performed with the program AIS to assess the significance of the 244
association between genetic and geographic distances. Statistical significance was tested 245
using 1000 random permutations. 246
247
Results 248
mtDNA sequences 249
A 516 base-pair (bp) fragment of the control region (CR) was sequenced for 44 L. 250
longicaudis individuals. Due to a portion of ambiguous alignment, 25 sites from the control 251
region were excluded from all further analyses, totaling 491 bp. Sequences of the ATP8 (329 252
bp) and ND5 (651 bp) genes were obtained for 37 Neotropical otters each (Table 2). 253
Outgroups were sequenced for these three fragments yielding the same sequence length, 254

XXIV
except for Aonyx cinereus whose control region segment was 1 bp longer than the remaining 255
individuals (so that the total alignment was 517 bp-long). The three segments were 256
concatenated totaling 1472 bp. 257
Moderate to high levels of genetic diversity were observed in all three segments 258
(Table 2).The CR was the most variable segment when L. longicaudis samples were 259
analyzed separately, but showed clear indications of saturation when other species were 260
also included in the comparisons (see Table 2). Separate analyses were conducted for three 261
different mtDNA data sets: (i) control region alone; (ii) coding segments (ATP8 + ND5); and 262
(iii) full concatenation (CR + ATP8 + ND5). 263
264
Control region data set 265
Sequences generated for this segment defined 23 different haplotypes (Table 3). A 266
relatively high level of nucleotide diversity was observed among individuals (Table 2). The 267
Hasegawa-Kishino-Yano (Hasegawa et al. 1985) substitution model with a proportion of 268
invariant sites and a gamma distribution of rate heterogeneity across sites (HKY+I+G) 269
provided the best fit to this data set (ln = -1363.4178). The MP, ML, NJ and Bayesian 270
phylogenetic analyses did not conflict with each other in the inferred tree topology, but were 271
unable to resolve the relationships among the haplotypes (Fig. 2). The only supported 272
grouping obtained with this segment was a clade containing most haplotypes from French 273
Guiana and one sequence from Peru (subsequently named Clade 2 – see below). The 274
haplotype network also failed to show a clear pattern, with a considerable amount of 275
reticulation indicating the occurrence of homoplasy and likely saturation at variable sites (Fig. 276
3). 277
In spite of the apparent lack of discernible phylogenetic structure, the FST between 278
two broadly defined geographic groups (Brazil vs. Northwestern South America; see below) 279
was quite high (FST = 0.45; p = 0.000). Of the neutrality tests performed, only Fu’s F* was 280
significantly negative (Fu’s F*= -6.546, p=0.001) when the Brazilian samples were analyzed 281
separately, while all other tests were non-significant for separate or combined population 282
samples. The mismatch distribution showed a multi-modal pattern for most data sets, except 283
for the analysis of Brazilian individuals by themselves, which resulted in a roughly unimodal 284
peak (Fig. 4A). 285
286
Combined data sets 287
Sequences from the concatenations of the ATP8 and ND5 segments (n = 36; data set 288
II) and ATP8 + ND5 + CR (n = 35; data set III) led to the observation of 19 and 26 unique 289
XXV
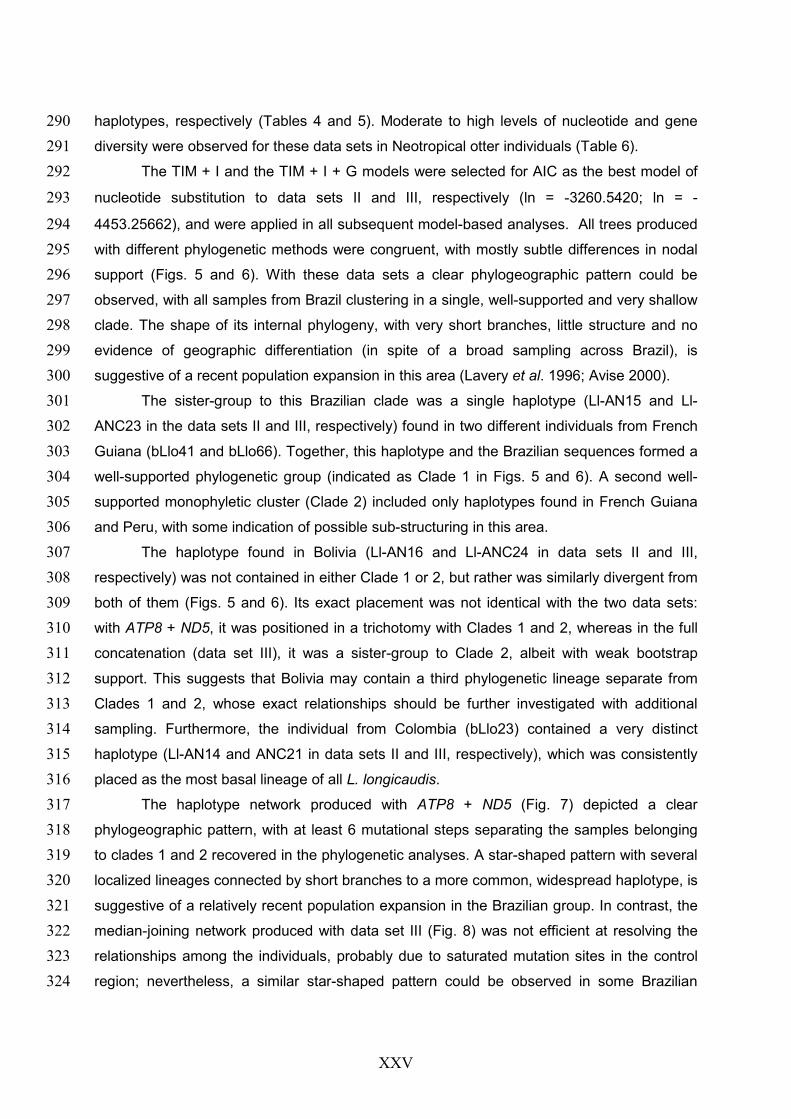
haplotypes, respectively (Tables 4 and 5). Moderate to high levels of nucleotide and gene 290
diversity were observed for these data sets in Neotropical otter individuals (Table 6). 291
The TIM + I and the TIM + I + G models were selected for AIC as the best model of 292
nucleotide substitution to data sets II and III, respectively (ln = -3260.5420; ln = -293
4453.25662), and were applied in all subsequent model-based analyses. All trees produced 294
with different phylogenetic methods were congruent, with mostly subtle differences in nodal 295
support (Figs. 5 and 6). With these data sets a clear phylogeographic pattern could be 296
observed, with all samples from Brazil clustering in a single, well-supported and very shallow 297
clade. The shape of its internal phylogeny, with very short branches, little structure and no 298
evidence of geographic differentiation (in spite of a broad sampling across Brazil), is 299
suggestive of a recent population expansion in this area (Lavery et al. 1996; Avise 2000). 300
The sister-group to this Brazilian clade was a single haplotype (Ll-AN15 and Ll-301
ANC23 in the data sets II and III, respectively) found in two different individuals from French 302
Guiana (bLlo41 and bLlo66). Together, this haplotype and the Brazilian sequences formed a 303
well-supported phylogenetic group (indicated as Clade 1 in Figs. 5 and 6). A second well-304
supported monophyletic cluster (Clade 2) included only haplotypes found in French Guiana 305
and Peru, with some indication of possible sub-structuring in this area. 306
The haplotype found in Bolivia (Ll-AN16 and Ll-ANC24 in data sets II and III, 307
respectively) was not contained in either Clade 1 or 2, but rather was similarly divergent from 308
both of them (Figs. 5 and 6). Its exact placement was not identical with the two data sets: 309
with ATP8 + ND5, it was positioned in a trichotomy with Clades 1 and 2, whereas in the full 310
concatenation (data set III), it was a sister-group to Clade 2, albeit with weak bootstrap 311
support. This suggests that Bolivia may contain a third phylogenetic lineage separate from 312
Clades 1 and 2, whose exact relationships should be further investigated with additional 313
sampling. Furthermore, the individual from Colombia (bLlo23) contained a very distinct 314
haplotype (Ll-AN14 and ANC21 in data sets II and III, respectively), which was consistently 315
placed as the most basal lineage of all L. longicaudis. 316
The haplotype network produced with ATP8 + ND5 (Fig. 7) depicted a clear 317
phylogeographic pattern, with at least 6 mutational steps separating the samples belonging 318
to clades 1 and 2 recovered in the phylogenetic analyses. A star-shaped pattern with several 319
localized lineages connected by short branches to a more common, widespread haplotype, is 320
suggestive of a relatively recent population expansion in the Brazilian group. In contrast, the 321
median-joining network produced with data set III (Fig. 8) was not efficient at resolving the 322
relationships among the individuals, probably due to saturated mutation sites in the control 323
region; nevertheless, a similar star-shaped pattern could be observed in some Brazilian 324

XXVI
haplotypes. Again, individuals bLlo41 and bLlo66 were positioned near the Brazilian group 325
instead of being placed in association with other samples from their geographic region 326
(French Guiana). 327
The AMOVA results indicated that most of the genetic variability in L. longicaudis 328
mtDNA could be explained by a single Northwest vs. Southeast partition (i.e. Brazil [SE] vs. 329
all other sampled locations [NW]. The FST between these two geographic groups was high 330
(0.65, p < 0.001; and 0.54, p < 0.001, for data sets II and III, respectively), as expected due 331
to their almost perfect allopatry. Given this result and the available sample, we focused 332
several geography-based analyses on these two broad units, even though the NW group 333
seems to contain a diverse assembly of non-monophyletic historical lineages (Figs. 5 and 6). 334
For the complete L. longicaudis sample, as well as and for the NW geographic group, 335
all neutrality tests were non-significant. In contrast, significantly negative results were 336
obtained for the Brazilian group (Fu’s F* = -8.6625, p < 0.001, data set II; Fu’s F* = -6.793, p 337
< 0.001; Tajima’s D = -5.872, p = 0.02, data set III), congruent with the inference of a recent 338
population expansion in this region. The mismatch distribution analyses taking into account 339
the whole species and the NW geographic group showed a multimodal distribution (not 340
shown), which is expected given the observed phylogenetic structure in this area. On the 341
other hand, the Brazilian sample revealed a unimodal pattern (Fig. 4B,C), which is again 342
consistent with a historical demographic expansion. 343
The Mantel test was performed only with data set III (CR + ATP8 + ND5) and 344
revealed a weak but significant relationship between genetic and geographic distances when 345
the entire sample was compared (r = 0.29; p = 0.02). However, when the two geographic 346
groups of samples were analyzed individually, the correlation was very low and non-347
significant (SE: r = 0.054, p = 0.1, n = 29; NW: r = 0.034, p = 0.41, n = 7). 348
The divergence between Lontra longicaudis and L. canadensis was dated to ca. 4.16 349
MYA (confidence interval [CI]: 2-82 – 5.85 MYA). Within L. longicaudis, the divergence 350
between the Colombian haplotype and the other lineages was estimated to have occurred 351
around 0.644 MYA (CI: 0.437 – 0.906 MYA), while the three-way split among the Bolivian 352
haplotype and Clades 1 and 2 was estimated to have occurred at ca. 0.450 MYA (CI: 0.303 353
– 0.629 MYA). The diversification within clades occurred soon afterwards. Of particular 354
interest is the age of the base of Clade 1 (separation between the haplotype from French 355
Guiana and the Brazilian group), estimated at 0.422 MYA (CI: 0.286 – 0.594), and the 356
coalescence of the Brazilian clade itself (dated at 0.196 MYA; CI: 0.133 – 0.276). 357
XXVII
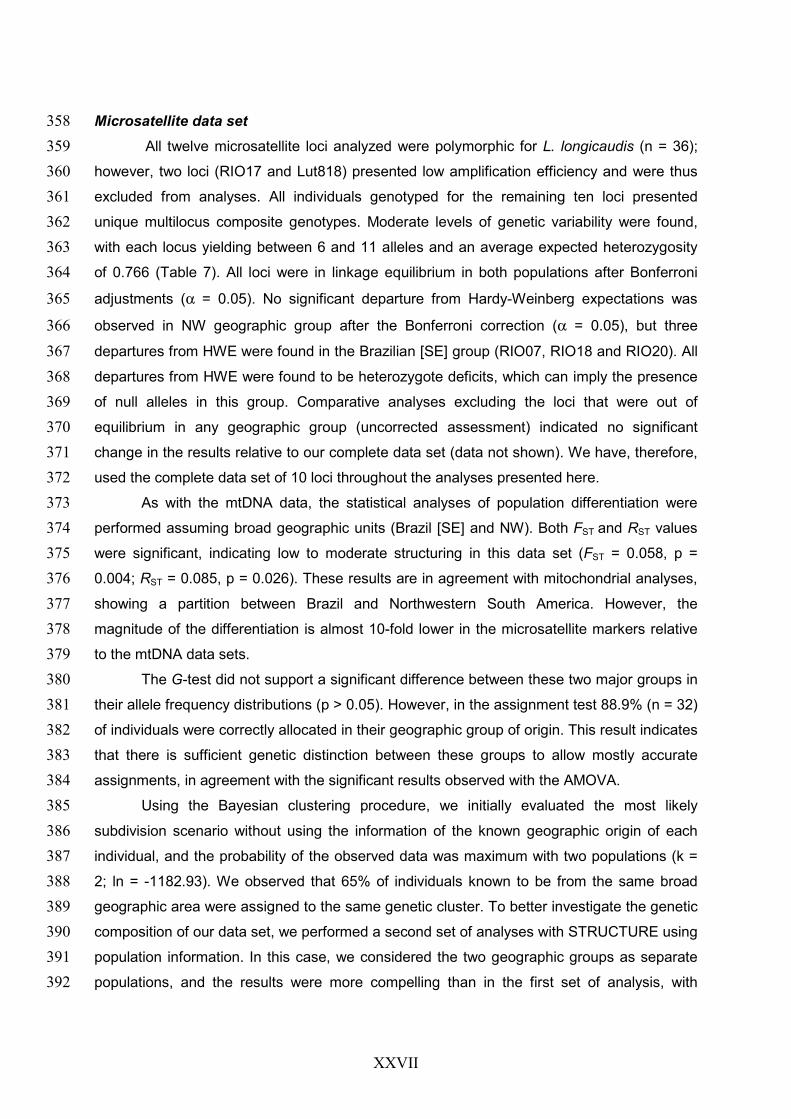
Microsatellite data set 358
All twelve microsatellite loci analyzed were polymorphic for L. longicaudis (n = 36); 359
however, two loci (RIO17 and Lut818) presented low amplification efficiency and were thus 360
excluded from analyses. All individuals genotyped for the remaining ten loci presented 361
unique multilocus composite genotypes. Moderate levels of genetic variability were found, 362
with each locus yielding between 6 and 11 alleles and an average expected heterozygosity 363
of 0.766 (Table 7). All loci were in linkage equilibrium in both populations after Bonferroni 364
adjustments (α = 0.05). No significant departure from Hardy-Weinberg expectations was 365
observed in NW geographic group after the Bonferroni correction (α = 0.05), but three 366
departures from HWE were found in the Brazilian [SE] group (RIO07, RIO18 and RIO20). All 367
departures from HWE were found to be heterozygote deficits, which can imply the presence 368
of null alleles in this group. Comparative analyses excluding the loci that were out of 369
equilibrium in any geographic group (uncorrected assessment) indicated no significant 370
change in the results relative to our complete data set (data not shown). We have, therefore, 371
used the complete data set of 10 loci throughout the analyses presented here. 372
As with the mtDNA data, the statistical analyses of population differentiation were 373
performed assuming broad geographic units (Brazil [SE] and NW). Both FST and RST values 374
were significant, indicating low to moderate structuring in this data set (FST = 0.058, p = 375
0.004; RST = 0.085, p = 0.026). These results are in agreement with mitochondrial analyses, 376
showing a partition between Brazil and Northwestern South America. However, the 377
magnitude of the differentiation is almost 10-fold lower in the microsatellite markers relative 378
to the mtDNA data sets. 379
The G-test did not support a significant difference between these two major groups in 380
their allele frequency distributions (p > 0.05). However, in the assignment test 88.9% (n = 32) 381
of individuals were correctly allocated in their geographic group of origin. This result indicates 382
that there is sufficient genetic distinction between these groups to allow mostly accurate 383
assignments, in agreement with the significant results observed with the AMOVA. 384
Using the Bayesian clustering procedure, we initially evaluated the most likely 385
subdivision scenario without using the information of the known geographic origin of each 386
individual, and the probability of the observed data was maximum with two populations (k = 387
2; ln = -1182.93). We observed that 65% of individuals known to be from the same broad 388
geographic area were assigned to the same genetic cluster. To better investigate the genetic 389
composition of our data set, we performed a second set of analyses with STRUCTURE using 390
population information. In this case, we considered the two geographic groups as separate 391
populations, and the results were more compelling than in the first set of analysis, with 392

XXVIII
individuals that were a priori grouped in the SE and NW groups being correctly assigned with 393
97% and 89% accuracy, respectively (Fig. 9). An interesting case was that of individual 394
bLlo21, from French Guiana, which was estimated to have a 57% probability of belonging to 395
the Brazilian genetic cluster. Since this individual had 30% of its microsatellite data missing, 396
we repeated this analysis excluding the loci for which no genotypes had been obtained from 397
this animal. The proportion of its genomic ancestry in the Brazilian group decreased to 49%, 398
but remained too high to be easily dismissed, implying some level of recent gene flow 399
between the two groups. 400
The Mantel test revealed a weak but significant correlation between genetic and 401
geographic distances when the whole sample was analyzed (r = 0.33; p = 0.001). When 402
each group was analyzed separately, the Mantel test indicated a significant correlation for 403
the Brazilian group (r = 0.47, p = 0.003, n = 29), but not for the NW geographic group (r = 404
0.49, p = 0.13, n = 7). 405
406
Discussion 407
Genetic Diversity 408
Observed levels of genetic variability in Neotropical otters (Tables 2, 6 and 7) were 409
considerably high when compared to other vertebrates. For example, analyses of mtDNA 410
control region data sets (overlapping with the segment employed here) from sympatric 411
mammals yielded nucleotide diversity (π) values of 0.0017 in marsh deer (Blastocerus 412
dichotomus) populations of the Río de la Plata basin (Márquez et al. 2006), and 0.00771 in 413
jaguars (Panthera onca) throughout their range (Eizirik et al. 2001), while in this study we 414
obtained values of 0.011 (Tables 2 and 6). 415
Tchaicka et al. (2007) used the same control region segment in phylogeographic 416
analyses of the crab-eating fox (Cerdocyon thous), a genetically diverse Neotropical canid 417
sympatric with L. longicaudis throughout most of its range. The comparison between these 418
species indicates that haplotype diversity is higher in L. longicaudis (h = 0.8911 ± 0.0060) 419
than in Cerdocyon (h = 0.83 ± 0.032), while nucleotide diversity is lower (π = 0.0113 ± 0.0027 420
vs. 0.019 ± 0.002). 421
Comparisons to other studies performed with mustelids suggest moderate to high 422
levels of mtDNA diversity in Lontra longicaudis. Both nucleotide and haplotype diversity found 423
in the Neotropical otter mtDNA CR (π = 0.0113 ± 0.0027; h = 0.8911 ± 0.0060) are similar to 424
or higher than estimates reported for Mustela lutreola (π = 0.012 ± 0.058 to 0.0012 ± 0.088; h 425
= 0.469 to 0.939, Northeast and Southeast Europe populations, respectively; Michaux et al. 426
2005), Enhydra lutris (π = 0.098 ± 0.029; h = 0.412; Larson et al. 2002) and Lutra lutra (π = 427
XXIX
0.0006; h = 0.16 ± 0.06; Ferrando et al. 2004). Studies on European populations of Lutra 428
lutra based on 300bp of the 5’ hypervariable sement of the mtDNA control region have so far 429
described only six haplotypes, all of which differ from each other by only one nucleotide, 430
indicating a low genetic variability for that species (Effenberger & Suchentrunk 1999; Mucci et 431
al. 1999; Cassens et al. 2000; Pérez-Haro et al. 2005). The absence of other genetic studies 432
on otter or any mustelid using the genes ATP8 and ND5 precludes direct comparisons of 433
these data to other species. 434
In spite of its high diversity relative to other mtDNA segments, our analyses indicate 435
that the control region may not be the best mitochondrial marker for phylogeographic studies 436
in L. longicaudis and perhaps other related species. Variable sites in this segment seem to 437
be saturated even at the intra-specific level, leading to a lower signal-to-noise ratio than 438
verified for the other two fragments. Conversely, the ND5 segment used here seems to be a 439
very informative segment, less prone to saturation at recent levels, which has also been 440
observed for other carnivores studied by our group (unpublished data). 441
With respect to microsatellite diversity, Beheler et al. (2004) described 10 loci for Lontra 442
canadensis, two of which were used in this study. These markers exhibited more alleles in L. 443
longicaudis than reported for their original target species, whereas the observed 444
heterozygosity was higher in the latter. Beheler et al. (2005) described an additional 10 445
microsatellites for L. canadensis, four of which were analyzed here for L. longicaudis. Again, 446
more alleles were found for every locus in L. longicaudis, while the observed heterozygosity 447
was relatively lower in this species. The remaining microsatellite markers used here were 448
developed for Lutra lutra (Dallas & Piertney 1998); in these markers a similar number of 449
alleles and higher heterozygosity were observed for L. longicaudis relative to the original 450
target species. Other studies employing these markers include the following: Hung et al. 451
(2004) used three of these loci (Lut701, Lut733 e Lut782) on Lutra lutra scat samples in 452
Kinmen, and found fewer alleles than identified here; Dallas et al. (2002) also employed the 453
same three markers in L. lutra and found fewer alleles than reported here for two of the loci 454
(Lut701 e Lut733); finally, Randi et al. (2003) used four of these loci in European populations 455
of L. lutra and found a higher allelic diversity but observed heterozygosity generally lower than 456
we estimated for L. longicaudis. A practical implication of these results is that these markers 457
are quite variable in L. longicaudis, are thus informative for further investigations of population 458
genetics and molecular ecology in this species, and should provide useful comparisons to 459
other related species. 460

XXX
Phylogeography and Demographic History 461
The phylogenetic and network analyses of Lontra longicaudis mtDNA sequences 462
showed this species to be composed of at least four geographically structured phylogroups: 463
(i) Colombia; (ii) Bolivia; (iii) French Guiana; and (iii) Brazil. Colombia and Bolivia were 464
represented by a single sample each, whose genetic divergence from other individuals 465
indicates deep phylogeographic partitions involving these areas, which need to be further 466
ascertained by means of enhanced sampling. 467
The allopatry of the two better-sampled phylogroups (Brazil and French Guiana) is 468
almost complete, with only two individuals (bLlo41 and bLlo 66, which share the same 469
haplotype) found in a geographic region inconsistent with their phylogenetic placement. The 470
position of these French Guiana samples in Clade 1 is intriguing, as they are solidly placed at 471
the base of this clade. This suggests that this incongruence between geography and 472
phylogeny may be due to an ancestral colonization process, instead of secondary mtDNA 473
gene flow. In that case, it would imply that the Brazilian clade derives from a recent episode 474
of colonization from the north, so that northern populations are paraphyletic with respect to 475
more southerly ones. Another observation that is consistent with this inference is the position 476
of the single haplotype (sampled in two different individuals) from the Brazilian northeast, 477
which is the most basal of all lineages from Brazil (e.g. Ll-AN4B in Fig. 5 and Ll-ANC18 in 478
Fig. 6). This hypothesis needs to be further investigated on the basis of additional sampling 479
in northern Brazil and adjacent areas. 480
The mtDNA inference of a significant genetic partition between Brazil and the other 481
sampled areas in South America is supported by the microsatellite data set. However, the 482
magnitude of this difference is much lower with these fast-evolving nuclear markers than with 483
the matrilineal mitochondrial sequences. This may be due to slower effects of historical 484
genetic drift acting on two isolated groups, given the larger effective population size of 485
nuclear markers, or (non-exclusively) to the occurrence of ongoing male-biased gene flow 486
between these areas. Teasing apart these processes should prove to be an interesting 487
avenue for research in this species, for which data on individual dispersal and social 488
behavior is currently unavailable. 489
The pattern observed with the mtDNA phylogenies and haplotype networks is 490
consistent with a recent population expansion in Brazil, with most haplotypes from this region 491
differing from each other by only one or two mutational steps, often connected in a star-492
shaped fashion (e.g. Figs. 5 - 8). This inference is also supported by the mtDNA mismatch 493
distribution analysis (Fig. 4) and the neutrality test results. The mismatch distribution results 494
of the ATP8 + ND5 data set (seemingly “cleaner” in terms of phylogenetic signal, with less 495

XXXI
homoplasy than inferred for the control region) fits particularly well the expected pattern 496
under a sudden demographic expansion (Rogers & Harpending 1992), with a single, smooth 497
prominent peak. The age of this expansion was estimated at ca. 200,000 years ago, possibly 498
following colonization of this area from northern South America. 499
500
Implications for conservation 501
The results presented here have implications for the conservation and management 502
of this species in the wild and in captivity. In spite of being represented by a single sample 503
each, the divergence observed in Colombia and Bolivia suggests that those areas may be 504
sufficiently differentiated to warrant recognition as separate Evolutionarily Significant Units 505
(ESU – Ryder 1986). As such, they should be conserved and managed as distinct entities. 506
Further studies are required to improve our knowledge about these populations and their 507
evolutionary relationships to others. 508
French Guiana otters are not monophyletic in their mtDNA lineages trees, but should 509
be viewed as separate conservation unit. This area seems to contain a very high level of 510
genetic diversity, and may hold important clues to better understand the evolutionary history 511
of this species. It should therefore be viewed as an important focus for additional research 512
and conservation efforts. Other demographic units probably exist in the Neotropical otter, 513
which should be investigated in more detailed population genetic studies involving an 514
expanded geographic sampling of the species range. 515
516
References 517
Avise JC, Arnold J, Ball RM et al. (1987) Intraspecific Phylogeography: the mithocondrial 518
DNA bridge between populations genetics and systematics. Annual Review of Ecology 519
and Systematics, 18, 489:522. 520
Avise JC (1994) Molecular markers, natural history e evolution. Chapman & Hall, New York. 521
Avise JC (2000) Phylogeography – The History and Formation of Species. Harvard 522
University Press, Cambridge, Massachusetts. 523
Bandelt HJ, Forster P, Röhl A (1999) Median-joining networks for inferring intraspecific 524
phylogenies. Molecular Biology and Evolution, 16, 37-48. 525
XXXII
Beheler AS, Fike JA, Murfitt LM, Rhodes Jr. OE, Serfass TS (2004) Development of 526
polimorphic microsatellite loci for North American river otters (Lontra canadensis) and 527
amplification in related Mustelids. Molecular Ecology Notes, 4, 56-58. 528
Beheler AS, Fike JA, Murfitt LM et al. (2005) Ten new polymorphic microsatellite loci for 529
North American river otters (Lontra canadensis) and their utility in related mustelids. 530
Molecular Ecology Notes, 5, 602-604. 531
Bermingham E, Martin AP (1998) Comparative mtDNA phylogeography of neotropical 532
freshwater fishes: testing shared history to infer the evolutionary landscape of lower 533
Central America. Molecular Ecology, 7, 499-517. 534
Bodkin JL, Ballachey BE, Cronin MA, Scribner KT (1999) Population demographics and 535
genetic diversity and remnant and translocated populations of sea otters. Conservation 536
Biology, 13, 1378-1385. 537
Boutin-Ganache I, Raposo M, Raymond M, Deschepper CF (2001) M13-tailed primers 538
improve the readability and usability of microsatellite analyses performed with two 539
different allele-sizing methods. Biothecniques, 31, 25-28. 540
Blundell GM, Ben-David M, Groves P, Bowyer RT, Geffen E (2002) Characteristics of sex-541
biased dispersal and gene flow in coastal river otters: implications for natural 542
recolonization of extirpated populations. Molecular Ecology, 13, 289-303. 543
Cantanhede AM, da Silva VMF, Farias IP et al. (2005) Phylogeography and population 544
genetics of the endangered Amazonian manatee, Trichechus inunguis Natterer, 1883 545
(Mammalia, Sirenia). Molecular Ecology, 14, 401-413. 546
Cassens I, Tiedemann R, Suchentrunk F, Hartl GB (2000) Mitochondrial DNA variation in the 547
European otter (Lutra lutra) and the use of spatial autocorrelation analysis in 548
conservation. The Journal of Heredity, 91, 31-41. 549
Chebez JC (1999) Los que se van – Espécies argentinas em peligro. Buenos Aires, Editorial 550
Albatroz Saci. 551

XXXIII
Chehébar CE (1990) Action Plan from Latin American Otters. In: Otters: A Plan for their 552
Conservation (eds. Foster-Turley P, Macdonald S, Mason C), pp. 64-73. IUCN Otter 553
Specialist Group. 554
Costa LP (2003) The historical bridge between the Amazon and the Atlantic Forest of Brazil: 555
a study of molecular phylogeography with small mammals. Journal of Biogeography, 556
30, 71-86. 557
Dallas JF, Piertney SB (1998) Microsatellite primers for the Eurasian otter. Molecular 558
Ecology, 7, 1248-1251. 559
Dallas JF, Marshall F, Piertney SB, Bacon PJ, Racey P (2002) Spatially restricted gene flow 560
and reduced microsatellite polymorphism in the Eurasian otter Lutra lutra in Britain. 561
Conservation Genetics, 3, 15-29. 562
de Thoisy B, Hrbek T, Farias IP, Vasconcelos WR, Larvegne A (2006) Genetic structure, 563
population dynamics, and conservation of Black caiman (Melanosuchus niger). 564
Biological Conservation, 133, 474-482. 565
Effenberger S, Suchentrunk F (1999) RFLP analyses of the mitochondrial DNA of otters 566
(Lutra lutra) from Europe – implications for conservation of a flagship species. 567
Biological Conservation, 90, 229-234. 568
Eizirik E, Bonatto SL, Johnson WE et al. (1998) Phylogeographic patterns and mitochondrial 569
DNA control region evolution in two Neotropical cats (Mammalia, Felidae). Journal of 570
Molecular Evolution, 47, 613-624. 571
Eizirik E, Kim J, Menotti-Raymond M et al. (2001) Phylogeography, population history e 572
conservation of jaguars (Panthera onca, Mammalia, Felidae). Molecular Ecology, 10, 573
65-79. 574
Excoffier L, Smouse P, Quattro J (1992) Analysis of Molecular Variance inferred from metric 575
distances among DNA haplotypes: application to human mitochondrial DNA restriction 576
data. Genetics, 131, 479-491. 577

XXXIV
Ferrando A, Ponsà M, Marmi J, Domingo-Roura X (2004) Eurasian otters, Lutra lutra, have a 578
dominant mtDNA haplotype from the Iberian Peninsula to Scandinavia. The Journal of 579
Heredity, 95, 430-435. 580
Foster-Turley P, Macdonald S, Mason CF (1990) Otters: An action plane for their 581
conservation. IUCN/SSC Otter Specialist Group. 582
Frankham R, Ballou JD, Briscoe DA (2002) Introduction to Conservation Genetics. 583
Cambridge University Press, Cambridge. 584
Fu YX (1997) Statistical test of neutrality of mutations against population growth, hitchhiking 585
and background selection. Genetics, 147, 915-925. 586
Fu YX, Li WH (1993) Statistical tests of neutrality of mutations. Genetics, 133, 693-709. 587
Grazziotin FG, Monzel M, Echeverrigaray S, Bonatto SL (2006) Phylogeography of the 588
Bothrops jararaca complex (Serpentes: Viperidae): past fragmentation and island 589
colonization in the Brazilian Atlantic Forest. Molecular Ecology, 15, 3969-3982. 590
Harpending HC, Batzer MA, Gurven M et al. (1998) Genetic traces of ancient demography. 591
Proceedings of Natural Academy of Sciences, 95, 1961-1967. 592
Hasegawa M, Kishino H, Yano T (1985) Data of the human-ape splitting by a molecular clock 593
of mitochondrial DNA. Journal of Molecular Evolution, 22, 160–174. 594
Huelsenbeck JP, Ronquist F (2001) MRBAYES: Bayesian inference of phylogeny. 595
Bioinformatics, 17, 754-755. 596
Hung C, Li S, Lee L (2004) Faecal DNA typing to determine the abundance and spatial 597
organisation of otters (Lutra lutra) along two stream systems in Kinmen. Animal 598
Conservation, 7, 301-311. 599
IUCN (2006) IUCN Red List of Threatened Species. <www.iucnredlist.org> Downloaded in 600
27 February 2007. 601
Kumar S, Tamura K, Nei M (2004) MEGA3: Integrated software for molecular evolutionary 602
genetics analysis and sequence alignment. Briefings in Bioinformatics, 5, 2. 603

XXXV
Larson SE, Jameson RJ, Bodkin JL, Staedler M, Bentzen P (2002) Microsatellite DNA and 604
mtDNA variation within and among remnant and translocated sea otter, Enhydra lutris, 605
populations. Journal of Mammalogy, 83, 893-906. 606
Lavery S, Moritz C, Fielder DR (1996) Genetic patterns suggest exponential population 607
growth in a declining species. Molecular Biology and Evolution, 13, 1106-1113. 608
Lessa EP, Cook AC, Patton JL (2003) Genetic footprints of expansion in North America, but 609
not Amazonia, during the late Quaternary. Proceedings of National Academy of 610
Sciences USA, 100, 10331–10334. 611
Lovejoy NR, de Araújo MLG (2000) Molecular systematics, biogeography and population 612
structure of Neotropical freshwater needlefishes of the genus Potamorrhaphis. 613
Molecular Ecology, 9, 259-268. 614
Macdonald SM, Mason CF (1990) Threats. In: Otters: An Action Plan for their Conservation 615
(eds. Foster-Turley P, Macdonald S, Mason C), pp. 11-14. IUCN Otter Specialist 616
Group. 617
Mantel N (1967) The detection of disease clustering and a generalized regression approach. 618
Cancer Research, 27, 209-220. 619
Marquéz A, Maldonado JE, Gonzáles S et al. (2006) Phylogeography and Pleistocene 620
demographic history of the endangered marsh deer (Blastocerus dichotomus) from the 621
Río de la Plata Basin. Molecular Ecology, 7, 563-575. 622
Marshall TC, Slate J, Kruuk LEB, Pemberton JM (1998) Statistical confidence for likelihood-623
based paternity inference in natural populations. Molecular Ecology, 7, 639–655. 624
Michaux JR, Hardy OJ, Justy F et al. (2005) Conservation genetics and population history of 625
the threatened European mink Mustela lutreola, with an emphasis on the West 626
European populations. Molecular Ecology, 14, 2373-2388. 627
Miller MP (2005) ALLELES IN SPACE: Computer software for the joint analysis of 628
interindividual spatial and genetic information. Journal of Heredity, 96, 711-724. 629

XXXVI
Mucci N, Pertoldi C, Madsen AB, Loeschcke V, Randi E (1999) Extremely low mitochondrial 630
DNA control-region sequence variation in the otter Lutra lutra population of Denmark. 631
Hereditas, 130, 331-336. 632
Pérez-Haro M, Viñas J, Mañas F et al. (2005) Genetic variability in the complete 633
mitochondrial control region of the Eurasian Otter (Lutra lutra) in the Iberian Peninsula. 634
Biological Journal of the Linnean Society, 86, 397-403. 635
Posada D, Crandall KA (1998) MODELTEST: testing the model of DNA substitution. 636
Bioinformatics Applications Notes, 14, 817-818. 637
Paetkau D, Calvert W, Stirling I, Strobeck C (1995) Microsatellite analysis of population 638
structure in Canadian polar bears. Molecular Ecology, 4, 347–354. 639
Pritchard JK, Stephens M, Donnelly P (2000) Inference of population structure using 640
multilocus genotype data. Genetics, 155, 945–959. 641
Randi E, Davoli F, Pierpaoli M et al. (2003) Genetic structure in otter (Lutra lutra) populations 642
in Europe: implications for conservation. Animal Conservation, 6, 93-100. 643
Rice WR (1989) Analyzing tables of statistical tests. Evolution, 43, 223-225. 644
Rogers AR, Harpending HC (1992) Population growth makes waves in the distribution of 645
pairwise genetic differences. Molecular Biology and Evolution, 9, 552-569. 646
Rozas J, Sánchez-DeIBarrio JC, Messeguer X, Rozas R (2003) DNASP, DNA polymorphism 647
analyses by the coalescent and others methods. Bioinformatics, 19, 2496-2497. 648
Ryder OA (1986) Species conservation and systematics: the dilemma of subspecies. Trends 649
in Ecology and Evolution, 1, 9-10. 650
Sambrook J, Fritsch EF, Maniatis T (1989) Molecular Cloning, 2nd edn. Cold Spring Harbor 651
Laboratory Press, New York. 652
Saiki RK, Scharf S, Faloona F et al. (1985) Enzymatic amplification of beta-globin genomic 653
sequences and restriction site analysis for diagnosis of sickle cell anemia. Science, 654
230, 1350-1354. 655

XXXVII
Schneider S, Excoffier L (1999) Estimation of past demography parameters from the 656
distribution of pairwise differences when the mutation rates vary among sites: 657
Application to human mitochondrial DNA. Genetics, 152, 1079-1089. 658
Schneider S, Roessli D, Excoffier L (2000) ARLEQUIN: A Software for Population Genetic 659
Data Analysis, Version 2.0. Genetics and Biometry Laboratory, Department of 660
Anthorpology, University of Geneva, Geneva, Switzerland. 661
Sivasundar A, Bermingham E, Ortí G (2001) Population structure and biogeography of 662
migratory freshwater fishes (Prochilodus: Characiformes) in major South America 663
rivers. Molecular Ecology, 10, 407-417. 664
Slatkin M (1995) A measure of population subdivision based on microsatellite allele 665
frequencies. Genetics, 139, 457–462. 666
Sokal RR, Rohlf FJ (1981) Biometry, the principals and practice of statistics in biological 667
research, 3rd edn. W.H. Freeman & Co., New York. 668
Swofford DL (2002) PAUP*. Phylogenetic Analysis Using Parsimony (*and Others Methods), 669
Version 4. Sinauer Associates, Suderland, Massachusetts. 670
Tajima F (1989) Statistical methods to test for nucleotide mutation hypothesis by DNA 671
polymorphism. Genetics, 123, 585-595. 672
Tchaicka L, Eizirik E, De Oliveira TG, Cândido Jr JF, Freitas TRO (2007) 673
Phylogeography and population history of the crab-eating fox (Cerdocyon thous) 674
Molecular Ecology, 16, 819–838. 675
Vianna JA, Bonde RK, Caballero S et al. (2006) Phylogeography, phylogeny and 676
hibridization in trichechid sirenians: implications for manatee conservation. Molecular 677
Ecology, 15, 433-447. 678
Wright S (1965) The interpretation of population structure by F-statistics with special regard 679
to systems of mating. Evolution, 19, 395-420. 680
681
682
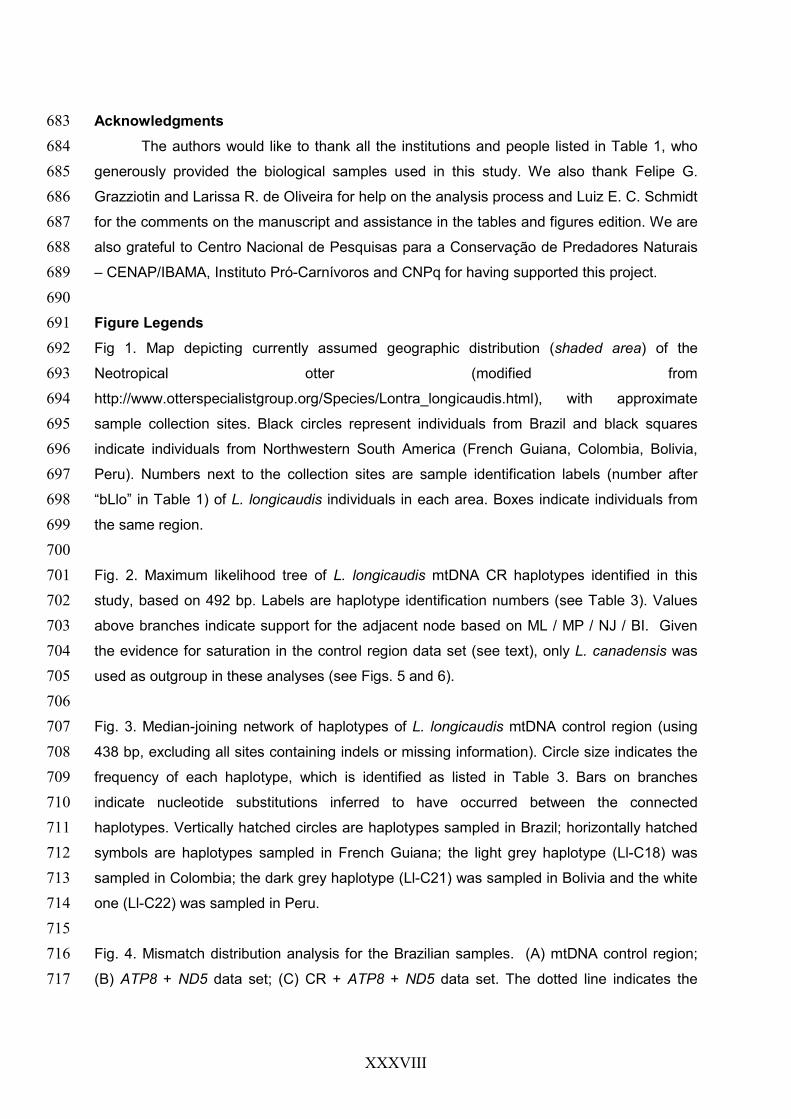
XXXVIII
Acknowledgments 683
The authors would like to thank all the institutions and people listed in Table 1, who 684
generously provided the biological samples used in this study. We also thank Felipe G. 685
Grazziotin and Larissa R. de Oliveira for help on the analysis process and Luiz E. C. Schmidt 686
for the comments on the manuscript and assistance in the tables and figures edition. We are 687
also grateful to Centro Nacional de Pesquisas para a Conservação de Predadores Naturais 688
– CENAP/IBAMA, Instituto Pró-Carnívoros and CNPq for having supported this project. 689
690
Figure Legends 691
Fig 1. Map depicting currently assumed geographic distribution (shaded area) of the 692
Neotropical otter (modified from 693
http://www.otterspecialistgroup.org/Species/Lontra_longicaudis.html), with approximate 694
sample collection sites. Black circles represent individuals from Brazil and black squares 695
indicate individuals from Northwestern South America (French Guiana, Colombia, Bolivia, 696
Peru). Numbers next to the collection sites are sample identification labels (number after 697
“bLlo” in Table 1) of L. longicaudis individuals in each area. Boxes indicate individuals from 698
the same region. 699
700
Fig. 2. Maximum likelihood tree of L. longicaudis mtDNA CR haplotypes identified in this 701
study, based on 492 bp. Labels are haplotype identification numbers (see Table 3). Values 702
above branches indicate support for the adjacent node based on ML / MP / NJ / BI. Given 703
the evidence for saturation in the control region data set (see text), only L. canadensis was 704
used as outgroup in these analyses (see Figs. 5 and 6). 705
706
Fig. 3. Median-joining network of haplotypes of L. longicaudis mtDNA control region (using 707
438 bp, excluding all sites containing indels or missing information). Circle size indicates the 708
frequency of each haplotype, which is identified as listed in Table 3. Bars on branches 709
indicate nucleotide substitutions inferred to have occurred between the connected 710
haplotypes. Vertically hatched circles are haplotypes sampled in Brazil; horizontally hatched 711
symbols are haplotypes sampled in French Guiana; the light grey haplotype (Ll-C18) was 712
sampled in Colombia; the dark grey haplotype (Ll-C21) was sampled in Bolivia and the white 713
one (Ll-C22) was sampled in Peru. 714
715
Fig. 4. Mismatch distribution analysis for the Brazilian samples. (A) mtDNA control region; 716
(B) ATP8 + ND5 data set; (C) CR + ATP8 + ND5 data set. The dotted line indicates the 717

XXXIX
observed frequency of pairwise differences among haplotypes, while the continuous lines 718
depicts the expected frequency under the sudden population expansion model. 719
720
Fig. 5. Maximum likelihood tree of L. longicaudis mtDNA ATP8 + ND5 haplotypes identified in 721
this study. Labels are haplotype identification numbers (see Table 4). Values above 722
branches indicate support for the adjacent node based on ML / MP / NJ / BI. 723
724
Fig. 6. Maximum likelihood tree of L. longicaudis mtDNA CR + ATP8 + ND5 lineages 725
identified in this study, based on 1472 bp. Labels are haplotype identification numbers (see 726
Table 5). Values above branches indicate support for the adjacent node based on ML / MP / 727
NJ / BI. 728
729
Fig. 7. Median-joining network of L. longicaudis mtDNA ATP8 + ND5 haplotypes (using 681 730
bp; all sites containing indels or missing information were excluded). The crossed marks are 731
nucleotide substitutions inferred in that branch. Bars on branches indicate nucleotide 732
substitutions inferred to have occurred between the connected haplotypes. Vertically hatched 733
circles are haplotypes sampled in Brazil; horizontally hatched symbols are haplotypes 734
sampled in French Guiana and Peru; the light grey haplotype (Ll-AN14) was sampled in 735
Colombia; the dark grey one (Ll-AN16) was sampled in Bolivia. 736
737
Fig 8. Median-joining network of L. longicaudis mtDNA CR + ATP8 + ND5 haplotypes (using 738
1164 bp; all sites containing indels or missing information were excluded). The crossed 739
marks are nucleotide substitutions inferred in that branch. Bars on branches indicate 740
nucleotide substitutions inferred to have occurred between the connected haplotypes. 741
Vertically hatched circles are haplotypes sampled in Brazil; horizontally hatched symbols are 742
haplotypes sampled in French Guiana; the light grey haplotype (Ll-ANC21) was sampled in 743
Colombia; the dark grey haplotype (Ll-ANC24) was sampled in Bolivia and the white one (Ll-744
ANC25) was sampled in Peru. 745
746
Fig. 9. Best population clustering result (k = 2 clusters) in a Bayesian analysis of 747
microsatellite data. Each otter individual is represented by a vertical bar partitioned into dark 748
grey and light grey segments, the lengths of which indicate the probability of membership in 749
each population cluster (parenthesis numbers: (1) Brazil; (2) Northwestern South America). 750
Numbers below to the horizontal axe are sample identification labels (number after “bLlo” in 751
Table 1) of L. longicaudis individuals in each area. 752

XL

XLI

XLII
Table 3. List of individuals that bear each mtDNA control region haplotype. Also indicated are the absolute frequency in the total sample (Fr) and the geographic distribution of each haplotype.
Haplotypea Individuals Fr
Country of
haplotype
occurrence
Ll-C1 bLlo01, bLlo03,bLlo11, bLlo24 4 Brazil
Ll-C2A bLlo02, bLlo06, bLlo08, bLlo09, bLlo12, bLlo14, bLlo15, bLlo18, bLlo26, bLlo34, bLlo38, bLlo58, bLlo64
13 Brazil
Ll-C2B bLlo30 1 Brazil
Ll-C3 bLlo05, bLlo39 2 Brazil
Ll-C4 bLlo07 1 Brazil
Ll-C5 bLlo10 1 Brazil
Ll-C6 bLlo16 1 Brazil
Ll-C7 bLlo17 1 Brazil
Ll-C8 bLlo28 1 Brazil
Ll-C9 bLlo29, bLlo37 2 Brazil
Ll-C10 bLlo31 1 Brazil
Ll-C11 bLlo36 1 Brazil
Ll-C12 bLlo42 1 Brazil
Ll-C13 bLlo51 1 Brazil
Ll-C14 bLlo57 1 Brazil
Ll-C15 bLlo60, bLlo61 2 Brazil
Ll-C16 bLlo19, bLlo20 2 French Guiana
Ll-C17 bLlo21, bLlo22 2 French Guiana
Ll-C18 bLlo23 1 Colombia
Ll-C19 bLlo25 1 French Guiana
Ll-C20 bLlo41, bLlo66 2 French Guiana
Ll-C21 bLlo67 1 Bolivia
Ll-C22 bLlo68 1 Peru a Haplotypes with the same number and different letters (e.g. Ll-C2A, 2B) are collapsed into a single haplotype when all sites
with missing information or indels are excluded (e.g. Fig.3).

XLIII
Table 4. List of individuals that bear each mitochondrial DNA ATP8 + ND5 haplotype. Also indicated are the absolute frequency on the total sample (Fr) and the geographic distribution of each
haplotype.
Haplotype a Individuals Fr Country(ies) of
haplotype occurrence
Ll-AN1 bLlo01 1 Brazil
Ll-AN2 bLlo02, bLlo14, bLlo15 3 Brazil
Ll-AN3 bLlo03, bLlo24, bLlo31 3 Brazil
Ll-AN4A bLlo05, bLlo06, bLlo08, bLlo12, bLlo16,
bLlo29, bLlo30, bLlo34, bLlo57, bLlo58 10 Brazil
Ll-AN4B bLlo60, bLlo61 2 Brazil
Ll-AN5 bLlo07 1 Brazil
Ll-AN6 bLlo09, bLlo39 2 Brazil
Ll-AN7 bLlo10 1 Brazil
Ll-AN8 bLlo11 1 Brazil
Ll-AN9 bLlo17 1 Brazil
Ll-AN10 bLlo42 1 Brazil
Ll-AN11A bLlo19 1 French Guiana
Ll-AN11B bLlo20 1 French Guiana
Ll-AN12A bLlo21, bLlo68 2 French Guiana, Peru
Ll-AN12B bLlo25 1 French Guiana
Ll-AN13 bLlo22 1 French Guiana
Ll-AN14 bLlo23 1 Colombia
Ll-AN15 bLlo41, bLlo66 2 French Guiana
Ll-AN16 bLlo67 1 Bolivia a Haplotypes with the same number and different letters (e.g. Ll-AN4A, 4B) are collapsed into a
single haplotype when all sites with missing information or indels are excluded (e.g. Fig.5).

XLIV
Table 5. List of individuals that bear each mitochondrial DNA CR + ATP8 + ND5 haplotype. Also indicated are the absolute frequency on the total sample (Fr) and the geographic distribution of each haplotype.
Haplotype a Individuals Fr Country of haplotype
occurrence
Ll-ANC1 bLlo01 1 Brazil
Ll-ANC2 bLlo02, bLlo14, bLlo15 3 Brazil
Ll-ANC3 bLlo03, bLlo24 2 Brazil
Ll-ANC4 bLlo05 1 Brazil
Ll-ANC5 bLlo06, bLlo08, bLlo12, bLlo34, bLlo58 5 Brazil
Ll-ANC6 bLlo07 1 Brazil
Ll-ANC7 bLlo09 1 Brazil
Ll-ANC8 bLlo10 1 Brazil
Ll-ANC9 bLlo11 1 Brazil
Ll-ANC10 bLlo16 1 Brazil
Ll-ANC11 bLlo17 1 Brazil
Ll-ANC12 bLlo29 1 Brazil
Ll-ANC13 bLlo30 1 Brazil
Ll-ANC14 bLlo31 1 Brazil
Ll-ANC15 bLlo39 1 Brazil
Ll-ANC16 bLlo42 1 Brazil
Ll-ANC17 bLlo57 1 Brazil
Ll-ANC18 bLlo60, bLlo61 2 Brazil
Ll-ANC19A bLlo19 1 French Guiana
Ll-ANC19B bLlo20 1 French Guiana
Ll-ANC20 bLlo21 1 French Guiana
Ll-ANC21 bLlo23 1 Colombia
Ll-ANC22 bLlo25 1 French Guiana
Ll-ANC23 bLlo41, bLlo66 2 French Guiana
Ll-ANC24 bLlo67 1 Bolivia
Ll-ANC25 bLlo68 1 Peru a Haplotypes with the same number and different letters (e.g. Ll-ANC19A, 19B) are collapsed into a single
haplotype when all sites with missing information or indels are excluded (e.g. Fig.7).

XLV
Table 6. Nucleotide and haplotype diversity observed in the Lontra longicaudis mtDNA segments, specified separately for different geographically defined populations.
Segmenta Groupb Nucleotide diversity (SE)c Haplotype diversity (SE)c
CR Brazil 0.0062 ± 0.0019 0.8217 ± 0.0106
FG 0.0165 ± 0.0039 0.8571 ± 0.0386
NW 0.0178 ± 0.0040 0.9333 ± 0.0196
Total 0.0113 ± 0.0027 0.8911 ± 0.0060
ATP8 + ND5 Brazil 0.0019 ± 0.0006 0.7754 ± 0.0153
FG 0.0058 ± 0.0016 0.9048 ± 0.0389
NW 0.0094 ± 0.0019 0.9333 ± 0.0196
Total 0.0059 ± 0.0013 0.8762 ± 0.0077
CR + ATP8 + ND5 Brazil 0.0038 ± 0.0009 0.9538 ± 0.0053
FG 0.0100 ± 0.0018 0.8667 ± 0.0527
NW 0.0124 ± 0.0018 0.9444 ± 0.0233
Total 0.0081 ± 0.0012 0.9714 ± 0.0027 a CR: mtDNA control region; ATP8: ATPase subunit 8; ND5: NADH dehydrogenase subunit 5.
b FG: French Guiana; NW: Northwestern South America (including French Guiana, Peru, Bolivia and Colombia). c All sites containing indels or missing information were excluded from this analysis. SE: standard error.

XLVI
Table 7. Measures of microsatellite diversity in the two geographic groups of the Neotropical otter investigated in this study.
Brazil Northwestern South America
Locus Na NEAb SR (bp)c Hed Ho
e HWEf
(P) Na NEAb SR (bp)c He
d Hoe
HWEf
(P)
Lut453 6 3 136-146 0.756 0.704 ns 3 0 138-144 0.648 0.429 ns
Lut701 6 1 180-198 0.680 0.826 ns 7 2 172-198 0.924 0.833 ns
Lut733 7 2 154-178 0.756 0.690 ns 5 0 154-170 0.758 0.714 ns
Lut782 6 2 178-198 0.672 0.517 ns 5 1 182-206 0.803 0.500 ns
RIO06 8 5 261-289 0.729 0.630 ns 3 0 275-281 0.711 0.000 ns
RIO07 8 5 176-194 0.791 0.379 * 3 0 182-186 0.604 0.286 ns
RIO11 11 7 168-188 0.895 0.862 ns 4 0 168-182 0.758 0.429 ns
RIO18 11 7 142-174 0.827 0.462 * 5 1 142-154 0.670 0.429 ns
RIO19 9 5 286-306 0.712 0.571 ns 6 2 290-304 0.747 0.571 ns
RIO20 8 5 261-279 0.845 0.250 * 3 0 265-269 0.545 0.000 ns
Mean 8 4.2 - 0.766 0.589 - 4.4 0.6 - 0.717 0.419 - a Number of alleles
b Number of exclusive alleles
c Size range
d Expected heterozygosity
e Observed heterozygosity
f Deviation from Hardy-Weinberg Equilibrium
* Significant after Bonferroni adjustment (p < 0.001)

XLVII

XLVIII
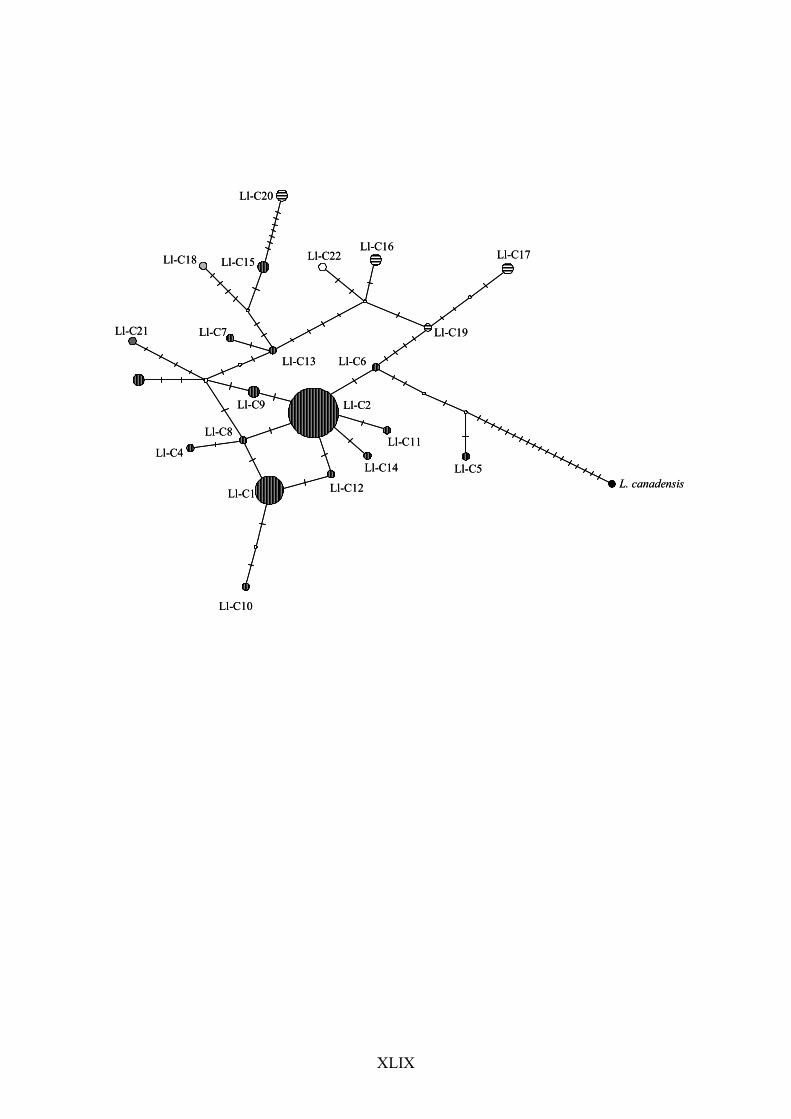
XLIX
Ll-C21
Ll-C20
Ll-C2
Ll-C12Ll-C1
Ll-C10
Ll-C8
Ll-C4
Ll-C14
Ll-C11
Ll-C6
Ll-C9
Ll-C17
Ll-C13
Ll-C15Ll-C18
Ll-C7
Ll-C5
Ll-C19
Ll-C16Ll-C22
L. canadensis
Ll-C21
Ll-C20
Ll-C2
Ll-C12Ll-C1
Ll-C10
Ll-C8
Ll-C4
Ll-C14
Ll-C11
Ll-C6
Ll-C9
Ll-C17
Ll-C13
Ll-C15Ll-C18
Ll-C7
Ll-C5
Ll-C19
Ll-C16Ll-C22
L. canadensis

L

LI
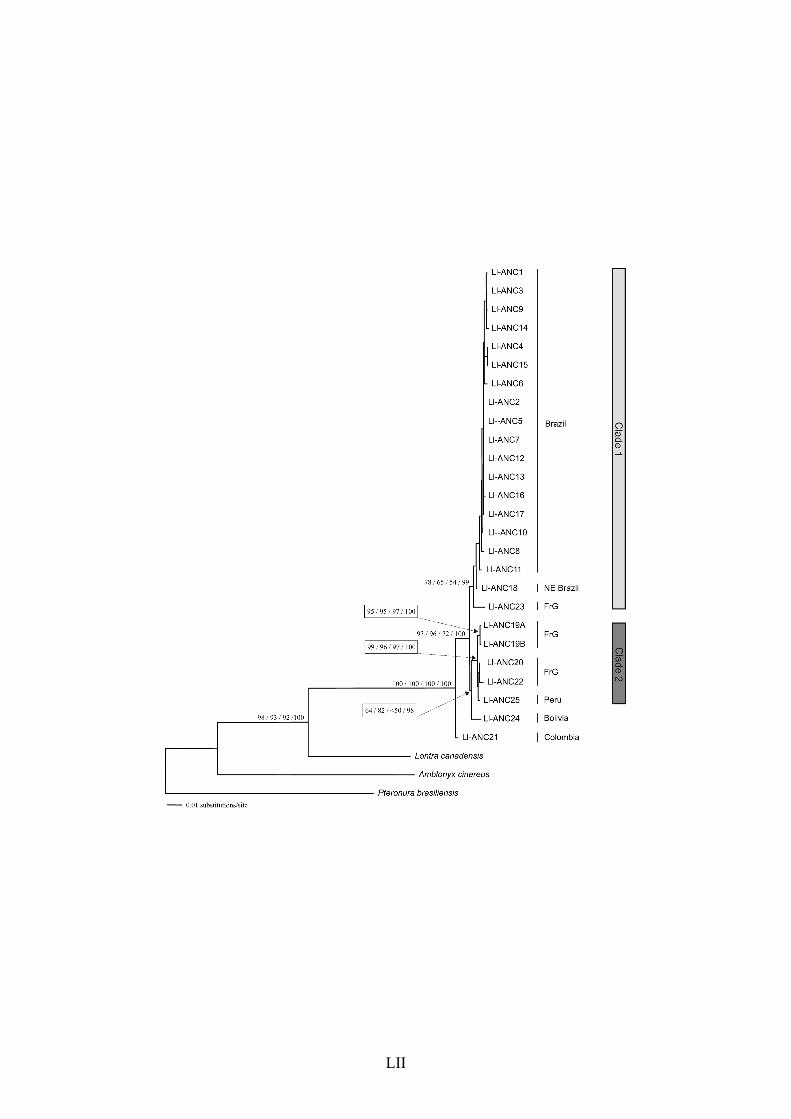
LII
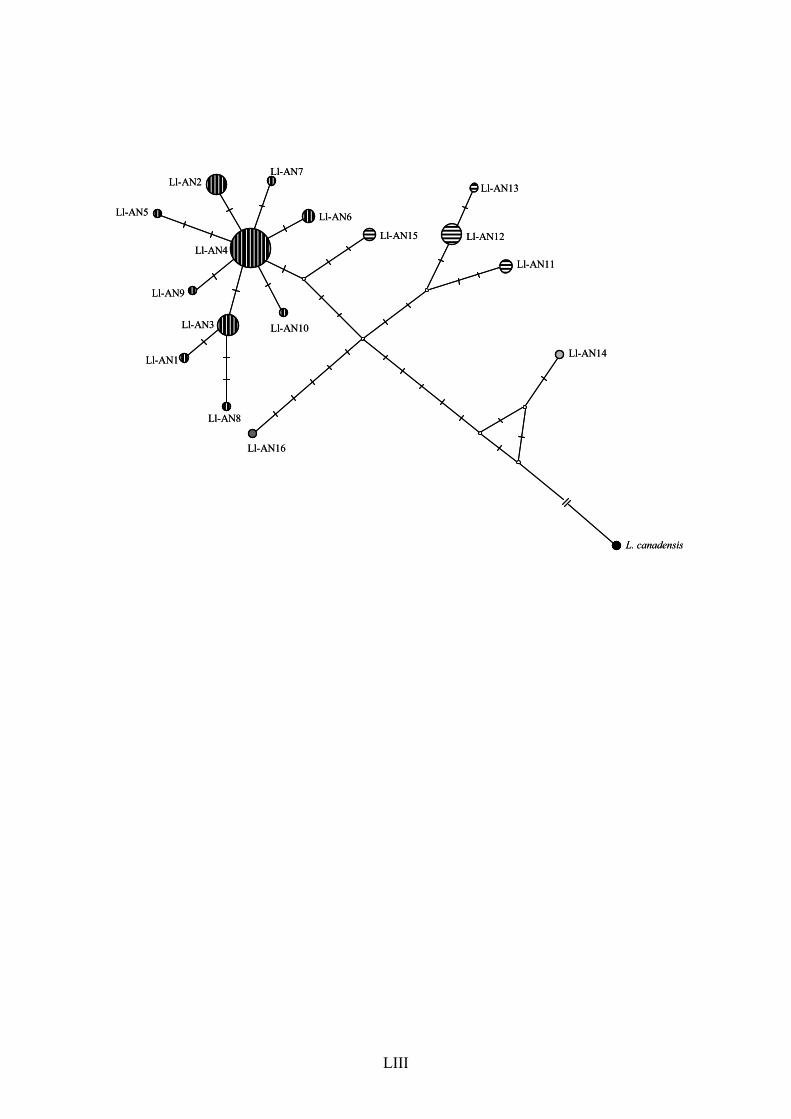
LIII
Ll-AN5
Ll-AN2Ll-AN7
Ll-AN6
Ll-AN15
Ll-AN9
Ll-AN3
Ll-AN1
Ll-AN8
Ll-AN10
Ll-AN11
Ll-AN12
Ll-AN14
L. canadensis
Ll-AN4
Ll-AN16
Ll-AN13
Ll-AN5
Ll-AN2Ll-AN7
Ll-AN6
Ll-AN15
Ll-AN9
Ll-AN3
Ll-AN1
Ll-AN8
Ll-AN10
Ll-AN11
Ll-AN12
Ll-AN14
L. canadensis
Ll-AN4
Ll-AN16
Ll-AN13

LIV
Ll-ANC8
Ll-ANC10
Ll-ANC2Ll-ANC17
Ll-ANC7
Ll-ANC13
Ll-ANC16
Ll-ANC3
Ll-ANC6
Ll-ANC9Ll-ANC1
Ll-ANC14
Ll-ANC12
Ll-ANC24
Ll-ANC4
Ll-ANC15
Ll-ANC11
Ll-ANC23
Ll-ANC18
Ll-ANC19
Ll-ANC25 Ll-ANC20
Ll-ANC22
Ll-ANC-21L. canadensis
Ll-ANC5
Ll-ANC8
Ll-ANC10
Ll-ANC2Ll-ANC17
Ll-ANC7
Ll-ANC13
Ll-ANC16
Ll-ANC3
Ll-ANC6
Ll-ANC9Ll-ANC1
Ll-ANC14
Ll-ANC12
Ll-ANC24
Ll-ANC4
Ll-ANC15
Ll-ANC11
Ll-ANC23
Ll-ANC18
Ll-ANC19
Ll-ANC25 Ll-ANC20
Ll-ANC22
Ll-ANC-21L. canadensis
Ll-ANC5

LV
LVI
Author Information Box
This project is part of Cristine S. Trinca’s M. Sc. thesis at the Graduate Program in Zoology
of the Pontifícia Universidade Católica do Rio Grande do Sul (PUCRS), Brazil, where she is
advised by Dr. Eduardo Eizirik. Her research interests are focused on population genetics,
ecology, phylogeography and conservation of Neotropical otters. Dr. Helen Waldemarin is an otter
biologist interested in ecology, behavior and conservation of Neotropical populations of this group.
Dr. Klaus-Peter Koepfli works on carnivore phylogenetics, evolutionary biology and biogeography.
Dr. Benoit de Thoisy is a conservation biologist interested in diverse issues pertaining to genetics
and ecology of South American taxa. Dr. Eizirik is an evolutionary biologist focusing most of his
research on phylogenetics, conservation genetics and molecular ecology of Neotropical carnivores.

Capítulo III – Discussão Geral
LVIII
Os resultados obtidos no presente trabalho evidenciam a existência de padrões
filogeográficos claros em Lontra longicaudis. A partir das análises filogenéticas e populacionais
realizadas, são discutidas algumas hipóteses a respeito da história demográfica desta espécie,
bem como sugestões para incorporar estas informações no planejamento de estratégias
adequadas para a conservação e manejo da mesma. Inferências sobre os padrões de variabilidade
nos segmentos de mtDNA utilizados no estudo foram realizadas, avaliando-se seu desempenho
como marcadores para estudos evolutivos recentes em mustelídeos. Estes aspectos foram
abordados na discussão do artigo precedente. Sendo assim, neste espaço, será feita uma breve
revisão dos mesmos, salientando alguns aspectos e implicações adicionais.
O presente trabalho é o primeiro a caracterizar a diversidade genética e a estruturação
geográfica observada em populações naturais de L. longicaudis, uma vez que os únicos estudos
até o momento incluindo esta espécie são análises filogenéticas da família Mustelidae e da
Subfamília Lutrinae em geral (Van Zyll de Jong 1987; Koepfli & Wayne 1998, 2003; Marmi et al.
2004), não abordando qualquer aspecto genético e/ou populacional da lontra Neotropical em
particular. Alguns estudos desta natureza foram realizados até o momento para outras espécies de
mustelídeos (p.ex. Mucci et al. 1999; Kyle & Strobeck 2001; Fleming & Cook 2002; Blundell et al.
2002; Broquet et al. 2006; Pertoldi et al. 2006), o que permite comparações iniciais com os
resultados aqui obtidos. Estas comparações indicam que a lontra Neotropical apresenta níveis
relativamente altos de diversidade genética nos segmentos mitocondriais empregados, bem como
alta variabilidade nos locos de microssatélite analisados.
A região controladora têm sido bastante empregada em estudos evolutivos e demográficos
de diversas espécies de mamíferos, revelando padrões filogeográficos claros em diversas espécies
de vertebrados (Sivasundar et al. 2001; Márquez et al. 2006; Tchaicka et al. 2007). Entretanto, este
segmento, apesar de bastante variável, não apresentou boa resolução na identificação de padrões
de estruturação geográfica e história evolutiva de Lontra longicaudis. Nota-se que apesar de
relativamente variável em nível intra-específico, quando utilizado para comparações
interespecíficas, sua variabilidade é bastante reduzida, dando claras indicações de saturação.
Entretanto, ainda assim, este segmento mostrou-se mais variável do que em Lutra lutra, em que
diversos estudos encontraram uma diversidade nucleotídica e haplotípica bastante reduzida em
diversas regiões da Europa (Mucci et al. 1999; Effenberger & Suchentrunk 1999; Cassens et al.
2000; Pérez-Haro et al. 2005).
Comparações com outros estudos realizados com diversas espécies de carnívoros sugerem
moderados níveis de variabilidade genética no DNA mitocondrial de Lontra longicaudis. A
diversidade haplotípica geral encontrada para a região controladora do mtDNA é relativamente alta
(hConc= 0.8911 ± 0.0060), em comparação, por exemplo, com Mustela lutreola (h = 0.469 e 0.939,

LIX
para duas populações da Europa; Michaux et al. 2005), Enhydra lutris (h = 0.412; Larson et al.
2002) e Lutra lutra (h = 0.16 ± 0.06; Ferrando et al. 2004). A diversidade nucleotídica encontrada
neste conjunto de dados é moderada (π = 0.0113 ± 0.0027) comparada com estimativas obtidas
para outros mustelídeos, como por exemplo, Lutra lutra (π = 0.0006; Ferrando et al. 2004), e
Mustela lutreola (π = 0.012 ± 0.058 e 0.0012 ± 0.088 para cada uma das duas populações
analisadas). Em contrapartida, uma menor diversidade é observada quando comparada a Enhydra
lutris (π = 0.098 ± 0.029; Larson et al. 2002).
Johnson et al. (1999) utilizaram os genes ATP8 e ND5 na investigação de padrões
filogeográficos de quatro espécies de pequenos felinos neotropicais. A diversidade nucleotídica (π)
encontrada variou de 0.0029 (Oncifelis guigna) a 0.0126 apresentando grande número de sítios
polimórficos (em média 36, exceto para O. guigna). Os valores encontrados para L. longicaudis
podem ser considerados altos (36 sítios polimórficos e π = 0.0080 ± 0.0015).
Todavia, comparações com outras espécies de carnívoros, especialmente mustelídeos,
sobre a variabilidade dos segmentos dos genes ATP8 e ND5 não puderam ser realizadas, pois os
estudos realizados até o momento não utilizaram estas regiões do mtDNA.
Quando a diversidade genética é comparada entre os segmentos empregados, a região
controladora é mais variável do que os genes ATP8 e ND5, entretanto, em comparações
interespecíficas, estes dois apresentam-se muito mais informativos. Isto também fica evidente na
análise das árvores filogenéticas, as quais foram claras em demonstrar sinais filogeográficos, com
exceção daquela construída somente com a porção hipervariável I da região controladora (Fig. 2).
Isto sugere que este segmento esteja saturado de mutações, perdendo assim poder informativo.
Este resultado é interessante do ponto de vista experimental e analítico, uma vez que a região
controladora tem sido muito utilizada para investigar padrões filogeográficos com diversas espécies
de vertebrados. Caso o padrão da região controladora observado para Lontra longicaudis venha a
ser corroborado em outras espécies, é possível que a escolha preferencial deste segmento como
portador de sinais filogeográficos seja questionada.
Em contrapartida, os genes ATP8 e ND5 apresentaram alta diversidade intra- e
interespecífica, sendo que devido ao tamanho do segmento e número de sítios polimórficos e
informativos para as análises dentro e entre espécies, o gene ND5 parece, neste caso, ser o mais
indicado para análises filogeográficas.
Com relação aos locos de microssatélite, estes se mostraram bastante variáveis, com
grande número de alelos, comparados às espécies para os quais foram descritos (Lontra
canadensis, Beheler et al. 2004, 2005; Lutra lutra, Dallas & Piertney 1998). Beheler et al. (2004,
2005) encontraram, em geral, menor número de alelos e maior heterozigosidade em L. canadensis
em relação ao observado para L. longicaudis. Este fato, porém, pode ser um efeito do tamanho
LX
amostral analisado para L. longicaudis, o qual pode não ter sido totalmente representativo da
variabilidade nestes locos na espécie em questão. Dallas & Piertney (1998) encontraram números
semelhantes de alelos, todavia, em menor nível de heterozigosidade do que o observado em L.
longicaudis.
Estudos direcionados à análise e estruturação da variabilidade genética de populações
naturais de Lutra lutra foram realizados em diversas regiões da Europa e Ásia (Dallas et al. 2002;
Randi et al. 2003; Hung et al. 2004), os quais utilizaram alguns dos mesmos locos de microssatélite
empregados neste estudo. De um modo geral, estes locos demonstraram-se tão ou mais variáveis
em Lontra longicaudis do que em Lutra lutra, indicando que os marcadores selecionados são
eficientes para a investigação de parâmetros populacionais naquela espécie.
As análises de mtDNA revelaram a existência de um padrão filogeográfico claro, sem
compartilhamento de haplótipos entre as regiões. Este padrão é necessariamente decorrente de
um extenso período de isolamento entre as populações ancestrais (Avise et al. 1987). Os
resultados obtidos indicam a existência de quatro entidades filogeográficas, duas delas
sustentadas por um conjunto amostral robusto e as outras duas representadas por apenas um
indivíduo cada. Os dois maiores grupos de linhagens de mtDNA são representados pelo Clado 1, o
qual compreende todas as linhagens brasileiras e uma proveniente da Guiana Francesa, e o Clado
2 incluindo todos os outros haplótipos encontrados na Guiana Francesa e Peru.
As duas outras linhagens de mtDNA são provenientes da Bolívia e da Colômbia. Coletado
na Cordilheira central dos Andes, o indivíduo proveniente da Colômbia revelou conter a linhagem
mais divergente, sugerindo que a Cordilheira dos Andes pode ser uma barreira ao fluxo gênico
entre os indivíduos localizados a Leste e Oeste da mesma. Contudo, o tempo de divergência entre
esta linhagem e o restante, parece bastante recente (644 mil anos atrás), indicando que o episódio
de isolamento deste grupo foi posterior ao surgimento desta provável barreira.
O tempo de divergência entre L. longicaudis e L. canadensis datado foi cerca de 4.16 Ma. A
divergência média entre o haplótipo Colombiano e as outras linhagens foi estimada em 0.644 Ma,
enquanto que a separação da linhagem encontrada na Bolívia e dos Clados 1 e 2 foi datada em
aproximadamente 450 mil anos. Estes dois clados apresentaram uma alopatria quase completa,
exceto por um haplótipo geograficamente proveniente da Guiana Francesa incluído no Clado 1,
predominantemente brasileiro. Este dado indica haver alguma conectividade (ao menos ancestral)
entre as populações destas duas regiões, onde o sentido de colonização seria Norte–Sul, tendo em
vista as posições dos haplótipos da Guiana Francesa e do Nordeste brasileiro (basal entre todas as
seqüências do Brasil) no Clado 1. De especial interesse é a datação do tempo de divergência na
base do Clado 1 (separação entre o haplótipo da Guiana e o grupo brasileiro de linhagens), a qual
foi estimada em 0.422 Ma. A coalescência das linhagens brasileiras foi datada em cerca de 196

LXI
Ma. Além disso, os haplótipos da Guiana Francesa demonstram algum grau de sub-estruturação
indicado pelas análises filogenéticas, com tempo de divergência datado em aproximadamente 176
mil anos atrás.
Apesar de Colômbia e Bolívia serem, cada uma, representadas por apenas um indivíduo,
sua posição consistente nas várias análises e o alto grau de apoio aos principais ramos das
árvores filogenéticas indica que há uma alta probabilidade de haver entidades demográficas
distintas nestas regiões.
Resultados obtidos através das análises dos locos de microssatélite concordam com aqueles
revelados pelo mtDNA, indicando haver clara separação entre o Brasil e o Noroeste da América do
Sul (apoiado pelo alto valor de FST e pelos testes de associação). Entretanto, devido ao pequeno
tamanho amostral, não foi possível testar cenários mais refinados de estruturação geográfica da
variabilidade genética destes marcadores. Fluxo gênico no sentido Norte-Sul também pode ser
inferido, revelado pelos testes de associação, os quais indicaram haver um indivíduo com
localização geográfica na Guiana Francesa e que apresentou maior similaridade de alelos com as
amostras brasileiras.
Entretanto, estudos mais aprofundados e com maior tamanho amostral devem ser
conduzidos em diferentes escalas geográficas, a fim de desvendar padrões ainda desconhecidos e
também confirmar se estas subdivisões devem ser interpretadas como Unidades de Manejo (MUs)
ou Unidades Evolutivamente Significativas (ESUs), merecendo considerações próprias em
iniciativas de conservação.
É importante definir quais populações devem ser consideradas separadamente para fins de
conservação, de modo a não interferir na distribuição geográfica da diversidade genética formada
através dos processos históricos. Esforços isolados voltados para a conservação da espécie estão
em desenvolvimento, abordando especialmente aspectos ecológicos, enquanto persiste uma
carência significativa de informações sobre a composição genética das populações naturais de
Lontra longicaudis. A identificação detalhada de unidades populacionais com diferenciação
genética e/ou demográfica ao longo da distribuição da espécie é extremamente importante para
uma avaliação precisa da representatividade das áreas protegidas, e o desenho adequado de
estratégias de conservação.

Capítulo IV - Referências Bibliográficas

LXIII
Arrendal J, Walker CW, Sundqvist A, Hellborg L, Vilà C (2004) Genetic evaluation of a
translocation program. Conservation Genetics, 5, 79-88.
Asquith NM, Wright SJ, Clauss MJ (1997) Does mammal community composition control
recruitment in neotropical forests? Evidence from Panama. Ecology, 78, 941-946.
Avise JC, Arnold J, Ball RM, Bermingham E, Lamb T, Neigel JE, Reeb CA, Saunders NC (1987)
Intraspecific Phylogeography: the mithocondrial DNA bridge between populations genetics and
systematics. Annual Review of Ecology and Systematics, 18, 489-522.
Avise JC, Bowen B, Lamb T, Meylan AB, Berminghom E (1992) Mitochondrial DNA evolution at a
turtle’s pace: evidence for low genetic variability and reduced microevolutionary rate in
Testudines. Molecular Biology and Evolution, 9, 457-473.
Avise JC (2000) Phylogeography – The history and formation the species. Harvard University
Press, Cambridge, Massachusetts.
Baker CS, Pery A, Bannister JL, Weinrich MT, Abernethy RB, Calambokidis K, Lien J, Lambertsen
RH, Urban-Ramirez J, Vasquez O, Clapham PJ, Alling A, O’Brien SJ, Palumbi SR (1993)
Abundant mitochondrial DNA variation and world-wide population structure in humpback
whales. Proceedings of the National Academy of Sciences, 90, 8239-8243.
Ballard JWO, Whitlock MC (2004) The incomplete natural history of mitochondria. Molecular
Ecology, 13, 729-744.
Beheler AS, Fike JA, Murfitt LM, Rhodes Jr OE, Serfass TS (2004) Development of polymorphic
microsatellite loci for North American river otters (Lontra canadensis) and amplification in
related Mustelids. Molecular Ecology Notes, 4, 56-58.
Beheler AS, Fike JA, Murfitt LM, Dharmarajan G, Rhodes Jr OE, Serfass TS (2005) Ten new
polymorphic microsatellite loci for North American river otters (Lontra canadensis) and their
utility in related mustelids. Molecular Ecology Notes, 5, 602-604.
Bermingham E, Moritz C (1998) Comparative phylogeography: concepts and applications.
Molecular Ecology, 7, 367-369.
Blacher C (1987) Ocorrência e preservação de Lutra longicaudis (Mammalia: Mustelidae) no
Litoral de Santa Catarina. Boletim da Fundação Brasileira para Conservação da Natureza, 22,
105-117.
Blundell GM, Ben-David M, Groves P, Bowyer RT, Geffen E (2002) Characteristics of sex-biased
dispersal and gene flow in coastal river otters: implications for natural recolonization of
extirpated populations. Molecular Ecology, 13, 289-303.
Broquet T, Johnson CA, Petit E, Thompson I, Burel F, Fryxell M (2006) Dispersal and genetic
structure in the American marten, Martes americana. Molecular Ecology, 15, 1689-1697.
LXIV
Bruford MW, Wayne RK (1993) Microsatellite and their application to population genetic studies.
Current Opinion in Genetics & Development, 3, 939-943.
Cassens I, Tiedemann R, Suchentrunk F, Hartl GB (2000) Mitochondrial DNA Variation in the
Europian Otter (Lutra lutra) and the Use of Spatial Autocorrelation Analysis in Conservation.
The Journal of Heredity, 91, 31-41.
Cegelski CC, Waits LP, Anderson NJ (2003) Assessing population structure e gene flow in
Montana wolverines (Gulo gulo) using assignment-based approaches. Molecular Ecology, 12,
2907-2918.
Chebez JC (1999) Los que se van – Espécies argentinas em peligro. Buenos Aires, Editorial
Albatroz Saci.
Chehébar CE (1990) Action Plan from Latin American Otters In: Otters: An Action Plan for their
Conservation (eds. Foster-Turley P, Macdonald S, Mason C), pp. 64-73. IUCN Otter Specialist
Group.
Cimardi AV (1996) Mamíferos de Santa Catarina, 1a ed. Florianópolis: FATMA.
Ciofi C, Bruford MW (1999) Genetic structure e gene flow among Komodo dragon populations
inferred by microsatellite loci analysis. Molecular Ecology, 8, 17-30.
Colares EP, Best RC (1991) Blood parameters of amazon otters (Lutra longicaudis, Pteronura
brasiliensis) (Carnivora, Mustelidae). Comparative Biochemistry and Physiology, 99A, 513-515.
Colares EP, Silva MNF (1987) Efeito da redução da alimentação na digestibilidade em lontras
Lutra longicaudis (Mammalia: Mustelidae). In: II Reunião de trabalhos de especialistas em
mamíferos aquáticos da América do Sul.
Colares EP, Waldemarin HF (2000) Feeding of the neotropical river otter (Lontra longicaudis) in
the coastal region of the Rio Grande do Sul State, Southern Brazil. IUCN Otter Specialist
Group Bulletin, 17, 6–13.
Crandall KA, Bininda-Emond ORP, Mace GM, Wayne RK (2000) Considering evolutionary process
in conservation biology. Trends in Ecology and Evolution, 15, 290-295.
Dallas JF, Piertney SB (1998) Microsatellite primers for the Eurasian otter. Molecular Ecology, 7,
1248-1251.
Dallas JF, Bacon PJ, Carss DN, Conroy JWH, Green R, Jefferies DJ, Kruuk H, Marshall F,
Piertney SB, Racey PA (1999) Genetic diversity in the Eurasian otter, Lutra lutra, in Scotland.
Evidence from microsatellite polymorphism. Biological Journal of the Linnean Society, 68, 71-
86.
Dallas JF, Carss DN, Marshall F, Koeplfi KP, Kruuk H, Piertney SB, Bacon PJ (2000) Sex
identification of the Eurasian otter Lutra lutra by PCR typing of spraints. Conservation
Genetics, 1, 181-183.

LXV
Dallas JF, Marshall F, Piertney SB, Bacon PJ, Racey P (2002) Spatially restricted gene flow and
reduced microsatellite polymorphism in the Eurasian otter Lutra lutra in Britain. Conservation
Genetics, 3, 15-29.
DeSalle R, Amato G (2004) The expansion of conservation genetics. Nature Reviews Genetics, 5,
702-712.
DeYoung RW, Honeycutt RL (2005) The molecular toolbox: genetic techniques in wildlife ecology
and management. Journal of Wildlife Management, 69, 1362-1384.
Dragoo JM, Honeycutt R (1997) Systematics of Mustelid-like Carnivores. Journal of Mammalogy,
78, 426-443.
Duarte JCS, Rebêlo GH (1985) Carnivore skins held in Brazil. Trafic bulletin, 7, 16-17.
Effenberger S, Suchentrunk F (1999) RFLP analyses of the mitochondrial DNA of otters (Lutra
lutra) from Europe – implications for conservation of a flagship species. Biological
Conservation, 90, 229-234.
Eisenberg JF, Redford KH (1999) Mammals of the Neotropics, Vol. 3. The Central Tropics:
Ecuador, Peru, Bolivia, Brazil. Chicago, London, University of Chicago Press.
Eizirik E (1996) Ecologia molecular, genética da conservação, e o conceito de Unidades
Evolutivamente Significativas. Revista Brasileira de Genética, 19, 23-29.
Eizirik E, Kim J, Menotti-Raymond M, Crawshaw Jr PG, O’Brien SJ, Johnson WE (2001)
Phylogeography, population history e conservation of jaguars (Panthera onca, Mammalia,
Felidae). Molecular Ecology, 10, 65-79.
Emmons LH (1990) Neotropical Rainforest Mammals: A field guide. Chicago, London, University of
Chicago Press.
Ferrando A, Ponsà M, Marmi J, Domingo-Roura X (2004) Eurasian otters, Lutra lutra, have a
dominant mtDNA haplotype from the Iberian Península to Scandinavia. The Journal of
Heredity, 95, 430-435.
Fleming MA, Cook JA (2002) Phylogeography of endemic ermine (Mustela erminea) in southeast
Alaska. Molecular Ecology, 11, 795–807.
Flynn JJ, Finarelli JÁ, Zehr S, Hsu J, Nedbal MA (2005) Molecular phylogeny of the Carnivora
(Mammalia): assessing the impact of increased sampling on resolving enigmatic relationships.
Systematic Biology, 54, 317-337.
Fonseca GAB, Robinson J (1988) Forest size and structure: competitive and predatory effects on
small mammal communities. Biological Conservancy, 53, 265-294.
Fonseca GA, Rylands AB, Costa CMR, Machado RB, Leite YLR (1994) Livro vermelho dos
mamíferos ameaçados de extinção. Belo Horizonte, Fundação Biodiversitas.

LXVI
Foster-Turley P, Macdonald S, Mason CF (1990) Otters: An action plan for their conservation.
IUCN/SSC Otter Specialist Group.
Frankham R, Ballou JD, Briscoe DA (2002) Introduction to Conservation Genetics. Cambridge
University Press, Cambridge.
Frantz AC, Pope LC, Carpenter PJ, Roper TJ, Wilson GJ, Delahay RJ, Burke T (2003) Reliable
microssatellite genotyping of the Eurasian badger (Meles meles) using faecal DNA. Molecular
Ecology, 12, 1649-1661.
Fraser DJ, Bernatchez L (2001) Adaptive evolutionary conservation: towards a unified concept for
defining conservation units. Molecular Ecology, 10, 2741–2752.
Fulton TR, Strobeck C (2006) Molecular phylogeny of the Arctoidea (Carnivora): Effects of missing
data on supertree and supermatrix analyses of multiple gene data sets. Molecular
Phylogenetics and Evolution, 41, 1665-181.
Gallo JP (1986) Otters in México. Journal of the Otter Trust, 1, 19-24.
Gallo JP (1989) Distribución y estado actual de la nutria o perro de agua (Lutra longicaudis
annectens Major, 1897) en la Sierra Madre del Sur, México. Tese de Mestrado, Universidad
Nacional Autónoma de México.
Gallo JP (1997) Situación y distribución de las nutrias en México, con énfasis en Lontra
longicaudis annectens (Major, 1897). Revista Mexicana de Mastozoología, 2, 10-32.
Helder J, De Andrade HK (1997) Food and feeding habitats of the neotropical river otter Lontra
longicaudis (Carnivora, Mustelidae). Mammalia, 61, 193-203.
Hey J, Machado CA (2003) The study of structured populations — new hope for a difficult and
divided science. Nature Reviews Genetics, 4, 535-543.
Huang C, Hsu C, Lee L, Li S (2005) Isolation and characterization of tetramicrosatellite DNA
markers in the Eurasian otter (Lutra lutra). Molecular Ecology Notes, 5, 314-316.
Hung C, Li S, Lee L (2004) Faecal DNA typing to determine the abundance and spatial
organisation of otters (Lutra lutra) along two stream systems in Kinmen. Animal Conservation,
7, 301-311.
IBAMA - Instituto Brasileiro do Meio Ambiente e dos Recursos Naturais Renováveis (1997)
Mamíferos aquáticos do Brasil: Plano de Ação. Brasília.
IBAMA - Instituto Brasileiro do Meio Ambiente e dos Recursos Naturais Renováveis (2004) Plano
de ação: Pesquisa e Conservação de mamíferos carnívoros do Brasil. Centro Nacional de
Pesquisa e Conservação dos Predadores Naturais – CENAP, São Paulo.
Indrusiak CB, Eizirik E (2003) Carnívoros. In: Livro vermelho da fauna ameaçada de extinção no
Rio Grande do Sul. Edipucrs, Porto Alegre.

LXVII
IUCN (2006) IUCN Red List of Threatened Species. <www.iucnredlist.org> Downloaded in 27
February 2007.
Johnson WE, Pecon-Slattery J, Eizirik E, Kim JH, Menotti-Raymond M, Bonacic C, Cambre R,
Crawshaw P, Nunes A, Seuánez HN, Seymour KL, Simon F, Swanson W, O’Brien SJ (1999)
Disparate phylogeography patterns of molecular genetic variation in four closely related South
American small cat species. Molecular Ecology, 8, 79-92.
Johnson WE, Eizirik E, Roelke-Parker M, O’Brien SJ (2001) Applications of genetic concepts e
molecular methods to carnivore conservation. In: Carnivore Conservation (eds. Gittleman JL,
Funk SM, MacDonald D, Wayne RK), pp. 335-358. Cambridge University Press, Cambridge.
Kitching RL (1986) Prey-Predator Interactions. In: Community Ecology: Patterns and Process (eds.
Kikkawa J, Anderson DJ), pp. 214-240. Blackell Scientific Publications.
Koepfli KP, Wayne RK (1998) Phylogenetic relationships of otters (Carnivora: Mustelidae) based
on mitochondrial cytochrome b sequences. Journal of Zoology, 246, 401-406.
Koepfli KP, Wayne RK (2003) Type ITS markers are more informatives than cytocrome b in
phylogenetic reconstruction of the Mustelidae (Mammalia: Carnivora). Systematic Biology, 52,
571-593.
Kohn MH, Murphy WJ, Ostrander EA, Wayne RK (2006) Genomics and conservation genetics.
Trend in Ecology and Evolution, 21, 629-637.
Kruuk R (2006) Otters. Ecology, behavior and conservation. 265pp. Oxford University Press.
Kyle CJ, Strobeck C (2001) Genetic structure of North American wolverine (Gulo gulo) populations.
Molecular Ecology, 10, 337-347.
Lacomba I, Soutullo A, Prigioni CM (2001) Distribution and conservation status of the Neotropical
river otter (Lontra longicaudis) in the coastal lagoons of the Uruguayan Atlantic basin and their
main tributaries. IUCN Otter Specialist Group Bulletin, 18, 20-24.
Larson SE, Jameson RJ, Bodkin JL, Staedler M, Bentzen P (2002) Microsatellite DNA and mtDNA
variation within and among remnant and translocated sea otter, Enhydra lutris, populations.
Journal of Mammalogy, 83, 893-906.
Luikart G, England PR, Tallmon D, Jordan S, Taberlet P (2003) The power and promise of
population genomics: from genotyping to genome typing. Nature Reviews Genetics, 4, 981-
994.
Macdonald SM, Mason CF (1985) Otters, their habitat and conservation in Northeast Greece.
Biological Conservation, 31, 191-210.
Macdonald SM, Mason CF (1990) Threats. In: Otters: An Action Plan for their Conservation (eds.
Foster-Turley P, Macdonald S, Mason C), pp. 11-14. IUCN Otter Specialist Group.

LXVIII
Machado ABM, Fonseca GAB, Machado RB, Aguiar LMS, Lins LV (1998) Livro vermelho das
espécies ameaçadas de extinção da fauna de Minas Gerais. Fundação Biodiversitas, Belo
Horizonte.
Marmi J, López-Giraldéz F, Domingo-Moura X (2004) Phylogeny, evolutionary history and
taxonomy of the Mustelidae based on sequences of the cytochome b gene and a complex
repetitive flanking region. Zoologica Scripta, 33, 481-499.
Márquez A, Maldonado JE, González S, Beccaceci MD, Garcia JE, Duarte JMB (2006)
Phylogeography and Pleistocene demographic history of the endangered marsh deer
(Blastocerus dichotomus) from the Río de La Plata Basin. Conservation Genetics, 7, 563-575.
Martin A & Palumbi SR (1993) Body size, metabolic rate, generation time, and the molecular clock.
Proceedings of the National Academy of Sciences, 90, 4087-4091.
Mason C (1990) An Introduction to the Otters. In: Otters: An Action Plan for their Conservation
(eds. Foster-Turley P, Macdonald S, Mason C), pp. 4-7. IUCN Otter Specialist Group.
Michaux JR, Hardy OJ, Justy F, Fournier P, Kranz A, Cabria M, Davison A, Rosoux R, Libois R
(2005) Conservation genetics and population history of the threatened Europian mink
Mustela lutreola, with an emphasis on the West European populations. Molecular Ecology,
14, 2373-2388.
Moritz C (1994) Defining “Evolutionary Significant Units” for conservation. Trends in Ecology and
Evolution, 9, 373-375.
Moritz C, Faith D (1998) Comparative phylogeography and the identification of genetically
divergent areas for conservation. Molecular Ecology, 7, 419-429.
Mucci N, Pertoldi C, Madsen AB, Loeschcke V, Randi E (1999) Extremely low mitochondrial DNA
control-region sequence variation in the otter Lutra lutra population of Denmark. Hereditas,
130, 331-336.
Neigel JE, Avise JC (1986) Phylogenetic relationships of mitochondrial DNA under various
demographic models of speciation. In: Evolutionary processes and theory (eds. Nevo E, Karlin
S), pp. 513-534. Academy Press, New York.
Nesje M, Roed KH, Lifjeld JT, Lindberg P, Steens OF (2000) Genetic relationship in the falcon
(Falco peregrinus) analyzed by microsatellite DNA markers. Molecular Ecology, 9, 53-60.
Nowak RM (1999) Walker’s mammals of the world, 6th edn. Johns Hopkins University Press,
Baltimore.
Paraná (Secretaria do Estado do Meio Ambiente) (1995) Lista vermelha de animais ameaçados de
extinção no Estado do Paraná. SEMA/GTZ, Curitiba.
Pardini R (1998) Feeding ecology of the neotropical river otter, Lontra longicaudis, in an Atlantic
Forest Stream, southeastern Brazil. Journal of Zoology, 245, 385–391.

LXIX
Pardini R (1999) Use of shelters by the neotropical river otter (Lontra longicaudis) in an Atlantic
Forest stream, southeastern Brazil. Journal of Mammalogy, 80, 600-610.
Parera A (1996) Las "nutrias verdadeiras" de la Argentina. Boletin Tecnico de la Fundacion Vida
Silvestre Argentina, 21, 1-38.
Passamani M, Camargo SL (1995) Diet of the river otter Lutra longicaudis in Furnas reservoir,
south-eastern Brazil. IUCN Otter Specialist Group Bulletin, 12, 32-33.
Pérez-Haro M, Viñas J, Mañas F, Batet A, Ruiz-Olmo J, Pla C (2005) Genetic variability in the
complete mitochondrial control region of the Eurasian Otter (Lutra lutra) in the Iberian
Peninsula. Biological Journal of the Linnean Society, 86, 397-403.
Pertoldi C, Breyne P, Cabria MT, Halfmaerten D, Jansman HAH, Van Den Berge K, Madsen AB,
Loeschcke V (2006) Genetic structure of the European polecat (Mustela putorius) and its
implication for conservation strategies. Journal of Zoology, 270, 102-115.
Pope LC, Domingo-Roura X, Erven K, Burke T (2005) Isolation by distance and gene flow in the
Eurasian badger (Meles meles) at both a local and broad scale. Molecular Ecology, 15, 371–
386.
Quadros J, Monteiro-Filho ELA (2000) Fruit occurrence in the diet of the neotropical otter, Lontra
longicaudis, in southern Brazilian Atlantic forest and its implications for seed dispersion.
Mastozoología Neotropical, 7, 33-36.
Quadros J, Monteiro-Filho ELA (2001) Diet of the Neotropical otter, Lontra longicaudis, in Atlantic
Forest area, Santa Catarina State, southern Brazil. Studies on Neotropical Fauna and
Environment, 36, 15-21.
Randi E, Davoli F, Pierpaoli M, Pertoldi C, Bo Madsen A, Loeschcke V (2003) Genetic structure in
otter (Lutra lutra) populations in Europe: implications for conservation. Animal Conservation, 6,
93-100.
Reuther C, Dolch D, Green R, Jahrl J, Jefferies D, Krekemeyer A, Kucerova M, Madsen AB,
Romanowski J, Roche K, Ruiz-Olmo J, Teubner J, Trindade A (2000) Surveying and
monitoring distribution and population trends of the Eurasian otter (Lutra lutra). Habitat, 12,
143pp.
Ryder OA (1986) Species conservation and systematics: the dilemma of subspecies. Trends in
Ecology and Evolution, 1, 1-10.
São Paulo (Secretaria de Estado do Meio Ambiente) (1998) Fauna ameaçada no Estado de São
Paulo. SMA/CED, São Paulo.
Sato J, Hosada T, Mieczyslaw W, Tsuchiya K, Yamamoto Y, Suzuki H (2003) Phylogenetic
relationships and divergence times among mustelids (Mammalia: Carnivora) based on

LXX
nucleotide sequences of the nuclear interphotoreceptor retinoid binding protein and
mitochondrial cytochrome b genes. Zoologial Science, 20, 243-264.
Schlötterer C (1998) Microssatelites. In: Molecular genetic analysis of populations: a pratical
approach, 2nd edn. (ed. Hoelzel AR), pp. 237-261. Oxford University Press, New York.
Schlötterer C (2004) The evolution of molecular markers – just a matter of fashion? Nature
Reviews Genetics, 5, 63-69.
Serfass TL, Brooks RP, Novak JM, Johns PE, Rhodes Jr OE (1998) Genetic variation among
populations of river otters in North America: considerations for reintroduction projects. Journal
of Mammalogy, 79, 736-746.
Silva F (1994) Mamíferos silvestres do Rio Grande do Sul. Fundação Zoobotânica do Rio Grande
do Sul, Porto Alegre.
Sivasundar A, Bermingham E, Ortí G (2001) Population structure and biogeography of migratory
freshwater fishes (Prochilodus: Characiformes) in major South America rivers. Molecular
Ecology, 10, 407-417.
Soldateli M, Blacher C (1996) Considerações preliminares sobre o número e distribuição
espaço/temporal de sinais de Lutra longicaudis (Olfers, 1818) (Carnivora, Mustelidae) nas
lagoas da Conceição e do Peri, Ilha de Santa Catarina, SC Brasil. Biotemas, 9, 38–64.
Spinola RM, Vaughan C (1995) Abundancia relativa y actividad de marcaje de la nutria Neotropical
(Lutra longicaudis) en Costa Rica. Vida Silvestre Neotropical, 4, 38-45.
Stevens MI, Hogg ID (2003) Long-term isolation and recent range expansion from glacial refugia
revelead for the endemic springtail Gomphiocephalus hodgsoni from Victoria Land, Antarctica.
Molecular Ecology, 12, 2357-2369.
Swimley TJ, Serfass TL, Brooks RP, Tzilkowski WM (1998) Predicting river otter latrine sites in
Pennsylvania. Wildlife Society Bulletin, 26, 836-845.
Tchaicka L, Eizirik E, Oliveira TG, Cândido Jr JF, Freitas TRO (2007) Phylogeography and
population history of the crab-eating fox (Cerdocyon thous). Molecular Ecology, 16, 819–838.
Terborgh J (1990) The role of felid predators in neotropical forests. Vida Silvestre Neotropical, 2, 3-
5.
Terborgh J (1992) Maintenance of diversity in tropical forest. Biotropica, 24, 283-292.
Utreras V, Rodríguez M, Araya I (2002) Preliminary study on the diet of the Neotropical otter Lutra
longicaudis in the Tiputini river, Yasuni National Park, Ecuadorian Amazonia. In: Proceedings
of the VII International Otter Colloquium.
Waits L, Taberlet P, Swenson JE, Sandegren F, Franzen R (2000) Nuclear DNA microsatellite
analysis of genetic diversity e gene flow in the Scandinavian brown bear (Ursus arctus).
Molecular Ecology, 9, 421-431.

LXXI
Waldemarin HF (1997) Estudo da ecologia de lontras (Lontra longicaudis) no Parque Nacional da
Lagoa do Peixe: Manejo e Conservação. Monografia de Graduação. Fundação Universidade
do Rio Grande, Rio Grande.
Waldemarin HF, Colares EP (2000) Utilization of resting sites and dens by the neotropical river
otter (Lontra longicaudis) in the south of Rio Grande do Sul State, Southern Brazil. IUCN Otter
Specialist Group Bulletin, 17, 14-19.
Walker CW, Vilà C, Landa A, Lindén M, Ellegren H (2001) Genetic variation and population
structure in Scandinavian wolverine (Gulo gulo) populations. Molecular Ecology, 10, 53-63.
Wisely SM, Buskirk SW, McDonald DB, Ostrander EA (2002) Genetic diversity e fitness in black-
footed ferrets before e during a bottleneck. Journal of Heredity, 93, 231-237.
Wright SJ, Gompper ME, DeLeon B (1994) Are large predators keystone species in neotropical
forest? The evidence from Barro Colorado Island. Oikos, 71, 279-294.
Van Zyll de Jong CG (1987) A phylogenetic study of the Lutrinae (Carnivora; Mustelidae) using
morphological data. Canadian Journal of Zoology, 65, 2536-2544.