Embed Size (px)
Citation preview

Estudo da associação espacial entre áreas queimadas e
desmatamento na Amazônia
[SER-300] Projeto FinalVeronika Leitold
1

contexto, motivação
perguntas-chave
materiais
análise:
etapas 1. - 4.
metodologia & resultados
observações finais
Roteiro
2

Contexto
aumento de secas
extremas+ presença de
desmatamentoaumento de incêndios=
há ampla evidência de uma relação entre uso de fogo e desmatamento dentro do contexto de mudança de uso e cobertura da terra na Amazônia
existem poucos estudos sobre a distribuição e associação espacial entre esses eventos
3

Motivação
desmatamento & queimada
Aragão & Shimabukuro (2010): The Incidence of Fire in Amazonian Forests with Implications for REDD
taxas de ocorrência de incêndio na Amazônia aumentaram em 59% em áreas com desmatamento reduzido, prejudicando assim parte dos créditos de carbono obtidos por meio de medidas para reduzir emissões de gases de efeito estufa por desmatamento e degradação (REDD)
4

Motivação
queimadas em...floresta madura
pastagem?regeneração?
...?
Lima et al. (2012): Land use and land cover changes determine the spatial relationship between fire and deforestation in the Brazilian Amazon
técnicas de análise espacial mostraram existência de associação entre desmatamento e queimada
próximo de 55% da área queimada não possui relação com desmatamento de floresta madura
5

Perguntas
Associações encontradas entre áreas de queimada e desmatamento na Amazônia Ocidental também existem em outras regiões? (foco no Estado do Pará)
Qual a origem do combustível em áreas queimadas que não possuem relação com desmatamento de floresta madura?
Qual a fonte de incêndios que ocorrem em florestas maduras em pé?
6

Materiais
Landsat/TM*
mapa decicatrizes dequeimadas
&PRODESmapas de
desmatamentoanual
TerraClassmapa de
uso de terra2008
&
7*cena 225/64 no catálogo WRS-2

classificação: desmatamento “antigo” e “recente”
Etapa 1. Metodologia
PRODES mapa de
desmatamentoanual seleção por
atributosano ≤ 2007ano > 2007 PRODES
mapa de desmatamento
“antigo” e “recente”
8

+ =
“fishnet”5x5km
estatística zonalqueimada
desmat. “antigo”
desmat. “recente”
Etapa 1. Resultados
Interm
sof
spatialstructure,
burn
edarea
andrecent
defores-
tation
exhibited
smallan
dsimila
rsp
atialau
toco
rrelation
coeffi-
cien
ts(m
axim
umsign
ificant
rw
0.13
,p<
0.05
),while
aslightly
strong
ersp
atialstructure
was
observed
for
old
deforestation
(max
imum
sign
ificant
rw
0.31
,p
<0.05
).To
talde
forestation
mirroredtheresu
ltsof
oldde
forestation,
emph
asizingtheeffect
ofcu
mulativede
forestationev
ents
ontheov
eralls
patial
structureof
deforestation.
Theco
rrelog
ramsindicated
anov
erallde
crea
sein
spatialco
rrelation
with
distan
ce,with
the
occasion
alartifacts
introd
uced
bytheregu
largridding
oftheda
taat
larger
cellsize
s.Th
estrong
ersp
atialstructure
detected
forrecent
deforestation
emph
asizes
the
influe
nce
ofan
thropo
genic
factors
onLU
LCC
proc
essesin
theBrazilian
Amazon
(Fig.5
).W
henassessingtheco
rrelationbe
twee
nbu
rningan
dde
fores-
tation
while
controlling
forthesp
atials
truc
ture
oftheda
ta,itwas
possibleto
observeastrong
errelation
ship
betw
eenthebu
rned
area
andrecent
deforestation,
which
rose
toge
ther
withtheincrea
sein
cellsize
,rea
chingitsmax
imum
atrw
0.8(p
<0.05
,Fig.6).How
ever,
therewas
nosign
ificant
eviden
ceof
spatialassociation
betw
een
burn
edarea
andoldde
forestation,
rega
rdless
ofscale(!
0.1<r<
0.1,
p>
0.05
,Fig.
6),which
was
likelydu
eto
thedifferen
cein
the
prop
ortion
sof
burn
edarea
inea
chde
forestationclass.Ev
enthou
gh55
%of
themap
pedbu
rningoc
curred
inside
oldde
forestationarea
s,this
only
amou
ntsto
7%of
thetotalclassarea
(938
km2ou
tof
13,200
km2 )
asco
mpa
redto
34%of
therecent
deforestationclass
area
(534
km2 )
burn
edin
thesameye
ar.
Both
the
spatialstructure
and
the
spatialassociation
ofthe
stud
ied
variab
les
are
visu
alized
onFig.
7.Distinc
tland
scap
eco
nfigu
ration
scanbe
observed
forea
chde
forestationclass,mainly
resu
lting
from
the
differen
tleng
thsof
the
time
intervalsthat
cons
titute
each
class.
The
visu
alassessmen
tof
the
spatializ
edde
forestationan
dbu
rnscar
data
also
reve
alsahigh
erincide
nceof
burn
ing,
toge
ther
withrecent
deforestation,
intheno
rthw
estan
dex
trem
esouthw
estpo
rtions
ofthestud
iedarea
(green
/bluetone
sin
Fig.
8).S
uchapa
tternof
spatialco
-occurrenc
eis
also
observed
forarea
swithless
dens
ityof
burn
ing/recent
deforestation(yellow
tone
s),v
isible
towardthesouthe
astof
thestud
yarea
.
Discu
ssionan
dco
nclusion
s
Theab
overesu
ltsun
dersco
rethedirect
useof
burningforinitial
LULC
Cproc
essesin
theBrazilian
Amazon
;app
roximately90
%of
the
burningthat
was
observed
in20
05oc
curred
inprev
ious
lyde
forested
area
s.How
ever,the
resu
ltsalso
emph
asizethat,for
trop
ical
region
s,de
forestationan
dbu
rningev
entsarerelated(Buc
ini&
Lambin,20
02;
Coch
rane
,20
03;Nep
stad
etal.,20
04;Uhl
&Kau
ffman
,199
0)bu
tcann
otbe
cons
idered
equiva
lent,a
sothe
rmea
nsof
matureforest
remov
alareutilizedpriorto
theap
plicationof
fire.T
hisresu
ltisalso
confi
rmed
bytheex
istenc
eof
spatialstruc
turing
andtheco
rrelation
betw
een
burning
and
deforestation,
inag
reem
entwith
prev
ious
stud
iestha
thyp
othe
size
such
associationas
partof
theLU
LCCproc
ess
intheBrazilian
Amazon
(Loren
a&Lambin,20
09;M
ortonet
al.,20
08;
Siren&Bron
dizio,
2009
;Soler
etal.,20
09;S
orrens
en,2
004,
2008
).Th
e“old
deforestation”
classiden
tified
thecu
mulativeland
use/
land
cove
rch
ange
over
the
area
forthe
w30
yearsof
mod
ern
human
occu
pation
intheAmazon
upto
2002
,whe
refire
shou
ldtheo
retically
beless
used
over
time.
Recent
deforestation
area
s(200
2e20
05)r
epresent
ongo
ingLU
LCCproc
esses,whe
retheus
eof
fire
isex
pected
tobe
pred
ominan
t.Interestingly,theco
mpa
risonof
burn
edan
dde
forested
area
salso
reve
aled
that
thelargestpo
rtion
ofthebu
rnscarsthat
weremap
ped
for20
05oc
curred
inarea
sde
forested
priorto
2002
(55%
ofthe17
11km
2bu
rned
),seem
ingly
contradictingtheassu
mptionthat
theam
ount
ofbu
rningisdirectly
relatedto
theestimates
ofrecent
deforestationin
area
sof
mature
forest.Ev
iden
ceof
such
dissoc
iation
was
prev
ious
lygive
nby
Aragã
oan
dSh
imab
ukuro(201
0),w
hosh
owed
that
redu
ctions
intherate
ofde
forestationwereacco
mpa
nied
instea
dby
anincrea
sein
theoc
curren
ceof
burn
ingev
entsforthe
Amazon
region
betw
een
theye
ars20
00an
d20
07.T
wopo
ssible
explan
ations
forsu
chahigh
incide
nceof
burn
ingov
eroldde
forestationarea
sarethefollo
wing:
a)theus
eof
fire
forrene
wal
ofex
isting
pasturearea
s(i.e.,the
remov
alof
wee
dsan
dremineralizationof
dead
biom
ass)
and/or
b)theremov
alof
rege
nerating
vege
tation
forne
wcrop
orpa
sture
implem
entation
(Aragã
o&Sh
imab
ukuro,
2010
).It
isim
portan
tto
note
that
whe
nco
nsidering
the
relative
amou
ntof
burn
ingin
relation
tothetotald
eforestedarea
(7%of
the
old
deforestation
area
swere
burn
edve
rsus
35%
ofthe
recent
deforestationarea
s)toge
ther
withthestrong
correlationbe
twee
nbu
rningan
drecent
deforestationve
rsus
low
correlationwithold
deforestation,
itisclea
rthat
alargepo
rtionof
thebu
rningproc
ess
isstill
relatedto
recent
deforestationev
ents
fortheco
nversion
ofmatureforest
toag
ricu
ltural
purposes.Nev
ertheless,
thepresen
tfind
ings
raisean
impo
rtan
tqu
estion
:iftheredu
ctionin
defores-
tation
isno
tfollo
wed
byaredu
ctionin
burn
ingan
dtheab
solute
values
ofbu
rned
area
forlocation
slong
sinc
eco
nvertedto
human
use
are
remarka
bly
high
,wha
ttype
offuel
issu
pporting
the
Fig.
8.Visua
lrep
resentationof
thesp
atialr
elations
hipbe
twee
nbu
rnscarsan
dde
forestation:
a)oldde
forestation,
b)recent
deforestation,
andc)
burn
edarea
.The
cellsize
sare
9600
"96
00m.
A.Limaet
al./
AppliedGeo
grap
hy34
(201
2)23
9e24
624
5
0
1
9

intersecção: quantidade de área queimada relacionada com desmatamento “recente” e “antigo”
PRODESmapa de
desmatamentoaté 2010
∑ área queimada em cada PRODES
“classei”
Landsat/TMmapa de
queimadas& =
Etapa 2. Metodologia
10

3%
64%
17%
16%
FlorestaDesmatamento recenteDesmatamento antigoNão floresta
∑ área “classei”:
598 km2
de queimadas ocorreram em áreas de “desmatamento
antigo”
Etapa 2. Resultados
11

atualização: TerraClass - uso de terra em 2008
PRODESdesmatamento
em 2009&
desmatamentoem 2010
TerraClassuso de terraatualizadapara 2010
TerraClassuso de terra
em 2008+ =
Etapa 3. Metodologia
12

intersecção: classes de uso de terra em áreas queimadas do tipo “desmatamento antigo”
TerraClassmapa de uso
de terraatualizada
(2010)
∑ área queimada em cada “classei”
de usode terra
áreas dequeimada(2010)
& =
Etapa 3. Metodologia
13

VEGETAÇÃO SECUNDÁRIA
PASTO LIMPO
PASTO SUJO
DESFLORESTAMENTO
FLORESTA
REGENERAÇÃO COM PASTO
HIDROGRAFIA
ÁREA NÃO OBSERVADA
NÃO FLORESTA
FLORESTA SOB NUVEM
MINERAÇÃO
PASTO COM SOLO EXPOSTO
ÁREA URBANA
AGRICULTURA ANUAL0 100 200 300 400
0
0
110
2740
018
161153
87348
117
46% pasto (limpo+sujo)17% floresta16% desflorestamento
Etapa 3. Resultados
14

buffer: classes de uso de terra ao redor de queimadas em floresta
TerraClassmapa de uso
de terraatualizada
(2010)
∑ área de cada “classei”de uso
de terra ao redor de queimadas
queimadasem
floresta& =
buffer 500m buffer 500m
buffer 500m buffer 500m
Etapa 4. Metodologia
15

VEGETAÇÃO SECUNDÁRIA
PASTO LIMPO
PASTO SUJO
DESFLORESTAMENTO
FLORESTA
REGENERAÇÃO COM PASTO
HIDROGRAFIA
ÁREA NÃO OBSERVADA
NÃO FLORESTA
FLORESTA SOB NUVEM
MINERAÇÃO
PASTO COM SOLO EXPOSTO
ÁREA URBANA
AGRICULTURA ANUAL0 100 200 300 400
0
0
110
2736
01512
15277
342103
1a fonte de fogo em floresta:pasto (limpo) com 44.7%
Etapa 4. Resultados
16
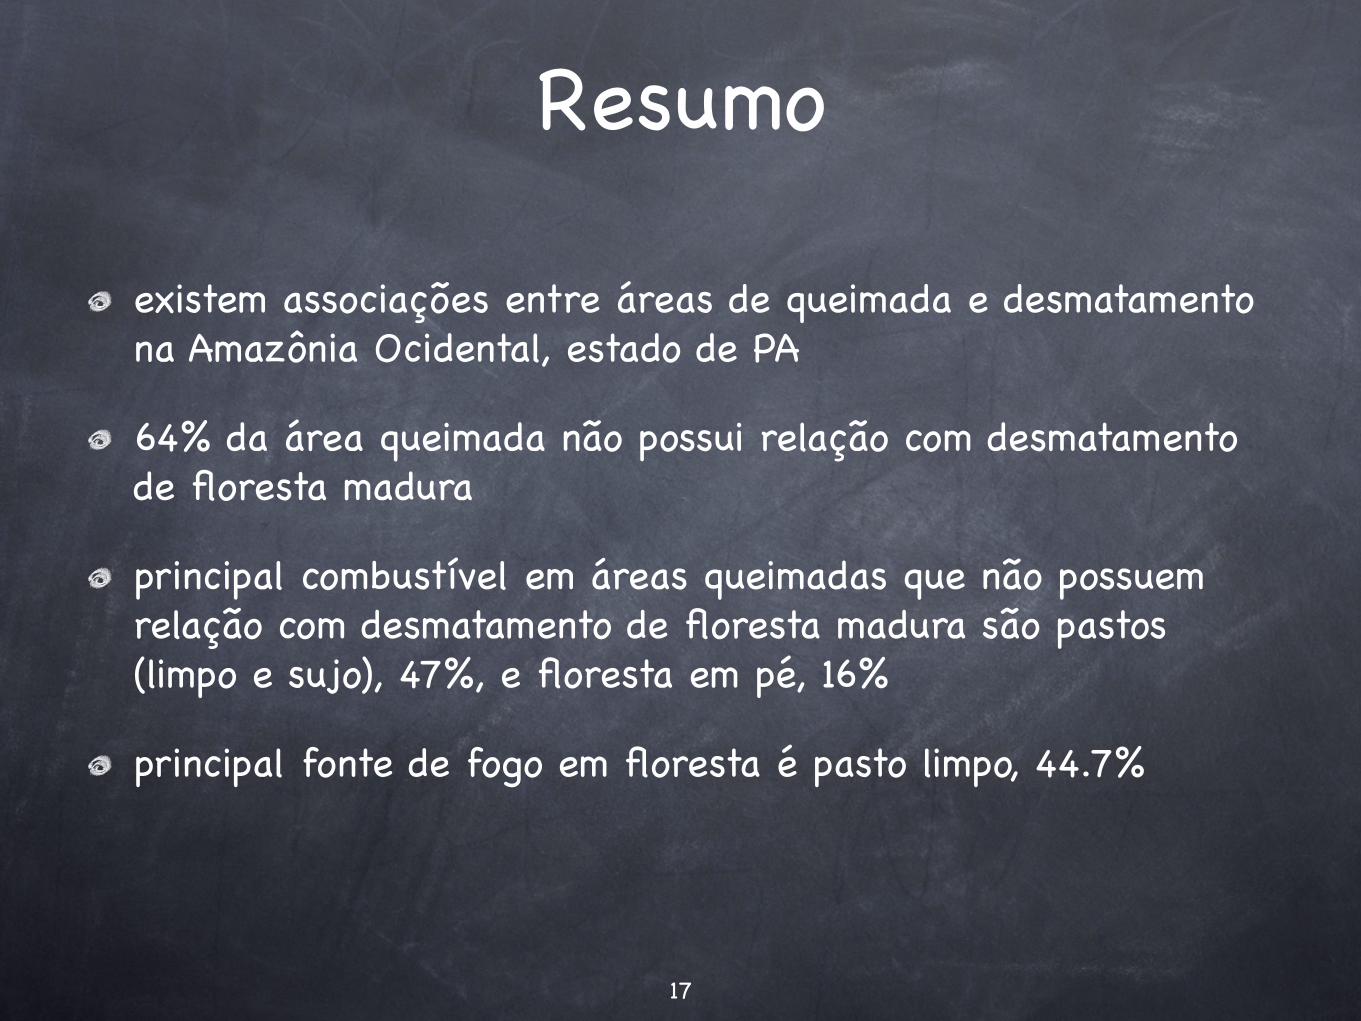
Resumo
existem associações entre áreas de queimada e desmatamento na Amazônia Ocidental, estado de PA
64% da área queimada não possui relação com desmatamento de floresta madura
principal combustível em áreas queimadas que não possuem relação com desmatamento de floresta madura são pastos (limpo e sujo), 47%, e floresta em pé, 16%
principal fonte de fogo em floresta é pasto limpo, 44.7%
17

18
Obrigada.