Embed Size (px)
Citation preview
©FUNPEC-RP www.funpecrp.com.brGenetics and Molecular Research 10 (2): 665-677 (2011)
Genetic structure based on nuclear and chloroplast microsatellite loci of Solanum lycocarpum A. St. Hil. (Solanaceae) in Central Brazil
K. Martins1, L.J. Chaves2, R. Vencovsky3 and P.Y. Kageyama4
1Universidade Federal de São Carlos, Campus Sorocaba, Sorocaba, SP, Brasil2Escola de Agronomia e Ciência dos Alimentos, Setor de Melhoramento Vegetal, Universidade Federal de Goiás, Goiânia, GO, Brasil3Departamento de Genética, Escola Superior de Agricultura Luiz de Queiroz, Universidade de São Paulo, Piracicaba, SP, Brasil4Laboratório de Reprodução e Genética de Espécies Arbóreas,Departamento de Ciências Florestais,Escola Superior de Agricultura Luiz de Queiroz,Universidade de São Paulo, Piracicaba, SP, Brasil
Corresponding author: K. MartinsE-mail: [email protected]
Genet. Mol. Res. 10 (2): 665-677 (2011)Received August 31, 2010Accepted November 12, 2010Published April 19, 2011DOI 10.4238/vol10-2gmr1046
ABSTRACT. Solanum lycocarpum (Solanaceae) is a woody species found in the Brazilian Cerrado. The flowers are pollinated by Xylocopa spp bees, and seeds are dispersed by mammals with distinct home range sizes. As a consequence, relative contributions of pollen and seeds to overall gene flow can vary according to different spatial scales. We studied the genetic structure of four natural populations of S. lycocarpum separated by 19 to 128 km, including individuals located along dirt roads that interlink three of the populations. A total of 294 individuals were genotyped with five nuclear and six chloroplast microsatellite markers. Significant spatial genetic structure was found in the total set of individuals; the Sp statistic was 0.0086. Population differentiation based on the six chloroplast microsatellite markers (θpC = 0.042) was small and similar to that based on the five nuclear
666
©FUNPEC-RP www.funpecrp.com.brGenetics and Molecular Research 10 (2): 665-677 (2011)
K. Martins et al.
microsatellite markers (θp = 0.054). For this set of populations, pollen and seed flow did not differ significantly from one another (pollen-to-seed flow ratio = 1.22). Capability for long distance seed dispersion and colonization of anthropogenic sites contributes to the ability of S. lycocarpum to maintain genetic diversity. Seed dispersion along dirt roads may be critical in preserving S. lycocarpum genetic diversity in fragmented landscapes.
Key words: cpDNA inheritance; Gene flow; Pollen flow;Seed dispersion; Spatial genetic structure
INTRODUCTION
Gene flow is a collective term that includes all the mechanisms that result in gene move-ment within and among populations (Slatkin, 1985). Most plant species accomplish gene flow during two independent life cycle stages: pollen transit and seed dispersion. Recognition that gene flow in plants is a two-step process is essential for understanding the distribution of genetic variation within and among populations (Levin, 1981). Comparing rates of pollen and seed flow is therefore necessary for a complete understanding of the dispersion mechanisms that cause population structure (Hamilton and Miller, 2002). The relative contribution of seed and pollen migration to overall gene flow in natural populations is useful to distinguish the effects of habitat fragmentation on pollen- and seed-dispersion agents. Gene flow from both pollen and seed are required to predict fragmentation-induced genetic changes in natural populations.
Ecological approaches have shown that pollen and seed migration is spatially restricted, usually with leptokurtic distribution curves (Slatkin, 1985; Godoy and Jordano, 2001). In most species, pollen is rarely transported distances longer than 1000 m (Burczyk et al., 2004). Direct estimates of gene flow based on molecular markers have shown that pollen dispersal is wide-spread among low-density tropical trees, ranging from a mean of 200 m to over 19 km for spe-cies pollinated by small insects versus bats (Ward et al., 2005). Seeds tend to be distributed near the seed parent, and they are rarely carried for distances longer than 200 m (Levin, 1981; Cain et al., 2000). In animal-dispersed species, strong distance limitation of seed delivery is combined with infrequent long-distance dispersal events (Godoy and Jordano, 2001). Although the maxi-mum migration distance varies among species and studies, the general rule is that long distance migration is infrequent. As these rare events are usually difficult to document, there are few stud-ies that seek to quantify the maximum dispersion distances (Cain et al., 2000).
One way of assessing the relative contributions of pollen and seeds to overall gene flow is estimating levels of genetic differentiation at molecular markers having different modes of inheritance. Nuclear markers are biparentally inherited, being carried both via pollen and seeds. Organelle markers, on the other hand, are usually uniparentally inherited. The chlo-roplast genome, in particular, is maternally inherited in most angiosperms and is transported only via seed (Ennos, 1994). Maternally inherited markers can provide a record of seed gene flow independent of pollen gene flow (Hamilton and Miller, 2002).
Distribution patterns of genetic variation within and among populations vary among species, as the combination of both mating features (especially the outcrossing rate) and of vectors of pollination and seed dispersion result in different rates and distances of pollen and seed gene flow. Also, knowledge of the features and of the behavior of pollinators and seed-
667
©FUNPEC-RP www.funpecrp.com.brGenetics and Molecular Research 10 (2): 665-677 (2011)
Solanum lycocarpum gene flow
dispersers suggests that the contribution of pollen and seed migration to total gene flow is scale-dependent. In generalist species, for instance, whose seeds are dispersed by a variety of animals with different foraging habits and distinct home range sizes, the pattern of seed dispersion rate varies according to a spatial scale. However, few studies have quantified gene flow at various spatial scales (McCauley, 1997; Oddou-Muratorio et al., 2001; Trapnell and Hamrick, 2004).
The approach of estimating gene flow at different geographical scales is particularly interesting for plant species whose potential for long-distance seed dispersion exceeds the pollen migration potential (Trapnell and Hamrick, 2004). It is also relevant for species show-ing metapopulation dynamics, i.e., species whose seed flow is accentuated due to the constant foundation of new populations. In the Brazilian Cerrado (Brazilian Savannas), fire is consid-ered to be a relatively constant source of disturbance in the populations. Hence, the efficiency of seed dispersion in the foundation of new populations turns out to be important for the main-tenance of genetic diversity and for the persistence of the species in the long term.
Solanum lycocarpum A. St. Hil. (Solanaceae) is a woody species occurring in the Brazil-ian Cerrado; seeds are dispersed by various medium- to large-sized mammals. An investigation of intrapopulation genetic diversity based on chloroplast DNA (cpDNA) (Martins et al., 2006) showed that seeds from multiple origins found natural populations. This information demonstrates the efficiency of seed-dispersers in effecting long-distance gene flow and in the colonization of vacant sites. The species is also found in anthropogenic areas such as along dirt roads, in pastures and in open lands, where the plants can be found at high densities. We evaluated population dif-ferentiation in four natural populations of S. lycocarpum separated by distances ranging from 19 to 128 km, and estimate the gene flow via pollen and seeds. The genetic diversity in natural popu-lations and in plants located along a dirt road was also compared in order to provide insights into the mechanisms involved in gene flow and the maintenance of genetic diversity in this species.
MATERIAL AND METHODS
Solanum lycocarpum (Solanaceae), popularly known as ‘lobeira’ (wolf’s fruit), is a fast-growing woody bush up to 2 m tall. Its distribution area comprises the Cerrado vegetation in Central Brazil. The fruit pulp is employed in the production of a phytomedicine, “wolf’s fruit-powder” (‘polvilho-de-lobeira’), widely used for controlling diabetes and obesity as well as for lowering cholesterol levels, being sold in capsules (Dall’Agnol and von Poser, 2000). This species has considerable potential for environmental restoration projects, as the germina-tion rate is high, the seeds germinate under full sun, the plant grows quickly, and it is adapted to conditions of water stress (Chaves-Filho and Stacciarini-Seraphin, 2001). In addition, it produces fleshy fruits that attract frugivorous animals to restored vegetation. It flowers all year round, with a peak in production in the rainy season, and flowers are pollinated by Xylocopa bees (Oliveira-Filho and Oliveira, 1988; Moura et al. 2010). The fruits are more prevalent in the rainy season and the fleshy fruits are consumed by wild animals, such as maned wolves, bush dogs, tapirs, and ants (Motta Junior et al., 1996). Detailed information about the ecology of S. lycocarpum can be found in Martins et al. (2006).
Study areas and sampling
Leaf tissues were collected from at least 60 individuals from each of the four natural
668
©FUNPEC-RP www.funpecrp.com.brGenetics and Molecular Research 10 (2): 665-677 (2011)
K. Martins et al.
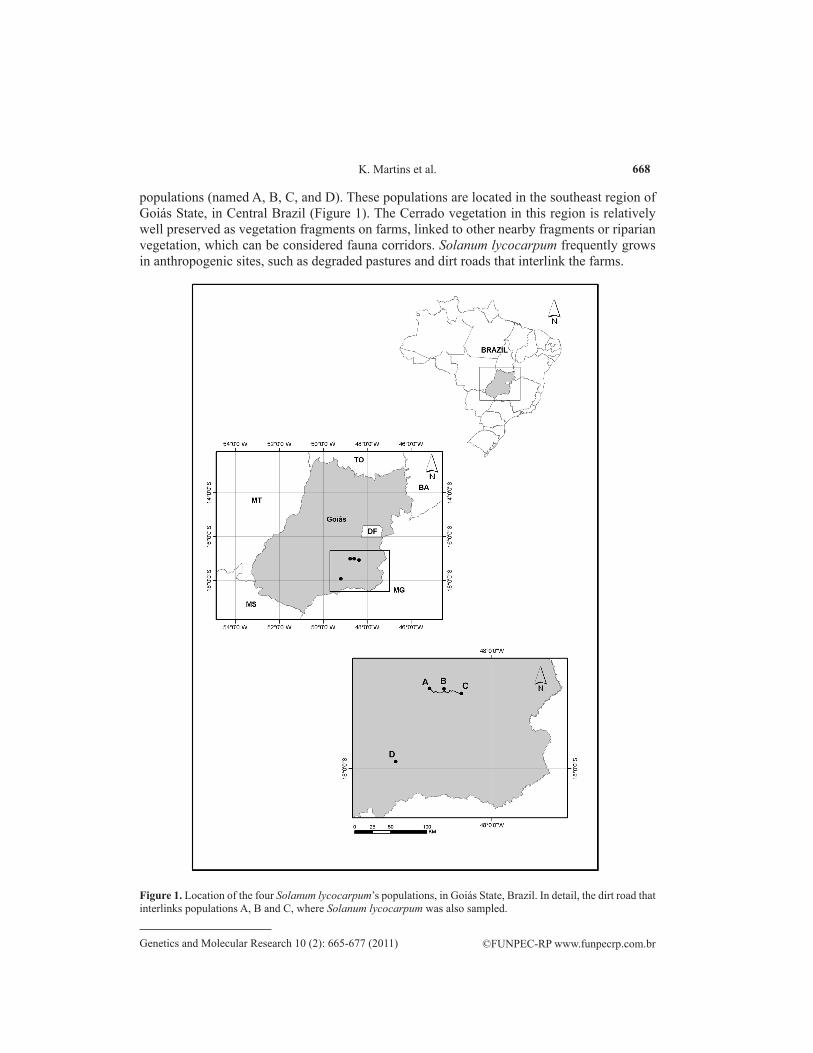
populations (named A, B, C, and D). These populations are located in the southeast region of Goiás State, in Central Brazil (Figure 1). The Cerrado vegetation in this region is relatively well preserved as vegetation fragments on farms, linked to other nearby fragments or riparian vegetation, which can be considered fauna corridors. Solanum lycocarpum frequently grows in anthropogenic sites, such as degraded pastures and dirt roads that interlink the farms.
Figure 1. Location of the four Solanum lycocarpum’s populations, in Goiás State, Brazil. In detail, the dirt road that interlinks populations A, B and C, where Solanum lycocarpum was also sampled.
669
©FUNPEC-RP www.funpecrp.com.brGenetics and Molecular Research 10 (2): 665-677 (2011)
Solanum lycocarpum gene flow
Plants were randomly sampled in population B and a complete census was carried out of populations A, C and D. Sixty individuals located along the dirt road that interlinks three of the populations (A, B and C) were also sampled. On average, one individual per kilometer was sam-pled along the road. The spatial location of the trees was recorded using GPS equipment (eTrex, Garmin®). In total, 294 individuals were sampled. Nine open-pollinated families from populations A, B and C were obtained for the study of the inheritance of cpDNA, totaling 222 progeny.
Microsatellite genotyping
First, the hairs that cover the surface of the leaves were removed with a blade. Total genomic DNA was extracted following CTAB protocol, as described by Doyle and Doyle (1990). DNA was used as a template for polymerase chain reaction (PCR) to amplify five nu-clear microsatellite loci developed for Capsicum spp (Martins et al., 2006) and six chloroplast microsatellite loci developed for dicotyledonous angiosperms (Weising and Gardner, 1999). The conditions of the PCR and nuclear and chloroplast microsatellite loci characterization are described in Martins et al. (2006). After amplification, DNA fragments were separated by electrophoresis on a 4% polyacrylamide denaturing gel for 1 h in a DNA sequencing system. Fragments were visualized after being stained with silver nitrate, following the Creste et al. (2001) protocol. Allele sizes were determined by comparison with a standard molecular weight marker (10-bp ladder, Invitrogen®). Different-sized amplified fragments, due to differences in the number of single-sequence repeat (SSR) units, were considered as different alleles.
Data analysis
Chloroplast inheritance test analysis
The probability of paternal chloroplast transmission (P) was estimated according to Milligan (1992). This estimation was calculated for each population individually and for the total number of progeny. The probability of obtaining K progeny containing paternally derived organelles in a set of N progeny is given by the following binomial distribution:
(Equation 1)
The power of the test was considered to be β ≥ 0.95. As β = 1 - Pr(K/N,P), the term Pr(K/N,P) was substituted by 1 - β in Equation 1.
In open-pollinated progeny, only a sub-set of the offspring is expected to be informa-tive. Selfing may occur, and even when the seeds result from cross-pollination both parents may have the same haplotype (Oddou-Muratorio et al., 2001). Assuming that trees either self or mate at random, the number of informative crosses (Ninf) - those in which both parents are expected to carry different haplotypes - is estimated by:
(Equation 2)
670
©FUNPEC-RP www.funpecrp.com.brGenetics and Molecular Research 10 (2): 665-677 (2011)
K. Martins et al.
where pi is the frequency of haplotype i in the population, s is the selfing rate and N is the num-ber of progeny with haplotype i. The frequency of haplotypes (pi) in each population was esti-mated with the FSTAT software (Goudet, 1995). MLTR V. 2.4 10 (Ritland, 2002) was employed to estimate the multi-locus population outcrossing rate (tm). The selfing rate (s) was obtained by 1 - tm. N was replaced by Ninf in Equation 1, as suggested by Oddou-Muratorio et al. (2001).
Genetic diversity analysis
Genetic diversity of each population and on the dirt road plants was analyzed by gene diversity (He), average number of alleles per locus (A) and fixation index (f) esti-mates obtained from nuclear microsatellite genotypes with the GDA software (Lewis and Zaykin, 2001). As the chloroplast genome polymorphisms are inherited without recombi-nation, each of the allele combinations in the six microsatellite loci was considered to be a haplotype. In its turn, each haplotype was analyzed as a different allele belonging to a single-haploid locus. The number of haplotypes (nh), the number of private haplotypes per population (np), and the haplotypic diversity (h) were estimated with the FSTAT software (Goudet, 1995).
Genetic structure analysis
Spatial genetic structure was characterized upon the analysis of kinship coef-ficients (Fij) between all pairs of individuals, which were estimated as in Loiselle et al. (1995). Average pairwise Fij estimates were plotted against the logarithm of the pairwise spatial distances. Under isolation by distance in a two-dimensional space, kinship is expected to decrease approximately linearly with the logarithm of the spatial distance (Hardy and Vekemans, 1999). The regression slope (bF) was used to quantify the extent of spatial genetic structure, using the Sp statistic. The Sp statistic was obtained by the ratio - bF / (1 - F(1)), where F(1) is the average Fij between adjacent individuals (in the first distance interval). The significance of bF was tested by 10,000 permutations of individu-als among spatial positions. All the computations were carried out with the SPAGeDi version 1.2 computer program (Hardy and Vekemans, 2002).
The genetic structure was also characterized according to Weir and Cockerham (1984), using the GDA software (Lewis and Zaykin, 2001). Considering populations A, B, C, and D, the estimated parameters for the nuclear microsatellites were: average f within populations; total f of the populations (F), and divergence in allele frequencies among populations (θp). A confidence interval of 99% per 10,000 bootstraps over loci was estimated. Population differen-tiation based on allele size (RST) was calculated with the RSTCalc software (Goodman, 1997).
The genetic structure of chloroplast markers was quantified using analysis of variance of gene frequencies (Weir and Cockerham, 1984). F and f are not defined for haploid genomes. Estimates of population differentiation (θpC) and of the standard deviation per 10,000 boot-straps over populations were obtained with the EG software (Coelho, 2000).
Gene flow analysis
Gene flow (Nm) based on nuclear SSR was estimated according to Wright (1951), as follows:
671
©FUNPEC-RP www.funpecrp.com.brGenetics and Molecular Research 10 (2): 665-677 (2011)
Solanum lycocarpum gene flow
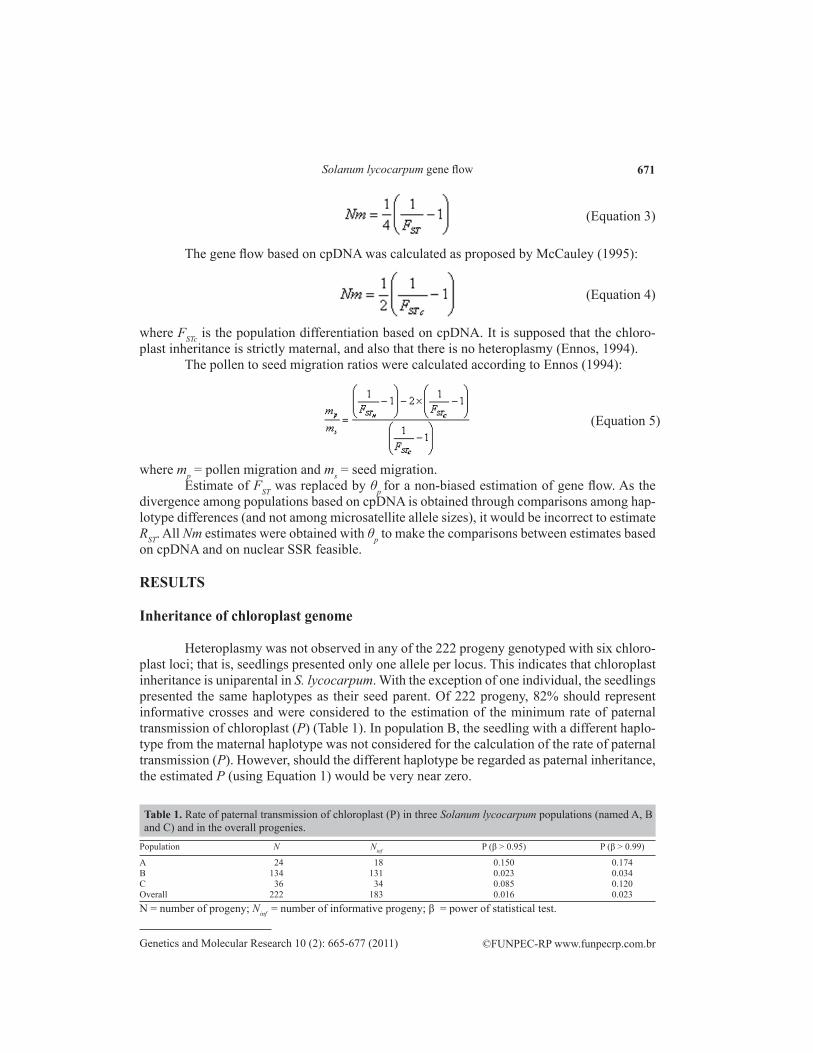
The gene flow based on cpDNA was calculated as proposed by McCauley (1995):
(Equation 3)
(Equation 4)
where FSTc is the population differentiation based on cpDNA. It is supposed that the chloro-plast inheritance is strictly maternal, and also that there is no heteroplasmy (Ennos, 1994).
The pollen to seed migration ratios were calculated according to Ennos (1994):
(Equation 5)
where mp = pollen migration and ms = seed migration. Estimate of FST was replaced by θp for a non-biased estimation of gene flow. As the
divergence among populations based on cpDNA is obtained through comparisons among hap-lotype differences (and not among microsatellite allele sizes), it would be incorrect to estimate RST. All Nm estimates were obtained with θp to make the comparisons between estimates based on cpDNA and on nuclear SSR feasible.
RESULTS
Inheritance of chloroplast genome
Heteroplasmy was not observed in any of the 222 progeny genotyped with six chloro-plast loci; that is, seedlings presented only one allele per locus. This indicates that chloroplast inheritance is uniparental in S. lycocarpum. With the exception of one individual, the seedlings presented the same haplotypes as their seed parent. Of 222 progeny, 82% should represent informative crosses and were considered to the estimation of the minimum rate of paternal transmission of chloroplast (P) (Table 1). In population B, the seedling with a different haplo-type from the maternal haplotype was not considered for the calculation of the rate of paternal transmission (P). However, should the different haplotype be regarded as paternal inheritance, the estimated P (using Equation 1) would be very near zero.
Population N Ninf P (β > 0.95) P (β > 0.99)
A 24 18 0.150 0.174B 134 131 0.023 0.034C 36 34 0.085 0.120Overall 222 183 0.016 0.023
Table 1. Rate of paternal transmission of chloroplast (P) in three Solanum lycocarpum populations (named A, B and C) and in the overall progenies.
N = number of progeny; Ninf = number of informative progeny; β = power of statistical test.
672
©FUNPEC-RP www.funpecrp.com.brGenetics and Molecular Research 10 (2): 665-677 (2011)
K. Martins et al.
Genetic diversity
Estimates of number of alleles per locus (A) and gene diversity (He) did not differ between populations (A, B, C, D, and dirt road) (Table 2). Despite large standard errors, A and He were smaller in population D. The number of cpDNA hapotypes (nh) was surprisingly high in the natural populations and along the dirt road (Table 2). A smaller number of cpDNA hap-lotypes (nh =19) was also observed in population D. Plants along the dirt road also showed a large number of haplotypes (nh = 30) and a smaller proportion of private haplotypes (Table 2).
Population n A He nh np/nh h
A 58 3.80 (1.56) 0.342 (0.139) 35 37.1% 0.972B 60 4.20 (1.71) 0.348 (0.144) 31 35.5% 0.973C 60 4.20 (2.45) 0.353 (0.161) 27 40.7% 0.932D 56 3.40 (1.92) 0.283 (0.154) 19 68.4% 0.910Dirt road 60 3.80 (2.31) 0.327 (0.160) 30 23.3% 0.950Average (SE) 3.88 (0.15) 0.330 (0.013) 28.4 (2.67) - 0.947 (0.012)
Table 2. Genetic diversity in four populations of Solanum lycocarpum and in individuals along a dirt road.
Sample size (n), average number of alleles per locus (A) and gene diversity (He) were estimated with five nuclear SSR loci. Number of haplotypes (nh), proportion of private haplotypes (np/nh) and haplotypic diversity (h) were estimated with chloroplast DNA.
Genetic structure and gene flow
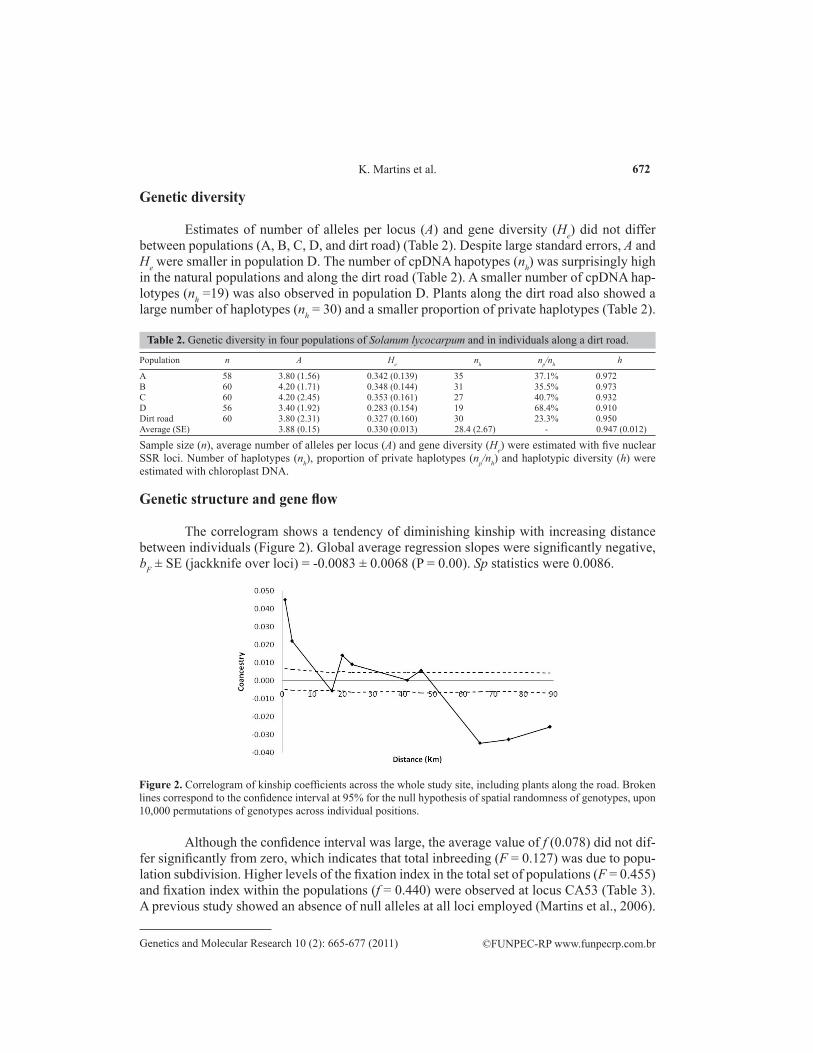
The correlogram shows a tendency of diminishing kinship with increasing distance between individuals (Figure 2). Global average regression slopes were significantly negative, bF ± SE (jackknife over loci) = -0.0083 ± 0.0068 (P = 0.00). Sp statistics were 0.0086.
Figure 2. Correlogram of kinship coefficients across the whole study site, including plants along the road. Broken lines correspond to the confidence interval at 95% for the null hypothesis of spatial randomness of genotypes, upon 10,000 permutations of genotypes across individual positions.
Although the confidence interval was large, the average value of f (0.078) did not dif-fer significantly from zero, which indicates that total inbreeding (F = 0.127) was due to popu-lation subdivision. Higher levels of the fixation index in the total set of populations (F = 0.455) and fixation index within the populations (f = 0.440) were observed at locus CA53 (Table 3). A previous study showed an absence of null alleles at all loci employed (Martins et al., 2006).
673
©FUNPEC-RP www.funpecrp.com.brGenetics and Molecular Research 10 (2): 665-677 (2011)
Solanum lycocarpum gene flow
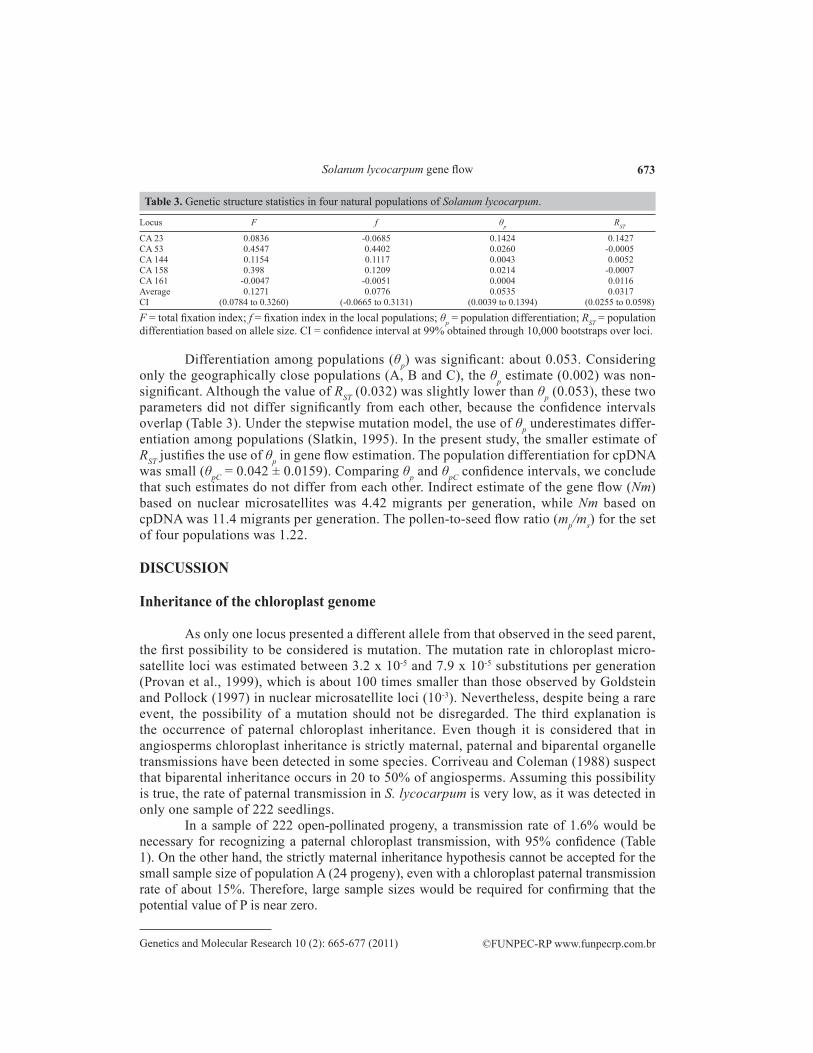
Differentiation among populations (θp) was significant: about 0.053. Considering only the geographically close populations (A, B and C), the θp estimate (0.002) was non-significant. Although the value of RST (0.032) was slightly lower than θp (0.053), these two parameters did not differ significantly from each other, because the confidence intervals overlap (Table 3). Under the stepwise mutation model, the use of θp underestimates differ-entiation among populations (Slatkin, 1995). In the present study, the smaller estimate of RST justifies the use of θp in gene flow estimation. The population differentiation for cpDNA was small (θpC = 0.042 ± 0.0159). Comparing θp and θpC confidence intervals, we conclude that such estimates do not differ from each other. Indirect estimate of the gene flow (Nm) based on nuclear microsatellites was 4.42 migrants per generation, while Nm based on cpDNA was 11.4 migrants per generation. The pollen-to-seed flow ratio (mp/ms) for the set of four populations was 1.22.
DISCUSSION
Inheritance of the chloroplast genome
As only one locus presented a different allele from that observed in the seed parent, the first possibility to be considered is mutation. The mutation rate in chloroplast micro-satellite loci was estimated between 3.2 x 10⁻⁵ and 7.9 x 10⁻⁵ substitutions per generation (Provan et al., 1999), which is about 100 times smaller than those observed by Goldstein and Pollock (1997) in nuclear microsatellite loci (10-3). Nevertheless, despite being a rare event, the possibility of a mutation should not be disregarded. The third explanation is the occurrence of paternal chloroplast inheritance. Even though it is considered that in angiosperms chloroplast inheritance is strictly maternal, paternal and biparental organelle transmissions have been detected in some species. Corriveau and Coleman (1988) suspect that biparental inheritance occurs in 20 to 50% of angiosperms. Assuming this possibility is true, the rate of paternal transmission in S. lycocarpum is very low, as it was detected in only one sample of 222 seedlings.
In a sample of 222 open-pollinated progeny, a transmission rate of 1.6% would be necessary for recognizing a paternal chloroplast transmission, with 95% confidence (Table 1). On the other hand, the strictly maternal inheritance hypothesis cannot be accepted for the small sample size of population A (24 progeny), even with a chloroplast paternal transmission rate of about 15%. Therefore, large sample sizes would be required for confirming that the potential value of P is near zero.
Locus F f θp RST
CA 23 0.0836 -0.0685 0.1424 0.1427CA 53 0.4547 0.4402 0.0260 -0.0005CA 144 0.1154 0.1117 0.0043 0.0052CA 158 0.398 0.1209 0.0214 -0.0007CA 161 -0.0047 -0.0051 0.0004 0.0116Average 0.1271 0.0776 0.0535 0.0317CI (0.0784 to 0.3260) (-0.0665 to 0.3131) (0.0039 to 0.1394) (0.0255 to 0.0598)
Table 3. Genetic structure statistics in four natural populations of Solanum lycocarpum.
F = total fixation index; f = fixation index in the local populations; θp = population differentiation; RST = population differentiation based on allele size. CI = confidence interval at 99% obtained through 10,000 bootstraps over loci.
674
©FUNPEC-RP www.funpecrp.com.brGenetics and Molecular Research 10 (2): 665-677 (2011)
K. Martins et al.
Genetic structure and gene flow
Comparisons of genetic diversity estimates in plants along the dirt road and in natural populations showed that S. lycocarpum seeds are efficient colonizers of vacant anthropogenic sites as the genetic diversity has been preserved in these recently colonized sites. The high number of cpDNA haplotypes suggests that natural populations and dirt roads were colonized by seeds from several different seed parents. The smaller proportion of private haplotypes in plants along the dirt road also shows that seed dispersion is highly efficient; i.e., seeds from the sampled natural populations are colonizing the adjacent anthropogenic environments.
The smaller number of cpDNA haplotypes in population D indicates that it was founded by a smaller number of mother lineages. A detailed discussion about the smaller genetic diver-sity in population D is found in a previous study of intrapopulation genetic diversity (Martins et al., 2006). Population D might have suffered a bottleneck or had a more recent origin than the other populations. Lack of seed dispersion agents would be another reason for the lower genetic diversity in population D (Martins et al., 2006).
The spatial genetic structure, the population differentiation and the low levels of in-breeding are coherent with the life story traits and the mating system of this species, as S. lycocarpum mates predominantly by outcrossing (tm~ 1.00), biparental inbreeding is not com-mon, and there are almost 10 trees participating as pollen donors per mother-tree (Martins et al., 2006). The occurrence of S. lycocarpum along dirt roads, pastures and other anthropogenic environments promotes an increase in effective population sizes that reduces the effects of genetic drift and favors gene flow.
The three geographically close populations (A, B and C) consisted of a single pan-mictic population prior to the Cerrado fragmentation, as the θp estimate (0.002) among them was nonsignificant. As nowadays the vegetation is discontinuous, they may be regarded as sub-populations. Population differentiation based on cpDNA was slightly smaller than that based on nuclear SSR. Apparently, it sounds incongruous that cpDNA population differentiation is small and even similar or smaller than that for nuclear SSR. However, with highly variable loci, population differentiation can be small. Paetkau et al. (1997) observed a strong negative correla-tion of heterozygosity and genetic distance, in a study of nuclear microsatellite loci. Petit et al. (2005) observed a significant negative correlation between GST and the number of haplotypes of cpDNA. The number of cpDNA haplotypes was surprisingly high in our populations (Table 2).
In their review, Petit et al. (2005) observed that of 93 angiosperm and gymnosperm species, only in three of them the population differentiation based on maternally inherited markers proved to be lower than that based on nuclear markers. According to them, the aver-age value of cpDNA population differentiation was 0.637 (± 0.002) in 124 angiosperm spe-cies, whereas it was 0.184 (± 0.002) in 77 species, based on nuclear markers. However, we must be cautious when comparing these results with those in our study. Results shown in Petit et al. (2005) were based on studies carried out at a larger geographical scale, comprising, most of the time, the entire distribution area of the species. Thus, due to the larger geographical areas, higher population differentiation is expected.
Considering the difference in the variance of the effective population size of hap-loid and diploid genomes, it is expected that population differentiation would be higher for cpDNA than for nuclear markers. As the chloroplast genome is haploid, uniparentally inherited and without recombination, it is assumed that the effective population size of
675
©FUNPEC-RP www.funpecrp.com.brGenetics and Molecular Research 10 (2): 665-677 (2011)
Solanum lycocarpum gene flow
this genome is smaller, and therefore it is expected to experience higher rates of genetic drift than the nuclear genome. Consequently, the population differentiation at equilibrium is higher for chloroplast markers (Petit et al., 1993).
Besides the effective population size of the genome, population differentiation based on cpDNA and nuclear markers also depends on pollen and seed migration rates, as well as on out-crossing rates and on the mode of inheritance of organelles (Petit et al., 1993; Hamilton and Miller, 2002). With complete self-fertilization, all genomes are dispersed only via seeds. A mixed mating system will therefore reduce the average dispersal of nuclear markers via pollen (when compared to complete outcrossing) by a factor equal to the selfing rate (Hamilton and Miller, 2002).
Biased maternal transmission of chloroplast, due to paternal leakage of the chloro-plast, has a significant effect on the population differentiation based on cpDNA, since it leads to a dispersion of genes via pollen. Even a small leakage of chloroplast transmission results in an important fall in the population differentiation based on cpDNA. Even a small population differentiation is still more accentuated in case the pollen migration rate is higher than that of the seeds (Petit et al., 1993). Since in S. lycocarpum, both the occurrence of selfing and of paternal transmission of the chloroplast are minimal, it may be inferred from estimates of population differentiation that seed migration makes a large contribution to total gene flow.
Pollen-to-seed flow ratio (mp/ms) for the set of four populations was 1.22, showing that pollen and seed migration rates were not different at this geographical scale. In a review of 93 species, Petit et al. (2005) found that the median of mp/ms was 17, showing an overall predominance of pollen flow. Only in 27% of their reviewed species, seed dispersal appeared to account for a large proportion (>20%) of total gene flow, i.e., (mp/ms <5).
The significant role of seed dispersal in the overall gene flow observed in S. lycocar-pum is similar to that observed in other insect-pollinated and fleshy fruited species (Raspe et al., 2000; Oddou-Muratorio et al., 2001; Petit et al., 2005), and which display a population dynamics of extinction/recolonization (Raspe et al., 2000). Oddou-Muratorio et al. (2001) discuss that this combination of life history traits results in lower levels of population differ-entiation, especially in maternally inherited markers, owing to the occurrence of colonization events by multiple foundations.
Seed dispersion occurs through endozoochory, and several animals with different for-aging habits and distinct walking capabilities search for the fleshy fruits, especially mammals such as crab-eating-foxes (Dusicyon thous), hoary foxes (Lycalopex vetulus), tapirs (Tapirus terrestris), and maned wolves (Chrysocyon brachyurus), which can be regarded as the main long-distance S. lycocarpum seed-disperser.
At a micro-spatial scale within populations, most seed dispersion is restricted; ants as well as cattle and small animals are the main contributors (Martins et al., 2006). At an intermediate scale (within populations and in the space between close populations), pollina-tors are responsible for substantial pollen flow. At an intermediate to wide geographical scale, seed dispersion by frugivorous mammals assumes a greater relative importance, permitting colonization of vacant sites.
This study has enabled us to gain knowledge about the population genetic structure of S. lycocarpum and to search for an association with the species’ mating features, focusing on gene flow agents. Solanum lycocarpum is able to preserve genetic diversity in fragmented landscapes due to its capability of long-distance seed dispersion. Our results concerning pollen and seed migration rates and their relative contribution to total gene flow at different spatial
676
©FUNPEC-RP www.funpecrp.com.brGenetics and Molecular Research 10 (2): 665-677 (2011)
K. Martins et al.
scales could be useful for defining strategies for in situ conservation. It is possible to plan the maximum gap among Cerrado fragments, and to establish
corridors for the transit of fauna. In the case of S. lycocarpum, for instance, gene flow via seeds is more frequent up to a distance of 20 km. If the presence of individuals along the roadsides is not taken into account, the 20 km gap would be the maximum distance between fragments. In addition, the dirt roads that interlink natural populations may be acting as corridors of gene flow. Seed dispersion along dirt roads may be a critical way of preserving S. lycocarpum ge-netic diversity in a fragmented landscape.
ACKNOWLEDGMENTS
We especially thank Prof. Márcio Elias Ferreira and Dr. Glaucia S.C. Buso (EMBRAPA Recursos Genéticos e Biotecnologia) for providing nuclear SSR primer sequences. We also thank the staff of the Laboratório de Reprodução e Genética de Espécies Arbóreas (LARGEA-ESALQ/USP), especially Elza Ferraz, Maria Andréia Moreno and Gabriela Defávari, for continued sup-port in the laboratory. Research supported by Fundação de Amparo à Pesquisa do Estado de São Paulo (FAPESP/Brazil). K. Martins received a PhD fellowship from Conselho Nacional de De-senvolvimento Científico e Tecnológico (CNPq/Brazil).
REFERENCES
Burczyk J, DiFazio SP and Adams WT (2004). Gene flow in forest trees: how far do genes really travel? Forest Genet. 11: 179-192.
Cain ML, Milligan BG and Strand AE (2000). Long-distance seed dispersal in plant populations. Am. J. Bot. 87: 1217-1227.Chaves-Filho JT and Stacciarini-Seraphin E (2001). Alteração do potencial osmótico e teor de carboidratos solúveis em
plantas jovens de lobeira (Solanum lycocarpum St.-Hil.) em resposta ao estresse hídrico. Rev. Bras. Bot. 24: 199-204.Coelho ASG (2000). Programa EG: Análise de Estrutura Genética de Populações pelo Método da Análise de Variância
(Software). Universidade Federal de Goiás, Instituto de Ciências Biológicas, Departamento de Biologia Geral, Goiânia.Corriveau JL and Coleman AW (1988). Rapid screening method to detect potential biparental inheritance of plastid DNA
and results for over 200 angiosperm species. Am. J. Bot. 75: 1443-1458.Creste S, Tulmann-Neto A and Figueira A (2001) Detection of single sequence repeat polymorphisms in denaturing
polyacrylamide sequencing gels by silver staining. Plant Mol. Biol. Rep. 19: 299-306.Dall’Agnol R and von Poser GL (2000). The use of complex polysaccharides in the management of metabolic diseases:
the case of Solanum lycocarpum fruits. J. Ethnopharmacol. 71: 337-341.Doyle JJ and Doyle JS (1990). Isolation of plant DNA from fresh tissue. Focus 12: 13-15.Ennos RA (1994). Estimating the relative rates of pollen and seed migration among plant populations. Heredity 72: 250-259.Godoy JA and Jordano P (2001). Seed dispersal by animals: exact identification of source trees with endocarp DNA
microsatellites. Mol. Ecol. 10: 2275-2283.Goldstein DB and Pollock DD (1997). Launching microsatellites: a review of mutation processes and methods of
phylogenetic interference. J. Hered. 88: 335-342.Goodman SJ (1997). RSTCalc: a collection of computer programs for calculating estimates of genetic differentiation from
microsatellite data and determining their significance. Mol. Ecol. 6: 881-885.Goudet J (1995). FSTAT (version 1.2): a computer program to calculate F-statistics. J. Heredity 86: 485-486.Hamilton MB and Miller JR (2002). Comparing relative rates of pollen and seed gene flow in the island model using
nuclear and organelle measures of population structure. Genetics 162: 1897-1909.Hardy OJ and Vekemans X (1999). Isolation by distance in a continuous population: reconciliation between spatial
autocorrelation analysis and population genetics models. Heredity 83 (Pt 2): 145-154.Hardy OJ and Vekemans X (2002). SPAGeDi: a versatile computer program to analyse spatial genetic structure at the
individual or population levels. Mol. Ecol. Notes 2: 618-620.Levin DA (1981). Dispersal versus gene flow in plants. Ann. Missouri Bot. Gard. 68: 233-253.Lewis PO and Zaykin D (2001). Genetic Data Analysis: Computer Program for the Analysis of Allelic Data. Available at
677
©FUNPEC-RP www.funpecrp.com.brGenetics and Molecular Research 10 (2): 665-677 (2011)
Solanum lycocarpum gene flow
[http://hydrodictyon.eeb.uconn.edu/people/plewis/software.php]. Accessed April 7, 2011.Loiselle BA, Sork VL, Nason J and Graham C (1995). Spatial genetic structure of a tropical understorey shrub, Psychotria
officinalis (Rubiaceae). Am. J. Bot. 82: 1420-1425.Martins K, Chaves LJ, Buso GSC and Kageyama PY (2006). Mating system and fine-scale spatial structure of Solanum
lycocarpum St. Hil. (Solanaceae) in the Brazilian Cerrado. Conserv. Genet. 7: 957-969.McCauley DE (1995). The use of chloroplast DNA polymorphism in studies of gene flow in plants. Trends Ecol. Evol.
10: 198-202.McCauley DE (1997). The relative contributions of seed and pollen movement to the local genetic structure of Silene alba.
J. Hered. 88: 257-263.Milligan BG (1992). Is organelle DNA strictly maternally inherited? Power analysis of a binomial distribution. Am. J.
Bot. 79: 1325-1328.Motta JC Junior, Talamoni SA, Lombardi JA and Simokomaki K (1996). Diet of maned wolf, Chrysocyon brachyurus, in
central Brazil. J. Zoo 240: 277-284.Moura TM, Oliveira GXO and Chaves LJ (2010). Correlação entre floração, frutificação e variáveis ambientais em
Solanum lycocarpum A. St. Hil, Solanaceae. Biosci. J. 26: 457-462.Oddou-Muratorio S, Petit RJ, Le Guerrone B, Guesnet D, et al. (2001). Pollen- versus seed-mediated gene flow in a
scattered forest tree species. Evolution 55: 1123-1135.Oliveira-Filho AT and Oliveira LCA (1988). Biologia floral de uma população de Solanum lycocarpum St. Hil.
(Solanaceae) em Lavras, MG. Rev. Bras. Bot. 11: 23-32.Paetkau D, Waits LP, Clarkson PL, Craighead L, et al. (1997). An empirical evaluation of genetic distance statistics using
microsatellite data from bear (Ursidae) populations. Genetics 147: 1943-1957.Petit RJ, Kremer A and Wagner DB (1993). Finite island model for organelle and nuclear genes in plants. Heredity 71: 630-641.Petit RJ, Duminil J, Fineschi S, Hampe A, et al. (2005). Comparative organization of chloroplast, mitochondrial and
nuclear diversity in plant populations. Mol. Ecol. 14: 689-701.Provan J, Soranzo N, Wilson NJ, Goldstein DB, et al. (1999). A low mutation rate for chloroplast microsatellites. Genetics
153: 943-947.Raspe O, Saumitou-Laprade P, Cuguen J and Jacquemart AL (2000). Chloroplast DNA haplotype variation and population
differentiation in Sorbus aucuparia L. (Rosaceae: Maloideae). Mol. Ecol. 9: 1113-1122.Ritland K (2002). Extensions of models for the estimation of mating systems using n independent loci. Heredity 88: 221-228.Slatkin M (1985). Gene flow in natural populations. Annu. Rev. Ecol. Syst. 16: 393-430.Slatkin M (1995). A measure of population subdivision based on microsatellite allele frequencies. Genetics 139: 457-462.Trapnell DW and Hamrick JL (2004). Partitioning nuclear and chloroplast variation at multiple spatial scales in the
Neotropical epiphytic orchid, Laelia rubescens. Mol. Ecol. 13: 2655-2666.Ward M, Dick CW, Gribel R and Lowe AJ (2005). To self, or not to self... a review of outcrossing and pollen-mediated
gene flow in Neotropical trees. Heredity 95: 246-254.Weir BS and Cockerham CC (1984). Estimating F-statistics for the analysis of population structure. Evolution 38: 1358-1370.Weising K and Gardner RC (1999). A set of conserved PCR primers for the analysis of simple sequence repeat
polymorphisms in chloroplast genomes of dicotyledonous angiosperms. Genome 42: 9-19.Wright S (1951). The genetical structure of populations. Ann. Eugen. 15: 354.


![[Recensão a] WALTER BURKERT - Structure and History in](https://img.document.onl/doc/110x75/615966b994d82c280b68f270/recenso-a-walter-burkert-structure-and-history-in-.jpg)