Embed Size (px)
Citation preview
Hydrogeological characterization of Gold Valley: an investigationof precipitation recharge in an intermountain basin in the Death Valleyregion, California, USA
Abdulaziz M. Abdulaziz & José M. Hurtado, Jr. &Abdalla Faid
Abstract Gold Valley is typical of intermountain basinsin Death Valley National Park (DVNP), California (USA).Using water-balance calculations, a GIS-based analyticalmodel has been developed to estimate precipitationalinfiltration rates from catchment-scale topographic data(elevation and slope). The calculations indicate thatgroundwater recharge mainly takes place at high eleva-tions (>1,100m) during winter (average 1.78mm/yr). Aresistivity survey suggests that groundwater accumulatesin upstream compartmentalized reservoirs and that thegroundwater flows through basin fill and fracturedbedrock. This explains the relationship between theupstream precipitational infiltration in Gold Valley andthe downstream spring flow in Willow Creek. To verifythe ability of local recharge to support high-flux springs inDVNP, a GIS-based model was also applied to theFurnace Creek catchment. The results produced insuffi-cient total volume of precipitational infiltration to supportflow from the main high-flux springs in DVNP undercurrent climatic conditions. This study introduces a GIS-based infiltration model that can be integrated into theDeath Valley regional groundwater flow model to estimateprecipitational infiltration recharge. In addition, the GIS-based model can efficiently estimate local precipitational
infiltration in similar intermountain basins in arid regionsprovided that the validity of the model is verified.
Keywords Groundwater recharge/water budget .Groundwater/surface-water relations . Statisticalmodeling . USA
Introduction
The source of water and high-volume discharge fromsprings in Death Valley National Park (DVNP; Fig. 1)have long been of interest and associated with someuncertainty. The regional groundwater flow system(RGWFS) between Nevada and eastern California hasbecome the object of numerous extensive hydrogeologicalstudies. These studies have attempted to evaluate apossible transfer of radioactive nuclides from the proposedrepository (recently put on hold) and nuclear testing inNevada National Security Site, previously known asNevada Test site, into the underlying groundwater system,which may ultimately discharge in DVNP (Belcher et al.2009; Bushman et al. 2010). In addition, regionalpopulation growth and existing irrigation in southernNevada are putting enormous stresses on groundwatersupplies (Harrill 1986). In the past few decades, theDVNP management has become concerned about thesource of water discharging from high-volume springslocated on the eastern margin of Death Valley, particularlyNevares, Texas and Travertine Springs in the FurnaceCreek area (Fig. 1).
Nearly all known hydrogeological techniques have beenapplied to investigate one or more aspects related to theRGWFS. These include characterization of the groundwaterbudget and regional flow system (Eakin 1966; Harrill et al.1988); groundwater flow modeling (Harrill 1995; Czarneckiet al. 1996; D’Agnese et al. 1997; chap. A and F in Belcherand Sweetkind 2010); geochemical analysis (Winograd andEakin 1965; Winograd and Thordarson 1975a; Classen1985; Thomas 1988; Peterman et al. 1992; Farmer 1996;Thomas et al. 1996; Stetzenbach et al. 1999; Bushman, et al.2010); stable oxygen and hydrogen isotopic composition ofgroundwater (Winograd and Friedman 1972; Winograd and
Received: 18 January 2011 /Accepted: 11 February 2012Published online: 8 March 2012
* Springer-Verlag 2012
A. M. Abdulaziz ())Mining, Petroleum, and Metallurgical Engineering Department,Faculty of Engineering,University Cairo,Cairo University Street, Giza, 12613, Egypte-mail: [email protected]
J. M. HurtadoDepartment of Geological Sciences,The University of Texas at El Paso,500 West University Avenue, El Paso, TX 79902-5816, USA
A. FaidHydrology Department,The National Authority for Remote Sensing and Space Sciences,P.O. Box 1564, Alf Maskan, Egypt
Hydrogeology Journal (2012) 20: 701–718 DOI 10.1007/s10040-012-0840-8

Thordarson 1975b); and groundwater geochronology using14C (Winograd and Pearson 1976).
Two opposing paradigms, interbasin flow against localrecharge, are conceptualized to account for the high flowrate of springs (>400 L/min) in DVNP, with hydro-chemical, hydrologic, and isotopic composition argumentspresented to support one paradigm and to some extentcontradict the other. A widely accepted concept amongmany hydrogeologists working in the area is based oninterbasin flow through the southern Funeral Mountains, aprocess by which groundwater moves from one topo-graphic basin to another through an intervening structuralor topographic barrier (Winograd and Eakin 1965; Belcherand Sweetkind 2010). This concept is supported by
regional equipotential contours in the carbonate aquifer,similar geochemistry in many regional springs, and otherhydrogeological observations in many locations such asAsh Meadows National Wildlife Refuge in southeastNevada (Winograd and Eakin 1965; Miller 1977; Prudicet al. 1993; D’Agnese et al. 1997, chap. B in Belcher andSweetkind 2010). The second paradigm favors localrecharge, precipitation and infiltration in the local water-shed, as the main source for the high flow springs in DeathValley (Pistrang and Kunkel 1964; Nelson et al. 2004;Anderson et al. 2006). In either case, groundwater flowmodels of the DVNP region consider at least two majoraquifer systems: a 4,500-m thick Lower Paleozoic(Cambrian-Devonian) regional aquifer and a Quaternary
Fig. 1 Location of the study area in California, USA
702
Hydrogeology Journal (2012) 20: 701–718 DOI 10.1007/s10040-012-0840-8

aquifer comprising basin fill of variable thickness (Dudleyand Larson 1976; Classen 1985; D’Agnese et al. 1997;chap. A and B in Belcher and Sweetkind 2010). Tertiaryfelsic volcanics are recognized as an additional significantlocalized aquifer unit above the Upper Paleozoic Carbon-ate aquifer (Winograd and Friedman 1972; Dettinger1989; Peterman et al. 1992).
Predicting infiltration rates through the unsaturated zonein an arid environment is difficult and complex due to thedynamic nature of the thermal hydrologic system and non-linear system response (Danko and Cluff 2007). Overallinfiltration is an episodic, transient process that depends onseveral parameters, including the quantity and duration ofprecipitation, evapotranspiration (ET), infiltration rate, andwater-storage capacity of the shallow subsurface zone (Flintet al. 2002). Evaporation from soil typically provides themajority of uncertainty in any infiltration scenario and isderived from empirical relationships (Danko and Cluff2007). It is common for net recharge to fluctuate over shorttime scales; therefore, Flint et al. (2002) suggested consid-ering decadal climatic cycles as the appropriate time-scalefor understanding net recharge in large basins. Recharge inthe mountain ranges to the east of DVNP is an importantcomponent within the Death Valley regional groundwaterflowmodel. However, few detailed investigations to accountfor infiltration, flow system and water budget of intermoun-tain basins have been introduced. Consequently, infiltrationinto the mountain ranges east of DVNP was recognized byKing and Bredehoeft (unpublished report, 1999, “DeathValley springs geochemical investigation: Yucca Mountainnuclear repository, Inyo county oversight-1998”, producedby The HYDRODYNAMICS Group) as a major data gap inthe regional groundwater flow model of D’Agnese et al.(1997).
The Black Mountains (Fig. 1) are important topograph-ic features that have local basin fill aquifers with lowdischarge springs (0.56 and 29 L/min; Johnson et al. 1989;Steinkampf and Werrel 2001). Such diminished springdischarge located close to the Furnace Creek Fault zone(FCFZ) led Johnson et al. (1989) to suggest that the FCFZacts as an effective barrier to groundwater flow towardsthe south and west of the Black Mountains. Moreover, thecomplex tectonic history of the region indicates lowdiscontinuous permeability across mountain ranges, whichhinders the flow of significant groundwater to DeathValley through the Black Mountains. Gold Valley aquifer,an important local Quaternary aquifer in the BlackMountains, has been categorized hydrostratigraphicallyas a basin fill aquifer system of an intermountain basin(Winograd and Thordarson 1975b). Groundwater natural-ly issues from highly fractured gabbro-diorite bedrocknear the terminus of the Gold Valley basin fill in threesprings known as Willow Springs, with continuous flow atdifferent rates. To better understand the hydrogeologicalsystem dynamics in Gold Valley and Willow Springs, thesite characterization, subsurface architecture, and hydro-geological system are investigated in detail using fiveresistivity profiles imaging the subsurface as deep as 50 mthroughout the Gold Valley area.
Gold Valley is hydrogeologically well characterized(Winograd and Thordarson 1975b; Steinkampf and Werrel2001) and presents an ideal case study to estimateprecipitational infiltration from water mass balance inDeath Valley area. In this study, a simple geographicalinformation system (GIS)-based model that reasonablycalculates precipitational infiltration rates from elevationand slope data of watersheds is introduced. This modelwas derived from semi-empirical estimates of precipita-tional infiltration rates based on a water mass balance(recharge-discharge relationship) of Willow Springs inGold Valley watershed. The calibrated GIS-based modelwas then used to determine average infiltration rates at thecatchment area of Nevares, Texas, and Travertine Springs.Thus, this paper will examine the interbasin flow and localrecharge hypothesis from a different perspective in whichthe ability of local recharge to maintain the presentcontinuous steady flow of the high-flux springs in FurnaceCreek is assessed.
Site description
Gold Valley encompasses approximately 60 km2 withinthe midwestern part of the Black Mountains betweenlatitudes 36˚00′ N–36˚04′ N, and longitudes 116˚38′ W–116˚42′ W (Fig. 1). Ground-surface elevation rangesbetween 1,780 meters above sea level (m.a.s.l.). at thenorthern and southern peaks and 690 m near the WillowSprings orifice.
Gold Valley involves rocks that discontinuously rangein age from Proterozoic to Quaternary (Fig. 2) and ischaracterized by a complex tectonic evolution that, as apart of Black Mountains, is mainly controlled bynorthwest crustal extension during the Tertiary andQuaternary periods (Workman et al. 2002). The architec-ture of fault zones and rock types are important geologicalconditions that influence the behavior of fault zones to actas either conduits or barriers to water flow (Caine et al.1996; Faunt 1997). In Gold Valley, the highly developedfracture systems in the bedrock and around fault zonesprovide potential secondary porosity for groundwaterstorage and facilitate water flow to Willow Springs.Detailed description of the geology and tectonic frame-work developed in Death Valley area is discussed inWorkman et al. 2002.
Methods and results
Several methods have been developed to estimate infiltra-tion rates and to denote their locations in a catchment area.These include: empirical approaches (e.g. Maxey andEakin 1950; Miller 1977 and Harrill 1986); water-balancetechniques (e.g. Rice 1984; and D’Agnese et al. 1997) andnumerical modeling (e.g. the INFIL model of Hevesi et al.2002). Each of these methods attempts to consider acomplex array of factors that govern net recharge;however, each method has limitations (D’Agnese et al.
703
Hydrogeology Journal (2012) 20: 701–718 DOI 10.1007/s10040-012-0840-8

2002). In this study, a hybrid method that utilizes simplemass-balance calculations of influential hydrologicalparameters is adopted to develop a GIS model estimatingprecipitational recharge from elevation and slope data.The mass-balance computations are performed on a pixel-by-pixel basis in a GIS environment using a digitalelevation model (DEM). At each pixel location, rechargeis estimated by subtracting the total water loss from thecalculated average precipitation. Figure 3 presents thehydrological parameters of the water-balance rechargemodel and the fate of precipitation in Gold Valley.Together, these parameters are considered to be represen-tative of the long-term hydrological conditions at aparticular pixel location.
Gold Valley is designated as a wilderness area withinDVNP, and, therefore, site access is limited to theproximity road trails and field methods must poseminimum disruption (Fig. 4). Unpublished meteorologicaldata and flow measurements from Willow Springs
collected in Gold Valley by Inyo County, California,between August 1999 and March 2001 were utilized inestimating precipitational infiltration using water balance.Flow rate at the springs was measured by a UNIDATADoppler flow meter and was electronically recorded every15 min with a data logger. In addition, the monitoringcrew made nine hand measurements for spring flow bytiming the flow required to fill containers of a knownvolume (Fig. 4). Precipitation and air temperature meas-urements were automatically recorded every 20 min at aweather station placed near the center of the Gold Valleycatchment area at an elevation of 1,085 m.a.s.l. Precipi-tation measurements at the weather station were made bya tipping bucket, and an additional ten manual rain gaugeswere distributed throughout the basin between 1,000 and1,256 m elevation from which precipitation data werecollected once per month.
To image the dominant aquifer system in Gold Valley,five resistivity profiles are conducted in April 2007 using a
Fig. 2 Three-dimensional view to the geological setting in Gold Valley; Geological map modified from Workman et al. 2002
704
Hydrogeology Journal (2012) 20: 701–718 DOI 10.1007/s10040-012-0840-8

dipole-dipole configuration. The location of these profilesand rain gauges is presented in Fig. 4. The survey used 28electrodes with 10-m spacing and enabled 40–50 m depthpenetration. Saline solution was poured on the electrodesto decrease the effect of soil conditions, and to keep thecontact resistance below 2 kΩ. The Swift and Stinginstruments, manufactured by AGI, were used to conductthe resistivity survey and the accompanying softwarepackage was used to download and process the raw data.In addition, GPS readings were surveyed at the beginning,middle, and end of each resistivity profile using a TrimblePathfinder Pro XRS. These data were differentiallycorrected using a GPS base station in DVNP. Elevationaccuracy was less than 2 m and horizontal accuracy wasless than 1 m. These GPS stations were used to rectify aDEM that is utilized in delineating drainages and definethe elevations and slopes, pixel by pixel, in the study area.
Subsurface characterization and groundwater flowBased on nine seismic refraction lines, Jansen (AquiferScience and Technology, unpublished report, 2000; seedetails in the Fig. 5 caption) estimated the depth ofbedrock in Gold Valley to be between 21 and 42 m, but itmay be as deep as 93 m in places. The bedrock surfaceunderneath the basin fill has a gentle slope and is parallelto the ground surface in the southern part of the valley. It
appears very steep near the proximity of the northern wallof the fault block. Jansen (unpublished report, see Fig. 5caption) conducted six time-domain electromagnetic(TEM) profiles near Willow Springs to map the depth tobedrock in the deeper portion of Gold Valley and reporteda 6.5 to 49-m thick basin fill (Fig. 5). He defined threehydrostratigraphic units including the bed rock, saturatedbasin fill, and unsaturated basin fill with their respectiveresistivities between 296 and 2,960, 8 and 40, and 829 and1,250 ohm.m (Fig. 5). The abrupt change in resistivity ofthe deepest layer at station TEM18 and TEM19 (Fig. 5)may suggest the presence of a fault, characterized from thelinear valley features, that may be present in this area. Thetrend, dip, and relative motion of the fault are unknown,but the orientation of the fault can be inferred from theNE–SW trend of a linear valley feature (Jansen, unpub-lished report, see Fig. 5 caption).
The results of the resistivity survey (Fig. 6) show greatvariability in resistivity values at the fractured bedrockcontact with basin fill. These values depend mostly onintensity of fracturing, fracture porosity, and watersaturation. In most cases, resistivity in fracture zonesranges from 250 to 500 ohm.m but may approach 950ohm.m. The relatively low resistivity zone (20–170 ohm.m), within a high-resistivity background (up to 1,200ohm.m), is most likely sediment saturated with waterwithin bedrock or coarse-grained basin fill. The increase
Key Parameters
Recharge = Precipitation – Water loss
Water loss = Free Evaporation + Bare Soil Evaporation + Evapotranspiration
Free Evaporation = Water loss by evaporation from runoff
Bare Soil Evaporation = Water loss by evaporation from soil located above soil zone
Evapotranspiration = plant’s Transpiration + Evaporation from soil in the root zone
Soil Moisture
Free Evaporation Infiltration
Precipitation
Runoff Infiltration
Recharge
Bare Soil Evaporation Evapotranspiration
Spring flow
Fig. 3 Fate of precipitation water in the water-mass-balance model applied in Gold Valley area
705
Hydrogeology Journal (2012) 20: 701–718 DOI 10.1007/s10040-012-0840-8

in resistivity with depth suggests that the bed rock isflooring Gold Valley basin fill with a traceable bed rockcontact (Figs. 5 and 6). Low resistivity values due to
accumulation of fine-grained material or development offine-grained fault gouge is excluded based on geology andthe nature of the basin fill. Despite the extreme
Fig. 4 Base map showing the location of instruments and resistivity profiles used to characterize the subsurface of Gold Valley area(shown in Fig. 1)
Fig. 5 a Location of the TEM profiles in Gold Valley, and b the composite TEM profile, modified with the permission of Jansen (AquiferScience and Technology, a branch of Ruekert and Mielke) from the unpublished report “Seismic Refraction and Time DomainElectromagnetic surveys for Gold Valley and Echo canyon, Inyo County, Death Valley National Park, California”, 2000)
706
Hydrogeology Journal (2012) 20: 701–718 DOI 10.1007/s10040-012-0840-8

heterogeneity in basin fill and the differentially fracturedbedrock, continuity in the water-bearing zone is
recognized, except in GV5 profile (Fig. 6). The thicknessof the saturated zone is typically controlled by location,
Fig. 6 Resistivity profiles, imaging the shallow subsurface in Gold Valley basin. The locations of these profiles are shown in Fig. 4
707
Hydrogeology Journal (2012) 20: 701–718 DOI 10.1007/s10040-012-0840-8

thickness, and heterogeneity of the basin fill and topog-raphy. Profiles of GV1 and GV4 were collected along themain stream (Fig. 4) and show a continuous, 30–35-m-thick saturated zone, but with compartmentalized reser-voirs clearly imaged (Fig. 6). In the other profiles (GV2,GV3, and GV5), groundwater mostly accumulates incompartmentalized reservoirs that hardly show connec-tions by bedrock fractures (e.g. GV5 profile in Fig. 6).Because GV5 was taken along a moderate sized tributarythe eastern part, located to the right hand side of GV3profile, is homogeneously saturated.
To map out the thickness of the basin-fill hydrostrati-graphic unit throughout the Gold Valley area, geophysicaldata from this study’s resistivity survey was integratedwith TEM and seismic refraction data refraction collectedby Jansen (unpublished report, see Fig. 5 caption). Due tothe lateral extension limitations of the geophysical profile,the overall distribution of the basin fill isopach map(Fig. 7) is based on the assumptions made fromgeophysical data at the survey site and field observationof geomorphic features. The isopach map (Fig. 7) indi-cated that the basin fill unit is usually 20 m thick or less inthe upstream tributaries but develops a layer of 30–50 mthrough the main streams. In addition, a groundwater levelmap of Gold Valley (Fig. 8) is constructed from theinterpreted resistivity profiles and GPS stations. It showsgroundwater flow to the W–NW (in the direction ofWillow Springs) that exhibits at least three variablehydraulic gradients. The hydraulic gradient is generallygentle at the higher portion (the area delineated by pointsGV2, GV3 and GV5) with average value 1.91 cm/m; butslightly steep, ∼2.7 cm/m, in the area delineated by pointsGV2, GV5, and GV4; and moderately gentle (2.42 cm/m)at the downstream part between GV1 and GV4 (Fig. 8).
The changes in hydraulic gradient usually reflectchanges in hydraulic conductivity. For instance, the areaswith good hydraulic conductivity show gentle hydraulicgradients compared to those with poor hydraulic conduc-tivity. In the areas located to the east and west of GV4profile (Fig. 8), the hydraulic gradient is slightly steeperupstream of the GV4 profile compared to the downstreamarea in which the depth to water is extremely shallow(Fig. 6). This pattern is in essence controlled by a lowhydraulic conductivity zone that resulted in build up ofhydraulic head at this area. A similar scenario is expectedat the orifice of the three Willow Springs in Willow Creek(not surveyed due to the site inaccessibility). In contrast,gentle hydraulic gradient indicates considerably highhydraulic conductivity values that are normally expectedat fractured bedrock or basin-fill/bedrock interface.
Hydrological parameters of the water-mass-balancerecharge modelThe 30-m DEM of Gold Valley was analyzed using thehydrologic tools within ArcGIS to identify the boundaryof the drainage system in Gold Valley. The elevation ofthe catchment area ranges between 570 and 1,750 m.a.s.l.,
with approximately 72.5% of the area between 1,000 and1,500 m.
Precipitation and runoffPrecipitation data for a complete year (2000) from 10 raingauges in the Gold Valley catchment area were regressedagainst station elevation. The regression tends to slightlyoverestimate precipitation rates at higher elevation, prob-ably due to erroneous measurements associating windyconditions at higher elevations or other factors, but showsan acceptable match at the low elevation parts of the basin(Fig. 9). Due to the low rates of precipitation during 2000,the slope of the linear regression was used, but theintercept was adjusted until the mean calculated valuematched the mean annual value of the tipping bucket data(∼106 mm/yr) in Gold Valley. This mean annual value iscomparable to the Black Mountains records reported byBedinger et al. (1989) and Friedman et al. (1992) and forwhich the mean annual precipitation ranged between 76and 140 mm/yr.
A comparison between the stable isotope compositionsof groundwater from Willow Springs and precipitationfrom the same elevation in the nearby Panamint Range(Anderson 2002) (Table 1) shows that groundwater fromWillow Springs is isotopically lighter than precipitationcollected from the Panamint Range, and the evaporationeffect on the percolating precipitational water in GoldValley is negligible. This is probably due to recharge atthe higher elevations during the low-temperature winterand the high infiltration capacity of the basin fill.
The physical and geological features of the highelevations in the Black Mountains and around DeathValley region are, in general, distinct from those in the lowelevations. At high elevations, vegetation cover and soilare virtually absent and bedrock, with well developedfractures, is exposed. Therefore, slope may not onlyindicate the feasible location of vegetation cover but alsodefine the fraction of precipitation dispensed as runoff.Run off is approximated using the relationship:
Runoff � ppt� S � CF ð1Þwhere ppt is the estimated precipitation and S is the slope ofeach pixel of the DEM, and CF is a calibration factor. Thecalibration factor is determined empirically to yield reason-able runoff values that fit mass-balance calculations. Regard-less of the calculated runoff value, it is expected that runoffwater will be lost as direct evaporation and soil moisture.
Temperature and evapotranspiration (ET) patternsThe relationship between temperature and water lossthrough evaporation and transpiration is historicallydocumented (Johnson 1980; Hevesi et al. 2002; Ferrettiet al. 2003; Nichols et al. 2004). The available temperaturerecords may provide a good way to approximate the ETthroughout the Gold Valley area. Soil evaporation andplant transpiration constitutes the total ET, which in arid
708
Hydrogeology Journal (2012) 20: 701–718 DOI 10.1007/s10040-012-0840-8

and semiarid environments is highly variable in space,elevation, and time (Evans et al. 1981; Hutley et al. 2001;Ferretti et al. 2003). The heterogeneity in vegetationdistribution and difficulty in reliable partitioning of ETcomponents are additional complexities in developing agood prediction of potential ET values.
Several techniques have been developed to estimate ETfrom meteorological parameters (Nichols et al. 2004), but,in general, each of these techniques has its limitations.Because vegetation cover usually does not changesignificantly and the average monthly temperatures have
not changed more than 5–8% over the last few years inDeath Valley, the Blaney-Criddle method (Nichols et al.2004; Dunne and Leopold 1978) represents the simplestand most efficient method of estimating potential ET inGold Valley. The modified Blaney-Criddle method esti-mates ET using the following equation:
ET ¼ ð0:142Ta þ 1:095ÞðTa þ 17:8ÞKd ð2Þwhere ET is potential ET (cm/month); Ta is average airtemperature (°C); K is an empirical factor that is a
Fig. 7 a Isopach map to the basin fill in Gold Valley. b Locations of the refraction seismic data, modified with permission from Jansen(unpublished report, see Fig. 5 caption)
709
Hydrogeology Journal (2012) 20: 701–718 DOI 10.1007/s10040-012-0840-8

function of vegetation type and stage of growth; and d isthe monthly fraction of annual hours of daylight, which isa function of latitude and time of the year. The first term inparentheses in Eq. 2 is accepted to be 1.38 if Ta<3°C.
Given the 30˚02′30″ N latitude for Gold Valley, thefractional value of annual hours of daylight was calculated byinterpolation between the standard values at latitudes 20˚Nand 40˚N. The empirical value is selected based on dominantvegetation species (creosote and saltbush) andK and d valuesfrom Nichols et al. 2004 are presented in Table 2. Using thetemperature records in Gold Valley, the mean ET rate derivedfromEq. 2 is 1.2mm/day (438mm/yr), which is considerably
smaller than the average observed pan evaporation in DeathValley (1,168 mm/yr). This is partially related to the lowertemperature in Gold Valley compared to Death Valley and theavailability of soil moisture in the root zone. Assuming theaverage vegetation cover in Gold Valley is equivalent to 4–6% and the average estimated ET is 1.2 mm/yr, the totalestimated amount of water loss by ETof 5% vegetation coveris 1.3 × 10⁶ m3/yr. This amount is approximately one and ahalf times the annual flow fromWillow Springs at an averagerate of 170 L/min.
To be compatible with the results of the semi-empiricalmodel, the total estimated ET volume was redistributed to
Fig. 8 Groundwater level (m.a.s.l.) map of the Gold Valley area
Fig. 9 Comparison between the calculated and rain-gauge-measured precipitation values in Gold Valley during the year 2000
710
Hydrogeology Journal (2012) 20: 701–718 DOI 10.1007/s10040-012-0840-8

the DEM cells based on the elevation and slope values asindicators for vegetation intensity using the followingrelationship:
ETc � eCF1Eþ1
Sð Þ ð3Þwhere ETc is the estimated ET of a particular cell (m/yr),CF is a calibration factor (dimensionless), E is theelevation of the cell (m.a.s.l.), and S is the slope of thecell (dimensionless). The calibration factor was deter-mined empirically.
Dense vegetation cover is encountered at lower eleva-tions (<1,150 m) and on gentle slopes (less than 30˚). Usingthese criteria, a weighting factor for elevation and slope wasadjusted several times until the total ET in the semi-empiricalmodel matched the total ETestimated by the Blaney-Criddlemethod (Nichols et al. 2004; Dunne and Leopold 1978).
Flow rate of Willow SpringsFlow at Willow Springs is continuous at a moderate rateof approximately 150–190 L/min (Johnson et al. 1989;
King and Bredehoeft, unpublished report (see details inthe previous); Anderson et al. 2006). The flow ratemeasured with the Doppler flow meter ranges between51 and 500 L/min, with an average rate of 176 L/min,which is comparable to the aforementioned estimates. Thedischarge from these springs develops overland flow for adistance that usually does not exceed 4.6 m. Then thewater completely disappears through the fracture systemof the bedrock underneath a thin basin fill where itprobably joins a major flow system in the main fault planetracing Willow Creek.
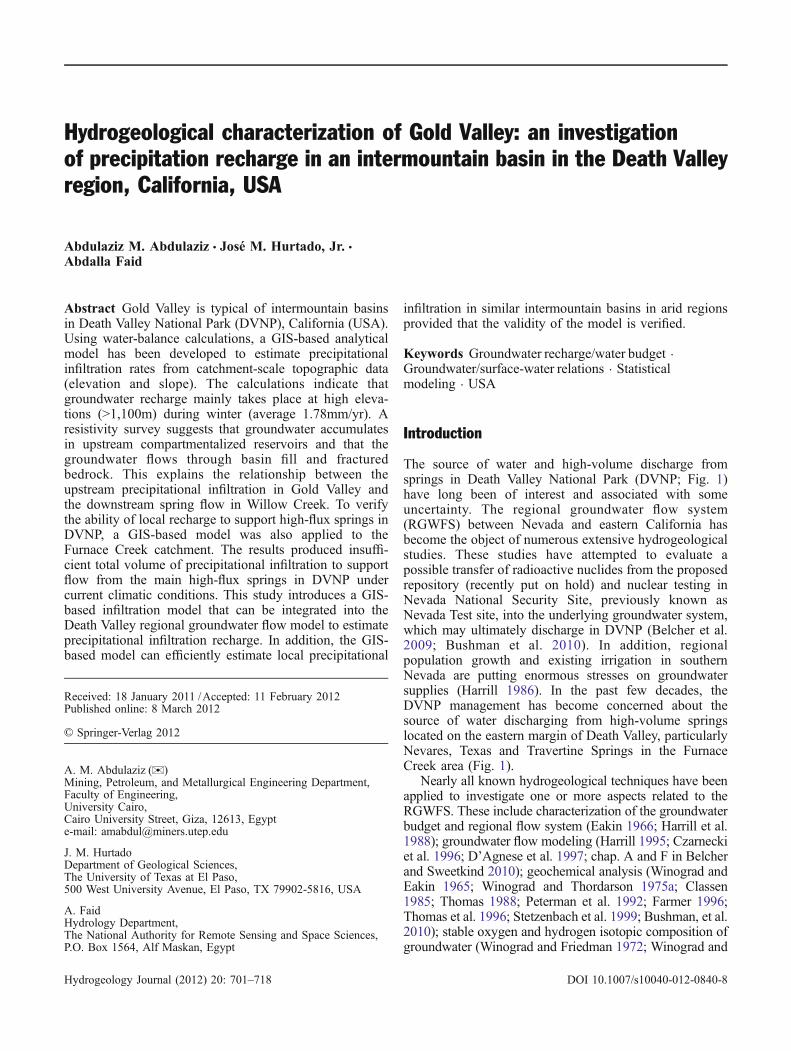
Based on the elevation of the springs (∼600 m.a.s.l.)and 14C geochronology of the spring water, there is ageneral consensus that Willow Springs is a modelexample of a mountain spring draining modern precipita-tional water within an inter-mountain-range basin (Kingand Bredehoeft, unpublished report (see details in theprevious); Steinkampf and Werrel 2001; Anderson et al.2006). Plots of spring flow rate and meteorologicalrecords strongly support this consensus (Figs. 10 and11). Flow rate is inversely proportional to ambient airtemperature, although a slight increase in flow is detectedafter most precipitation events. Such response in springflow depends on the intensity and duration of precipita-tion and flow rate prior to rainfall. It is generally difficultto recognize the change in small flow rates unless theperturbing precipitation event is intense and continues forenough time. If this happens, flow remains high for a fewdays before showing a steep breakthrough (Fig. 11). Incase of high flow rates, it is uncommon to detect areasonable response after precipitation events over arelatively long time even if they are successive or intense.Two possible reasons to explain this behavior may beconsidered; the first attributes the obscured response tothe limited capacity of hydraulic conduits of the maingroundwater flow paths. The second reason involvesnegligible change in hydraulic gradient across the basinafter precipitation events resulting in significant flowresponse despite the possible considerable recharge. Thesecond scenario seems more reasonable, especially if therelatively high spring flow rate (200 L/min) that ismaintained for 45 days after the last precipitation eventended is considered (Fig. 11).
Estimates of rechargeIn water balance calculation, the runoff value calculatedfrom Eq. 1 at each pixel was adjusted using the calibration
Table 1 Stable isotope compositions of Willow Springs water and Panamint Range precipitation
Water sample Elev. (m.a.s.l.) δ 18OVSMOW (per mil) δ DVSMOW (per mil) Data source
Willow Springs 731 -11.4 -92 King and Bredehoeft 1999a
Willow Springs 731 -10.96 -85.9 Anderson et al. 2006Willow Springs 731 -10.96 -85.88 Anderson 2002Panamint Range precipitation 1,699 -9.48 -65.11 Anderson 2002Panamint Range precipitation 2,097 -12.28 -102.36 Anderson 2002
aUnpublished report, 1999, “Death Valley springs geochemical investigation: Yucca Mountain nuclear repository, Inyo county oversight-1998”, produced by The HYDRODYNAMICS Group
Table 2 Monthly fraction of annual daylight hours (d) and averageempirical factor (K) values that fit the modified Blaney-Criddle m-ethod in the Gold Valley area (Nichols et al. 2004)
Time d K
January 1st. 0.06819 0.1089Mid. January 0.06819 0.0990End January 0.06819 0.0891Mid. February 0.06679 0.0812End February 0.06679 0.0733Mid. March 0.08240 0.0673End March 0.08240 0.0634Mid. April 0.08860 0.0634End April 0.08860 0.0812Mid. May 0.09821 0.1723End May 0.09821 0.1921Mid. June 0.09901 0.2416End June 0.09901 0.2416Mid. July 0.10021 0.2495End July 0.10021 0.2713Mid. August 0.09360 0.2713End August 0.09360 0.2693Mid. September 0.08300 0.2356End September 0.08300 0.2198Mid. October 0.07759 0.1742End October 0.07759 0.1663Mid. November 0.06799 0.1445End November 0.06799 0.1307Mid. December 0.07441 0.1188End December 0.07441 0.1089
711
Hydrogeology Journal (2012) 20: 701–718 DOI 10.1007/s10040-012-0840-8
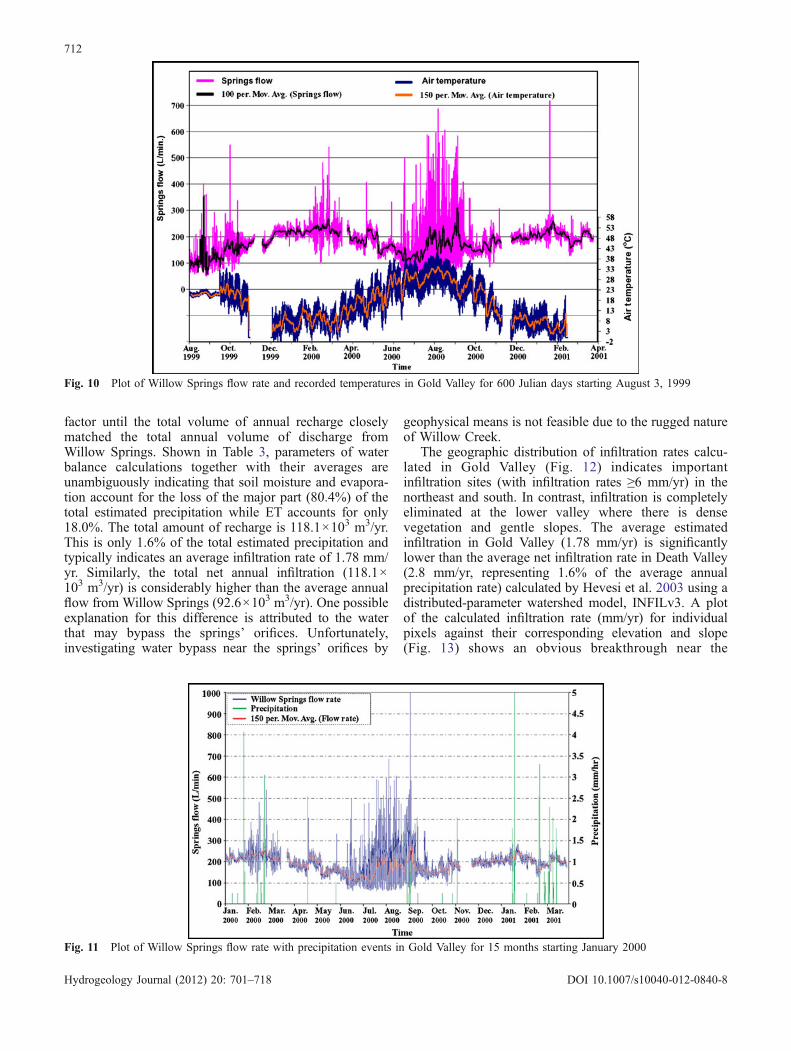
factor until the total volume of annual recharge closelymatched the total annual volume of discharge fromWillow Springs. Shown in Table 3, parameters of waterbalance calculations together with their averages areunambiguously indicating that soil moisture and evapora-tion account for the loss of the major part (80.4%) of thetotal estimated precipitation while ET accounts for only18.0%. The total amount of recharge is 118.1×10³ m3/yr.This is only 1.6% of the total estimated precipitation andtypically indicates an average infiltration rate of 1.78 mm/yr. Similarly, the total net annual infiltration (118.1×10³ m3/yr) is considerably higher than the average annualflow from Willow Springs (92.6×10³ m3/yr). One possibleexplanation for this difference is attributed to the waterthat may bypass the springs’ orifices. Unfortunately,investigating water bypass near the springs’ orifices by
geophysical means is not feasible due to the rugged natureof Willow Creek.
The geographic distribution of infiltration rates calcu-lated in Gold Valley (Fig. 12) indicates importantinfiltration sites (with infiltration rates ≥6 mm/yr) in thenortheast and south. In contrast, infiltration is completelyeliminated at the lower valley where there is densevegetation and gentle slopes. The average estimatedinfiltration in Gold Valley (1.78 mm/yr) is significantlylower than the average net infiltration rate in Death Valley(2.8 mm/yr, representing 1.6% of the average annualprecipitation rate) calculated by Hevesi et al. 2003 using adistributed-parameter watershed model, INFILv3. A plotof the calculated infiltration rate (mm/yr) for individualpixels against their corresponding elevation and slope(Fig. 13) shows an obvious breakthrough near the
Fig. 10 Plot of Willow Springs flow rate and recorded temperatures in Gold Valley for 600 Julian days starting August 3, 1999
Fig. 11 Plot of Willow Springs flow rate with precipitation events in Gold Valley for 15 months starting January 2000
712
Hydrogeology Journal (2012) 20: 701–718 DOI 10.1007/s10040-012-0840-8
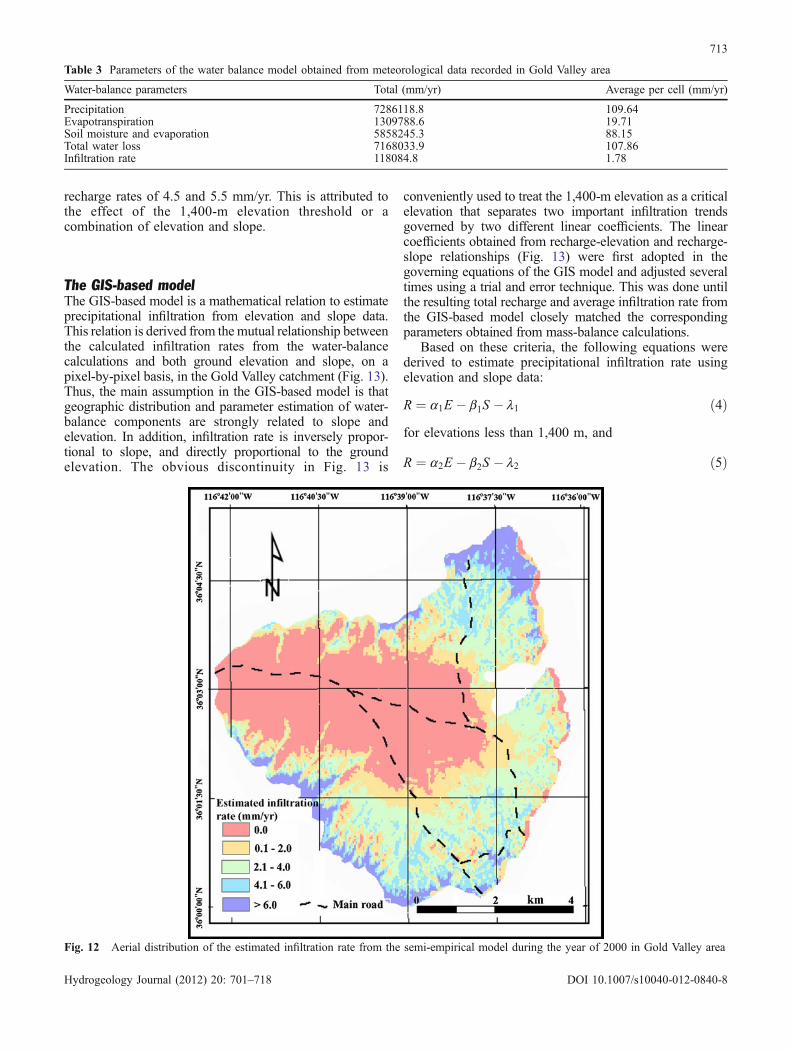
recharge rates of 4.5 and 5.5 mm/yr. This is attributed tothe effect of the 1,400-m elevation threshold or acombination of elevation and slope.
The GIS-based modelThe GIS-based model is a mathematical relation to estimateprecipitational infiltration from elevation and slope data.This relation is derived from the mutual relationship betweenthe calculated infiltration rates from the water-balancecalculations and both ground elevation and slope, on apixel-by-pixel basis, in the Gold Valley catchment (Fig. 13).Thus, the main assumption in the GIS-based model is thatgeographic distribution and parameter estimation of water-balance components are strongly related to slope andelevation. In addition, infiltration rate is inversely propor-tional to slope, and directly proportional to the groundelevation. The obvious discontinuity in Fig. 13 is
conveniently used to treat the 1,400-m elevation as a criticalelevation that separates two important infiltration trendsgoverned by two different linear coefficients. The linearcoefficients obtained from recharge-elevation and recharge-slope relationships (Fig. 13) were first adopted in thegoverning equations of the GIS model and adjusted severaltimes using a trial and error technique. This was done untilthe resulting total recharge and average infiltration rate fromthe GIS-based model closely matched the correspondingparameters obtained from mass-balance calculations.
Based on these criteria, the following equations werederived to estimate precipitational infiltration rate usingelevation and slope data:
R ¼ a1E � b1S � l1 ð4Þfor elevations less than 1,400 m, and
R ¼ a2E � b2S � l2 ð5Þ
Table 3 Parameters of the water balance model obtained from meteorological data recorded in Gold Valley area
Water-balance parameters Total (mm/yr) Average per cell (mm/yr)
Precipitation 7286118.8 109.64Evapotranspiration 1309788.6 19.71Soil moisture and evaporation 5858245.3 88.15Total water loss 7168033.9 107.86Infiltration rate 118084.8 1.78
Fig. 12 Aerial distribution of the estimated infiltration rate from the semi-empirical model during the year of 2000 in Gold Valley area
713
Hydrogeology Journal (2012) 20: 701–718 DOI 10.1007/s10040-012-0840-8

for elevations greater than 1,400 m. In Eqs. (4) and (5), Ris the infiltration rate (mm/yr), E is the elevation (m.a.s.l.),and S is the slope. The constants α1, β1, and λ1 are equalto 0.0017928, 0.62242, and 0.4753, respectively. Theconstants α2, β2, λ2 are equal to 0.00466128, 1.62484,and 1.0501, respectively.
The GIS-based model was able to depict the generalpattern of mass balance calculations, but with a slightperturbation due to linearity of the GIS-based model. Theresulting GIS-based model is not only suitable to theBlack Mountains and Death Valley region, but also mayprovide useful results in other arid environments of thewestern USA.
Evaluation of the recharge capacity of Furnace Creekcatchment area using the GIS-based modelThe catchment area of the main springs at Furnace Creekwas delineated from the National Elevation Database(NED) using the hydrology tool in ArcGIS. It covers anarea of 527.05 km2 located mainly within the boundary ofDVNP, and includes Furnace Creek Wash, parts of thesouthern Funeral Mountains, the northern part of theGreenwater Valley, and the northeast portion of the BlackMountains (Fig. 1).
To evaluate the capacity of local recharge to support flowof the high-flux springs in the Furnace Creek area of east-central Death Valley, the GIS-basedmodel was applied to theNevares, Texas, and Travertine Springs watersheds (Fig. 1).Elevation and slope data for each pixel in these watershedswere defined from the NED and the suitable equation of theGIS-based model was automatically applied to estimateinfiltration. The resulting infiltration rates range between 0.0and 8.06 mm/yr with an average of 1.753 mm/yr. Figure 14shows that a major part of the catchment area attainedinfiltration rates of less than 2.00 mm/yr. It is also clear thatinfiltration generally decreases towards the northwest. Thehighest infiltration rates are located, as expected, at higher
elevations in the northeast and southwest. The totalestimated precipitational infiltration obtained from the GIS-
Fig. 13 Estimated recharge from the semi-empirical model in Gold Valley during the year 2000 plotted against both elevation and slope
Fig. 14 Map of average estimated precipitation recharge obtainedfrom the GIS-based model for Furnace Creek Wash, Death Valley,shown in Fig. 1
714
Hydrogeology Journal (2012) 20: 701–718 DOI 10.1007/s10040-012-0840-8

based model is 685,719 m3/yr. Such a value is significantlygreater than the total infiltration (91,815 m3/yr) obtainedfrom the same input data set but using Maxey-Eakin criteria(Maxey and Eakin 1950).
Discussion
Hydrogeology of Gold ValleyThe semi-empirical model revealed that most recharge inGold Valley takes place at high elevations (>1,100 m) andthat the majority of water loss is related to evapotranspi-ration and soil moisture content. However, the isotopiccomposition of Willow Springs indicates that the evapo-ration signature is negligible. In addition, the stableisotopic composition of this water is comparable to thatof precipitation at similar elevation in the nearby PanamintRange (Table 1). This implies that recharge not only tookplace at high elevations, as implied in Fig. 12, but alsoduring the wintertime. Noteworthy variations in springflow are noticeable during the summer (Fig. 10), but theimportance of these perturbations significantly decrease inwinter, especially when precipitation events are dominant.This behavior is related to the underground flow regime,in which the groundwater drains isolated compartmental-ized chambers, especially in summer. Such chambers arepartially connected through the underground trace of thesurface tributaries that all join at the main valley in thestudy area. The water-level map (Fig. 8) revealed differenthydraulic gradients that can be related to changes inhydraulic conductivity. Regions of limited hydraulicconductivity represent a hydraulic barrier for flow fromsome chambers and provide the route for flow from otherchambers until the potential difference between chambersnear the barrier approaches zero. At this stage, flow startsagain from the abandoned chambers. This actuallyresembles the behavior of a group of resistors in anelectric circuit. In addition to the change in hydraulicgradient of these chambers throughout the Gold Valley,their relative position relative to the spring’s orifice maystrongly influence the amount of water that reaches thezone of influence of Willow Springs. At winter time,compartmentalized chambers are recharged and the po-tential of the groundwater is enough to reduce the effect ofthe hydraulic barrier and, as a result, perturbations inspring flow are diminished.
The resistivity survey indicated that groundwater inGold Valley accumulates mainly in compartmentalizedreservoirs within the major tributaries and that the mainflow paths occur within the fractured part of the bedrockor at the basin fill-bedrock contact. Accordingly, therelationship between infiltration in Gold Valley anddischarge patterns at Willow Springs can be explained asfollows. During winter, enough recharge into compart-mentalized reservoirs upstream of the springs results insteep hydraulic gradients enough to overcome mosthydraulic necks and barriers in the pathway towards thespring orifices. These compartmentalized reservoirs, prob-ably with high hydraulic conductivity, are responsible for
maintaining relatively stable flow at Willow Springsduring the recharge season (Fig. 11). Alternatively, duringsummers with negligible recharge, the hydraulic gradientacross the aquifer decreases due to draining most waterfrom the compartmentalized reservoirs and as a result aperturbed flow in Willow Springs is encountered. Thisperturbed flow is a consequence of heterogeneous flowpaths arising from grain size and K value (permeability)variations, as well as hydraulic barriers near the middleparts of the aquifer. This is clearly seen in the water levelmap (Fig. 8) in which the hydraulic gradient is relativelysteep at the GV4 profile and the water table is shallow(GV4 profile, Fig. 6). Diurnal variation in flow fromWillow Springs is attributed to variation in water loss bypotential ET and evaporation throughout the day–nightcycle.
Based on water chemistry, Mifflin (1968) suggestedthree categories of flow systems for springs in Nevada,which include small local, local, and regional flowsystems. Johnson (1980) investigated the temporal rela-tionship of water chemistry, discharge rate, and tritiumcontent for a group of small local springs in the RubyMountains, Nevada, and concluded that flow systems ofthe small local springs were shallow. By contrast, the localflow system was larger and deeper. The physical hydro-geological observations suggest that groundwater flow inGold Valley is within the small local flow system and flowprincipally takes place in the fractured part of the bedrockor at the lithological contact between bedrock and basinfill. Accordingly, the hydrogeological system of GoldValley indicates that the FCFZ acts as an effective barrierto groundwater flow across the Black Mountains block.This is most likely the main reason for absence of thehigh-flux springs in the Black Mountains.
Local recharge at Furnace CreekLong-term records (since 1988) of spring discharge in theFurnace Creek area and water level in a well nearTravertine Springs are available. To evaluate a possiblerelationship between spring flow and precipitation eventsin the Furnace Creek area, the measured flow of Nevares,Texas, and Travertine Springs is plotted with the hourlyrecorded precipitation at the weather station at DVNPHeadquarters using data from 2006 (Fig. 15). Generally,Travertine Springs showed a steady discharge rate with nosigns of response to any of the precipitation events, whichis due to the naturally high-flux of this springs whichdominates any perturbation. However, Texas Springsshowed a relatively moderate change in flow rate overthe reported time period, with possible indications of anincrease in flow rate subsequent to some precipitationevents (Fig. 15). Nevares Springs showed a distinctoscillatory flow, which is likely attributed to a malfunctionin measuring technique of the accompanying flume.
The estimated precipitational infiltration from the GIS-based model accounts only for the water that makes itsway below the root zone. It does not account for waterthat does not reach the saturated zone where it can be
715
Hydrogeology Journal (2012) 20: 701–718 DOI 10.1007/s10040-012-0840-8
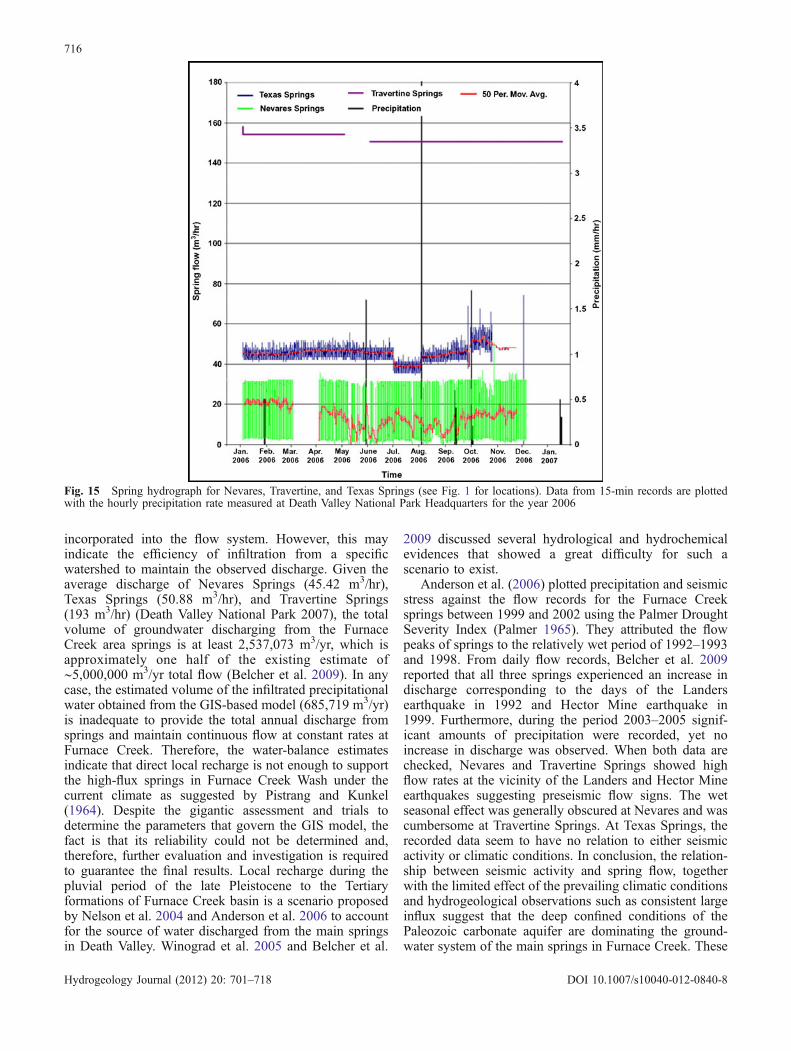
incorporated into the flow system. However, this mayindicate the efficiency of infiltration from a specificwatershed to maintain the observed discharge. Given theaverage discharge of Nevares Springs (45.42 m3/hr),Texas Springs (50.88 m3/hr), and Travertine Springs(193 m3/hr) (Death Valley National Park 2007), the totalvolume of groundwater discharging from the FurnaceCreek area springs is at least 2,537,073 m3/yr, which isapproximately one half of the existing estimate of∼5,000,000 m3/yr total flow (Belcher et al. 2009). In anycase, the estimated volume of the infiltrated precipitationalwater obtained from the GIS-based model (685,719 m3/yr)is inadequate to provide the total annual discharge fromsprings and maintain continuous flow at constant rates atFurnace Creek. Therefore, the water-balance estimatesindicate that direct local recharge is not enough to supportthe high-flux springs in Furnace Creek Wash under thecurrent climate as suggested by Pistrang and Kunkel(1964). Despite the gigantic assessment and trials todetermine the parameters that govern the GIS model, thefact is that its reliability could not be determined and,therefore, further evaluation and investigation is requiredto guarantee the final results. Local recharge during thepluvial period of the late Pleistocene to the Tertiaryformations of Furnace Creek basin is a scenario proposedby Nelson et al. 2004 and Anderson et al. 2006 to accountfor the source of water discharged from the main springsin Death Valley. Winograd et al. 2005 and Belcher et al.
2009 discussed several hydrological and hydrochemicalevidences that showed a great difficulty for such ascenario to exist.
Anderson et al. (2006) plotted precipitation and seismicstress against the flow records for the Furnace Creeksprings between 1999 and 2002 using the Palmer DroughtSeverity Index (Palmer 1965). They attributed the flowpeaks of springs to the relatively wet period of 1992–1993and 1998. From daily flow records, Belcher et al. 2009reported that all three springs experienced an increase indischarge corresponding to the days of the Landersearthquake in 1992 and Hector Mine earthquake in1999. Furthermore, during the period 2003–2005 signif-icant amounts of precipitation were recorded, yet noincrease in discharge was observed. When both data arechecked, Nevares and Travertine Springs showed highflow rates at the vicinity of the Landers and Hector Mineearthquakes suggesting preseismic flow signs. The wetseasonal effect was generally obscured at Nevares and wascumbersome at Travertine Springs. At Texas Springs, therecorded data seem to have no relation to either seismicactivity or climatic conditions. In conclusion, the relation-ship between seismic activity and spring flow, togetherwith the limited effect of the prevailing climatic conditionsand hydrogeological observations such as consistent largeinflux suggest that the deep confined conditions of thePaleozoic carbonate aquifer are dominating the ground-water system of the main springs in Furnace Creek. These
Fig. 15 Spring hydrograph for Nevares, Travertine, and Texas Springs (see Fig. 1 for locations). Data from 15-min records are plottedwith the hourly precipitation rate measured at Death Valley National Park Headquarters for the year 2006
716
Hydrogeology Journal (2012) 20: 701–718 DOI 10.1007/s10040-012-0840-8

conditions may experience important temporal modifica-tions in the flow of Furnace Creek springs that can berelated to local recharge during wet periods.
Conclusions
This study evaluated the hydrogeology of Gold Valley andshowed that groundwater accumulates in compartmental-ized reservoirs located mainly in the higher parts of thebasin. It is likely that the main flow paths occur within thefractured zone of the bedrock or at basin fill-bedrockcontact. In addition, most recharge takes place at highelevation during winter. This is reflected in the relativelysteady flow in Willow Springs in the winter compared tothe variable flow observed during summer. This hydro-geological setting indicates that the FCFZ acts as aneffective hydraulic barrier to groundwater flow across theBlack Mountains.
The GIS-based model presented in this study showsthat the estimated precipitational recharge in the FurnaceCreek catchment area, even in the most optimisticscenarios, is insufficient to provide the total volume ofgroundwater discharged from the main springs of FurnaceCreek wash. This conclusion requires further investigationand analysis to ensure the validity of the GIS model inestimating the precipitational recharge. Furthermore, fieldobservations and hydrogeochemistry of groundwaterindicate that there are geological and hydrologicalconstraints that make recharge during the late Pleistocenepluvial period difficult (Belcher et al. 2009). Accordingly,current local recharge or recharge during the late Pleisto-cene cannot adequately explain the origin of groundwaterin the Death Valley region. However, impartial reflectionson the overall hydrogeological setting acknowledge thatinterbasin flow together with partial local recent rechargeseems to be a better model for satisfying the geochemicalsignature and hydrogeological observations in FurnaceCreek Wash and the southern Great Basin in general.
Acknowledgements Funding from Inyo County and The Hydro-dynamics group is gratefully acknowledged. The fruitful discussionat the early stages of this work with J. Walton, University of Texasat El Paso, is greatly appreciated. The authors thank T. Fisk and J.Stark, both from Death Valley National Park, for technical andlogistical support. Acknowledgements are also given to B. Luke andher lab assistants at the Departments of Geoscience and CivilEngineering at the University of Nevada Las Vegas for providingthe resistivity survey instruments and tools. Comments and reviewsby T. Fisk, J. VonSchriltz, and S. Holt from Death Valley NationalPark were very helpful and are greatly appreciated.
References
Anderson K (2002) Contribution of local recharge to high fluxsprings in Death Valley National Park, California-Nevada. MScThesis, Brigham Young University, USA
Anderson K, Nelson S, Mayo A, Tingey D (2006) Interbasin flowrevisited: the contribution of local recharge to high-dischargesprings, Death Valley, CA. J Hydrol 323:276–302
Bedinger M, Langer W, Reed J (1989) Groundwater hydrology. In:Bedinger M, Sargent K, Langer, W (eds) Studies of geology andhydrology in the Basin and Range Province, southwesternUnited States, for isolation of high-level radioactive waste-characterization of the Death Valley region, Nevada andCalifornia, US Geol Surv Prof Pap 1307-F, pp 28-35
Belcher W, Sweetkind D (2010) Death Valley regional groundwaterflow system, Nevada and California: hydrogeologic frameworkand transient groundwater flow model: US Geological SurveyProf Pap 1711, 398 pp
Belcher W, Bedinger M, Back J, Sweetkind D (2009) Interbasinflow in the Great Basin with special reference to the southernFuneral Mountains and the source of Furnace Creek springs,Death Valley, California, USA. J Hydrol 369:30–43
Bushman M, Nelson S, Tingey D, Eggett D (2010) Regionalgroundwater flow in structurally–complex extended terranes: anevaluation of the sources of discharge at Ash Meadows,Nevada. J Hydrol 386:118–129
Caine J, Evan J, Foster C (1996) Fault zone architecture andpermeability structure. Geology 24:1025–1028
Classen H, (1985) Sources and Mechanism of recharge forgroundwater in the west-central Amargosa Desert, Nevada: ageochemical interpretation. US Geol Surv Prof Pap 712-F
Czarnecki J, Faunt C, GableW, Zyvoloski G (1996) On the developmentof a three-dimensional finite-element groundwater flowmodel of thesaturated zone, Yucca Mountain, Nevada and California, Proc.Model CARE ’96, Golden, CO, 25–27 September 1996
D’Agnese F, Faunt C, Turner A, Hill M (1997) Hydrogeologicevolution and numerical simulation of the Death Valley ground-water flow system, Nevada and California. US Geol Surv WaterResour Invest Rep 96-4300
D’Agnese F, O’Brien G, Faunt C, Belcher W, Sun Juan C (2002) Athree-dimensional numerical model of predevelopment condi-tions in the Death Valley regional ground-water flow system,Nevada and California. US Geol Surv Water Resour Invest Rep02-4102, 114 pp. http://pubs.usgs.gov/wri/wri024102/pdf/WRIR02-4102.pdf. Cited 19 January 2012
Danko G, Cluff T (2007) Infiltration-Evapotranspiration soil surfacemodel studies. Devils Hole Workshop 2007 Abstracts. USGeological Survey, Death Valley, CA
Dettinger M (1989) Distribution of carbonate-rock aquifers insouthern Nevada and the potential for their development:summary and findings. US Geological Survey, Carson City, CA
Dudley W Jr, Larson J (1976) Effect of irrigation pumping on desertpupfish habitats in Ash Meadows, Nye County, Nevada. USGeol Surv Prof Pap 927, 52 pp
Dunne T, Leopold L (1978) Water in environmental planning.Freeman, New York
Eakin T (1966) A regional inter-basin groundwater system in theWhite River area, southwestern Nevada. Water Resour Res2:251–271
Evans D, Sammis T, Cable D (1981) Actual evapotranspirationunder desert conditions. In: Evans D, Thames J (eds) Water indesert ecosystems. Dowden, Stroudsberg, PA, pp 195–218
Farmer D (1996) Investigation of regional flow patterns in the AshMeadows ground-water basin of southern Nevada usingUranium isotope ratios. MSc Thesis, University of Nevada,Las Vegas, USA
Faunt C (1997) Effect of faulting on groundwater movement in theDeath Valley region, Nevada and California. US Geol SurvWater Resour Invest Rep 95-4132, 42 pp
Ferretti D, Pendall E, Morgan J, Nelson J, Le Cain D,Moseir A (2003)Partitioning evapotranspiration fluxes from a Colorado grasslandusing stable isotopes: seasonal variations and ecosystem implica-tions of elevated atmospheric CO2. Plant Soil 254:291–303
Flint A, Flint L, Blainey J, Hevesi J (2002) Determining regionalgroundwater recharge in the Great Basin. 54th GSA AnnualMeeting, Rocky Mountain, Session no. 21, Southern UtahUniversity, Cedar City, UT, May 2002, Abstract
Friedman I, Smith G, Gleason J, Warden A, Harris J (1992) Stableisotope composition of waters in southeastern California, 1:modern precipitation. J Geophys Res 97:5795–5812
717
Hydrogeology Journal (2012) 20: 701–718 DOI 10.1007/s10040-012-0840-8

Harrill J (1986) Groundwater storage depletion in Pahrump Valley,Nevada–California, 1962–1975. US Geol Surv Water Suppl Pap2279, 53 pp
Harrill J (1995) A conceptual model of the Death Valley Ground-Water Flow System, Nevada and California. Report to NationalPark Services, Pal Consult., San Jose, CA
Harrill J, Gates J, Thomas J (1988) Major groundwater flow systemsin the Great Basin region of Nevada, Utah and adjacent states.US Geol Surv Hydrol Invest Atlas HA-694-C, 2 sheets
Hevesi J, Flint A, Flint L (2002) Preliminary estimates of spatiallydistributed net infiltration and recharge for the Death ValleyRegion, Nevada and California. US Geol Surv Water ResourInvest Rep 02-4010, 36 pp
Hevesi J, Flint A, Flint L (2003) Simulation of net infiltration andpotential recharge using a distributed-parameter watershedmodel of the Death Valley region, Nevada and California. USGeol Surv Water Resour Invest Rep 03-4090, 161 pp. Availablevia DIALOG Online at:http://pubs.usgs.gov/wri/wri034090/wrir034090.pdf. Cited 19 January 2012
Hutley L, O’Grady A, Eamus D (2001) Monsoonal influences oninfluences of Savanna vegetation of northern Australia. Oeco-logia 126:434–443
Johnson C (1980) Environmental controls on occurrences andchemistry of groundwater in a carbonate terrain of Castron,Nevada. Publ. no. 41066, Desert Research Institute, Reno, NV
Johnson R, Miffin M, Adenle O (1989) Hydrogeologic study of theBlack Mountains area, Death Valley National Monument,California. Meffile, Las Vegas, NV, 112 pp
Maxey G, Eakin T (1950) Groundwater in White River Valley,White Pine, Nye and Lincoln counties, Nevada. Nevada StateEngineer Water Resour Bull no. 8, 59 pp
Mifflin M (1968) Delineation of groundwater flow systems inNevada. Technical report series H-W, Publ. no. 4, University ofNevada and Desert Research Institute, Reno, NV, 109 pp
Miller G (1977) Appraisal of the water resources of DeathValley, California–Nevada. US Geol Surv Open File Rep77–728, 68 pp
Nelson S, Anderson K, Mayo A (2004) Testing the interbasin flowhypothesis at Death Valley, California. EOS Trans Am GeophysUnion 85(37):349
Nichols J, Eichinger W, Cooper D, Prueger J, Hipps L, NealeC, Bawazir A. (2004) Comparison of evapotranspirationestimation methods for a riparian area. IIHR technical reportNo. 436, College of Engineering, University of Iowa, IowaCity, IA, 50 pp
Palmer W (1965) Meteorological drought. Research paper no. 45,US Department of Commerce Weather Bureau, Washington,DC, 58 pp
Peterman Z, Stuckless J, Mahan S, Marshal B, Gutentag E, DowneyJ (1992) In: Kharka Y, Maest A (eds) Water–rock interaction:Proc. 7th. Water Rock Interaction Symp., Utah, USA. Balkema,Rotterdam, The Netherlands, pp 825–829
Pistrang M, Kunkel F (1964) A brief geologic and hydrologicreconnaissance of Furnace Creek wash area, Death ValleyNational Monument, California. US Geol Surv Water SupplPap 1779-Y, 35 pp
Prudic D, Harrill J, Burbey T (1993) Conceptual evaluation ofregional groundwater flow in the carbonate rock province of theGreat Basin, Nevada, Utah, and adjacent states. US Geol SurvOpen File Rep 170-93, 103 pp
Rice W (1984) Preliminary two-dimensional regional hydrologicmodel of the Nevada Test Site and vicinity: Albuquerque, NM.Report SAND83-7466, Sandia National Laboratories, Liver-more, CA, 89 pp
Steinkampf W, Werrel W (2001) Groundwater flow to Death Valley,as inferred from Chemistry and geohydrology of selectedsprings in Death Valley National Park, California and Nevada.US Geol Surv Water Resour Invest Rep 98-4114
Stetzenbach K, Farnham I, Hodge V, Johannesson K (1999) Usingmultivariate statistical analysis of groundwater major cation andtrace elements concentrations to evaluate groundwater flow in aregional aquifer. Hydrogeol Proc 13:2655–2673
Thomas J (1988) Delineation of groundwater flow systems insouthern Nevada using isotopic and chemical data. Geol SocAm Abst Prog 20:A363
Thomas J, Welch A, Dettinger M (1996) Geochemistry and isotopichydrology of representative aquifers in the Great Basin region ofNevada, Utah and adjacent States. US Geol Surv Prof Pap 1409-C
Winograd I, Eakin T (1965) Interbasin movement of groundwater insouth-central Nevada: the evidence. Geol Soc Am Abstr SpecPap 82, 227 pp
Winograd I, Friedman I (1972) Deuterium as a trace of groundwaterflow, southern Great Basin, Nevada and California. Geol SocAm Bull 83:3691–3708
Winograd I, Pearson F (1976) Major carbon 14 anomaly in aregional carbonate aquifer: possible evidence for megascalechanneling, south central Great Basin. Water Resour Res12:1125–1143
Winograd I, Thordarson W (1975a) Hydrogeologic and hydro-chemical framework, south-central Great Basin, Nevada-Cal-ifornia, with special reference to the Nevada Test Site. US GeolSurv Prof Pap 712-C, 123 pp
Winograd I, Thordarson W (1975b) Deuterium as a tracer ofregional groundwater flow, southern Great Basin, Nevada-California, with special reference to the Nevada Test Site. U SGeol Surv Prof Paper 712-C:123
Winograd I, Fridrich C, Sweetkind D, Belcher W, Thomas J (2005)Comment on “Testing the interbasin flow hypothesis at DeathValley, California”. EOS Trans Am Geophys Union 86(32):295–296
Workman J, Menges C, Page W, Taylor E, Ekren E, Rowley P,Dixon G, Thompson R, Wright L (2002) Geologic map of theDeath Valley groundwater model area, Nevada and California.US Geol Surv Miscel Field Studies Map MF-2381-A
718
Hydrogeology Journal (2012) 20: 701–718 DOI 10.1007/s10040-012-0840-8