Embed Size (px)
Citation preview
FABIO ANTONIO RIBEIRO MATOS
IMPACTOS DA FRAGMENTAÇÃO NA DIVERSIDADE FILOGENÉTICA,
FUNCIONAL E CO-BENEFÍCIOS NA FLORESTA TROPICAL ATLÂNTICA
VIÇOSA MINAS GERAIS – BRASIL
2016
Tese apresentada à Universidade Federal de Viçosa, como parte das exigências do Programa de Pós-Graduação em Botânica, para obtenção do título de Doctor
Scientiae.

Ficha catalográfica preparada pela Biblioteca Central daUniversidade Federal de Viçosa - Câmpus Viçosa
T
Matos, Fabio Antonio Ribeiro, 1982-M433i2016
Impacto da fragmentação na diversidade filogenética,funcional e co-benefícios na floresta tropical Atlântica /Fabio Antonio Ribeiro Matos. - Viçosa, MG, 2016.
x, 156f : il. (algumas color.) ; 29 cm.
Orientador : João Augusto Alves Meira Neto.Tese (doutorado) - Universidade Federal de Viçosa.Inclui bibliografia.
1. Ecologia florestal. 2. Florestas tropicais.3. Comunidades vegetais. 4. Biodiversidade. 5. Dióxido decarbono - Aspectos ambientais. 6. Natureza - Influência dohomem . I. Universidade Federal de Viçosa. Departamentode Biologia Vegetal. Programa de Pós-graduação emBotânica. II. Título.
CDD 22. ed. 577.3
FichaCatalografica :: Fichacatalografica https://www3.dti.ufv.br/bbt/ficha/cadastrarficha/visua...
2 de 3 09-05-2016 09:48
FABIO ANTONIO RIBEIRO MATOS
IMPACTOS DA FRAGMENTAÇÃO NA DIVERSIDADE FILOGENÉTICA,
FUNCIONAL E CO-BENEFÍCIOS NA FLORESTA TROPICAL ATLÂNTICA
APROVADA: 7 de março de 2016.
___________________________ __________________________ Luiz Fernando Silva Magnago Carlos Frankl Sperber (Coorientador)
___________________________ __________________________ José Henrique Schoereder Markus Gastauer
_______________________________ João Augusto Alves Meira Neto
(Orientador)
Tese apresentada à Universidade Federal de Viçosa, como parte das exigências do Programa de Pós-Graduação em Botânica, para obtenção do título de Doctor
Scientiae.
ii
“Quem caminha sozinho pode até chegar mais rápido, mas aquele que vai
acompanhado, com certeza vai mais longe”
Clarice Lispector
Eu dedico esta tese à David Edwards,
Luiz Magnago e Mônica P. da Silva.
Sem vocês teria sido impossível!
iii
AGRADECIMENTOS
Agradeço a minha família, em especial a minha irmã Eliani pela atenção, carinho
e pelas sábias palavras em momentos de escuridão.
A minha noiva Mônica pela amizade, carinho e atenção ao longo desta jornada,
bem como pelos maravilhosos momentos de descontração e alegria que me
proporciona. Também agradeço pelas pacientes revisões.
A Universidade Federal de Viçosa pela oportunidade de crescimento através do
contato com o seu corpo docente, discente e utilização do espaço físico. Em
especial agradeço ao Ângelo pela dedicação, atenção e carinho com que nos
recebe.
A ArcelorMittal pelo financiamento da coleta de dados para a realização desta
tese e a CAPES (Coordenação de Aperfeiçoamento de Pessoal de Nível
Superior) pela concessão de minha bolsa de estudos no Brasil e no exterior
(processo número 99999.006537/2014-06).
Ao meu orientador professor Dr. João Augusto Alves Meira Neto, pela confiança,
incentivo, atenção e amizade no decorrer destes seis anos em que fiquei sob
sua orientação.
Ao meu coorientador Luiz Fernando Silva Magnago pelos valiosos ensinamentos
e amizade.
Ao meu coorientador David P. Edwards, por ter me recebido em seu laboratório
na Universidade de Sheffield-UK, bem como pelos valiosos ensinamentos
durante o processo de coorientação.
Aos companheiros de trabalho e amigos Marcelo Simonelli, Luiz Fernando Silva
Magnago e Mariana Ferreira Rocha. Em especial a Luiz e Mariana pelas valiosas
discussões ecológicas e estatísticas.
Agradeço também aos colegas adquiridos Carol, Glaucia, Luiz Benevides,
Naiara, Júnia, Alex, Pedro, Prímula, Romero, Gustavo pelas valiosas conversas
ao longo destes quatro anos. A vocês meu muito obrigado!

iv
SUMÁRIO
RESUMO .............................................................................................................................. vii
ABSTRACT ........................................................................................................................... ix
I – Introdução Geral ............................................................................................................ 1
II. Referências Bibliográficas ............................................................................................ 4
III. CAPÍTULO I ..................................................................................................................... 9
Effects of landscape configuration, composition and edges on phylogenetic diversity of trees in a highly fragmented tropical forest.......................................... 9
Summary ..........................................................................................................................10
Introduction .....................................................................................................................12
Materials and methods ..................................................................................................14
Study sites .....................................................................................................................14
Data collection ..............................................................................................................15
Data analysis .................................................................................................................15
Results..............................................................................................................................20
Impacts of landscape configuration on phylogenetic diversity ..................................20
Impacts of landscape composition on phylogenetic diversity ...................................20
Impacts of fragment size and edge-effects on phylogenetic diversity......................21
Discussion .......................................................................................................................22
Impacts of landscape configuration on phylogenetic diversity ..................................22
Impacts of landscape composition on phylogenetic diversity ...................................23
Impacts of fragment size and edge-effects on phylogenetic diversity......................24
Conclusions and conservation implications ............................................................25
Acknowledgements........................................................................................................26
References .......................................................................................................................26
IV. CAPÍTULO II ...................................................................................................................41
Impacts of forest fragmentation on the functional diversity of trees: roles of landscape configuration and composition in the Brazilian Atlantic forest .........41
ABSTRACT ......................................................................................................................42
Introduction .....................................................................................................................43
Materials and methods ..................................................................................................45
Study sites .....................................................................................................................45
Data collection ..............................................................................................................46
Metrics of fragmentation...............................................................................................47
Functional trait matrix ...................................................................................................48
Measures of functional diversity ..................................................................................48
v
Measures of null model ................................................................................................49
Measures of functionally unique species ....................................................................49
Statistical analyses .......................................................................................................50
Results..............................................................................................................................50
Impacts of landscape configuration on functional diversity .......................................51
Impacts of landscape composition on functional diversity ........................................52
Discussion .......................................................................................................................53
Impacts of landscape configuration on functional diversity .......................................53
Impacts of landscape composition on functional diversity ........................................55
Conclusions and conservation implications ............................................................55
Acknowledgements........................................................................................................57
Role of the funding source ...........................................................................................57
References .......................................................................................................................57
V. CAPÍTULO III ...................................................................................................................72
Does natural forest regeneration offer important carbon-biodiversity co-benefits in a highly fragmented landscape? ................................................................................72
Abstract ............................................................................................................................72
Introduction .....................................................................................................................73
Materials and methods ..................................................................................................75
Study area .....................................................................................................................75
Tree sampling locations ...............................................................................................75
Tree sampling methods ................................................................................................77
Above-ground carbon stock .........................................................................................77
Phylogeny construction ................................................................................................78
Functional trait matrix ...................................................................................................78
Functional dendrogram construction ...........................................................................79
Tree conservation value ...............................................................................................79
Statistical analysis ........................................................................................................81
Results..............................................................................................................................82
Impacts of habitat type, forest age and source distance on carbon stock ...............82
Impacts of habitat type, forest age and source distance on biodiversity .................82
Impacts of habitat type, forest age and source distance on phylogenetic and
functional diversity ........................................................................................................84
Are there co-benefits between carbon stock and conservation value? ...................85
Discussion .......................................................................................................................86
Impacts of habitat type, forest age and source distance on carbon stock ...............86
vi
Impacts of habitat type, forest age and source distance on biodiversity .................87
Impacts of habitat type, forest age and source distance on phylogenetic and
functional diversity ........................................................................................................88
Are there co-benefits between carbon stock and conservation value......................88
Policy recommendations and conclusions ...............................................................89
Acknowledgments ..........................................................................................................90
Role of the funding source ...........................................................................................90
References .......................................................................................................................90
VI - Conclusões Gerais ....................................................................................................103
VII – SUPPLEMENTARY MATERIAL .............................................................................104
III. CAPÍTULO I .............................................................................................................104
Effects of landscape configuration, composition and edges on phylogenetic diversity of trees in a highly fragmented tropical forest.......................................104
IV. CAPÍTULO II .............................................................................................................115
Impacts of forest fragmentation on the functional diversity of trees: roles of landscape configuration and composition in the Brazilian Atlantic forest .......115
IV. CAPÍTULO III ............................................................................................................135
Does secondary forest offer important carbon-biodiversity co-benefits in a highly fragmented landscape? ..................................................................................135
vii
RESUMO
MATOS, Fabio Antonio Ribeiro, D.Sc., Universidade Federal de Viçosa, março de 2016. Impactos da fragmentação na diversidade filogenética, functional e co-benefícios na Floresta Tropical Atlântica. Orientador: João Augusto Alves Meira-Neto. Coorientadores: Luiz Fernando Silva Magnago e David P. Edwards.
A fragmentação de habitat e a degradação das florestas tropicais causadas por mudanças no uso da terra, são as principais ameaças à biodiversidade e a emissões de carbono antropogênico. Consequentemente, o desenvolvimento de políticas adequadas de conservação requer uma compreensão de como as comunidades são afetadas pelas mudanças antropogênicas das paisagens. Para investigar os efeitos da fragmentação e possíveis co-benefícios entre carbono e biodiversidade em florestas em renegeração, focamos nas espécies arbóreas, tendo três objetivos gerais: (i) verificar os efeitos da configuração e composição das paisagens e o efeito de borda sobre a diversidade filogenética; (ii) avaliar o impacto da fragmentação sobre a diversidade funcional; (iii) verificar a existência de co-benefícios entre biodiversidade e o estoque de carbono para aplicação de mecanismos de conservação, por meio do mercado de carbono (Reducing Emissions from Deforestation and Forest Degradation - REDD+), utilizando como modelo florestas em regeneração. Nosso estudo foi desenvolvido na floresta tropical brasileira conhecida como Florestas de Tabuleiro. Para o objetivo geral (i), amostramos 27 fragmentos de diferentes tamanhos, formas e graus de isolamento, com um total de 280 parcelas de 10mx10m, sendo que, para 12 destes fragmentos também alocamos 120 parcelas de igual tamanho no ambiente de borda. Para o objetivo geral (ii) utilizamos os mesmos 27 fragmentos descrito para o objetivo (i), contudo, sem o ambiente de borda. Para o objetivo (iii), utilizamos 27 fragmentos de floresta primária, 11 fragmentos de florestas em regeneração e 11 pastos de criação de gado, totalizando 490 parcelas de 10mx10m. Em cada parcela coletamos todos os indivíduos arbóreos, com diâmetro à altura do peito (DAP; a 1,30 metros acima do solo) ≥4.8 cm de diâmetro. De acordo com cada objetivo deste estudo, os indivíduos amostrados foram classificados em espécies endêmicas da Floresta Atlântica, ameaçadas de extinção (Lista Vermelha da IUCN), quanto às suas características funcionais, como também calculados suas respectiva densidade de madeira e carbono. A diversidade filogenética-PD foi positivamente relacionada ao aumento da porcentagem de cobertura florestal. A distância filogenética entre pares de indivíduos que co-ocorrem (SES.MPD), diminuiu com o aumento da irregularidade dos fragmentos e com a densidade de fragmentos nas paisagens. PD foi maior no interior do que no ambiente de borda, enquanto SES.MNTD, foi menor no interior do que nos ambientes de borda. Em termos da diversidade funcional, o isolamento gerou uma redução da regularidade funcional e aumento da divergência funcional. Além disso, grandes fragmentos apresentaram uma menor uniformidade funcional, enquanto a dispersão funcional diminuiu com aumento da cobertura florestal. Encontramos também, que paisagens com maior densidade de fragmentos apresentaram maiores valores de densidade da madeira. Em termos de co-benefícios, encontramos positivas relações entre o carbono das árvores com todas as métricas de biodiversidade utilizadas neste estudo. Temos como conclusões

viii
principais que: (i) a composição das paisagens e o efeito de borda altera a diversidade filogenética das espécies arbóreas estocadas nos remanescentes de floresta. Por outro lado, paisagens fragmentadas possuem a capacidade de manter elevada história evolutiva, dada a retenção de diversidade filogenética, através de uma gama de métricas de configuração das paisagens; (ii) o isolamento aumentou a diferenciação de nicho através do incremento de espécies adaptadas ao distúrbio. Métricas de composição das paisagens geraram um incremento da co-ocorrência de espécies funcionalmente semelhantes; e (iii) existem fortes co-benefícios entre o estoque de carbono e a biodiversidade em florestas em regeneração, mesmo estas estando isoladas de grandes blocos florestais.
ix
ABSTRACT
MATOS, Fabio Antonio Ribeiro, D.Sc., Universidade Federal de Viçosa, march, 2016. Impact of fragmentation on phylogenetic and functional diversity, and cobenefits in a Tropical Atlantic Rain Forest. Adviser: João Augusto Alves Meira-Neto. Co-advisers: Luiz Fernando S. Magnago e David P. Edwards.
Fragmentation and degradation of tropical forests caused by changes in land use
are among the main causes of biodiversity loss and emissions of greenhouse
gases. Consequently, the development of appropriate conservation policies
requires an understanding of how communities are affected by anthropogenic
changes of landscapes. To investigate the effects of fragmentation and possible
cobenefits between carbon storage and biodiversity conservation in forest
regeneration, we focus on tree species, with three general objectives: (i) verify
effects of configuration and composition of the landscapes and the edge effect
on the phylogenetic diversity; (ii) evaluate the fragmentation impact on the
functional diversity; (iii) verify the existence of cobenefits between carbon storage
and tree-biodiversity to application of conservation mechanisms, through the
carbon market (Reducing Emissions from Deforestation and Forest Degradation
- REDD +), in forest regeneration. Our experiment was developed in a fragmented
landscape of a type of Brazilian Atlantic Forest known as Tableland Forest. For
the first objective (i), we sampled 27 fragments of different sizes, shapes and
isolation levels, with 280 plots of 10 m x 10 m. For the second objective (ii), we
used the same 27 fragments without edge plots. For the third objective (iii), we
used 27 fragments of primary forest, 11 fragments in regeneration and 11 in cattle
pastures, totaling 490 plots of 10 m x 10 m. In each plot we collect all trees with
a diameter at breast height (DBH, 1.30 meters above the ground) ≥4.8 cm in
diameter. According to each objective of this study, from the sampled individuals
we identified the endemic species of the Atlantic Forest, the threatened species
(IUCN Red List), their functional characteristics and calculated their respective
wood density and carbon storage. Phylogenetic diversity-PD was significantly
and positively associated with an increased
x
percentage of forest cover. The phylogenetic distance between individuals that
co-occur (SES.MPD) reduced with increasing irregularity of fragments and
fragments density in the landscape. PD was higher on the fragments interiors
than on the edge habitat, while SES.MNTD was lower on the fragments interiors
than on the edge habitat. In terms of the functional diversity, the isolation led to a
reduction of functional regularity and increased functional divergence. In addition,
the larger the fragments, the lower the functional uniformity; while functional
dispersion decreases as percentage of forest cover increases. We also found
that landscapes with higher density of fragments have higher values of wood
density. In terms of co-benefits, we find positive relationship between the carbon
storage and all the biodiversity metrics used in this study. Finally we have
remarkable conclusions about Brazilian Rainforest fragmentation and cobenefits,
being: (i) the composition of landscapes and edge effects alter the phylogenetic
diversity of the tree species stored in forest remnants. Moreover, fragmented
landscapes have the ability to maintain high evolutionary history, given the
phylogenetic diversity retention, across a range metrics of configuration of
landscapes; (ii) isolation increased the niche differentiation through the increase
of species adapted to disturbance. The metric of landscapes composition
increases with the co-occurrence of functionally similar species; and (iii) there are
strong cobenefits between carbon storage and biodiversity in forests
regeneration, even if isolated from large forest blocks.
1
I – Introdução Geral
As florestas tropicais, desempenham importantes papéis, como controle
da invasão biológica (Kennedy et al., 2002), sequestro e estoque de carbono em
sua biomassa (Lewis, 2006; Laurance, 2008), regulação climática (Anderson-
Teixeira et al., 2012), além de fornecer recursos madeireiros, não madeireiros,
alimentícios (e.g., pesca, caça frutos e sementes) e culturais (e.g., estético,
artístico, científico e espiritual), para mais de 800 milhões de pessoas que vivem
nestes ecossistemas (Chomitz et al., 2007). Apesar disto, devido a atividades
antrópicas, estas florestas estão entre umas das mais ameaçadas do globo,
especialmente pela exploração irregular e desordenada de seus recursos
naturais, fragmentação de habitats, uso e ocupação desordenada do solo (Gibbs
et al., 2010; Hansen et al., 2013; Magnago et al., 2014; Magnago et al., 2015a;
Lewis, Edwards & Galbraith, 2015).
A fragmentação de habitat ocorre pelo processo de transformação de
áreas anteriormente contínuas, em manchas isoladas do habitat original,
geralmente ladeadas por áreas transformadas por ação antrópica (Wilcove et al.,
1986; Fahrig, 2003; Bennett & Saunders, 2010). Desta forma, o processo de
fragmentação pode ser caracterizado por conduzir modificações na configuração
e composição das paisagens. Dentre os efeitos da fragmentação na
configuração das paisagens, podemos citar: (i) aumento na irregularidade da
forma (Hill & Curran, 2003); e (ii) aumento do isolamento (Ewers & Didham,
2006); enquanto que os efeitos geralmente descritos para características de
composição são: (iii) redução da área do fragmento (Ewers & Didham, 2006;
Magnago et al., 2014); e (iv) aumento da densidade de fragmentos nas
paisagens (Bennett & Saunders 2010; Boscolo & Petzger, 2011). Em adição,
posteriormente ao processo de fragmentação o principal efeito indireto é o
aumento da área de borda dos remanescentes florestais (i.e., efeito de borda;
Fahrig, 2003; Ewers & Didham, 2006).
A fragmentação, é considerada uma das maiores ameaças à
biodiversidade, com redução da riqueza de espécies e alterações na composição
das comunidades (Magnago et al., 2014), redução da densidade da madeira
(Laurance et al. 2006) e estoque de carbono (Pütz et al. 2014; Berenguer et al.
2014; Magnago et al., 2015a). Em adição, a redução da área do fragmento
2
aumenta os efeitos de borda, conduzindo mudanças abióticas e bióticas que
interferem na estrutura e funcionamento dos ecossistemas (Laurance et al. 2006;
Magnago et al., 2014). Dentre os efeitos abióticos, temos o aumento da
temperatura e redução da umidade relativa do ar (Magnago et al., 2015b). Em
termos dos efeitos bióticos, temos o aumento da taxa de mortalidade de árvores
e da densidade de lianas (Laurance et al. 2002), bem como a substituição de
espécies tardias por espécies pioneiras com baixa densidade da madeira
(Laurance et al. 2006; Pütz et al. 2011). Por fim, além da fragmentação e efeito
de borda, a criação de fragmentos com forma mais irregular e o aumento do
isolamento entre remanescentes florestais afetam negativamente a ocorrência
das espécies (Boscolo & Metzger et al., 2011), com profundos efeitos sobre as
relações planta-dispersores (Laurance et al., 2011; Hagen et al., 2012).
Apesar de ter sido realizado considerável esforço nas últimas décadas
para a compreensão do efeito da fragmentação (i.e., métricas de configuração e
composição das paisagens) sobre a biodiversidade, a maioria dos estudos foram
centrados na dimensão taxonômica da biodiversidade (e.g., riqueza de espécies,
diversidade de espécies; Fahrig, 2003; Sodhi & Ehrlich 2010; Tscharntke et al.,
2012). Como os efeitos da variação ambiental, incluindo o produzido pelo
processo de fragmentação, são mediados por características das espécies (e.g.,
limitações fisiológicas, necessidades de habitat, habilidades na dispersão),
considerações sobre a diversidade taxonômica só podem fornecer uma
impressão incompleta sobre as consequências das atividades humanas sobre a
biodiversidade em escala local ou regional. Por conseguinte, a inclusão de
atributos de espécies, tais como funções ecológicas ou histórias evolutivas, em
avaliações da biodiversidade, pode fornecer maior subsidío na tomada de
decisões visando a conservação da biodiversidade em paisagens altamente
fragmentadas de floresta tropical.
Estimativas da biodiversidade, com base na história evolutiva e funções
ecológicas das espécies, descrevem a dimensão da diversidade filogenética e a
dimensão da diversidade funcional. A priorização de distinção evolutiva para
planejamento de conservação, pode nos ajudar a preservar o máximo da
diversidade filogenética em fragmentos remanescentes (Mace, Gittleman &
Purvis, 2003; Redding & Mooers, 2006; Isaac et al., 2007). Por outro lado, a
conservação da diversidade filogenética diminui a chance de se perder fenótipos
únicos e características ecológicas importantes (Jetz et al., 2014),
3
proporcionando benefícios para o funcionamento e estabilidade dos
ecossistemas (Dinnage et al., 2012; Cadotte, 2013). Diversidade funcional mede
a variabilidade dos atributos funcionais entre espécies dentro de uma
comunidade (Petchey e Gaston, 2006), permitindo compreender os impactos da
fragmentação florestal sobre os papéis que as espécies desempenham dentro
das comunidades. Com a conservação de elevada diversidade funcional,
espera-se que seja mantido dentro dos ecossistemas um grande número de
espécies funcionalmente distintas, bem como o provisionamento de serviços
ecossistêmicos, através de uma variedade de mecanismos (Tilman et al., 1997;
O`Gorman et al., 2011).
Além da elevada biodiversidade, as florestas tropicais são responsáveis
por ~32% da produção primária global (Field et al., 1998), abrigando os maiores
estoques de carbono acima do solo (Lewis, 2006; Laurance, 2008). No entanto,
estas regiões são cada vez mais dominadas por atividades humanas (Lewis,
Edwards & Galbraith, 2015), tendo experimentado a degradação dramática via
extração de madeira e desmatamento para a agricultura (Gibbs et al., 2010;
Hansen et al., 2013). Estes diferentes tipos de distúrbios combinados, são
importantes fontes de emissões de carbono antropogênicos, perdendo apenas
para a queima de combustíveis fósseis (Fearnside & Laurence, 2004; Bonan,
2008; Van der Werf, 2009). As emissões de dióxido de carbono e outros gases
de efeito estufa podem conduzir a mudanças climáticas, agravando a perda de
biodiversidade global no futuro (Thomas et al., 2004). Apesar dos impactos
negativos na biodiversidade e no clima, existe um déficit substancial no
financiamento disponível para deter as perdas de biodiversidade e carbono
(McCarthy et al., 2012).
Considerando que os recursos financeiros disponíveis para combater as
alterações climáticas e a perda de biodiversidade são limitados, há uma
necessidade urgente de identificar ações que visem, simultaneamente, ambas
as questões (Miles & Kapos, 2008; McCarthy et al, 2012). Um potencial
emergente para pagamento de carbono baseado em serviços ecossistêmicos é
o mecanismo proposto pelas Nações Unidas: a redução das emissões por
desmatamento e degradação florestal (Reduced Emissions from Deforestation
and Degradation; REDD+), com o '+' incluindo pagamentos para melhorias do
estoque de carbono das florestas, simultaneamente, protegendo a
4
biodiversidade como um co-benefício gratuito da proteção do estoque de
carbono.
Para que o mecanismo REDD+ ofereça co-benefícios, é essencial que
sejam identificadas as atividades que conservem carbono e possuam uma forte
relação entre carbono e biodiversidade. Contudo, a maioria dos trabalhos tem
focado no potencial de co-benefícios através da prevenção do desmatamento
(Miles & Kapos, 2008; Venter et al., 2009; Phelps, Webb & Adams 2012) e
impactos associados à fragmentação das florestas (Magnago et al., 2015a).
Desta forma, se fazem necessários estudos que indiquem os potenciais
estoques de carbono e co-benefícios para as florestas em regeneração após
distúrbio, uma vez que estas representam uma elevada porcentagem das
paisagens de florestas tropicais.
Neste estudo, avaliamos o efeito da fragmentação em comunidades de
árvores sobre a sua diversidade funcional e filogenética, bem como, os possíveis
mecanismos de co-benefícios entre carbono e biodiversidade para florestas em
regeneração. Este estudo foi conduzido na altamente fragmentada e ameaçada
floresta Atlântica brasileira, um hotspot de biodiversidade, aonde 300 espécies
de árvores são encontrados em apenas um hectare de floresta (Rolim & Chiarello
2004; Saiter et al., 2011). Este estudo foi dividido em três capítulos. No primeiro
capítulo, avaliamos o efeito da configuração das paisagens, composição e efeito
de borda na diversidade filogenética de árvores. No segundo capítulo,
investigamos os impactos da fragmentação florestal sobre a diversidade
funcional de árvores. No terceiro capítulo, avaliamos se florestas em
regeneração em paisagens altamente fragmentadas podem oferecer co-
benefícios entre carbono e biodiversidade.
II. Referências Bibliográficas
Anderson-Teixeira, K.J., Snyder, P.K., Twine, T.E., Cuadra, S. V., Costa, M.H., DeLucia, E.H., 2012. Climate-regulation services of natural and agricultural ecoregions of the Americas. Nat. Clim. Chang. 2, 177–181.
Berenguer, E., Ferreira, J., Gardner, T.A., Aragão, L.E.O.C., De Camargo, P.B., Cerri, C.E., Durigan, M., Oliveira, R.C. De, Vieira, I.C.G. & Barlow, J. (2014) A large-scale field assessment of carbon stocks in human-modified tropical forests. Global Change Biology, 2005, 3713–3726.
Boscolo, D. & Paul Metzger, J. (2011) Isolation determines patterns of species presence in highly fragmented landscapes. Ecography, 34, 1018–1029.
5
Bonan, G. B. (2008). Forests and climate change: forcings, feedbacks, and the climate benefits of forests. Science 320, 1444-1449.
Cadotte, M.W. (2013) Experimental evidence that evolutionarily diverse assemblages result in higher productivity. Proceedings of the National Academy of Sciences, 110, 8996–9000.
Chomitz, K.M., Buys, P., De Luca, G., Thomas, T.S., Wertz-Kanounnikoff, S. (2007). At Loggerheads? Agricultural Expansion, Poverty Reduction and Environment in the Tropical Forests. © World Bank, Washington, DC.
Dinnage, R., Cadotte, M.W., Haddad, N.M., Crutsinger, G.M. & Tilman, D. (2012) Diversity of plant evolutionary lineages promotes arthropod diversity. Ecology Letters, 15, 1308–1317.
Ewers, R.M. & Didham, R.K. (2006) Confounding factors in the detection of species responses to habitat fragmentation. Biological reviews of the Cambridge Philosophical Society, 81, 117–42.
Fahrig, L. (2003) Effects of Habitat Fragmentation on Biodiversity. Review Literature And Arts Of The Americas, 34, 487–515.
Fearnside, P.M. & Laurance, W.F. (2004) Tropical deforestation and greenhouse-gas emissions. Ecological Applications, 14, 982–986.
Field, CB., Behrenfeld MJ, Randerson, JT, Falkowski P. (1998) Primary Production of the Biosphere: Integrating Terrestrial and Oceanic Components. Science, 281, 237–240
Gibbs, H.K., Ruesch, A.S., Achard, F., Clayton, M.K., Holmgren, P., Ramankutty, N. & Foley, J.A. (2010) Tropical forests were the primary sources of new agricultural land in the 1980s and 1990s. Proceedings of the National Academy of Sciences, 107, 16732–16737.
Hagen, M., Kissling, D.W., Rasmussen, C., De Aguiar, M.A.M, Brown, L.E., Cartensen, D.W., Alves-Dos-Santos, I., Dupont, Y.L., Edwards, F.K., Genini, J., Guimarães Jr., P.R., Jenkins, G.B., Jordano, P., (2010). Biodiversity, Species Interactions and Ecological Networks in a Fragmented World. Advances in Ecological Research. 46: 89-210.
Hansen, M.C., Potapov, P. V, Moore, R., Hancher, M., Turubanova, S. a, Tyukavina, a, Thau, D., Stehman, S. V, Goetz, S.J., Loveland, T.R., Kommareddy, a, Egorov, a, Chini, L., Justice, C.O. & Townshend, J.R.G. (2013) High-resolution global maps of 21st-century forest cover change. Science (New York, N.Y.), 342, 850–3.
Hill, J.L. & Curran, P.J. (2003) Area, shape and isolation of tropical forest fragments : effects on tree species diversity and implications for conservation. 30 , 1391–1403.
Isaac, N.J.B., Turvey, S.T., Collen, B., Waterman, C. & Baillie, J.E.M. (2007) Mammals on the EDGE: Conservation Priorities Based on Threat and Phylogeny. PLoS ONE, 2, e296.
Jetz, W., Thomas, G.H., Joy, J.B., Redding, D.W., Hartmann, K. & Mooers, A.O. (2014) Global Distribution and Conservation of Evolutionary Distinctness in Birds. Current Biology, 24, 919–930.
6
Kennedy, T.A.; S. Naemm, K.M. Howe, J.M.H. Knops, D. Tilman, P. Reich (2002) Biodiversity as a barrier to ecological invasion Nature, 417 pp. 636–638
Laurance, W.F., Lovejoy, T.E., Vasconcelos, H.L., Bruna, E.M., Didham, R.K., Stouffer, P.C., Gascon, C., Bierregaard, R.O., Laurance, S.G. & Sampaio, E. (2002) Ecosystem decay of Amazonian forest fragments: A 22-year investigation. Conservation Biology, 16, 605–618.
Laurance, W. F.; Nascimento, H.; Laurance, S. G.; Andrade, A.; Ribeiro, J.; Giraldo, J.; Lovejoy, T. E.; Condit, R.; Chave, J.; D’Angelo, S. (2006). Rapid decay of tree community composition in Amazonian forest fragments. Proceedings of the National Academy of Sciences USA 103: 19010–19014.
Laurance, WF (2008) Can carbon trading save vanishing forest?. BioScience, 58, 286–287.
Laurance, W.F., Camargo, J L.C., Luizão, R.C.C., Laurance, S.G., Pimm, S.L., Bruna, E.M., Stouffer, P.C. Williamson, G.B., Benítez-Malvido, J., Vasconcelos, H. L., (2011). The fate of Amazonian forest fragments: A 32-year investigation. Biological Conservation. 144, 56–67.
Lewis, S.L. (2006) Tropical forests and the changing earth system. Philosophical transactions of the Royal Society of London. Series B, Biological sciences, 361, 195–210.
Lewis, S.L., Edwards, D.P., Galbraith, D., (2015( Increasing human dominance of tropical forests. Science, 349, 827-832.
Mace, G.M., Gittleman, J.L & Purvis, A. (2003) Preserving the Tree of Life. Science, 300, 1707–1709.
McCarthy, D. P., Donald, P. F., Scharlemann, J. P., Buchanan, G. M., Balmford, A., Green, J. M., Green, J. M. H., Bennun, L. A., Burgess, N. D., Fishpool, L. D. C., Garnett, S. T., Leonard, D. L., Maloney, R. F., Morling, P., Schaefer, H. M., Symes, A., Wiedenfield, D. A. & Butchart, S. H. (2012). Financial costs of meeting global biodiversity conservation targets: current spending and unmet needs. Science 338, 946-949.
Magnago, L.F.S., Edwards, D.P., Edwards, F.A., Magrach, A., Martins, S. V. & Laurance, W.F. (2014) Functional attributes change but functional richness is unchanged after fragmentation of Brazilian Atlantic forests. Journal of Ecology, 102, 475–485.
Magnago, L.F.S., Magrach, A., Laurance, W.F., Martins, S. V., Meira-Neto, J.A. a., Simonelli, M. & Edwards, D.P. (2015a) Would protecting tropical forest fragments provide carbon and biodiversity co-benefits under redd+? Global Change Biology, 21, 3455–3468.
Magnago, L.F.S., Magrach, A., Laurance, W.F., Martins, S. V., Meira-Neto, J.A. a., Simonelli, M. & Edwards, D.P. (2015b) Would protecting tropical forest fragments provide carbon and biodiversity co-benefits under redd+? Global Change Biology, 21, 3455–3468.
Miles, L. & V, K. (2008) Reducing greenhouse gas emissions from deforestation and forest degradation: global land-use implications. Science, 320, 1454.
O’Gorman, E.J., Yearsley, J.M., Crowe, T.P., Emmerson, M.C., Jacob, U., Petchey, O.L., (2011). Loss of functionally unique species may gradually
7
undermine ecosystems. Proc. R. Soc. B Biol. Sci. 278, 1886–1893.
Phelps J, Friess DA, Webb EL (2012) Win–win REDD+ approaches belie carbon–biodiversity trade-offs. Special Issue Article: REDD+ and Conservation, Biological Conservation, 154, 53–60.
Petchey, O.L., Gaston, K.J., (2006). Functional diversity: back to basics and looking forward. Ecol. Lett. 9, 741–758.
Pütz, S.; Groeneveld, J.; Alves, L. F.; Metzger, J. P.; Huth, A. (2011). Fragmentation drives tropical forest fragments to early successional states: A modelling study for Brazilian Atlantic forests. Ecological Modelling 222: 1986-1997.
Pütz, S., Groeneveld, J., Henle, K., Knogge, C., Martensen, A.C., Metz, M., Metzger, J.P., Ribeiro, M.C., de Paula, M.D. & Huth, A. (2014) Long-term carbon loss in fragmented Neotropical forests. Nature Communications, 5, 5037.
Redding, D.W. & Mooers, A.Ø. (2006) Incorporating Evolutionary Measures into Conservation Prioritization. Conservation Biology, 20, 1670–1678.
Rolim, S.G. & Chiarello, A.G. (2004) Slow death of Atlantic forest trees in cocoa agroforestry in southeastern Brazil. Biodiversity and Conservation, 13, 2679–2694.
Saiter, F.Z., Guilherme, F.A.G., Thomaz, L.D. & Wendt, T. (2011) Tree changes in a mature rainforest with high diversity and endemism on the Brazilian coast. Biodiversity and Conservation, 20, 1921–1949.
Sodhi, N.S. & Ehrlich, P.R. (2010) Conservation Biology for All. Oxford University Press, New York, New York, USA.
Tilman, D., Knops, J., Wedin, D., Reich, P., Ritchie, M., Siemann, E., 1997. The influence of functional diversity and composition on ecosystem processes. Science 277, 1300–1302.
Thomas, C. D., Cameron, A., Green, R. E., Bakkenes, M., Beaumont, L. J., Collingham, Y. C., Erasmus. B. F. N., Ferreira de Siqueira, M., Grainger, A., Hannah, L., Hughes. L., Huntley, B., van Jaarsveld, A. S., Midgely, G. F., Miles, L., Ortega-Huerta, M. A., Peterson, A. T., Phillips, O. L. & Williams, S. E. (2004). Extinction risk from climate change. Nature 427, 145-148.
Tscharntke, T., Tylianakis, J.M., Rand, T.A., Didham, R.K., Fahrig, L., Batáry, P., Bengtsson, J., Clough, Y., Crist, T.O., Dormann, C.F., Ewers, R.M., Fründ, J., Holt, R.D., Holzschuh, A., Klein, A.M., Kleijn, D., Kremen, C., Landis, D.A., Laurance, W., Lindenmayer, D., Scherber, C., Sodhi, N., Steffan-Dewenter, I., Thies, C., van der Putten, W.H. & Westphal, C. (2012) Landscape moderation of biodiversity patterns and processes - eight hypotheses. Biological Reviews of the Cambridge Philosophical Society, 87, 661–685.
Wilcove, D.S., McLellan, C.H., Dobson, A.P., 1986. Habitat fragmentation in the temperate zone. In Conservation Biology, ed. ME Soulé, pp.237–56. Sunderland, MA: Sinauer.
Van der Werf, G. R., Morton, D. C., DeFries, R. S., Olivier, J. G., Kasibhatla, P. S., Jackson, R. B.,Collatz, G. J. & Randerson, J. T. (2009). CO2 emissions from forest loss. Nat. Geosci. 2, 737-738.
8
Venter, O., Laurance, W.F., Iwamura, T., Wilson, K. a, Fuller, R. a & Possingham, H.P. (2009) BREVIA Harnessing Carbon Payments to Protect Biodiversity. Science, 326, 2009–2009.
9
III. CAPÍTULO I
Effects of landscape configuration, composition and edges on
phylogenetic diversity of trees in a highly fragmented tropical forest
Fabio Antonio R. Matos1,2, Luiz Fernando S. Magnago3, Markus Gastauer1,
João M. B. Carreiras4, Marcelo Simonelli5, João Augusto A. Meira-Neto1*,
David P. Edwards2*
1Laboratory of Ecology and Evolution of Plants (LEEP), Departamento de
Biologia Vegetal, Universidade Federal de Viçosa, Minas Gerais, Brasil;
2Department of Animal and Plant Sciences, University of Sheffield, Sheffield, UK.
3Departamento de Biologia, Setor de Ecologia e Conservação, Universidade
Federal de Lavras (UFLA), Lavras, Brazil
4National Centre for Earth Observation (NCEO), University of Sheffield, UK.
5Instituto Federal do Espírito Santo, Vitória, Espírito Santo, Brasil,
* Corresponding authors. E-mail: [email protected]; [email protected]
** submitted to Journal of Ecology
10
Summary
1. Fragmentation of tropical forests is a major driver of the global extinction
crisis. A key question is understanding how fragmentation impacts
phylogenetic diversity, which summarises the total evolutionary history
shared across species within a community. Conserving phylogenetic
diversity decreases the potential of losing unique ecological and
phenotypic traits, and plays important roles in maintaining ecosystem
function and stability.
2. Our study was conducted in forest patches within the Brazilian Atlantic
forest, which is both highly fragmented and a global hotspot of threatened
biodiversity. We focus on trees to evaluate the impacts of landscape
configuration and landscape composition, as well as fragment size and
edge effects, on phylogenetic diversity.
3. We found that PD, a measure of phylogenetic richness, MPD, a measure
of the phylogenetic distance between individuals in a community in deep
evolutionary time, and MNTD, a measure of distance between individuals
in a community at the intra-familial and intra-generic level, were not
affected by landscape configuration. However, among the metrics of
landscape composition, PD was significantly and positively related to
increasing percentage of forest cover. Additionally, phylogenetic distance
between pairs of co-occurring individuals (SES.MPD) reduced with
fragment irregularity (i.e. more edge effected) and fragment density in the
landscape, indicating more phylogenetic clustering.
4. We also found a gradient of fragmentation impacts on PD, from small to
large fragments and edge versus interior habitats: with increasing
11
fragment size, we found a reduction of PD in interiors, but no change at
edges. Additionally, PD was higher in fragment interiors than at edges,
whereas SES.MNTD, which accounts for variation in species richness,
was lower in interiors than at edges, indicating phylogenetic
overdispersion in fragment interiors versus phylogenetic clustering at
edges.
5. Synthesis. Landscape composition and edge effects cause changes to the
evolutionary history within fragments, but fragmented landscapes still
retain high evolutionary history given the retention of phylogenetic diversity
across a range of landscape configurations. Protecting large patches and
those within landscapes that retain much forest cover, as well as extending
forest cover via forest restoration to enhance patch area, connectivity and
density, are key conservation goals.
Key-words: Habitat fragmentation, habitat loss, landscape structure,
phylogenetic structure, edge effect, tableland Atlantic rain forest
Tweetable Abstract: Tree evolutionary history is best saved in large,
connected forest patches in the threatened Brazilian Atlantic forest
12
Introduction
Human modification of tropical landscapes is one of the greatest threats
to global biodiversity (Morris 2010; Ellis et al. 2010; Lewis, Edwards & Galbraith
2015). Over 100 Mha of tropical forest was converted to farmland between 1980
and 2012 (Gibbs et al. 2010; Hansen et al. 2013), driving a dramatic loss of
species in cleared areas (Gibson et al. 2011). What remains is a landscape
dominated by fragmentation processes, with 25% of remaining rainforest in the
Amazon and Congo Basins and 91% in the Brazilian Atlantic forest within 1 km
of an edge (Haddad et al. 2015). Remaining tropical forests are increasingly
isolated, persist in increasingly smaller and more irregular patches, and have
greater edge effects (Fahrig 2003; Laurance et al. 2006; Arroyo-Rodríguez et al.
2013; Magnago et al. 2014).
Fragmentation drives both shifts in forest structure and biodiversity. There
is an increase in the abundance of trees with low wood density (Laurance et al.
2006) that drive a decay in functional diversity in just three decades since
isolation (Benchimol & Peres 2015), while edge effects that penetrate into the
forest, from wind to woody vines, increase tree mortality (Laurance et al. 2002).
Fragments thus have reduced carbon stocks compared to contiguous forest (Putz
et al. 2014; Berenguer et al. 2014), particularly at fragment edges (Magnago et
al. 2015a; Haddad et al. 2015). In turn, fragmentation drives the loss of species
richness and changes in species composition when compared to contiguous
habitat (Laurance et al. 2006; Laurance et al. 2007; Arroyo-Rodríguez et al. 2013;
Magnago et al. 2014), in smaller versus larger fragments (Laurance et al. 2011),
at edges versus interiors (Magnago et al. 2014), and in more isolated patches
(Fahrig 2003; Magnago et al. 2015b). These changes are typified by the
replacement of rare interior forest species with edge-tolerant generalist species
(Arroyo-Rodríguez et al. 2013; Carrara et al. 2015) and exotic species (Turner
1996).
While much of the knowledge of the effects of fragmentation on
biodiversity is based on species richness, abundance, and composition, it is also
important to understand the impacts of fragmentation on phylogenetic diversity—
the total evolutionary history shared across all species within a community
(Arroyo-Rodríguez et al. 2012; Winter, Devictor & Schweiger 2013; Cisneros,
13
Fagan & Willig 2015a; Frishkoff et al. 2014). Incorporating measures of
evolutionary distinctiveness into conservation planning can help us to preserve
as much of the tree of life as possible (Mace, Gittleman & Purvis 2003; Redding
& Mooers 2006; Isaac et al. 2007), while conserving phylogenetic diversity
decreases the chance of losing unique phenotypic and ecological traits (Jetz et
al. 2014), and provides benefits for ecosystem function and stability (Dinnage et
al. 2012; Cadotte 2013).
Reviewing the literature, we identified seven studies that used
phylogenetic metrics to evaluate the effects of forest fragmentation in tropical
communities (Table 1). Of these studies, two showed that forest fragments have
lower phylogenetic diversity than contiguous landscapes (Santos et al. 2014;
Munguía-Rosas et al. 2014). Four investigated the effect of fragment area and/or
amount of forest cover on phylogenetic diversity and phylogenetic structure with
conflicting findings: With declining fragment size or percentage forest, bats in
Caribbean lowlands, Costa Rica, lost phylogenetic diversity (Cisneros, Fagan &
Willig 2015a), trees in the Brazilian Atlantic both lost (Andrade et al. 2015) and
retained (Santos et al. 2010) phylogenetic diversity, and trees in Los Tuxtlas,
Mexico, retained phylogenetic diversity (Arroyo-Rodríguez et al. et al. 2012).
Finally, two studies investigated the impact of edges on tree phylogenetic
diversity, one revealing reductions at fragment edges (Santos et al. 2010), the
other no difference between edge and interior (Benitez-Malvido et al. 2014).
Beyond the impacts of fragment area and edge effects, the degree of
isolation from other fragments and fragment shape are also likely to determine
impacts on phylogenetic diversity. This is because the retention of species in
fragments is influenced by the level of isolation (Boscolo & Metzger 2011;
Magnago et al. 2015b) and the shape of fragments (Hill & Curran 2003).
However, we identified just one study that investigated the impacts of isolation
and fragment shape (Cisneros, Fagan & Willig 2015a). Cisneros, Fagan & Willig
(2015a) found that the phylogenetic diversity of bats increased as proximity
between forest patches and shape irregularity of patches decreased. A key
question therefore is how the phylogenetic diversity of tree communities is
affected by fragment isolation and shape.
Trees are critical for habitat structure (Boscolo & Metzger 2011; Pardini et
al. 2010; Magnago et al. 2014), carbon storage (Laurance 2004; Nascimento &
Laurance 2004; Magnago et al. 2015b), as well as their high diversity (Banks-
14
Leite et al. 2014). Given this and the importance of phylogenetic diversity for
conservation and ecosystem functioning, in this study we answer the fundamental
question of how configuration and composition metrics affect phylogenetic
diversity and structure of trees. We also investigate the impact of edge effects on
phylogenetic diversity and structure. We do so in the biodiversity hotspot of the
Brazilian Atlantic forest, where the landscape is largely fragmented (Haddad et
al. 2015) and around 300 tree species are found in just one hectare of forest
(Rolim & Chiarello 2004; Saiter et al. 2011), making it one of the biologically most
important biomes on Earth.
Materials and methods
Study sites
Our 220 km long study area was conducted in Espírito Santo (19°3'48.02"
S and 39°58'58.52" W) northwards to southern Bahia (17°43'29.30" S and
39°44'26.60" W), east Brazil (Fig. 1 and see Table S1 for details). Remaining
forests in the region are highly fragmented, situated in a matrix of cattle pastures,
and plantations of Eucalyptus spp., sugar cane, coffee, and papaya (Rolim et al.
2005). These forest areas are included in the Atlantic Forest domain (IBGE 1987;
also termed Tableland forest, Rizzini 1979), typified by large flat areas rising
slowly from 20 to 200 m a.s.l., and according to the Brazilian vegetation
classification are Lowland Rain Forest (IBGE 1987). The prevailing climate is wet
tropical (Köppen climate classification), with low rainfall from April to September
followed by high precipitation from October to March, and with minimal variation
in climate across sampling sites: precipitation ranges from 1,228 mm yr-1 in
Espírito Santo (Peixoto & Gentry 1990) to ~1,403 mm yr-1 in Bahia (Gouvêa
1969), with similar average temperatures in the dry season (Espírito Santo
~15.6°C; Bahia ~14°C) and the wet season (Espírito Santo ~27.4°C; Bahia
~23°C).
Historically, the studied landscape remained well preserved until the
1950’s. Thereafter, Espírito Santo and Bahia experienced rampant clearcut
logging and charcoal production, followed by agriculture (Garay & Rizzini 2004).
The main deforestation period in our study area was between 1950s and early
1970s (Simonelli 2007; Magnago et al. 2015b), with conversion of forests
primarily to sugar cane and cattle pastures. Because our fragments were 40 to
15
60 years old when sampled, extinction debts of some long-lived tree species are
likely still to be paid. However, tree species composition in the interior of smaller
fragment alters rapidly (most within the first 10 years since isolation) to reflect a
more disturbed community (Laurance et al. 1998; Laurance et al. 2002;
Laurance et al. 2006), indicating that our time since isolation is sufficient to detect
many important impacts of fragmentation.
Data collection
Fieldwork was conducted between January 2008 and July 2014 in 27
forest fragments that ranged in area from 13 to 23,480 ha (see Table S1 in the
Supplementary Methods). Within each fragment, we sampled one transect (except
for the second largest fragment of 17,716 ha in which we sampled two transects
separated by 4 km), positioned ≥200 m from the forest edge (28 transects in total;
see Fig. 1 and Table S1). Additionally, within 11 of these fragments again
spanning 13 to 23,480 ha, we sampled one transect (again, two transects
separated by 4 km were sampled in the 17,716 ha fragment) each positioned ~5
m from the forest edge and each paired with the plot sampled in the interior of
the same fragment (see Magnago et al. 2014 and Table S1). We thus have a
dataset of 28 interior transects, and 12 edge transects (paired with 12 of the 28
interior transects). On each transect, we sampled 10 plots of 10 m x 10 m (0.1
ha) located at 20 m intervals along each transect, totaling 400 plots (4 ha). We
only sampled primary forests, with no evidence of recent logging, although we
cannot rule out the occurrence of limited logging several decades ago.
Within each plot, we sampled all individuals living and rooted within our
plots with diameter at breast height (DBH; 1.30 metres above ground height) ≥4.8
cm. Individuals that were not identified at the site were collected and classified
into morphospecies, subsequently identified by morphological comparison in the
Herbarium of Vale (CVRD) or botanical experts for their families. The botanical
material collected in reproductive stage was deposited in the Herbarium of the
Federal University of Viçosa, Minas Gerais (VIC) and CVRD.
Data analysis
Metrics of fragmentation
16
We investigate both the configuration (i.e. geometric arrangement,
isolation and position of elements [fragments or matrix] within the landscape) and
composition (i.e. quality or quantity of elements [fragments or matrix] that
compose the landscape) of our focal forest fragments within the study area
(Cisneros, Fagan & Willig 2015a; Cisneros, Fagan & Willig 2015b). We identify
the configuration and composition characteristics of landscapes using the
vegetation map of the Brazilian Atlantic forest (reference year 2005;
www.sosma.org.br and www.inpe.br), developed by SOS Mata Atlântica/INPE
(2015). This dataset depicts the spatial distribution of the main forest formations
within this biome (see also Supplementary Methods, Text S1), and has been used
to describe landscape structure via forest loss and fragmentation (Ribeiro et al.
2009) and to generate estimates of carbon loss due to habitat fragmentation (Pütz
et al. 2014). We first divided our landscape into forest (i.e. only Tableland forest)
and non-forest (i.e. all other types of natural and non-natural formations). Second,
we created a buffer of 5 km around each of the 27 sampled fragments, due to the
high level of fragmentation and isolation within our landscapes (see Magnago et
al. 2014; Magnago et al. 2015 and Table S3). However, omission and
commission errors were detected after comparison with available very-high
optical spatial resolution satellite data from 2012 (World Imagery 2015b), these
were then manually corrected to obtain the most accurate spatial delineation of
the forest fragments within each 5 km buffer. All forest fragments were then
converted to raster format using the same spatial resolution (30 meters) used to
generate the vegetation map of this biome.
Fragmentation metrics were computed within the area defined by the 5 km
buffer around each forest fragment and using the implementation given in
FRAGSTATS (v 4.2; McGarigal et al. 2012; except ‘source distance’ see below).
Furthermore, all metrics were computed using the eight-cell neighbourhood rule
and considering a search radius of 5 km. For each fragment we measured five
metrics related to landscape configuration (see Table S2 in the supplementary
material for full details of each metric): (1) forest shape index - measures the level
of shape complexity on a per fragment basis. A low number, indicates fragments
are more regular and thus have less edge effects; (2) landscape shape index -
measures the degree of shape complexity of all fragments belonging to the same
class (forest) across a landscape. For a given forest area, a low number means
that fragments within a landscape are on average more regularly shaped and
17
thus have less edge effects; (3) forest nearest neighbour - gives the Euclidean
distance to the nearest neighbour forest patch. A low number suggests less
isolation; (4) mean forest nearest neighbour – gives the average value of the
forest nearest neighbour metric when considering all forest fragments within each
buffer; and (5) source distance – measures distance to the nearest forest patch
having an area of at least 1,000 ha, with a low number suggesting less isolation.
This metric was computed with ArcGis (v 10.1) using as a base the vegetation
map of Brazilian Atlantic forest (SOS Mata Atlântica/INPE (2015) (Table S2).
For each fragment, we additionally measured three metrics of landscape
composition again using the implementation given in FRAGSTATS (see Table S2
for full details of each metric): (6) forest patch size – measures the area of the
focal fragment; (7) forest cover – measures the percentage of the landscape
covered by forest, with a high number reflecting largest remaining forest cover;
and (8) forest patch density – measures the number of fragments in 100 hectares
within each landscape.
Phylogeny construction
For the preparation of our phylogenetic tree, we constructed a list of all our
family/genus/species according to APG III (2009). In the program Phylocom
version 4.2 (Webb et al. 2008), we then used the PHYLOMATIC function to return
the phylogenetic hypothesis for the relationship between our 72 families, 273
genera and 604 species sampled in 6,802 tree individuals, using the new
modified megatree R20120829mod.new for vascular plants from Gastauer &
Meira-Neto (in press). In our phylogenetic hypothesis more than two species per
family or more than two genera of an unresolved family in R20120829mod.new
were inserted as polytomies. Finally, to estimate the lengths of branches in
millions of years for our ultrametric phylogenetic tree, we used the file
"ages_exp", (Gastauer & Meira-Neto, in press) and the BLADJ algorithm in
Phylocom program version 4.2 (Webb et al. 2008, see Fig. S1).
Measures of phylogenetic diversity and structure
From our phylogenetic hypothesis we calculate six phylogenetic metrics
weighted by the abundance:
1) PD (phylogenetic diversity) - the sum of evolutionary history in a
community (Faith 1992). This metric is given in millions of years.
18
2) SES.PD (the standard effect size (SES) of PD) – PD is positively related
with species richness (Swenson 2014). Thus, SES.PD was calculated by
comparing observed PD with that of null communities of equal species
richness (Swenson 2014). Positive values of SES.PD indicate higher PD
than expected by chance for a given species richness, while negative
values indicate lower PD than expected by chance.
3) MPD (mean pairwise distance) – mean phylogenetic distance between all
combinations of pairs of individuals (given in millions of years; Webb et al.
2000). High values suggest greater evolutionary distance between pairs
of individuals sampled and negative values decrease this distance.
4) SES.MPD (the standard effect size (SES) of MPD) – MPD corrected for
species richness. Positive values indicate that the co-occurrence of pairs
of individuals which are phylogenetically close is greater than expected by
chance (phylogenetic clustering) and negative values that pairs co-
occuring individuals are phylogenetic more distant than expected by
chance (phylogenetic overdispersion) (Webb et al. 2000; Webb et al.
2002).
5) MNTD (mean nearest taxon distance) – mean phylogenetic distance
between an individual and the most closely related (non-conspecific)
individual (given in millions of years; Webb et al. 2000). Low levels suggest
that closely related pairs of individuals (non-conspecific) co-occur and high
values that they do not.
6) SES.MNTD (the standard effect size (SES) of MNTD) - MNTD corrected
for species richness. High values indicate the co-occurrence of individuals
more closely related than expected by chance given the species richness
(phylogenetic clustering) and negative values that the co-occurrence of
related individuals is lower than expected by chance (phylogenetic
overdispersion) (Webb et al. 2000; Webb et al. 2002).
We calculated these six metrics using “picante” package (Kembel et al.
2010) in R, version 3.2.1 (R Development Core Team. 2015). For the standard
effect size (SES) calculations, our tree was compared with 10,000 null model
randomizations using the algorithm "phylogeny pool", with the result for

19
SES.MPD and SES.MNTD multiplied by -1 (Swenson 2014). The applied null
model randomizes the identity of species occurring in each sample, however
maintains constant species richness and abundance within each transect. It
Assuming therefore, that all species are equally likely to occur in any fragment in
the landscape (Arroyo-Rodríguez et al. 2012).
Statistical analyses
We analysed the effects of landscape configuration and composition on
each phylogenetic metric using Generalized Linear Models, with Gaussian error
and an identity link (normality was tested and confirmed by the Shapiro Wilk test),
as implemented in the ‘glm’ function from stats package. For each metric of
phylogenetic diversity (PD, MPD and MNTD), phylogenetic structure (SES.PD,
SES.MPD and SES.MNTD) and species richness, we then used the "dredge"
function in the MuMIn package to find all possible combinations among our
landscape variables for the global model. The model with the lowest Akaike
Information Criterion of Second Order (∆AICc, indicated for small sample sizes)
was selected as the best model (Burnham et al. 2011). Log transformations were
used to reduce the variance heterogeneity for forest shape index, source distance
and forest patch size measurements. Lastly, given that predictor landscape
variables may have high multi-collinearity (Boscolo & Metzger 2011), we used the
variance inflation factor (VIF) to identify any correlated variables (i.e. VIF values
≥10); however, because VIF values ranged from 2.90 (i.e. forest patch size) to 10
(i.e. forest cover), we did not remove any variable.
Additionally, we investigated the impacts of fragment area and edge
effects on metrics of phylogenetic diversity, phylogenetic structure and species
richness. We considered two predictor variables: (i) fragment size in log scaled
and (ii) habitat type with two levels (edge and interior). We also consider the
possible interactions between these two predictor variables (see Magnago et al.
2014 for details). These analyzes were conducted using Generalized Linear
Mixed Model (GLMM), with site as a random variable (Bolker et al. 2009). The
GLMM was built using the function “lmer” in the package lme4, with Gaussian
error and an identity link. After creating each model, we applied the "dredge"
function in the package MuMIn and our best model was considered the one with
value of ∆AICc = 0. All statistical analyses were performed in R, version 3.2.1 (R
Development Core Team. 2015).
20
Results
We recorded 6,802 Individuals of 604 tree species, spanning 273 genera
and 72 families according to the classification of the Angiosperm Phylogeny
Group's III (2009) across our 28 interior transects and 12 edge transects.
Impacts of landscape configuration on phylogenetic diversity
Our fragments varied substantially in terms of their configuration, with
between a seven- and 13,000-fold variation in minimum and maximum values
(Table S3). However, none of our phylogenetic diversity metrics (i.e. PD; MPD
and MNTD) was affected by any characteristics of landscape configuration
according to our best models (in which ∆AICc=0; Tables 2 and S4).
For phylogenetic structure (i.e. SES.PD, SES.MPD and SES.MNTD), our
best models (Tables 2 and S4) showed that SES.MPD was negatively affected
by increasing landscape shape index (t = -2.553, P < 0.017, Fig. 2a), indicating
that increasing irregularity of landscapes leads to an increase in the co-
occurrence of pairs of individuals more distant phylogenetically (phylogenetic
overdispersion). In addition, our best models indicated a marginally significant
negative effect of forest shape index on SES.MPD (t = -1.721, P = 0.098, Fig.
2b).
In relation to species richness, no landscape configuration metric
significantly explained the number of species in fragments, according to our best
model (Tables 2 and S4). Finally, across all thirty-six selected models (∆AICc<2;
Table S4), landscape shape index and source distance (both seven times) were
the most frequently selected variables, with forest shape index and forest nearest
neighbour (both four times) the next most frequently selected variables.
Impacts of landscape composition on phylogenetic diversity
Our fragments varied substantially in terms of their composition, with
between a five- and 1,800-fold variation in minimum and maximum values (Table
S3). Considering only the best model (Tables 2 and S4), phylogenetic diversity
(PD) was positively related to forest cover (t = 4.394, P < 0.0001, Fig. 3a),
indicating that landscapes with higher forest cover retain a larger amount of
evolutionary history in their remaining forests. We also found that with increasing
21
forest patch density there was a marginally significant decrease of MPD (t = -
1.719, P = 0.097, Fig. 3b).
Considering our best models of phylogenetic structure (Tables 2 and S4),
we found a positive effect of increasing forest patch density on SES.MPD (t =
3.391, P < 0.0002, Fig. 3c), indicating that co-occurring individuals are more
closely related than expected by chance (phylogenetic clustering). In contrast, we
found a marginally significant negative effect of forest cover on SES.MNTD (t = -
1.793, P = 0.084, Fig. 3d).
In terms of species richness, our best models (Tables 2 and S4) indicate
a positive effect of forest cover (t = 4.436, P < 0.0001, Fig. S2). In addition, we
found a positive and marginally significant effect of forest patch density of
landscapes on species richness (t = 1.823, P = 0.081). Lastly, across all thirty-six
selected models (∆AICc<2; Table S4), forest patch density (15 times) and forest
cover (11 times) were frequently selected, whereas forest patch size was only
selected twice. Thus, metrics of phylogenetic diversity are most frequently
impacted by forest cover and forest patch density.
Impacts of fragment size and edge-effects on phylogenetic diversity
Considering our best model (Tables 3 and S5), phylogenetic diversity (PD)
was significantly affected by the interaction between fragment size and interior
versus edge of the fragments (t = -3.470, P < 0.004, Fig. 4a): with increasing
fragment size, we found a reduction of PD in interiors (F = 6.685, P < 0.027, Fig.
4a), but no significant change of PD at edges (F = 2.530, P = 0.142, Fig. 4a). PD
was significantly greater in fragment interiors than fragment edges (t = 3.773, P
< 0.002, Fig. 4b).
In terms of phylogenetic structure, our landscapes were little affected by
habitat type and were not affected by fragment size (Tables 3 and S5).
SES.MNTD was lower in interior than in edge locations (t = -2.672, P < 0.020,
Fig. 4c), indicating phylogenetic overdispersion inside fragment versus
phylogenetic clustering at edges.
In addition, we found that species richness was significantly affected by
the interaction between the size of the fragments and interior versus edge of the
sampled transects (t = 1.842, P < 0.010, Fig. S3a): with increasing fragment size,
there was a reduction in species richness in interiors (F = 7.420, P < 0.021, Fig.

22
S3a), but no significant change at edges (F = 1.852, P = 0.203, Fig. S3a). Species
richness was significantly higher in fragment interiors than in fragment edges (t =
3.045, P < 0.005; Fig. S3b).
Finally, across all seventeen selected models (∆AICc<2; Table S5), only
habitat (edge vs interior) was frequently selected (10 times), with forest fragment
size (5 times) the next most frequently selected. The interaction between
fragment size and habitat type (edge vs interior; three times) was rarely selected.
Discussion Forest fragmentation is a major driver of the global extinction crisis
(Haddad et al. 2015; Lewis, Edwards & Galbraith 2015). A key question is how
the degree of isolation and shape of forest fragments impacts phylogenetic
diversity. Saving phylogenetic diversity prevents the loss of evolutionarily unique
species (Purvis et al. 2000; Vamosi et al. 2008), conserves as much of the tree
of life as possible (Mace, Gittleman & Purvis 2003; Redding & Mooers 2006;
Isaac et al. 2007) and underpins the retention of key ecosystem services and
functions (Cadotte, Cardinale & Oakley 2008; Cadotte 2013). Focusing on trees
communities within the globally threatened Brazilian Atlantic forest, we find that
with increasing forest cover there was higher retention of phylogenetic diversity
and that with more irregular fragments (i.e. more edge effected) and with
increased density of fragments in the landscape was a reduction in the
phylogenetic distance between pairs of co-occurring individuals (SES.MPD, more
clustering). Fragmentation can thus lead to profound changes in the evolutionary
history stored in these remaining fragments (Santos et al. 2014; Munguía-Rosas
et al. 2014). There was, however, no significant impact of the configuration
characteristics of fragments and landscapes (i.e. shape and isolation) on
phylogenetic diversity (PD, MPD and MNTD), suggesting that fragments
remaining in these landscapes still retain important regional tree evolutionary
history, as well as important ecosystem functions (Magnago et al. 2014; Magnago
et al. 2015b).
Impacts of landscape configuration on phylogenetic diversity
That no phylogenetic diversity metric was affected by the configuration of
landscape features suggests that recently fragmented landscapes (i.e. <100
years) have not led to profound changes in the phylogenetic diversity. These new
23
findings indicate the possibility that landscape configuration has not promoted
profound changes in productivity of trees (Cadotte et al. 2013) and ecosystem
stability (Cadotte, Dinnage & Tilman 2012). However, landscape configuration
affected the phylogenetic diversity of bats in Costa Rica, with decreased
phylogenetic diversity with increased isolation (Cisneros, Fagan & Willig 2015a).
Presumably bats have more rapid relaxation following fragmentation than do
trees, and consequently, while phylogenetic diversity of trees is presently retained
even in isolated and edge dominated fragments, over centennial timescales, this
could slowly degrade if isolation is not reversed.
Phylogenetic structure within fragments was affected by landscape
configuration, with higher landscape shape index (more edge effects) causing
individuals of co-occurring species to be more distantly related than expected by
chance (i.e. SES.MPD<0; Fig. 2a). Firstly, increasing complexity of landscape
form could filter individuals of tree species from across the entire phylogenetic
tree, but not whole clades (Arroyo-Rodríguez et al. 2012). Secondly, more edge
effects could facilitate the spill-over of individuals of species from fragment edges
(Hill & Curran 2003) and the non-forest matrix (Cook et al. 2002; Cisneros, Fagan
& Willig 2015a), which in many cases are likely to have evolved from different
lineages than forest interior trees. Both possibilities are supported by the fact that
with increasing complexity of the landscape, the remaining forests are more
susceptible to the impacts of edge effects (Ranta et al. 1998; Hill & Curran 2003;
Ewers & Didham 2006).
Impacts of landscape composition on phylogenetic diversity
Phylogenetic diversity (PD) was higher in landscapes with more forest
cover (Fig. 3a), but this might be partially explained by increases in species
richness (see Table 2 and Figure S2; Faith 1992; Swenson 2014). However, the
loss of evolutionary history to reduced forest cover in the threatened Brazilian
Atlantic forest is also supported by the fact that MPD of species in the Rubiaceae
increases with more forest cover (Andrade et al. 2015; but see Arroyo-Rodríguez
et al. 2012), and more generally, that increasing habitat loss drives profound
changes in species composition, functional groups and carbon storage (Laurance
et al. 2006; Tabarelli et al. 2010; Magnago et al. 2014; Magnago et al. 2015b).
24
Phylogenetic structure within fragments was also affected by landscape
composition, with lower forest patch density (more isolation and edge effects;
Fahrig 2003) causing individuals of co-occurring species to be more
phylogenetically dispersed (i.e. SES.MPD<0; Fig. 3c). As with the impacts of
higher edge effects on SES.MPD (Fig. 2a), it seems likely that more disturbance
filters individuals of tree species from across the entire phylogenetic tree, but not
whole clades (Arroyo-Rodríguez et al. 2012), and that phylogenetically unique
species (versus those from forest interiors) colonize from fragment edges (Hill &
Curran 2003) and the non-forest matrix (Cook et al. 2002; Cisneros, Fagan &
Willig 2015a). Additionally, increased isolation also limits the dispersion of seed
between remaining forests, decreasing similarity in species composition between
isolated forest patches (Hubbell 2001; Chave 2008; Duque et al. 2009), and
possibly leading to lower similarity of evolutionary characteristics between
species.
Impacts of fragment size and edge-effects on phylogenetic diversity
PD was higher in the interior of smaller fragments than in the interior of
large fragments (Fig. 4a), whereas other studies either found no impact of area
on phylogenetic diversity for trees (Santos et al. 2010; Arroyo-Rodríguez et al.
2012) or higher phylogenetic diversity of bats in larger fragments (Cisneros,
Fagan & Willig 2015a). While we sampled higher species richness in the interiors
of small than of large fragments (see Table 3; Fig. S3a and Magnago et al. 2014),
differences are also likely to reflect changes in the evolutionary history of species
presents, which exhibit lower functional redundancy, more disturbance-adapted
species, and low prevalence of zoochoric fruit, fleshy fruit and medium seeds
(Magnago et al. 2014).
We found lower PD at edges than interiors (Fig. 4b; Santos et al. 2010, but
see Benítez-Malvido et al. 2014). In our fragments, edge effects change
microclimatic conditions (Magnago et al. 2015a), reduce species richness (see
Fig. S3b; see also Laurance et al. 2006) and alter functionality (Magnago et al.
2014). Thus while reductions in species richness again likely part explain the loss
of PD, reductions are also underpinned by other ecological factors.
Lastly, we found higher SES.MNTD at edges than interiors (Fig. 4c),
indicating that the evolutionary distance between species pairs of individuals
25
within family or genera is less than expected by chance. Because edge effects
reduce community dissimilarity (Laurance et al. 2006) and important functional
groups (Lopes et al. 2009; Magnago et al. 2014), the next individual sampled is
likely a close relative of at least one kind of individual already sampled. However,
recent work in the Brazilian Atlantic forest (Santos et al. 2010) and Mexican dry
forest (Benítez-Malvido et al. 2014) found no impact of edge effects on the
phylogenetic structure of tree, suggesting that they were predominantly
assembled by stochastic processes (Hubbell 2001).
Conclusions and conservation implications Tropical forests are suffering dramatic levels of deforestation (Gibbs et al.
2010; Hansen et al. 2013) and fragmentation (Haddard et al. 2015), with
landscape features such as shape, isolation, and density of fragments limiting
ecological processes and change the evolutionary characteristics of communities
(Laurance et al. 2002; Fahrig 2003; Laurance et al. 2006; Ewers & Didham 2006;
Haddad et al. 2015). However, these features did not affect the phylogenetic
diversity of trees, while reduced forest cover has led to loss of evolutionary
history. On the one hand, this underscores the importance of protecting large
forest blocks and/or many fragments in a landscape that retains much forest
cover (Pardini et al. 2010; Gibson et al. 2011; Arroyo-Rodríguez et al. 2012). On
the other hand, this suggests that where the vast majority of forest cover has
been lost there is limited benefit of protecting the few remaining patches for
retention of phylogenetic diversity and potentially that dispersal (rescue effects)
is limited in such highly fragmented landscapes. These results suggest that
conservation must seek to extend forest cover via forest restoration to enhance
patch area, patch connectivity and/or patch density in highly threatened regions,
such as the Brazilian Atlantic and Tropical Andes.
From a conservation perspective, it is encouraging that phylogenetic
structure (SES.MPD) was positively affected by increasing fragmentation effects.
When compared to fragments in a more natural state (i.e., larger blocks, less
isolated, lower edge effects), edge effected and/or isolated fragments are able to
retain a range of evolutionary histories resulting in phylogenetic overdispersion.
Future studies should investigate the quality of these changes in light of resource
availability for fauna (Magnago et al. 2014), the matrices in which the remnants
26
are immersed (Cisneros, Fagan & Willig 2015a), and how phylogenetic structure
changes following forest restoration.
Finally, our results underscore the potential conservation value of small
fragments (especially within landscapes that retain much forest cover), which
harboured more phylogenetic diversity in their interiors than did the interiors of
larger patches. Such fragments could represent important sources of seeds of
evolutionarily distinct species for restoration projects, as well as stepping-stones
for dispersal between larger, viable patches.
Acknowledgements We are grateful to CAPES a scholarship awarded to FARM (processo número
99999.006537/2014-06). We are grateful to Reserva Natural Vale, Reserva
Biológica de Sooretama, Reserva Biológica Córrego do Veado, Flona do Rio
Preto, as well as IBAMA the work permit granted in federal conservation units
(license number 42532). We thank FAPEMIG, SECTES-MG, MCTI and CNPq for
financial support. Fibria S.A, ArcelorMittal BioFlorestas and Suzano Papel e
Ceculose S.A for for financial and logistical support. Finally, the people who made
this work possible in the field: Mariana F. Rocha, Thiago S. Coser, Domingos
Folli, Glaucia S. Tolentino, Carolina Nunes, and Geanna Correia. JAAMN holds
a CNPq productivity fellowship (301913/2012-9).
References Angisosperm Phylogeny Group, APG (2009) An update of the Angiosperm
Phylogeny Group classification for the orders and families of flowering plantas: APG III. Botanical Journal of the Lennean Society, 161, 105–121.
Andrade, E.R., Jardim, J.G., Santos, B.A., Melo, F.P.L., Talora, D.C., Faria, D. & Cazetta, E. (2015) Effects of habitat loss on taxonomic and phylogenetic diversity of understory Rubiaceae in Atlantic forest landscapes. Forest
Ecology and Management, 349, 73–84.
Arroyo-Rodríguez, V., Cavender-Bares, J., Escobar, F., Melo, F.P.L., Tabarelli, M. & Santos, B.A. (2012) Maintenance of tree phylogenetic diversity in a highly fragmented rain forest. Journal of Ecology, 100, 702–711.
Arroyo-Rodríguez, V., Rös, M., Escobar, F., Melo, F.P.L., Santos, B.A., Tabarelli, M. & Chazdon, R. (2013) Plant β-diversity in fragmented rain forests: testing floristic homogenization and differentiation hypotheses. Journal of Ecology, 101, 1449–1458.
27
Banks-Leite, C., Pardini, R., Tambosi, L.R., Pearse, W.D., Bueno, A.A., Bruscagin, R.T., Condez, T.H., Dixo, M., Igari, A.T., Martensen, A.C. & Metzger, J.P. (2014) Using ecological thresholds to evaluate the costs and benefits of set-asides in a biodiversity hotspot. Science, 345, 1041–1045.
Benchimol, M. & Peres, C.A. (2015) Edge-mediated compositional and functional decay of tree assemblages in Amazonian forest islands after 26 years of isolation. Journal of Ecology, 103, 408–420.
Benitez-Malvido, J., Gallardo-Vasquez, J.C., Alvarez-Anorve, M.Y. & Avila-Cabadilla, L.D. (2014) Influence of matrix type on tree community assemblages along tropical dry forest edges. American Journal of Botany, 101, 820–829.
Berenguer, E., Ferreira, J., Gardner, T.A., Aragão, L.E.O.C., De Camargo, P.B., Cerri, C.E., Durigan, M., Oliveira, R.C. De, Vieira, I.C.G. & Barlow, J. (2014) A large-scale field assessment of carbon stocks in human-modified tropical forests. Global Change Biology, 2005, 3713–3726.
Boscolo, D. & Paul Metzger, J. (2011) Isolation determines patterns of species presence in highly fragmented landscapes. Ecography, 34, 1018–1029.
Bolker, B.M., Brooks, M.E., Clark, C.J., Geange, S.W., Poulsen, J.R., Stevens, M.H.H. & White, J.-S.S. (2009) Generalized linear mixed models: a practical guide for ecology and evolution. Trends in Ecology & Evolution, 24, 127–135.
Burnham, K.P., Anderson, D.R. & Huyvaert, K.P. (2011) AIC model selection and multimodel inference in behavioral ecology: some background, observations, and comparisons. Behavioral Ecology and Sociobiology, 65, 23–35.
Cadotte, M.W., Cardinale, B.J. & Oakley, T.H. (2008) Evolutionary history and the effect of biodiversity on plant productivity. Proceedings of the National
Academy of Sciences of the United States of America, 105, 17012–17017.
Cadotte, M.W., Dinnage, R. & Tilman, D. (2012) Phylogenetic diversity promotes
ecosystem stability. Ecology, 93, S223–S233.
Cadotte, M.W. (2013) Experimental evidence that evolutionarily diverse assemblages result in higher productivity. Proceedings of the National
Academy of Sciences, 110, 8996–9000.
Chave, J. (2008) Spatial variation in tree species composition across tropical forest. Tropical Forest Community Ecology (eds W.P. Carson & S.A.
Schnitzer), pp. 11–30. Blackwell Scientific, Oxford, UK.
Carrara, E., Arroyo-Rodríguez, V., Vega-Rivera, J.H., Schondube, J.E., de Freitas, S.M. & Fahrig, L. (2015) Impact of landscape composition and configuration on forest specialist and generalist bird species in the fragmented Lacandona rainforest, Mexico. Biological Conservation, 184,
28
117–126.
Cisneros, L.M., Fagan, M.E. & Willig, M.R. (2015a) Effects of human-modified landscapes on taxonomic, functional and phylogenetic dimensions of bat biodiversity. Diversity and Distributions, 21, 523–533.
Cisneros, L.M., Fagan, M.E. & Willig, M.R. (2015b) Season-specific and guild-specific effects of anthropogenic landscape modification on metacommunity structure of tropical bats. Journal of Animal Ecology, 84, 373–385.
Cook, W.M., Lane, K.T., Foster, B.L. & Holt, R.D. (2002) Island theory, matrix effects and species richness patterns in habitat fragments. Ecology Letters, 5, 619–623.
Dinnage, R., Cadotte, M.W., Haddad, N.M., Crutsinger, G.M. & Tilman, D. (2012) Diversity of plant evolutionary lineages promotes arthropod diversity. Ecology Letters, 15, 1308–1317.
Duque, Á., Phillips, J.F., Von Hildebrand, P., Posada, C.A., Prieto, A., Rudas, A., Suescún, M. & Stevenson, P. (2009) Distance decay of tree species similarity in protected areas on terra firme forests in Colombian Amazonia. Biotropica, 41, 599–607.
Ellis, E.C., Klein Goldewijk, K., Siebert, S., Lightman, D. & Ramankutty, N. (2010) Anthropogenic transformation of the biomes, 1700 to 2000. Global Ecology
and Biogeography, 19, 589-606.
Ewers, R.M. & Didham, R.K. (2006) Confounding factors in the detection of species responses to habitat fragmentation. Biological reviews of the
Cambridge Philosophical Society, 81, 117–42.
Faith, D.P. (1992) Conservation evaluation and phylogenetic diversity. Biological
Conservation, 61, 1–10.
Frishkoff, L.O., Karp, D.S., M’Gonigle, L.K., Mendenhall, C.D., Zook, J., Kremen, C., Hadly, E.A. & Daily, G.C. (2014) Loss of avian phylogenetic diversity in neotropical agricultural systems. Science, 345, 1343–1346.
Fahrig, L. (2003) Effects of Habitat Fragmentation on Biodiversity. Review
Literature And Arts Of The Americas, 34, 487–515.
Gastauer, M. & Meira-Neto, J. A. A. (in press) An enhanced calibration of a recently released megatree for the analysis of phylogenetic diversity.
Brazilian Journal of Biology
Garay, I. & Rizzini G.M. (2004) A Floresta Atlântica de Tabuleiros: Diversidade
Funcional da Cobertura Arbórea. Petrópolis, Rio de Janeiro, 255 p.
Gibbs, H.K., Ruesch, A.S., Achard, F., Clayton, M.K., Holmgren, P., Ramankutty, N. & Foley, J.A. (2010) Tropical forests were the primary sources of new agricultural land in the 1980s and 1990s. Proceedings of the National
29
Academy of Sciences, 107, 16732–16737.
Gibson, L., Lee, T.M., Koh, L.P., Brook, B.W., Gardner, T.A., Barlow, J., Peres, C.A., Bradshaw, C.J.A., Laurance, W.F., Lovejoy, T.E. & Sodhi, N.S. (2011) Primary forests are irreplaceable for sustaining tropical biodiversity. Nature,
478, 378–381.
Gouvêa, J.B.S. (1969) Contribuição à geomorfologia do sul da Bahia. Área dos baixos cursos dos rios Pardo e Jequitinhonha. Comunicação Técnica do Cenntro de Pesquisas do CACAU/Comissão Executiva de Planejamento da
Lavoura Cacaueira, Itabuna, 35, 111 p.
Haddad, N.M., Brudvig, L.A., Clobert, J., Davies, K.F., Gonzalez, A., Holt, R.D., Lovejoy, T.E., Sexton, J.O., Austin, M.P., Collins, C.D., Cook, W.M., Damschen, E.I., Ewers, R.M., Foster, B.L., Jenkins, C.N., King, A.J., Laurance, W.F., Levey, D.J., Margules, C.R., Melbourne, B.A., Nicholls, A.O., Orrock, J.L., Song, D.-X. & Townshend, J.R. (2015) Habitat fragmentation and its lasting impact on Earth’s ecosystems. Science
Advances, 1, 1-9.
Hansen, M.C., Potapov, P. V, Moore, R., Hancher, M., Turubanova, S. a, Tyukavina, a, Thau, D., Stehman, S. V, Goetz, S.J., Loveland, T.R., Kommareddy, a, Egorov, a, Chini, L., Justice, C.O. & Townshend, J.R.G. (2013) High-resolution global maps of 21st-century forest cover change. Science (New York, N.Y.), 342, 850–3.
Hill, J.L. & Curran, P.J. (2003) Area, shape and isolation of tropical forest fragments : effects on tree species diversity and implications for conservation. 30 , 1391–1403.
Hubbell, S. (2001) The unified neutral theoryy of biodiversity and biogeography.
Princeton University Press, Princeton, New Jersey, USA, 375 p.
Isaac, N.J.B., Turvey, S.T., Collen, B., Waterman, C. & Baillie, J.E.M. (2007) Mammals on the EDGE: Conservation Priorities Based on Threat and Phylogeny. PLoS ONE, 2, e296.
IBGE (Fundação Instituto Brasileiro de Geografia e Estatística). (1987) Rio Doce: geologia, geomorfologia, pedologia, vegetação e uso potencial da terra.
Projeto Radambrasil, Volume SF.34, Rio de Janeiro.
Jetz, W., Thomas, G.H., Joy, J.B., Redding, D.W., Hartmann, K. & Mooers, A.O. (2014) Global Distribution and Conservation of Evolutionary Distinctness in Birds. Current Biology, 24, 919–930.
Kembel, S.W., Cowan, P.D., Helmus, M.R., Cornwell, W.K., Morlon, H., Ackerly, D.D., Blomberg, S.P. & Webb, C.O. (2010) Picante: R tools for integrating phylogenies and ecology. Bioinformatics, 26, 1463–1464.
Laurance, W.F., Laurance, S.G., & Delamonica, P. (1998) Tropical forest
30
fragmentation and greenhouse fas emission. Forest Ecology and
Management, 110, 173–180.
Laurance, W.F., Lovejoy, T.E., Vasconcelos, H.L., Bruna, E.M., Didham, R.K., Stouffer, P.C., Gascon, C., Bierregaard, R.O., Laurance, S.G. & Sampaio,
E. (2002) Ecosystem decay of Amazonian forest fragments: A 22-year investigation. Conservation Biology, 16, 605–618.
Laurance, W.F. (2004) Forest-climate interactions in fragmented tropical landscapes. Philosophical Transactions of the Royal Society B: Biological
Sciences, 359, 345–352.
Laurance, W.F., Nascimento, H.E.M., Laurance, S.G., Andrade, A., Ribeiro, J.E.L.S., Giraldo, J.P., Lovejoy, T.E., Condit, R., Chave, J., Harms, K.E. & D’Angelo, S. (2006) Rapid decay of tree-community composition in Amazonian forest fragments. Proceedings of the National Academy of
Sciences of the United States of America, 103, 19010–19014.
Laurance, W.F., Nascimento, H.E.M., Laurance, S.G., Andrade, A., Ewers, R.M., Harms, K.E., Luizão, R.C.C. & Ribeiro, J.E. (2007) Habitat fragmentation, variable edge effects, and the landscape-divergence hypothesis. PloS one, 2, e1017.
Laurance, W.F., Camargo, J.L.C., Luizão, R.C.C., Laurance, S.G., Pimm, S.L., Bruna, E.M., Stouffer, P.C., Bruce Williamson, G., Benítez-Malvido, J. & Vasconcelos, H.L. (2011) The fate of Amazonian forest fragments: A 32-year investigation. Biological Conservation, 144, 56–67.
Lewis, S.L., Edwards, D.P. & Galbraith, D. (2015) Increasing human dominance of tropical forests. Science, 349, 827-832.
Lopes, A.V., Girão, L.C., Santos, B.A., Peres, C.A. & Tabarelli, M. (2009) Long-term erosion of tree reproductive trait diversity in edge-dominated Atlantic forest fragments. Biological Conservation, 142, 1154–1165.
Mace, G.M., Gittleman, J.L & Purvis, A. (2003) Preserving the Tree of Life.
Science, 300, 1707–1709.
McGarial, K., Cushman, S. A. & Ene, E. (2012) FRAGSTATS v4: spatial pattern analysis program for categorical and continuous maps. University of Massachusetts, Amherst, MA, USA. Available at: USA. Available at:
http://www.umass.edu/landeco/research/fragstats/fragstats.html.
Magnago, L.F.S., Edwards, D.P., Edwards, F.A., Magrach, A., Martins, S. V. & Laurance, W.F. (2014) Functional attributes change but functional richness is unchanged after fragmentation of Brazilian Atlantic forests. Journal of
Ecology, 102, 475–485.
Magnago, L.F.S., Rocha, M.F., Meyer, L., Martins, S.V. & Meira-Neto, J.A.A. (2015a) Microclimatic conditions at forest edges have significant impacts on
31
vegetation structure in large Atlantic forest fragments. Biodiversity and
Conservation, 24, 2305–2318.
Magnago, L.F.S., Magrach, A., Laurance, W.F., Martins, S. V., Meira-Neto, J.A. a., Simonelli, M. & Edwards, D.P. (2015b) Would protecting tropical forest
fragments provide carbon and biodiversity co-benefits under redd+? Global
Change Biology, 21, 3455–3468.
Morris, R.J. (2010) Anthropogenic impacts on tropical forest biodiversity: a network structure and ecosystem functioning perspective. Philosophical
Transactions of the Royal Society B: Biological Sciences, 365, 3709–3718.
Munguía-Rosas, M.A., Jurado-Dzib, S.G., Mezeta-Cob, C.R., Montiel, S., Rojas, A. & Pech-Canché, J.M. (2014) Continuous forest has greater taxonomic, functional and phylogenetic plant diversity than an adjacent naturally fragmented forest. Journal of Tropical Ecology, 30, 323–333.
Nascimento, H.E.M. & Laurance, W.F. (2004) Biomass Dynamics in Amazonian Forest Fragments. Ecological Applications, 14, 127–138.
Pardini, R., Bueno, A.D.A., Gardner, T. a, Prado, P.I. & Metzger, J.P. (2010) Beyond the fragmentation threshold hypothesis: regime shifts in biodiversity across fragmented landscapes. PloS one, 5, e1366.
Peixoto, A. L. & Gentry, A. (1990) Diversidade e composição florística da mata de tabuleiro na Reserva Florestal de Linhares (Espírito Santo, Brasil). Revista Brasileira de Botânica, 13, 19-25.
Purvis, A., Agapow, P.-M., Gittleman, J.L. & Mace, G.M. (2000) Nonrandom Extinction and the Loss of Evolutionary History. Science, 288, 328–330.
Pütz, S., Groeneveld, J., Henle, K., Knogge, C., Martensen, A.C., Metz, M., Metzger, J.P., Ribeiro, M.C., de Paula, M.D. & Huth, A. (2014) Long-term carbon loss in fragmented Neotropical forests. Nature Communications, 5,
5037.
Ranta, P. & Blom, T.O.M. (1998) The fragmented Atlantic rain forest of Brazil : size , shape and distribution of forest fragments. Biodiversity & Conservation, 7, 385–403.
R Development Core Team (2015) R: A language and Environment for Statistical
Computing. R Foundation for Statistical Computing, Vienna, Austria.
Redding, D.W. & Mooers, A.Ø. (2006) Incorporating Evolutionary Measures into Conservation Prioritization. Conservation Biology, 20, 1670–1678.
Ribeiro, M.C., Metzger, J.P., Martensen, A.C., Ponzoni, F.J. & Hirota, M.M. (2009) The Brazilian Atlantic Forest: How much is left, and how is the remaining forest distributed? Implications for conservation. Biological
Conservation, 142, 1141–1153.
32
Rolim, S.G. & Chiarello, A.G. (2004) Slow death of Atlantic forest trees in cocoa agroforestry in southeastern Brazil. Biodiversity and Conservation, 13,
2679–2694.
Rolim, S.G., Jesus, R.M., Nascimento, H.E.M., do Couto, H.T.Z. & Chambers,
J.Q. (2005) Biomass change in an Atlantic tropical moist forest: the ENSO effect in permanent sample plots over a 22-year period. Oecologia, 142,
238–246.
Rizzini, C.T. (1979). Tratado de fitogeografia do Brasil: aspectos sociológicos e
florísticos. Universidade de São Paulo, 373 p.
Saiter, F.Z., Guilherme, F.A.G., Thomaz, L.D. & Wendt, T. (2011) Tree changes in a mature rainforest with high diversity and endemism on the Brazilian coast. Biodiversity and Conservation, 20, 1921–1949.
Santos, B.A., Tabarelli, M., Melo, F.P.L., Camargo, J.L.C., Andrade, A., Laurance, S.G. & Laurance, W.F. (2014) Phylogenetic Impoverishment of Amazonian Tree Communities in an Experimentally Fragmented Forest Landscape. PLoS ONE, 9, e113109.
Santos, B.A., Arroyo-Rodríguez, V., Moreno, C.E. & Tabarelli, M. (2010) Edge-Related Loss of Tree Phylogenetic Diversity in the Severely Fragmented Brazilian Atlantic Forest. PLoS ONE, 5, e12625.
Simonelli, M. (2007) Diversidade e Conservação das Florestas de Tabuleiros no Espírito Santo. In: Ecossistemas Costeiros do Espírito Santo: Conservação e Restauração (eds Orgs Menezes LFT, Pires FR, Pereira OJ), pp.21.-32,
EDUFES, Vitória, ES.
SOS Mata Altântica & Instituto Nacional de Pesquisas Espaciais (2015). Altas dos Remanescentes Florestais e Ecossistemas Associados no Domínio da
Mata Altântica, São Paulo, SP, 60 p.
Swenson, N.G. (2014) Functional and Phylogenetic Ecology in R. Springer
UserR!-Springer.
Tabarelli, M., Aguiar, A. V., Girão, L.C., Peres, C.A. & Lopes, A. V. (2010) Effects of Pioneer Tree Species Hyperabundance on Forest Fragments in Northeastern Brazil. Conservation Biology, 24, 1654–1663.
Turner, I.M. (1996) Species loss in fragments of tropical rain forest: a review of the evidence. Journal of Applied Ecology, 33, 200–209.
Vamosi, J.C. & Wilson J.R.U. (2008) Nonrandom extinction leads to elevated loss of angiosperm evolutionary history. Ecology Letters, 11, 1047–1053.
Winter, M., Devictor, V. & Schweiger, O. (2013) Phylogenetic diversity and nature conservation: where are we? Trends Ecol Evol, 28, 199–204.
Webb, C.O., Ackerly, D.D. & Kembel, S.W. (2008) Phylocom: software for the
33
analysis of phylogenetic community structure and trait evolution. Bioinformatics, 24, 2098–2100.
Webb, C.O. (2000) Exploring the Phylogenetic Structure of Ecological Communities: An Example for Rain Forest Trees. The American Naturalist,
156, 145–155.
Webb, C.O., Ackerly, D.D., McPeek, M. a. & Donoghue, M.J. (2002) Phylogenies and Community Ecology. Annual Review of Ecology and Systematics, 33,
475–505.

34
Tables Table 1 - Studies investigating the phylogenetic diversity and phylogenetic structure in the tropics through fragmentation effects.
Phylogenetic metric abbreviations: MPD, mean phylogenetic distance; MNTD, mean nearest taxon phylogenetic distance; NRI,
net related index; NTI, nearest taxon index; Rao`s Q, Rao’s quadratic entropy; PSV, phylogenetic species variability metric;
PSE, phylogenetic species evenness metric; PS, phylogenetic structure of PSV and PSE.
Taxon Geographic region Fragmentation metric (s) Phylogenetic metric (s)
Study
Trees Brazilian Atlantic forest Area, edge MPD, MNTD, NRI, NTI
Santos et al., 2010
Trees Mexico - Los Tuxtlas Area, % cover MPD, MNTD, NRI, NTI
Arroyo-Rodríguez et al., 2012
Trees Brazilian Amazon forest Contiguous vs. fragmented forest MPD, NRI Santos et al., 2014
Bats Costa Rica - Caribbean lowlands
Area, edge, % cover, isolation, shape, matrix type
Rao’s Q Cisneros, Fagan & Willig, 2014
Trees Mexico - Yucatan Peninsula
Contiguous vs. fragmented forest MPD, MNTD, NRI, NTI
Munguía-Rosas et al., 2014
Trees Mexico - western coast of Jalisco Edge, matrix type PSV, PSE, PS
Benítez-Malvido et al., 2014
Trees Brazilian Atlantic forest % cover MPD, MNTD, NRI, NTI
Andrade et al., 2015
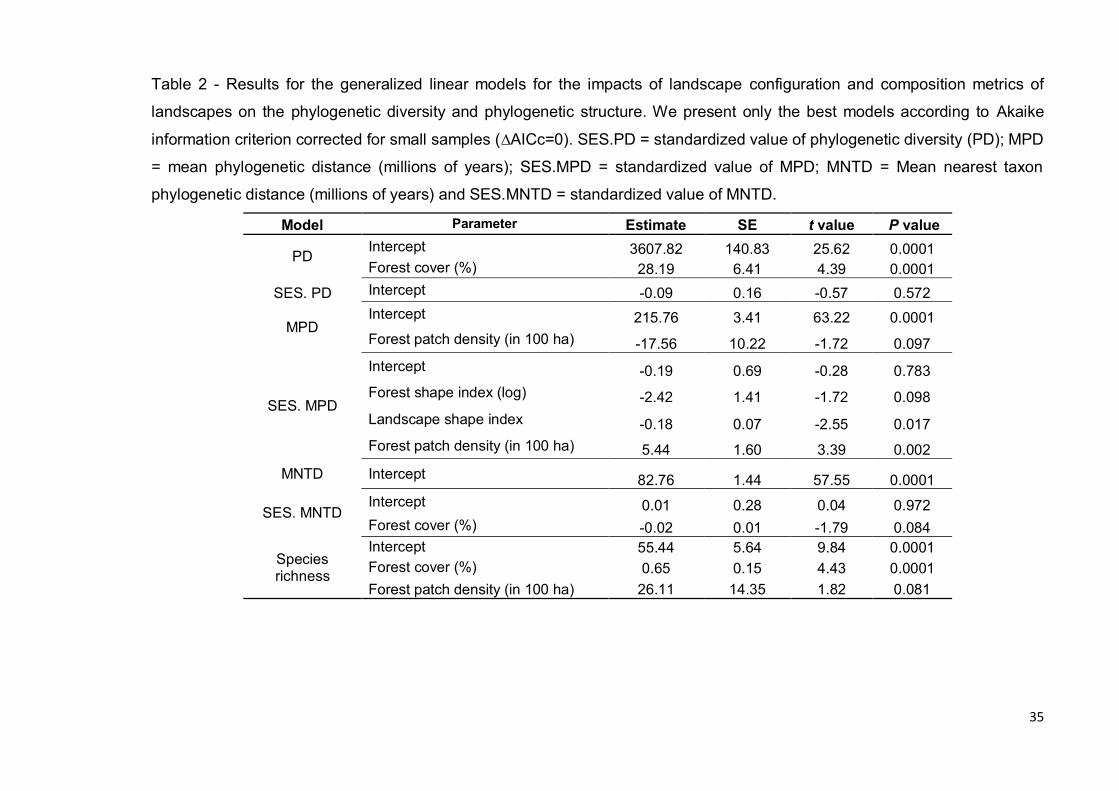
35
Table 2 - Results for the generalized linear models for the impacts of landscape configuration and composition metrics of
landscapes on the phylogenetic diversity and phylogenetic structure. We present only the best models according to Akaike
information criterion corrected for small samples (∆AICc=0). SES.PD = standardized value of phylogenetic diversity (PD); MPD
= mean phylogenetic distance (millions of years); SES.MPD = standardized value of MPD; MNTD = Mean nearest taxon
phylogenetic distance (millions of years) and SES.MNTD = standardized value of MNTD.
Model Parameter Estimate SE t value P value
PD Intercept 3607.82 140.83 25.62 0.0001 Forest cover (%) 28.19 6.41 4.39 0.0001
SES. PD Intercept -0.09 0.16 -0.57 0.572
MPD Intercept 215.76 3.41 63.22 0.0001
Forest patch density (in 100 ha) -17.56 10.22 -1.72 0.097
SES. MPD
Intercept -0.19 0.69 -0.28 0.783
Forest shape index (log) -2.42 1.41 -1.72 0.098
Landscape shape index -0.18 0.07 -2.55 0.017
Forest patch density (in 100 ha) 5.44 1.60 3.39 0.002
MNTD Intercept 82.76 1.44 57.55 0.0001
SES. MNTD Intercept 0.01 0.28 0.04 0.972 Forest cover (%) -0.02 0.01 -1.79 0.084
Species richness
Intercept 55.44 5.64 9.84 0.0001 Forest cover (%) 0.65 0.15 4.43 0.0001
Forest patch density (in 100 ha) 26.11 14.35 1.82 0.081
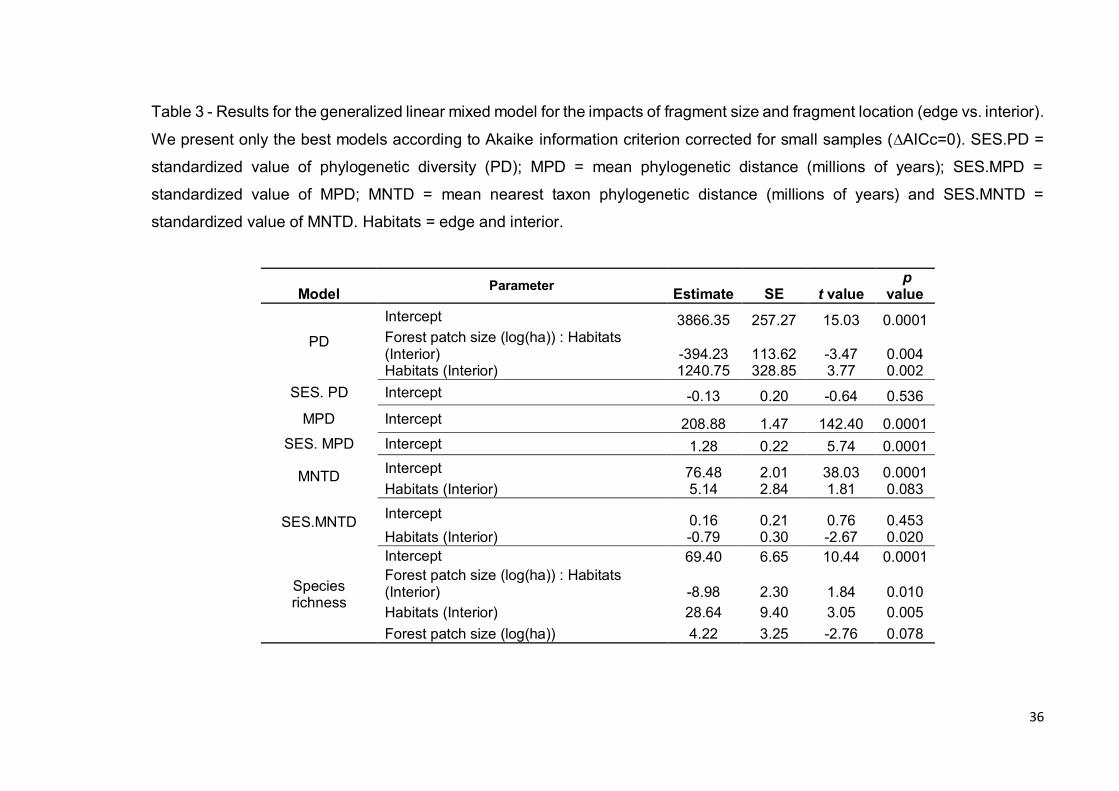
36
Table 3 - Results for the generalized linear mixed model for the impacts of fragment size and fragment location (edge vs. interior).
We present only the best models according to Akaike information criterion corrected for small samples (∆AICc=0). SES.PD =
standardized value of phylogenetic diversity (PD); MPD = mean phylogenetic distance (millions of years); SES.MPD =
standardized value of MPD; MNTD = mean nearest taxon phylogenetic distance (millions of years) and SES.MNTD =
standardized value of MNTD. Habitats = edge and interior.
Model Parameter
Estimate SE t value p
value
PD
Intercept 3866.35 257.27 15.03 0.0001 Forest patch size (log(ha)) : Habitats (Interior) -394.23 113.62 -3.47 0.004 Habitats (Interior) 1240.75 328.85 3.77 0.002
SES. PD Intercept -0.13 0.20 -0.64 0.536
MPD Intercept 208.88 1.47 142.40 0.0001 SES. MPD Intercept 1.28 0.22 5.74 0.0001
MNTD Intercept 76.48 2.01 38.03 0.0001 Habitats (Interior) 5.14 2.84 1.81 0.083
SES.MNTD Intercept 0.16 0.21 0.76 0.453 Habitats (Interior) -0.79 0.30 -2.67 0.020
Species richness
Intercept 69.40 6.65 10.44 0.0001 Forest patch size (log(ha)) : Habitats (Interior) -8.98 2.30 1.84 0.010
Habitats (Interior) 28.64 9.40 3.05 0.005
Forest patch size (log(ha)) 4.22 3.25 -2.76 0.078
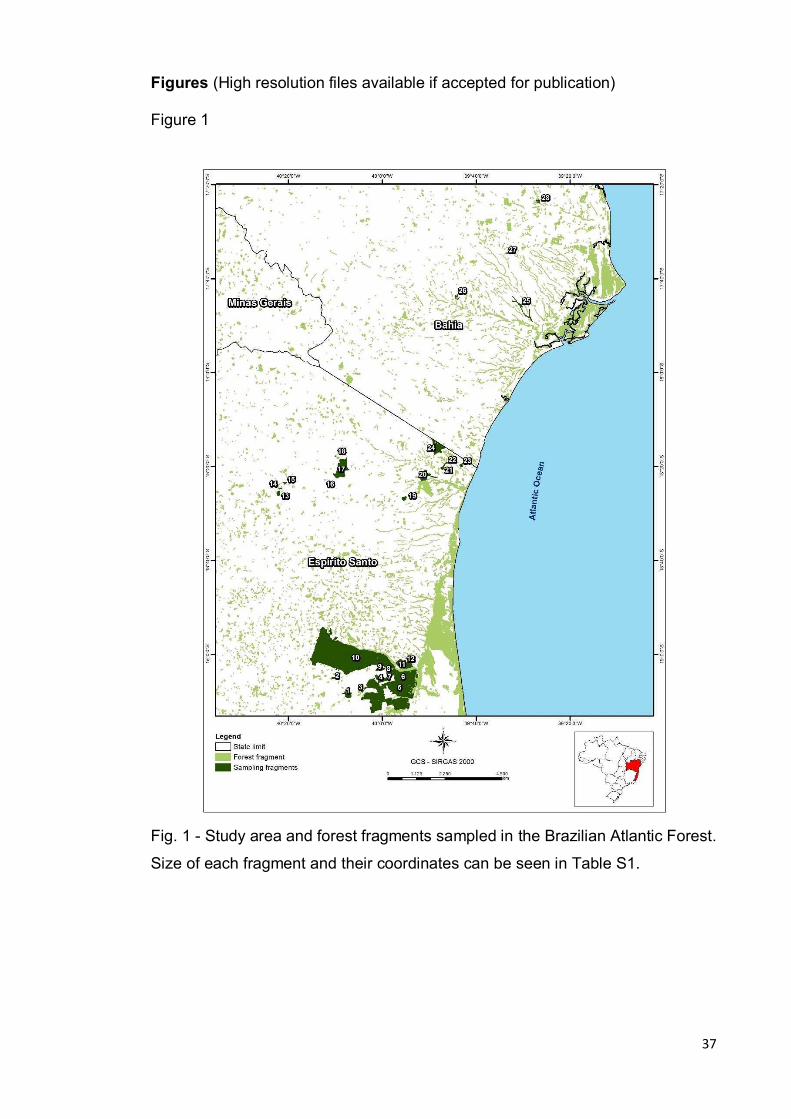
37
Figures (High resolution files available if accepted for publication)
Figure 1
Fig. 1 - Study area and forest fragments sampled in the Brazilian Atlantic Forest.
Size of each fragment and their coordinates can be seen in Table S1.
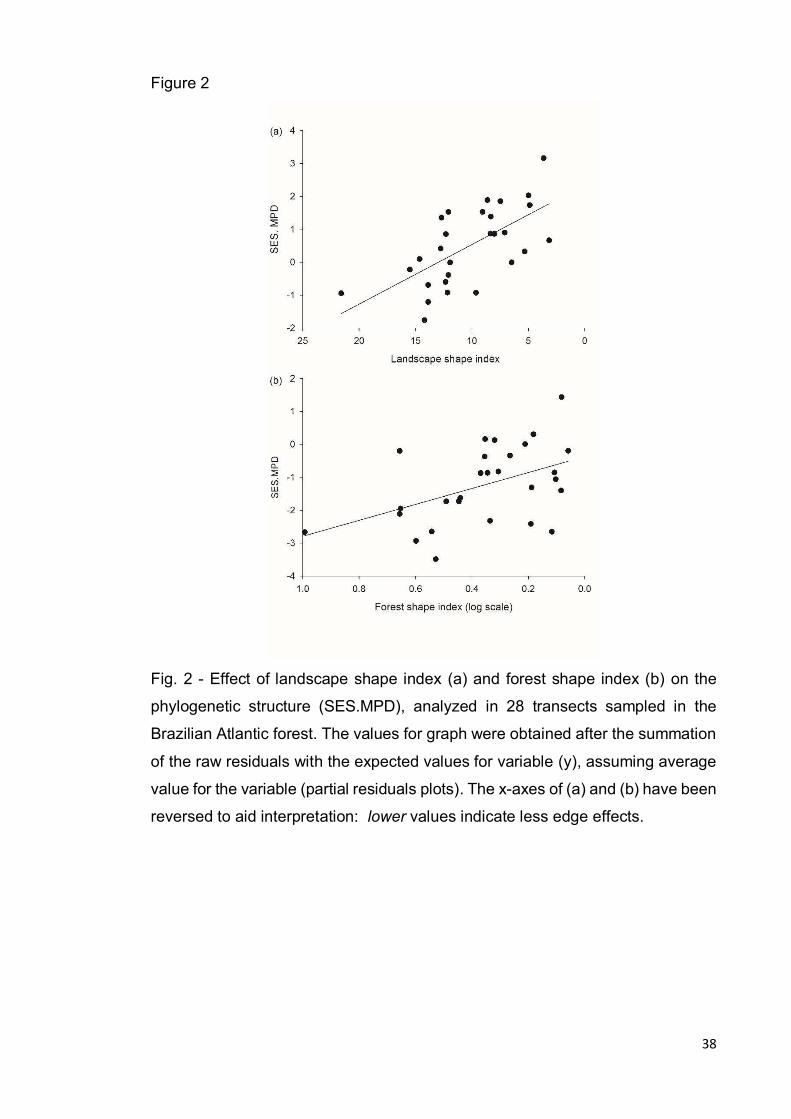
38
Figure 2
Fig. 2 - Effect of landscape shape index (a) and forest shape index (b) on the
phylogenetic structure (SES.MPD), analyzed in 28 transects sampled in the
Brazilian Atlantic forest. The values for graph were obtained after the summation
of the raw residuals with the expected values for variable (y), assuming average
value for the variable (partial residuals plots). The x-axes of (a) and (b) have been
reversed to aid interpretation: lower values indicate less edge effects.

39
Figure 3
Fig. 3 - Relationship between landscape composition, and phylogenetic diversity
and structure. (a) The effect of forest cover (%) on PD; (b) the effect of forest
patch density (in 100 ha) on MPD; (c) the effect of forest patch density (in 100
ha) on SES.MPD; and (d) the effect of forest cover (%) on SES.MNTD. The
values for each graph were obtained after the summation of the raw residuals
whit the expected values for each variable, assuming average values for other
variables (partial residuals plots).
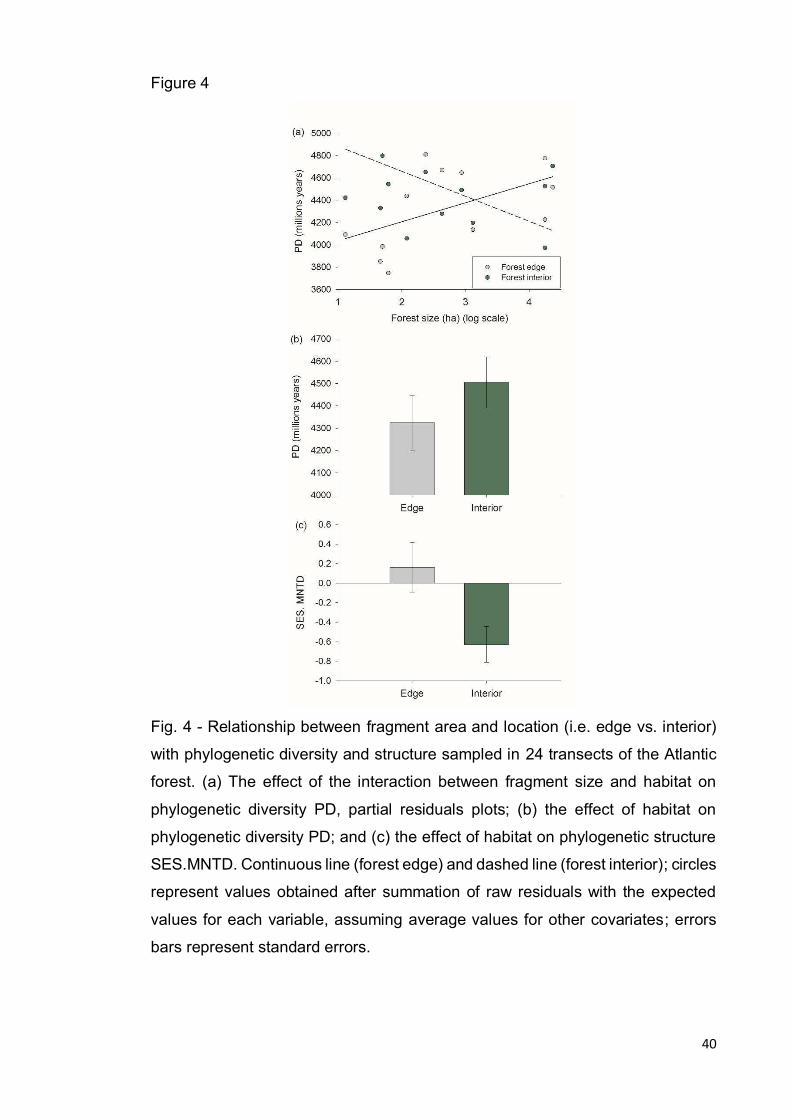
40
Figure 4
Fig. 4 - Relationship between fragment area and location (i.e. edge vs. interior)
with phylogenetic diversity and structure sampled in 24 transects of the Atlantic
forest. (a) The effect of the interaction between fragment size and habitat on
phylogenetic diversity PD, partial residuals plots; (b) the effect of habitat on
phylogenetic diversity PD; and (c) the effect of habitat on phylogenetic structure
SES.MNTD. Continuous line (forest edge) and dashed line (forest interior); circles
represent values obtained after summation of raw residuals with the expected
values for each variable, assuming average values for other covariates; errors
bars represent standard errors.
41
IV. CAPÍTULO II
Impacts of forest fragmentation on the functional diversity of trees: roles
of landscape configuration and composition in the Brazilian Atlantic
forest
Fabio Antonio R. Matos1,2, Luiz Fernando S. Magnago3, Mariana Ferreira
Rocha3, João M. B. Carreiras4, Marcelo Simonelli5, Sebastião V. Martins 6,
João Augusto A. Meira-Neto1*, David P. Edwards2*
1Laboratory of Ecology and Evolution of Plants (LEEP), Departamento de
Biologia Vegetal, Universidade Federal de Viçosa (UFV), Viçosa, Minas Gerais,
CEP: 36570-900, Brasil
2Department of Animal and Plant Sciences, University of Sheffield, Sheffield, S10
2TN, United Kingdom
3Departamento de Biologia, Setor de Ecologia e Conservação, Universidade
Federal de Lavras (UFLA), Lavras, Minas Gerais, CEP: 37200-000, Brazil
4National Centre for Earth Observation (NCEO), University of Sheffield, S3
7RH, United Kingdom
5Instituto Federal do Espírito Santo, Vitória, Espírito Santo, CEP: 29056-264,
Brasil,
6Departamento de Engenharia Florestal, Universidade Federal de Viçosa (UFV),
Viçosa, Minas Gerais, CEP: 36570-900,Brasil
* Corresponding authors. E-mail: [email protected]; [email protected] Tel: +44 (0)114 2220147 ; +55 (31) 3899-1955
** submitted to Biological Conservation
42
ABSTRACT Forests fragmentation is one of the main causes of global biodiversity loss,
impacting the distribution of functional traits within communities. Conserving
functional diversity decreases the loss of phenotypic characteristics that play
important roles in ecosystem processes. We evaluate the impacts of landscape
configuration (i.e., shape and isolation) and landscape composition (i.e., area,
cover and patch density) on (i) functional diversity, (ii) functionally unique species;
and (iii) the richness and abundance of functional characteristics of trees in 27
fragments within the threatened Brazilian Atlantic forest. We used four functional
diversity metrics commonly used in conservation studies (i.e., functional richness,
evenness, divergence and dispersion). In terms of landscape configuration,
higher forest shape index (irregularity promoting edge effects) reduced functional
divergence and functional dispersion, while increasing isolation negatively
impacted functional evenness and positively impacted functional divergence. In
terms of landscape composition, smaller fragments had higher functional
evenness and lower forest cover led to increased functional dispersion. We also
found that increasing forest patch density reduced the richness and abundance
of species adapted to disturbance and increased species with high wood density.
Finally, there was no impact of landscape characteristics on functionally unique
species. These results suggest that higher isolation increases niche
differentiation via increase of species adapted to disturbance, while landscape
composition increased niche homogenization. In highly threatened tropical
regions, conservation must seek to expand connectivity, forest cover or increase
patch density between patches via secondary forest restoration to reverse the
negative impacts of fragmentation and retain key functional traits and processes.
Key-words: Habitat fragmentation, landscape structure, functional structure, functional trait attributes, wood density, tableland Atlantic rain forest
43
Introduction Tropical forests are increasingly human-dominated (Lewis et al., 2015):
the conversion of more than 1.5 million hectares of tropical forest to agriculture
between 1980 and 2012 (Gibbs et al., 2010; Hansen et al., 2013) plus the
associated fragmentation of remaining forests represent the main drivers of
global biodiversity loss and ecosystem degradation (Morris, 2010; Ellis et al.,
2010). So severe are these processes that 25% of the vast Congo and Amazon
basins and 91% of the Brazilian Atlantic forest are within 1 km of an edge (Haddad
et al., 2015). Fragmentation creates landscapes with forest patches of different
sizes, shapes and isolation levels (Fahrig, 2003; Ewers and Didham, 2006). In
turn, each patch is affected by abiotic changes especially at edges, including
increased wind, temperature and desiccation (Laurance et al., 2002; Magnago et
al., 2015a), and with big implications for species persistence and their movement
between fragments (Vieira et al., 2009; Boscolo and Metzger, 2011; Laurance et
al., 2011). Given predictions that forest fragmentation will increase (Haddad et
al., 2015; Lewis et al., 2015), understanding the effects that these 'new
landscapes' have on biodiversity is crucial.
Species richness, community composition and phylogenetic diversity are
strongly influenced by fragmentation (Magnago et al., 2014, Santos et al., 2010;
Andrade et al., 2015; Cisneros et al., 2015a). Reducing fragment area and
increasing edge effects both tend to result in the loss of species (Ewers and
Didham, 2006; Magnago et al., 2014) and changes in species composition
(Laurance et al., 2002; Hill and Curran, 2003; Magnago et al., 2014; Benchimol
and Peres, 2015), often via shifts in resource availability (e.g., food for fauna;
Lopes et al., 2009). These changes are typified by the replacement of rare interior
forest species with edge-tolerant generalist species (Arroyo-Rodríguez et al.,
2013; Carrara et al., 2015) and exotic species (Turner, 1996). Fragmentation also
tends to most strongly negatively impact those species that are most
evolutionarily distinct (Purvis et al., 2000; Vamosi and Wilson, 2008).
It is also important to understand the impacts of forest fragmentation on
the roles that species play within communities to shape ecological processes.
Functional diversity measures the variability of functional attributes among
species within a community (Petchey and Gaston, 2006), generally using
attributes that affect the performance of the species in a community (Díaz and
Cabido, 2001; Pérez-Harguindeguy et al., 2013). It has the advantage over
44
approaches that compare abundances of members of different functional guilds
(Azhar et al., 2013; Gilroy et al., 2015) in accounting for within-guild variation
between species (such as concurrent differences in body size and beak
morphology; Edwards et al., 2013). Conserving high functional diversity is
expected to both retain functionally unique species (O`Gorman et al., 2011) and
the provisioning of ecosystem services via a variety of mechanisms (Tilman et
al., 1997; Petchey and Gaston 2006; Cardinale et al., 2012; Hooper et al., 2005).
For instance, functional diversity was a better predictor of variation in above-
ground biomass, and thus carbon storage, than was species richness in
manipulative experiments in European grasslands (Petchey et al., 2004).
Recent studies investigating the impacts of tropical forest fragmentation
on functional diversity (FD) have tended to focus on area, forest cover, and edge
impacts across an array of taxa. In terms of area effects, results are contrasting:
in Los Tuxtlas, Mexico, the FD of copro-necrophagous beetles was lower in small
than in larger fragments (Barragán et al., 2011), as was the FD of mammals in a
global meta-analysis (Ahumada et al., 2011), whereas FD was higher in small
than in larger fragments for trees in the Brazilian Atlantic forest (Magnago et al.,
2014) and bats in Costa Rica (Cisneros et al., 2015a). In terms of forest cover
effects, in the Brazilian Atlantic forest, the FD of birds was higher with smaller
percentage of forest cover (De Coster at al., 2015). Lastly, FD of tree species in
the Brazilian Atlantic forest was lower at the edge than in the interior of the
fragments (Magnago et al., 2014), and FD of pollination systems gradually
decreased from forest interior to edges (Lopes et al., 2009).
Beyond the impacts of fragment area and edge effects, the degree of
isolation from other fragments (Boscolo and Metzger, 2011; Magnago et al.,
2015b) and fragment shape (Hill and Curran, 2003) influence species retention
in fragments and, therefore, are also likely to determine impacts on functional
diversity. However, to our knowledge there is just one study investigating the
impacts of isolation and fragment shape on FD (Cisneros et al., 2015) revealing
that the FD of bats increases when shape irregularity decreases (i.e., less edge
to interior ratio) and proximity (i.e., connectivity) increases between fragments. A
key question therefore is how the functional diversity of tree communities is
affected by the shape and isolation of fragments, since these communities are
critical for habitat structure (Boscolo and Metzger, 2011; Pardini et al., 2010;
Magnago et al., 2014), carbon storage (Laurance, 2004; Nascimento and
45
Laurance, 2004; Magnago et al., 2015b), as well as their high diversity (Banks-
Leite et al., 2014).
In this study, we examined the effects of configuration and composition of
landscapes on the functional diversity of trees on 27 fragments of the threatened
Brazilian Atlantic forest (Myers et al., 2000). The Atlantic forest retains just 11%
of its original forest cover (Ribeiro et al., 2009), which nevertheless provides vital
habitat and resources for much threatened fauna (Moran and Catterall, 2010;
Magnago et al., 2014), considerable primary production (Barber, 2007) and
carbon stocks (Pütz et al., 2014), and thus co-benefits between carbon and
biodiversity (Magnago et al., 2015b). Our study had three specific objectives: (1)
to evaluate the effect of configuration and composition of landscapes on four
functional diversity indices; (2) to evaluate the effect of configuration and
composition of landscapes on functionally unique species; and (3) to determine
how metrics of configuration and composition affect the richness and abundance
of functional characteristics of trees vulnerable to fragmentation.
Materials and methods
Study sites
Our study area was based in Espírito Santo (19° 3'48.02" S and
39°58'58.52" W) northwards to southern Bahia (17°43'29.30" S and 39°44'26.60"
W), east Brazil (Fig. 1; see Table A1), which contains a landscape matrix
composed of cattle pastures, plantations of Eucalyptus spp., sugar cane, coffee,
and papaya, and forest fragments (Rolim et al., 2005). The prevailing climate is
wet tropical (Köppen climate classification), with low rainfall from April to
September followed by high precipitation from October to March, and with
minimal variation in climate across sampling sites: precipitation ranges from
1,228 mm yr-1 in Espírito Santo (Peixoto and Gentry, 1990) to ~1,403 mm yr-1 in
Bahia (Gouvêa, 1969), with similar average temperatures in the dry season
(Espírito Santo ~15.6°C; Bahia ~14°C) and the wet season (Espírito Santo
~27.4°C; Bahia ~23°C). The predominant soil in the study area is Yellow Podzolic
(IBGE, 1987; Magnago et al., 2015b).
These forest areas are included in the Atlantic Forest domain (IBGE,
1987), typified by large flat areas rising slowly from 20 to 200 m a.s.l., and
according to the Brazilian vegetation classification are Lowland Rain Forest
46
(IBGE, 1987). These areas are of high conservation value, as these landscapes
despite having fragments of different shapes, sizes and levels of isolation (Fig.1
and Table A2), still have high biodiversity (Chiarello, 1999; Rolim and Chiarello,
2004; Magnago et al., 2014) and strong carbon storage and biodiversity co-
benefits (Magnago et al., 2015b).
Historically, the studied landscape remained well preserved until the
1950’s. Thereafter, Espírito Santo and Bahia experienced rampant clear-cut
logging and charcoal production, followed by agriculture (Garay and Rizzini,
2004). The main deforestation period in our study area was thus between 1950s
and early 1970s (Magnago et al. 2015b), with conversion of forests primarily to
sugar cane and cattle pastures. Because our fragments were 40 to 60 years old
when sampled, extinction debts of some long-lived tree species are likely still to
be paid. However, trees species composition in the interior of smaller fragment
alters rapidly (most within the first 10 years since isolation) to reflect a more
disturbed community (Laurance et al., 1998; Laurance et al., 2002; Laurance et
al., 2006), indicating that our time since isolation is sufficient to detect many
important impacts of fragmentation.
Data collection
Fieldwork was conducted between January 2008 and July 2014 in 27
forest fragments with areas ranging from 13 to 23 480 ha (Table A1; Matos et al.,
in review). Within each fragment, we sampled one transect (except for the
second largest fragment of 17 716 ha in which we sampled two transects
separated by 4 km), positioned at least 200 m from the forest edge (28 transects
in total; see Fig. 1 and Table A1). On each transect, we sampled 10 square plots
(10 m x 10 m; 0.1 ha combined) located at 20 m intervals along each transect,
totaling 280 plots (2.8 ha). We only sampled primary forests, with no evidence of
recent logging, although we cannot rule out the occurrence of limited degradation
several decades ago.
Within each plot, we sampled all individuals living and rooted within our
plots with diameter at breast height (DBH) of ≥4.8 cm at 1.3 meters above ground
height. Individuals that were not identified at the site were collected and classified
into morphospecies, subsequently identified by morphological comparison in the
Herbarium of the Vale (CVRD) or botanical experts for their families (e.g.
Myrtaceae and Sapotaceae). The botanical material collected in reproductive
47
stage was deposited in the Herbarium of the Federal University of Viçosa, Minas
Gerais (VIC) and CVRD, Espírito Santo.
Metrics of fragmentation
We investigate both the configuration (i.e., geometric arrangement,
isolation and position of elements within the landscape) and composition (i.e.,
type or quantity of elements that compose the landscape) of our forest fragments
within the study area (Cisneros et al., 2015). Following Matos et al. (in review),
we identify the configuration and composition characteristics of landscapes using
a vegetation map of the Brazilian Atlantic forest (reference year 2015;
www.sosma.org.br and www.inpe.br). This dataset depicts the spatial distribution
of the main forest formations within this biome, and has been used to describe
landscape structure via forest loss and fragmentation (Ribeiro et al., 2009) and
to generate estimates of carbon loss due to habitat fragmentation (Pütz et al.,
2014). See Text A1 for further details.
Fragmentation metrics were computed as in Matos et al. (in review), i.e.,
encompassing an area defined by a 5 km buffer around each forest fragment and
using the implementation given in FRAGSTATS (v 4.2; McGarigal et al., 2012;
except ‘source distance’ see below). Furthermore, all metrics were computed
using the eight-cell neighbourhood rule and considering a search radius of 5 km.
For each fragment we measured four metrics related to landscape configuration
(see Table A3): (1) forest shape index - measures the level of shape complexity
on a fragment basis, with a low number indicating that fragments are more regular
and thus have less edge effects; (2) forest nearest neighbour - gives the
Euclidean distance to the nearest neighbour forest patch, with a low number
suggesting less isolation; (3) mean forest nearest neighbour – gives the average
value of the forest nearest neighbour metric when considering all forest fragments
within each buffer; and (4) source distance – measures distance to the nearest
forest patch having an area of at least 1,000 ha, with lower values suggesting
less isolation. This metric was computed with ArcGis (v 10.1) using as a base the
vegetation map of Brazilian Atlantic forest (SOS Mata Atlântica/INPE, 2015)
(Table A3).
For each fragment, we additionally measured three metrics of landscape
composition again using the implementation given in FRAGSTATS (see Table S3
for full details of each metric): (5) forest patch size – measures the area of the
48
focal fragment; (6) forest cover – measures the percentage of the landscape
covered by forest, with a high number reflecting largest remaining forest cover;
and (7) forest patch density – measures the number of fragments in 100 hectares
within each landscape.
Functional trait matrix
We examined six traits related to: quantity and type of food resource (1.
fruit size [mm], 2. seed size [mm], and 3. fruit type, categorized into fleshy or non-
fleshy fruits; Coombe, 1976; Magnago et al., 2014); fruit dispersal syndrome (4.
zoochoric or non-zoochoric dispersion; Magnago et al., 2014); forest structure (5.
succession group, categorized as pioneer, initial secondary or later secondary;
Borges et al., 2009; Magnago et al., 2014), and carbon storage (6. wood density
in dry weight [g cm-3]; Magnago et al., 2014; 2015b). See Text A2 for full details.
Among the 538 species sampled, 4% representing 0.5% of the total
abundance (i.e., 24 of 4 847 individuals) were removed from the analysis because
they were identified to morphospecies level or could not have functional
characteristics obtained.
Measures of functional diversity
We used the function ‘dbFD’ function (FD package; Laliberté et al., 2015)
in R version 3.2.1 (R Development Core Team 2015) to calculate four functional
diversity metrics: (1) functional richness (FRic), which measures the volume of
trait space occupied by a community. High FRic suggests a high use of
resources, whereas a low value of FRic suggests that some traits are missing
from communities resulting in poor use of resources; (2) functional evenness
(FEve), which describes the uniformity of distribution of abundance of species in
the occupied functional trait space. A community with high FEve has a symmetric
abundance distribution throughout functional space, indicating the absence of
dominance by specific functional groups and suggesting that resources are being
used efficiently by the community; (3) functional divergence (FDiv), which
quantifies the divergence in the distribution of abundance in the volume of traits.
When FDiv is high, there are high levels of niche differentiation, indicating low
competition for resource; and finally (4) functional dispersion (FDis), which
estimates the dispersion of species in functional trait space, considering species’
relative abundances. Higher values of FDis suggest that the remaining forests
49
have a high functional richness and/or divergence, since this index incorporates
features of both functional metrics. The functional diversity indices FRic, FEve
and FDiv have been proposed by Villéger et al., (2008) and FDis proposed by
Laliberté and Legendre, (2010). Both indices have been widely used in studies
investigating the effect of fragmentation on bird communities (De Coster et al.,
2015), mammals (Ahumada et al., 2011), beetles (Barragán et al., 2011) and
trees (Magnago et al., 2014) in tropical forests.
Measures of null model
Measures of functional diversity are sensitive to underlying species
richness (Pavoine and Bonsall, 2011; Schuldt et al., 2014). Hence we determine
whether changes in functional diversity resulting from landscape configuration
and composition were higher or lower than one would expect by chance, by
calculating the standardized effect size (ses) of our four metrics of functional
diversity (FRic, FEve, FDiv and FDis). The ses measures the number of standard
deviations between the observed values and expected. Thus, ses takes the
following form: [(observed – mean expected) / standard deviation of expected],
where observed values are obtained from the sampled data, expected mean is
the average of 999 randomizations and standard deviation of expected is the
standard deviation of the 999 simulated communities. We used the independent
swap algorithm (Gotelli, 2000), to maintain species richness and species
frequency occurrence in the 999 communities. These analysis were run in R
version 3.2.1 (R Development Core Team. 2015) according to script from
(Swenson, 2014). A negative value indicates that the fragmented forest has lower
FD than expected by chance, whereas a positive value denotes higher FD than
expected by chance.
Measures of functionally unique species
We adapted the Evolutionary Distinction (ED) index, which measures how
much a given species is distinguished from other species in a phylogeny
(phylogenetic diversity), to be used in a functional context (Thuiller et al., 2014).
First, we constructed a functional dendrogram according to the functional traits of
trees (see Text A2 for complete details of functional traits). To build a functional
dendrogram, we used the Gower`s distance (Pavoine et al., 2009) to create a
distance matrix from continuous and categorical functional traits, and the UPGMA
50
clustering method. We then used the ‘as.phylo’ function available in the R ape
package to transform the functional dendrogram into a tree of class phylo. Finally,
we applied the function 'fair.proportion' available in picante package to calculate
ED of each species present in the functional dendrogram. The fair proportion
method (Isaac et al., 2007) is given by the sum of the branch lengths among all
the nodes from the tip to the root, divided by the number of species subtending
each branch.
Statistical analyses
We analysed the effects of landscape configuration and composition on
each metric of functional diversity (FRic, FEve, FDiv and FDis), functional
structure (ses FRic, sesFEve, sesFDiv and sesFDis), functionally unique species
and functional traits. We used generalized linear models (GLM), with Gaussian
error and an identity link (normality was tested and confirmed by the Shapiro Wilk
test), in the ‘glm’ function from stats package. For count data (e.g. the abundance
of categorical functional traits; see Text A2) we used GLM, with a Poisson error
distribution and a log link function, and negative binomial distributions with log
link functions when the data showed significant overdispersion. These models
were made using the ‘glmmadmb’ function from the package glmmADMB. We
used the ‘dredge’ function from MuMIn package to test all possible combinations
of the fragmentation metrics (i.e., configuration and composition) included in the
global model. To select our best model we used an information theoretical
approach based on the Akaike Information Criterion of Second Order (∆AICc),
which is indicated for small sample sizes, and the best model was indicated by
the lowest ∆AICc value (Burnham et al., 2011). Log transformations were used
to reduce the variance heterogeneity for forest shape index, source distance and
forest patch size measurements. Lastly, given that predictor landscape variables
may have high multi-colinearity (Boscolo and Metzger, 2011), we used the
variance inflation factor (VIF) to identify any correlated variables (i.e., VIF values
≥10; Benchimol and Peres, 2015); however, because VIF values ranged from
2.90 (i.e., forest patch size) to 10 (i.e., forest cover), we did not remove any
variable.
Results
51
Impacts of landscape configuration on functional diversity
Considering only our best model (in which ∆AICc=0; Tables 1 and A4),
functional evenness (FEve) was significantly (α = 0.05) and negatively related to
forest nearest neighbour (t = -2.648, P = 0.0138; Fig. 2a), indicating that
increasing isolation of fragments generated high irregularity of distribution of
species abundances within the trait space. Functional divergence (FDiv) showed
a significant negative relationship with forest shape index (t = -2.130, P = 0.0432;
Fig. 2b) and was significantly higher in fragments with the highest level of isolation
(i.e., forest nearest neighbor) (t = 2.223, P = 0.0355; Fig. 2c). Finally, we found
that increasing irregularity of the fragments (i.e., forest shape index) reduced
functional dispersion (FDis) (t = -3.781, P = 0.0009; Fig. 2d).
In terms of the best models explaining functional structure (Tables 1 and
A4), we found that with increasing irregularity of fragments (i.e., forest shape
index) there was a significant decrease in sesFRic (t = -2.487, P = 0.0199; Fig.
3a), suggesting that highly irregular fragments are less FRic than expected for
communities assembled with random processes. sesFEve was significantly lower
than expected by chance in areas with higher values of forest nearest neighbour
(t = -2.917, P = 0.0074; Fig. 3b). sesFDiv was significantly lower than expected
by chance in areas with higher forest shape index (t = -2.161, P = 0.0405; Fig.
3c), and larger than expected by chance with increased level of isolation between
the remaining forests within landscapes (i.e., mean forest nearest neighbor) (t =
2.137, P = 0.0426; Fig. 3d). Lastly, we found that sesFDis was lower than
expected by chance with increasing irregularity of fragments (i.e., shape forest
index) (t = -4.014, P = 0.0005; Fig. 3e).
In terms of functionally unique species, we found no effect of landscape
configuration according to our selection of models (which ∆AICc=0; Table A5).
Instead the null model was the best model.
We found that configuration characteristics of landscapes (see Table A3)
significantly affected the richness and abundance of three functional traits (in
which ∆AICc=0; Tables 2, A6, A7, A8 and A9), but that fruit diameter, seed
diameter, and wood density were not affected (Tables 2, A6 and A9). In terms of
species richness, higher forest shape index caused a significant reduction of non-
zoochoric dispersers (Table 2; Fig. A1-a), while increasing source distance (i.e.,
distance to fragments ≥1000 ha) increased the richness of initial secondary but

52
reduced the richness of later secondary species (Table 2; Fig. A1b-c). In terms
of abundance, higher forest shape index had a positive effect on the abundance
of species with fleshy fruits (Fig. A2a), but a negative effect on the abundance of
species with non-fleshy fruits and non-zoochoric dispersion (Table 2; Fig. A2b-c).
Higher forest nearest neighbor reduced the abundance of species with zoochoric
dispersion, and increased the abundance of pioneer species (Fig. A2e-f). Finally,
increased source distance was negatively related to the abundance of species
with fleshy fruits, zoochoric dispersion, and later secondary (Fig. A2g-i), whereas
it was positively related to the abundance of pioneer and initial secondary species
(Table 2; Fig. A2j-k).
Impacts of landscape composition on functional diversity
According to our best models of functional diversity (in which ∆AICc=0;
Tables 1 and A4), FEve was negatively related to forest patch size (t = -2.632, P
= 0.0143; Fig. 4a), indicating that the evenness of traits is less heterogeneous in
larger than smaller fragments. We also found that increasing the percentage of
forest cover reduced FDis (t = -3.214, P = 0.0036; Fig. 4b).
In terms of functional structure, according to our best model (Tables 1 and
A4), sesFEve was negatively related to fragment area (t = -2.623, P = 0.0146;
Fig. 4c) and sesFDis was negatively related to forest cover (t = -3.772, P =
0.0009; Fig. 4d). This suggests that larger fragments and increased forest cover
have lower values of sesFEve and sesFDis than expected for communities
assembled at random processes.
Considering our best models for functionally unique species, we found no
effect of composition of the landscape (which ∆AICc=0; Table A5). Instead the
null model was the best model.
Evaluating the effect of landscape composition (see Table A3) on the
richness and abundance of functional traits (in which ∆AICc=0; Tables 2, A6, A7
A8 and A9), we found that fruit and seed diameter were not affected by any of
our landscapes composition metrics (Tables 2, A6). In terms species richness,
increasing forest cover led to increasing richness of tree species with fleshy fruits,
zoochoric dispersion and later secondary species (Table 2; Fig. A3a-c), while
increasing forest patch size and forest patch density led to decreasing richness
of pioneer species and to increasing richness of later secondary species,

53
respectively (Table 2; Fig. A3d-e). Finally, in terms of abundance, increased
forest cover led to a reduction in the abundance of non-zoochoric dispersing
species (Table 2; Fig. A4a), while forest patch density was negatively related to
the abundance of initial secondary species but positively related to wood density
(Table 2; Fig. A4b-c).
Discussion Understanding the effects of forest fragmentation on functional diversity
will enable us to design conservation strategies that help to maximise the
provision of key ecosystem functions and services (Tilman et al., 1997; Petchey
and Gaston, 2006; Cadotte et al., 2011). Our results demonstrate that functionally
unique species were not impacted by any of our landscapes metrics of
configuration and composition, indicating that even remote, isolated, small and/or
edge-effected fragments can harbor functionally unique species. Considering the
effects of landscape configuration on functional diversity, we found that increased
isolation led to a reduction of functional evenness and increased functional
divergence. Moreover, and taking into account the impact of landscape
compositional characteristics, lower functional evenness was associated with
larger forest patches and lower functional dispersion with increased forest cover.
Finally, landscapes with higher forest patch density may be important reservoirs
of biodiversity and carbon storage, since they retain trees with higher values of
the wood density and later secondary species, but fewer species adapted to
disturbance. These results suggest that characteristics of landscape
configuration (i.e., increasing isolation) leads to a loss of functional redundancy,
but do not promote fewer functions than areas with less isolation, while the impact
of changing landscape composition (i.e., increasing area, forest cover and forest
patch density) increase functional similarity between species, suggesting higher
interaction with fauna and capacity for carbon storage (see Bello et al. 2015).
Impacts of landscape configuration on functional diversity
Functional diversity can be influenced by species richness (Pavoine and
Bonsall, 2011; Schuldt et al., 2014). After correcting for the potentially
confounding impacts of species richness, we found that functional richness
(sesFRic), functional divergence (sesFDiv) and functional dispersion (sesFDis)
54
were low (i.e., ses<0) in fragments with higher forest shape index (i.e., high edge
effect; Hill and Curran, 2003; Ewers and Didham, 2006). This suggests niche
homogenization among species sharing similar functional characteristics
(Mouchet et al., 2010; Magnago et al., 2014; De Coster et al., 2015).
Unexpectedly, however, homogenization was caused by (1) increased
abundance of species with fleshy fruits, and (2) decreased richness of species
with non-zoochoric dispersion, reductions in the abundance of species with non-
fleshy fruits and abundance of initial secondary species (i.e., species adapted to
disturbance; Hill and Curran, 2003; Magnago et al. 2014). One potential
explanation is that our most edge-effected (irregular) fragments were also those
with a larger size (see Fig. A5), and thus that size is more important than shape
in driving functional responses.
In contrast, fragments with the highest level of isolation (i.e., forest nearest
neighbor) had lower functional evenness (FEve and sesFEve, thus independent
of species richness) and higher functional divergence (FDiv, but not sesFDiv).
These patterns suggest higher niche differentiation with greater isolation, caused
by the loss of functional redundancy (i.e., later secondary species) and the
increase in species adapted to disturbance (i.e., pioneers species), which may
generate negative interactions with fauna and the erosion of ecosystem services
over time (Girão et al., 2007; Magnago et al., 2014). A possible explanation is
that increasing isolation limits seed dispersal among remaining forest fragments
(Hubbell, 2001; Duque et al., 2009), leading to increased floristic differentiation
between species in highly fragmented landscapes (Arroyo-Rodríguez et al.,
2013). Increased floristic differentiation is predicted by the landscape-divergence
hypothesis, in which anthropogenic-induced changes lead to different
successional trajectories, changing species composition and functional
characteristics of trees (Laurance et al., 2007; Arroyo-Rodríguez et al., 2013;
Sfair et al., 2016).
In addition to the level of isolation, we found that with increasing source
distance (i.e., distance to fragments ≥1000 ha) there was an increase in the
richness of initial secondary species and reduced richness of later secondary
species. Similarly, we found a decrease in abundance of fleshy fruits, zoochoric
dispersion and later secondary species and an increase in abundance of pioneer
species and initial secondary species. These results suggest that the loss of large
forest blocks across the landscape can lead to the reduction of important
55
ecosystem functions through the loss of later secondary species and increasing
richness and abundance of resilient species (i.e., adapted to disturbance), as well
as loss of important resources for fauna (Girão et al., 2007; Magnago et al., 2014).
Impacts of landscape composition on functional diversity
The presence of large forest blocks reduced functional evenness (FEve
and sesFEve) and higher percentage of forest cover decreased functional
dispersion (FDis and sesFDis), independent of the number of species sampled.
These results indicate strong functional redundancy between species that share
similar functional characteristics in highly forested landscapes (Mouchet et al.,
2010; Magnago et al., 2014; De Coster et al., 2015). Increased redundancy for
FEve and FDis within functional space was caused by reducing the species
richness of pioneers and the abundance of non-zoochoric species, and
increasing the richness of species with fleshy fruits, zoochoric and later
secondary traits. In support of these findings, studies investigating the effect of
fragment area on the community of trees in the Brazilian Atlantic forest (Magnago
et al., 2014) and of forest cover on the functional diversity of birds (De Coster et
al., 2015) showed an increase in functional redundancy with increasing fragment
area and forest cover driven by increases in functional traits that have important
interactions with fauna.
Finally, with increasing forest patch density there was an increase in the
species richness of later secondary and high wood density trees, but reduced
abundance of initial secondary species. This suggests that fragmented
landscapes that retain high densities of fragments can play an important role in
the conservation of carbon storage and co-benefits between carbon storage and
biodiversity (Magnago et al., 2014; 2015b). This is very important in highly
fragmented landscapes such as those found in the Brazilian Atlantic forest, where
~80% of remaining forest fragments have an area of less than 50 ha (Ribeiro et
al., 2009).
Conclusions and conservation implications
Changes to tree functional diversity caused by the configuration and
composition of fragmented landscapes have important implications for the
conservation of highly fragmented tropical landscapes, including the globally
56
threatened Brazilian Atlantic, Tropical Andes, and Himalaya forests (Armenteras
et al., 2003; Kumar and Ram, 2005; Ribeiro et al., 2009; Magnago et al., 2014;
De Coster et al., 2015). There are both positive and negative impacts for
conservation associated with these changes. We found high functional
redundancy even in highly edge-effected areas (i.e., high forest shape index) as
well as in areas with large forest blocks. This was driven by the high availability
of tree species with important traits for fauna and composed of later secondary
species, suggesting that these habitats are important for conservation, plus offer
favorable sources of seed dispersal for secondary forest enrichment in adjacent
degraded areas (Chazdon et al., 2009).
However, increasing isolation among remaining forest fragments drives
lower functional evenness and increased functional divergence, possibly caused
by floristic differentiation promoted by the isolation process (Arroyo-Rodríguez et
al., 2013). Such isolation limits the persistence of animal species (Prugh et al.
2008; Vieira et al., 2009; Boscolo and Metzger, 2011), likely drives long-term
reductions in capacity to store carbon (Bello et al., 2015; Peres et al., 2016), and
consequently, isolated fragments may have a lower potential to offer strong co-
benefits between carbon and biodiversity (Magnago et al., 2015b). Furthermore,
while reductions in forest patch size and forest cover promote higher functional
evenness and dispersion (and thus losses of functional redundancy), this is
driven by reductions of fleshy fruit, zoochoric dispersed, and later secondary
species and by increases of trees adapted to disturbance (i.e., changing quality,
but not quantity of functions; De Coster et al., 2015). Future studies should
investigate the long-term effect of these functional changes on ecological
processes. For instance, Banks-Leite et al., (2014) showed that it is important to
recover or maintain forest cover in the Atlantic forest above 30% of native habitat
to prevent the loss of endemic species and associated ecological processes.
Finally, these results suggest that where the vast majority of forest cover
and connectivity has been lost there is limited benefit of protecting the few
remaining patches for the retention of functional diversity, and that such isolated
locations could represent poor conservation investment if found in regions where
much contiguous forest cover remains (see also Matos et al. in review for similar
results for phylogenetic diversity). Nevertheless, in highly threatened regions
where most contiguous forest is already gone, including the Brazilian Atlantic and
Tropical Andean forests (Ribeiro et al., 2009; Haddad et al., 2015), then
57
conservation must seek to expand forest cover, increase patch density, and/or
connectivity between patches via secondary forest restoration to reverse the
negative impacts of fragmentation processes. This is likely to be an important
option for recovering carbon stocks—via promoting species with higher wood
density—and maintaining biodiversity within such highly fragmented and
threatened regions, potentially offering strong co-benefits between carbon and
biodiversity under REDD+ (Magnago et al. 2015b).
Acknowledgements We are grateful to CAPES a scholarship awarded to FARM (process
number 99999.006537/2014-06). We are grateful to Reserva Natural Vale,
Reserva Biológica de Sooretama, Reserva Biológica Córrego do Veado, Flona
do Rio Preto, as well as IBAMA the work permit granted in federal conservation
units (license number 42532). We also thank Conservation International, IEMA
(Instituto Estadual de Meio Ambiente) via the Projeto Corredores Ecológicos,
Reserva Natural Vale, Marcos Daniel Institute, and Pro-Tapir for logistical
support. Finally, the people who made this work possible in the field: Thiago S.
Coser, Domingos Folli, Glaucia S. Tolentino, Carolina Nunes, and Geanna
Correia. JAAMN holds a CNPq productivity fellowship (301913/2012-9). L.F.S.M.
was supported by Brazilian Studentship and Doctorate Sandwich Program grants
from the Brazilian Federal Agency for Support and Evaluation of Graduate
Education (CAPES) with two grants, Brazilian Studentship and Doctorate
Sandwich Program.
Role of the funding source This work was funding by CNPq – the Brazilian Agency for Science and
Technology (grant no. 477780/2009-1), FAPEMIG, SECTES-MG, MCTI, Fibria
S.A, Suzano Papel and Ceculose S.A., and ArcelorMittal BioFlorestas. These
sponsors do not participate in the design of this study, collection of data, analysis,
or interpretation of the data, the writing in this manuscript, or the decision to
submit this manuscript for publication.
References Ahumada, J.A., Silva, C.E.F., Gajapersad, K., Hallam, C., Hurtado, J., Martin, E.,
McWilliam, A., Mugerwa, B., O’Brien, T., Rovero, F., Sheil, D., Spironello,
58
W.R., Winarni, N., Andelman, S.J., 2011. Community structure and diversity of tropical forest mammals: data from a global camera trap network. Philos. Trans. R. Soc. B Biol. Sci. 366, 2703–2711. doi:10.1098/rstb.2011.0115
Andrade, E.R., Jardim, J.G., Santos, B.A., Melo, F.P.L., Talora, D.C., Faria, D., Cazetta, E., 2015. Effects of habitat loss on taxonomic and phylogenetic diversity of understory Rubiaceae in Atlantic forest landscapes. For. Ecol. Manag. 349, 73–84. doi:10.1016/j.foreco.2015.03.049
Armenteras, D., Gast, F., Villareal, H., 2003. Andean forest fragmentation and the representativeness of protected natural areas in the eastern Andes , Colombia. Biol. Conserv 113, 245–256. doi:10.1016/S0006-3207(02)00359-2
Arroyo-Rodríguez, V., Rös, M., Escobar, F., Melo, F.P.L., Santos, B.A., Tabarelli, M., Chazdon, R., 2013. Plant β-diversity in fragmented rain forests: testing floristic homogenization and differentiation hypotheses. J. Ecol. 101, 1449–1458. doi:10.1111/1365-2745.12153
Banks-Leite, C., Pardini, R., Tambosi, L.R., Pearse, W.D., Bueno, A.A., Bruscagin, R.T., Condez, T.H., Dixo, M., Igari, A.T., Martensen, A.C., Metzger, J.P., 2014. Using ecological thresholds to evaluate the costs and benefits of set-asides in a biodiversity hotspot. Science 345, 1041–1045. doi:10.1126/science.1255768
Barragán, F., Moreno, C.E., Escobar, F., Halffter, G., Navarrete, D., 2011. Negative impacts of human land use on dung beetle functional diversity. PLoS One 6, e17976. doi:10.1371/journal.pone.0017976
Barber, J., 2007. Biological solar energy. Philos. Trans. R. Soc. A Math. Phys. Eng. Sci. 365, 1007–1023. doi:10.1098/rsta.2006.1962
Bello, C., Galetti, M., Pizo., Magnago, L.F.S., Rocha, M.F., Peres, C.A., Ovaskainen, O., Jordano, P., 2015. Deufanation affects carbon storage in
tropical forests. Science 1, 1–11. doi: 10.1126/sciadv.1501105
Boscolo, D., Metzger, J.P., 2011. Isolation determines patterns of species presence in highly fragmented landscapes. Ecography 34, 1018–1029. doi:10.1111/j.1600-0587.2011.06763.x
Burnham, K.P., Anderson, D.R., Huyvaert, K.P., 2011. AIC model selection and multimodel inference in behavioral ecology: some background, observations, and comparisons. Behav. Ecol. Sociobiol. 65, 23–35. doi:10.1007/s00265-010-1029-6
Cadotte, M.W., Carscadden, K., Mirotchnick, N., 2011. Beyond species: Functional diversity and the maintenance of ecological processes and services. J. Appl. Ecol. 48, 1079–1087. doi:10.1111/j.1365-2664.2011.02048.x
Cardinale, B.J., Duffy, J.E., Gonzalez, A., Hooper, D.U., Perrings, C., Venail, P., Narwani, A., Mace, G.M., Tilman, D., Wardle, D.A., Kinzig, A.P., Daily, G.C., Loreau, M., Grace, J.B., Larigauderie, A., Srivastava, D.S., Naeem, S., 2012. Biodiversity loss and its impact on humanity. Nature 486, 59–67. doi:10.1038/nature11148
59
Chazdon, R.L., Peres, C.A., Dent, D., Sheil, D., Lugo, A.E., Lamb, D., Stork, N.E., Miller, S.E., 2009. The potential for species conservation in tropical secondary forests. Conserv. Biol. 23, 1406–1417. doi:10.1111/j.1523-1739.2009.01338.x
Chiarello, A.G., 1999. Effects of fragmentation of the Atlantic forest on mammal communities in southeastern Brazil. Biol. Conserv. 89, 71–82. doi:10.1016/S0006-3207(98)00130-X
Cisneros, L.M., Fagan, M.E., Willig, M.R., 2015. Effects of human-modified landscapes on taxonomic, functional and phylogenetic dimensions of bat biodiversity. Divers. Distrib. 21, 523–533. doi:10.1111/ddi.12277
Coombe, G., 1976. The development of fleshy fruits. Annu. Rev. Plant Biol. 27,
207–228. doi: 10.1146/annurev.pp.27.060176.001231
De Coster, G., Banks-Leite, C., Metzger, J.P., 2015. Atlantic forest bird communities provide different but not fewer functions after habitat loss. Proc. R. Soc. B Biol. Sci. 282, 20142844. doi:10.1098/rspb.2014.2844
Duque, Á., Phillips, J.F., Von Hildebrand, P., Posada, C.A., Prieto, A., Rudas, A., Suescún, M., Stevenson, P., 2009. Distance decay of tree species similarity in protected areas on terra firme forests in Colombian Amazonia. Biotropica 41, 599–607. doi:10.1111/j.1744-7429.2009.00516.x
Ewers, R.M., Didham, R.K., 2006. Confounding factors in the detection of species responses to habitat fragmentation. Biol. Rev. Camb. Philos. Soc. 81, 117–42. doi:10.1017/S1464793105006949
Edwards, F.A., Edwards, D.P., Hamer, K.C., Davies, R.G., 2013. Impacts of logging and conversion of rainforest to oil palm on the functional diversity of birds in Sundaland. Ibis 155, 313–326. doi:10.1111/ibi.12027
Garay, I., Rizzini G.M., 2004. A Floresta Atlântica de Tabuleiros: Diversidade
Funcional da Cobertura Arbórea. Petrópolis, Rio de Janeiro, 255 p.
Gibbs, H.K., Ruesch, A.S., Achard, F., Clayton, M.K., Holmgren, P., Ramankutty, N., Foley, J.A., 2010. Tropical forests were the primary sources of new agricultural land in the 1980s and 1990s. Proc. Natl. Acad. Sci. U.S.A. 107, 16732–16737. doi:10.1073/pnas.0910275107
Gilroy, J.J., Uribe, C.A.M., Haugaasen, T., Edwards, D.P., 2015. Effect of scale on trait predictors of species responses to agriculture. Conserv. Biol. 29, 463–472. doi:10.1111/cobi.12422
Girão, L.C., Lopes, A.V., Tabarelli, M., Bruna, E.M., 2007. Changes in tree reproductive traits reduce functional diversity in a fragmented Atlantic forest landscape. PLoS ONE 2, e908. doi:10.1371/journal.pone.0000908
Gotelli, N.J., 2000. Null model analysis of species co-occurrence patterns. Ecology 81, 2606–2621. doi.org/10.1890/0012-9658(2000)081[2606:NMAOSC]2.0.CO;2
Gouvêa, J.B.S. (1969) Contribuição à geomorfologia do sul da Bahia. Área dos baixos cursos dos rios Pardo e Jequitinhonha. Comunicação Técnica do Cenntro de Pesquisas do CACAU/Comissão Executiva de Planejamento da Lavoura Cacaueira, Itabuna, 35, 111 p.
60
Haddad, N.M., Brudvig, L.A., Clobert, J., Davies, K.F., Gonzalez, A., Holt, R.D., Lovejoy, T.E., Sexton, J.O., Austin, M.P., Collins, C.D., Cook, W.M., Damschen, E.I., Ewers, R.M., Foster, B.L., Jenkins, C.N., King, A.J., Laurance, W.F., Levey, D.J., Margules, C.R., Melbourne, B.A., Nicholls, A.O., Orrock, J.L., Song, D.-X., Townshend, J.R., 2015. Habitat fragmentation and its lasting impact on Earth’s ecosystems. Sci. Adv. 1, e1500052–e1500052. doi:10.1126/sciadv.1500052
Hansen, M.C., Potapov, P. V, Moore, R., Hancher, M., Turubanova, S. A, Tyukavina, A., Thau, D., Stehman, S. V, Goetz, S.J., Loveland, T.R., Kommareddy, A., Egorov, A., Chini, L., Justice, C.O., Townshend, J.R.G., 2013. High-resolution global maps of 21st-century forest cover change. Science 342, 850–853. doi:10.1126/science.1244693
Hill, J.L., Curran, P.J., 2003. Area , shape and isolation of tropical forest fragments : effects on tree species diversity and implications for conservation. J. of Biogeo. 30, 1391–1403. doi:10.1016/j.biocon.2008.04.013
Hooper, D.U., Chapin, F.S., Ewel, J.J., Hector, A., Inchausti, P., Lavorel, S., Lawton, J.H., Lodge, D.M., Loreau, M., Naeem, S., Schmid, B., Setälä, H., Symstad, A.J., Vandermeer, J., Wardle, D.A., 2005. Effects of biodiversity on ecosystem functioning: a consensus of current knowledge. Ecol. Monogr. 75, 3–35. doi:10.1890/04-0922
Hubbell, S., 2001. The unified neutral theoryy of biodiversity and biogeography. Princeton University Press, Princeton, New Jersey, USA, 375 p.
IBGE (Fundação Instituto Brasileiro de Geografia e Estatística, 1987. Rio Doce: geologia, geomorfologia, pedologia, vegetação e uso potencial da terra. Projeto Radambrasil, Volume SF.34, Rio de Janeiro.
Isaac, N.J.B., Turvey, S.T., Collen, B., Waterman, C., Baillie, J.E.M., 2007. Mammals on the EDGE: Conservation Priorities Based on Threat and Phylogeny. PLoS One 2, e296. doi:10.1371/journal.pone.0000296
Kumar, A., Ram, J., 2005. Anthropogenic disturbances and plant biodiversity in forests of Uttaranchal , central Himalaya. Biodivers. Conserv. 14, 309–331. doi:10.1007/s10531-004-5047-4
Laliberté, E., Legendre, P., 2010. A distance-based framework for measuring functional diversity from multiple traits. Ecology 91, 299–305. doi:10.1890/08-2244.1
Laliberté, E., Legendre, P., B. Shipley., 2015. FD: measuring functional diversity from multiple traits, and other tools for functional ecology. R package version 1.0-12.
Laurance, W.F., Laurance, S.G., Delamonica, P., 1998. Tropical forest fragmentation and greenhouse gas emissions. For. Ecol. Manag. 110, 173–180. doi:10.1016/S0378-1127(98)00291-6
Laurance, W.F., Lovejoy, T.E., Vasconcelos, H.L., Bruna, E.M., Didham, R.K., Stouffer, P.C., Gascon, C., Bierregaard, R.O., Laurance, S.G., Sampaio, E., 2002. Ecosystem decay of Amazonian forest fragments: A 22-year investigation. Conserv. Biol. 16, 605–618. doi:10.1046/j.1523-1739.2002.01025.x
61
Laurance, W.F., 2004. Forest-climate interactions in fragmented tropical landscapes. Philos. Trans. R. Soc. B Biol. Sci. 359, 345–352. doi:10.1098/rstb.2003.1430
Laurance, W.F., Nascimento, H.E.M., Laurance, S.G., Andrade, A., Ribeiro, J.E.L.S., Giraldo, J.P., Lovejoy, T.E., Condit, R., Chave, J., Harms, K.E., D’Angelo, S., 2006. Rapid decay of tree-community composition in Amazonian forest fragments. Proc. Natl. Acad. Sci. U.S.A. 103, 19010–19014. doi:10.1073/pnas.0609048103
Laurance, W.F., Nascimento, H.E.M., Laurance, S.G., Andrade, A., Ewers, R.M., Harms, K.E., Luizão, R.C.C., Ribeiro, J.E., 2007. Habitat fragmentation, variable edge effects, and the landscape-divergence hypothesis. PLoS One 2, e1017. doi:10.1371/journal.pone.0001017
Laurance, W.F., Camargo, J.L.C., Luizão, R.C.C., Laurance, S.G., Pimm, S.L., Bruna, E.M., Stouffer, P.C., Bruce Williamson, G., Benítez-Malvido, J., Vasconcelos, H.L., 2011. The fate of Amazonian forest fragments: A 32-year investigation. Biol. Conserv. 144, 56–67. doi:10.1016/j.biocon.2010.09.021
Lewis, S.L., Edwards, D.P., Galbraith, D., 2015 Increasing human dominance of tropical forests. Science, 349, 827-832. doi: 10.1126/science.aaa9932
Lopes, A.V., Girão, L.C., Santos, B.A., Peres, C.A., Tabarelli, M., 2009. Long-term erosion of tree reproductive trait diversity in edge-dominated Atlantic forest fragments. Biol. Conserv. 142, 1154–1165. doi:10.1016/j.biocon.2009.01.007
McGarial, K., Cushman, S.A., Ene, E., 2012. FRAGSTATS v4: spatial pattern analysis program for categorical and continuous maps. University of Massachusetts, Amherst, MA, USA. Available at: USA. Available at: http://goo.gl/bkqYH2.
Magnago, L.F.S., Edwards, D.P., Edwards, F.A., Magrach, A., Martins, S. V., Laurance, W.F., 2014. Functional attributes change but functional richness is unchanged after fragmentation of Brazilian Atlantic forests. J. Ecol. 102, 475–485. doi:10.1111/1365-2745.12206
Magnago, L.F.S., Rocha, M.F., Meyer, L., Martins, S.V., Meira-Neto, J.A.A., 2015a. Microclimatic conditions at forest edges have significant impacts on vegetation structure in large Atlantic forest fragments. Biodivers. Conserv. 9, 2305-2318. doi:10.1007/s10531-015-0961-1
Magnago, L.F.S., Magrach, A., Laurance, W.F., Martins, S. V., Meira-Neto, J.A. a., Simonelli, M., Edwards, D.P., 2015b. Would protecting tropical forest fragments provide carbon and biodiversity co-benefits under redd+? Glob. Chang. Biol. 44, 21, 3455–3468.doi:10.1111/gcb.12937
Matos, F.A.R., Magnago, L.F.S., Gastauer, M., Carreiras, J.M.B., Simonelli, M., Meira-Neto, J.A.A., Edwards, D.P. Effects of landscape configuration, composition and edges on phylogenetic diversity of trees in a highly fragmented tropical forest. J. Ecol, in review
Moran, C., Catterall, C.P., 2010. Can Functional Traits Predict Ecological Interactions? A Case Study Using Rain forest Frugivores and Plants in Australia. Biotropica 42, 318–326. doi:10.1111/j.1744-7429.2009.00594.x
62
Mouchet, M.A., Villeger, S., Manson, N.W.H., Mouillot, D., 2010. Functional diversity measures: an overview of their redundancy and their ability to discriminate community assembly rules. Funct. Ecol., 24, 867–876. doi: 10.1111/j.1365-2435.2010.01695.x
Morris, R.J., 2010. Anthropogenic impacts on tropical forest biodiversity: a network structure and ecosystem functioning perspective. Philos. Trans. R. Soc. B Biol. Sci. 365, 3709–3718. doi:10.1098/rstb.2010.0273
Myers, N., Mittermeier, R.A., Mittermeier, C.G., Fonseca, G.A.B., Kent, J., 2000. Biodiversity hotspots for conservation priorities. Nature 403, 853–8. doi:10.1038/35002501
O’Gorman, E.J., Yearsley, J.M., Crowe, T.P., Emmerson, M.C., Jacob, U., Petchey, O.L., 2011. Loss of functionally unique species may gradually undermine ecosystems. Proc. R. Soc. B Biol. Sci. 278, 1886–1893. doi:10.1098/rspb.2010.2036
Pardini, R., Bueno, A.D.A., Gardner, T. a, Prado, P.I., Metzger, J.P., 2010. Beyond the fragmentation threshold hypothesis: regime shifts in biodiversity across fragmented landscapes. PLoS One 5, e1366. doi:10.1371/journal.pone.0013666
Pavoine, S., Vallet, J., Gachet, S., 2009. for improving the measurement of functional diversity. Oikos 118, 391–402. doi:10.1111/j.1600-0706.2009.16668.x
Pavoine, S., Bonsall, M.B., 2011. Measuring biodiversity to explain community assembly : a unified approach. Biol. Rev. 2, 792–812. doi:10.1111/j.1469-185X.2010.00171.x
Peixoto, A.L., Silva, I.M. (1997) Tabuleiro Forests of Northern Espirito Santo, Southeastern Brasil. Centres of Plant Diversity - A guide and Strategy for Their Conservation Volume 3 (eds S.D. Davis & V.H. Heywood), 369-372. WWF and IUCN publisher, Cambridge.
Peres, C.A., Emilio, T., Schietti, J., Desmouliere, S.J.M., Levi, T., 2016. Dispersal limiation induces long-term biomass collapse in overhunted Amazonian forests. Proc. Natl. Acad. Sci. U.S.A. doi/10.1073/pnas.1516525113
Pérez-Harguindeguy, N., Díaz, S., Garnier, E., Lavorel, S., Poorter, H., Jaureguiberry, P., Bret-Harte, M.S., Cornwell, W.K., Craine, J.M., Gurvich, D.E., Urcelay, C., Veneklaas, E.J., Reich, P.B., Poorter, L., Wright, I.J., Ray, P., Enrico, L., Pausas, J.G., De Vos, a. C., Buchmann, N., Funes, G., Quétier, F., Hodgson, J.G., Thompson, K., Morgan, H.D., Ter Steege, H., Van Der Heijden, M.G. a, Sack, L., Blonder, B., Poschlod, P., Vaieretti, M.V., Conti, G., Staver, a. C., Aquino, S., Cornelissen, J.H.C., 2013. New handbook for standardised measurement of plant functional traits worldwide. Aust. J. Bot. 61, 167–234. doi:10.1071/BT12225
Petchey, O.L., Hector, A., Gaston, K.J., 2004. How do different measures of functional diversity perform? Ecology 85, 847–857. doi:10.1890/03-0226
Petchey, O.L., Gaston, K.J., 2006. Functional diversity: back to basics and looking forward. Ecol. Lett. 9, 741–758. doi:10.1111/j.1461-0248.2006.00924.x
63
Prugh, L.R., Hodges, K.E., Sinclair, A.R.E., Brashares, J.S., 2008. Effect of habitat area and isolation on fragmented animal populations. Proc. Natl. Acad. Sci. U.S.A. 105, 20770–5. doi:10.1073/pnas.0806080105
Purvis, A., Agapow, P.-M., Gittleman, J.L., Mace, G.M., 2000. Nonrandom Extinction and the Loss of Evolutionary History. Science 288, 328–330. doi:10.1126/science.288.5464.328
Pütz, S., Groeneveld, J., Henle, K., Knogge, C., Martensen, A.C., Metz, M., Metzger, J.P., Ribeiro, M.C., de Paula, M.D., Huth, A., 2014. Long-term carbon loss in fragmented Neotropical forests. Nat. Commun. 5, 5037. doi:10.1038/ncomms6037
R Development Core Team (2015) R: A language and Environment for Statistical Computing. R Foundation for Statistical Computing, Vienna, Austria.
Ribeiro, M.C., Metzger, J.P., Martensen, A.C., Ponzoni, F.J., Hirota, M.M., 2009. The Brazilian Atlantic Forest: How much is left, and how is the remaining forest distributed? Implications for conservation. Biol. Conserv. 142, 1141–1153. doi:10.1016/j.biocon.2009.02.021
Rolim, S.G., Chiarello, A.G., 2004. Slow death of Atlantic forest trees in cocoa agroforestry in southeastern Brazil. Biodivers. Conserv. 13, 2679–2694. doi:10.1007/s10531-004-2142-5
Rolim, S.G., Jesus, R.M., Nascimento, H.E.M., do Couto, H.T.Z., Chambers, J.Q., 2005. Biomass change in an Atlantic tropical moist forest: the ENSO effect in permanent sample plots over a 22-year period. Oecologia 142, 238–246. doi:10.1007/s00442-004-1717-x
Santos, B.A., Arroyo-Rodríguez, V., Moreno, C.E., Tabarelli, M., 2010. Edge-related loss of tree phylogenetic diversity in the severely fragmented Brazilian Atlantic forest. PLoS ONE 5, e12625. doi:10.1371/journal.pone.0012625
Sfair, J.C., Arroyo-Rodríguez, V., Santos, B.A., Tabarelli, M., 2016. Taxonomic and functional divergence of tree assemblages in a fragmennted tropical forest. Ecol. Appl. in press.
Schuldt, A., Bruelheide, H., Durka, W., Michalski, S.G., Purschke, O., 2014. Tree diversity promotes functional dissimilarity and maintains functional richness despite species loss in predator assemblages. Oecologia 174, 533–543. doi:10.1007/s00442-013-2790-9
SOS Mata Altântica and Instituto Nacional de Pesquisas Espaciais, 2015. Altas dos Remanescentes Florestais e Ecossistemas Associados no Domínio da Mata Altântica, São Paulo, SP, 60 p.
Tilman, D., Knops, J., Wedin, D., Reich, P., Ritchie, M., Siemann, E., 1997. The influence of functional diversity and composition on ecosystem processes. Science 277, 1300–1302. doi:10.1126/science.277.5330.1300
Thuiller, W., Pironon, S., Psomas, A., Barbet-massin, M., Pearman, P.B., Renaud, J., Zupan, L., Zimmermann, N.E., 2014. The European functional tree of bird life in the face of global change. Nature 470, 531-34. doi:10.1038/ncomms4118
64
Turner, I.M. 1996. Species loss in fragments of tropical rain forest: a review of the evidence. J. Appl. Ecol., 33, 200–209. doi: 10.2307/2404743
Vamosi, J.C., Wilson, J.R.U., 2008. Nonrandom extinction leads to elevated loss of angiosperm evolutionary history. Ecol. Lett. 11, 1047–1053. doi:10.1111/j.1461-0248.2008.01215.x
Villéger, S., Mason, N.W.H., Mouillot, D., 2008. New multidimensional functional diversity indices for a multifaceted framework in functional ecology. Ecology 89, 2290–2301. doi:10.1890/07-1206.1
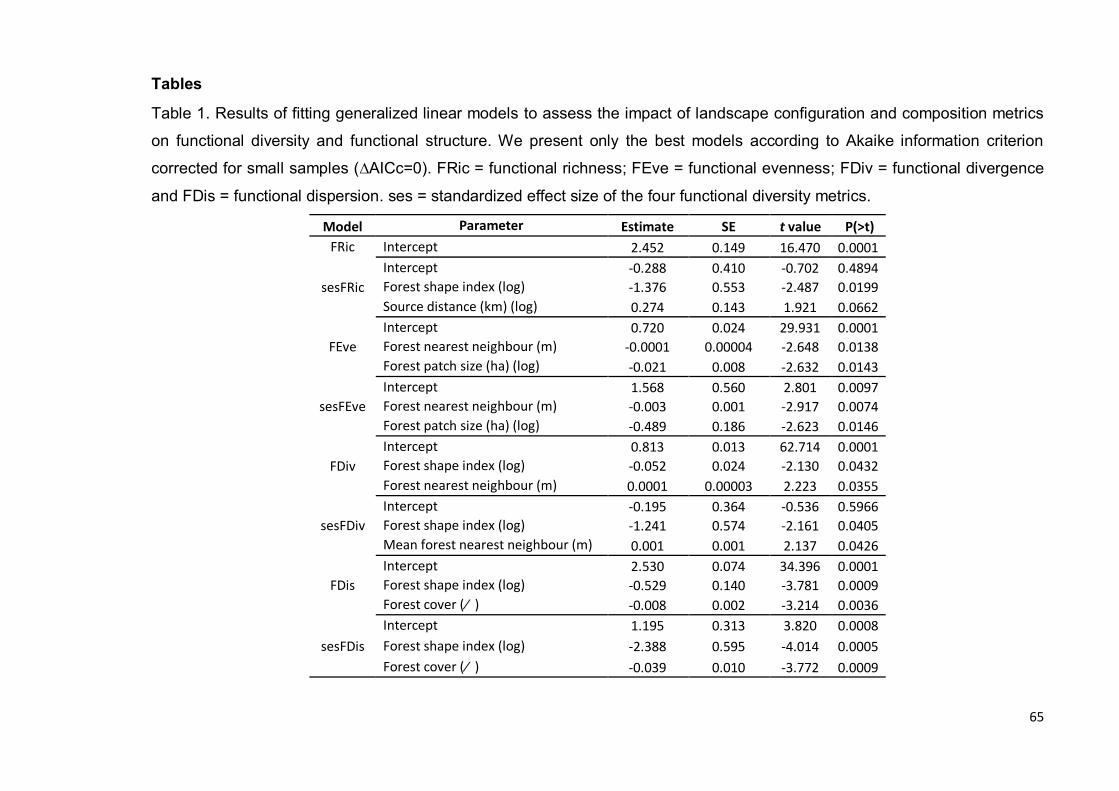
65
Tables
Table 1. Results of fitting generalized linear models to assess the impact of landscape configuration and composition metrics
on functional diversity and functional structure. We present only the best models according to Akaike information criterion
corrected for small samples (∆AICc=0). FRic = functional richness; FEve = functional evenness; FDiv = functional divergence
and FDis = functional dispersion. ses = standardized effect size of the four functional diversity metrics.
Model Parameter Estimate SE t value P(>t)
FRic Intercept 2.452 0.149 16.470 0.0001
sesFRic
Intercept -0.288 0.410 -0.702 0.4894
Forest shape index (log) -1.376 0.553 -2.487 0.0199
Source distance (km) (log) 0.274 0.143 1.921 0.0662
FEve
Intercept 0.720 0.024 29.931 0.0001
Forest nearest neighbour (m) -0.0001 0.00004 -2.648 0.0138
Forest patch size (ha) (log) -0.021 0.008 -2.632 0.0143
sesFEve
Intercept 1.568 0.560 2.801 0.0097
Forest nearest neighbour (m) -0.003 0.001 -2.917 0.0074
Forest patch size (ha) (log) -0.489 0.186 -2.623 0.0146
FDiv
Intercept 0.813 0.013 62.714 0.0001
Forest shape index (log) -0.052 0.024 -2.130 0.0432
Forest nearest neighbour (m) 0.0001 0.00003 2.223 0.0355
sesFDiv
Intercept -0.195 0.364 -0.536 0.5966
Forest shape index (log) -1.241 0.574 -2.161 0.0405
Mean forest nearest neighbour (m) 0.001 0.001 2.137 0.0426
FDis
Intercept 2.530 0.074 34.396 0.0001
Forest shape index (log) -0.529 0.140 -3.781 0.0009
Forest cover (% ) -0.008 0.002 -3.214 0.0036
sesFDis
Intercept 1.195 0.313 3.820 0.0008
Forest shape index (log) -2.388 0.595 -4.014 0.0005
Forest cover (% ) -0.039 0.010 -3.772 0.0009
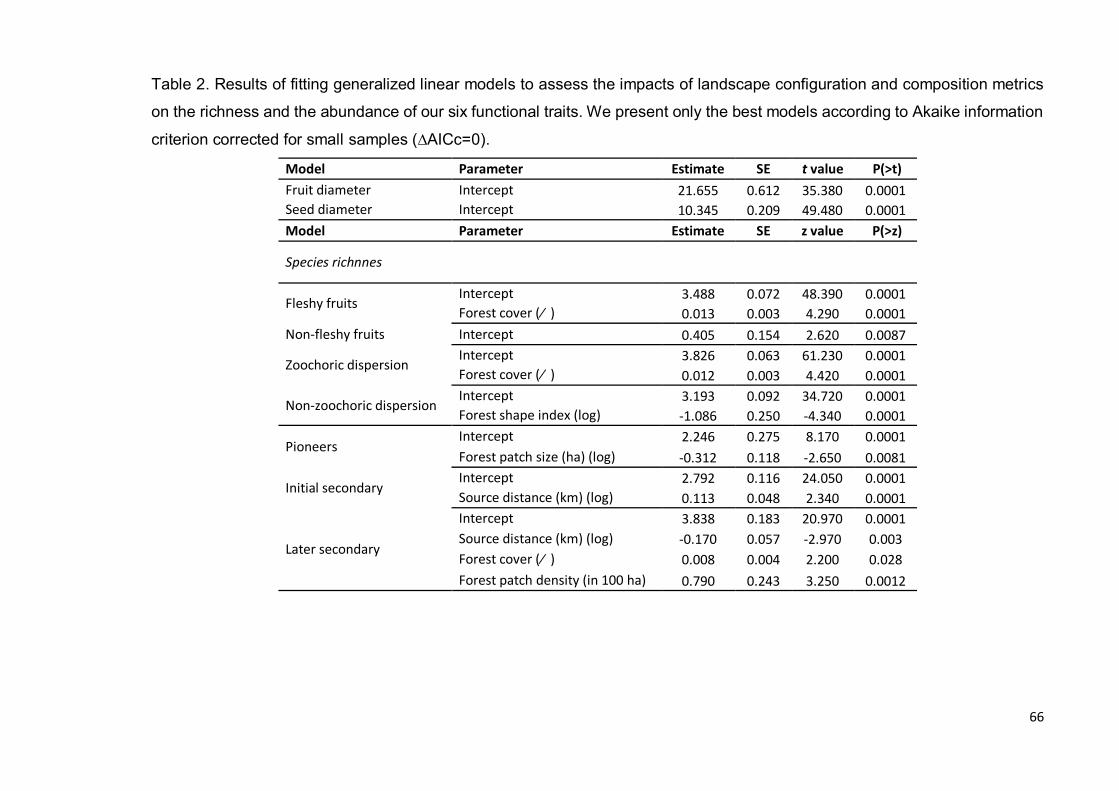
66
Table 2. Results of fitting generalized linear models to assess the impacts of landscape configuration and composition metrics
on the richness and the abundance of our six functional traits. We present only the best models according to Akaike information
criterion corrected for small samples (∆AICc=0).
Model Parameter Estimate SE t value P(>t)
Fruit diameter Intercept 21.655 0.612 35.380 0.0001
Seed diameter Intercept 10.345 0.209 49.480 0.0001
Model Parameter Estimate SE z value P(>z)
Species richnnes
Fleshy fruits Intercept 3.488 0.072 48.390 0.0001
Forest cover (% ) 0.013 0.003 4.290 0.0001
Non-fleshy fruits Intercept 0.405 0.154 2.620 0.0087
Zoochoric dispersion Intercept 3.826 0.063 61.230 0.0001
Forest cover (% ) 0.012 0.003 4.420 0.0001
Non-zoochoric dispersion Intercept 3.193 0.092 34.720 0.0001
Forest shape index (log) -1.086 0.250 -4.340 0.0001
Pioneers Intercept 2.246 0.275 8.170 0.0001
Forest patch size (ha) (log) -0.312 0.118 -2.650 0.0081
Initial secondary Intercept 2.792 0.116 24.050 0.0001
Source distance (km) (log) 0.113 0.048 2.340 0.0001
Later secondary
Intercept 3.838 0.183 20.970 0.0001
Source distance (km) (log) -0.170 0.057 -2.970 0.003
Forest cover (% ) 0.008 0.004 2.200 0.028
Forest patch density (in 100 ha) 0.790 0.243 3.250 0.0012
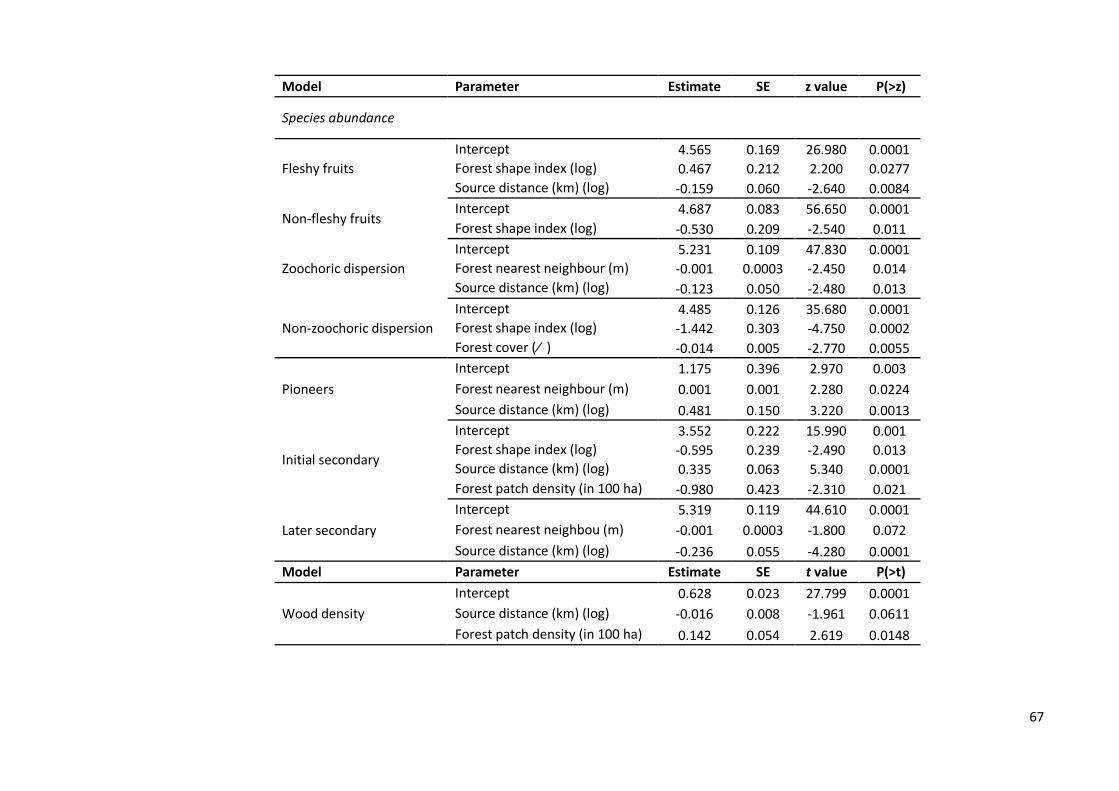
67
Model Parameter Estimate SE z value P(>z)
Species abundance
Fleshy fruits
Intercept 4.565 0.169 26.980 0.0001
Forest shape index (log) 0.467 0.212 2.200 0.0277
Source distance (km) (log) -0.159 0.060 -2.640 0.0084
Non-fleshy fruits Intercept 4.687 0.083 56.650 0.0001
Forest shape index (log) -0.530 0.209 -2.540 0.011
Zoochoric dispersion
Intercept 5.231 0.109 47.830 0.0001
Forest nearest neighbour (m) -0.001 0.0003 -2.450 0.014
Source distance (km) (log) -0.123 0.050 -2.480 0.013
Non-zoochoric dispersion
Intercept 4.485 0.126 35.680 0.0001
Forest shape index (log) -1.442 0.303 -4.750 0.0002
Forest cover (% ) -0.014 0.005 -2.770 0.0055
Pioneers
Intercept 1.175 0.396 2.970 0.003
Forest nearest neighbour (m) 0.001 0.001 2.280 0.0224
Source distance (km) (log) 0.481 0.150 3.220 0.0013
Initial secondary
Intercept 3.552 0.222 15.990 0.001
Forest shape index (log) -0.595 0.239 -2.490 0.013
Source distance (km) (log) 0.335 0.063 5.340 0.0001
Forest patch density (in 100 ha) -0.980 0.423 -2.310 0.021
Later secondary
Intercept 5.319 0.119 44.610 0.0001
Forest nearest neighbou (m) -0.001 0.0003 -1.800 0.072
Source distance (km) (log) -0.236 0.055 -4.280 0.0001
Model Parameter Estimate SE t value P(>t)
Wood density
Intercept 0.628 0.023 27.799 0.0001
Source distance (km) (log) -0.016 0.008 -1.961 0.0611
Forest patch density (in 100 ha) 0.142 0.054 2.619 0.0148
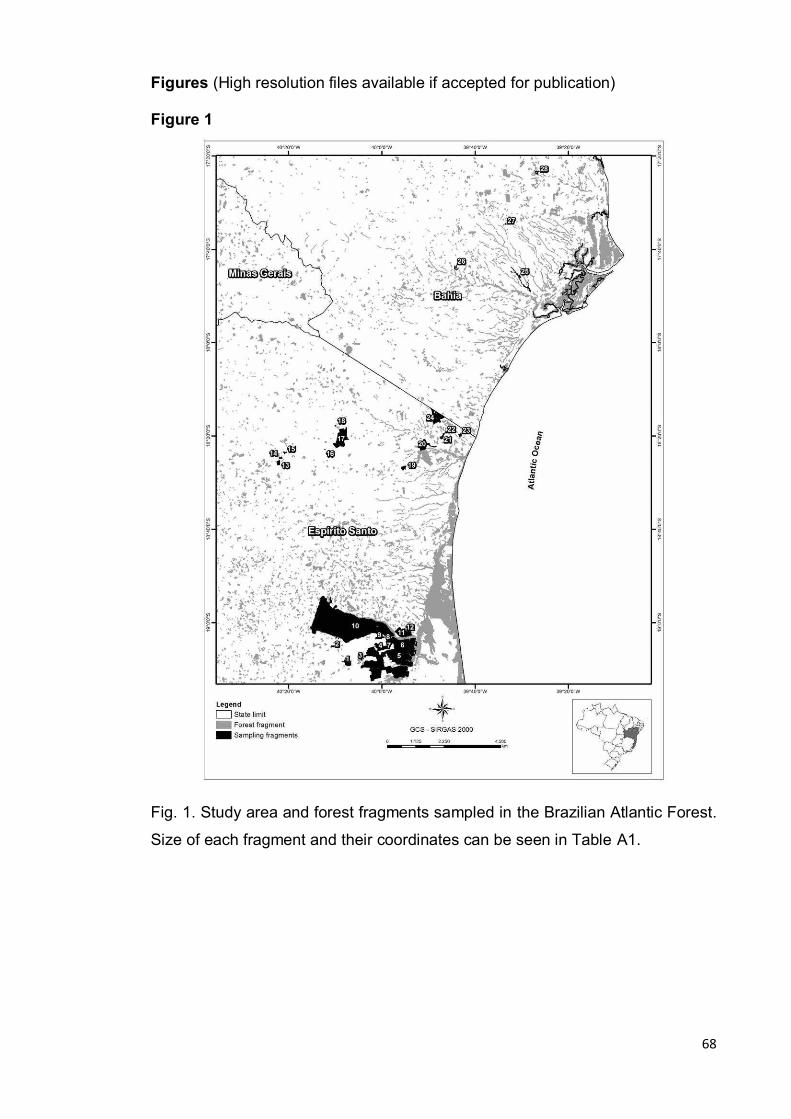
68
Figures (High resolution files available if accepted for publication)
Figure 1
Fig. 1. Study area and forest fragments sampled in the Brazilian Atlantic Forest.
Size of each fragment and their coordinates can be seen in Table A1.
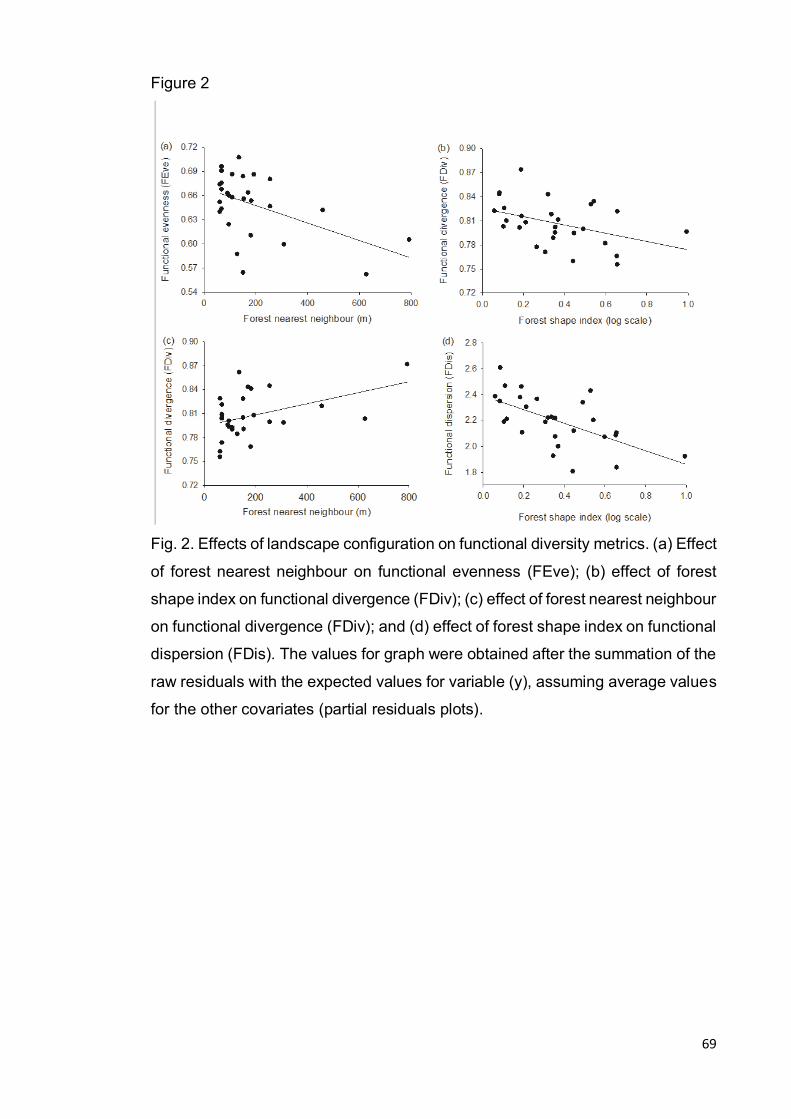
69
Figure 2
Fig. 2. Effects of landscape configuration on functional diversity metrics. (a) Effect
of forest nearest neighbour on functional evenness (FEve); (b) effect of forest
shape index on functional divergence (FDiv); (c) effect of forest nearest neighbour
on functional divergence (FDiv); and (d) effect of forest shape index on functional
dispersion (FDis). The values for graph were obtained after the summation of the
raw residuals with the expected values for variable (y), assuming average values
for the other covariates (partial residuals plots).
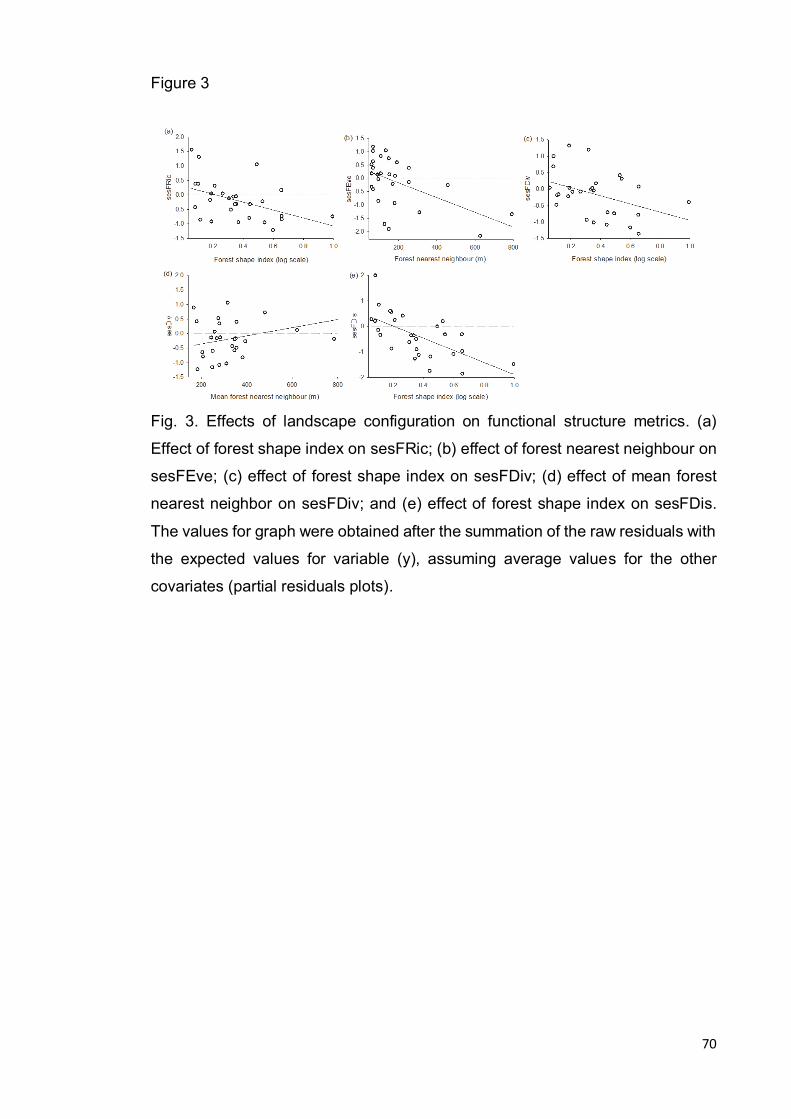
70
Figure 3
Fig. 3. Effects of landscape configuration on functional structure metrics. (a)
Effect of forest shape index on sesFRic; (b) effect of forest nearest neighbour on
sesFEve; (c) effect of forest shape index on sesFDiv; (d) effect of mean forest
nearest neighbor on sesFDiv; and (e) effect of forest shape index on sesFDis.
The values for graph were obtained after the summation of the raw residuals with
the expected values for variable (y), assuming average values for the other
covariates (partial residuals plots).

71
Figure 4
Fig. 4. Effects of landscape composition on functional diversity and functional
structure metrics. (a) Effect of forest patch size on functional evenness (FEve);
(b) effect of forest cover on functional dispersion (FDis); (c) effect of forest patch
size on sesFEve; and (d) effect of forest cover on sesFDis. The values for graph
were obtained after the summation of the raw residuals with the expected values
for variable (y), assuming average values for the other covariates (partial
residuals plots).
72
V. CAPÍTULO III
Does natural forest regeneration offer important carbon-biodiversity co-
benefits in a highly fragmented landscape?
Abstract Tropical forests store large amounts of carbon and have high biodiversity, but
they are being degraded at alarming rates. Given the rapid conversion of
rainforest and associated release of carbon dioxide, and the massive shortfall in
funding for biodiversity conservation, we urgently need to seek mechanisms that
can simultaneously stem both carbon and biodiversity losses. One potential is for
carbon-based payments for ecosystem services (e.g., United Nations, Reducing
Emissions from Deforestation and Forest Degradation, REDD+) to protect
biodiversity as a co-benefit for free. Here, we investigated whether carbon
enhancements via natural forest regeneration offer such co-benefits focusing for
the first time in the highly fragmented Brazilian Atlantic forest and on tree
diversity. After four decades of regeneration, patches of secondary forest that
were isolated from mature forest had recovered 25% of the carbon stocks of a
primary forest. Over this period, secondary forest recovered high floristic similarity
with primary forests, high richness and abundance of endemic and IUCN red list
species, and resulting from this recovery of species richness, high phylogenetic
and functional diversity. There were positive relationships between carbon stock
and tree diversity recovery, suggesting that there is potential for co-benefits under
REDD+. This indicates that more emphasis should be placed on the regeneration
of secondary tropical forests by carbon-based funding initiatives that even
isolated patches of secondary forest could help to mitigate the biodiversity
extinction crisis by recovering important species and improving landscape
connectivity.
Key-words: biodiversity value, biomass, ecosystems services, forest
management, fragment isolation, REDD+, threatened species, endemic species
73
Introduction Tropical forests account for ~32% of global primary production (Field et
al., 1998), harboring the largest above-ground carbon stocks (Lewis, 2006;
Laurance, 2008) and highest levels of biodiversity (Gardner, 2010). However,
these regions are increasingly human-dominated (Lewis, Edwards & Galbraith,
2015), having experienced dramatic degradation via selective logging and fire,
deforestation for agriculture (more than 1.5 million km2 between 1980 and 2012;
Gibbs et al., 2010; Hansen et al., 2013), and resulting fragmentation of remaining
forests (Haddad et al., 2015). Combined, these land-use driving climate change,
increasing anthropogenic carbon emissions (Fearnside & Laurance, 2004;
Bonan, 2008; Van der Werf, 2009), and causing massive loss of global
biodiversity (Morris, 2010; Ellis et al., 2010; Pimm et al., 2014).
In addition to the loss of carbon stocks and biodiversity via land-use
change, resulting increases in emissions of carbon dioxide—second only to the
burning of fossil fuels as the key emitter of greenhouse gases (Berenguer et al.,
2014; Pütz et al., 2014)—have the potential to change irreversibly the global
climate. Greenhouse gas emissions thus exacerbate the current global
biodiversity crisis via temperature increases, severe heatwaves, and severe
droughts (Herrera-Montes & Brokaw, 2010; Cortés-Gómez et al., 201; Scheffers
et al., 201). Because the financial resources available to tackle climate change
and biodiversity loss are limited, there is an urgent need to identify actions that
simultaneously address both issues (Miles & Kapos, 2008; McCarthy et al.,
2012). One emerging potential is for carbon-based payments for ecosystem
services—such as the United Nations, Reducing Emissions from Deforestation
and Forest Degradation (REDD+) mechanism, with the ‘+’ including payments for
enhancements of forest carbon stocks—to simultaneously protect biodiversity as
a free co-benefit of carbon protection.
For REDD+ to offer co-benefits, we must identify carbon-saving activities
within locations that offer a strong positive congruence between carbon stocks
and biodiversity, and to direct investment to such locations. Most work has thus
far focused on the potential for co-benefits via preventing deforestation (Miles &
Kapos, 2008; Venter et al., 2009; (Phelps, Webb & Adams 2012) and associated
impacts within forest fragments (Magnago al., 2015). Given severe losses of
species richness, functional diversity and phylogenetic diversity following
conversion (for examples, Gibson et al., 2011; Edwards et al., 2013 Ibis;
74
Magnago et al., 2014, Santos et al., 2010; Andrade et al., 2015; Cisneros et al.,
2015; Edwards et al. 2015), potential co-benefits are often clear. Another
important potential is for natural regeneration of secondary forest to recover the
loss of carbon stocks, forest cover, and biodiversity, and ultimately to reverse
drastic climate change by sequestering carbon from the atmosphere (Thomas et
al., 2004; Poorter et al., 2016).
Assessing above-ground biomass (AGB) recovery of lowland Neotropical
secondary forests, Poorter et al., (2016) demonstrated that after 20 years since
land abandonment, the carbon-absorption rate in secondary forests was 11 times
the uptake rate of old-growth forests, and that AGB stocks take a median of 66
years to recover 90% of old-growth AGB levels. In the Tropical Andes, after 30
years of secondary succession approximately half of old-growth AGB had been
restored (Gilroy et al., 2015). Within secondary forests, there can also be
substantial recovery of ant, bird, dung beetle, butterfly and bat diversity, amongst
others (Barlow et al., 2007; Chazdon et al., 2008; Bihn et al., 2008; Gilroy et al,
2014; Hernández-Ordóñez, Urbina-Cardona & Martínez Ramos, 2015). This
suggests that important carbon and biodiversity co-benefits could accrue if
REDD+ is used to enhance the rate with which marginal farmland is abandoned
and thus the natural recovery of secondary forests. However, to our knowledge,
only two studies have formally quantified the rate of carbon and biodiversity
recovery and thus accrual of co-benefits, revealing strong positive links between
the amount of AGB and bird, dung beetle, and amphibian recovery in the Tropical
Andes (Gilroy et al., 2014; Basham et al. in revision).
Trees are critical for habitat structure (Boscolo & Metzger 2011; Pardini et
al. 2010; Magnago et al. 2014), carbon storage (Laurance 2004; Nascimento &
Laurance 2004; Magnago et al. 2015), as well as their high diversity (Banks-Leite
et al. 2014). A key question, therefore, is whether carbon enhancements under
REDD+ can offer carbon and tree diversity co-benefits. Recent studies evaluating
the effect of secondary forests on tree diversity demonstrate an increase in
species richness, functional diversity (Lohbeck et al., 2012), and changes in the
phylogenetic structure (Letcher, 2009). However, none considered the rate of
recovery of carbon and biodiversity, preventing a direct assessment of the
potential for co-benefits.
In this study, we focus on the question of whether secondary forest
regrowth offers carbon and tree diversity co-benefits in the threatened Brazilian
75
Atlantic forest (Myers et al., 2000). The Atlantic forest retains just 11% of its
original forest cover (Ribeiro et al., 2009), with natural regeneration of forest to
enlarge and reconnect patches frequently cited as a vital management technique
for reducing extinction risk and returning ecosystem functions and services to this
highly degraded region. We answer this question by sampling tree carbon and
diversity across a full landscape transition from cattle pasture through various
ages of secondary forest after abandonment, and we contrast the values of these
landscapes against primary forest controls.
Materials and methods
Study area
Our 340 km long study area was based in the state of Espírito Santo
(20°10'9.04"S and 40°13'47.63"W) to southern Bahia (17°15'41.00"S and
39°29'43.00"W), east Brazil (Fig. S1 and see Table S1 for details). Remaining
forests in the region are highly fragmented (Magnago et al., 2015), situated in a
landscape matrix of cattle pastures, and plantations of Eucalyptus spp., sugar
cane, coffee, and papaya (Rolim et al. 2005). These forest areas are included in
the Atlantic Forest domain (IBGE 1987; also termed Tableland forest, Rizzini
1979), typified by large flat areas rising slowly from 20 to 200 m a.s.l., and
according to the Brazilian vegetation classification are Lowland Rain Forest
(IBGE 1987).
Tree sampling locations
Fieldwork was conducted between January 2008 and January 2016
across the main habitat types (primary forest, secondary forest and cattle
pasture). Primary forest fragments ranged in area from 13 to 23,480 ha (see
Table S1), with no evidence of recent logging, although we cannot rule out the
occurrence of limited logging several decades ago.
The formation of secondary forests in tropical regions is strongly attributed
to expansion of the agricultural frontier for cattle pasture, plus associated logging
and mining (Gibbs et al., 2010; Hansen et al., 2013; Lewis, Edwards & Galbraith,
2015). We define secondary forests as those that had suffered significant
anthropogenic change, via severe logging, mining, roads, plus opening of glades
within the highly-degraded habitat for cattle grazing. Thus our secondary forests
76
were not entirely converted to pasture, but have regrown within a heavily
degraded matrix. These secondary forests differ from old-growth by visibly
altering forest structure, with smaller trees, lower canopy height, and infestation
of lianas (Chazdon et al., 2007; Dupuy, Leyequien & Lópes-Martínez, 2012;
Roeder, Holscher & Kossmann-Ferraz, 2012), making it possible to identify them
in the field.
In our study area, all 11 sampled secondary forest fragments ranged
between 10 and 346 ha in area with approximate time of regeneration since
recovery from intensive degradation of 18 to 46 years. All of our secondary forest
fragments were immersed in extensive areas of pasture cattle without
connectivity to primary fragments forest, with a great distance (18 to 29.4 km) to
large blocks of forest (≥1,000 hectares; see table S1 for details). The estimated
time of secondary succession is derived from data on two levels: (1) we use aerial
images taken annually starting in the years 1969 to 1971 at 3,800 meters altitude
and available from the Instituto Estadual de Meio Ambiente–IEMA
(http://www.meioambiente.es.gov.br) to determine the approximate year in which
the landscapes of the sampled secondary fragments began to be degraded and
isolated by large expanses of cattle pasture. Besides the intense removal of
wood, these secondary fragments were used as cattle resting areas, increasing
the intensity of disturbance (personal communication). (2) We use the Google
Earth Pro database to determine whether these fragments underwent a more
severe disturbance (i.e., clear-cutting of vegetation), or remained as observed in
the images provided by IEMA, until the year in which plots were allocated for this
study. Finally, as none of the sampled fragments have changed in shape (i.e.,
total vegetation cut), compared with reference images (i.e., IEMA), we subtract
the approximate year that these fragments were degraded and isolated in cattle
pasture areas by the year in which the plots were allocated in field to derive our
approximate time of secondary forest succession forest in years.
The distance of secondary forest patches (km) from large forest blocks
(herein ‘source distance’), which may act as sources of seeds and important
ecological processes (White et al., 2004; Kormann et al., 2016), was computed
with ArcGis (v 10.1) using as a base the vegetation map of Brazilian Atlantic forest
(SOS Mata Atlântica/INPE 2015), with a low value suggesting less isolation (see
Matos et al., in review). For full methodological details of calculating secondary
forest age and source distance, see supplementary methods (Text A2).
77
Finally, we sampled areas of active cattle pasture that were not abandoned
or in the early stages of regeneration. We focus on cattle farming because it
represents 35% of agricultural land and 22% of the area within the city limits of
13 urban centers in the two study states (Espírito Santo and Bahia; see table S2
for full details).
Tree sampling methods
Within each habitat type, we sampled one transect per forest patch or
cattle farm (except for the second largest fragment of primary forest [17,716 ha]
in which we sampled two transects separated by 4 km; see Fig. S1 and Table
S1). We thus have a dataset of 27 primary forest transects, 11 secondary forest
transects and 11 cattle pasture transects. On each transect, we sampled 10 plots
of 10 m x 10 m (0.1 ha) located at 20 m intervals along each transect, with the
plots positioned ≥200 m from the forest edge, totaling 270 plots (2.7 ha) in primary
forest, 150 plots (1.5 ha) in secondary forest and 120 plots (1.2 ha) in cattle
pasture.
Within each plot, we sampled all tree individuals living and rooted within
our plots with diameter at breast height (DBH; 1.30 meters above ground height)
≥4.8 cm. Individuals that straddled the plot edge were counted as being within
the plot if at least half of the trunk was inside the plot. For tree individuals that
were not identified at the site, we collected leaves and any reproductive parts,
these were then classified into morphospecies and subsequently identified by
morphological comparison in the Herbarium of Vale (CVRD) or by botanical
experts for their families. The botanical material collected in reproductive stage
was deposited in the Herbarium of the Federal University of Viçosa, Minas Gerais
(VIC) and CVRD.
Above-ground carbon stock
We estimate the amount of above-ground biomass (AGB) in each tree
individual, using Chave et al., (2005) equation for moist forest stands. We assume
that 50% of AGB of each individual is represented by carbon (Laurance et al.,
1997; Malhi et al., 2004; Chave et al., 2005; Paula et al., 2011; Lima et al., 2013;
Magnago et al., 2015).
Wood density in dry weight (g cm-3) was obtained from Global Wood
Density database (GWD) (available in: http://dx.doi.org/10.5061/dryad.234/1;
78
Chave et al., 2009; Zanne et al., 2009). When a species was identified at the
genus level or was not present in the GWD database, we used the average
density of wood for all species of the same genus in the database (for more details
see Flores and Coomes, 2011; Hawes et al., 2012; Magnago et al., 2014;
Magnago et al., 2015).
Phylogeny construction
For the preparation of our phylogenetic tree, we constructed a list of all our
family/genus/species according to APG III (2009). In the program Phylocom
version 4.2 (Webb et al. 2008), we then used the PHYLOMATIC function to return
the phylogenetic hypothesis for the relationship between our 66 families, 263
genera and 576 species sampled in 5,970 tree individuals, using the new
modified megatree R20120829mod.new for vascular plants from Gastauer &
Meira-Neto (in press). In our phylogenetic hypothesis more than two species per
family or more than two genera of an unresolved family in R20120829mod.new
were inserted as polytomies. Finally, to estimate the lengths of branches in
millions of years for our ultrametric phylogenetic tree, we used the file
"ages_exp", (Gastauer & Meira-Neto, in press) and the BLADJ algorithm in
Phylocom program version 4.2 (Webb et al. 2008).
Functional trait matrix
We examined six traits related to: quantity and type of food resource (1.
fruit size [mm], 2. seed size [mm], and 3. fruit type, categorized into fleshy or non-
fleshy fruits; Coombe, 1976; Magnago et al., 2014); fruit dispersal syndrome (4.
zoochoric or non-zoochoric dispersion; Magnago et al., 2014); forest structure (5.
succession group, categorized as pioneer, initial secondary or later secondary;
Borges et al., 2009; Magnago et al., 2014), and carbon storage (6. wood density
in dry weight [g cm-3]; Magnago et al., 2014; 2015). See Text A2 for full details.
Among the 576 species sampled, 5.55% representing 0.7% of the total
abundance (i.e., 44 of 5,970 individuals) were removed from the analysis of
functional diversity and phylogenetic construction (described above) because
they were only identified to morphospecies level.
79
Functional dendrogram construction
We build one functional dendrogram for all individuals of trees sampled in
the primary forest, secondary forest and cattle pasture using functional
characteristics described above. Gower`s distance (Pavoine et al., 2009) was
used to create a distance matrix from continuous and categorical functional traits
(see Text A1 for information about the functional traits), and the UPGMA
clustering method. To verify the loss of information when we transform the
distance matrix into a dendrogram, we correlated the original matrix and the
dendrogram cophenetic matrix, however we did not find great loss of information
(r = 0.927). Lastly, we used the ‘as.phylo’ function available on R ape package to
transform the functional dendrogram into a tree of class phylo. These analyzes
were performed in R version 3.2.1 (R Development Core Team 2015).
Tree conservation value
We considered a broad metrics of biodiversity, phylogenetic diversity and
functional diversity to determine tree conservation value.
Biodiversity
(1) Forest community structure: To calculate forest community structure,
we applied a non-metric multidimensional scaling (MDS) ordination analysis to
identify changes in community structure (see Magnago et al., 2014, Magnago et
al., 2015). We evaluated changes in the structure between habitat types using
raw species abundance data from each transect (i.e., primary forest, secondary
forest and cattle pasture), with the Sorensen (Bray–Curtis) distance metric. We
considered the MDS results arising from tree species abundance data as a
measure of community structure (Barlow et al., 2010). This analysis was
developed in R version 3.2.1 (R Development Core Team 2015)
(2) Similarity to primary forest: We evaluated changes in the similarity of
tree communities between the habitat types using Chao-Sørensen abundance-
based similarity index, with raw species abundance data from each transect
(Gilroy et al., 2014). We opted for the use of Chao-Sørensen abundance-based
because similarity based on the classic Sørensen index is sensitive to the sample
size (Chao et al., 2005). This analysis was developed in EstimateS version 9.1.0
(Colwell, 2013).
80
(3) Species richness and abundance: We evaluated changes in species
richness between the different types of habitat using the raw number of species
from each transect. We evaluated changes in the species abundance between
the habitats types using raw number of individuals from each transect.
(5) Richness and abundance of endemic species: To classify the species
endemic to the Atlantic Forest domain, we used the database Flora do Brazil (List
of Species of the Brazilian Flora, 2016, in http://floradobrasil.jbrj.gov.br) (see
Magnago et al., 2015).
(6) Richness and abundance of threatened species: We classified
threatened species as those listed on the IUCN Red List (IUCN, 2014) as
vulnerable, endangered or critically endangered (see Magnago et al., 2015).
Phylogenetic and functional diversity
From our phylogenetic hypothesis we calculate two phylogenetic metrics
weighted by abundance. (7) Phylogenetic diversity - the sum of evolutionary
history in a community (Faith, 1992). This metric is given in millions of years. (8)
Mean nearest taxon distance – mean phylogenetic distance between an
individual and the most closely related (non-conspecific) individual (given in
millions of years; Webb et al., 2000). Low levels suggest that closely related pairs
of individuals (non-conspecific) co-occur and high values that they do not.
Since a functional dendrogram has the same structure as a phylogenetic
tree (Pavoine & Bonsall 2010), we apply the same metrics used for phylogenetic
diversity following Thuiller et al., (2014) to determine impacts on ecosystem
functioning. (8) Functional diversity is defined as the total branch length of a
functional dendrogram (Petchey & Gaston 2002). (9) Mean nearest taxon
distance (Webb et al. 2000) – mean functional distance between an individual
and the most closely related (non-conspecific) individual. Low levels suggest that
pairs of individuals (non-conspecific) with similar functional traits co-occur and
high values that they do not.
Measures of phylogenetic and functional diversity are sensitive to
underlying species richness (Swenson 2014; Coronado et al., 2015). Hence we
determine whether changes in phylogenetic and functional diversity resulting
from habitat type were higher or lower than one would expect by chance, by
calculating the standardized effect size (ses) of our two metrics of phylogenetic
diversity (PD and MNTD-PD) and functional diversity (FD and MNTD-FD). The
81
ses measures the number of standard deviations between the observed values
and expected (see Text A3 for full details). Positive values of sesPD or sesFD
indicate higher PD or FD than expected by chance for a given species richness,
while negative values indicate lower PD or FD than expected by chance for a
given species richness. High values of sesMNTD-PD and sesMNTD-FD indicate
that the co-occurrence of related or functionally similar individuals is lower than
expected by chance (phylogenetic or functional overdispersion) for a given
species richness, and negative values indicate the co-occurrence of related or
functionally similar individuals is higher than expected by chance (phylogenetic
or functional clustering) for a given species richness. All analyzes of PD and FD
were Performed in R version 3.2.1 (R Development Core Team 2015)
Statistical analysis
To investigate the effects of secondary forests on carbon storage and tree
conservation value, we consider three habitat types (primary forest, secondary
forest and cattle pasture), plus the length of secondary succession (years) and
source distance (km). In addition, to assess co-benefits between carbon stock
and biodiversity of trees, we used the total carbon storage in each of the 11
transect of sampled secondary forest. To evaluate these relationships, we used
generalized linear models (GLMs; except ‘similarity’ see below), with Gaussian
error and an identity link (normality was tested and confirmed by the Shapiro Wilk
test), as implemented in the ‘glm’ function from stats package. For count data
(e.g., the species abundance and abundance of categorical functional traits) we
used GLMs, with a Poisson error distribution and a log link function, and negative
binomial distributions with log link functions when the data showed significant
overdispersion. These models were made using the ‘glmmadmb’ function from
the package glmmADMB. We also performed pairwise comparisons (i.e., Tukey
post hoc testing) between each habitat (primary forest, secondary forest and
cattle pasture) using the function ‘lsmeans’ from lsmeans package. In terms of
the effects of habitat type, length of secondary succession, source distance on
community similarity to primary forest and co-benefits (i.e. between carbon and
similarity to primary forest), we conducted Generalized Linear Mixed Model
(GLMM), with site as a random variable (Bolker et al., 2009). The GLMM was
built using the function “lmer” in the package lme4, with Gaussian error and an
identity link, following pairwise comparisons only between each habitat (primary
82
forest, secondary forest and cattle pasture) using the function ‘difflsmeans’ from
lmerTest package.
In addition, we used the ‘dredge’ function from MuMIn package to test all
possible combinations of secondary succession and source distance included in
the global model. To select our best model we used an information theoretical
approach based on the Akaike Information Criterion of Second Order (∆AICc),
which is indicated for small sample sizes, and the best model was indicated by
the lowest ∆AICc value (Burnham et al., 2011). Lastly, given that predictor (i.e.,
secondary forest age and source distance) variables may have multi-colinearity,
we run a Pearson correlation. However, we find a low, non-significant correlation
value (r = -0.370, P = 0.26; Fig. S2) and thus we did not remove any variable.
Results
Impacts of habitat type, forest age and source distance on carbon stock
Across all habitat types, we found a mean above-ground carbon stock of
228.9 ± 271.4, and within habitats types of 19.18 ± 32.4 Mg ha-1 in cattle pasture,
52.1 ± 17.33 Mg ha-1 in secondary forest and 386.3 ± 278.7 Mg ha-1 in primary
forest. Carbon stocks differed significantly between habitats (Table S3), with
pairwise comparisons revealing significant differences between all habitat pairs
(Table S3; Fig. 1a). In terms of forest regeneration, considering only our best
model (in which ∆AICc=0; Table S4), we found a significant positive effect of
secondary forest age on carbon stock (Mg ha-1, t = 3.765, P = 0.0044; Fig. 1b),
while source distance (i.e., distance to large forest blocks) had no effect on
carbon storage (see Table S4). Lastly, because we did not find a significant
correlation between secondary forest age and source distance (Fig. S2), this
suggests that these variables are impacting carbon stocks independently.
Impacts of habitat type, forest age and source distance on biodiversity
Forest community structure: Community structure differed significantly between
all habitats (Fig. 2a and S3; Table S5), with pairwise comparisons revealing
significant differences only between primary forest and secondary forest, and
primary forest and cattle pasture for MDS axis 1 (Fig. 2b; Table S6) and all habitat
83
pairs for MDS axis 2 (Table S6; Fig. S3a). In terms of forest regeneration and
source distance, considering only our best model (in which ∆AICc=0; Table S7),
the structure of communities was positively related with secondary forest age
(MDS axis 1; t = 3.73, P = 0.0047; Fig. 1c; Table S8), not being affected by source
distance (Table S7).
Similarity to primary forest: Similarity to overall primary forest community
varied significantly between habitats (Fig. 2d; Table S5), with primary transects
the most similar and pasture transects the least similar (all pairwise comparisons
significantly different; Table S6). In terms of forest regeneration and source
distance, considering only our best model (in which ∆AICc=0; Table S7), we
found a positive impact of secondary forest age (t = 7.71, P = 0.0001; Fig. 2e;
Table S8) and a negative impact of increasing source distance (t = -2.44, P =
0.0153; Fig. S3d; Table S8) on similarity to the primary forest community.
Species richness and abundance: Species richness was highest in
primary forest and lowest in pasture (Fig. 2f; Table S5), with all pairwise
comparisons significantly different (Table S6). Considering only our best model
(in which ∆AICc=0; Table S7) of the effects of secondary forest and source
distance, we found that species richness was positively related to secondary
forest age (z = 3.52, P = 0.0004; Table S8; Fig. 2g). There was no significant
impact of source distance (Table S7). For species abundance, we found a similar
pattern between habitat types (Fig. S3b; Table S6), but considering only our best
model (in which ∆AICc=0; Table S7), no effect of secondary forest (see Fig. S3c)
or source distance (Table S8).
Richness and abundance of species endemic: Endemic species richness
(Fig. 2h) and abundance (Fig. S3e) were highest in primary forest and lowest in
pasture (Table S5), with all pairwise comparisons significantly different (Figs. 2h
& S3e; Table S6). Considering only our best model (in which ∆AICc=0; Table S7)
of the effects of secondary forest and source distance, secondary forest age
impacted positively endemic species richness (z = 4.34, P = 0.00001; Fig. 2i;
Table S8) and abundance (z = 4.32, P = 0.0001; Fig. S3f; Table S8). There was
no impact of source distance (Table S7).
Richness and abundance of threatened species: There was a significant
effect of habitat on threatened species richness and abundance (Table S5):
pairwise comparisons revealed that richness was higher in primary than
secondary forest, which were higher than in pasture (Fig. S3g; Table S6), while
84
abundance was highest in primary forest, but did not differ between secondary
forest and cattle pasture (Fig. S3i; Table S6). In terms of secondary forest age
and source distance, considering only our best model (in which ∆AICc=0; Table
S7), the richness of threatened species (t = 2.60, P = 0.0094; Fig. S3h; Table S8)
and abundance (t = 2.56, P = 0.0100; Fig. S3j; Table S8) increased significantly
with the secondary forest age. There was no impact of source distance (Table
S7).
Impacts of habitat type, forest age and source distance on phylogenetic and
functional diversity
Phylogenetic diversity (PD): PD differed significantly between habitats
(Table S9), with PD in primary forest higher than in secondary forest, which were
higher than in cattle pasture (Fig. 3a; Table S10). After controlling for species
richness (sesPD), PD did not differ significantly between the three habitats
(Tables S9 and S10), suggesting that variation in PD across habitats is largely
driven by effects of species richness. Mean nearest taxon distance (MNTD-PD)
differed significantly between habitats (Table S9), with pairwise comparisons
again revealing significant differences between all habitats pairs (Fig. S4a; Table
S10), but in this instance controlling for species richness (sesMNTD-PD) revealed
larger sesMNTD-PD in primary forest than cattle pasture (Fig. S4c; Tables S9
and S10).
Considering only our best model (in which ∆AICc=0; Table S11) of the
effects of secondary forest age and source distance, there was a positive impact
of secondary forest age on PD (t = 2.75, P = 0.0227; Fig. 3b; Table S12).
However, after controlling for species richness, sesPD was not significantly
affected by secondary forest age (Table S12), indicating that the impact of
secondary forest age on PD is largely driven by species richness. Finally, there
was a negative relationship between secondary forest age and MNTD-PD,
suggesting that older secondary forests have a greater number of closely related
pairs of non-conspecific individuals, than that observed for younger secondary
forests (t = -2.97, P = 0.0157; Fig. S4b; Table S12). There was no impact of
source distance (Table S12).
Functional diversity (FD): FD differed significantly between habitats (Table
S9), with FD in primary forest higher than in secondary forest, which were higher
85
than in cattle pasture (Fig. 3c; Table S10). After controlling for species richness
(sesFD), sesFD did not differ significantly between the three habitats (Tables S9
and S10), suggesting that variation in FD across habitats is largely driven by the
effect of species richness. Mean nearest taxon distance (MNTD-FD) differed
significantly between habitats (Table S9). However, pairwise comparisons
showed that only cattle pasture was significantly different from primary forest and
secondary forest (Fig. S4d; Table S10).
Considering only our best model (in which ∆AICc=0; Table S11) of the
effects of secondary forest age and source distance on FD, there was a positive
impact of secondary forest age on FD (t = 3.50, P = 0.006; Fig. 3d; Table S12).
However, after controlling for species richness (sesFD), sesFD was not
significantly affected by secondary forest age or source distance (Table S12),
indicating that the impact of secondary forest age on PD is largely driven by
species richness.
Are there co-benefits between carbon stock and conservation value?
We found a marginally significant positive impact of above-ground carbon
stock on community structure (t = 2.22, P = 0.054; Fig. 4a; Table S13). For other
biodiversity value metrics, we found a significant positive effect of above-ground
carbon stock on similarity to primary forest community (t = 5.62, P = 0.0001; Fig.
4b; Table S13), species richness (z = 4.43, P = 0.0001; Fig. 4c; Table S13),
endemic species richness (z = 4.76, P = 0.0001; Table S13; Fig. 4d) and
abundance (z = 3.75, P = 0.0002; Table S13; Fig. S5a), and threatened species
richness (t = 3.50, P = 0.0005; Fig. S5b; Table S13) and abundance (z = 4.15, P
= 0.0001; Fig. S5c; Table S13).
In terms of phylogenetic diversity of trees, we found a strong positive co-
benefit between above-ground carbon stock and PD (t = 4.16, P = 0.0025; Fig.
4e; Table S13). However, after controlling for species richness (sesPD), PD was
not significantly affected by carbon storage (Table S13). Finally, we found a
strong positive co-benefit between carbon stock and FD (F = 4.11, P = 0.0027;
Table S13; Fig. 4f), which remained after controlling for species richness (sesFD;
t = 2.37, P = 0.042; Table S13; Fig. S5d).
86
Discussion Given the rapid conversion of rainforest and associated release of carbon
dioxide (Fearnside & Laurance, 2004; Bonan, 2008; Van der Werf, 2009), and
the massive shortfall in funding for biodiversity conservation (Miles & Kapos 2008;
McCarthy et al., 2012), we urgently need to seek mechanisms that can
simultaneously stem both carbon and biodiversity losses. One potential is for
carbon-based payments for ecosystem services (e.g., REDD+) to protect
biodiversity as a co-benefit for free (Gilroy et al., 2015; Magnago et al., 2015).
Here, we investigated whether carbon enhancements via natural forest
regeneration offer such co-benefits focusing for the first time in the highly
fragmented Brazilian Atlantic forest and on tree diversity. We found a significant
positive effect of secondary forest age on above-ground carbon storage of trees,
with significant recovery of floristic similarity with primary forests, richness and
abundance of endemic and IUCN red list species, and phylogenetic and
functional diversity within secondary forest. Positive relationships between
carbon stock and tree diversity recovery suggest there is potential for co-benefits
of natural forest regeneration under REDD+.
Impacts of habitat type, forest age and source distance on carbon stock
Cattle pasture is the main land use in this region, but has very low above-
ground carbon stocks (~18 Mg ha-1). Forty-five years after pasture abandonment
resulted in a nearly four-fold recovery of carbon stocks (~65 Mg ha-1) representing
about one sixth of the carbon stocks in a primary forest (~386 Mg ha-1). However,
relative to recent studies, our carbon recovery rates were low. In an analysis of
1,500 carbon plots across the lowland Neotropics (<1,000 m a.s.l.), Poorter et al.,
(2016) found an average recovery of 122 Mg ha-1 (range 20 to 225 Mg ha-1) after
20 years of regeneration, with above-ground carbon stocks recovering 90% of
old-growth values after 66 years. In the Tropical Andes of Colombia (>1,100 m
a.s.l.), natural regeneration on cattle pasture resulted in ~130 Mg ha-1 of above-
ground carbon stocks after 30 years, approximately half the stocks in a primary
forest (Gilroy et al., 2014).
The likely reason for the lower rates of recovery in this study is that all
secondary forest patches were isolated from primary forest fragments by the
pasture and crop matrix, plus were >13 km from large forest blocks (≥1,000
87
hectares, with no effect of source distance on above-ground carbon stock
recovery, see Results). By contrast, secondary forests in Gilroy et al., (2014) were
adjacent to contiguous primary forest. Thus, increasing isolation likely limits seed
dispersal from remaining forest fragments (Hubbell, 2001; Duque et al., 2009)
and the recovery of carbon stocks and carbon storage (Bello et al., 2015). In
support of this, in the Brazilian Atlantic there was significantly lower carbon stocks
with higher levels of isolation by distance to large forest blocks in primary forest
fragments (Magnago et al., 2015) and isolation causes increased floristic
differentiation between species in highly fragmented landscapes (Arroyo-
Rodríguez et al., 2013; Sfair et al., 2016).
Impacts of habitat type, forest age and source distance on biodiversity
We showed a strong effect of secondary forest age on community
structure and species richness (see also Barlow et al., 2007; Chazdon et al.,
2007). This is likely related to the initial recovery of generalist species (i.e. pioneer
and early secondary species) during the regeneration process, which leads to a
rapid change in habitat structure, more suitable microhabitats for seed
germination (Holl & Hoii, 1999), and increased occurrences of species that play
important ecological dispersal services, such as birds, dung beetles, bats large
mammals and small mammals (Barlow et al., 2007), followed by the replacement
of generalist trees with intermediate secondary forest species (Finegan, 1996).
After four decades of secondary forest recovery, communities were much
more similar to primary forest composition, harbouring many endemic and IUCN
Red-listed tree species (Figs. 2 & S3). Indeed, the abundance of IUCN Red-listed
species was similar in our ~40-year secondary forest patches to that observed
for small fragments (~13 ha) of primary forest (Magnago et al., 2015). Even
though recovery is occurring in locations that are very isolated from major sources
of seeds, it appears that with time a diverse array of trees of high conservation
value can recover. If secondary forest is recovered over much larger areas,
perhaps via support from REDD+ (see below), then there is the potential for forest
regeneration to improve landscape connectivity (Metzger et al., 2009) and reduce
extinction risk.
88
Impacts of habitat type, forest age and source distance on phylogenetic and
functional diversity
Phylogenetic diversity (PD) is vital for protecting evolutionary history
(Veron, Pavoine & Cadotte, 2015), and we found that ~40-year secondary forest
had recovered nearly two billion years of evolutionary history versus pasture, to
contain ~60% of the PD found in a primary forest. Functional diversity (FD) is vital
for protecting ecosystem services and functions (Cardinale et al., 2012; Hooper
et al., 2005), with eight-fold higher FD in secondary forest than pasture, and with
nearly half the FD in secondary than primary forest. Recovery of both PD and FD
was due to species richness effects, with null models suggesting that on a per
species basis there was no more PD or FD in secondary or primary forest than in
cattle pasture.
Lower levels of mean nearest distance taxon (MNTD) suggest increasing
co-occurrence of closely related pairs of (non-conspecific) individuals, which
provides greater phylogenetic and functional redundancy, and thus increased
resilience to disturbance within communities (Purschke et al., 2013). MNTD-PD
and MNTD-FD were highest in cattle pasture, MNTD-PD was higher in secondary
than primary forest (Fig. S4a,d), while MNTD-FD decreased with age of
secondary forest (Fig. S4b; but see Lohbeck et al. 2012). Again, species richness
explains most of these results (e.g., Fig. S4c): MNTD-PD and MNTD-FD tends
to be negatively correlated with species richness (Coronado et al., 2015),
because with more species there is an increased probability that the next
individual sampled is a close relative of at least one kind of individual already
sampled, reducing overall MNTD.
Are there co-benefits between carbon stock and conservation value
We found positive relationships between carbon stock and similarity to
primary forest, species richness, endemic species richness and abundance,
IUCN Red-listed species richness and abundance, phylogenetic diversity and
functional diversity (FD & sesFD) (Figs 4 and S5). This suggests strong potential
for co-benefits via carbon enhancements under natural forest regeneration in the
Brazilian Atlantic, enabling biodiversity protection for free under well-directed
REDD+ projects (see also Gilroy et al. 2014).
89
The majority of the carbon market is unlikely to offer enhanced payments
to directly conserve biodiversity (possible under REDD+; Phelps et al., 2012a,b).
Rather, market forces will likely seek the cheapest carbon, suggesting that
REDD+ will not meet the opportunity costs of highly profitable plantation
agriculture or selective logging (Fisher et al. 2011; except in peat swamps (Tata
et al., 2014) and will instead focus on less profitable, more marginal systems. In
the Tropical Andes, for example, economic returns from farming are very low
while carbon recovery in pastures adjacent to contiguous forest is rapid, making
it relatively cheap (~$2 t-1 CO2) to promote carbon enhancements (Gilroy et al.
2014). Although we have found significant recovery of carbon in isolated patches
of secondary forest in the Brazilian Atlantic, the rates of recovery were relatively
low (Gilroy et al. 2014; Poorter et al. 2016). This could result in higher carbon
prices of secondary regrowth in locations isolated from primary forest patches
blocks.
Policy recommendations and conclusions
Reducing anthropogenic climate change and tropical biodiversity loss are
two of the greatest challenges facing humanity (Barnett & Adger, 2007; Turner,
Oppenheimer & Wilcove, 2009; Cardinale et al., 2012). One possibility is to tackle
these challenges jointly (e.g. REDD+): our research underscores the importance
of focusing more carbon sequestration and conservation efforts on enhancing the
rate with which marginal land is abandoned. Of particular importance from a
biodiversity conservation perspective is the potential for secondary forests to
enlarge the area of existing fragments of primary forest (and to improve
landscape connectivity (Metzger et al., 2008). Both are vital for arresting the
arresting the declines in species, PD, and FD within more isolated primary forest
fragments Matos et al., (in review).
Enhancing the rate of land abandonment may entail land purchase or
renting (under long-term certified emissions reductions lCER schemes; Gilroy et
al. 2014) to allow the regrowth of secondary forest, provided that programs
ensure full prior and informed consent from land-owners. In much of the Tropical
Andes, for example, it would be more profitable to grow carbon than cows (Gilroy
et al. 2014). Because we found relatively low rates of carbon sequestration in our
study secondary forest fragments, future studies are vital to evaluate the effect of
90
landscape configuration and isolation from primary forest sources on co-benefits
offered by natural forest regeneration, and in turn, how this affects carbon pricing.
The best option may be to focus projects next to (or very near to) smaller patches
with specific conservation-values and larger primary forest blocks, where they
would buffer and enlarge these areas, likely reducing extinction risk, and likely
offer higher rates of carbon recovery and lower carbon prices making them a
more attractive win-win for conservation.
Acknowledgments We are grateful to CAPES a scholarship awarded to FARM (process
number 99999.006537/2014-06). We are grateful to Reserva Natural Vale,
Reserva Biológica de Sooretama, Reserva Biológica Córrego do Veado, Flona
do Rio Preto, as well as IBAMA the work permit granted in federal conservation
units (license number 42532). We also thank Conservation International, IEMA
(Instituto Estadual de Meio Ambiente) via the Projeto Corredores Ecológicos,
Reserva Natural Vale, Marcos Daniel Institute, and Pro-Tapir for logistical
support. Finally, the people who made this work possible in the field: Thiago S.
Coser, Domingos Folli, Glaucia S. Tolentino, Carolina Nunes, and Geanna
Correia. JAAMN holds a CNPq productivity fellowship (301913/2012-9). L.F.S.M.
was supported by Brazilian Studentship and Doctorate Sandwich Program grants
from the Brazilian Federal Agency for Support and Evaluation of Graduate
Education (CAPES) with two grants, Brazilian Studentship and Doctorate
Sandwich Program.
Role of the funding source
This work was funding by CNPq – the Brazilian Agency for Science and
Technology (grant no. 477780/2009-1), FAPEMIG, SECTES-MG, MCTI, Fibria
S.A, Suzano Papel and Ceculose S.A., and ArcelorMittal BioFlorestas. These
sponsors do not participate in the design of this study, collection of data, analysis,
or interpretation of the data, the writing in this manuscript, or the decision to
submit this manuscript for publication.
References Andrade, E.R., Jardim, J.G., Santos, B.A., Melo, F.P.L., Talora, D.C., Faria, D. &
91
Cazetta, E. (2015) Effects of habitat loss on taxonomic and phylogenetic diversity of understory Rubiaceae in Atlantic forest landscapes. Forest Ecology and Management, 349, 73–84.
Arroyo-Rodríguez, V., Rös, M., Escobar, F., Melo, F.P.L., Santos, B.A., Tabarelli, M., Chazdon, R., 2013. Plant β-diversity in fragmented rain forests: testing floristic homogenization and differentiation hypotheses. J. Ecol. 101, 1449–1458.
Banks-Leite, C., Pardini, R., Tambosi, L.R., Pearse, W.D., Bueno, A.A., Bruscagin, R.T., Condez, T.H., Dixo, M., Igari, A.T., Martensen, A.C. & Metzger, J.P. (2014) Using ecological thresholds to evaluate the costs and benefits of set-asides in a biodiversity hotspot. Science, 345, 1041–1045.
Barlow, J., Gardner, T. a, Araujo, I.S., Avila-Pires, T.C., Bonaldo, a B., Costa, J.E., Esposito, M.C., Ferreira, L. V, Hawes, J., Hernandez, M.I.M., Hoogmoed, M.S., Leite, R.N., Lo-Man-Hung, N.F., Malcolm, J.R., Martins, M.B., Mestre, L. a M., Miranda-Santos, R., Nunes-Gutjahr, a L., Overal, W.L., Parry, L., Peters, S.L., Ribeiro-Junior, M. a, da Silva, M.N.F., da Silva Motta, C. & Peres, C. a. (2007) Quantifying the biodiversity value of tropical primary, secondary, and plantation forests. Proceedings of the National Academy of Sciences of the United States of America, 104, 18555–60.
Barlow J, Louzada J, Parry L et al. (2010) Improving the design and management of forest strips in human-dominated tropical landscapes: a field test on dung beetles in the Brazilian Amazon. Journal of Applied Ecology, 47, 779–788.
Bihn, J.H., Verhaagh, M., Bra, M., Brandl, R., 2008. Do secondary forests act as refuges for old growth forest animals ? Recovery of ant diversity in the Atlantic forest of Brazil. Biological Conservation, 733-743.
Bello, C., Galetti, M., Pizo., Magnago, L.F.S., Rocha, M.F., Peres, C.A., Ovaskainen, O., Jordano, P., 2015. Deufanation affects carbon storage in tropical forests. Science 1, 1–11.
Berenguer, E., Ferreira, J., Gardner, T.A., Aragão, L.E.O.C., De Camargo, P.B., Cerri, C.E., Durigan, M., Oliveira, R.C. De, Vieira, I.C.G. & Barlow, J. (2014) A large-scale field assessment of carbon stocks in human-modified tropical forests. Global Change Biology, 2005, 3713–3726.
Bonan, G. B. (2008). Forests and climate change: forcings, feedbacks, and the climate benefits of forests. Science 320, 1444-1449.
Boscolo, D. & Paul Metzger, J. (2011) Isolation determines patterns of species presence in highly fragmented landscapes. Ecography, 34, 1018–1029.
Bolker, B.M., Brooks, M.E., Clark, C.J., Geange, S.W., Poulsen, J.R., Stevens, M.H.H. & White, J.-S.S. (2009) Generalized linear mixed models: a practical guide for ecology and evolution. Trends in Ecology & Evolution, 24, 127–135.
Burnham, K.P., Anderson, D.R. & Huyvaert, K.P. (2011) AIC model selection and multimodel inference in behavioral ecology: some background, observations, and comparisons. Behavioral Ecology and Sociobiology, 65, 23–35.
Cardinale, B.J., Duffy, J.E., Gonzalez, A., Hooper, D.U., Perrings, C., Venail, P., Narwani, A., Mace, G.M., Tilman, D., Wardle, D.A., Kinzig, A.P., Daily, G.C., Loreau, M., Grace, J.B., Larigauderie, A., Srivastava, D.S., Naeem, S., 2012.
92
Biodiversity loss and its impact on humanity. Nature 486, 59–67.
Chao, A. , Chazdon, R.L. , Colwell, R.K. & Shen, T.-J. (2005). A new statistical approach for assessing similarity of species composition with incidence and abundance data. Ecol. Lett., 8, 148–159.
Chave J, Andalo C, Brown S et al. (2005) Tree allometry and improved estimation of carbon stocks and balance in tropical forests. Oecologia, 145, 87–99.
Chave J, Coomes D, Jansen S, Lewis SL, Swenson NG, Zanne AE (2009) Towards a worldwide wood economics spectrum. Ecology Letters, 12, 351–366.
Chazdon, R.L., Letcher, S.G., van Breugel, M., Martínez-Ramos, M., Bongers, F. & Finegan, B. (2007) Rates of change in tree communities of secondary Neotropical forests following major disturbances. Philosophical transactions of the Royal Society of London. Series B, Biological sciences, 362, 273–289.
Chazdon, R. L. (2008). Beyond deforestation: restoring forests and ecosystem services on degraded lands. Science 320, 1458-1460.
Cisneros, L.M., Fagan, M.E. & Willig, M.R. (2015) Effects of human-modified landscapes on taxonomic, functional and phylogenetic dimensions of bat biodiversity. Diversity and Distributions, 21, 523–533.
Cortés-Gómez, A. M., Castro-Herrera, F. & Urbina-Cardona, J. N. (2013). Small changes in vegetation structure create great changes in amphibian ensembles in the Colombian Pacific rainforest. Trop. Conserv. Sci. 6, 749-769.
Coombe, G., 1976. The development of fleshy fruits. Annu. Rev. Plant Biol. 27, 207–228.
Coronado, N.H., Dexter, K.G., Toby, R., Lewis, S.L., Alexiades, M.N., Alvarez, E., Oliveira, A.A. De, Valverde, F.C., Fiore, A. Di & Farfan-rios, W. (2015) Phylogenetic diversity of Amazonian. Diversity Distrib., 1295–1307.
Colwell, R. K. 2013. EstimateS: Statistical estimation of species richness and shared species from samples. Version 9.1.0. User's Guide and application published at: http://purl.oclc.org/estimates.
Dupuy, J.M.; Leyequien, E.; López-Martinez, J. O. (2009). Patterns and corre;ates of Tropical Dry Forest structure and composition in Highly replicated chronosequence in Yucatan, Mexino. Biotropica 44, 151–162.
Duque, Á., Phillips, J.F., Von Hildebrand, P., Posada, C.A., Prieto, A., Rudas, A., Suescún, M., Stevenson, P., 2009. Distance decay of tree species similarity in protected areas on terra firme forests in Colombian Amazonia. Biotropica 41, 599–607.
Edwards, F.A., Edwards, D.P., Hamer, K.C. & Davies, R.G. (2013) Impacts of logging and conversion of rainforest to oil palm on the functional diversity of birds in Sundaland. Ibis, 155, 313–326.
Edwards, D.P., Gilroy, J.J., Thomas, G.H., Uribe, C.A.M. & Haugaasen, T. (2015) Land-Sparing Agriculture Best Protects Avian Phylogenetic Diversity. Current Biology, 25, 2384–2391.
Ellis, E.C., Klein Goldewijk, K., Siebert, S., Lightman, D. & Ramankutty, N. (2010)
93
Anthropogenic transformation of the biomes, 1700 to 2000. Global Ecology and Biogeography, 19, 589-606.
Faith, D.P. (1992) Conservation evaluation and phylogenetic diversity. Biological Conservation, 61, 1–10.
Fearnside, P.M. & Laurance, W.F. (2004) Tropical deforestation and greenhouse-gas emissions. Ecological Applications, 14, 982–986.
Field, CB., Behrenfeld MJ, Randerson, JT, Falkowski P. (1998) Primary Production of the Biosphere: Integrating Terrestrial and Oceanic Components. Science, 281, 237–240.
Finegan, B. (1996) Pattern and process in neotropoical secondary rain forests: the first 100 years of succession. Trends in Ecology and Evolution, 11, 119–124.
Fisher B, Edwards DP, Giam X. Wilcove DS. The high costs of conserving Southeast Asia's lowland rainforests. Front. Ecol. Environ. 2011;9:329–334.
Flores O, Coomes DA (2011) Estimating the wood density of species for carbon stock assessments. Methods in Ecology and Evolution, 2, 214–220.
Gastauer, M. & Meira-Neto, J. A. A. (in press) An enhanced calibration of a recently released megatree for the analysis of phylogenetic diversity. Brazilian Journal of Biology.
Gardner, T.A., 2010. Monitoring Forest Biodiversity: Improving Conservation Through Ecologically‐Responsible Management. Earthscan Publications Ltd., London, UK.
Gibbs, H.K., Ruesch, A.S., Achard, F., Clayton, M.K., Holmgren, P., Ramankutty, N. & Foley, J.A. (2010) Tropical forests were the primary sources of new agricultural land in the 1980s and 1990s. Proceedings of the National Academy of Sciences, 107, 16732–16737.
Gibson, L., Lee, T.M., Koh, L.P., Brook, B.W., Gardner, T.A., Barlow, J., Peres, C.A., Bradshaw, C.J.A., Laurance, W.F., Lovejoy, T.E. & Sodhi, N.S. (2011) Primary forests are irreplaceable for sustaining tropical biodiversity. Nature, 478, 378–381.
Gilroy, J.J., Woodcock, P., Edwards, F.A., Wheeler, C., Baptiste, B.L., Medina Uribe, C.A., Haugaasen, T. & Edwards, D.P. (2015) Cheap carbon and biodiversity co-benefits from forest regeneration in a hotspot of endemism. Nature Climate Change, 4, 503–507.
Hansen, M.C., Potapov, P. V, Moore, R., Hancher, M., Turubanova, S. a, Tyukavina, a, Thau, D., Stehman, S. V, Goetz, S.J., Loveland, T.R., Kommareddy, a, Egorov, a, Chini, L., Justice, C.O. & Townshend, J.R.G. (2013) High-resolution global maps of 21st-century forest cover change. Science (New York, N.Y.), 342, 850–3.
Haddad, N.M., Brudvig, L.A., Clobert, J., Davies, K.F., Gonzalez, A., Holt, R.D., Lovejoy, T.E., Sexton, J.O., Austin, M.P., Collins, C.D., Cook, W.M., Damschen, E.I., Ewers, R.M., Foster, B.L., Jenkins, C.N., King, A.J., Laurance, W.F., Levey, D.J., Margules, C.R., Melbourne, B.A., Nicholls, A.O., Orrock, J.L., Song, D.-X. & Townshend, J.R. (2015) Habitat fragmentation and its lasting impact on Earth’s ecosystems. Science
94
Advances, 1, e1500052–e1500052.
Hawes JE, Peres CA, Riley LB, Hess LL (2012) Landscape-scale variation in structure and biomass of Amazonian seasonally flooded and unflooded forests. Forest Ecology and Management, 281, 163–176.
Herrera-Montes, A. & Brokaw, N. (2010). Conservation value of tropical secondary forest: A herpetofaunal perspective. Biol. Conserv. 143, 1414-1422.
Hernández‐Ordóñez, O., Urbina‐Cardona, N. & Martínez‐Ramos, M. (2015). Recovery of Amphibian and Reptile Assemblages During Old‐Field Succession of Tropical Rain Forests. Biotropica 47, 377-388.
Hooper, D.U., Chapin, F.S., Ewel, J.J., Hector, A., Inchausti, P., Lavorel, S., Lawton, J.H., Lodge, D.M., Loreau, M., Naeem, S., Schmid, B., Setälä, H., Symstad, A.J., Vandermeer, J., Wardle, D.A., 2005. Effects of biodiversity on ecosystem functioning: a consensus of current knowledge. Ecol. Monogr. 75, 3–35.
Holl, K.D. & Hoii, K.D. (1999) Factors Limiting Tropical Rain Forest Regeneration in Abandoned Pasture: Seed Rain, Seed Germination, Microclimate, and Soil. Biotropica, 31, 229–242.
Hubbell, S., 2001. The unified neutral theoryy of biodiversity and biogeography. Princeton University Press, Princeton, New Jersey, USA, 375 p.
IBGE (Fundação Instituto Brasileiro de Geografia e Estatística). (1987) Rio Doce: geologia, geomorfologia, pedologia, vegetação e uso potencial da terra. Projeto Radambrasil, Volume SF.34, Rio de Janeiro.
Kormann, U., Scherber, C., Tscharntke, T., Klein, N., Larbig, M., Valente, J.J., Hadley, A.S. & Betts, M.G. (2016) Corridors restore animal-mediated pollination in fragmented tropical forest landscapes. Proc. R. Soc. B, 283: 20152347.
Laurance WF, Laurance SG, Ferreira LV, Rankinde Merona JM, Gascon C, Lovejoy TE (1997) Biomass collapse in Amazonian forest fragments. Science, 278, 1117–1118.
Laurance, W.F. (2004) Forest-climate interactions in fragmented tropical landscapes. Philosophical Transactions of the Royal Society B: Biological Sciences, 359, 345–352.
Laurance, WF (2008) Can carbon trading save vanishing forest?. BioScience, 58, 286–287.
Lewis, S.L. (2006) Tropical forests and the changing earth system. Philosophical transactions of the Royal Society of London. Series B, Biological sciences, 361, 195–210.
Lewis, S.L., Edwards, D.P., Galbraith, D., 2015 Increasing human dominance of tropical forests. Science, 349, 827-832. doi: 10.1126/science.aaa9932
Lohbeck, M., Poorter, L., Paz, H., Pla, L., van Breugel, M., Martínez-Ramos, M. & Bongers, F. (2012). Functional diversity changes during tropical forest succession. Perspectives in Plant Ecology, Evolution and Systematics 14, 89–96.
95
Lima RF, Olmos F, Dallimer M, Atkinson PW, Barlow J (2013) Can REDD+ help the conservation of restricted-Range Island Species? Insights from the endemism hotspot of S~ao Tom_e. PLoS One, 8, e74148.
Letcher SG. 2010. Phylogenetic structure of angiosperm communities during tropical forest succession. Proc. R. Soc. B Biol. Sci. 277:97–104.
McCarthy, D. P., Donald, P. F., Scharlemann, J. P., Buchanan, G. M., Balmford, A., Green, J. M., Green, J. M. H., Bennun, L. A., Burgess, N. D., Fishpool, L. D. C., Garnett, S. T., Leonard, D. L., Maloney, R. F., Morling, P., Schaefer, H. M., Symes, A., Wiedenfield, D. A. & Butchart, S. H. (2012). Financial costs of meeting global biodiversity conservation targets: current spending and unmet needs. Science 338, 946-949
Malhi Y, Baker TR, Phillips OL et al. (2004) The above-ground coarse wood productivity of 104 neotropical forest plots. Global Change Biology, 10, 563–591.
Magnago, L.F.S., Edwards, D.P., Edwards, F.A., Magrach, A., Martins, S. V. & Laurance, W.F. (2014) Functional attributes change but functional richness is unchanged after fragmentation of Brazilian Atlantic forests. Journal of Ecology, 102, 475–485.
Magnago, L.F.S., Magrach, A., Laurance, W.F., Martins, S. V., Meira-Neto, J.A. a., Simonelli, M. & Edwards, D.P. (2015) Would protecting tropical forest fragments provide carbon and biodiversity co-benefits under redd+? Global Change Biology, 21, 3455–3468.
Metzger, J.P., Martensen, A.C., Dixo, M., Bernacci, L.C., Ribeiro, M.C., Teixeira, A.M.G. & Pardini, R. (2009) Time-lag in biological responses to landscape changes in a highly dynamic Atlantic forest region. Biological Conservation, 142, 1166–1177.
Miles, L. & V, K. (2008) Reducing greenhouse gas emissions from deforestation and forest degradation: global land-use implications. Science, 320, 1454.
Morris, R.J. (2010) Anthropogenic impacts on tropical forest biodiversity: a network structure and ecosystem functioning perspective. Philosophical Transactions of the Royal Society B: Biological Sciences, 365, 3709–3718.
Myers, N., Mittermeier, R.A., Mittermeier, C.G., Fonseca, G.A.B., Kent, J., 2000. Biodiversity hotspots for conservation priorities. Nature 403, 853–8.
Nascimento, H.E.M. & Laurance, W.F. (2004) Biomass Dynamics in Amazonian Forest Fragments. Ecological Applications, 14, 127–138.
Paula MD, Alves Costa CP, Tabarelli M (2011) Carbon storage in a fragmented landscape of Atlantic forest: the role played by edge-affected habitats and emergent trees. Tropical Conservation Science, 4, 349–358.
Pardini, R., Bueno, A.D.A., Gardner, T. a, Prado, P.I. & Metzger, J.P. (2010) Beyond the fragmentation threshold hypothesis: regime shifts in biodiversity across fragmented landscapes. PloS one, 5, e1366.
Pavoine, S., Vallet, J., Gachet, S. (2009) for improving the measurement of functional diversity. Oikos 118: 391-402.
Pavoine, S., Bonsall, M. 2010. Measuring biodiversity to explain community assembly: a unified approach. Biological Reviews, 2010: 1-21.
96
Petchey, O.L., Gaston, K.J., 2006. Functional diversity: back to basics and looking forward. Ecol. Lett. 9, 741–758.
Pimm, S.L., Jenkins, C.N., Abell, R., Brooks, T.M., Gittleman, J.L., Joppa, L.N., Raven, P.H., Roberts, C.M. & Sexton, J.O. (2014) The biodiversity of species and their rates of extinction, distribution, and protection. Science (New York, N.Y.), 344, 1246752.
Phelps, J., Webb, E. & Adams, W. (2012a) Biodiversity co-benefits of policies to reduce forest-carbon emissions. Nature Climate Change, 2, 497–503.
Phelps J, Friess DA, Webb EL (2012a) Win–win REDD+ approaches belie carbon–biodiversity trade-offs. Special Issue Article: REDD+ and Conservation, Biological Conservation, 154, 53–60.
Poorter, L., Bongers, F., Aide, T.M., Almeyda Zambrano, A.M., Balvanera, P., Becknell, J.M., Boukili, V., Brancalion, P.H.S., Broadbent, E.N., Chazdon, R.L., Craven, D., de Almeida-Cortez, J.S., Cabral, G.A.L., de Jong, B.H.J., Denslow, J.S., Dent, D.H., DeWalt, S.J., Dupuy, J.M., Durán, S.M., Espírito-Santo, M.M., Fandino, M.C., César, R.G., Hall, J.S., Hernandez-Stefanoni, J.L., Jakovac, C.C., Junqueira, A.B., Kennard, D., Letcher, S.G., Licona, J.-C., Lohbeck, M., Marín-Spiotta, E., Martínez-Ramos, M., Massoca, P., Meave, J.A., Mesquita, R., Mora, F., Muñoz, R., Muscarella, R., Nunes, Y.R.F., Ochoa-Gaona, S., de Oliveira, A.A., Orihuela-Belmonte, E., Peña-Claros, M., Pérez-García, E.A., Piotto, D., Powers, J.S., Rodríguez-Velázquez, J., Romero-Pérez, I.E., Ruíz, J., Saldarriaga, J.G., Sanchez-Azofeifa, A., Schwartz, N.B., Steininger, M.K., Swenson, N.G., Toledo, M., Uriarte, M., van Breugel, M., van der Wal, H., Veloso, M.D.M., Vester, H.F.M., Vicentini, A., Vieira, I.C.G., Bentos, T.V., Williamson, G.B. & Rozendaal, D.M.A. (2016) Biomass resilience of Neotropical secondary forests. Nature, 1–15.
Purschke, O., Schmid, B.C., Sykes, M.T., Poschlod, P., Michalski, S.G., Durka, W., Kühn, I., Winter, M. & Prentice, H.C. (2013) Contrasting changes in taxonomic, phylogenetic and functional diversity during a long-term succession: Insights into assembly processes. Journal of Ecology, 101, 857–866.
Pütz, S., Groeneveld, J., Henle, K., Knogge, C., Martensen, A.C., Metz, M., Metzger, J.P., Ribeiro, M.C., de Paula, M.D. & Huth, A. (2014) Long-term carbon loss in fragmented Neotropical forests. Nature Communications, 5, 5037.
Ranta, P. & Blom, T.O.M. (1998) The fragmented Atlantic rain forest of Brazil : size , shape and distribution of forest fragments. Biodiversity & Conservation, 7, 385–403.
R Development Core Team (2015) R: A language and Environment for Statistical Computing. R Foundation for Statistical Computing, Vienna, Austria.
Ribeiro, M.C., Metzger, J.P., Martensen, A.C., Ponzoni, F.J. & Hirota, M.M. (2009) The Brazilian Atlantic Forest: How much is left, and how is the remaining forest distributed? Implications for conservation. Biological Conservation, 142, 1141–1153.
Rolim, S.G., Jesus, R.M., Nascimento, H.E.M., do Couto, H.T.Z. & Chambers, J.Q. (2005) Biomass change in an Atlantic tropical moist forest: the ENSO
97
effect in permanent sample plots over a 22-year period. Oecologia, 142, 238–246.
Rolim, S.G., Jesus, R.M., Nascimento, H.E.M., do Couto, H.T.Z. & Chambers, J.Q. (2005) Biomass change in an Atlantic tropical moist forest: the ENSO effect in permanent sample plots over a 22-year period. Oecologia, 142, 238–246.
Roeder, M., Holscher, D, Kossmann-Ferras (2012) Traits and growth of liana regeneration in primary and secondary forest of Central Amazonia. Applied vegetation science, 15, 108–118.
Rizzini, C.T. (1979). Tratado de fitogeografia do Brasil: aspectos sociológicos e florísticos. Universidade de São Paulo, 373 p.
Sfair, J.C., Arroyo-Rodríguez, V., Santos, B.A., Tabarelli, M., 2016. Taxonomic and functional divergence of tree assemblages in a fragmennted tropical forest. Ecol. Appl. in press.
Santos, B.A., Arroyo-Rodríguez, V., Moreno, C.E. & Tabarelli, M. (2010) Edge-Related Loss of Tree Phylogenetic Diversity in the Severely Fragmented Brazilian Atlantic Forest. PLoS ONE, 5, e12625.
Swenson, N.G. (2014) Functional and Phylogenetic Ecology in R. Springer UserR!-Springer.
SOS Mata Altântica & Instituto Nacional de Pesquisas Espaciais (2015). Altas dos Remanescentes Florestais e Ecossistemas Associados no Domínio da Mata Altântica, São Paulo, SP, 60 p.
Thomas, C. D., Cameron, A., Green, R. E., Bakkenes, M., Beaumont, L. J., Collingham, Y. C., Erasmus. B. F. N., Ferreira de Siqueira, M., Grainger, A., Hannah, L., Hughes. L., Huntley, B., van Jaarsveld, A. S., Midgely, G. F., Miles, L., Ortega-Huerta, M. A., Peterson, A. T., Phillips, O. L. & Williams, S. E. (2004). Extinction risk from climate change. Nature 427, 145-148.
Tata, H.L; Noordwijk, M. V.; Ruysschaert, D.; Mulia, R.; Rahayu, S.; Mulyoutami, E.; Widayati, T.; Ekadinata, A.; Zen, R,; Darsoyo, A.; Oktaviani, R.; Dewi, S. (2014). Will funcding to Reduce Emissions from Deforestation and (forest) Degradation (REDD+) stop conversion of peat swamps to oil palm in orangutan habitat in Tripa in Aceh, Indonesia?. Mitig Adapt Strateg Glob Change, 19, 693-713
Turner, W. R., Oppenheimer, M. & Wilcove, D. S. (2009). A force to fight global warming. Nature 462, 278-279
Van der Werf, G. R., Morton, D. C., DeFries, R. S., Olivier, J. G., Kasibhatla, P. S., Jackson, R. B.,Collatz, G. J. & Randerson, J. T. (2009). CO2 emissions from forest loss. Nat. Geosci. 2, 737-738.
Venter, O., Laurance, W.F., Iwamura, T., Wilson, K. a, Fuller, R. a & Possingham, H.P. (2009) BREVIA Harnessing Carbon Payments to Protect Biodiversity. Science, 326, 2009–2009.
Webb, C.O. (2000) Exploring the Phylogenetic Structure of Ecological Communities: An Example for Rain Forest Trees. The American Naturalist, 156, 145–155.
Webb, C.O., Ackerly, D.D. & Kembel, S.W. (2008) Phylocom: software for the
98
analysis of phylogenetic community structure and trait evolution. Bioinformatics, 24, 2098–2100.
White, E., Tucker, N., Meyers, N. & Wilson, J. (2004) Seed dispersal to revegetated isolated rainforest patches in North Queensland. Forest Ecology and Mnagement, 192, 409–426.
Zanne AE, Lopez-Gonzalez G, Coomes DA et al. (2009) Data from: Towards a worldwide wood economics spectrum. Dryad Digital Repository, doi:10.5061/dryad.234.
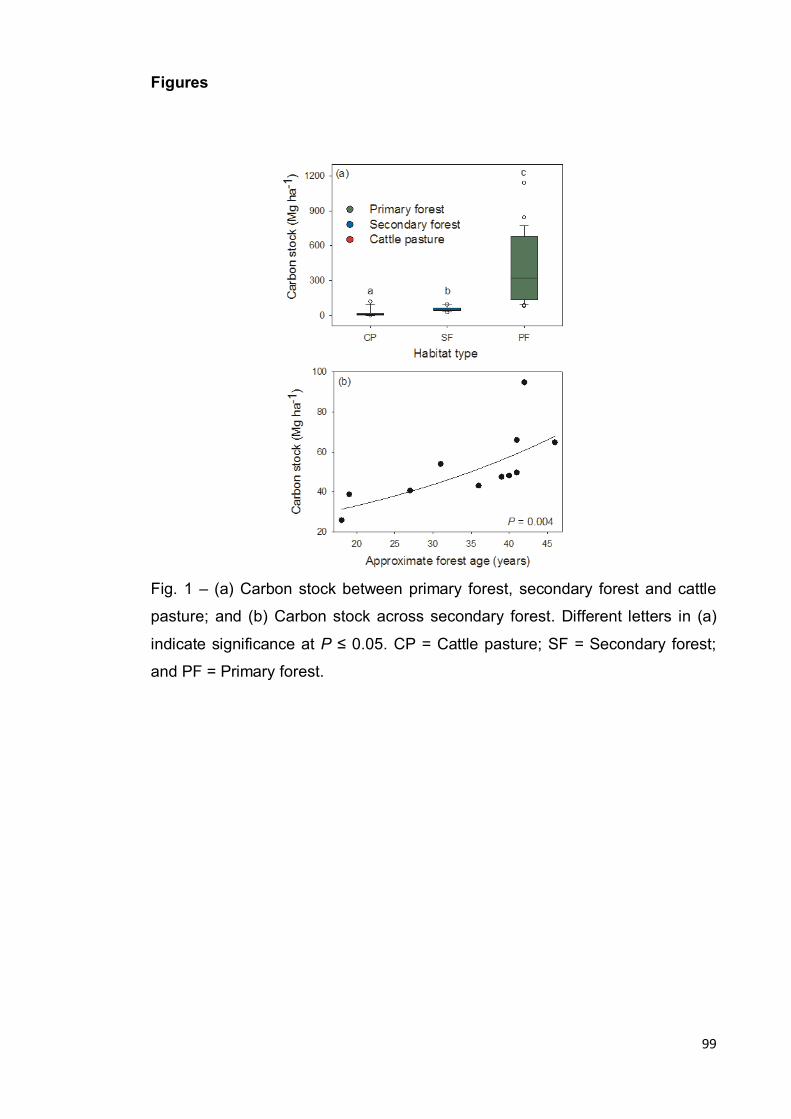
99
Figures
Fig. 1 – (a) Carbon stock between primary forest, secondary forest and cattle
pasture; and (b) Carbon stock across secondary forest. Different letters in (a)
indicate significance at P ≤ 0.05. CP = Cattle pasture; SF = Secondary forest;
and PF = Primary forest.
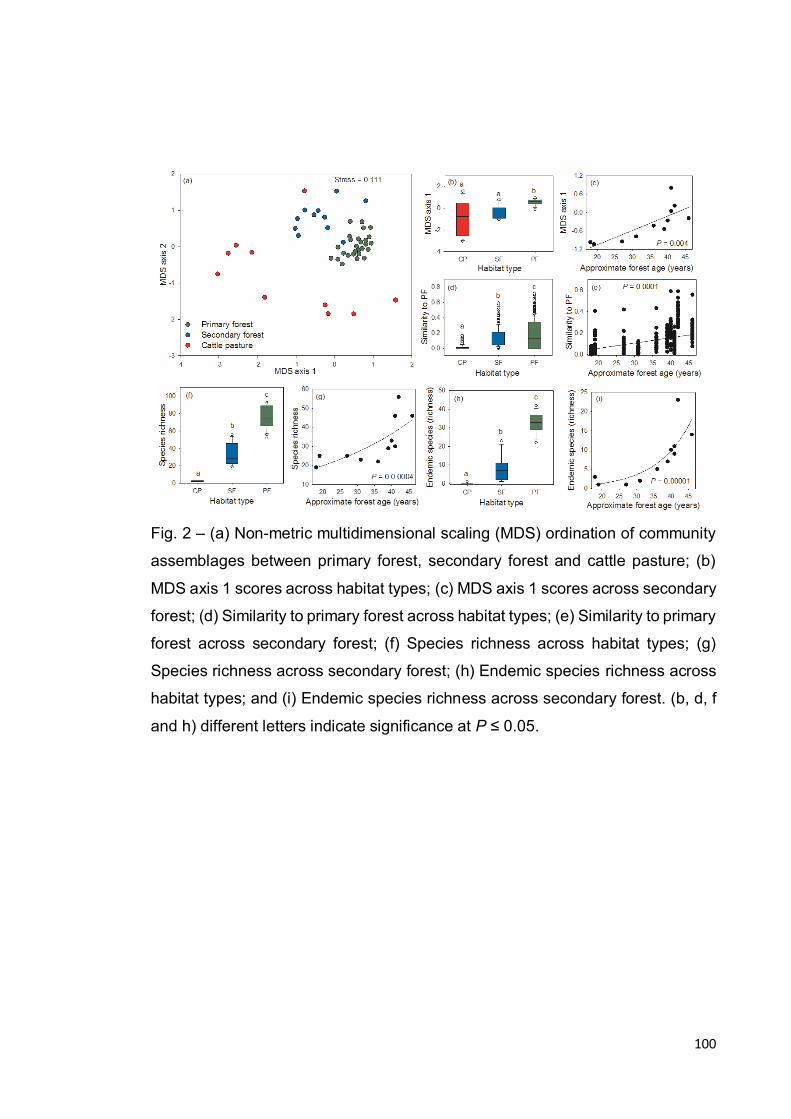
100
Fig. 2 – (a) Non-metric multidimensional scaling (MDS) ordination of community
assemblages between primary forest, secondary forest and cattle pasture; (b)
MDS axis 1 scores across habitat types; (c) MDS axis 1 scores across secondary
forest; (d) Similarity to primary forest across habitat types; (e) Similarity to primary
forest across secondary forest; (f) Species richness across habitat types; (g)
Species richness across secondary forest; (h) Endemic species richness across
habitat types; and (i) Endemic species richness across secondary forest. (b, d, f
and h) different letters indicate significance at P ≤ 0.05.
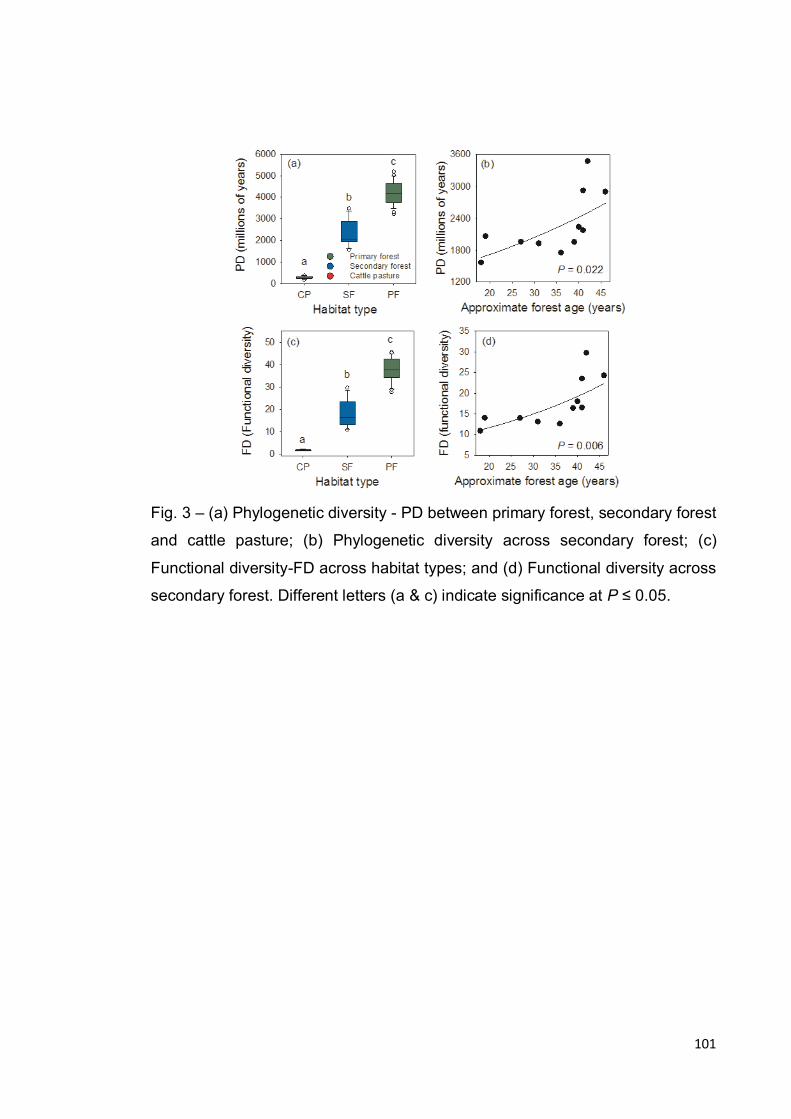
101
Fig. 3 – (a) Phylogenetic diversity - PD between primary forest, secondary forest
and cattle pasture; (b) Phylogenetic diversity across secondary forest; (c)
Functional diversity-FD across habitat types; and (d) Functional diversity across
secondary forest. Different letters (a & c) indicate significance at P ≤ 0.05.
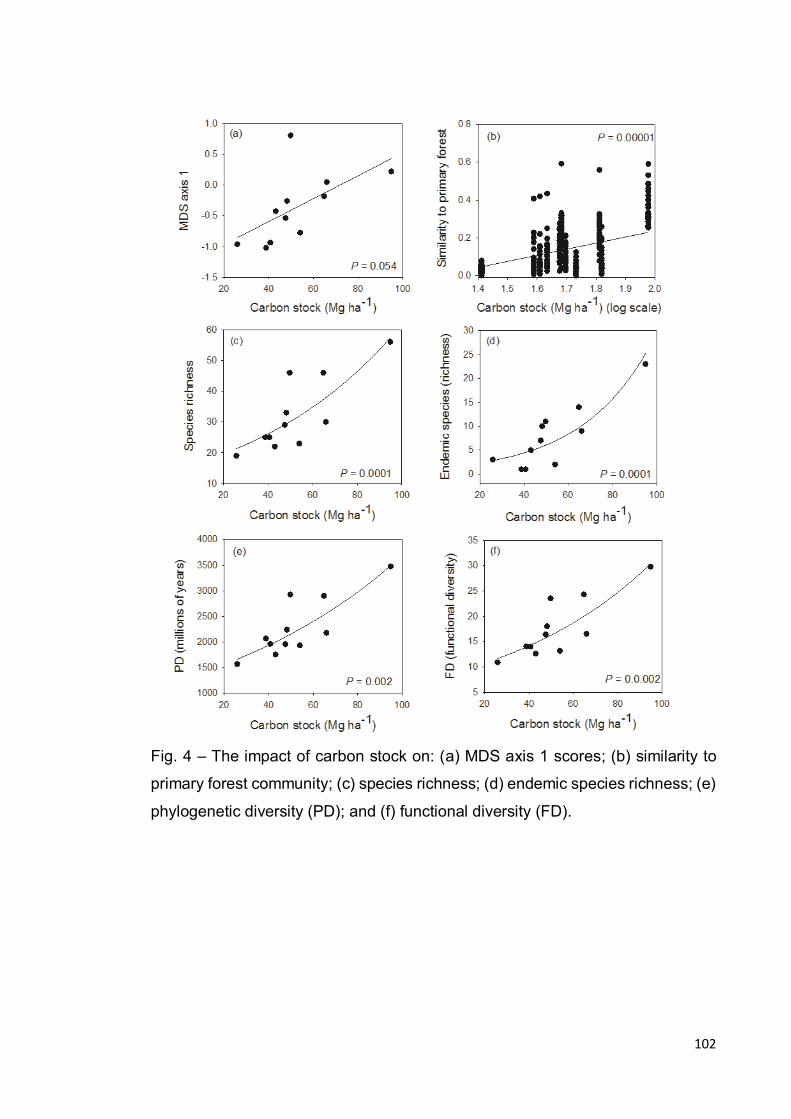
102
Fig. 4 – The impact of carbon stock on: (a) MDS axis 1 scores; (b) similarity to
primary forest community; (c) species richness; (d) endemic species richness; (e)
phylogenetic diversity (PD); and (f) functional diversity (FD).
103
VI - Conclusões Gerais
A partir dos resultados obtidos nos três capítulos pôde-se concluir que:
(i) Mudanças da composição das paisagens (i.e., porcentagem de
cobertura florestal e densidade de fragmentos em 100 ha) e o efeito de borda,
produzem alterações negativas na diversidade filogenética dentro dos
fragmentos. Por outro lado, paisagens fragmentadas mantêm elevada história
evolutiva dada a retenção de diversidade filogenética, através de uma gama de
características de configuração das paisagens (i.e., isolamento, forma dos
fragmentos e distância para fragmentos maiores que 1.000 hectares).
(ii) O isolamento entre fragmentos aumenta a diferenciação de nicho,
através do incremento de espécies adaptadas ao distúrbio, seguido pela perda
de espécies tardias. Porcentagem de cobertura florestal e tamanho do fragmento
gera uma homogeinização de nicho, dada pelo aumento redundância funcional
entre as espécies co-ocorrentes. Em adição, não encontramos evidências de que
as alterações das características de composição e configuração das paisagens
tenham levado a perda de espécies funcionalmente únicas.
(iii) Considerando as florestas em regeneração após distúrbio,
encontramos que existem elevados co-benefícios entre carbono e biodiversidade
de árvores. Isto indica, que mais ênfase deve ser colocada sobre as florestas
tropicais em regeneração para iniciativas de conservação da biodiversidade, por
meio do financiamento à base de carbono (REDD+), pois até mesmo manchas
isoladas de floresta em regeneração pode contribuir para atenuar a crise de
extinção da biodiversidade.
104
VII – SUPPLEMENTARY MATERIAL
III. CAPÍTULO I
Effects of landscape configuration, composition and edges on phylogenetic diversity of trees in a highly fragmented tropical forest
Fabio Antonio R. Matos1,2, Luiz Fernando S. Magnago3, Markus Gastauer1,
João M. B. Carreiras4, Marcelo Simonelli5, João Augusto A. Meira-Neto1*,
David P. Edwards2*
1Laboratory of Ecology and Evolution of Plants (LEEP), Departamento de Biologia
Vegetal, Universidade Federal de Viçosa, Minas Gerais, Brasil;
2Department of Animal and Plant Sciences, University of Sheffield, Sheffield, UK.
3Departamento de Biologia, Setor de Ecologia e Conservação, Universidade Federal
de Lavras (UFLA), Lavras, Brazil
4National Centre for Earth Observation (NCEO), University of Sheffield, UK.
5Instituto Federal do Espírito Santo, Vitória, Espírito Santo, Brasil,
* Corresponding authors. E-mail: [email protected]; [email protected]
105
This Supplementary Material includes:
Text S1 – Supplementary methods
Table S1 – Fragment details
Table S2 – Metrics of landscape configuration and composition
Table S3 – Values of landscape configuration and composition metrics in study fragments
Table S4 – Results of generalized linear models for landscape impacts
Table S5 – Results of generalized linear mixed models for fragment size and habitat impacts on phylogenetic diversity and structure
Figure S1 – Phylogenetic tree of tree species sampled
Figure S2 – Effect of forest cover on species richness
Figure S3 – Effect of fragment size and habitat on species richness
Supplemental references
106
Text S1 - Supplementary methods
Landscape structure
After the Amazon forest, the Brazilian Atlantic forest is the second largest
area of tropical rainforest in South America (Oliveira-Filho & Fontes 2000).
Currently it is estimated that 72% of the Brazilian population live in the potential
distribution area of this biome and that of its original area of 148,194,638 ha only
16,377,472 ha (11.73%), remains, distributed in fragments of different
successional stages, shapes, sizes and isolation levels (Ribeiro et al. 2009;
Tabarelli et al. 2010; Magnago et al. 2014).
The first map of vegetation types of the Brazilian Atlantic forest was
produced in 1985, and subsequently updated every five years up to 2005; further
updates were generated for the 2005-2008, 2008-2010 periods and currently
every year since 2010 (SOS Mata Atlântica/INPE 2015). The vegetation map
used in this study is the update generated with remote sensing data from 2015 to
produce the 2013-2014 update. Satellite data acquired by the Operational Land
Imager (OLI) sensor onboard Landsat 8 were processed and used to generate
the updated map with a minimum map unit of three hectares. The classification
followed a visual interpretation and manual delineation approach to discriminate
three forest formations (Atlantic forest, sandbank vegetation (restinga), and
mangrove) and associated ecosystems which have a high distinction in their
composition, vegetation type (Oliveira-Filho & Fontes 2000) and patterns of
phylogenetic structure (Duarte et al. 2014); additionally, several non-forest
classes were also identified and mapped: seasonally flooded vegetation (várzea),
mountain systems, vegetation refuges, and dunes. Deforestation over forest
classes were also mapped by comparison with data from previous periods.
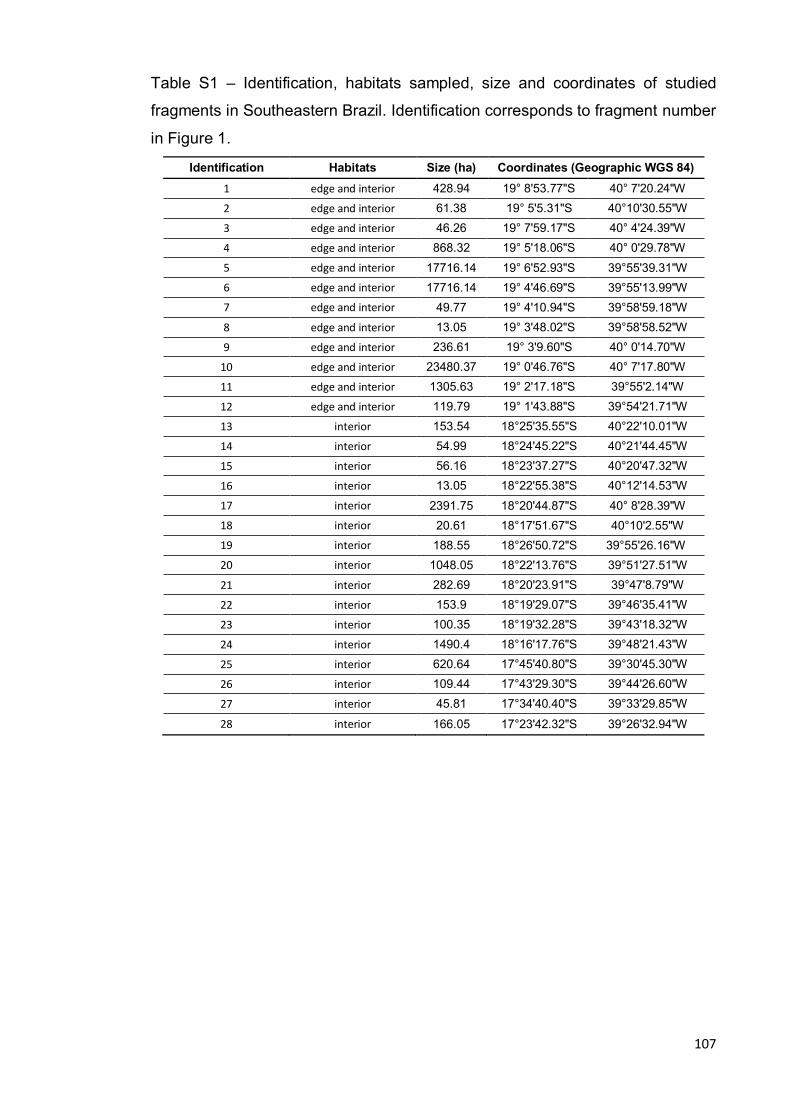
107
Table S1 – Identification, habitats sampled, size and coordinates of studied
fragments in Southeastern Brazil. Identification corresponds to fragment number
in Figure 1.
Identification Habitats Size (ha) Coordinates (Geographic WGS 84)
1 edge and interior 428.94 19° 8'53.77"S 40° 7'20.24"W
2 edge and interior 61.38 19° 5'5.31"S 40°10'30.55"W
3 edge and interior 46.26 19° 7'59.17"S 40° 4'24.39"W
4 edge and interior 868.32 19° 5'18.06"S 40° 0'29.78"W
5 edge and interior 17716.14 19° 6'52.93"S 39°55'39.31"W
6 edge and interior 17716.14 19° 4'46.69"S 39°55'13.99"W
7 edge and interior 49.77 19° 4'10.94"S 39°58'59.18"W
8 edge and interior 13.05 19° 3'48.02"S 39°58'58.52"W
9 edge and interior 236.61 19° 3'9.60"S 40° 0'14.70"W
10 edge and interior 23480.37 19° 0'46.76"S 40° 7'17.80"W
11 edge and interior 1305.63 19° 2'17.18"S 39°55'2.14"W
12 edge and interior 119.79 19° 1'43.88"S 39°54'21.71"W
13 interior 153.54 18°25'35.55"S 40°22'10.01"W
14 interior 54.99 18°24'45.22"S 40°21'44.45"W
15 interior 56.16 18°23'37.27"S 40°20'47.32"W
16 interior 13.05 18°22'55.38"S 40°12'14.53"W
17 interior 2391.75 18°20'44.87"S 40° 8'28.39"W
18 interior 20.61 18°17'51.67"S 40°10'2.55"W
19 interior 188.55 18°26'50.72"S 39°55'26.16"W
20 interior 1048.05 18°22'13.76"S 39°51'27.51"W
21 interior 282.69 18°20'23.91"S 39°47'8.79"W
22 interior 153.9 18°19'29.07"S 39°46'35.41"W
23 interior 100.35 18°19'32.28"S 39°43'18.32"W
24 interior 1490.4 18°16'17.76"S 39°48'21.43"W
25 interior 620.64 17°45'40.80"S 39°30'45.30"W
26 interior 109.44 17°43'29.30"S 39°44'26.60"W
27 interior 45.81 17°34'40.40"S 39°33'29.85"W
28 interior 166.05 17°23'42.32"S 39°26'32.94"W
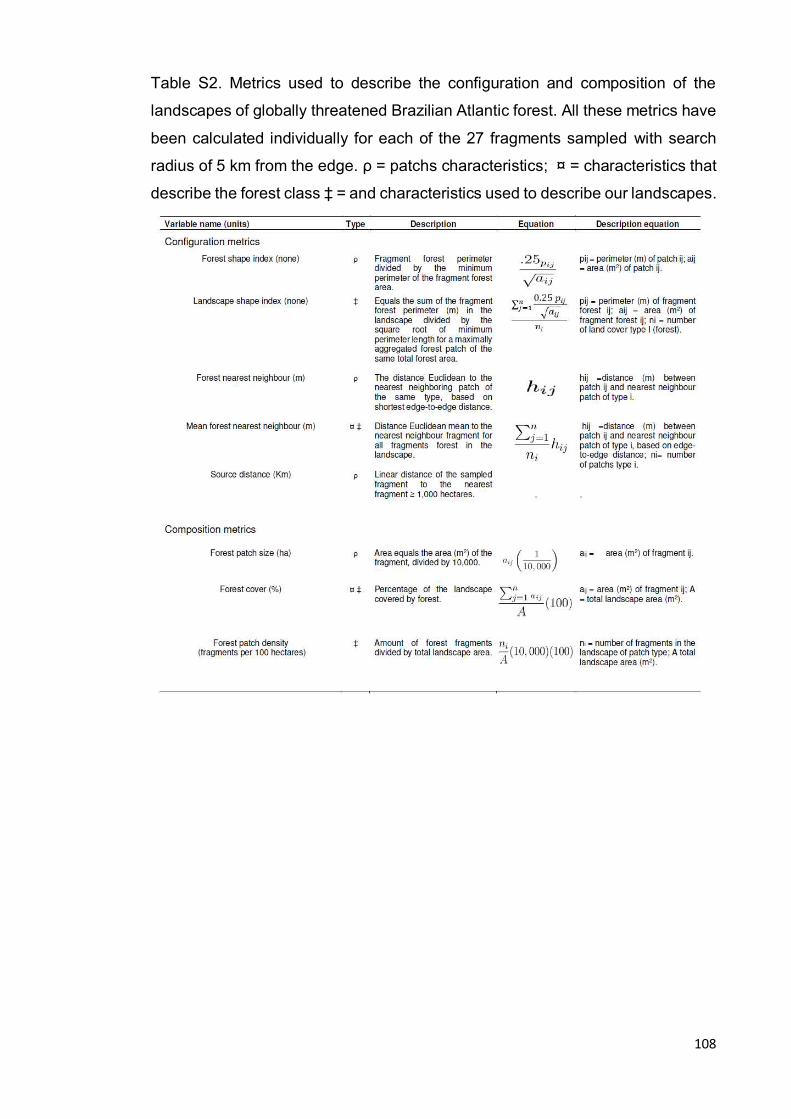
108
Table S2. Metrics used to describe the configuration and composition of the
landscapes of globally threatened Brazilian Atlantic forest. All these metrics have
been calculated individually for each of the 27 fragments sampled with search
radius of 5 km from the edge. ρ = patchs characteristics; ¤ = characteristics that
describe the forest class ‡ = and characteristics used to describe our landscapes.
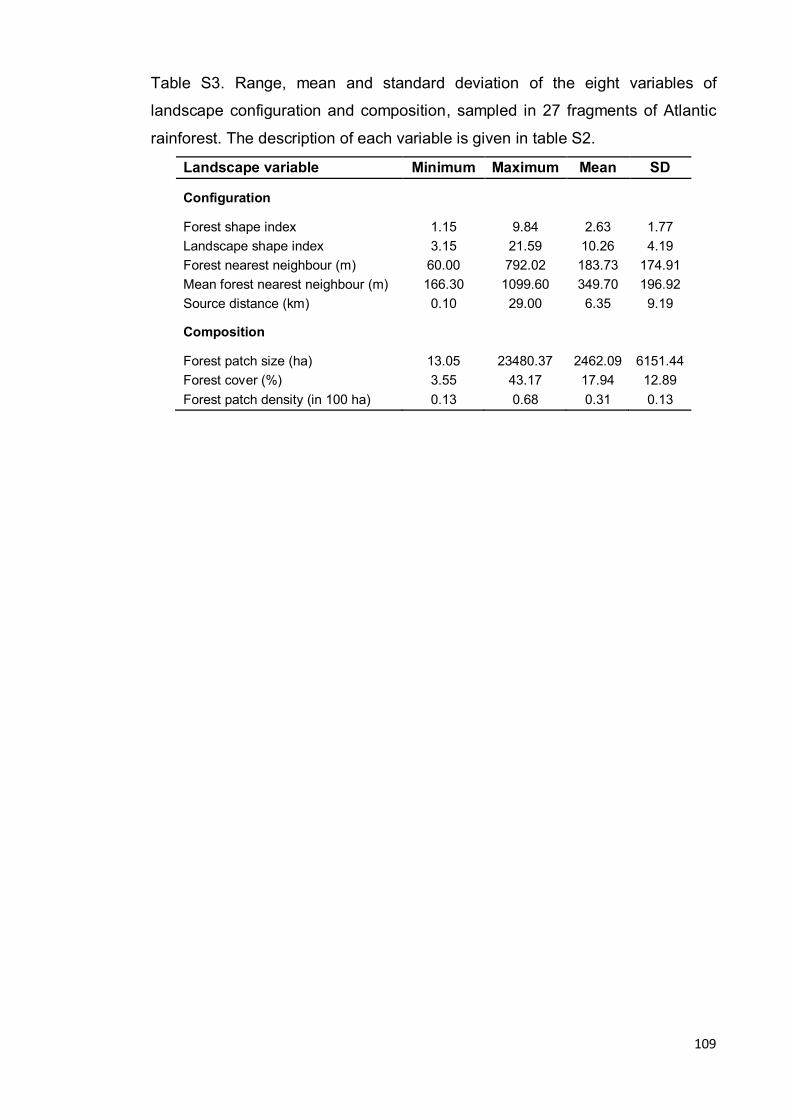
109
Table S3. Range, mean and standard deviation of the eight variables of
landscape configuration and composition, sampled in 27 fragments of Atlantic
rainforest. The description of each variable is given in table S2.
Landscape variable Minimum Maximum Mean SD
Configuration
Forest shape index 1.15 9.84 2.63 1.77
Landscape shape index 3.15 21.59 10.26 4.19
Forest nearest neighbour (m) 60.00 792.02 183.73 174.91
Mean forest nearest neighbour (m) 166.30 1099.60 349.70 196.92
Source distance (km) 0.10 29.00 6.35 9.19
Composition
Forest patch size (ha) 13.05 23480.37 2462.09 6151.44
Forest cover (%) 3.55 43.17 17.94 12.89
Forest patch density (in 100 ha) 0.13 0.68 0.31 0.13
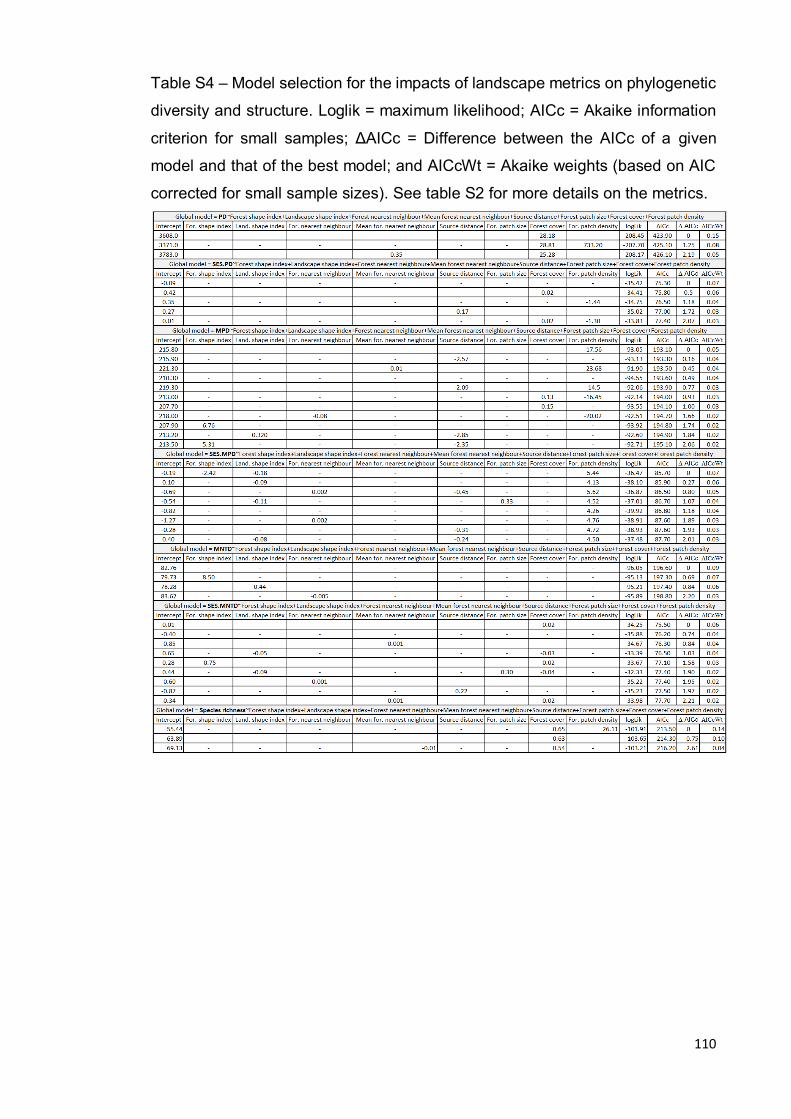
110
Table S4 – Model selection for the impacts of landscape metrics on phylogenetic
diversity and structure. Loglik = maximum likelihood; AICc = Akaike information
criterion for small samples; ΔAICc = Difference between the AICc of a given
model and that of the best model; and AICcWt = Akaike weights (based on AIC
corrected for small sample sizes). See table S2 for more details on the metrics.
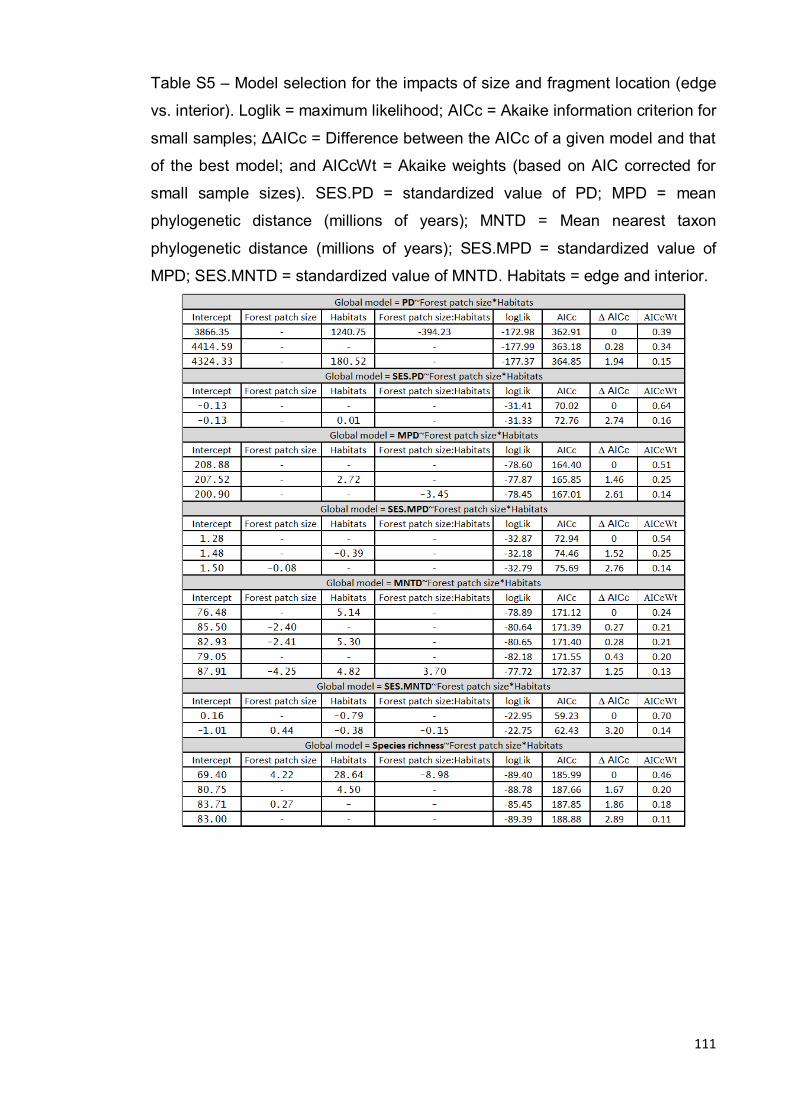
111
Table S5 – Model selection for the impacts of size and fragment location (edge
vs. interior). Loglik = maximum likelihood; AICc = Akaike information criterion for
small samples; ΔAICc = Difference between the AICc of a given model and that
of the best model; and AICcWt = Akaike weights (based on AIC corrected for
small sample sizes). SES.PD = standardized value of PD; MPD = mean
phylogenetic distance (millions of years); MNTD = Mean nearest taxon
phylogenetic distance (millions of years); SES.MPD = standardized value of
MPD; SES.MNTD = standardized value of MNTD. Habitats = edge and interior.
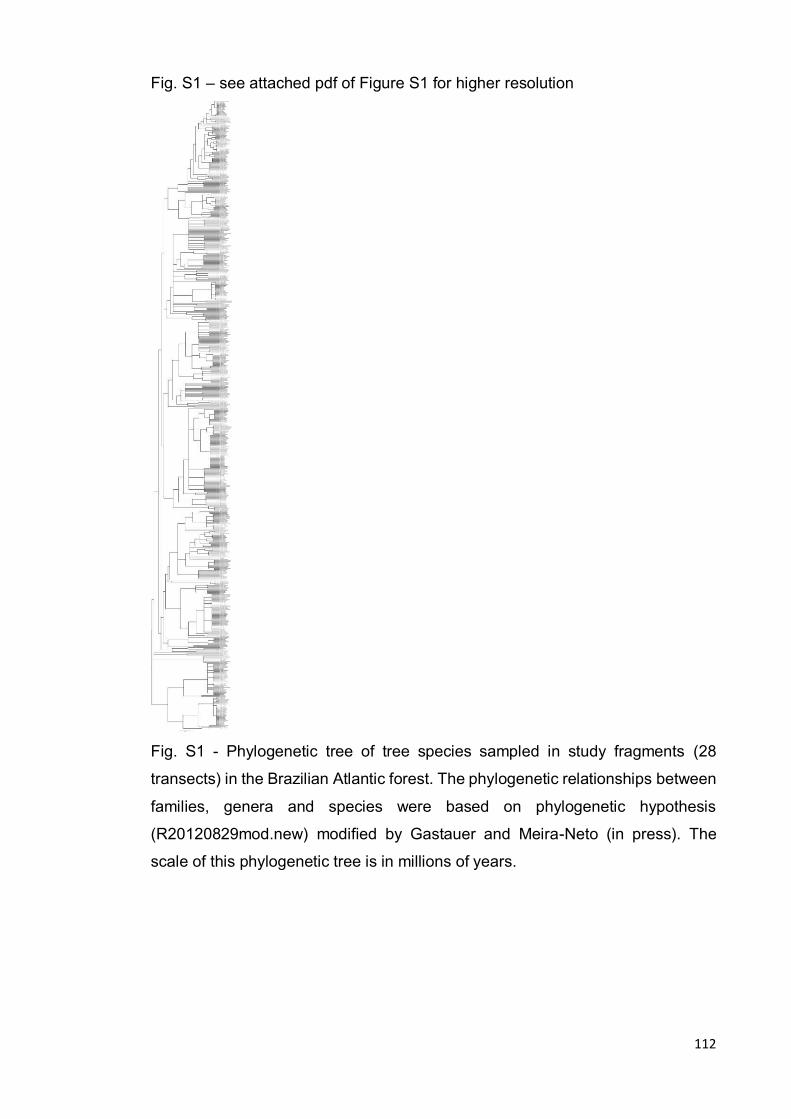
112
Fig. S1 – see attached pdf of Figure S1 for higher resolution
Fig. S1 - Phylogenetic tree of tree species sampled in study fragments (28
transects) in the Brazilian Atlantic forest. The phylogenetic relationships between
families, genera and species were based on phylogenetic hypothesis
(R20120829mod.new) modified by Gastauer and Meira-Neto (in press). The
scale of this phylogenetic tree is in millions of years.
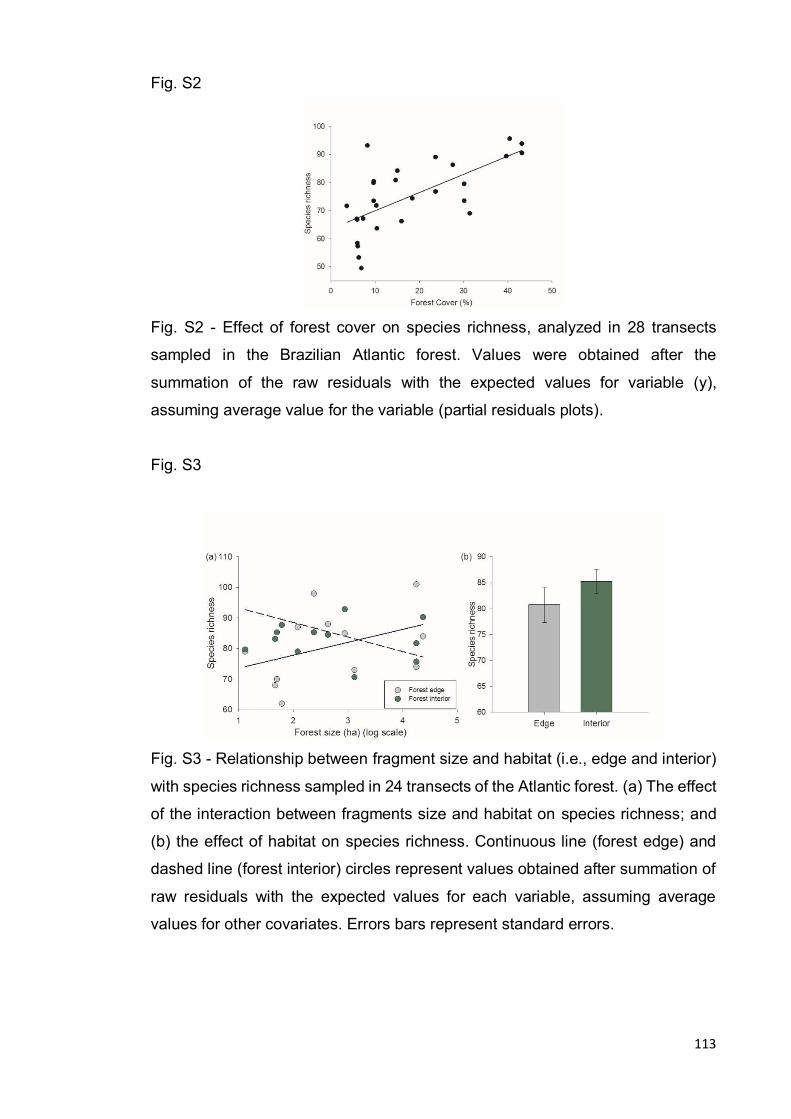
113
Fig. S2
Fig. S2 - Effect of forest cover on species richness, analyzed in 28 transects
sampled in the Brazilian Atlantic forest. Values were obtained after the
summation of the raw residuals with the expected values for variable (y),
assuming average value for the variable (partial residuals plots).
Fig. S3
Fig. S3 - Relationship between fragment size and habitat (i.e., edge and interior)
with species richness sampled in 24 transects of the Atlantic forest. (a) The effect
of the interaction between fragments size and habitat on species richness; and
(b) the effect of habitat on species richness. Continuous line (forest edge) and
dashed line (forest interior) circles represent values obtained after summation of
raw residuals with the expected values for each variable, assuming average
values for other covariates. Errors bars represent standard errors.
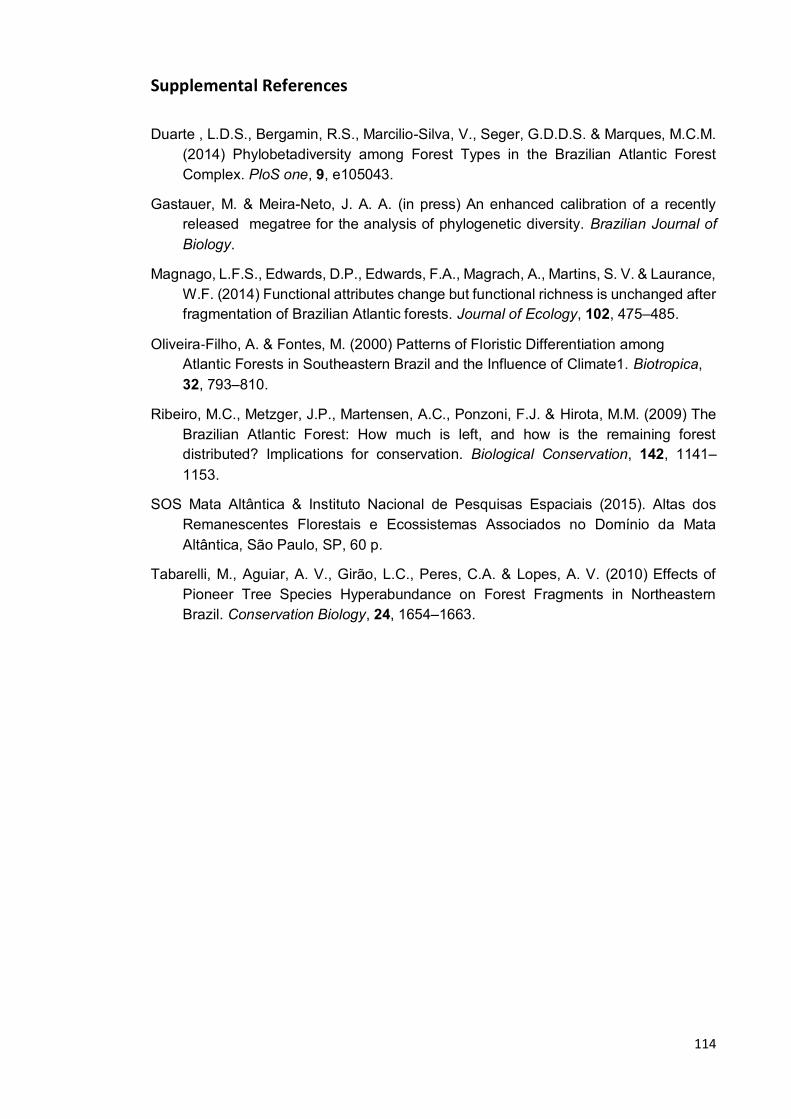
114
Supplemental References
Duarte , L.D.S., Bergamin, R.S., Marcilio-Silva, V., Seger, G.D.D.S. & Marques, M.C.M.
(2014) Phylobetadiversity among Forest Types in the Brazilian Atlantic Forest Complex. PloS one, 9, e105043.
Gastauer, M. & Meira-Neto, J. A. A. (in press) An enhanced calibration of a recently released megatree for the analysis of phylogenetic diversity. Brazilian Journal of
Biology.
Magnago, L.F.S., Edwards, D.P., Edwards, F.A., Magrach, A., Martins, S. V. & Laurance, W.F. (2014) Functional attributes change but functional richness is unchanged after fragmentation of Brazilian Atlantic forests. Journal of Ecology, 102, 475–485.
Oliveira‐Filho, A. & Fontes, M. (2000) Patterns of Floristic Differentiation among Atlantic Forests in Southeastern Brazil and the Influence of Climate1. Biotropica,
32, 793–810.
Ribeiro, M.C., Metzger, J.P., Martensen, A.C., Ponzoni, F.J. & Hirota, M.M. (2009) The Brazilian Atlantic Forest: How much is left, and how is the remaining forest distributed? Implications for conservation. Biological Conservation, 142, 1141–1153.
SOS Mata Altântica & Instituto Nacional de Pesquisas Espaciais (2015). Altas dos Remanescentes Florestais e Ecossistemas Associados no Domínio da Mata
Altântica, São Paulo, SP, 60 p.
Tabarelli, M., Aguiar, A. V., Girão, L.C., Peres, C.A. & Lopes, A. V. (2010) Effects of Pioneer Tree Species Hyperabundance on Forest Fragments in Northeastern Brazil. Conservation Biology, 24, 1654–1663.
115
IV. CAPÍTULO II
Impacts of forest fragmentation on the functional diversity of trees: roles
of landscape configuration and composition in the Brazilian Atlantic
forest
Fabio Antonio R. Matos1,2, Luiz Fernando S. Magnago3, Mariana Ferreira
Rocha3, João M. B. Carreiras4, Marcelo Simonelli5, Sebastião V. Martins 6,
João Augusto A. Meira-Neto1*, David P. Edwards2*
1Laboratory of Ecology and Evolution of Plants (LEEP), Departamento de
Biologia Vegetal, Universidade Federal de Viçosa (UFV), Viçosa, Minas Gerais,
CEP: 36570-900, Brasil
2Department of Animal and Plant Sciences, University of Sheffield, Sheffield, S10
2TN, United Kingdom
3Departamento de Biologia, Setor de Ecologia e Conservação, Universidade
Federal de Lavras (UFLA), Lavras, Minas Gerais, CEP: 37200-000, Brazil
4National Centre for Earth Observation (NCEO), University of Sheffield, S3
7RH, United Kingdom
5Instituto Federal do Espírito Santo, Vitória, Espírito Santo, CEP: 29056-264,
Brasil,
6Departamento de Engenharia Florestal, Universidade Federal de Viçosa (UFV),
Viçosa, Minas Gerais, CEP: 36570-900,Brasil
* Corresponding authors. E-mail: [email protected]; [email protected] Tel: +44 (0)114 2220147 ; +55 (31) 3899-1955
116
This Supplementary Information includes:
Text A1 – Supporting methods: Metrics of fragmentation
Text A2 – Supporting methods: Functional trait matrix
Table A1 – Fragment details
Table A2 – Values of landscape configuration and composition metrics in study
fragments
Table A3 – Metrics of landscape configuration and composition
Table A4 – Results of generalized linear models for the impacts of landscape
metrics on functional diversity and functional structure
Table A5 – Results of generalized linear models for the impacts of landscape
metrics on the functionally unique species
Table A6 – Results of generalized linear models for the impacts of landscape
metrics on the abundance of our six functional traits
Table A7 – Results of generalized linear models for the impacts of landscape
metrics (i.e., configuration and composition) on the richness and abundance of
our fruit dispersal syndrome traits
Table A8 – Results of generalized linear models for the impacts of landscape
metrics (i.e., configuration and composition) on the richness and abundance of
our forest structure traits
Table A9 – Results of generalized linear models for the impacts of landscape
metrics (i.e., configuration and composition) on the functional trait of carbon
storage (i.e. wood density)
Fig. A1 – Results of Generalized Linear Models results (only the best models
according to AICc) for the effects of landscape configuration on richness per
functional trait
Fig. A2 – Results of Generalized Linear Models results (only the best models
according to AICc) for the effects of landscape configuration on abundance of
species per functional trait
Fig. A3 - Results of Generalized Linear Models results (only the best models
according to AICc) for the effects of landscape composition on richness of
species per functional trait
Fig. A4 - Results of Generalized Linear Models results (only the best models
according to AICc) for the effects of landscape composition on abundance of
species per functional trait and wood density
117
Fig. A5 – Correlation between fragment size (x axis) and the level of irregularity
of forest fragments (y axis)
Supporting references
Text A1 - Supporting methods: Metrics of fragmentation
After the Amazon forest, the Brazilian Atlantic forest is the second largest
area of tropical rainforest in South America (Oliveira-Filho and Fontes, 2000).
Currently it is estimated that 72% of the Brazilian population live in the potential
distribution area of this biome and that of its original area of ~148Mha ha only
~16 Mha ha remains, distributed in fragments of different successional stages,
shapes, sizes and isolation levels (Ribeiro et al., 2009; Tabarelli et al., 2010;
Magnago et al., 2014).
The first map of vegetation types of the Brazilian Atlantic forest was
produced in 1985, and subsequently updated every five years up to 2005; further
updates were generated for the 2005-2008, 2008-2010 periods and currently
every year since 2010 (SOS Mata Atlântica/INPE, 2015). The vegetation map
used in this study is the update generated with remote sensing data from 2015 to
produce the 2013-2014 update. Satellite data acquired by the Operational Land
Imager (OLI) sensor onboard Landsat 8 were processed and used to generate
the updated map with a minimum map unit of three hectares. The classification
followed a visual interpretation and manual delineation approach to discriminate
three forest formations (Atlantic forest, sandbank vegetation (restinga), and
mangrove) and associated ecosystems which have a high distinction in their
composition, vegetation type (Oliveira-Filho and Fontes, 2000) and patterns of
phylogenetic structure (Duarte et al., 2014); additionally, several non-forest
classes were also identified and mapped: seasonally flooded vegetation (várzea),
mountain systems, vegetation refuges, and dunes. Deforestation over forest
classes were also mapped by comparison with data from previous periods.
The original map of vegetation types of the Brazilian Altantic forest was
first reclassified into a 2-class map of forest (i.e. only Tableland forest) and non-
forest (i.e., all other types of natural and non-natural formations). Next, a buffer
of 5 km around each one of the 27 sampled forest fragments was generated.
Each fragment and its surroundings (defined by the 5 km buffer) delimited each
analysis unit in this study (i.e., each landscape). A 5 km buffer was used to
118
capture the high level of fragmentation and isolation of each forest patch
considered in the analysis (see Magnago et al., 2014; Magnago et al., 2015 and
Table A2). However, omission and commission errors were detected after
comparison with available very-high optical spatial resolution satellite data from
2012 (World Imagery 2015). These were then manually corrected to obtain the
most accurate spatial delineation of every forest fragment within each 5 km buffer.
All forest fragments were then converted to raster format using the same spatial
resolution (30 meters) used to generate the vegetation map of this biome.
Additionally, deforestated areas were mapped by comparing the spatial
distribution of forest classes across maps of two consecutive periods.
Text A2 - Supporting methods: Functional trait matrix
We used six functional traits, which are associated with: (i) Quantity and
type of food resource; (ii) Fruit dispersal syndrome; (iii) Forest structure; and (iv)
Carbon storage (see Magnago et al., 2014 for more details).
(i) Food resource: (1) fruit diameter (mm); (2) seed diameter (mm); and (3)
fruit type - categorized into fleshy fruit, when the pericarp can accumulate water
and many organic compounds (see Coombe, 1976 and Magnago et al. 2014),
and non-fleshy fruits. These metrics were obtained from specimens in Herbarium
of the Vale (CVRD) and literature, supported the database of SpeciesLink (for
more details see: http://splink.cria.org.br/).
(ii) Fruit dispersal syndrome: (4) dispersion type – categorized into
zoochoric and non-zoochoric according to Van der Pijl, (1982). A zoochoric tree
produces diaspores surrounded by fleshy pulp, an aryl or other features that are
typically associated with dispersal by animals, and a non-zoochoric tree has
characteristics that indicate dispersal by abiotic means, such as winged seeds,
feathers or a lack of features that indicate dispersal via methods other than
downfall or explosive indehiscence (Magnago et al., 2014). The dispersion type
of each species was again obtained from specimens in CVRD and through the
data available in SpeciesLink (for more details see: http://splink.cria.org.br/), and
Magnago et al., (2014).
119
(iii) Forest structure: (5) successional groups – categorized as pioneer,
initial secondary and later secondary according to Bongers et al., (2009). We
considered as pioneers those trees that develop in conditions of high light and
generally do not occur in the understory, initial secondary those trees that develop
in intermediate shading conditions and as later secondary those trees that
develop exclusively and permanently in the understory (see Magnago et al.,
2014). The study species were classified using the databases of Jesus and
Rolim, (2005) and Magnago et al., (2014).
(iv) Carbon storage: (6) wood density in dry weight (g cm-3) - obtained
from Global Wood Density database (GWD) (available in: http://goo.gl/Upv8Ry,
Chave et al., 2009; Zanne et al., 2009). When a species was identified at the
genus level or was not present in the GWD database, we used the average
density of wood for all species of the same genus in the database (for more details
see Flores and Coomes, 2011; Hawes et al., 2012; Magnago et al., 2014).
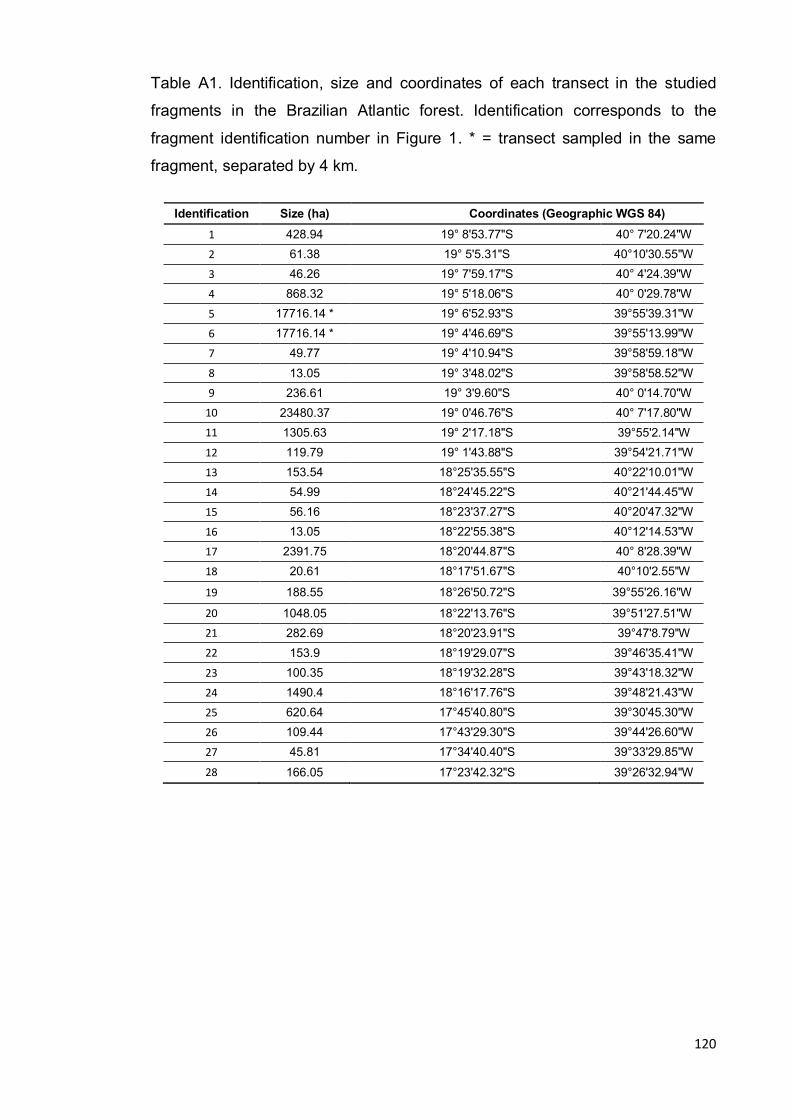
120
Table A1. Identification, size and coordinates of each transect in the studied
fragments in the Brazilian Atlantic forest. Identification corresponds to the
fragment identification number in Figure 1. * = transect sampled in the same
fragment, separated by 4 km.
Identification Size (ha) Coordinates (Geographic WGS 84)
1 428.94 19° 8'53.77"S 40° 7'20.24"W
2 61.38 19° 5'5.31"S 40°10'30.55"W
3 46.26 19° 7'59.17"S 40° 4'24.39"W
4 868.32 19° 5'18.06"S 40° 0'29.78"W
5 17716.14 * 19° 6'52.93"S 39°55'39.31"W
6 17716.14 * 19° 4'46.69"S 39°55'13.99"W
7 49.77 19° 4'10.94"S 39°58'59.18"W
8 13.05 19° 3'48.02"S 39°58'58.52"W
9 236.61 19° 3'9.60"S 40° 0'14.70"W
10 23480.37 19° 0'46.76"S 40° 7'17.80"W
11 1305.63 19° 2'17.18"S 39°55'2.14"W
12 119.79 19° 1'43.88"S 39°54'21.71"W
13 153.54 18°25'35.55"S 40°22'10.01"W
14 54.99 18°24'45.22"S 40°21'44.45"W
15 56.16 18°23'37.27"S 40°20'47.32"W
16 13.05 18°22'55.38"S 40°12'14.53"W
17 2391.75 18°20'44.87"S 40° 8'28.39"W
18 20.61 18°17'51.67"S 40°10'2.55"W
19 188.55 18°26'50.72"S 39°55'26.16"W
20 1048.05 18°22'13.76"S 39°51'27.51"W
21 282.69 18°20'23.91"S 39°47'8.79"W
22 153.9 18°19'29.07"S 39°46'35.41"W
23 100.35 18°19'32.28"S 39°43'18.32"W
24 1490.4 18°16'17.76"S 39°48'21.43"W
25 620.64 17°45'40.80"S 39°30'45.30"W
26 109.44 17°43'29.30"S 39°44'26.60"W
27 45.81 17°34'40.40"S 39°33'29.85"W
28 166.05 17°23'42.32"S 39°26'32.94"W
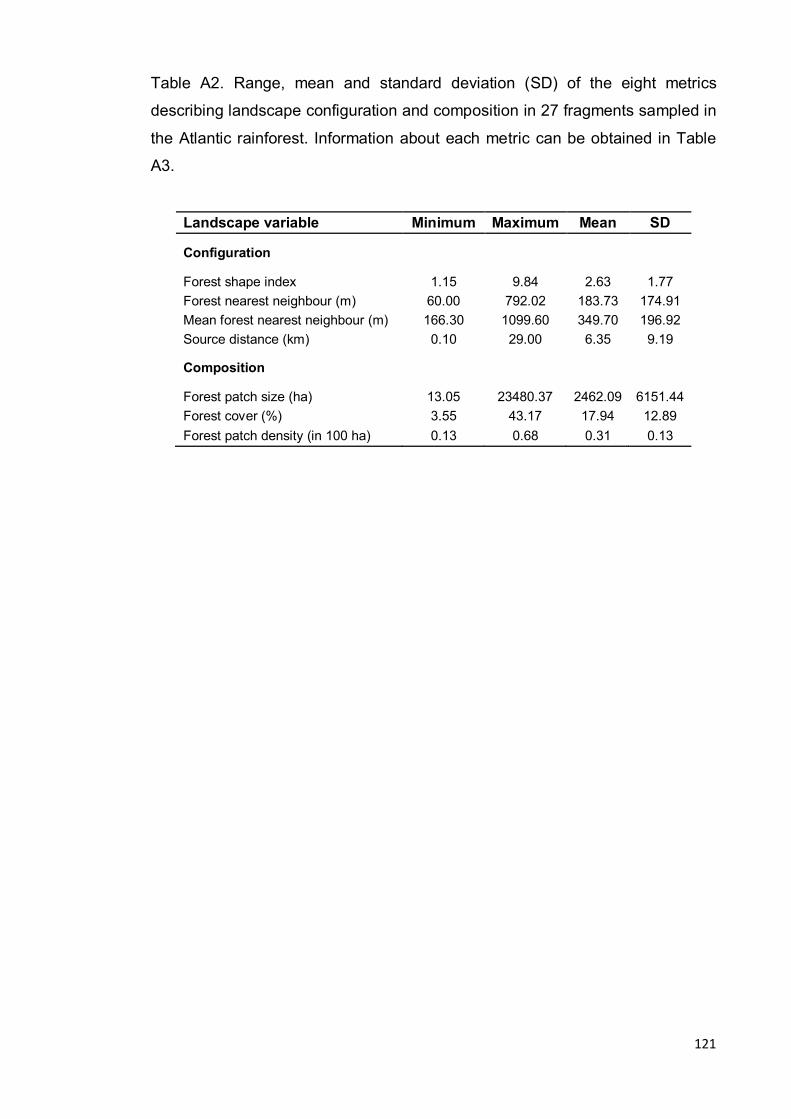
121
Table A2. Range, mean and standard deviation (SD) of the eight metrics
describing landscape configuration and composition in 27 fragments sampled in
the Atlantic rainforest. Information about each metric can be obtained in Table
A3.
Landscape variable Minimum Maximum Mean SD
Configuration
Forest shape index 1.15 9.84 2.63 1.77
Forest nearest neighbour (m) 60.00 792.02 183.73 174.91
Mean forest nearest neighbour (m) 166.30 1099.60 349.70 196.92
Source distance (km) 0.10 29.00 6.35 9.19
Composition
Forest patch size (ha) 13.05 23480.37 2462.09 6151.44
Forest cover (%) 3.55 43.17 17.94 12.89
Forest patch density (in 100 ha) 0.13 0.68 0.31 0.13
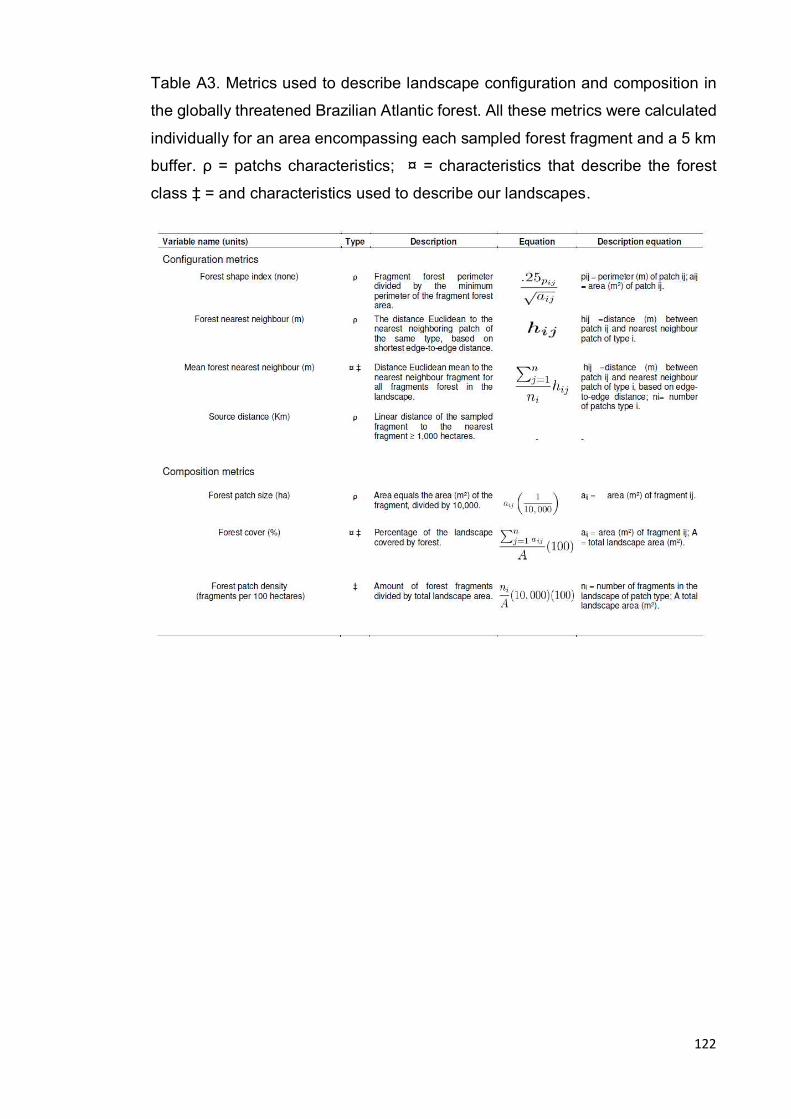
122
Table A3. Metrics used to describe landscape configuration and composition in
the globally threatened Brazilian Atlantic forest. All these metrics were calculated
individually for an area encompassing each sampled forest fragment and a 5 km
buffer. ρ = patchs characteristics; ¤ = characteristics that describe the forest
class ‡ = and characteristics used to describe our landscapes.
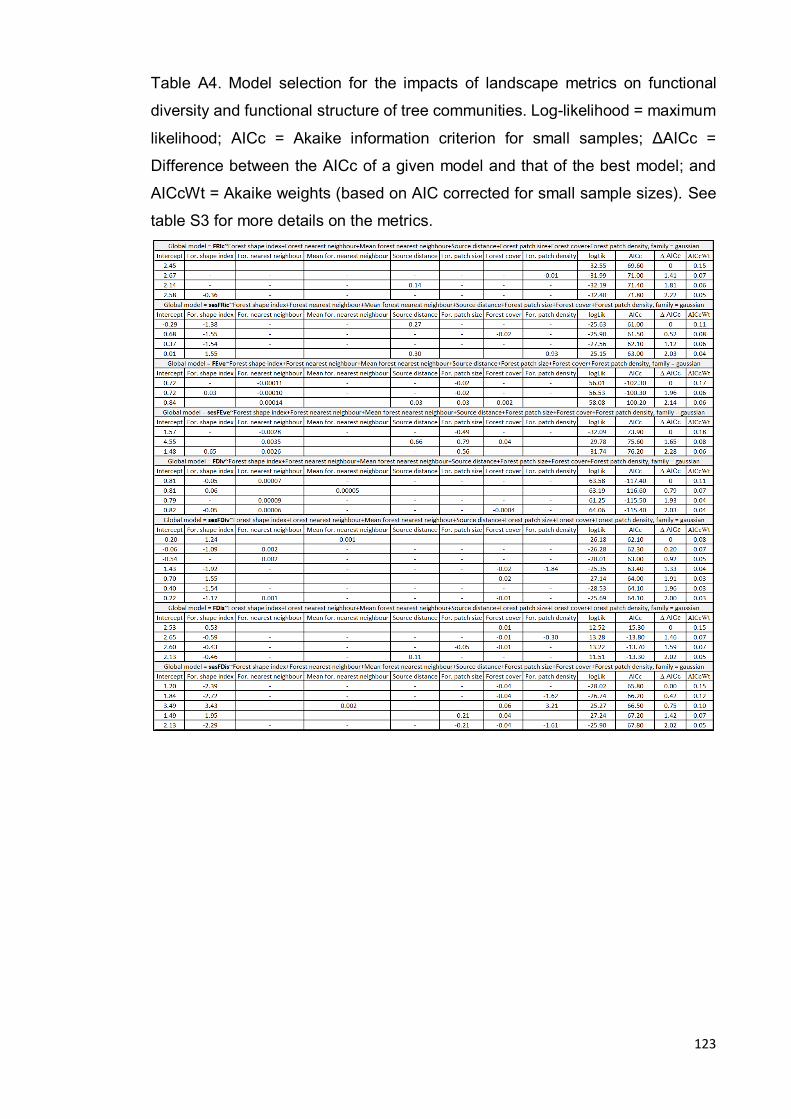
123
Table A4. Model selection for the impacts of landscape metrics on functional
diversity and functional structure of tree communities. Log-likelihood = maximum
likelihood; AICc = Akaike information criterion for small samples; ΔAICc =
Difference between the AICc of a given model and that of the best model; and
AICcWt = Akaike weights (based on AIC corrected for small sample sizes). See
table S3 for more details on the metrics.
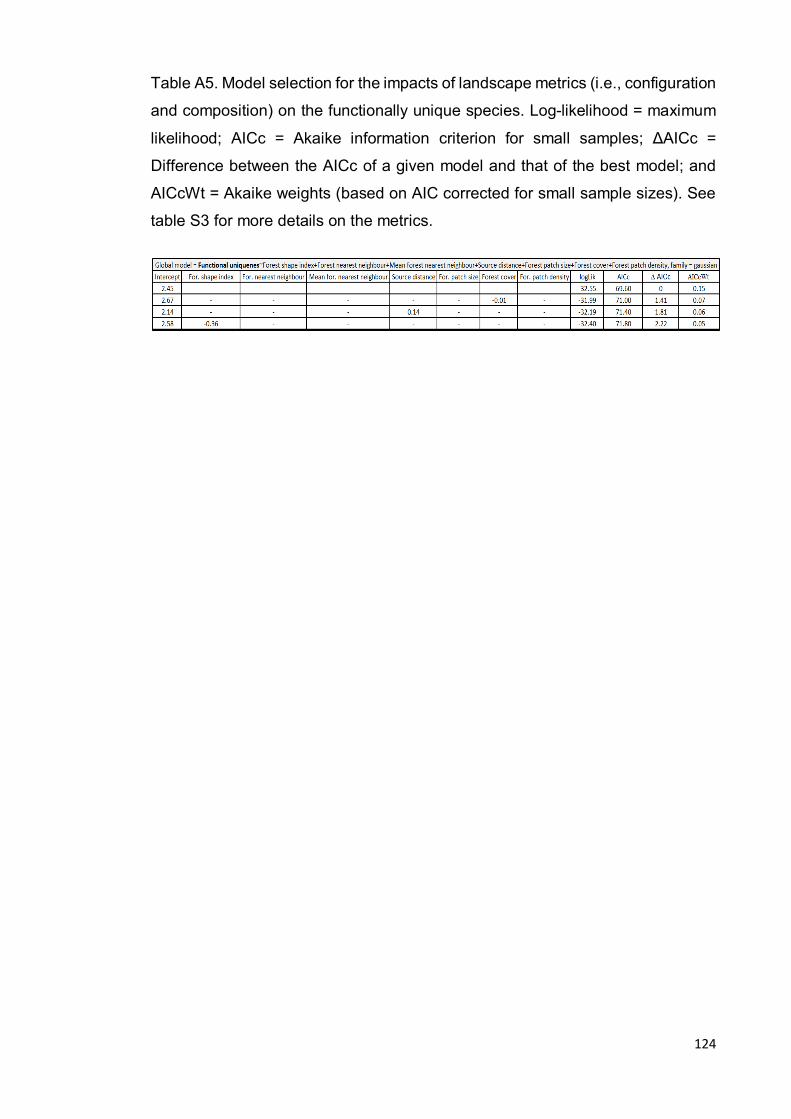
124
Table A5. Model selection for the impacts of landscape metrics (i.e., configuration
and composition) on the functionally unique species. Log-likelihood = maximum
likelihood; AICc = Akaike information criterion for small samples; ΔAICc =
Difference between the AICc of a given model and that of the best model; and
AICcWt = Akaike weights (based on AIC corrected for small sample sizes). See
table S3 for more details on the metrics.
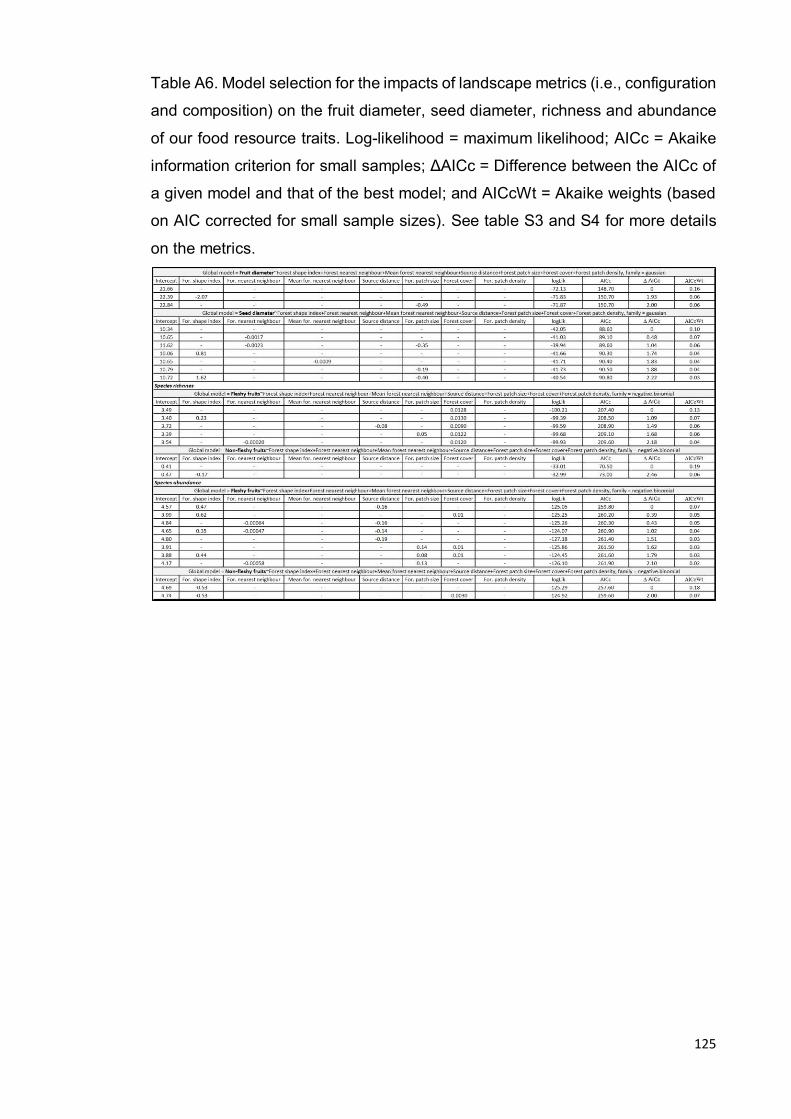
125
Table A6. Model selection for the impacts of landscape metrics (i.e., configuration
and composition) on the fruit diameter, seed diameter, richness and abundance
of our food resource traits. Log-likelihood = maximum likelihood; AICc = Akaike
information criterion for small samples; ΔAICc = Difference between the AICc of
a given model and that of the best model; and AICcWt = Akaike weights (based
on AIC corrected for small sample sizes). See table S3 and S4 for more details
on the metrics.
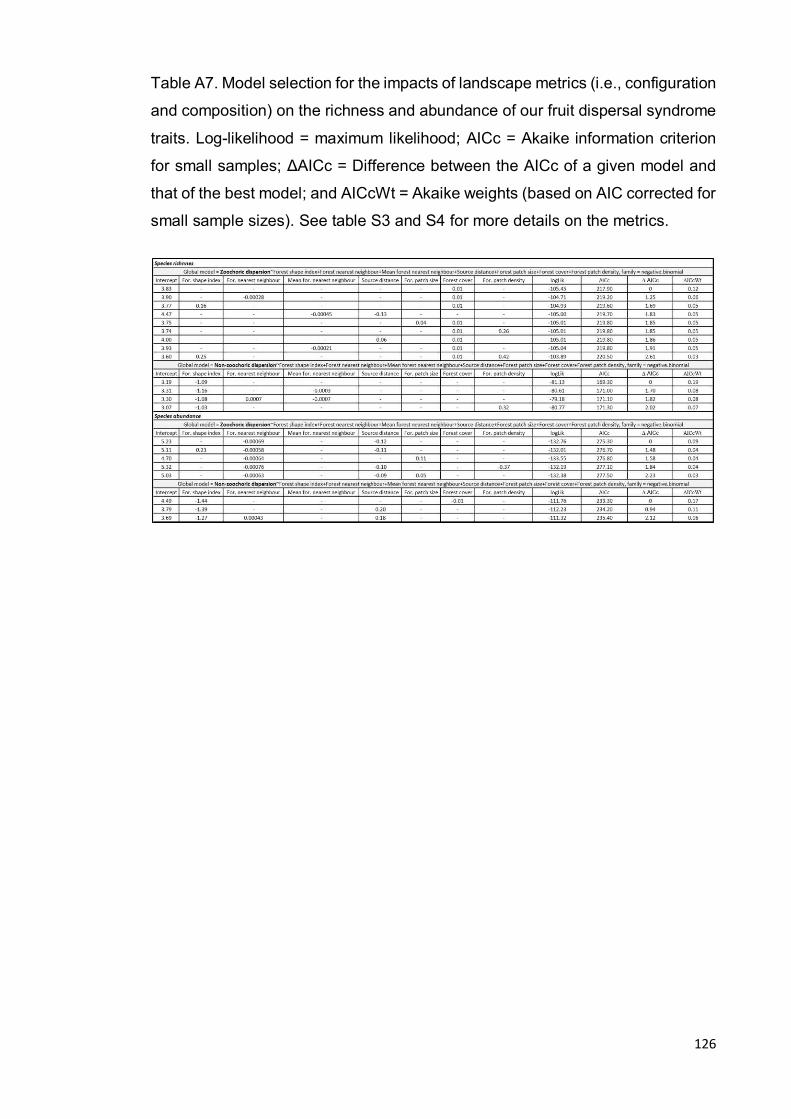
126
Table A7. Model selection for the impacts of landscape metrics (i.e., configuration
and composition) on the richness and abundance of our fruit dispersal syndrome
traits. Log-likelihood = maximum likelihood; AICc = Akaike information criterion
for small samples; ΔAICc = Difference between the AICc of a given model and
that of the best model; and AICcWt = Akaike weights (based on AIC corrected for
small sample sizes). See table S3 and S4 for more details on the metrics.
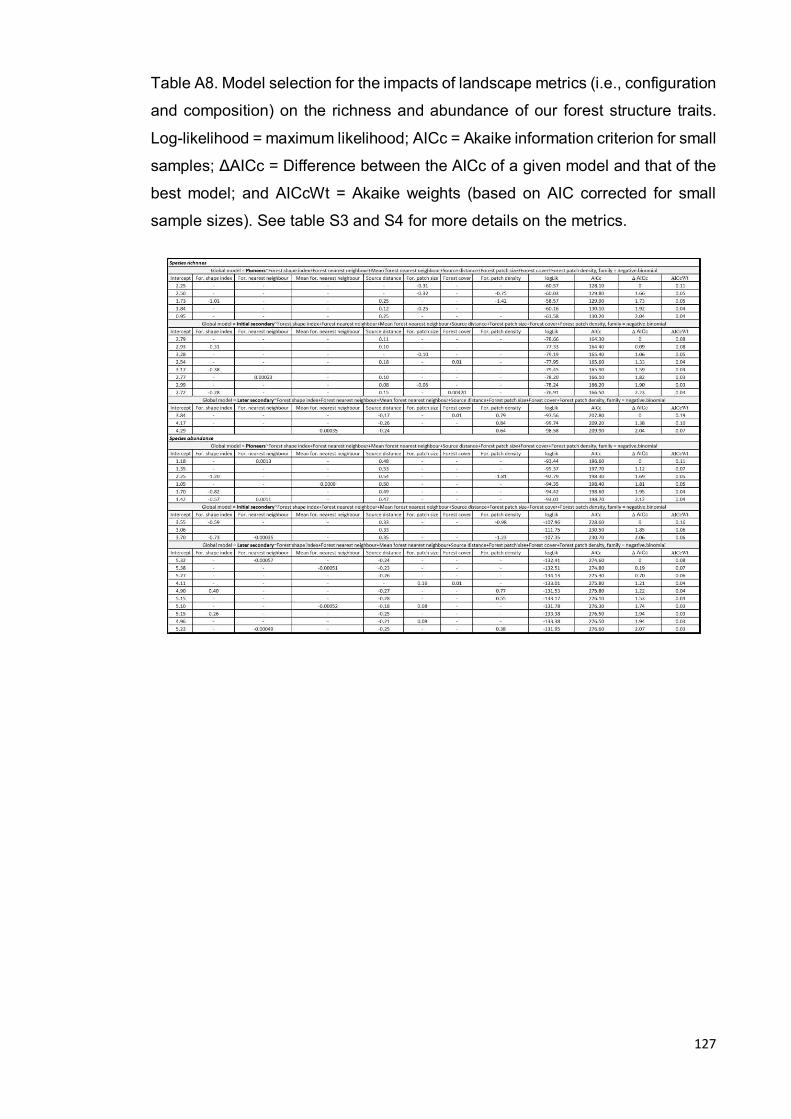
127
Table A8. Model selection for the impacts of landscape metrics (i.e., configuration
and composition) on the richness and abundance of our forest structure traits.
Log-likelihood = maximum likelihood; AICc = Akaike information criterion for small
samples; ΔAICc = Difference between the AICc of a given model and that of the
best model; and AICcWt = Akaike weights (based on AIC corrected for small
sample sizes). See table S3 and S4 for more details on the metrics.
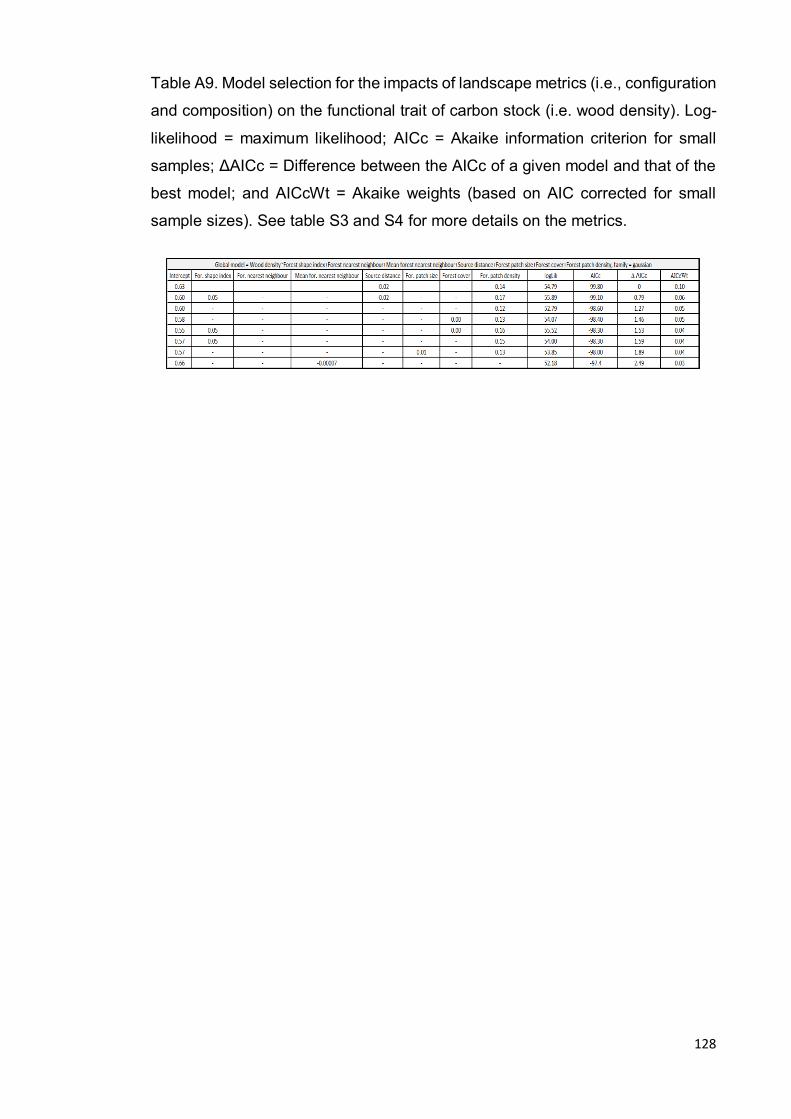
128
Table A9. Model selection for the impacts of landscape metrics (i.e., configuration
and composition) on the functional trait of carbon stock (i.e. wood density). Log-
likelihood = maximum likelihood; AICc = Akaike information criterion for small
samples; ΔAICc = Difference between the AICc of a given model and that of the
best model; and AICcWt = Akaike weights (based on AIC corrected for small
sample sizes). See table S3 and S4 for more details on the metrics.
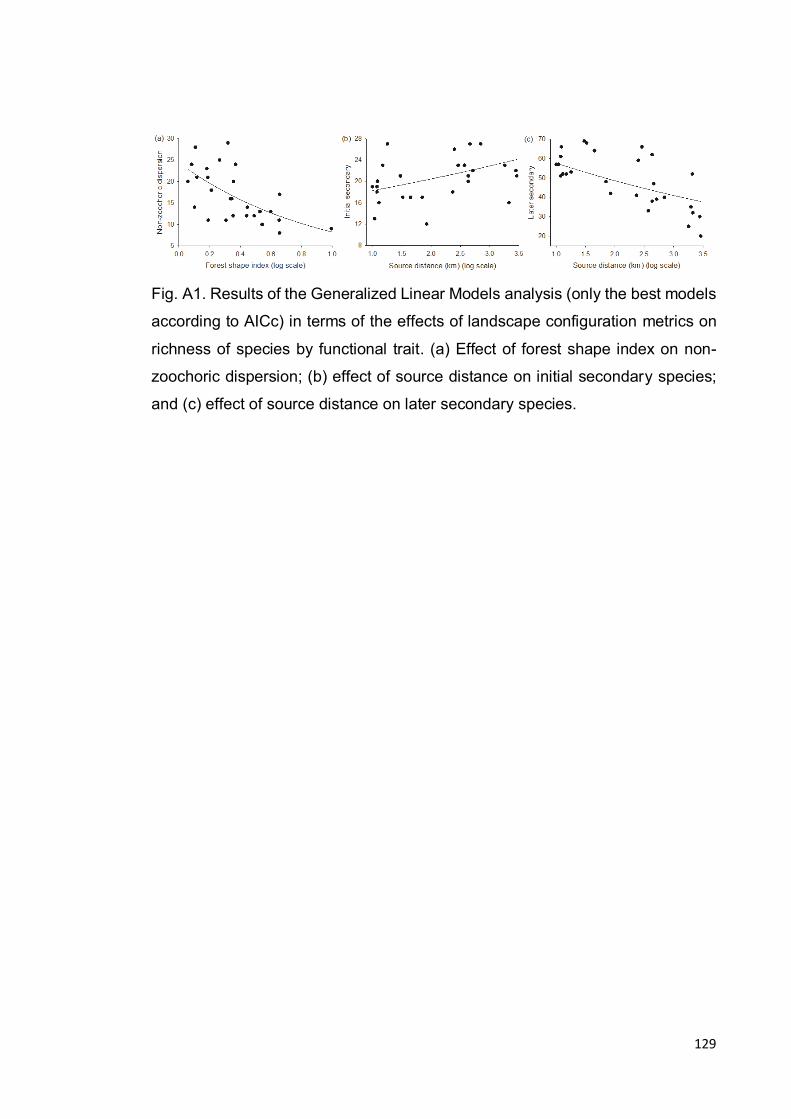
129
Fig. A1. Results of the Generalized Linear Models analysis (only the best models
according to AICc) in terms of the effects of landscape configuration metrics on
richness of species by functional trait. (a) Effect of forest shape index on non-
zoochoric dispersion; (b) effect of source distance on initial secondary species;
and (c) effect of source distance on later secondary species.
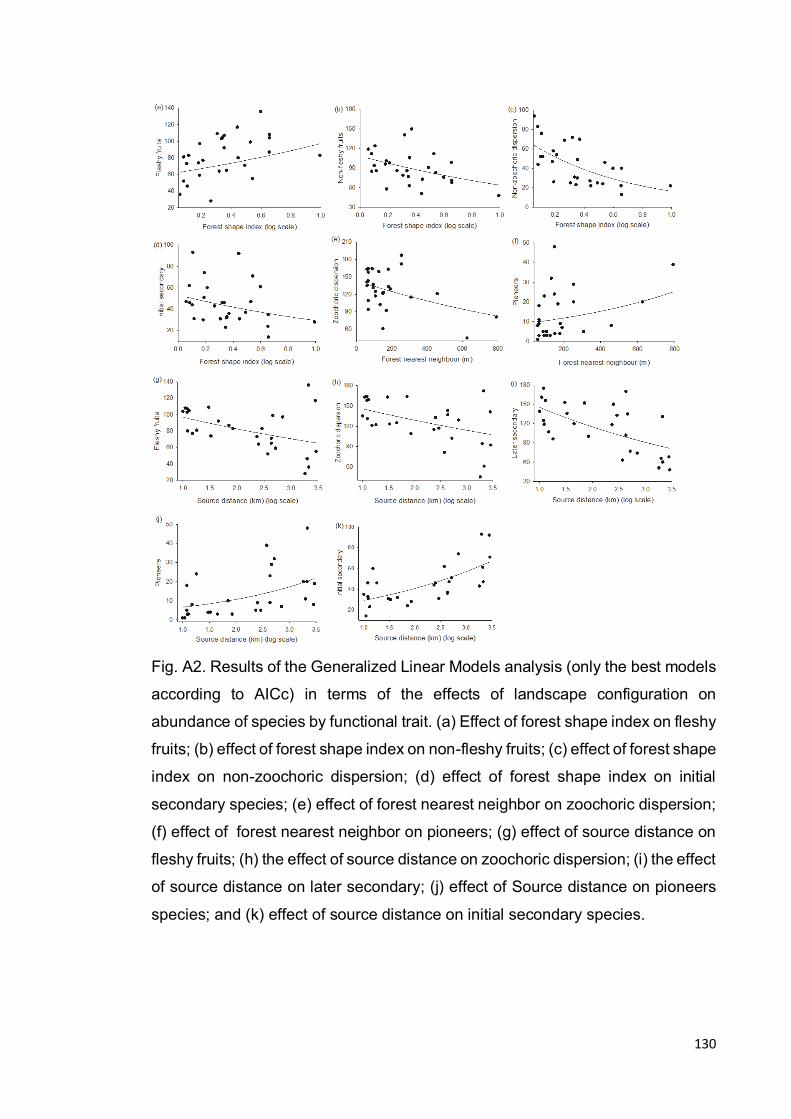
130
Fig. A2. Results of the Generalized Linear Models analysis (only the best models
according to AICc) in terms of the effects of landscape configuration on
abundance of species by functional trait. (a) Effect of forest shape index on fleshy
fruits; (b) effect of forest shape index on non-fleshy fruits; (c) effect of forest shape
index on non-zoochoric dispersion; (d) effect of forest shape index on initial
secondary species; (e) effect of forest nearest neighbor on zoochoric dispersion;
(f) effect of forest nearest neighbor on pioneers; (g) effect of source distance on
fleshy fruits; (h) the effect of source distance on zoochoric dispersion; (i) the effect
of source distance on later secondary; (j) effect of Source distance on pioneers
species; and (k) effect of source distance on initial secondary species.
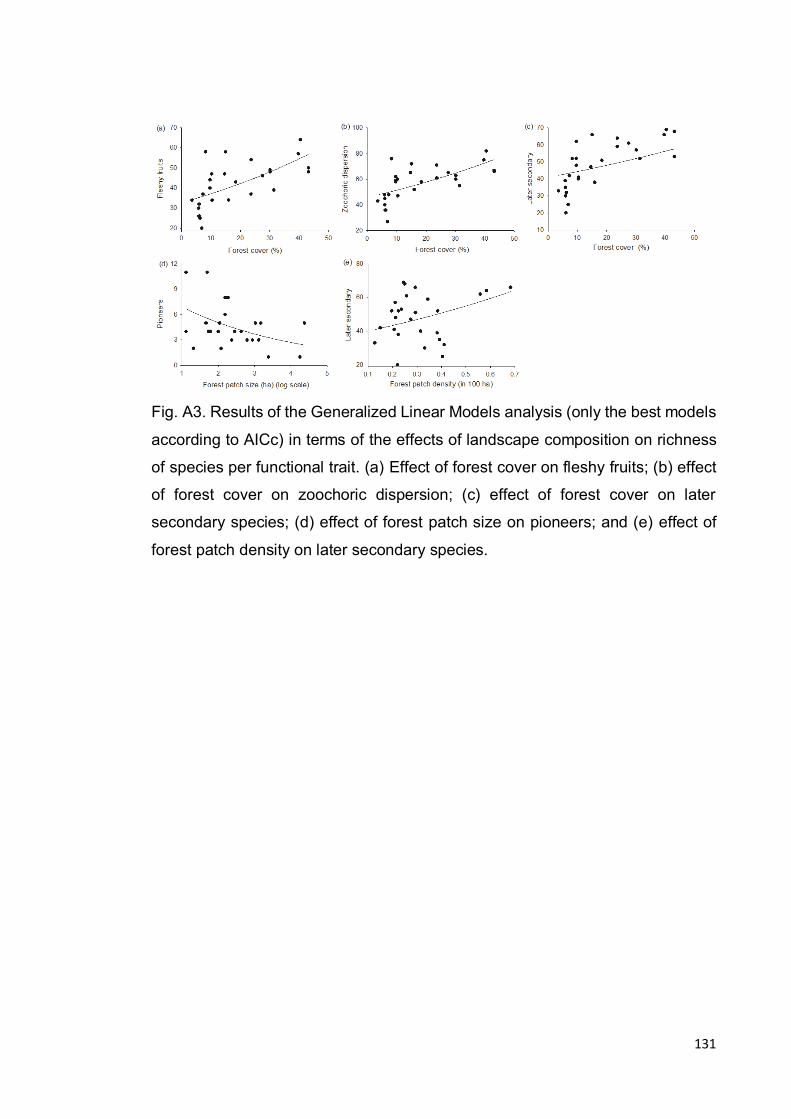
131
Fig. A3. Results of the Generalized Linear Models analysis (only the best models
according to AICc) in terms of the effects of landscape composition on richness
of species per functional trait. (a) Effect of forest cover on fleshy fruits; (b) effect
of forest cover on zoochoric dispersion; (c) effect of forest cover on later
secondary species; (d) effect of forest patch size on pioneers; and (e) effect of
forest patch density on later secondary species.
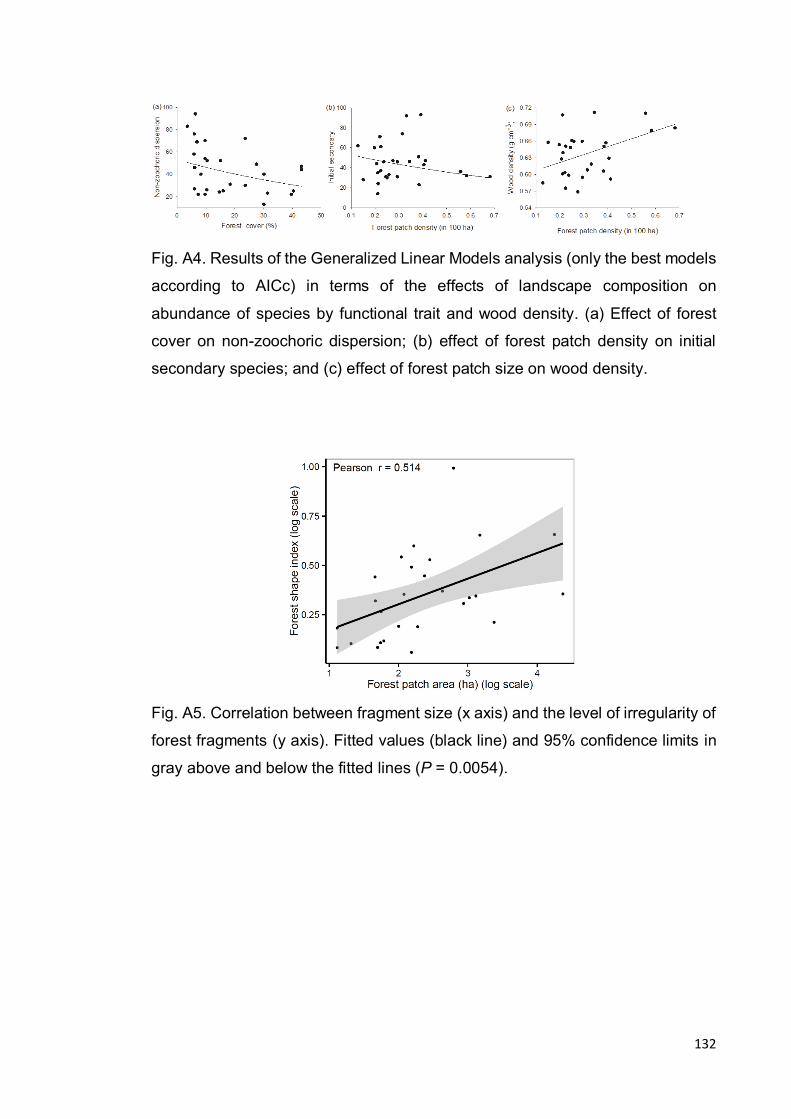
132
Fig. A4. Results of the Generalized Linear Models analysis (only the best models
according to AICc) in terms of the effects of landscape composition on
abundance of species by functional trait and wood density. (a) Effect of forest
cover on non-zoochoric dispersion; (b) effect of forest patch density on initial
secondary species; and (c) effect of forest patch size on wood density.
Fig. A5. Correlation between fragment size (x axis) and the level of irregularity of
forest fragments (y axis). Fitted values (black line) and 95% confidence limits in
gray above and below the fitted lines (P = 0.0054).
133
Supporting References
Bongers, F., Pooter, L., Hawthorne, W.D., Sheil, D., 2009. The intermediate disturbbance hypothesis applies to tropical forests, but disturbance contributes little to tree diversity. Ecol. Lett.12, 798–805. doi:10.1111/j.1461-0248.2009.01329.x
Chave, J., Coomes, D., Jansen, S., Lewis, S.L., Swenson, N.G., Zanne, A.E., 2009. Towards a worldwide wood economics spectrum. Ecol. Lett. 12, 351–366. doi: 10.1111/j.1461-0248.2009.01285.x
Coombe, G., 1976. The development of fleshy fruits. Annu. Rev. Plant Biol. 27,
207–228. doi: 10.1146/annurev.pp.27.060176.001231
Duarte, L.D.S., Bergamin, R.S., Marcilio-Silva, V., Seger, G.D.D.S., Marques, M.C.M., 2014. Phylobetadiversity among Forest Types in the Brazilian Atlantic Forest Complex. PLoS One 9, e105043. doi:10.1371/journal.pone.0105043
Flores, O., Coomes, D.A., 2011. Estimating the wood density of species for carbon stock assessments. Methods Ecol. Evol. 2, 214–220. doi:10.1111/j.2041-210X.2010.00068.x
Hawes, J.E., Peres, C.A., Riley, L.B., Hess, L.L., 2012. Landscape-scale variation in structure and biomass of Amazonian seasonally flooded and unflooded forests. For. Ecol. Manage. 281, 163–176. doi:10.1016/j.foreco.2012.06.023
Magnago, L.F.S., Edwards, D.P., Edwards, F.A., Magrach, A., Martins, S. V., Laurance, W.F., 2014. Functional attributes change but functional richness is unchanged after fragmentation of Brazilian Atlantic forests. J. Ecol. 102, 475–485. doi:10.1111/1365-2745.12206
Magnago, L.F.S., Magrach, A., Laurance, W.F., Martins, S. V., Meira-Neto, J.A. a., Simonelli, M., Edwards, D.P., 2015. Would protecting tropical forest fragments provide carbon and biodiversity co-benefits under redd+? Glob. Chang. Biol. 44, 21, 3455–3468.doi:10.1111/gcb.12937
Oliveira‐Filho, A., Fontes, M., 2000. Patterns of Floristic Differentiation among Atlantic Forests in Southeastern Brazil and the Influence of Climate1. Biotropica 32, 793–810. doi:10.1111/j.1744-7429.2000.tb00619.x
Rolim, S.G., Jesus, R.M., Nascimento, H.E.M., do Couto, H.T.Z., Chambers, J.Q., 2005. Biomass change in an Atlantic tropical moist forest: the ENSO effect in permanent sample plots over a 22-year period. Oecologia 142, 238–246. doi:10.1007/s00442-004-1717-x
SOS Mata Altântica and Instituto Nacional de Pesquisas Espaciais, 2015. Altas dos Remanescentes Florestais e Ecossistemas Associados no Domínio da Mata Altântica, São Paulo, SP, 60 p.
Tabarelli, M., Aguiar, A. V., Girao, L.C., Peres, C.A., Lopes, A.V., 2010. Effects of Pioneer Tree Species Hyperabundance on Forest Fragments in Northeastern Brazil. Conserv. Biol. 24, 1654–1663. doi:10.1111/j.1523-1739.2010.01529.x
Van der Pijl, L., 1982. Principles of Dispersal in Higher Plants, 3rd edn. Springer
134
Verlag, New York.
World Imagery, 2015. Source: Esri, DigitalGlobe, GeoEye, Earthstar Geographics, CNES/Airbus DS, USDA, USGS, AEX, Getmapping, Aerogrid, IGN, IGP, swisstopo, and the GIS User Community.
Zanne, A.E., Lopez-Gonzales, G., Coomes, D.A., Ilic, J., Jansen, S., Lewis, S.L., Miller, R.B., Swenson, N.G., Wiemann, M.C., Chave, J. 2009. Data from: Towards a worldwide wood economics spectrum. Dryad Digital Repository.
doi:10.5060/dryad.234.
135
IV. CAPÍTULO III
Does secondary forest offer important carbon-biodiversity co-benefits in a
highly fragmented landscape?
Text A1 - Supporting methods: Secondary forest age and source distance
The linear distance of secondary forest patches (km) from large forest
blocks (≥1,000 hectares; herein ‘source distance’), was computed with ArcGis (v
10.1) using as a base the vegetation map of Brazilian Atlantic forest (SOS Mata
Atlântica/INPE 2015). This linear distance is only between fragments belonging
to the same type of forest (i.e., Tableland forest).
The map of vegetation used to create “source distance” was produced in
1985, and subsequently updated every five years up to 2005; further updates
were generated for the 2005-2008, 2008-2010 periods and currently every year
since 2010 (SOS Mata Atlântica/INPE, 2015). The vegetation map used in this
study is the 2013-2014 update generated with remote-sensing data from 2015.
Satellite data were acquired by the Operational Land Imager (OLI) sensor
onboard Landsat 8 were processed and used to generate the updated map with
a minimum map unit of three hectares. This dataset depicts the spatial distribution
of the main forest formations within this biome, and has been used to describe
landscape structure via forest loss and fragmentation (Ribeiro et al., 2009) and
to generate estimates of carbon loss due to habitat fragmentation (Pütz et al.,
2014).
Text A2 - Supporting methods: Functional trait matrix
We used 6 functional traits, under described, which are associated with:
(i) Quantity and type of food resource; (ii) Fruit dispersal syndrome; (iii) Forest
structure; and (iv) Carbon storage (see Magnago et al., 2014 for more details).
(i) Food resource: (1) fruit diameter (mm); (2) seed diameter (mm); and (3)
fruit type - categorized into fleshy fruit, when the pericarp can accumulate water
and many organic compounds (see Coombe, 1976 and Magnago et al. 2014),
and non-fleshy fruits. These metrics were obtained from specimens in Herbarium
136
CVRD and literature, supported the database of SpeciesLink (for more details
see: http://splink.cria.org.br/).
(ii) Fruit dispersal syndrome: (4) dispersion type – categorized into
zoochoric and non-zoochoric according to Van der Pijl, (1982). A zoochoric tree
produces diaspores surrounded by fleshy pulp, an aryl or other features that are
typically associated with dispersal by animals, and a non-zoochoric tree has
characteristics that indicate dispersal by abiotic means, such as winged seeds,
feathers or a lack of features that indicate dispersal via methods other than
downfall or explosive indehiscence (Magnago et al., 2014). These dispersion type
of each species was again obtained from specimens in Herbarium of the Vale -
CVRD and trought the data available in SpeciesLink (for more details see:
http://splink.cria.org.br/), and Magnago et al., (2014).
(iii) Forest structure: (5) successional groups – categorized as pioneer,
initial secondary and later secondary according to Bongers et al., (2009). We
considered as pioneers those trees that develop in conditions of high light and
generally do not occur in the understory, initial secondary those trees that
develop in intermediate shading conditions and as later secondary those trees
that develop exclusively and permanently in the understory (see Magnago et al.,
2014). The study species were classified using the databases of Jesus and
Rolim, (2005) and Magnago et al., (2014).
(iv) Carbon storage: (6) wood density in dry weight (g cm-3) - obtained
from Global Wood Density database (GWD) (available in: http://goo.gl/Upv8Ry,
Chave et al., 2009; Zanne et al., 2009). When a species was identified at the
genus level or was not present in the GWD database, we used the average
density of wood for all species of the same genus in the database (for more
details see Flores and Coomes, 2011; Hawes et al., 2012; Magnago et al., 2014).
Text A3 - Supporting methods: Null model
Ses takes the following form: [(observed – mean expected) / standard
deviation of expected], where observed values are obtained from the sampled
data, expected mean is the average of 999 randomizations and standard
deviation of expected is the standard deviation of the 999 simulated communities.
We calculated these metrics of phylogenetic and functional diversity using
“picante” package (Kembel et al. 2010) in R, version 3.2.1 (R Development Core

137
Team. 2015). For the standard effect size (ses) calculations, our tree was
compared with 10,000 null model randomizations using the algorithm "phylogeny
pool" (Swenson 2014). The applied null model randomizes the identity of species
occurring in each sample, however maintains constant species richness and
abundance within each transect. Assuming therefore, that all species are equally
likely to occur in any fragment the habitat type (Arroyo-Rodríguez et al., 2012).
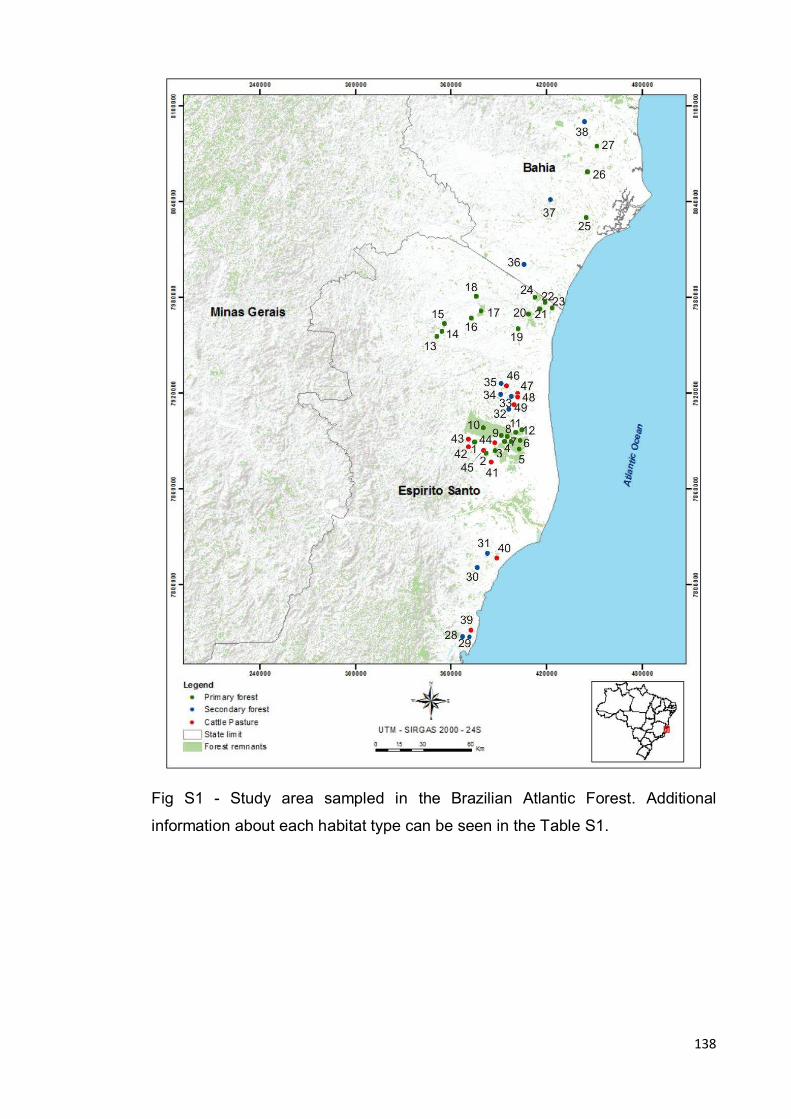
138
Fig S1 - Study area sampled in the Brazilian Atlantic Forest. Additional
information about each habitat type can be seen in the Table S1.
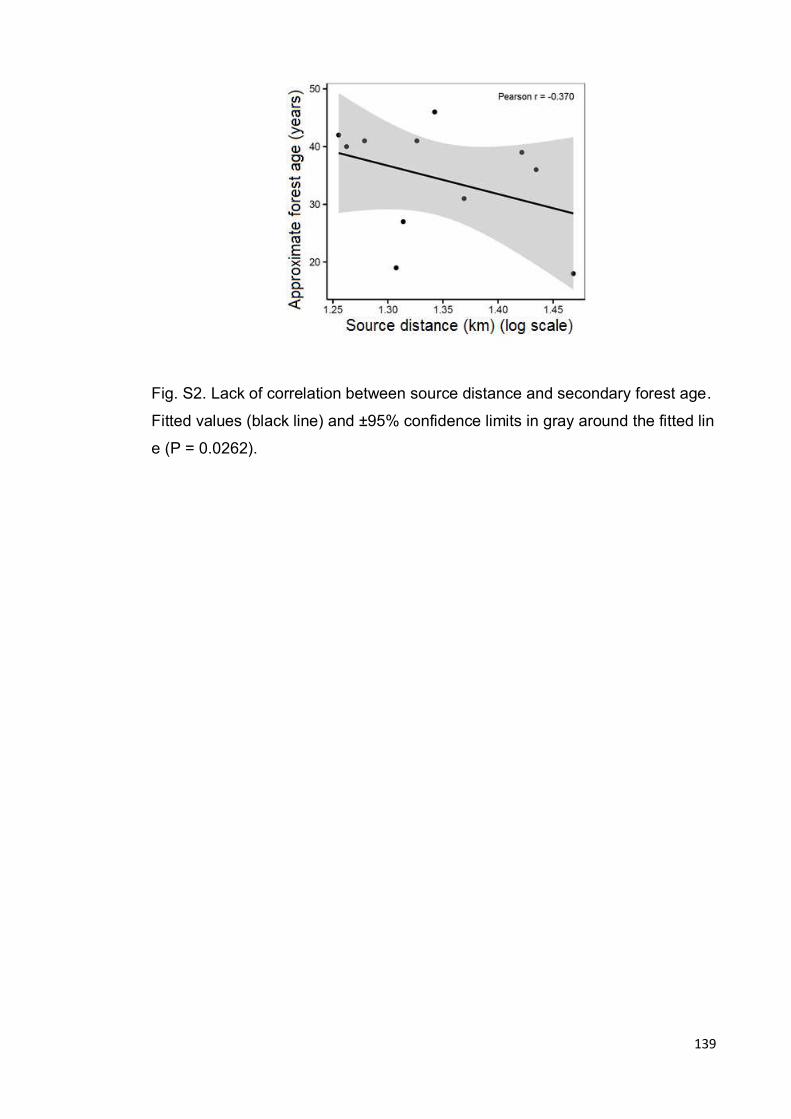
139
Fig. S2. Lack of correlation between source distance and secondary forest age.
Fitted values (black line) and ±95% confidence limits in gray around the fitted lin
e (P = 0.0262).
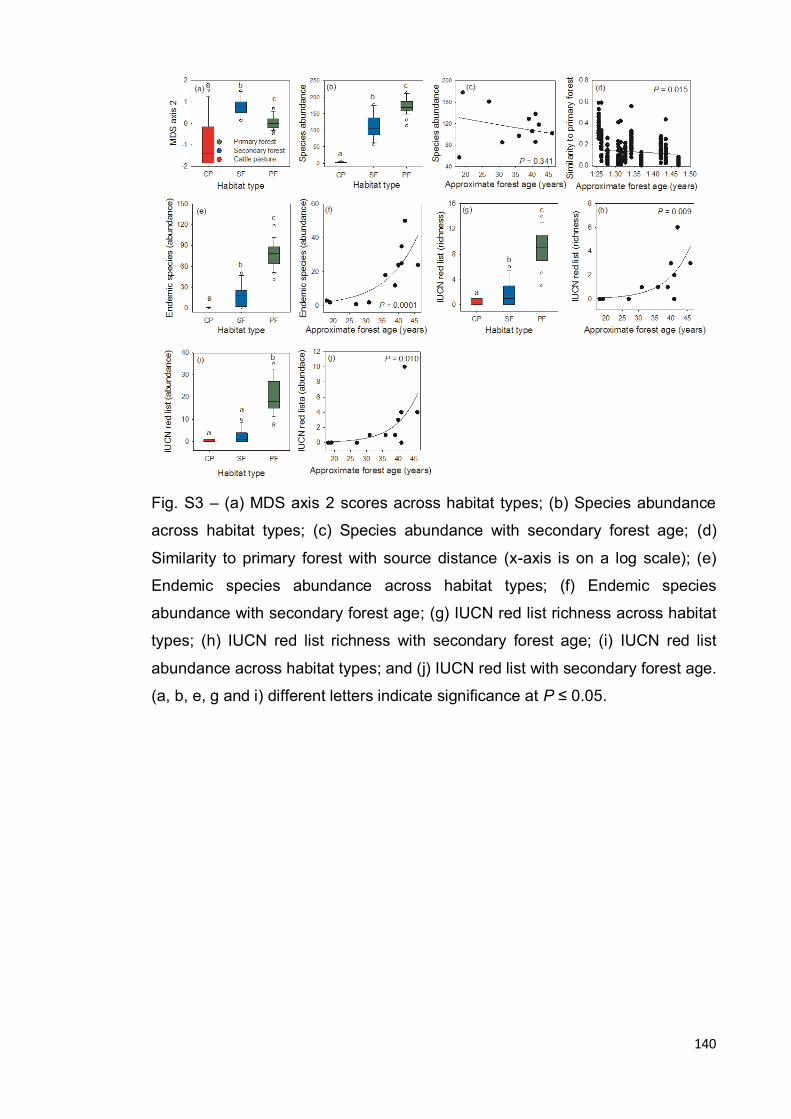
140
Fig. S3 – (a) MDS axis 2 scores across habitat types; (b) Species abundance
across habitat types; (c) Species abundance with secondary forest age; (d)
Similarity to primary forest with source distance (x-axis is on a log scale); (e)
Endemic species abundance across habitat types; (f) Endemic species
abundance with secondary forest age; (g) IUCN red list richness across habitat
types; (h) IUCN red list richness with secondary forest age; (i) IUCN red list
abundance across habitat types; and (j) IUCN red list with secondary forest age.
(a, b, e, g and i) different letters indicate significance at P ≤ 0.05.
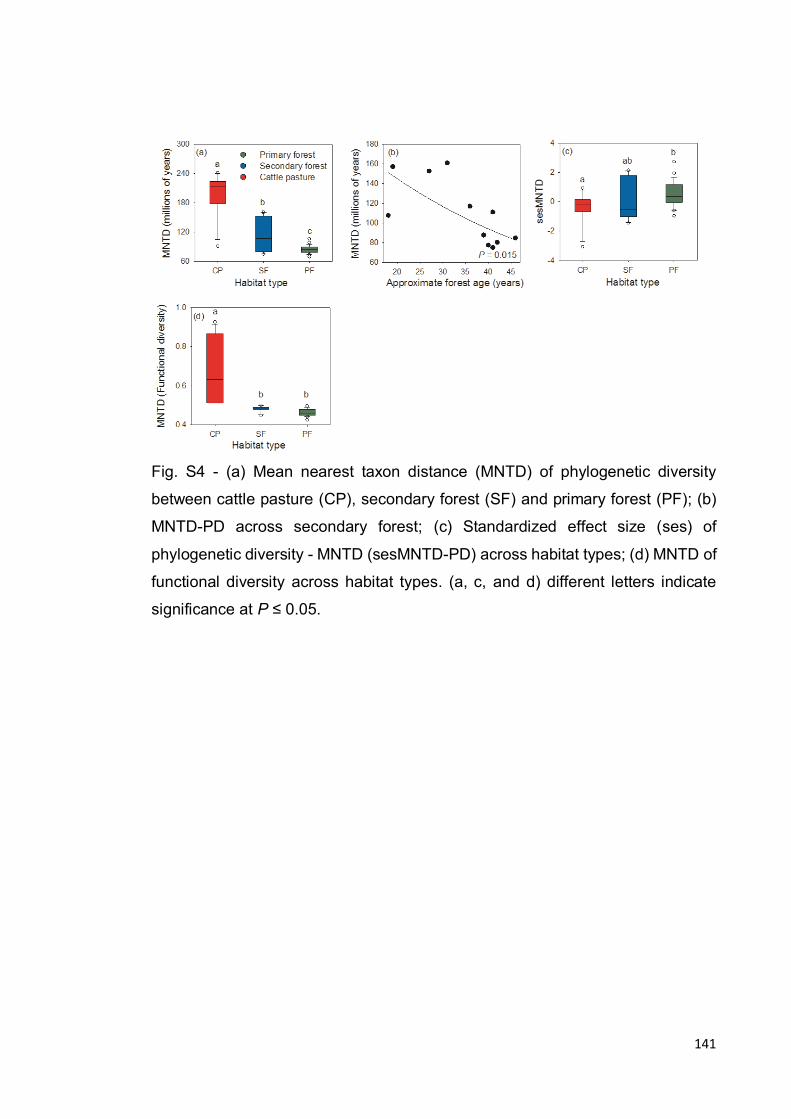
141
Fig. S4 - (a) Mean nearest taxon distance (MNTD) of phylogenetic diversity
between cattle pasture (CP), secondary forest (SF) and primary forest (PF); (b)
MNTD-PD across secondary forest; (c) Standardized effect size (ses) of
phylogenetic diversity - MNTD (sesMNTD-PD) across habitat types; (d) MNTD of
functional diversity across habitat types. (a, c, and d) different letters indicate
significance at P ≤ 0.05.
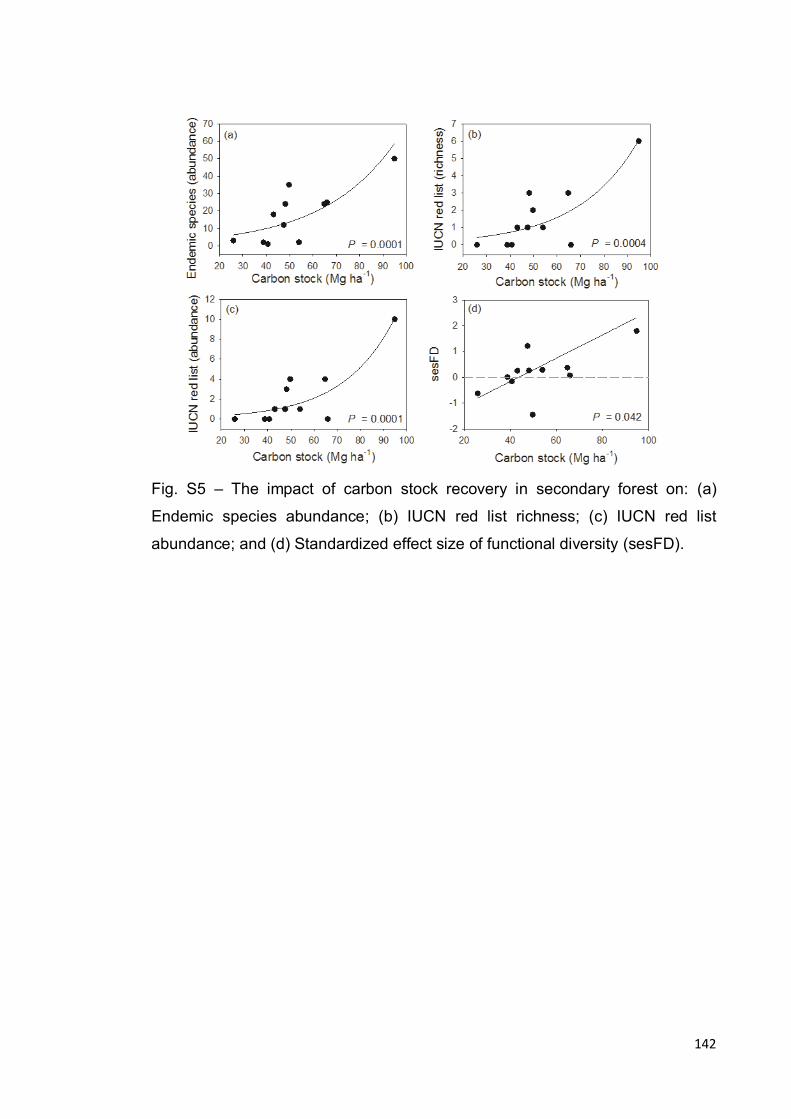
142
Fig. S5 – The impact of carbon stock recovery in secondary forest on: (a)
Endemic species abundance; (b) IUCN red list richness; (c) IUCN red list
abundance; and (d) Standardized effect size of functional diversity (sesFD).
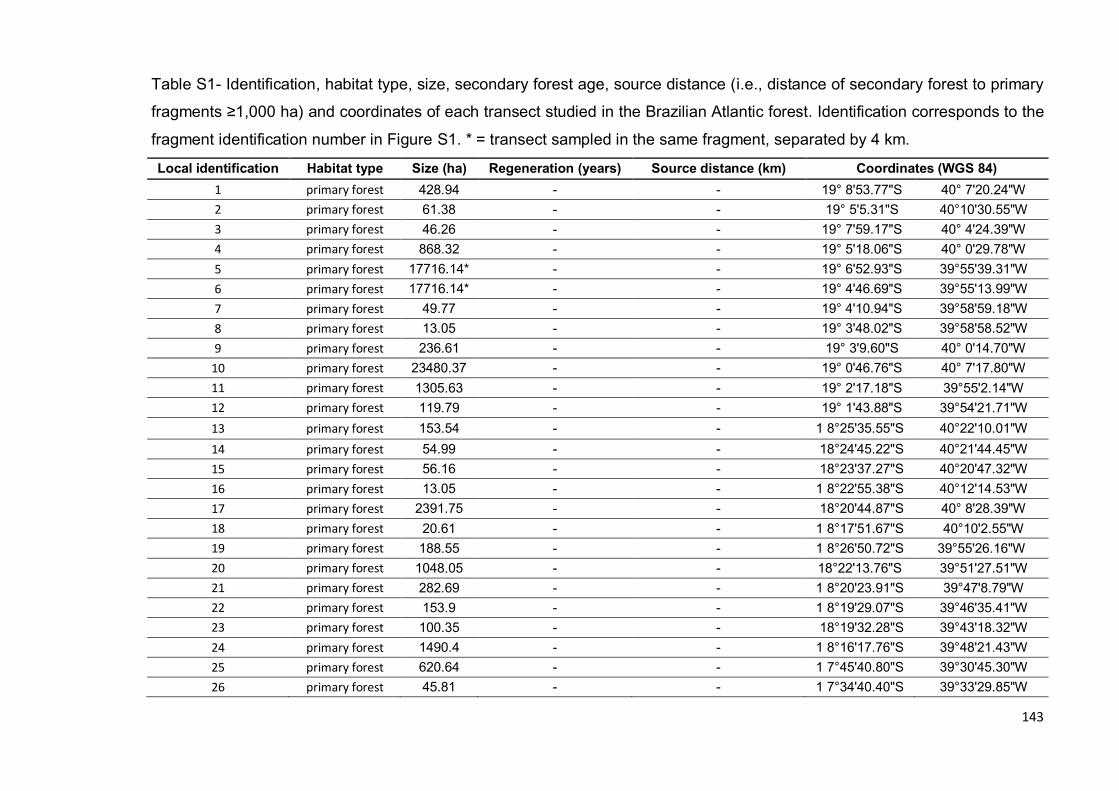
143
Table S1- Identification, habitat type, size, secondary forest age, source distance (i.e., distance of secondary forest to primary
fragments ≥1,000 ha) and coordinates of each transect studied in the Brazilian Atlantic forest. Identification corresponds to the
fragment identification number in Figure S1. * = transect sampled in the same fragment, separated by 4 km.
Local identification Habitat type Size (ha) Regeneration (years) Source distance (km) Coordinates (WGS 84)
1 primary forest 428.94 - - 19° 8'53.77"S 40° 7'20.24"W
2 primary forest 61.38 - - 19° 5'5.31"S 40°10'30.55"W
3 primary forest 46.26 - - 19° 7'59.17"S 40° 4'24.39"W
4 primary forest 868.32 - - 19° 5'18.06"S 40° 0'29.78"W
5 primary forest 17716.14* - - 19° 6'52.93"S 39°55'39.31"W
6 primary forest 17716.14* - - 19° 4'46.69"S 39°55'13.99"W
7 primary forest 49.77 - - 19° 4'10.94"S 39°58'59.18"W
8 primary forest 13.05 - - 19° 3'48.02"S 39°58'58.52"W
9 primary forest 236.61 - - 19° 3'9.60"S 40° 0'14.70"W
10 primary forest 23480.37 - - 19° 0'46.76"S 40° 7'17.80"W
11 primary forest 1305.63 - - 19° 2'17.18"S 39°55'2.14"W
12 primary forest 119.79 - - 19° 1'43.88"S 39°54'21.71"W
13 primary forest 153.54 - - 1 8°25'35.55"S 40°22'10.01"W
14 primary forest 54.99 - - 18°24'45.22"S 40°21'44.45"W
15 primary forest 56.16 - - 18°23'37.27"S 40°20'47.32"W
16 primary forest 13.05 - - 1 8°22'55.38"S 40°12'14.53"W
17 primary forest 2391.75 - - 18°20'44.87"S 40° 8'28.39"W
18 primary forest 20.61 - - 1 8°17'51.67"S 40°10'2.55"W
19 primary forest 188.55 - - 1 8°26'50.72"S 39°55'26.16"W
20 primary forest 1048.05 - - 18°22'13.76"S 39°51'27.51"W
21 primary forest 282.69 - - 1 8°20'23.91"S 39°47'8.79"W
22 primary forest 153.9 - - 1 8°19'29.07"S 39°46'35.41"W
23 primary forest 100.35 - - 18°19'32.28"S 39°43'18.32"W
24 primary forest 1490.4 - - 1 8°16'17.76"S 39°48'21.43"W
25 primary forest 620.64 - - 1 7°45'40.80"S 39°30'45.30"W
26 primary forest 45.81 - - 1 7°34'40.40"S 39°33'29.85"W
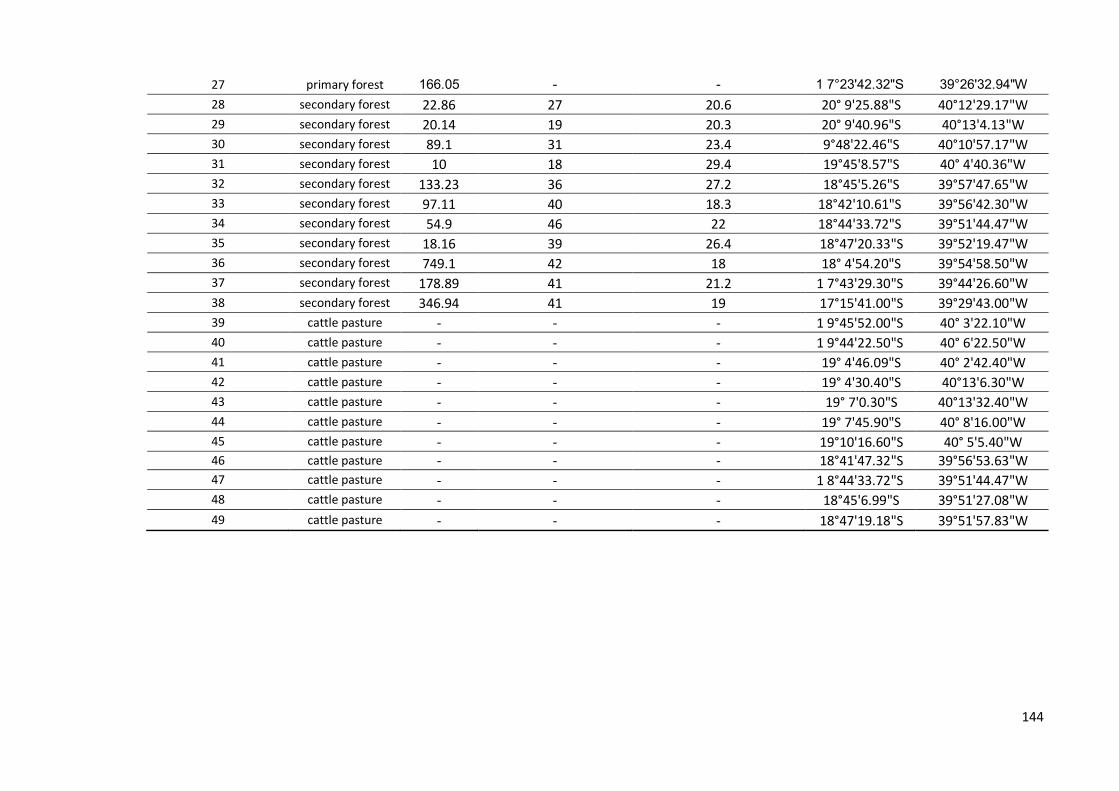
144
27 primary forest 166.05 - - 1 7°23'42.32"S 39°26'32.94"W
28 secondary forest 22.86 27 20.6 20° 9'25.88"S 40°12'29.17"W
29 secondary forest 20.14 19 20.3 20° 9'40.96"S 40°13'4.13"W
30 secondary forest 89.1 31 23.4 9°48'22.46"S 40°10'57.17"W
31 secondary forest 10 18 29.4 19°45'8.57"S 40° 4'40.36"W
32 secondary forest 133.23 36 27.2 18°45'5.26"S 39°57'47.65"W
33 secondary forest 97.11 40 18.3 18°42'10.61"S 39°56'42.30"W
34 secondary forest 54.9 46 22 18°44'33.72"S 39°51'44.47"W
35 secondary forest 18.16 39 26.4 18°47'20.33"S 39°52'19.47"W
36 secondary forest 749.1 42 18 18° 4'54.20"S 39°54'58.50"W
37 secondary forest 178.89 41 21.2 1 7°43'29.30"S 39°44'26.60"W
38 secondary forest 346.94 41 19 17°15'41.00"S 39°29'43.00"W
39 cattle pasture - - - 1 9°45'52.00"S 40° 3'22.10"W
40 cattle pasture - - - 1 9°44'22.50"S 40° 6'22.50"W
41 cattle pasture - - - 19° 4'46.09"S 40° 2'42.40"W
42 cattle pasture - - - 19° 4'30.40"S 40°13'6.30"W
43 cattle pasture - - - 19° 7'0.30"S 40°13'32.40"W
44 cattle pasture - - - 19° 7'45.90"S 40° 8'16.00"W
45 cattle pasture - - - 19°10'16.60"S 40° 5'5.40"W
46 cattle pasture - - - 18°41'47.32"S 39°56'53.63"W
47 cattle pasture - - - 1 8°44'33.72"S 39°51'44.47"W
48 cattle pasture - - - 18°45'6.99"S 39°51'27.08"W
49 cattle pasture - - - 18°47'19.18"S 39°51'57.83"W
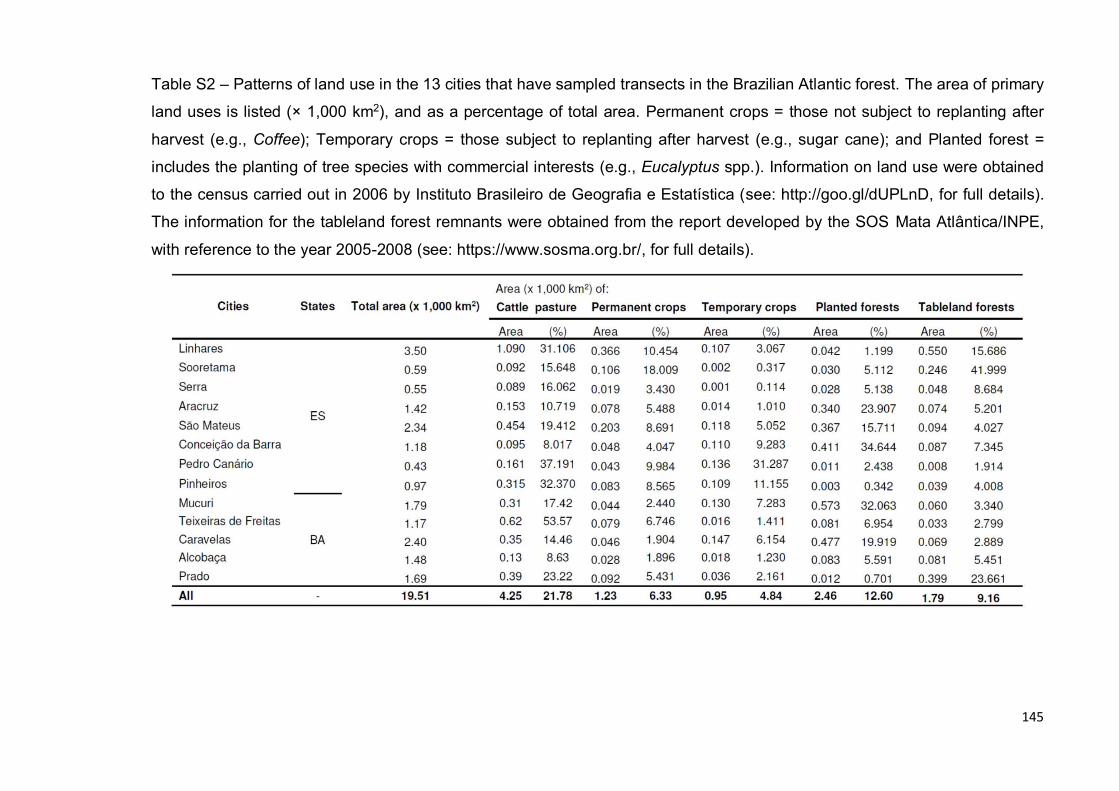
145
Table S2 – Patterns of land use in the 13 cities that have sampled transects in the Brazilian Atlantic forest. The area of primary
land uses is listed (× 1,000 km2), and as a percentage of total area. Permanent crops = those not subject to replanting after
harvest (e.g., Coffee); Temporary crops = those subject to replanting after harvest (e.g., sugar cane); and Planted forest =
includes the planting of tree species with commercial interests (e.g., Eucalyptus spp.). Information on land use were obtained
to the census carried out in 2006 by Instituto Brasileiro de Geografia e Estatística (see: http://goo.gl/dUPLnD, for full details).
The information for the tableland forest remnants were obtained from the report developed by the SOS Mata Atlântica/INPE,
with reference to the year 2005-2008 (see: https://www.sosma.org.br/, for full details).
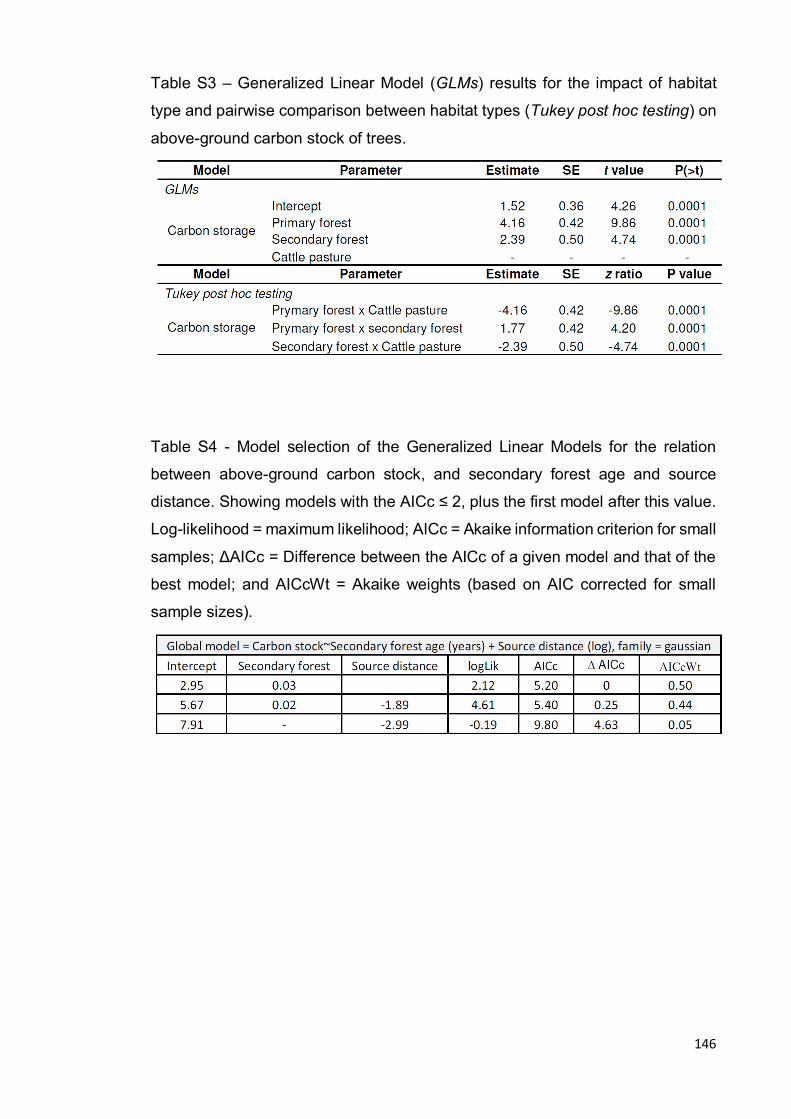
146
Table S3 – Generalized Linear Model (GLMs) results for the impact of habitat
type and pairwise comparison between habitat types (Tukey post hoc testing) on
above-ground carbon stock of trees.
Table S4 - Model selection of the Generalized Linear Models for the relation
between above-ground carbon stock, and secondary forest age and source
distance. Showing models with the AICc ≤ 2, plus the first model after this value.
Log-likelihood = maximum likelihood; AICc = Akaike information criterion for small
samples; ΔAICc = Difference between the AICc of a given model and that of the
best model; and AICcWt = Akaike weights (based on AIC corrected for small
sample sizes).
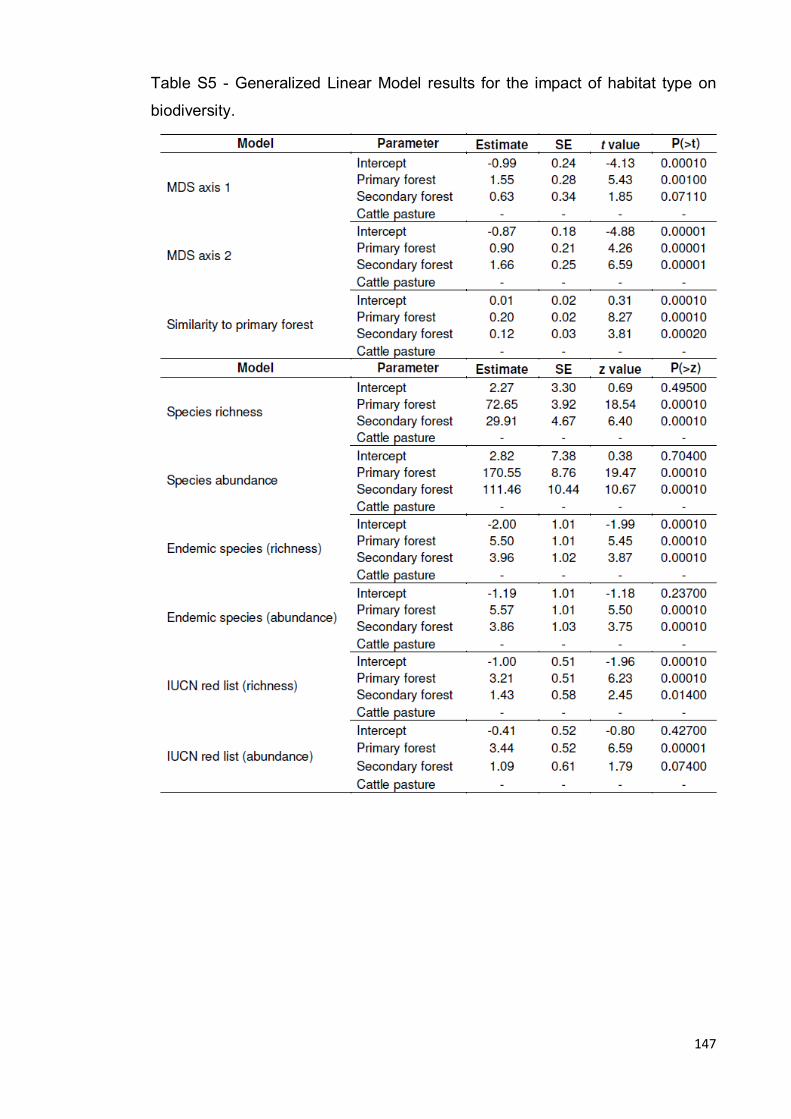
147
Table S5 - Generalized Linear Model results for the impact of habitat type on
biodiversity.
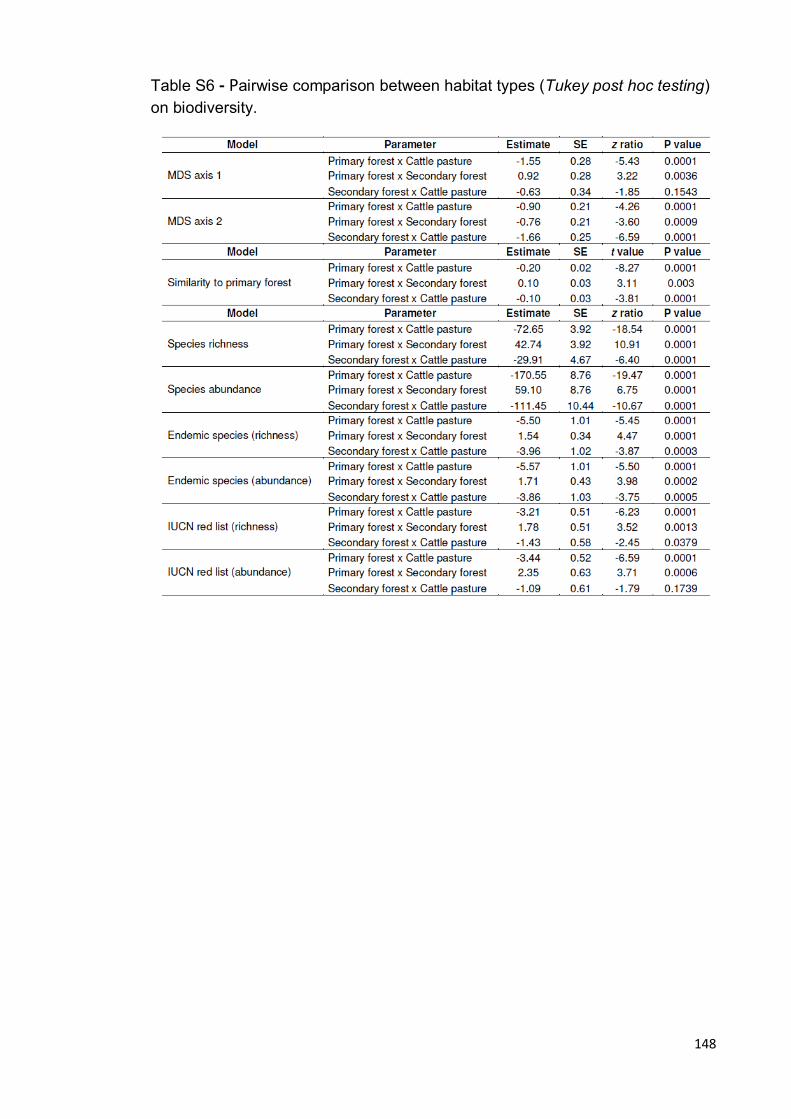
148
Table S6 - Pairwise comparison between habitat types (Tukey post hoc testing) on biodiversity.
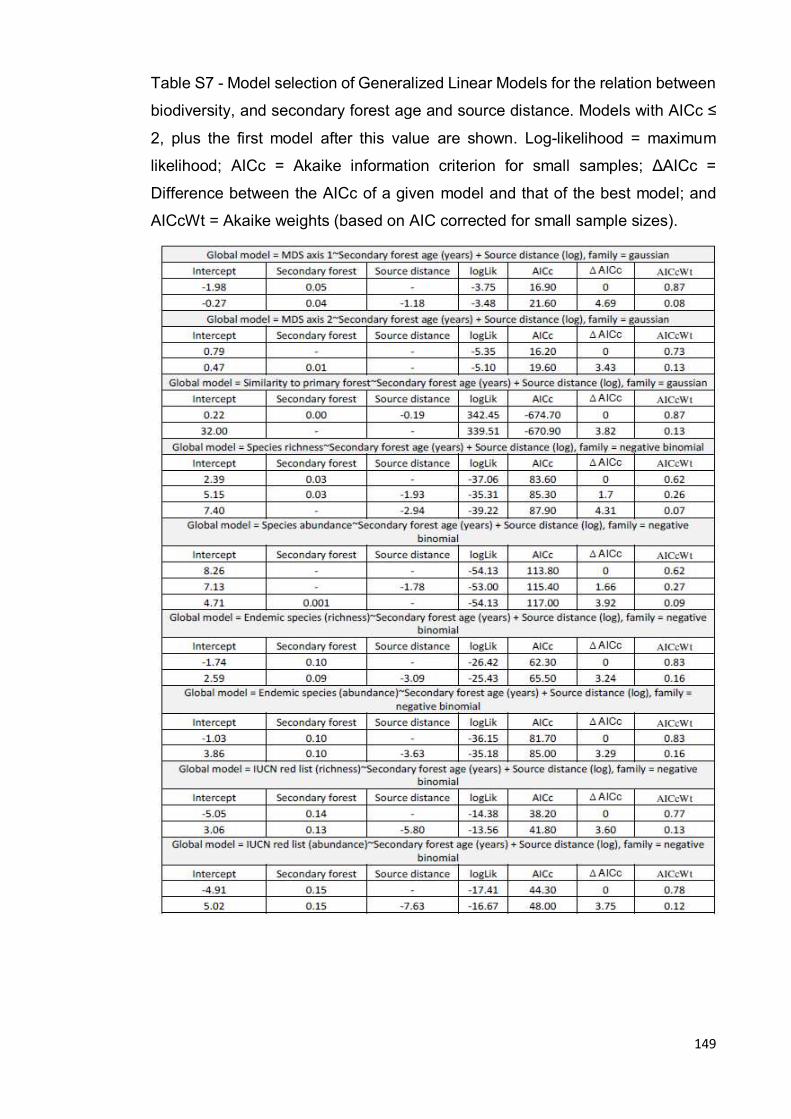
149
Table S7 - Model selection of Generalized Linear Models for the relation between
biodiversity, and secondary forest age and source distance. Models with AICc ≤
2, plus the first model after this value are shown. Log-likelihood = maximum
likelihood; AICc = Akaike information criterion for small samples; ΔAICc =
Difference between the AICc of a given model and that of the best model; and
AICcWt = Akaike weights (based on AIC corrected for small sample sizes).
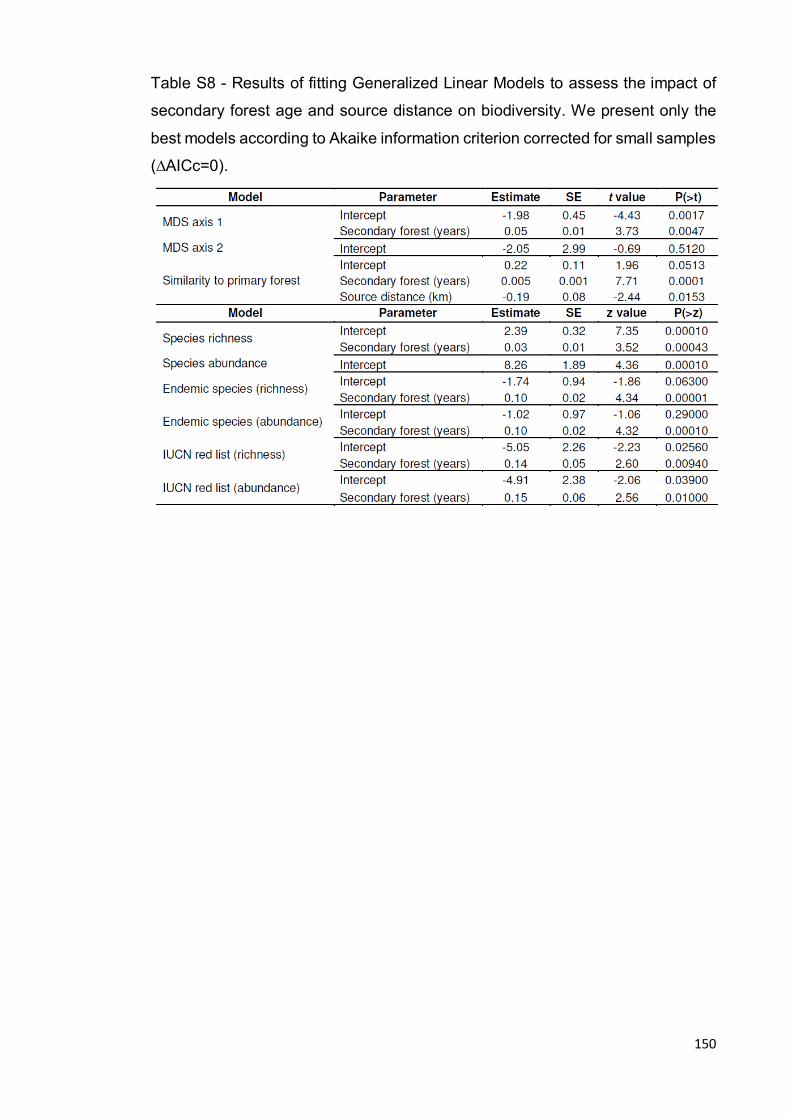
150
Table S8 - Results of fitting Generalized Linear Models to assess the impact of
secondary forest age and source distance on biodiversity. We present only the
best models according to Akaike information criterion corrected for small samples
(∆AICc=0).

151
Table S9 - Generalized Linear Model results for the impact of habitat type on
phylogenetic and functional diversity metrics.
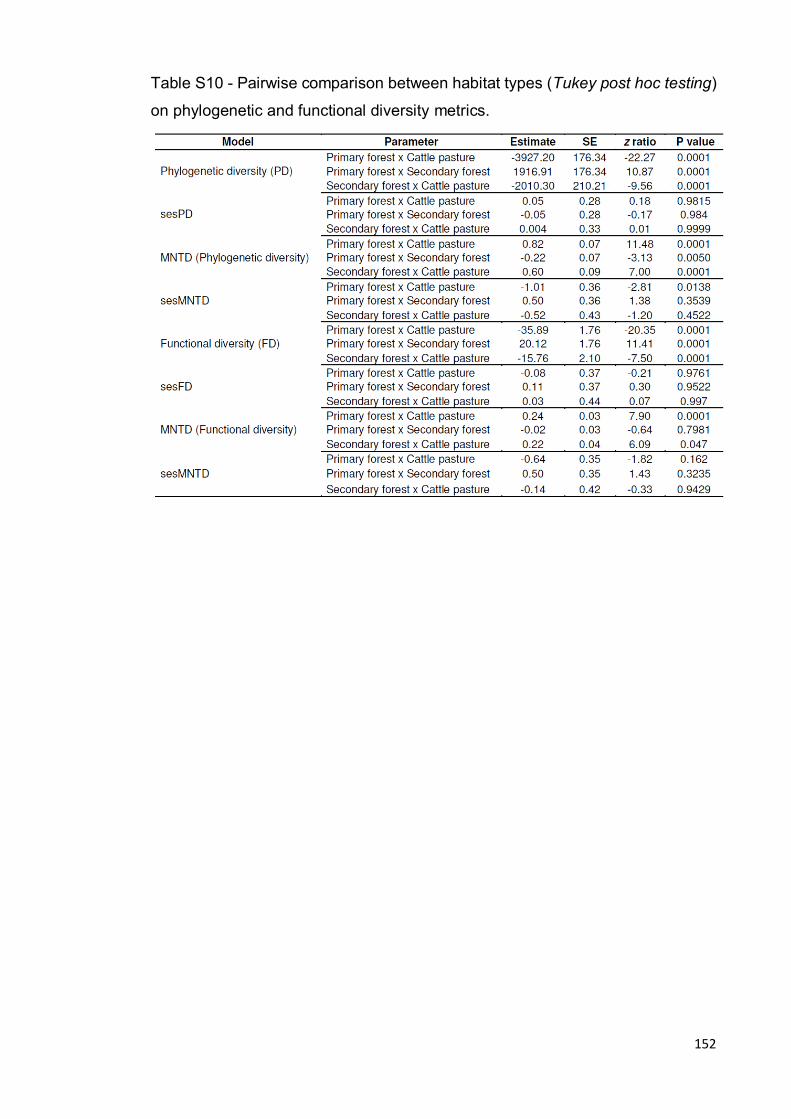
152
Table S10 - Pairwise comparison between habitat types (Tukey post hoc testing)
on phylogenetic and functional diversity metrics.
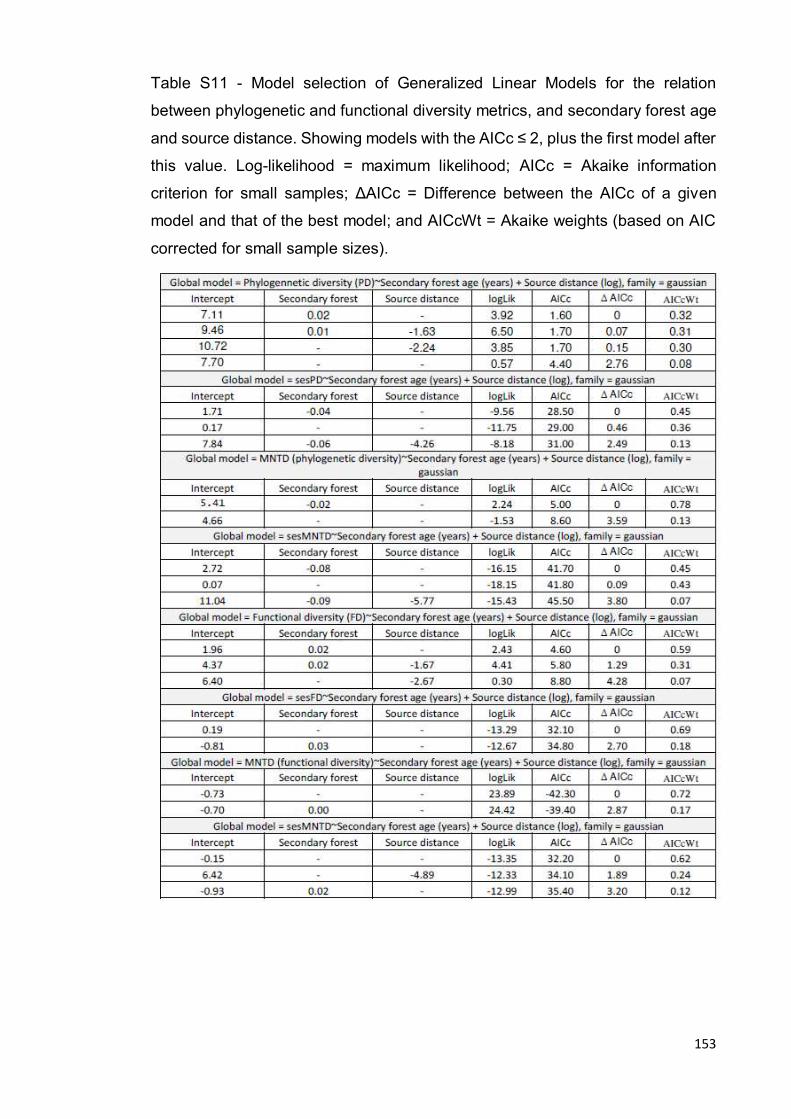
153
Table S11 - Model selection of Generalized Linear Models for the relation
between phylogenetic and functional diversity metrics, and secondary forest age
and source distance. Showing models with the AICc ≤ 2, plus the first model after
this value. Log-likelihood = maximum likelihood; AICc = Akaike information
criterion for small samples; ΔAICc = Difference between the AICc of a given
model and that of the best model; and AICcWt = Akaike weights (based on AIC
corrected for small sample sizes).
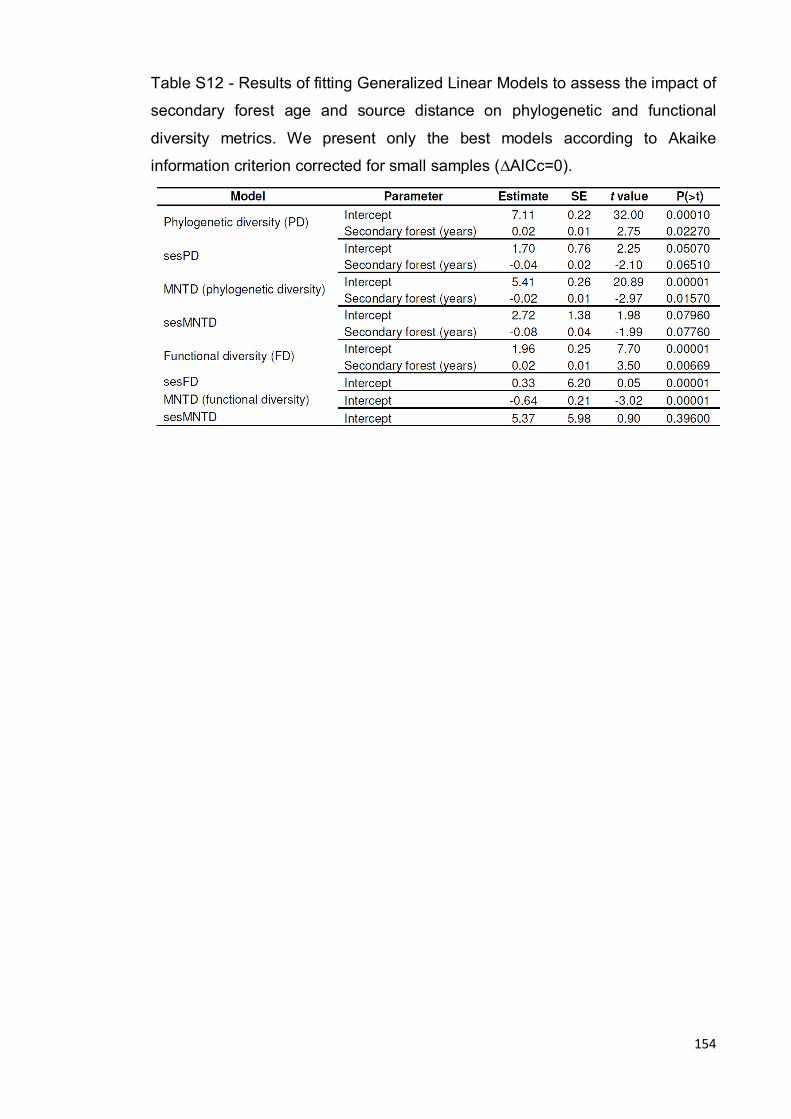
154
Table S12 - Results of fitting Generalized Linear Models to assess the impact of
secondary forest age and source distance on phylogenetic and functional
diversity metrics. We present only the best models according to Akaike
information criterion corrected for small samples (∆AICc=0).
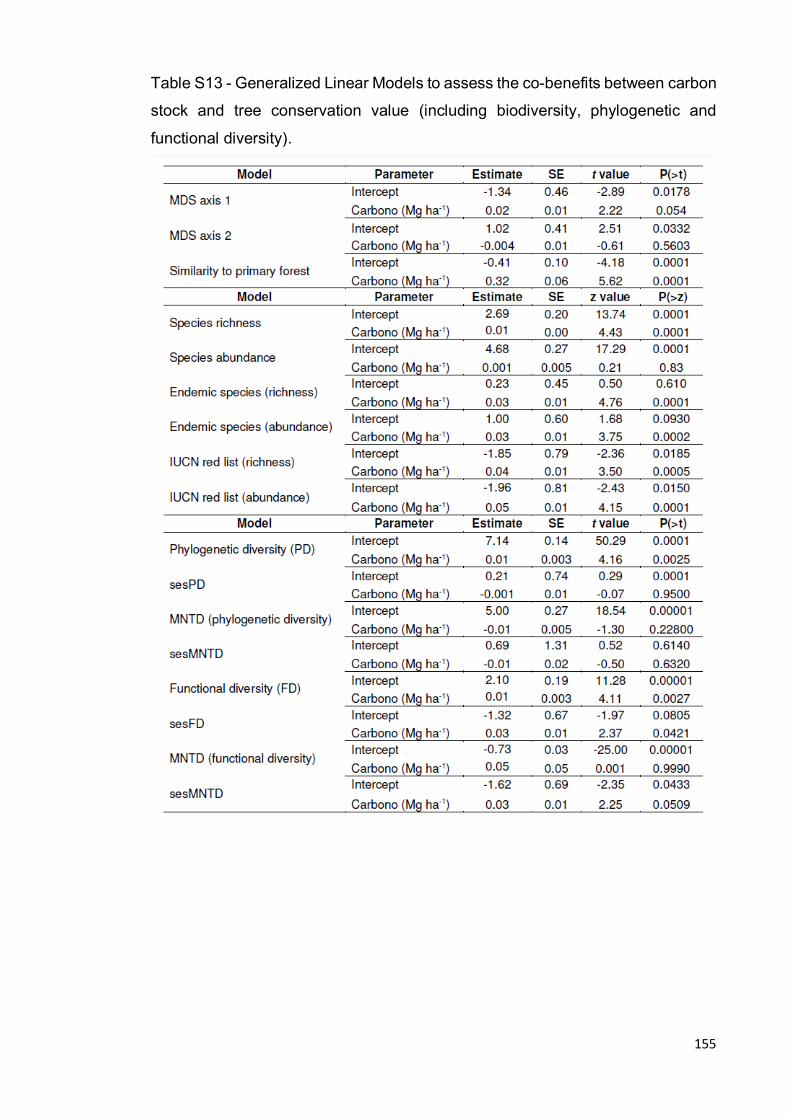
155
Table S13 - Generalized Linear Models to assess the co-benefits between carbon
stock and tree conservation value (including biodiversity, phylogenetic and
functional diversity).
156
Supplemental References
Arroyo-Rodríguez, V., Cavender-Bares, J., Escobar, F., Melo, F.P.L., Tabarelli, M. & Santos, B.A. (2012) Maintenance of tree phylogenetic diversity in a highly fragmented rain forest. Journal of Ecology, 100, 702–711.
Bongers, F., Pooter, L., Hawthorne, W.D., Sheil, D., 2009. The intermediate disturbbance hypothesis applies to tropical forests, but disturbance contributes little to tree diversity. Ecol. Lett.12, 798–805.
Chave, J., Coomes, D., Jansen, S., Lewis, S.L., Swenson, N.G., Zanne, A.E., 2009. Towards a worldwide wood economics spectrum. Ecol. Lett. 12, 351–366.
Coombe, G., 1976. The development of fleshy fruits. Annu. Rev. Plant Biol. 27,
207–228. doi: 10.1146/annurev.pp.27.060176.001231
Kembel, S.W., Cowan, P.D., Helmus, M.R., Cornwell, W.K., Morlon, H., Ackerly, D.D., Blomberg, S.P. & Webb, C.O. (2010) Picante: R tools for integrating
phylogenies and ecology. Bioinformatics, 26, 1463–1464.
Magnago, L.F.S., Edwards, D.P., Edwards, F.A., Magrach, A., Martins, S. V., Laurance, W.F., 2014. Functional attributes change but functional richness is unchanged after fragmentation of Brazilian Atlantic forests. J. Ecol. 102, 475–485.
Pütz, S., Groeneveld, J., Henle, K., Knogge, C., Martensen, A.C., Metz, M., Metzger, J.P., Ribeiro, M.C., de Paula, M.D., Huth, A., 2014. Long-term carbon loss in fragmented Neotropical forests. Nat. Commun. 5, 5037.
Ribeiro, M.C., Metzger, J.P., Martensen, A.C., Ponzoni, F.J., Hirota, M.M., 2009. The Brazilian Atlantic Forest: How much is left, and how is the remaining forest distributed? Implications for conservation. Biol. Conserv. 142, 1141–1153.
Rolim, S.G., Jesus, R.M., Nascimento, H.E.M., do Couto, H.T.Z., Chambers, J.Q., 2005. Biomass change in an Atlantic tropical moist forest: the ENSO effect in permanent sample plots over a 22-year period. Oecologia 142, 238–246.
Swenson, N.G. (2014) Functional and Phylogenetic Ecology in R. Springer UserR!-Springer.
SOS Mata Altântica and Instituto Nacional de Pesquisas Espaciais, 2015. Altas dos Remanescentes Florestais e Ecossistemas Associados no Domínio da Mata Altântica, São Paulo, SP, 60 p.
Van der Pijl, L., 1982. Principles of Dispersal in Higher Plants, 3rd edn. Springer
Verlag, New York.
Zanne, A.E., Lopez-Gonzales, G., Coomes, D.A., Ilic, J., Jansen, S., Lewis, S.L., Miller, R.B., Swenson, N.G., Wiemann, M.C., Chave, J. 2009. Data from:
Towards a worldwide wood economics spectrum. Dryad Digital Repository.