Embed Size (px)
Citation preview

Associação de Empresas de Engenharia do Rio de JaneiroMarch 5, 2012
EO Information Services in support of
Rio de Janeiro Vulnerability Landslides
- Service Utility Review -
Corné van der Sande, NEO BV
Mathijs Schouten, Hansje Brinker BV
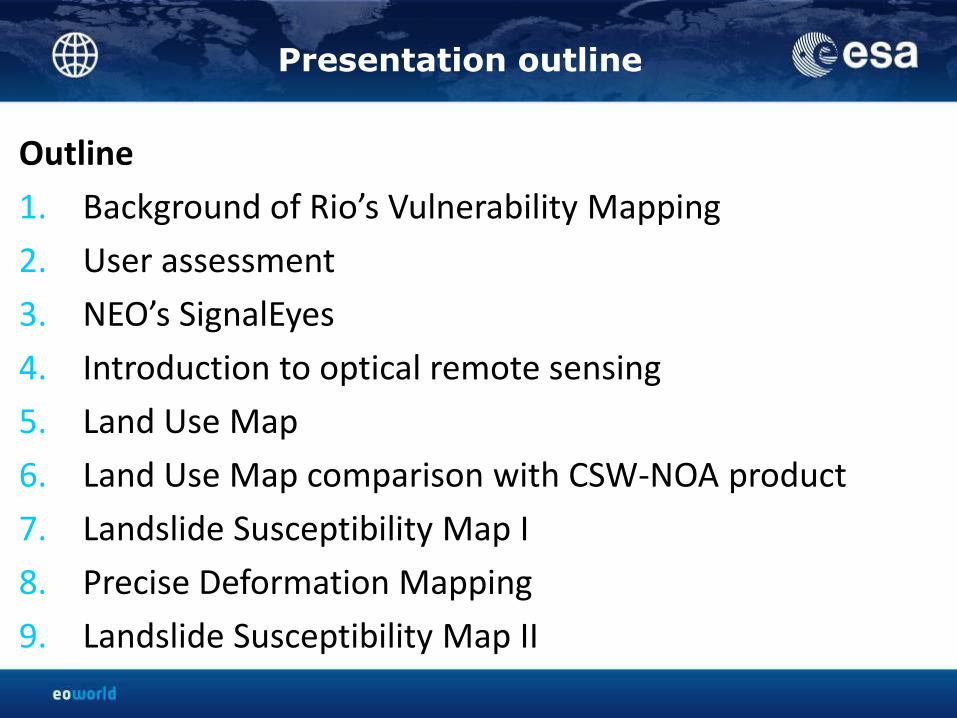
Presentation outline
Outline
1. Background of Rio’s Vulnerability Mapping
2. User assessment
3. NEO’s SignalEyes
4. Introduction to optical remote sensing
5. Land Use Map
6. Land Use Map comparison with CSW-NOA product
7. Landslide Susceptibility Map I
8. Precise Deformation Mapping
9. Landslide Susceptibility Map II
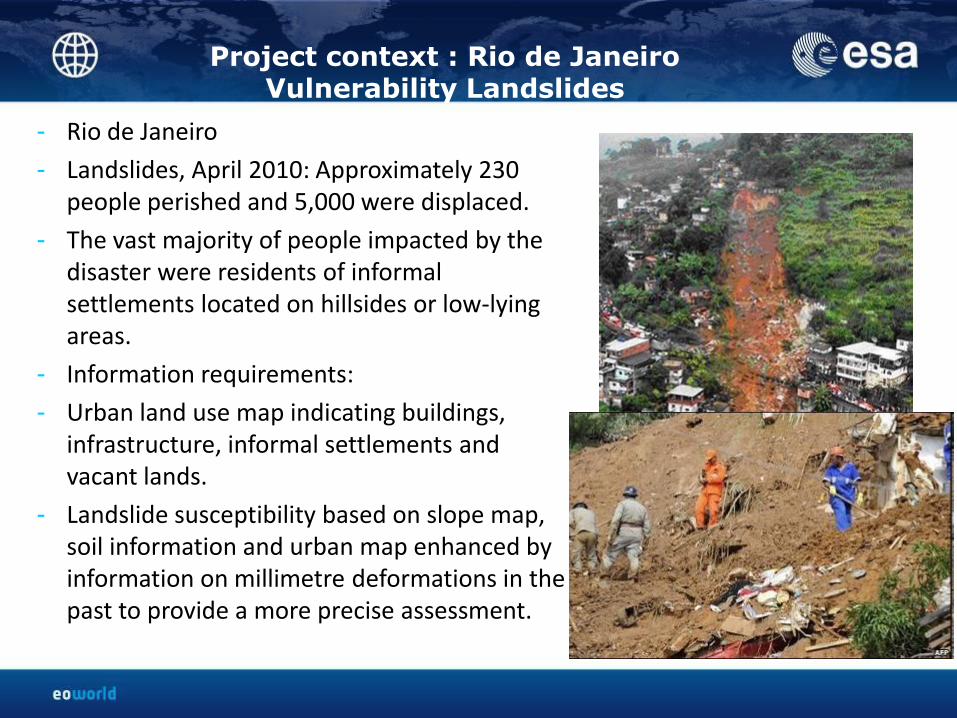
- Rio de Janeiro
- Landslides, April 2010: Approximately 230 people perished and 5,000 were displaced.
- The vast majority of people impacted by the disaster were residents of informal settlements located on hillsides or low-lying areas.
- Information requirements:
- Urban land use map indicating buildings, infrastructure, informal settlements and vacant lands.
- Landslide susceptibility based on slope map, soil information and urban map enhanced by information on millimetre deformations in the past to provide a more precise assessment.
Project context : Rio de Janeiro Vulnerability Landslides
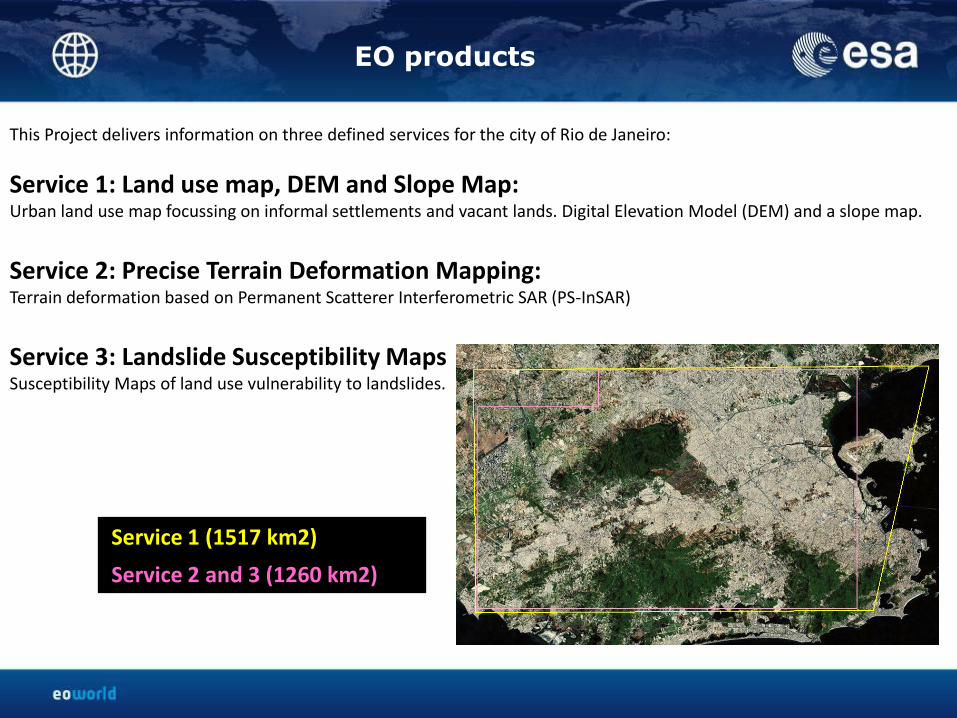
EO products
This Project delivers information on three defined services for the city of Rio de Janeiro:
Service 1: Land use map, DEM and Slope Map:Urban land use map focussing on informal settlements and vacant lands. Digital Elevation Model (DEM) and a slope map.
Service 2: Precise Terrain Deformation Mapping:Terrain deformation based on Permanent Scatterer Interferometric SAR (PS-InSAR)
Service 3: Landslide Susceptibility MapsSusceptibility Maps of land use vulnerability to landslides.
Service 1 (1517 km2)
Service 2 and 3 (1260 km2)

User Assessment
User Assesment based on the following criteria:
• Useful : Improves user’s operations (measurable benefit).
• Available : Readily accessible to users when needed, now and in the future.
• Reliable : Consistently meeting user-defined quality and standards.
• Affordable : Benefits justify the costs and are competitive with usual sources.
!The EO products related to landslide vulnerability are made by NEO andHansje Brinker. Both NEO and Hansje Brinker are not landslide experts orgeologist. We therefore present these results with great care. We deliverinformation on land use and terrain motion. Together with the end-userit should be possible, in our opinion, to make interpretation of these EOproducts best as possible.
Introduction to NEO
NEO BV, Amersfoort, the Netherlands:
- 18 employees, joint-venture in India, exists 15 years.
- Monitoring of objects (buildings, roads, water, trees, agricultural parcels, nature) using earth observation
- Change detection, map update, land use mapping, quality assessments of maps and imagery
- Clients: Dutch municipalities, water boards, provinces, ministries, EU
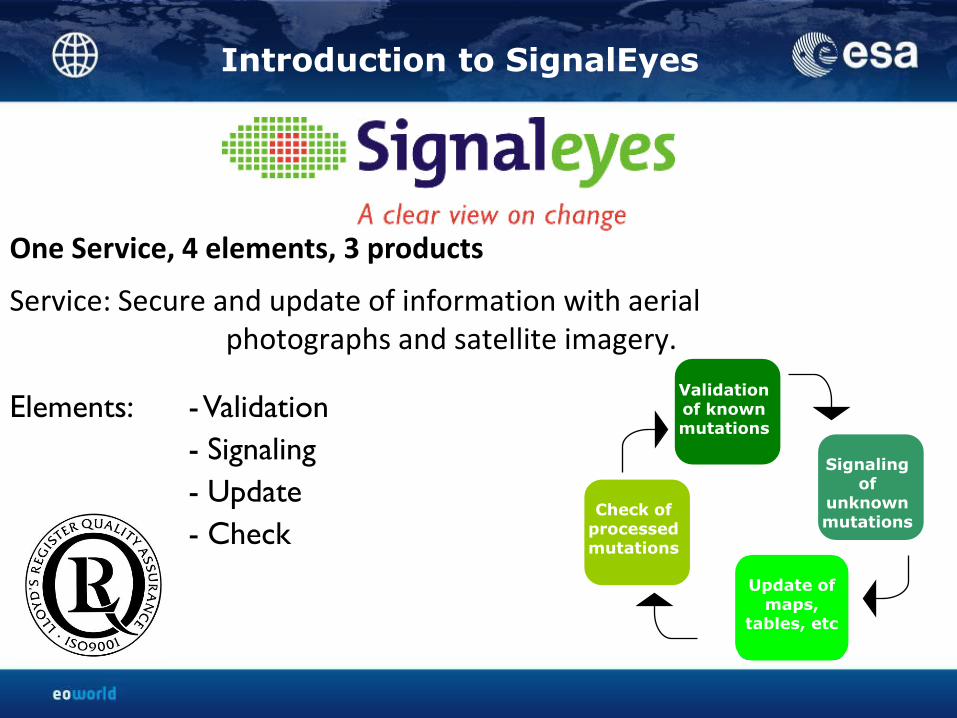
Service: Secure and update of information with aerial photographs and satellite imagery.
One Service, 4 elements, 3 products
Elements: -Validation
- Signaling
- Update
- Check
Introduction to SignalEyes
Validation of known mutations
Signaling of
unknown mutations
Update of maps,
tables, etc
Check of processed mutations

Instruction:
Straight corners
Line coding
Closed lines
Connected
Lines:
New
Changed
Disappeared
Map objects:
Disappeared (WAS)
New (BECOMES)
Mutation signal:
New annex
building
Mutation signal - Mapping instruction - Controle
Roof of annex
building mapped
using stereo
mapping
Control Mapping:
Are instructions followed?
Are all signals used?
Control Map objects:
Are instructions followed?
Are all objects updated?
Introduction to SignalEyes
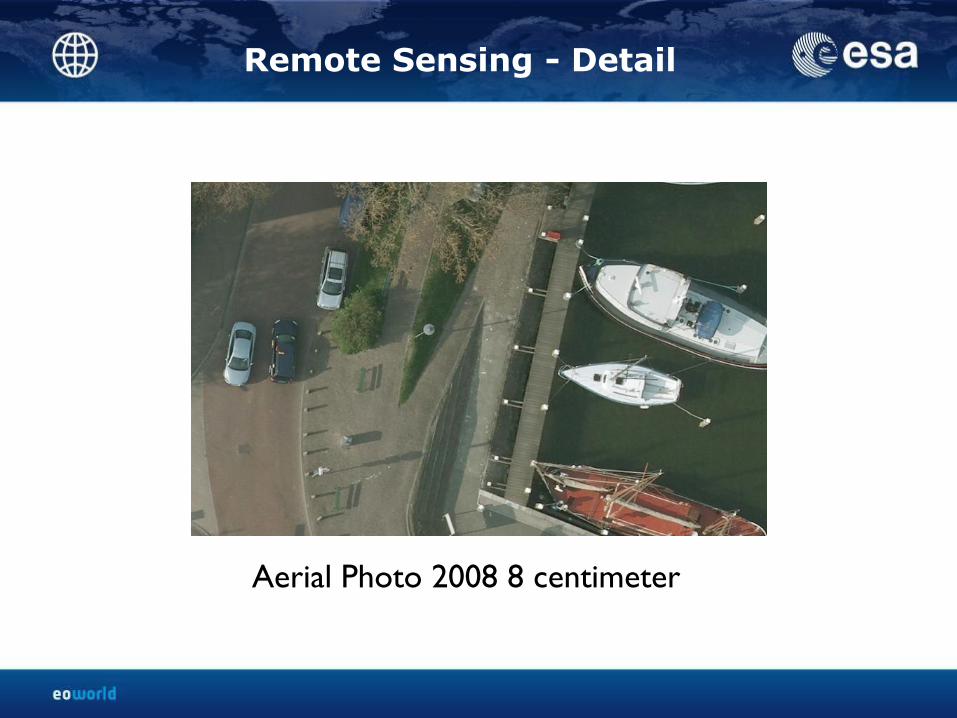
Aerial Photo 2008 8 centimeter
Remote Sensing - Detail
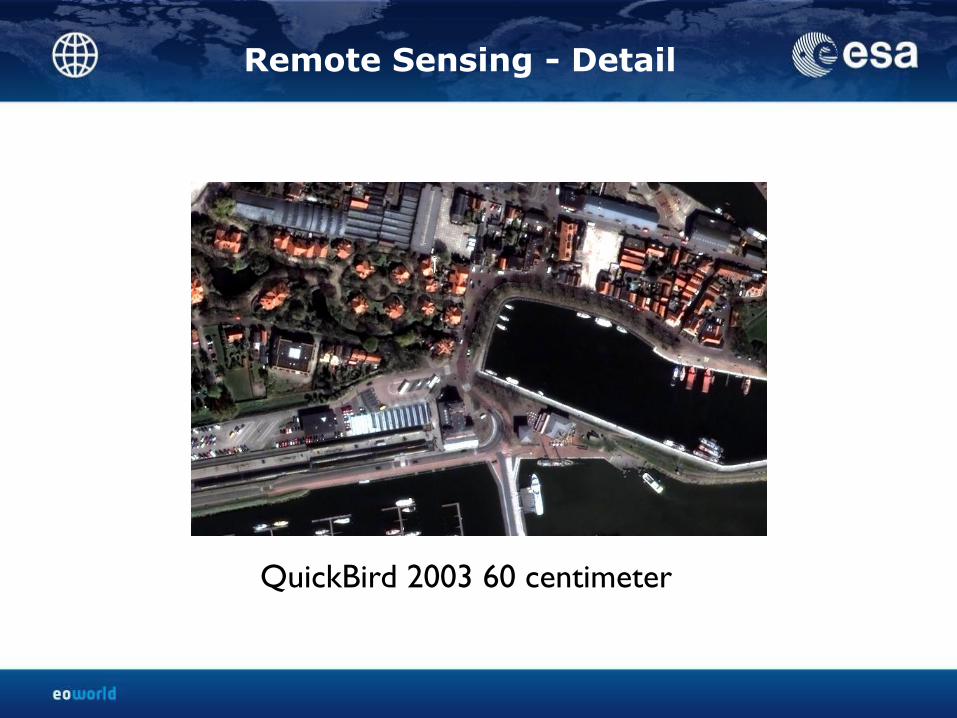
QuickBird 2003 60 centimeter
Remote Sensing - Detail
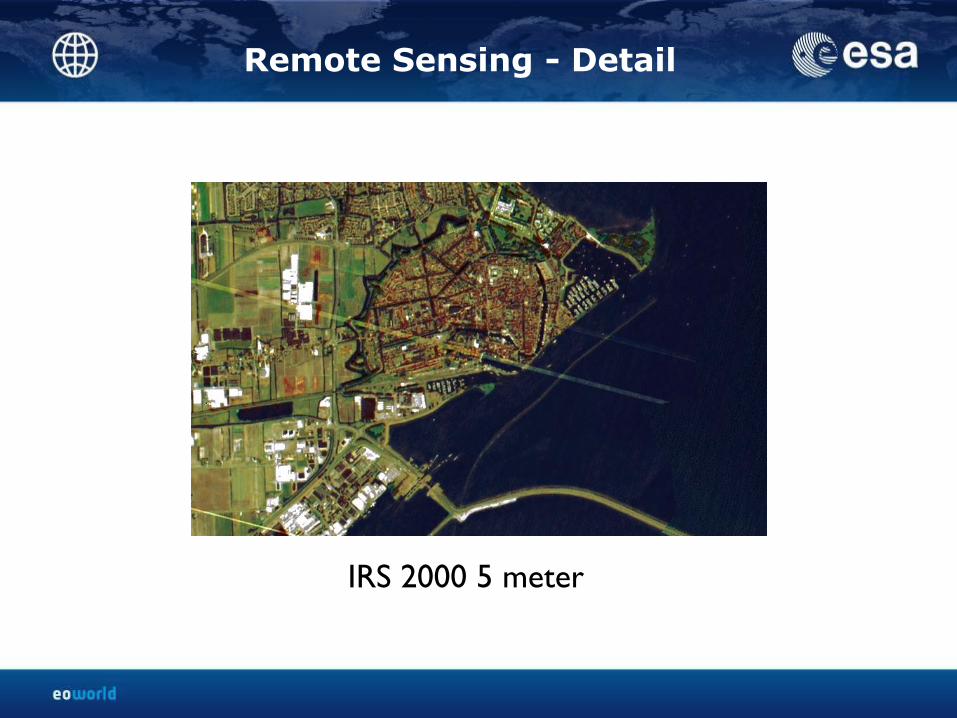
IRS 2000 5 meter
Remote Sensing - Detail
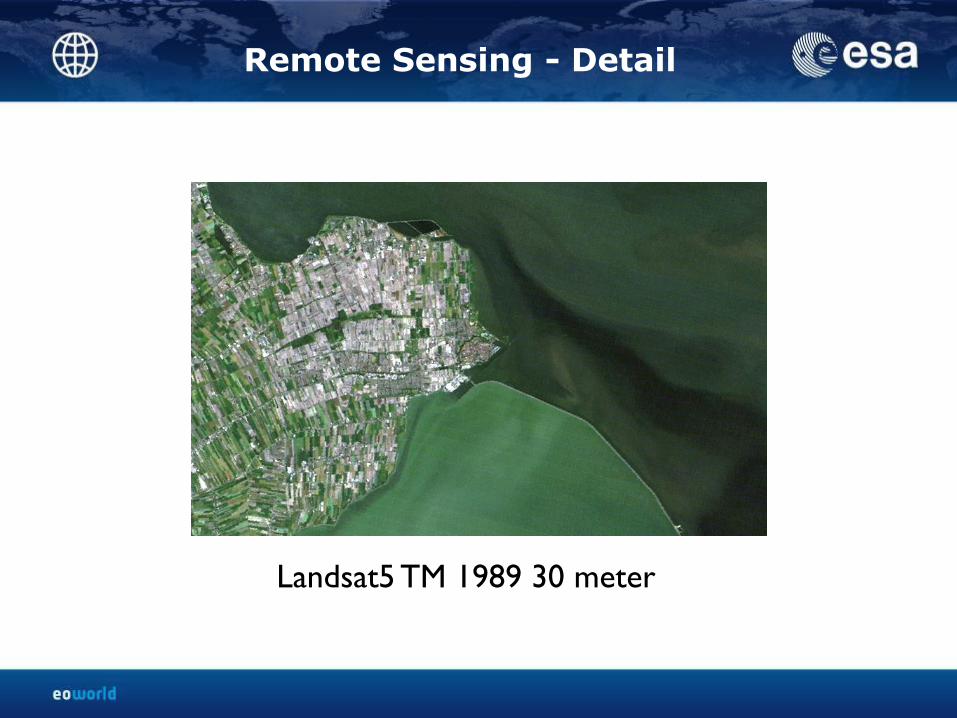
Landsat5 TM 1989 30 meter
Remote Sensing - Detail
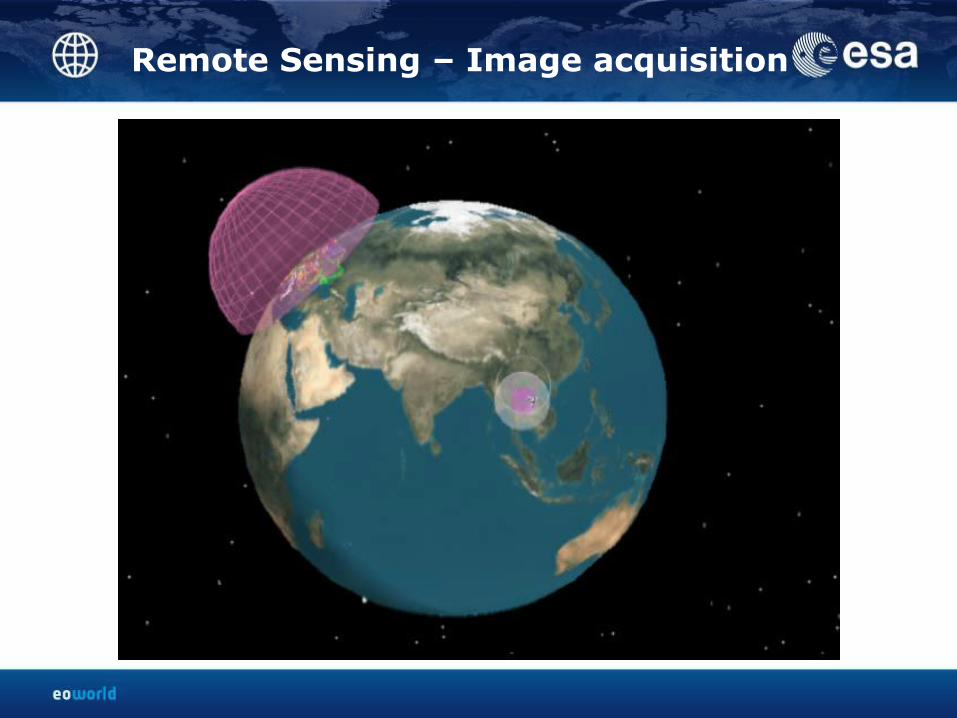
Remote Sensing – Image acquisition
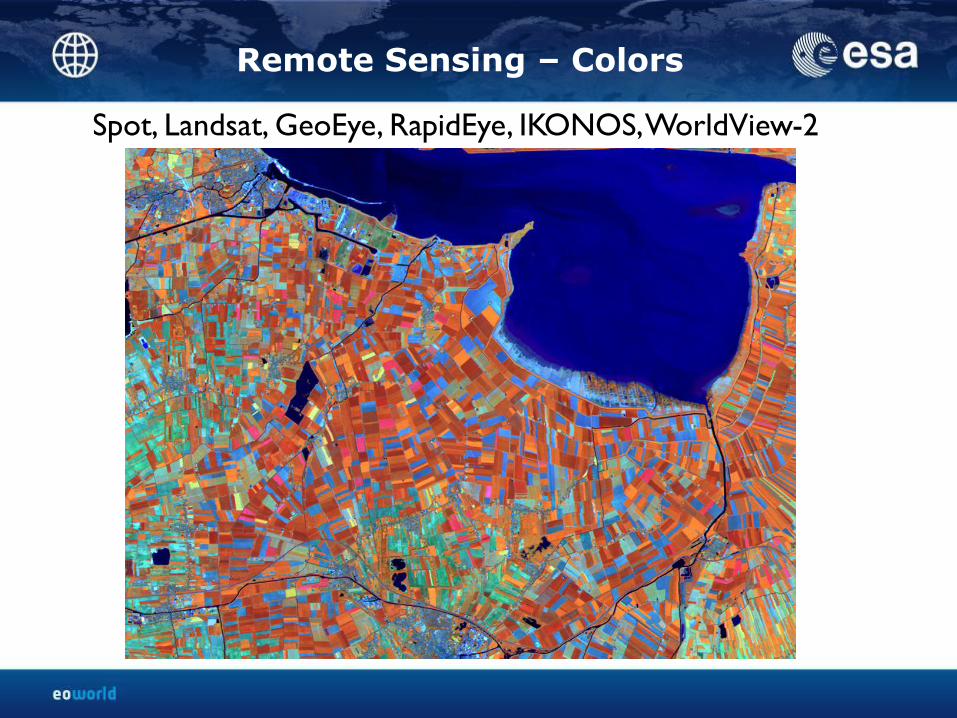
Spot, Landsat, GeoEye, RapidEye, IKONOS, WorldView-2
Remote Sensing – Colors
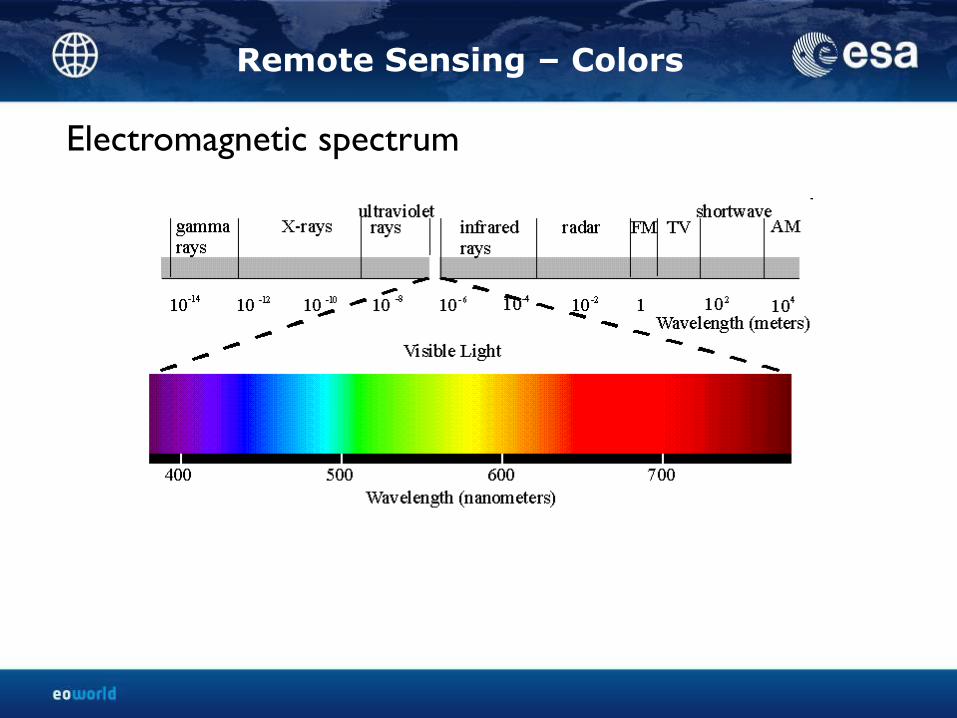
Electromagnetic spectrum
Remote Sensing – Colors
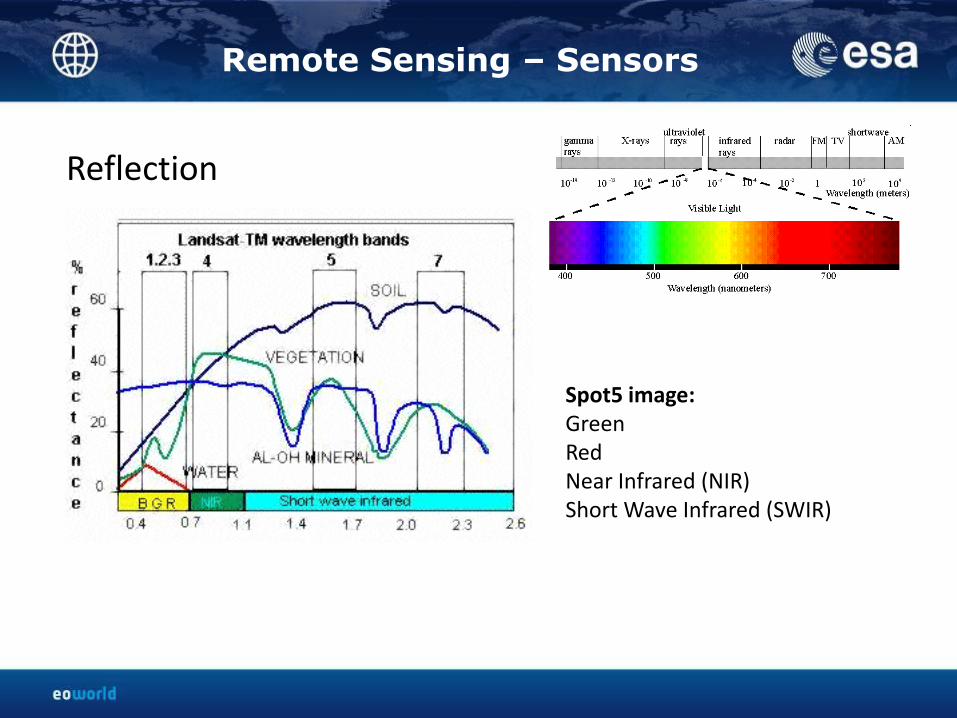
Reflection
Remote Sensing – Sensors
Spot5 image:GreenRedNear Infrared (NIR)Short Wave Infrared (SWIR)

Monitor: Sensor values
Red Near infrared
Green Red
Blue Green
Natural colors
Monitor: Sensor values
Red Red
Green Green
Blue Blue
False color (color infrared)
Remote Sensing – interpretation
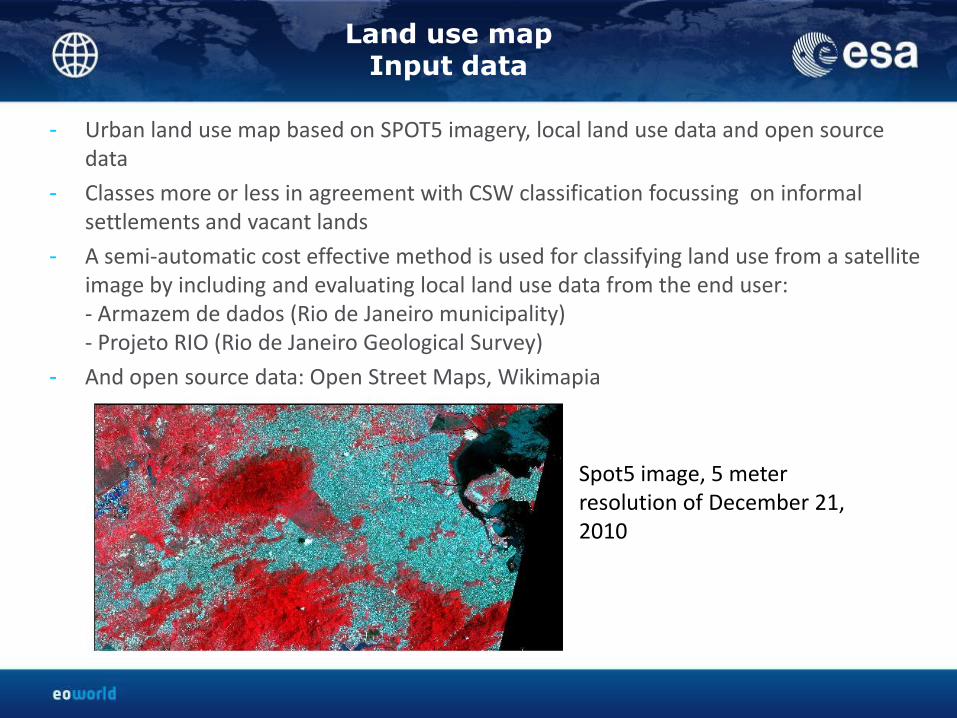
Land use mapInput data
- Urban land use map based on SPOT5 imagery, local land use data and open source data
- Classes more or less in agreement with CSW classification focussing on informal settlements and vacant lands
- A semi-automatic cost effective method is used for classifying land use from a satellite image by including and evaluating local land use data from the end user:- Armazem de dados (Rio de Janeiro municipality)- Projeto RIO (Rio de Janeiro Geological Survey)
- And open source data: Open Street Maps, Wikimapia
Spot5 image, 5 meter resolution of December 21, 2010
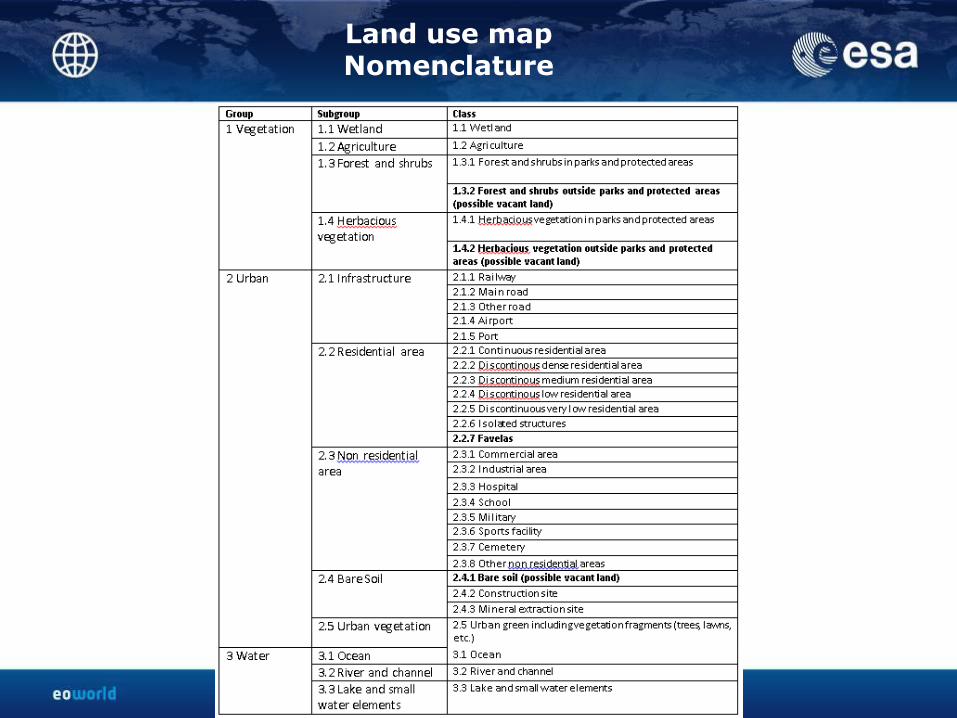
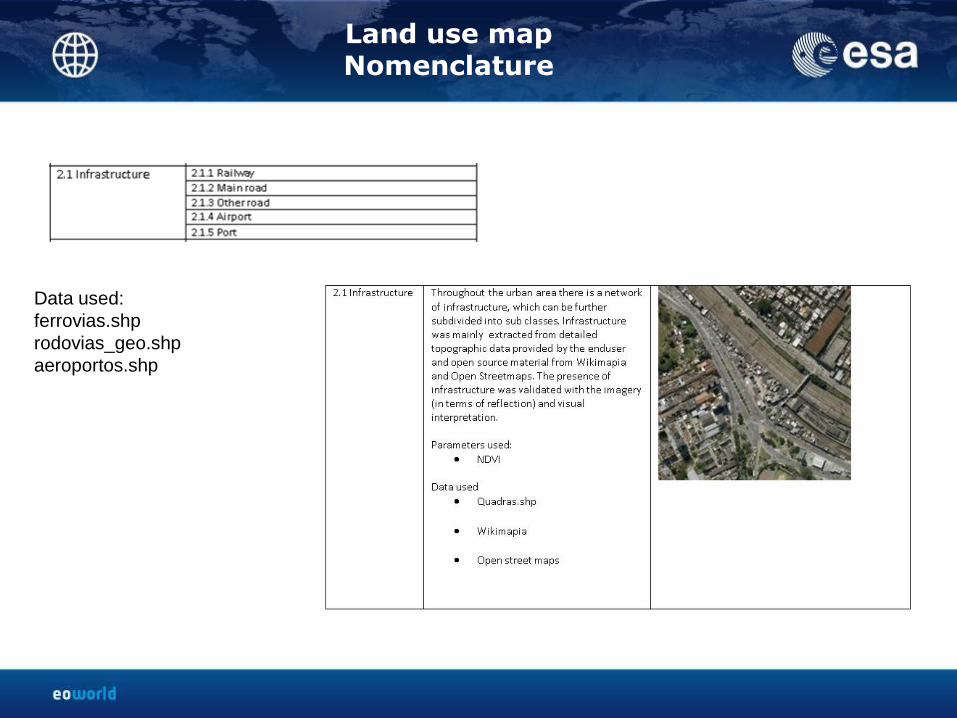
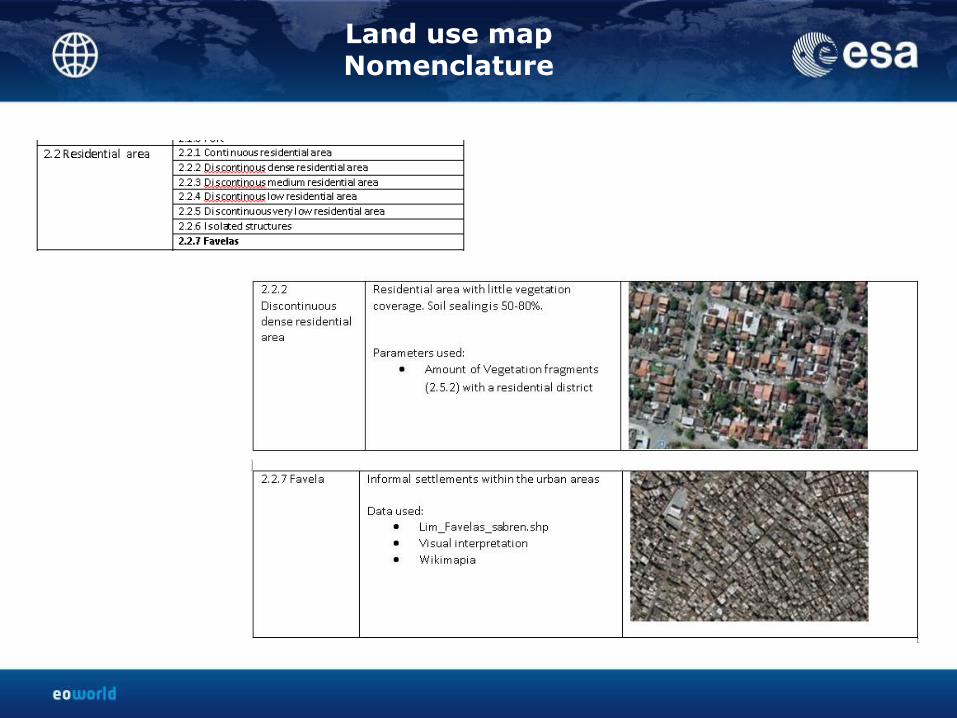
Land use mapNomenclature
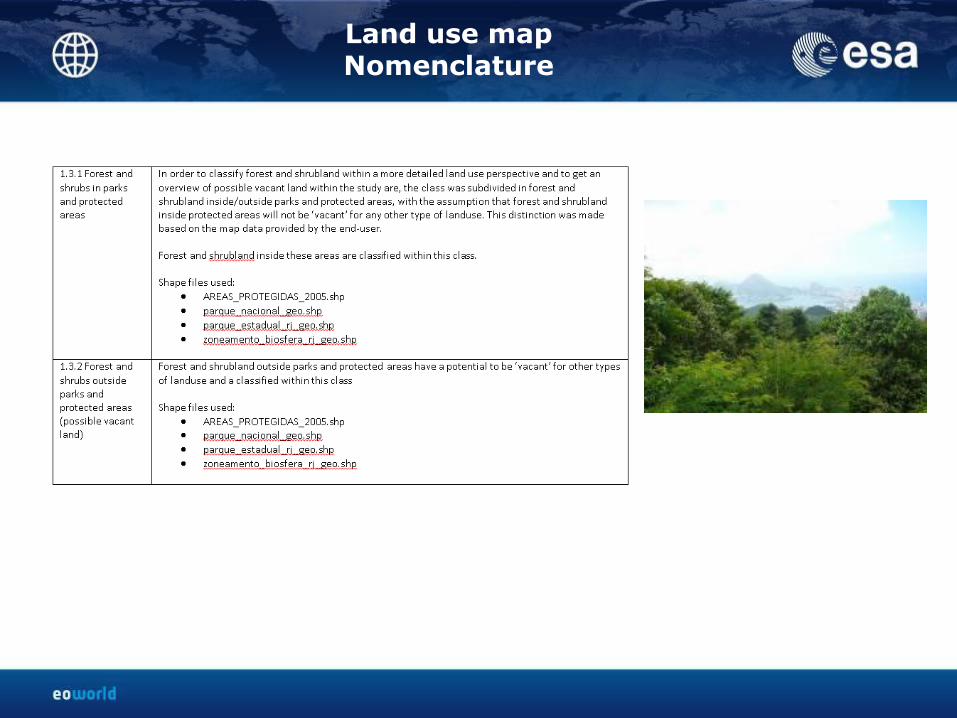
Land use mapNomenclature
Land use mapNomenclature
Data used:
ferrovias.shp
rodovias_geo.shp
aeroportos.shp
Land use mapNomenclature
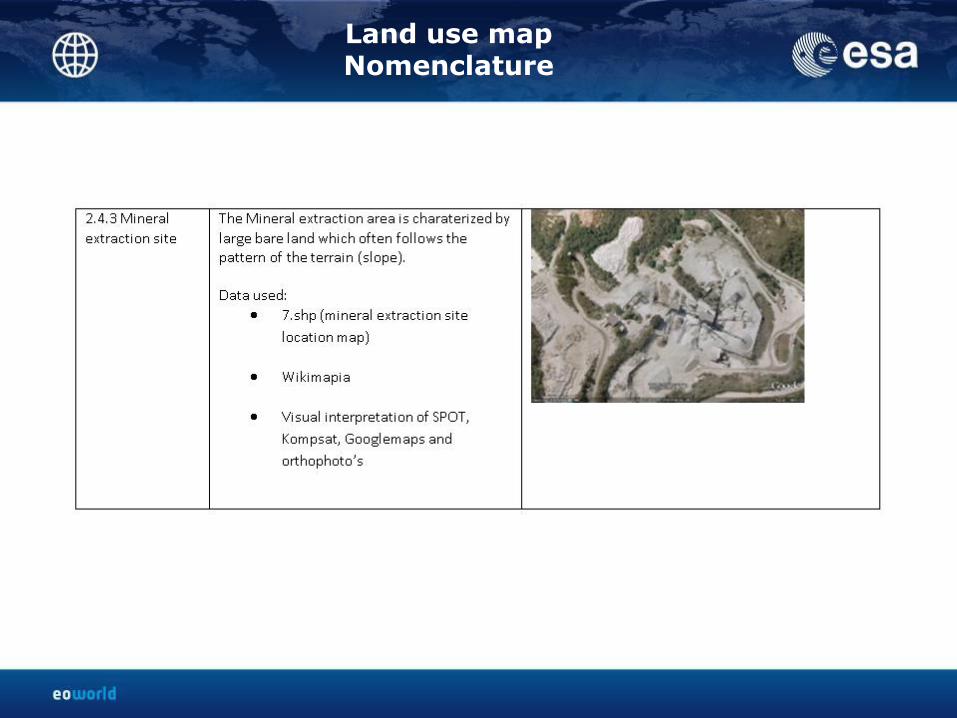
Land use mapNomenclature
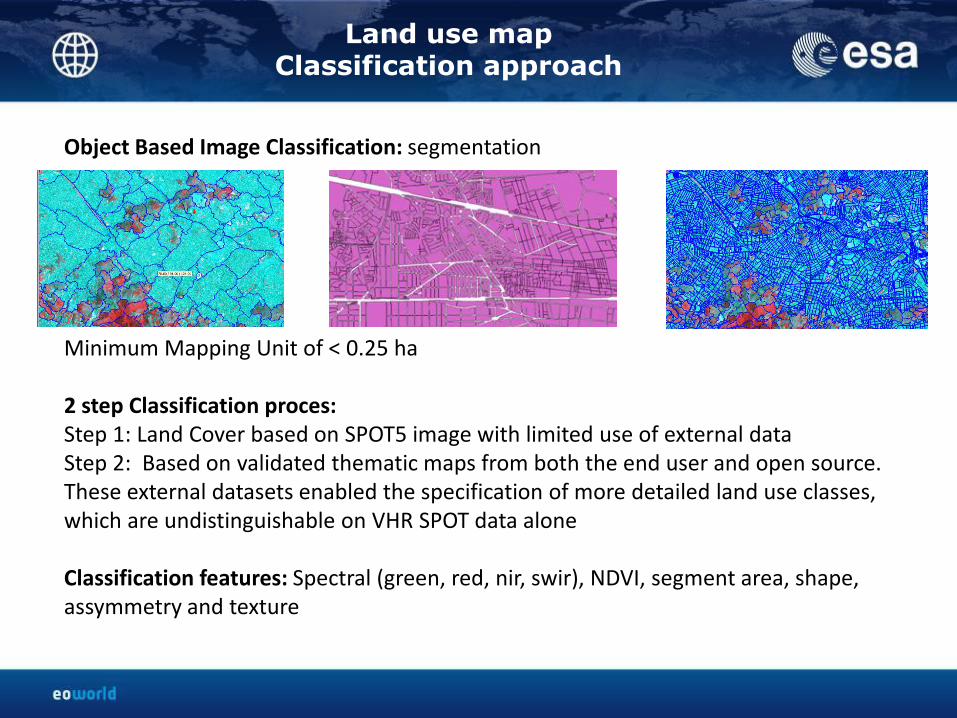
Land use mapClassification approach
Object Based Image Classification: segmentation
Minimum Mapping Unit of < 0.25 ha
2 step Classification proces:Step 1: Land Cover based on SPOT5 image with limited use of external dataStep 2: Based on validated thematic maps from both the end user and open source. These external datasets enabled the specification of more detailed land use classes, which are undistinguishable on VHR SPOT data alone
Classification features: Spectral (green, red, nir, swir), NDVI, segment area, shape, assymmetry and texture
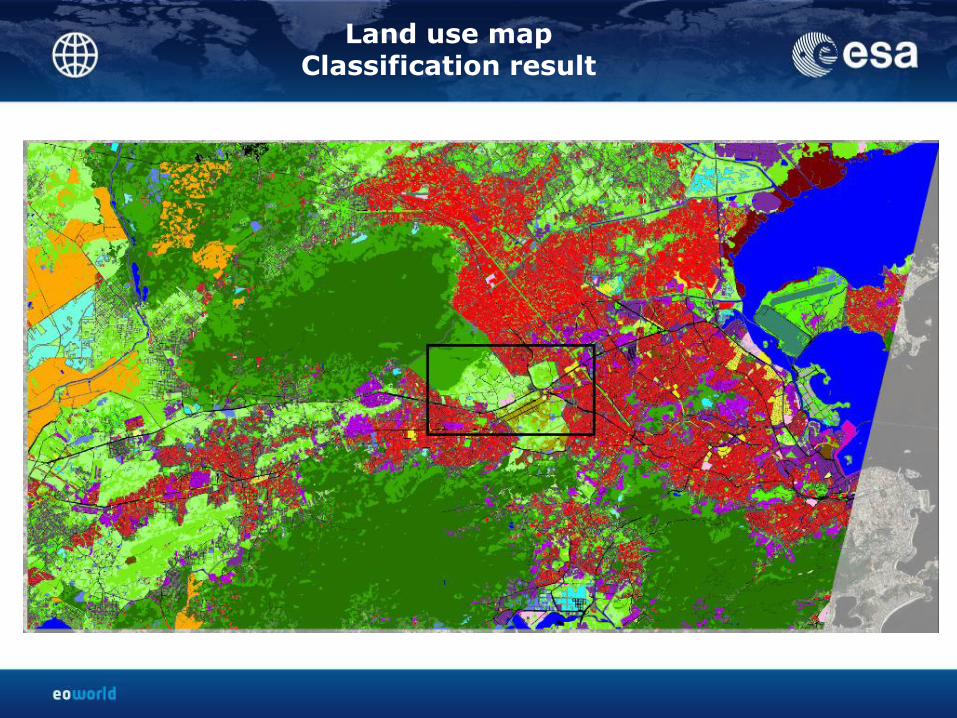
Land use mapClassification result
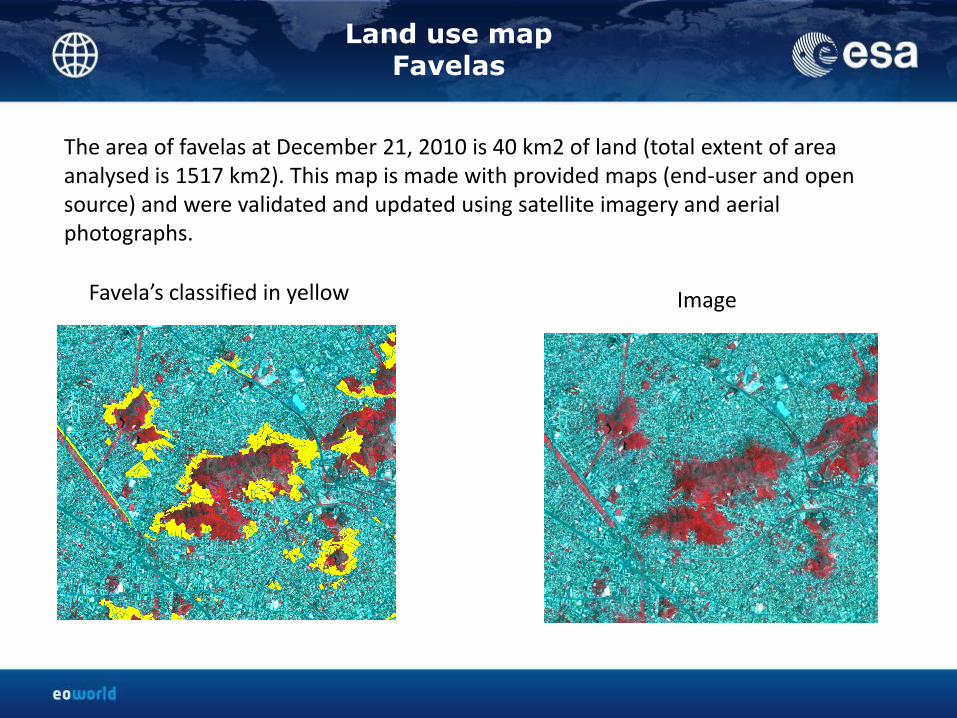
Land use map Favelas
Favela’s classified in yellow Image
The area of favelas at December 21, 2010 is 40 km2 of land (total extent of area analysed is 1517 km2). This map is made with provided maps (end-user and open source) and were validated and updated using satellite imagery and aerial photographs.
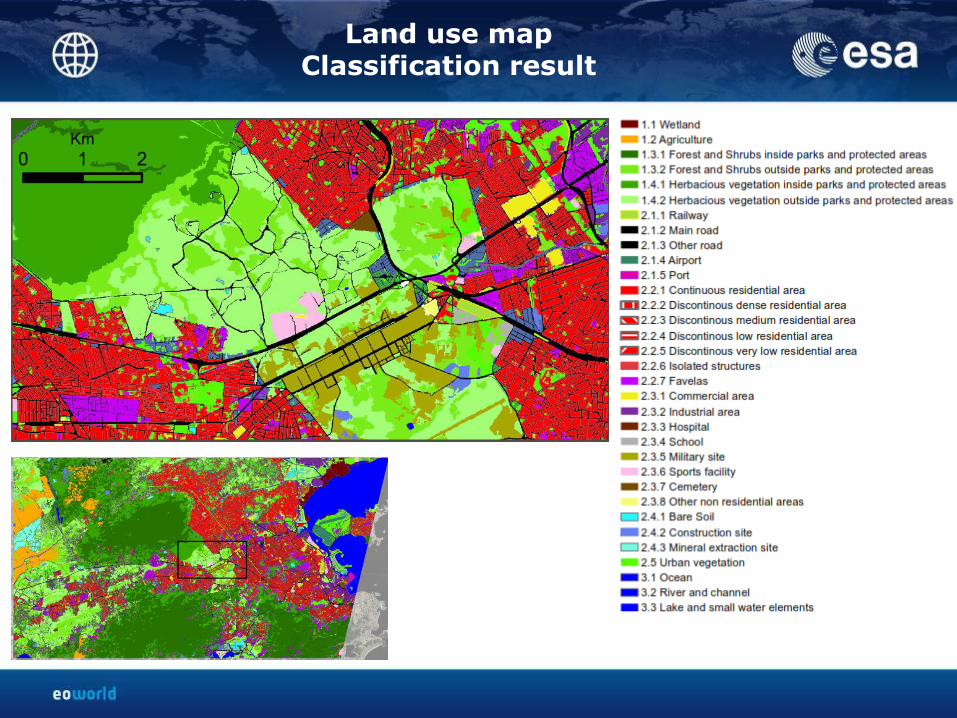
Land use mapClassification result
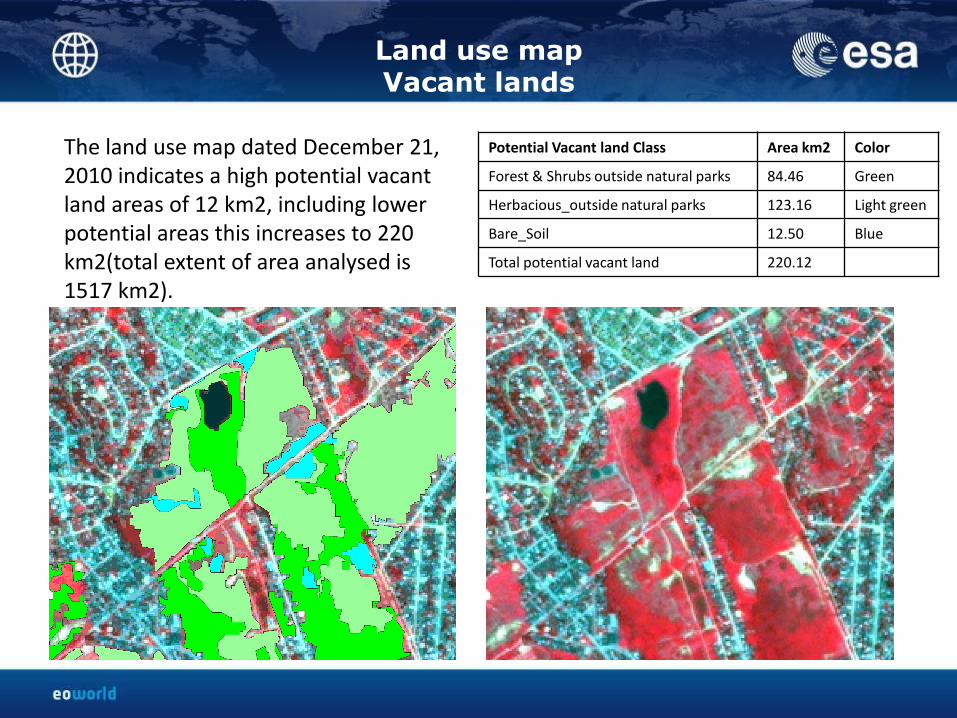
Land use mapVacant lands
The land use map dated December 21, 2010 indicates a high potential vacant land areas of 12 km2, including lower potential areas this increases to 220 km2(total extent of area analysed is 1517 km2).
Potential Vacant land Class Area km2 Color
Forest & Shrubs outside natural parks 84.46 Green
Herbacious_outside natural parks 123.16 Light green
Bare_Soil 12.50 Blue
Total potential vacant land 220.12
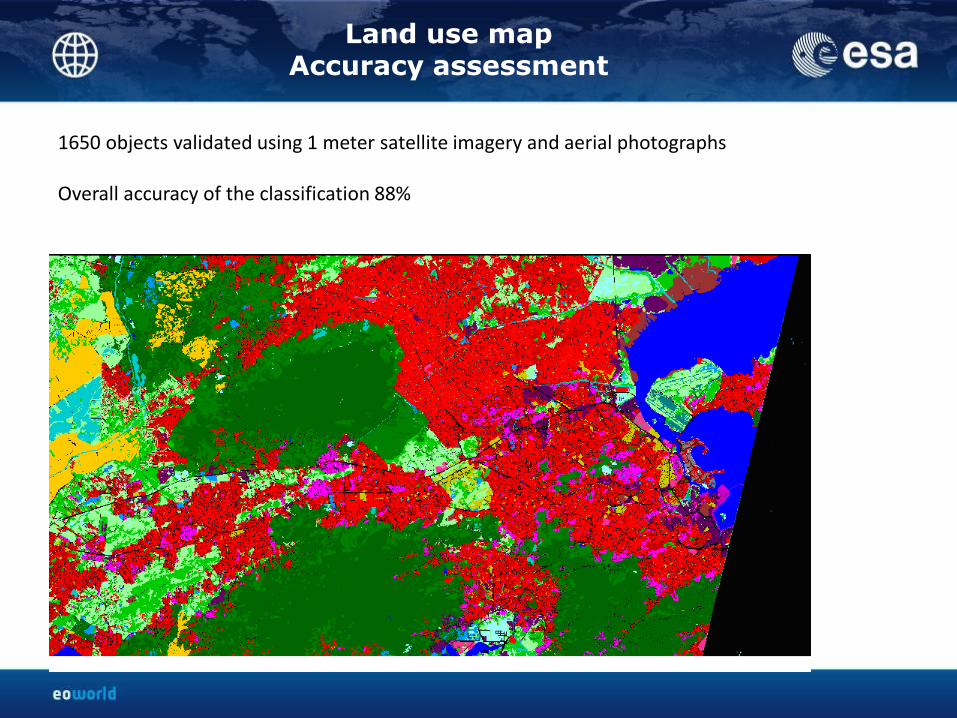
Land use mapAccuracy assessment
1650 objects validated using 1 meter satellite imagery and aerial photographs
Overall accuracy of the classification 88%

Land use mapComparison with CSW-NOA map
CSW-NOA made map with almost similar nomenclature, that makes it still dificult to compare.
NEO used SPOT 5 meter resolution and end user and local data to create map. CSW-NOA used aerial photographs, which is a much higher detail.
Validation of our map was done with 1 meter satellite imagery, CSW-NOA used field work
Comparing apples with pears
Detail of the classification and image
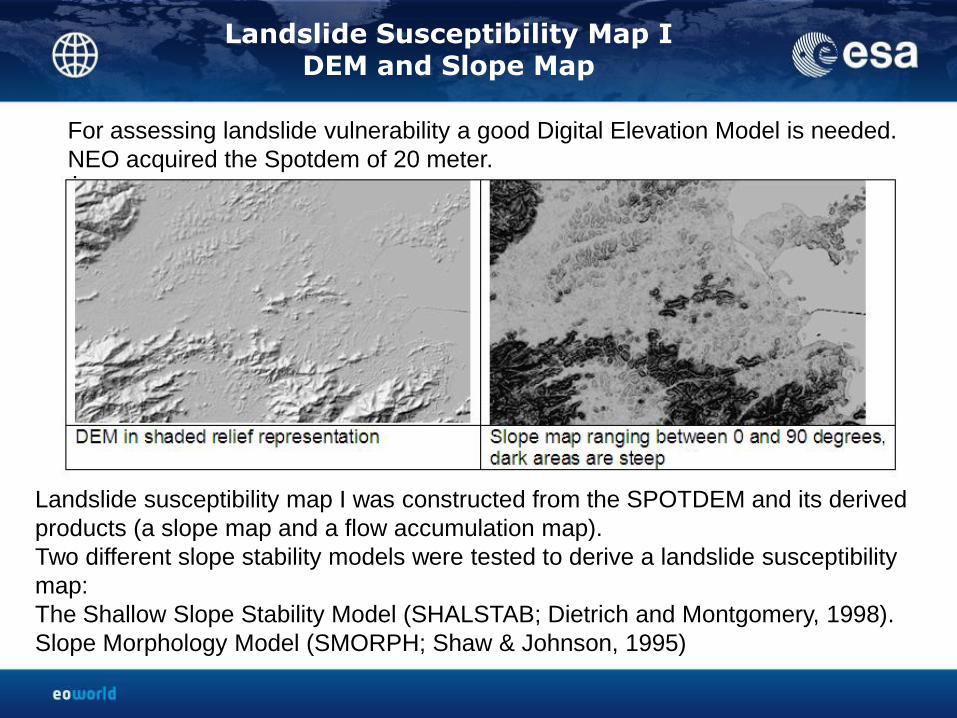
For assessing landslide vulnerability a good Digital Elevation Model is needed.
NEO acquired the Spotdem of 20 meter.
Landslide Susceptibility Map IDEM and Slope Map
Landslide susceptibility map I was constructed from the SPOTDEM and its derived
products (a slope map and a flow accumulation map).
Two different slope stability models were tested to derive a landslide susceptibility
map:
The Shallow Slope Stability Model (SHALSTAB; Dietrich and Montgomery, 1998).
Slope Morphology Model (SMORPH; Shaw & Johnson, 1995)
Landslide Susceptibility Map IMethodology
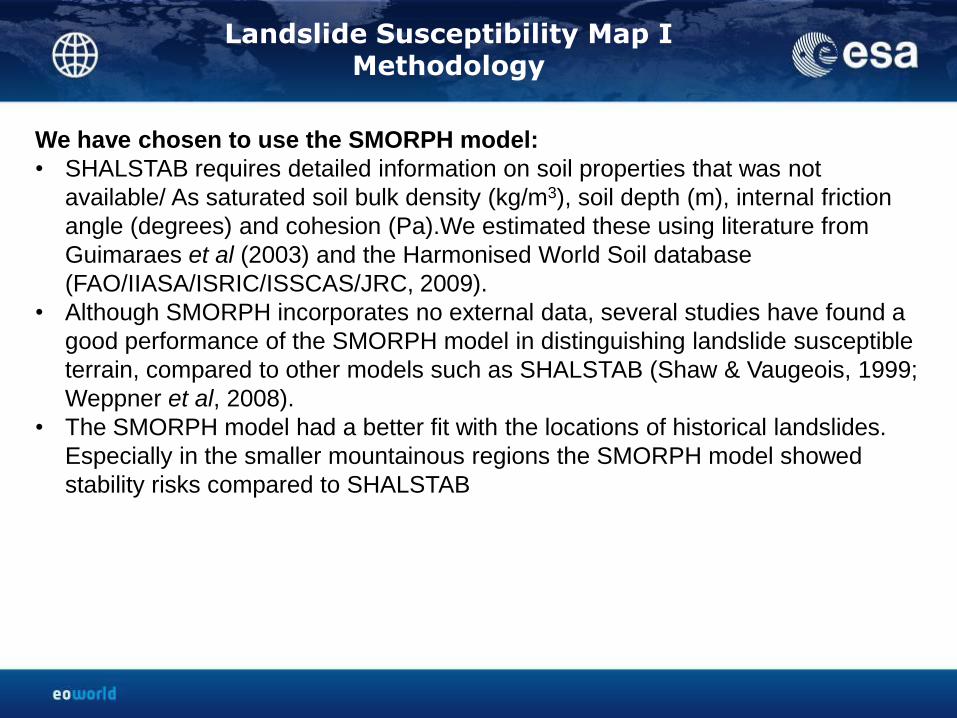
We have chosen to use the SMORPH model:
• SHALSTAB requires detailed information on soil properties that was not
available/ As saturated soil bulk density (kg/m3), soil depth (m), internal friction
angle (degrees) and cohesion (Pa).We estimated these using literature from
Guimaraes et al (2003) and the Harmonised World Soil database
(FAO/IIASA/ISRIC/ISSCAS/JRC, 2009).
• Although SMORPH incorporates no external data, several studies have found a
good performance of the SMORPH model in distinguishing landslide susceptible
terrain, compared to other models such as SHALSTAB (Shaw & Vaugeois, 1999;
Weppner et al, 2008).
• The SMORPH model had a better fit with the locations of historical landslides.
Especially in the smaller mountainous regions the SMORPH model showed
stability risks compared to SHALSTAB
Landslide Susceptibility Map IMethodology
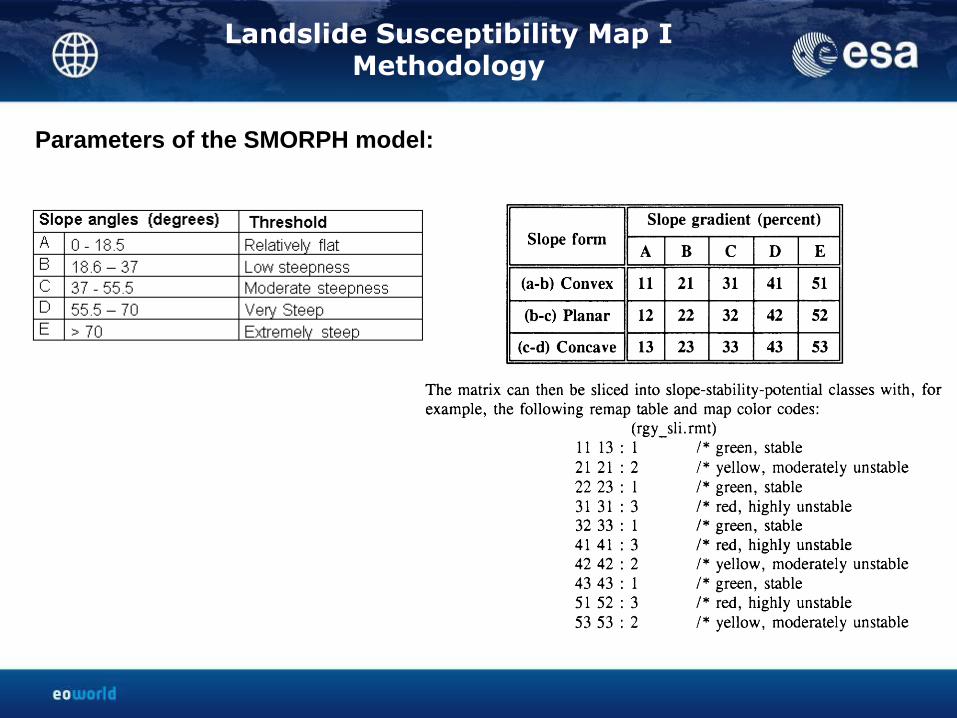
Parameters of the SMORPH model:
Landslide Susceptibility Map IMethodology
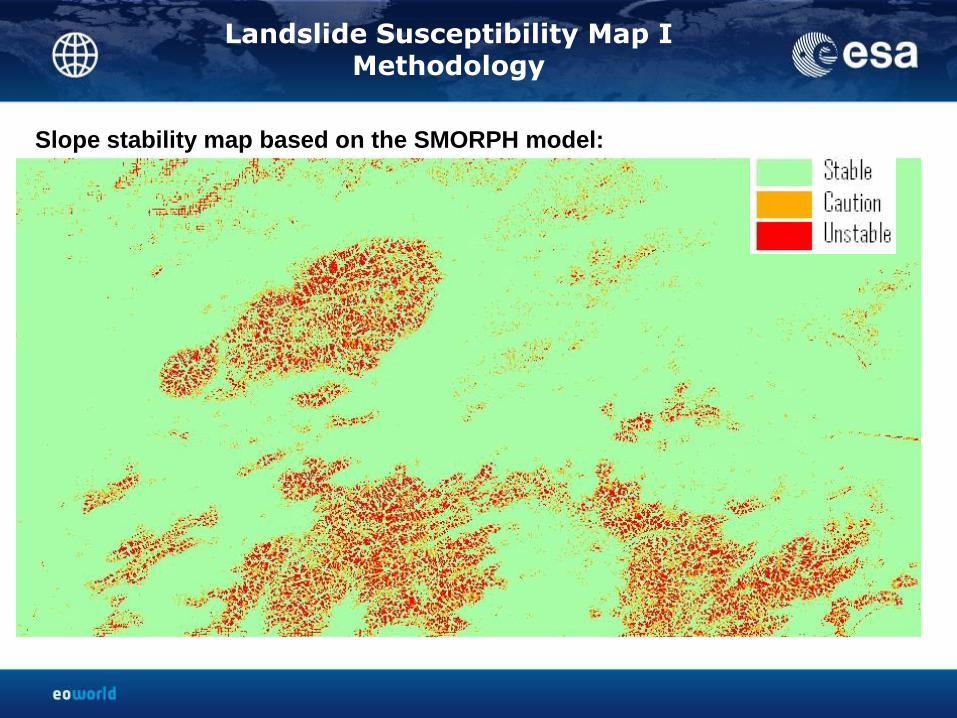
Slope stability map based on the SMORPH model:
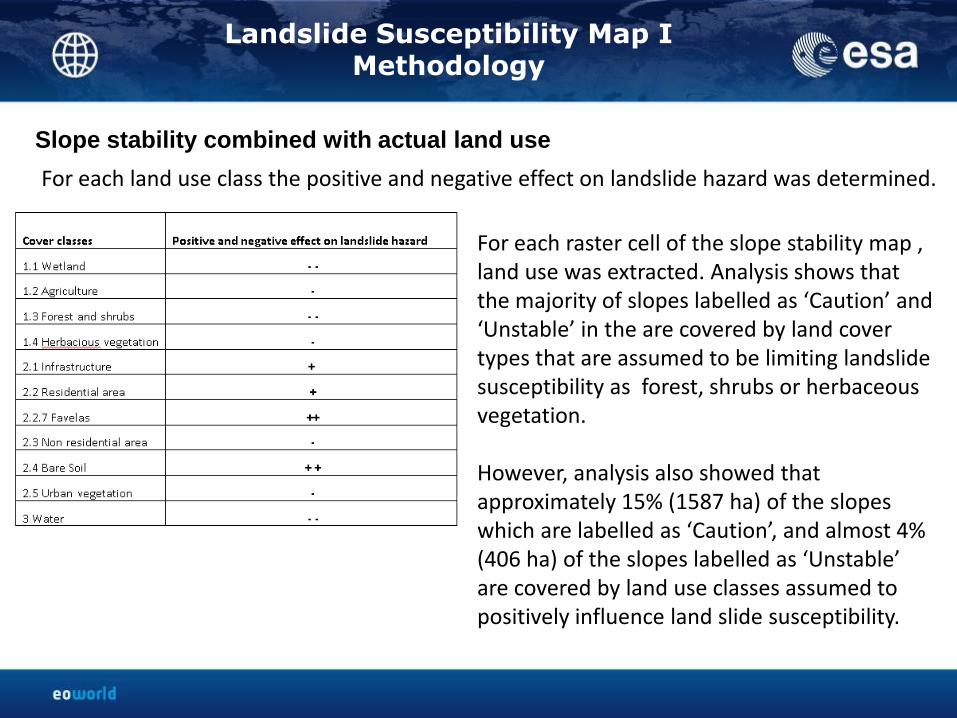
For each land use class the positive and negative effect on landslide hazard was determined.
Landslide Susceptibility Map IMethodology
Slope stability combined with actual land use
For each raster cell of the slope stability map , land use was extracted. Analysis shows that the majority of slopes labelled as ‘Caution’ and ‘Unstable’ in the are covered by land cover types that are assumed to be limiting landslide susceptibility as forest, shrubs or herbaceous vegetation.
However, analysis also showed that approximately 15% (1587 ha) of the slopes which are labelled as ‘Caution’, and almost 4% (406 ha) of the slopes labelled as ‘Unstable’ are covered by land use classes assumed to positively influence land slide susceptibility.
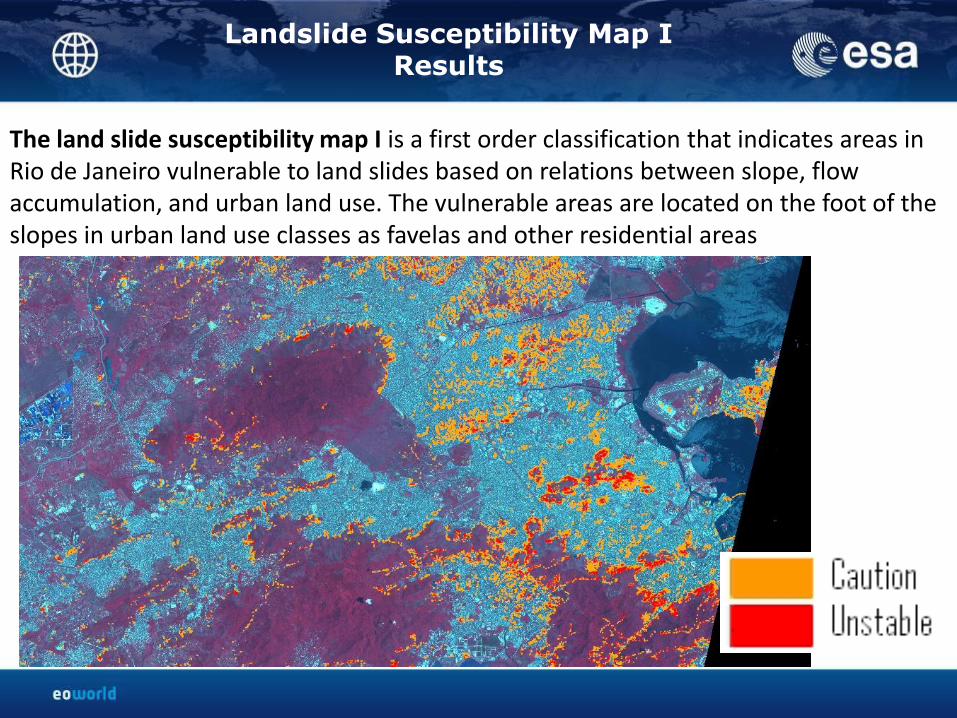
The land slide susceptibility map I is a first order classification that indicates areas in Rio de Janeiro vulnerable to land slides based on relations between slope, flow accumulation, and urban land use. The vulnerable areas are located on the foot of the slopes in urban land use classes as favelas and other residential areas
Landslide Susceptibility Map IResults

When we compare the locations of the occurred landslide events with the unstable slopes of the SMORPH model we see a some overlap (figure 4.1). However, we also see a lot of location in areas with stable slopes. This is because the actual meaning of the landslide event data of the end user is not clear enough.
Landslide Susceptibility Map IAccuracy assessment
Reported locations of
landslides