Embed Size (px)
Citation preview

LAND USES: BIOMASS FOR FOOD AND FUEL IN BRAZIL - THE NEXT 20 YEARS
JOSE ROBERTO MOREIRA
CENTRO NACIONAL DE REFERENCIA DE BIOMASSA
WORKSHOP
SUSTENTABILIDADE NA GERAÇÃO E USO DE ENERGIA NO BRASIL: OS PRÓXIMOS
VINTE ANOS
CAMPINAS 18-20 DE FEVEREIRO, 2002

TECHNOLOGY ISSUES

Long term technical potential - renewable energy supply
2100 Total EnergyDemand for SRESscenario ranges515-2737 EJ/yr
Long-term Technical Potential(EJ/yr)
Hydro >50Geothermal >20Wind >630Ocean >20Solar >1600Biomass >440Total Renewable >2800
Source: IPCC-TAR, 2001

0
5
10
15
20
25
30
35
40
1990 2000 2010 2020 2030 2040 2050 2060 2070 2080 2090 2100
IPCC SRES A2 Scenarios
A2
550550
750750
0
5
10
15
20
25
30
35
40
1990 2000 2010 2020 2030 2040 2050 2060 2070 2080 2090 2100
IPCC SRES A1B Scenarios
450450 550550 650650
Glo
bal
An
thro
po
gen
ic C
arb
oo
n D
ioxi
de
Em
issi
on
s (G
tC)
A1B
0
5
10
15
20
25
30
35
40
1990 2000 2010 2020 2030 2040 2050 2060 2070 2080 2090 2100
IPCC SRES B1 Scenarios
450450550550
B1
0
5
10
15
20
25
30
35
40
1990 2000 2010 2020 2030 2040 2050 2060 2070 2080 2090 2100
IPCC SRES A1T Scenarios
A1T
450450550550
650650
0
5
10
15
20
25
30
35
40
1990 2000 2010 2020 2030 2040 2050 2060 2070 2080 2090 2100
IPCC SRES B2 Scenarios
450450 550550 650650
B2
0
5
10
15
20
25
30
35
40
1990 2000 2010 2020 2030 2040 2050 2060 2070 2080 2090 2100
IPCC SRES A1FI Scenarios
450450550550650650
750750
A1FI
How to stabilise concentrations?
Emissions to be avoided: 300-1500 GtC
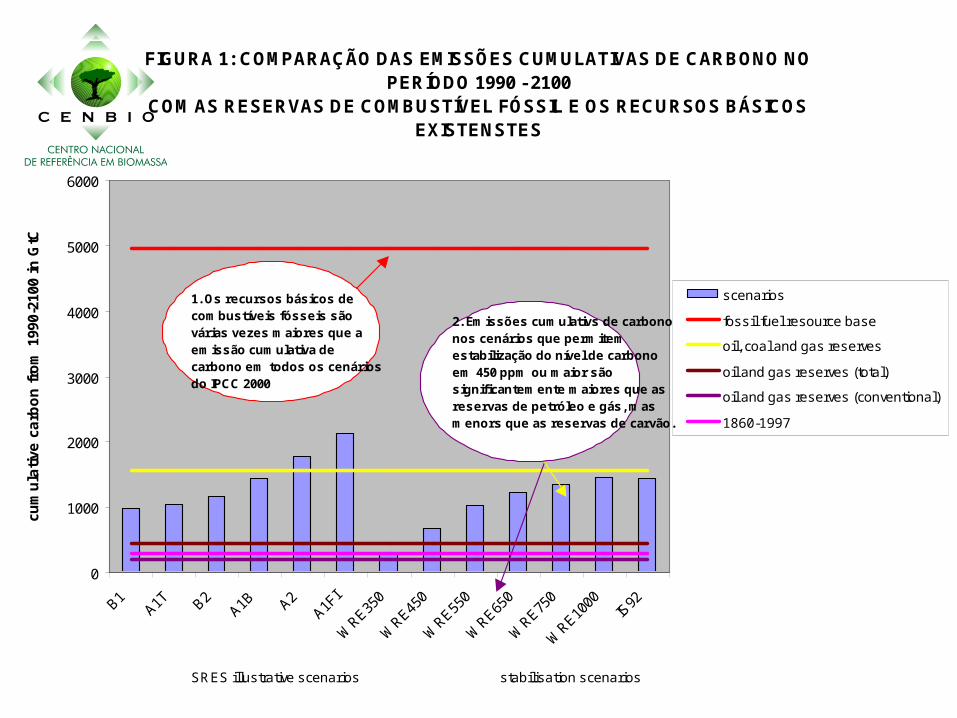
FIGURA 1: COMPARAÇÃO DAS EMISSÕES CUMULATIVAS DE CARBONO NO PERÍODO 1990 - 2100
COM AS RESERVAS DE COMBUSTÍVEL FÓSSIL E OS RECURSOS BÁSICOS EXISTENSTES
0
1000
2000
3000
4000
5000
6000
B1A1T B2
A1B A2A1F
I
WRE35
0
WRE45
0
WRE55
0
WRE65
0
WRE75
0
WRE10
00IS
92
cum
ula
tive
ca
rbo
n f
rom
199
0-21
00 i
n G
tC
scenarios
fossil fuel resource base
oil, coal and gas reserves
oil and gas reserves (total)
oil and gas reserves (conventional)
1860-1997
SRES illustrative scenarios stabilisation scenarios
1. Os recursos básicos de combustíveis fósseis são várias vezes maiores que a emissão cumulativa de carbono em todos os cenários do IPCC 2000
2. Emissões cumulativs de carbono nos cenários que permitem estabilização do nível de carbono em 450 ppm ou maior são significantemente maiores que as reservas de petróleo e gás, mas menors que as reservas de carvão.

Mitigation options
• Energy efficiency
• Decarbonisation– energy sources
– CO2 removal and storage
• Biological carbon sequestration
• Reducing other greenhouse gases from industry, agriculture, waste management

Mitigation options
• Energy efficiency
• Decarbonisation
–energy sources– CO2 removal and storage
• Biological carbon sequestration
• Reducing other greenhouse gases from industry, agriculture, waste management

Projection of technical energy potential from biomass by 2050.
Region
Population in 2050
Billion
Total landwith cropproductio
npotential
Gha
Cultivated
Land in1990
Gha
Additionalcultivated
landrequired in
2050Gha
Available areafor biomass
production in2050Gha
Max. Additionalamount of energy
from biomassa)
EJ/yr
Developedb) - 0.820 0.670 0.050 0.100 30Latin AmericaCentral &Caribbean
0.286 0.087 0.037 0.015 0.035 11
South America 0.524 0.865 0.153 0.082 0.630 189AfricaEastern 0.698 0.251 0.063 0.068 0.120 36Middle 0.284 0.383 0.043 0.052 0.288 86Northern 0.317 0.104 0.04 0.014 0.050 15Southern 0.106 0.044 0.016 0.012 0.016 5Western 0.639 0.196 0.090 0.096 0.010 3Chinac) - - - - - 2Rest of AsiaWestern 0.387 0.042 0.037 0.010 -0.005 0South –Central 2.521 0.200 0.205 0.021 -0.026 0Eastern 1.722 0.175 0.131 0.008 0.036 11South –East 0.812 0.148 0.082 0.038 0.028 8Total for regionsabove 8.296 2.495 0.897 0.416 1.28 396TOTAL BIOMASS ENERGY POTENTIAL, EJ/yr 441d)
a) Assumed 15 odt/ha/yr and 20Gj/odtb) Here, OECD and Economies in Transitionc) For China, the numbers are projected values from D’Apote (1998) and not maximum estimates.d) Includes 45 EJ/yr of current traditional biomass.
Source: Derived from Fischer and Heilig, 1998; D’Apote, 1998; IIASA/WEC, 1998)
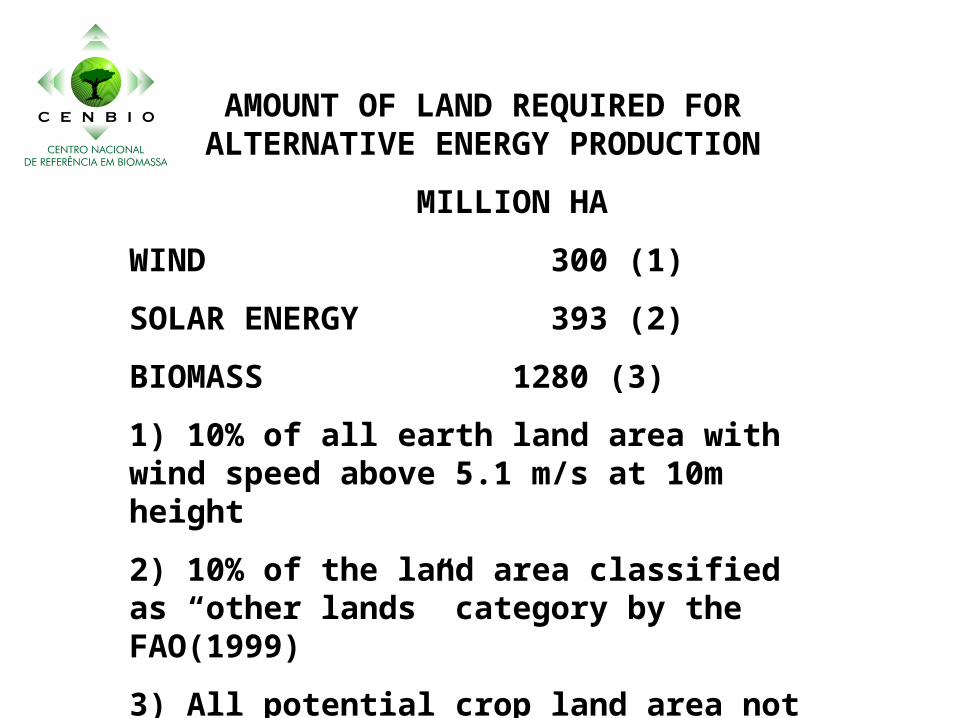
AMOUNT OF LAND REQUIRED FOR ALTERNATIVE ENERGY PRODUCTION
MILLION HA
WIND 300 (1)
SOLAR ENERGY 393 (2)
BIOMASS 1280 (3)
1) 10% of all earth land area with wind speed above 5.1 m/s at 10m height
2) 10% of the land area classified as “other lands” category by the FAO(1999)
3) All potential crop land area not been required for food crops in year 2050 are used
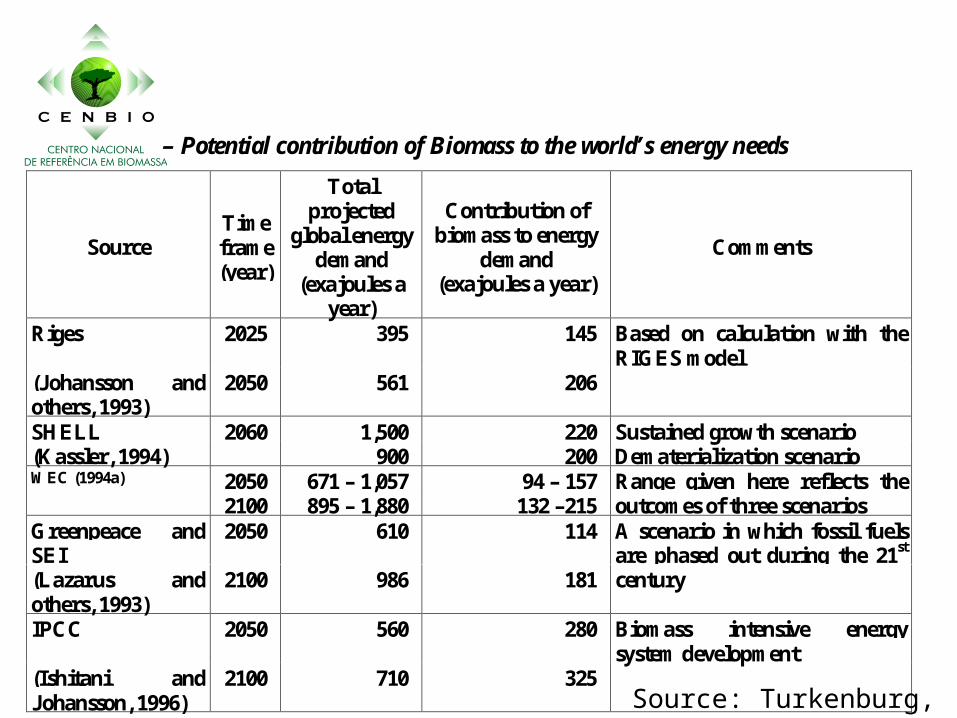
– Potential contribution of Biomass to the world’s energy needs
SourceTimeframe(year)
Totalprojected
global energydemand
(exajoules ayear)
Contribution ofbiomass to energy
demand(exajoules a year)
Comments
Riges 2025 395 145 Based on calculation with theRIGES model
(Johansson andothers, 1993)
2050 561 206
SHELL 2060 1,500 220 Sustained growth scenario(Kassler, 1994) 900 200 Dematerialization scenarioWEC (1994a) 2050 671 – 1,057 94 – 157
2100 895 – 1,880 132 –215Range given here reflects theoutcomes of three scenarios
Greenpeace andSEI
2050 610 114
(Lazarus andothers, 1993)
2100 986 181
A scenario in which fossil fuelsare phased out during the 21st
century
IPCC 2050 560 280 Biomass intensive energysystem development
(Ishitani andJohansson, 1996)
2100 710 325Source: Turkenburg, 2000

Current and future need for forest products in 109 m3, based on regional population projection (Alcamo et al,1994) and regionalforest product consumption (FAO, 1993).
1990 2000 2025 2050Industrial Roundwood
Tropical Regions 0,28 0,35 0,52 0,65Temperate Regions 0,89 0,95 1,04 1,04
Boreal Regions 0,43 0,45 0,49 0,49SubTotal Global Volume 1,60 1,75 2,05 2,18Fuelwood and Charcoal
Tropical Regions 1,37 1,70 2,63 3,41Temperate Regions 0,37 0,42 0,49 0,51
Boreal Regions 0,01 0,01 0,01 0,01SubTotal Global Volume 1,75 2,13 3,13 3,93Total Global Volume 3,35 3,88 5,18 6,11
Total Fuelwwod+charcoal energy(EJ/yr) 16 19,47 28,62 35,93
Source: IPCC SAR WGII, 1996
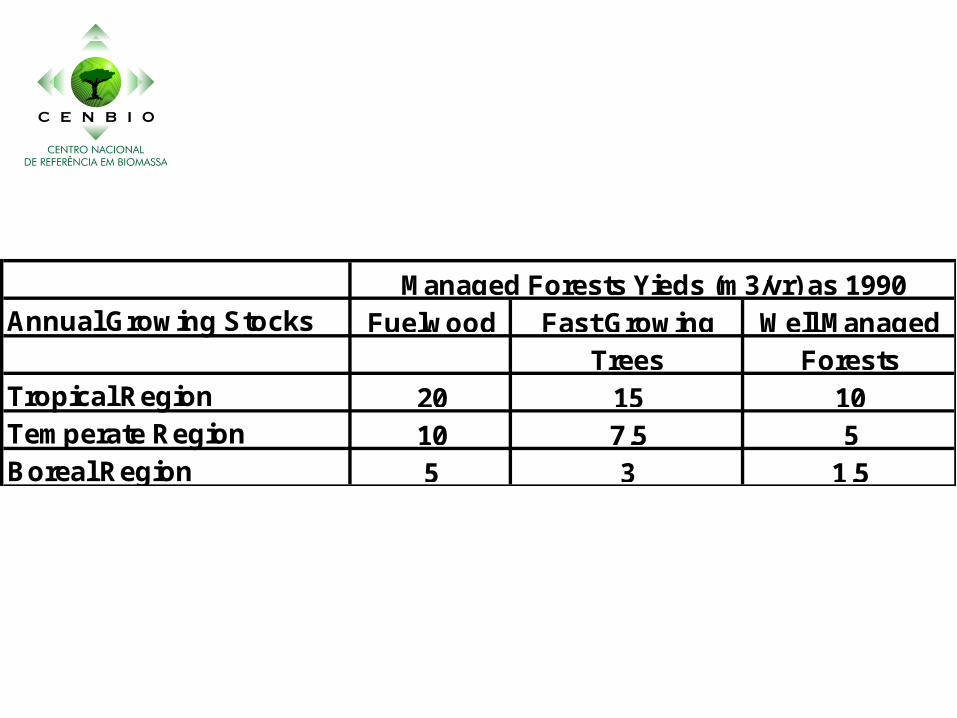
Annual Growing Stocks
Tropical RegionTemperate RegionBoreal Region
Fuelwood
5
157,53
2010
105
1,5
Managed Forests Yieds (m3/yr) as 1990Well Managed
ForestsTreesFast Growing
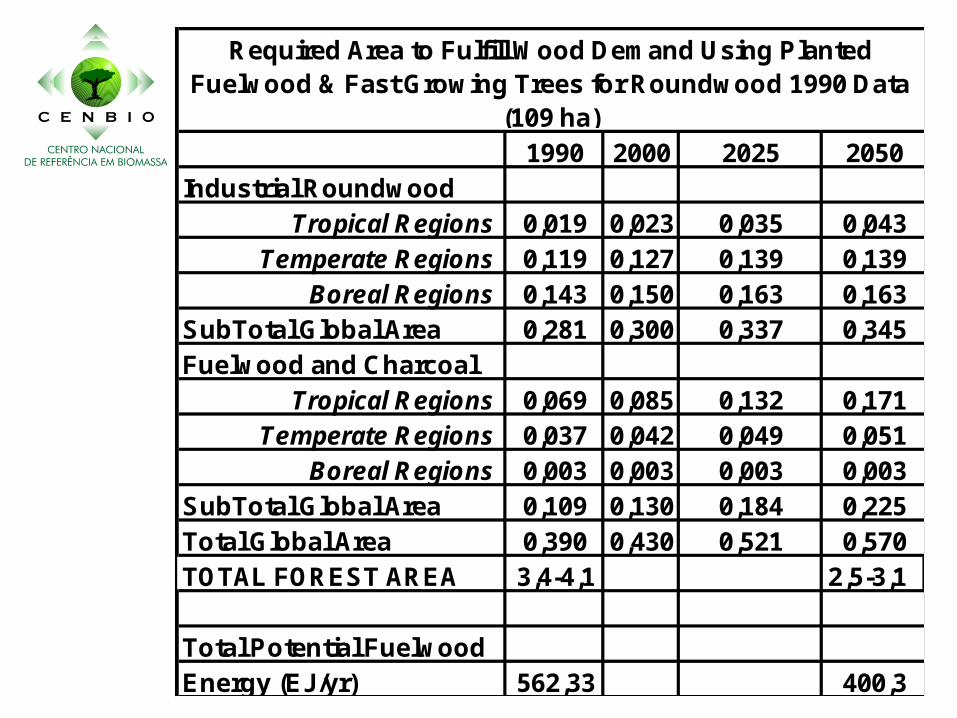
1990 2000 2025 2050Industrial Roundwood
Tropical Regions 0,019 0,023 0,035 0,043Temperate Regions 0,119 0,127 0,139 0,139
Boreal Regions 0,143 0,150 0,163 0,163SubTotal Global Area 0,281 0,300 0,337 0,345Fuelwood and Charcoal
Tropical Regions 0,069 0,085 0,132 0,171Temperate Regions 0,037 0,042 0,049 0,051
Boreal Regions 0,003 0,003 0,003 0,003SubTotal Global Area 0,109 0,130 0,184 0,225Total Global Area 0,390 0,430 0,521 0,570TOTAL FOREST AREA 3,4-4,1 2,5-3,1
Total Potential FuelwoodEnergy (EJ/yr) 562,33 400,3
Required Area to Fulfill Wood Demand Using Planted Fuelwood & Fast Growing Trees for Roundwood 1990 Data
(109 ha)

Country Area Yield Production Price Value** Total Value Area Yield Production Price Value Total Value(Mha) (t/ha) (Mt) (LC)* (US$/ha) (MUS$) (Mha) (t/ha) (Mt) (LC) (US$/ha) (MUS$)
BRAZIL 14 2,68 38,8 162 573,52 8303,2 12,8 3,24 41,5 112 324 4150USA 30 2,49 75 214 532,86 16050 28 8,38 235 100CHINA 8,7 1,72 15 23,5 4,7 110INDIA 6 0,93 56 6,6 1,82 12WORLD 85 2,25 187 163 4,29 711
* Local Currency**Uses the US market value. The assumption is not always commercially feasible.
Country Area Yield Production Price Value Total Value Area Yield Production Price Value* Total Value(Mha) (t/ha) (Mt) (LC) (US$/ha) (MUS$) (Mha) (t/ha) (Mt) (LC) (US$/ha) (MUS$)
BRAZIL 3,2 3,23 10,3 177 516,8 1648 2,3 0,78 1,8 1037 780 1800USA 1,3 7,01 9,1 160 0 1,45 0,0038 5780CHINA 28,5 6,35 18,1 NA 1,36 0,0075INDIA 44,5 2,96 13,2 0,31 0,97 0,301WORLD 180 3,85 58,5 11,7 0,62 73
*Coffee value in Brazil is much lower than in US. A value of US1000/tonne was assumed
SOYBEANS
RICE
Largest Crops in Brazil Compared with Some Other Important Agricultural Producers
MAIZE
COFFEE

CROP YIELD VALUE TOTAL VALUE(t/há) (US$/há) (Million US$)
CASSAVA 14 840 1470COFFEE 0.78 780 1800
SUGARCANE 70 757.9 3718SOYBEANS 2.68 574 8303
RICE 3.23 517 1648MAIZE 3.24 324 4150
WHEAT 1.99 279 448SORGHUM 1.87 168 77
VALUE OF SOME IMPORTANT CROPS FOR BRAZIL - 1995

HARVESTED AREAS FOR SOME MAJOR CROPS
0
50
100
150
200
250
BRAZIL USA CHINA INDIA WORLD
COUNTRIES
MH
A
SOYBEANS
MAIZE
SUGARCANE
RICE
COFFEE
CASSAVA
WHEAT
SORGHUM

AMOUNT OF BIOMASS HARVESTED- MAJOR CATEGORIES- 2001
0
500
1000
1500
2000
2500
3000
BRAZIL USA CHINA INDIA WORLD
COUNTRIES
MT
/YR
ALL CEREALS
SUGARCANE+"BARBOJO"
SUGARCANE
WOODFUEL(Comm.+NonComm.)
INDUSTRIAL ROUNDWOOD
WHEAT

ENERGY PRODUCTION FROM SUGARCANE PLANTATION- AREA EQUIVALENT TO SOYBEANS CROP - BRAZIL 2002/2020
YEAR AREA YIELD TOTAL PRODUCTION
(Mha) (t/ha) (Mt/yr) (EJ) (Mboe/day) (TWh/yr) (EJ) (EJ) (Mboe/day)2003 2,60 70 182 0,429 0,239 9,1 0,064 0,492 0,2742004 2,86 74 210 0,495 0,276 11,6 0,081 0,576 0,3212005 3,15 77 243 0,572 0,318 26,7 0,187 0,759 0,4222006 3,46 81 280 0,661 0,368 46,3 0,324 0,985 0,5482007 3,81 85 324 0,763 0,425 71,3 0,499 1,262 0,7022008 4,19 89 374 0,881 0,490 102,9 0,720 1,601 0,8912009 4,61 94 432 1,018 0,566 142,6 0,998 2,016 1,1222010 5,07 98 499 1,176 0,654 192,1 1,345 2,521 1,4022011 5,57 103 576 1,358 0,756 253,6 1,775 3,133 1,7432012 6,13 109 666 1,568 0,873 329,5 2,307 3,875 2,1562013 6,74 114 769 1,811 1,008 422,9 2,960 4,772 2,6552014 7,42 120 888 2,092 1,164 444,1 3,108 5,201 2,8942015 8,16 126 1026 2,417 1,345 512,9 3,590 6,007 3,3422016 8,98 132 1185 2,791 1,553 592,4 4,147 6,938 3,8602017 9,87 139 1368 3,224 1,794 684,2 4,789 8,013 4,4582018 10,86 140 1521 3,582 1,993 760,3 5,322 8,904 4,9542019 11,95 140 1673 3,940 2,192 836,3 5,854 9,794 5,4492020 13,14 140 1840 4,334 2,412 919,9 6,439 10,774 5,994
Increase 5,05 2 10,11 10,109 10,109 101,1 101,089 21,878 21,878
TOTAL 2000* 39 13000TOTAL 2020* 68 22000* SOURCE: US-EIA, International Energy Outlook
TOTAL ENERGYFuel+Elec. Fuel Electricity
ENERGY PRODUCTION ENERGY PRODUCTION

BEST SUGARCANE PRODUCTIVITY - 2001
0
20
40
60
80
100
120
140
TO
NN
ES
/HA

POTENTIAL ENERGY PRODUCTION FROM SUGARCANE 13 MILLION HA - BRAZIL
0,0
2,0
4,0
6,0
8,0
10,0
12,0
2003
2004
2005
2006
2007
2008
2009
2010
2011
2012
2013
2014
2015
2016
2017
2018
2019
2020
YEAR
EJ
/YR
Fuel+Elec. Electricity Fuel

WORLD BRAZIL USA INDIA CHINA
Agricultural Area (1000Ha) 4,961,289 250.2 418.3 180.8 535.36Arable & Permanent Crops (1000Ha) 1,501,452 65.2 179 169.7 135.36
SOURCE: FAO, 2002
LAND AVAILABILITY AND LAND USE FOR CROPSSELECTED COUNTRIES - 1999

WORLD FEASIBLE SUGARCANE PLANTATION -LARGE EFFORT SCENARIO- 2020
COUNTRY POTENTIAL AREA (Mha) (EJ) (Mboe/day) (TWh/yr) (EJ) (EJ) (Mboe/day)
BRAZIL 20 6,596 3,6700793 1400 9,8 16,396 9,1227797USA 10 3,298 1,8350397 700 4,9 8,1981 4,5613899INDIA 10 3,298 1,8350397 700 4,9 8,1981 4,5613899CHINA 10 3,298 1,8350397 700 4,9 8,1981 4,5613899MEXICO 4,8 1,583 0,880819 336 2,352 3,9351 2,1894671CENTRAL AM 4,8 1,583 0,880819 336 2,352 3,9351 2,1894671SOUTH AM 16 5,277 2,9360634 1120 7,84 13,117 7,2982238SOUTH ASIA 16 5,277 2,9360634 1120 7,84 13,117 7,2982238AUSTRALIA 16 5,277 2,9360634 1120 7,84 13,117 7,2982238AFRICA 16 5,277 2,9360634 1120 7,84 13,117 7,2982238OTHER 20 6,596 3,6700793 1400 9,8 16,396 9,1227797TOTAL 143,6 47,36 26,351169 10052 70,36 117,72 65,501559
TOTAL 2000* 39 13000TOTAL 2020* 68 22000
* SOURCE: US-EIA, International Energy Outlook
PRODUCTION PRODUCTION PRODUCTIONFUEL+ELECTR.FUEL ELECTRICITY

PRODUCTION OF SOME BIOMASS IN 2000 COMPARED WITH SUGARCANE POTENTIAL PRODUCTION IN 2020
0
5000
10000
15000
20000
25000
30000
WORLD
MT
/YE
AR
SUGARCANE+"BARBOJO" - LARGEEFFORT SCEN. - 2020
SUGARCANE+"BARBOJO"
WOODFUEL (Comm.+NonComm.)
INDUSTRIAL ROUNDWOOD
WHEAT
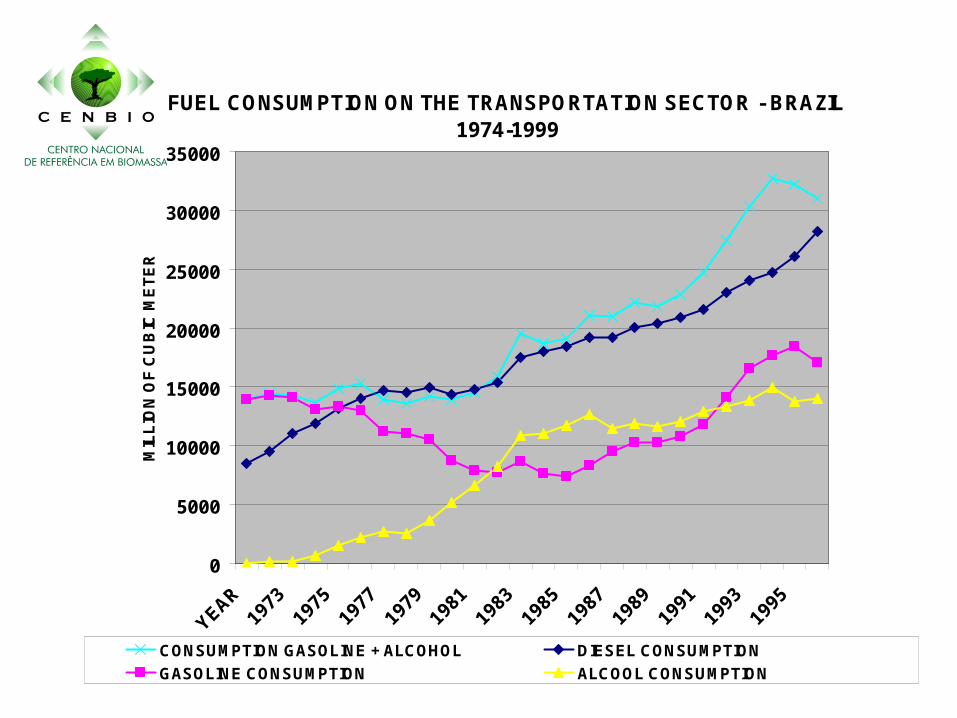
FUEL CONSUMPTION ON THE TRANSPORTATION SECTOR - BRAZIL 1974-1999
0
5000
10000
15000
20000
25000
30000
35000
YEAR
MIL
LIO
N O
F C
UB
IC M
ET
ER
CONSUMPTION GASOLINE + ALCOHOL DIESEL CONSUMPTION
GASOLINE CONSUMPTION ALCOOL CONSUMPTION

4.92.7 4.210.4
3.17.4 4.5
16.88.7
26.1
10.2
27.2
12.1
49.3
17.4
52.1
14.2
58.7
19.31
66.4
23.3
80.2
32
110
58.3
190
0
20
40
60
80
100
120
140
160
180
200
1987 1988 1989 1990 1991 1992 1993 1994 1995 1996 1997 1998 1999
YEAR
EVOLUTION OF COGENERATION IN SUGAR MILLS - ELECTRICICITY SOLD TO THE GRID - STATE OF SÃO PAULO
MW GWh

Car
bon
effi
cien
cy
Time
Market potentialEconomic potential
Socio-economic potential
Technological potential
Thermodynamic potential
Barriers to achieving the potential of technologies
Market failures
Values, attitudes, social barriers
High costs
Knowledge gap

SOCIO-ECONOMIC ISSUES

What are the main barriers to reach the (socio-)economic potential?
• Data, information, knowledge, awareness• Access to capital, especially smaller firms• Risk aversion in financial institutions, incl MDB’s• Trade barriers such as tariffs or export restrictions • Human and institutional capabilities • Missing codes and standards for EST’s • Low, subsidised conventional energy prices • Absence of full-cost pricing • Individual preferences/ lifestyle• Poverty
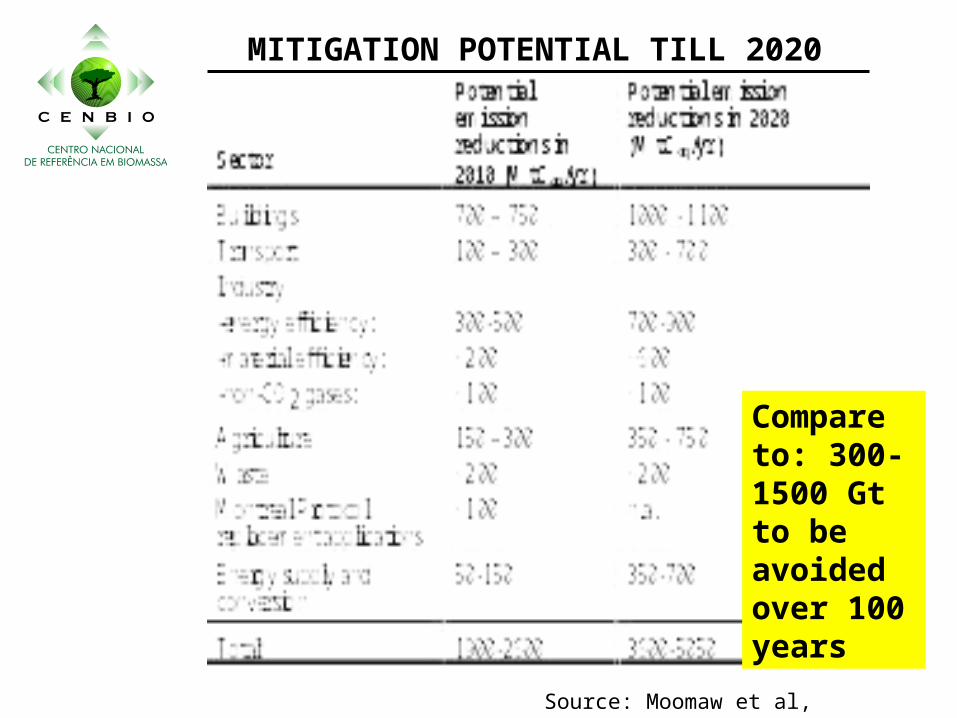
MITIGATION POTENTIAL TILL 2020
Source: Moomaw et al, IPCC, 2001
Compare to: 300-1500 Gt to be avoided over 100 years

A spokeswoman for the Mossman Central Mill-Australia said: 1) The Queensland and Federal Governments committed more than $10 million to the ethanol pilot plant project earlier this year; 2) Ethanol does not just have the potential to benefit cane growers but the environment and fuel consumers as well.
Peter Sheedy - Manager Herbert River District Canegrowers said:1) An ethanol blend offers a cleaner burning fuel; 2) Ethanol would also cut Australia's dependence on fossil fuel; 3) Ethanol has constantly to be kept on our radar screens.
Australian Cane Farmers Association chairman Warren Martin has: 1) Called for an immediate expansion of Australia's ethanol industry; 2) Stated many European countries already have mandatory ethanol-blend fuel; 3) Ethanol may ultimately provide the answer to more environmental issues than just greenhouse gas abatement," he said; 4) Additionally it will assist Australia to fill its own energy needs and rely less on imports.
Edition: ; Page: 001; Section: News

Japan eyes ethanol to cut greenhouse gas emissions Aya Takada (Reuters) Tokyo, December 20 , 2001
Japan, under pressure to cut greenhouse gas emissions, blamed for global warming, is considering introducing a policy of blending ethanol with gasoline.
Giant trading house Mitsui & Co is backing ethanol's introduction to the Japanese fuel market.
Estimate of the potential size of Japan's ethanol market is nearly six million kilolitres a year, based on the assumption that Japan would adopt an ethanol-to-gasoline blending ratio of 10 percent," said Mitsui biomass project manager Norimichi Okuda.
The Japanese have not used ethanol as fuel because they have not had any compelling need for an alternative But Japan has turned serious about using "green" energy.
From WWP- REPORT ON OIL GAS & PETROCHEMICALS
IN THE DEV, August 1st, 2001
Thailand is currently promoting the use of ethanol as an alternative
fuel.
It can be used as a substitute for the gasoline additive (MTBE).
As a results, the governments of Thailand and Austria are
considering a plan to set up 5 ethanol plants in Thailand.
The Austrian government's has proposed to Thailand that an
investment of around $22,000,000 to $44,000,000 could be made
for building each of the plants...

ENERGY RELATED CO2 EMISSIONS BY SECTOR - WORLD 1971-1995
1140 1273 1450 1542 1646 1732 1820 1913 2011 2113 2221
1653 1796 2094 2110 2293 2340 2387 2435 2484 2534 2586
672 760 862 925 1078 1215 1368 1540 1734 1952 2198
103 120 159 186 210 217 224 230 237 245 252
0%
10%
20%
30%
40%
50%
60%
70%
80%
90%
100%
1971 1975 1980 1985 1990 1995 2000 2005 2010 2015 2020
Building industry Transportation Agriculture

ECONOMIC ISSUES

Retail Wholesale ------- Retail Wholesale
Brazil -- 15 Russia 33 22
Australia 35 United States 43 27
EU 60 -- Japan 73 48
Cuba 8 -- South Korea -- 36
Thailand 13 12 Canada 30 16
Guatemala -- 22 Iran NA NA
South Africa -- 22 Malaysia 18 17
Colombia -- 27 Algeria -- --
Mauritius -- -- Indonesia -- --
Mexico 23 21 Egypt 21 18Sources: USDA attached reports, F.O. Licht, PROMAR International
Sugar Prices in the Leading Sugar Trading Nations
Net Exporters Net Importers (U.S. cents per pound of white sugar)

0,00
10,00
20,00
30,00
40,00
50,00
60,00
70,00
80,00
90,00
100,00
1960
1962
1964
1966
1968
1970
1972
1974
1976
1978
1980
1982
1984
1986
1988
1990
1992
1994
YEAR
US
CE
NT
S/L
B
Raw Sugar Pricescents/lb US 1995
Raw Sugar Pricescents/lb nominal
Raw Sugar PricesTrend
INTERNATIONAL RAW SUGAR PRICES - 1995-1960

0,00
10,00
20,00
30,00
40,00
50,00
60,00
70,00
80,00
90,00
YEAR
US
$/B
L
GasolinePrices US$/blUS$ 1995
GasolinePricesCurrentUS$/bl
GasolinePrices Trend
GASOLINE PRICES IN ROTERDAN

GASOLINE PRICES IN USA AND BRAZIL, AND ETHANOL PRICES IN BRAZIL
0.605 0.665
0.988
0.5860.710
0.7900.859
0.7320.888
0
0.2
0.4
0.6
0.8
1
1.2
Refinery
gate
199
9
Refinery
gate
200
0
Competit
ive P
rice U
SA-Conv.
Eng.
Competiv
e Pric
e USA-H
igh C
omp. E
ng.
Refinery
gate
200
1
Competiv
e Pric
e BRAZI
L-Conv.
Eng.
Competit
ive P
rice B
RAZIL-H
igh c
omp. E
ng.
Hydra
ted p
rice a
t mill
-200
1
Potentia
l Anhyd
rous p
rice a
t mill
-200
1
US$/gallon
GAS USA
ETHANOL
GAS BRAZIL
ETHANOL 2001

Ethanol cost "learning curve"
100
1000
1 10 100 1000e t ha no l c umulat ive c o ns ump t io n ( in millio n c ub ic me t e rs )
( US $/ m3 )
1980
1998200
300
400
500
600700800900

ALCOHOL PRODUCTION 1976-1998
0
2000
4000
6000
8000
10000
12000
14000
19761978
19801982
19841986
19881990
19921994
19961998
YEAR
X10
00 m
3
0
50000
100000
150000
200000
250000
X10
00 m
3
Alcohol Production
Accummulated Production

Carbon Credit Value:Two Scenarios
0
100
200
300
400
500
600
2003
2005
2007
2009
2011
2013
2015
2017
2019
2021
2023
2025
2027
Year
US
$/t
C
High Price
Low Price

SMALL HYDRO PROJECT Internal Rate of Return
0%
2%
4%
6%
8%
10%
12%
14%
16%
No CarbonCredits
Low Price High Price

0
200
400
600
800
1000
1200
1400
1600
1800
2003
2004
2005
2006
2007
2008
2009
2010
2011
2012
2013
2014
2015
2016
2017
2018
2019
2020
YEAR
MtC
Fuel+Elect. Cummulative(MtC)
Fuel Cummulative (MtC)
Elect. Cummulative (MtC)
POTENTIAL C ABATEMENT FROM THE USE OF SUGARCANE FOR FUEL AND ELECTRICITY
PRODUCTION - BRAZIL - 13 MILLION HA

0
20
40
60
80
100
120
140
2003
2004
2005
2006
2007
2008
2009
2010
2011
2012
2013
2014
2015
2016
2017
2018
2019
2020
YEAR
C Abatement/Area Sugarcane(tC/há)
AREA (Mha)
Cummulative C Abatement/AreaForest Sink (tC/há)
POTENTIAL CARBON ABATEMENT PER UNIT OF HARVESTED AREA - SUGARCANE - BRAZIL - 13 MHA

EXTERNAL DEBT IMPACT OF ALCOHOL EXPORTATION BRAZIL - 1979/1992
02 04 06 08 0
1 0 01 2 01 4 01 6 0
7 8 7 9 8 0 8 1 8 2 8 3 8 4 8 5 8 6 8 7 8 8 8 9 9 0 9 1 9 2
Y E A R
US$ B
illio
n E x t . d e b t
E x t . D e b t w . E th a n .
E x p . E th a n o l
E x p o r ta t io n
EXTERNAL DEBT IMPACT OF ALCOHOL EXPORTATION
BRAZIL 1979/1992
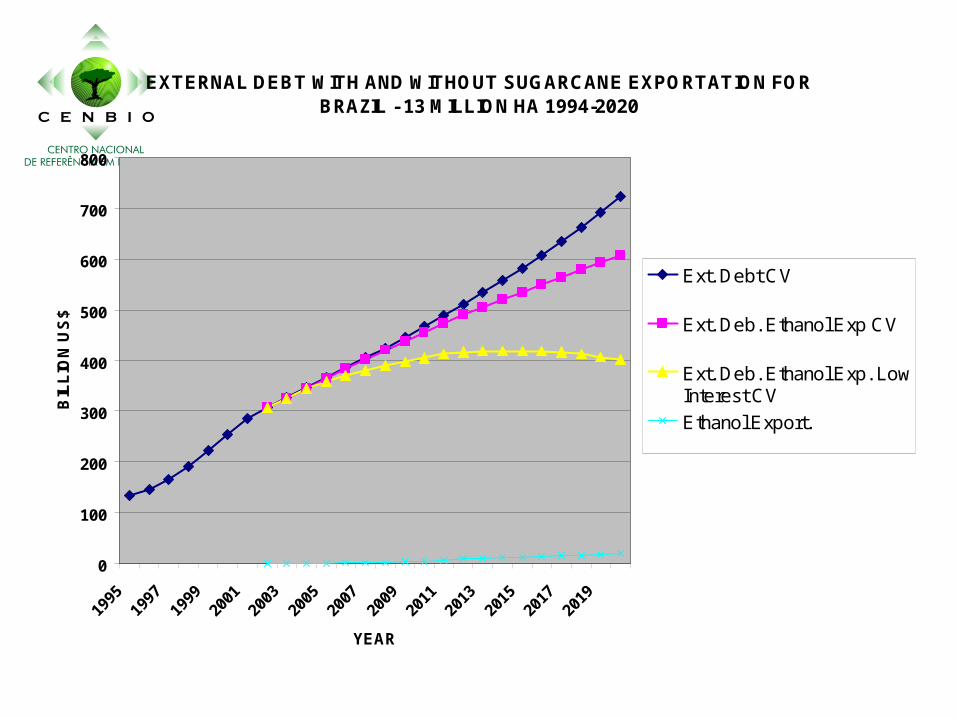
EXTERNAL DEBT WITH AND WITHOUT SUGARCANE EXPORTATION FOR BRAZIL - 13 MILLION HA 1994-2020
0
100
200
300
400
500
600
700
800
1995
1997
1999
2001
2003
2005
2007
2009
2011
2013
2015
2017
2019
YEAR
BIL
LIO
N U
S$
Ext. Debt CV
Ext. Deb. Ethanol Exp CV
Ext. Deb. Ethanol Exp. LowInterest CV
Ethanol Export.