Embed Size (px)
Citation preview
BAR - Brazilian Administration Review
E-ISSN: 1807-7692
Associação Nacional de Pós-Graduação e
Pesquisa em Administração
Brasil
Gastaud Maçada, Antonio Carlos; Michelini Beltrame, Mateus; Cunha Dolci, Pietro; Becker, João Luiz
IT Business Value Model for Information Intensive Organizations
BAR - Brazilian Administration Review, vol. 9, núm. 1, enero-marzo, 2012, pp. 44-65
Associação Nacional de Pós-Graduação e Pesquisa em Administração
Curritiva, Brasil
Available in: http://www.redalyc.org/articulo.oa?id=84123104004
How to cite
Complete issue
More information about this article
Journal's homepage in redalyc.org
Scientific Information System
Network of Scientific Journals from Latin America, the Caribbean, Spain and Portugal
Non-profit academic project, developed under the open access initiative
Available online at
http://www.anpad.org.br/bar
BAR, Rio de Janeiro, v. 9, n. 1, art. 3,
pp. 44-65, Jan./Mar. 2012
IT Business Value Model for Information Intensive Organizations
Antonio Carlos Gastaud Maçada *
E-mail address: [email protected]
Universidade Federal do Rio Grande do Sul - UFRGS
Porto Alegre, RS, Brazil.
Mateus Michelini Beltrame
E-mail address: [email protected]
Universidade Federal do Rio Grande do Sul- UFRGS
Porto Alegre, RS, Brazil.
Pietro Cunha Dolci
E-mail address: [email protected]
Universidade Federal do Rio Grande do Sul- UFRGS
Porto Alegre, RS, Brazil.
João Luiz Becker
E-mail address: [email protected]
Universidade Federal do Rio Grande do Sul- UFRGS
Porto Alegre, RS, Brazil.
* Corresponding author: Antonio Carlos Gastaud Maçada
Rua Washington Luiz, 855, Centro Histórico, Porto Alegre, RS, 90010-460, Brazil.
Copyright © 2012 Brazilian Administration Review. All rights reserved, including rights for
translation. Parts of this work may be quoted without prior knowledge on the condition that
the source is identified.
IT Business Value Model 45
BAR, Rio de Janeiro, v. 9, n. 1, art. 3, pp. 44-65, Jan./Mar. 2012 www.anpad.org.br/bar
Abstract
Many studies have highlighted the capacity Information Technology (IT) has for generating value for
organizations. Investments in IT made by organizations have increased each year. Therefore, the purpose of the
present study is to analyze the IT Business Value for Information Intensive Organizations (IIO - e.g. banks,
insurance companies and securities brokers). The research method consisted of a survey that used and combined
the models from Weill and Broadbent (1998) and Gregor, Martin, Fernandez, Stern and Vitale (2006). Data was
gathered using an adapted instrument containing 5 dimensions (Strategic, Informational, Transactional,
Transformational and Infra-structure) with 27 items. The instrument was refined by employing statistical
techniques such as Exploratory and Confirmatory Factorial Analysis through Structural Equations (first and
second order Model Measurement). The final model is composed of four factors related to IT Business Value:
Strategic, Informational, Transactional and Transformational, arranged in 15 items. The dimension Infra-
structure was excluded during the model refinement process because it was discovered during interviews that
managers were unable to perceive it as a distinct dimension of IT Business Value.
Key words: IT business value; IT investment; information intensive organizations.
A. C. G. Maçada, M. M. Beltrame, P. C. Dolci, J. L. Becker 46
BAR, Rio de Janeiro, v. 9, n. 1, art. 3, pp. 44-65, Jan./Mar. 2012 www.anpad.org.br/bar
Introduction
The value Information Technology (IT) has for organizations is one of the most frequent topics
in literature on IT management. For more than 50 years, more precisely since electronic data
processing became an essential tool in the business world, the topic has been investigated by IS
researchers (Freedman, 2003; Hu & Quan, 2005; Lin, 2009; Oh & Pinsonneault, 2007). Since the mid-
1990s studies attempting to assess IT Business Value have intensified. The main studies have sought
to assess the impact of IT on financial performance, productivity, workers and organizational
processes (Bharadwaj, 2000; Brynjolfsson & Hitt, 1996; Gregor, Martin, Fernandez, Stern, & Vitale,
2006; Loveman, 1994; Melville, Kraemer, & Gurbaxani, 2004; Scheepers & Scheepers, 2008; Tallon,
Kraemer, & Gurbaxani, 2001).
It is now well understood that the utilization of traditional financial measures, such as return on
investment (ROI) and return on assets (ROA), is not always comprehensive enough to fully appreciate
the results of IT acquisition and use. IT is not simply a tool for automating existing processes, it is
primarily a tool to promote organizational changes that can lead to additional gains in productivity,
profitability and customer satisfaction and so its value cannot be adequately measured with limited
financial and tangible measures (Dedrick, Gurbaxani, & Kraemer, 2003). The value of the knowledge
accumulated by the employees, the software, the data bases and the organizational and customer
relationship capacities do not show up in traditional accounting reports. Instead, IT Business Value is
better grasped by looking for its contributions towards the capacity people have for delivering value to
the clients (Strassmann, 2004). Hence, the IT Business Value for the organization is defined,
according to Melville et al. (2004), as being the benefits that IT provides towards the performance of
the organization at the intermediate process levels, such as cost reductions and increased productivity
in a specific task, and also in the organizational environment, like the creation of competitive
advantage (Melville et al., 2004).
The role of IT has also been found to differ among firms of different economic sectors and
having distinct intensities of IT use (Mittal & Nault, 2009). According to Hu and Quan (2005),
industries with intensive use of information, like banking, financial and insurance services, would
benefit more from IT investments than those industries with low information intensity, such as energy,
mining and construction. For some industries, information is the main product moving through the
primary value chain and the use of IT can result in significant improvements in operational efficiency.
The pioneer work of McKenney and McFarlan (1982) studied IT intensive user firms, focusing on
what they called informational islands that exists throughout different areas in a single organization.
One decade later Glazer (1991) established that measuring the intensity of an organization’s use of
information should be taken according to the degree to which its products and operations are based on
the information gathered and processed as part of exchanges that take place along the value chain,
from the supplier to the client. We label them Information Intensive Organizations (IIO’s). An IIO
demands a high volume of IT investments, which generates the need to assess to what extent these
investments are actually providing benefits and thus effectively adding value to the organization.
Accordingly, the question that motivates this study arises: How to asses the value of IT for
Information Intensive Organization?
In order to analyze the IT Business Value for IIO’s, this study proposes a combination of
models developed by Weill and Broadbent (1998) and Gregor, Martin, Fernandez, Stern and Vitale
(2006). The objective of this paper is to validate a model for measuring the IT Business Value for
IIO’s in their daily operations, as in the case of banks, insurance companies and security brokers. We
begin developing its theoretical framework, followed by a description of the methodology employed.
Then we present its main results and conclusions.
IT Business Value Model 47
BAR, Rio de Janeiro, v. 9, n. 1, art. 3, pp. 44-65, Jan./Mar. 2012 www.anpad.org.br/bar
Theoretical Background
Organizations are continuously searching for ways to use IT more intensely and broadly, IT
being considered a powerful tool, able to alter the strategic and operational bases of firms (Albertin,
2001). In particular, according to Crane and Bodie (1996), the financial services industry is being
radically transformed, the major driving forces being the new information technologies, vanishing
processing costs and the elimination of old barriers among products and services, as well as geography
itself.
While reviewing the literature on the topic, a number of models and dimensions were found
which different authors suggest are capable of representing IT Business Value (Brynjolfsson & Hitt,
1996; Dehning, Richardson, & Zmud, 2007; Gregor et al., 2006; Melville et al., 2004; Radhakrishnan,
Zu, & Grover, 2008; Turner & Lucas, 1985; Weill, 1992; Weill & Broadbent, 1998). While some
authors emphasize the strategic value of IT (Neirotti & Paolucci, 2007), others call attention to the
process of obtaining organizational benefits from IT investments (Zwicker, Souza, Vidal, & Siqueira,
2007). This helps demonstrate how complex is the task of analyzing the IT value.
The model proposed by Turner and Lucas (1985) and expanded by Weill (1992) was reworked
by Weill and Broadbent (1998), who proposed a more complex model showing the benefits obtained
from any investments expected to be made by the organization. Another dimension, infrastructure, was
added. It refers to the investments made in IT infrastructure and resulting benefits expected by the
organization, most of which are to increase the integration, flexibility and standardization of the
business.
Measures of value for the organization should be closely related to the strategic objectives for
which the technology was installed and also need to take into consideration the competitive
environment and the specific organizational context (Mooney, Gurbaxani, & Kraemer, 1996).
Furthermore, according to the author, it is vital that the value of any element needs to be linked to the
specific elements of the business plans that represent the criteria and objectives of organizational
performance. There were three types of investments identified: strategic, informational, and
transactional. Strategic investments in IT alter the product or the way the organization competes,
informational investments improve the quality and range of the information, while transactional
investments help in the operational management and reduce costs (Mirani & Lederer, 1998).
IT infrastructure, including computers used as mainframes, storage devices, servers, etc.,
provides the main information storage and processing capabilities of any organization. Therefore, a
larger IT infrastructure can store more information, which can be useful in the decision-making
process (Melville, Gurbaxani, & Kraemer, 2007). Investments in IT infrastructure should induce a
positive and abnormal reaction in relation to the appreciation of the firm in the market due to the wider
scope of this type of investment. They introduce robust technological platforms that can be used in a
variety of current and future IT applications (Aral & Weill, 2007; Bharadwaj, 2000; Chatterjee, Pacini,
& Sambamurthy, 2002; Weill & Aral, 2006).
The dimensions of Weill and Broadbent´s model characterize types of IT investment according
to the organizational objectives, with distinct benefits attributed to each of them.
The strategic dimension considers the benefits for the organization at a strategic level that the use
of IT can bring, such as competitive advantage, strategic alignment and better customer relations.
Its variations are: product innovation, process innovation, competitive advantage, renewed delivery
service, increased sales and better market positioning.
The information dimension deals with the value that IT brings to the organization as a result of the
improved information, be it in terms of accessibility, quality or flexibility. Its variations are:
increased control, better information, better integration, improved quality and a faster cycle.
A. C. G. Maçada, M. M. Beltrame, P. C. Dolci, J. L. Becker 48
BAR, Rio de Janeiro, v. 9, n. 1, art. 3, pp. 44-65, Jan./Mar. 2012 www.anpad.org.br/bar
The transactional dimension explores the benefits that IT provides to the organization in
operational transactions, repetitive activities and any activities that do not require intellectual effort.
Its variations are: cost reductions and increased organizational outputs.
The infrastructure dimension deals with the benefits that investments in technological equipment
related to the functioning of the information systems bring to the organization, specifically personal
computers, printers, operational systems and scanners (Weill & Broadbent, 2000). Its variations
are: enhanced business integration and flexibility, reduced marginal costs of each IT unit in the
business, reduced IT costs and standardization.
The seminal model from Turner and Lucas (1985) was also reworked by Gregor et al. (2006) to
include another dimension, transformational IT. This transformation takes place at the organizational
level due to the use of IT, bringing benefits at the time the investments are made, which serve as
catalysts of future changes. As the organization builds its resource system and creates assets for
competitive advantage, managers gain knowledge and new abilities (Lucas, 2005). The benefits of this
new dimension for the organization are: new or improved business processes, new skills among the
collaborators and new organizational structures, including alterations to the business model. For
example, the internet stimulated a wave of creativity and thus this new technology set forward a great
number of new business models (Lucas, 2005). The transformational dimension is based on the
supposition that investments in IT, and its use, innovate and transform the business processes of the
organization (Mooney et al., 1996) and, consequently, the industry in which it operates. This change in
processes, in turn, alters perception of the IT Business Value, thus making it a cyclical process.
Venkatraman (1994) proposed a framework with five levels of IT-induced transformation within the
organization: the greater the level of transformation of the business the greater the benefits accrued.
The degrees of transformation proposed by Venkatraman (1994) are: local exploitation, internal
integration, business processes and networks redesign, and business scope redefinition.
The results from the use of IT are not merely limited to increased efficiency and strategic
advantage, but also include organizational transformation, with new ways of doing business and
managing organizational learning, leading to new changes in the management and application of IT
both in the organization and in the industry in which it operates (Gregor et al., 2006).
Transformational IT investments, understood as a redefinition of business processes and the industry
and its relationships, can serve as a base for structural changes in industry practices and also in
differentiating the firm that makes these investments from others in the same sector that do not
(Dehning, Richardson, & Zmud, 2003).
In summary, the original Turner and Lucas´s model has been used by different authors. Weill
and Broadbent (1998) and Gregor et al. (2006) added fourth and fifth dimensions to the original
model: infrastructure and transformational, respectively. The augmented models were used in other
studies, where they contributed external validation. For instance, Weill and Broadbent’s model was
validated by Shang and Seddon (2002), Chuang (2004), Aral and Weill (2007), and Sobol and Klein
(2009). The model of Gregor et al. (2006) was validated by research conducted by Avison (2007),
Cha, Gregor and Fernandez (2008), Phang, Kankanhalli and Ang (2008), and Cao (2010).
The present study, in contrast to the previous studies, has combined the models from Weill and
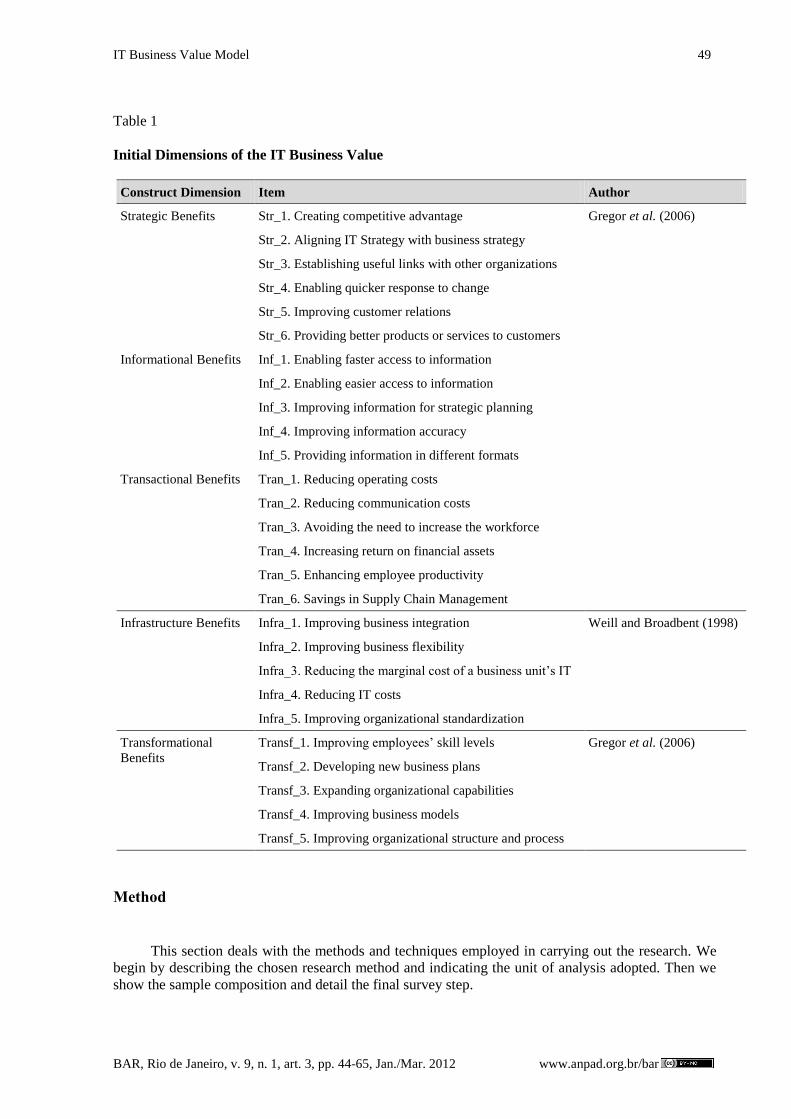
Broadbent (1998) and Gregor et al. (2006) into a single model. Table 1 shows the five dimensions and
their items from the initial model as employed in the present study.
IT Business Value Model 49
BAR, Rio de Janeiro, v. 9, n. 1, art. 3, pp. 44-65, Jan./Mar. 2012 www.anpad.org.br/bar
Table 1
Initial Dimensions of the IT Business Value
Construct Dimension Item Author
Strategic Benefits Str_1. Creating competitive advantage Gregor et al. (2006)
Str_2. Aligning IT Strategy with business strategy
Str_3. Establishing useful links with other organizations
Str_4. Enabling quicker response to change
Str_5. Improving customer relations
Str_6. Providing better products or services to customers
Informational Benefits Inf_1. Enabling faster access to information
Inf_2. Enabling easier access to information
Inf_3. Improving information for strategic planning
Inf_4. Improving information accuracy
Inf_5. Providing information in different formats
Transactional Benefits Tran_1. Reducing operating costs
Tran_2. Reducing communication costs
Tran_3. Avoiding the need to increase the workforce
Tran_4. Increasing return on financial assets
Tran_5. Enhancing employee productivity
Tran_6. Savings in Supply Chain Management
Infrastructure Benefits Infra_1. Improving business integration Weill and Broadbent (1998)
Infra_2. Improving business flexibility
Infra_3. Reducing the marginal cost of a business unit’s IT
Infra_4. Reducing IT costs
Infra_5. Improving organizational standardization
Transformational
Benefits
Transf_1. Improving employees’ skill levels Gregor et al. (2006)
Transf_2. Developing new business plans
Transf_3. Expanding organizational capabilities
Transf_4. Improving business models
Transf_5. Improving organizational structure and process
Method
This section deals with the methods and techniques employed in carrying out the research. We
begin by describing the chosen research method and indicating the unit of analysis adopted. Then we
show the sample composition and detail the final survey step.
A. C. G. Maçada, M. M. Beltrame, P. C. Dolci, J. L. Becker 50
BAR, Rio de Janeiro, v. 9, n. 1, art. 3, pp. 44-65, Jan./Mar. 2012 www.anpad.org.br/bar
Research method
The survey method of research is a way of gathering information directly and in a standardized
form from people through the use of questionnaires in which the questions are the same for all the
interviewees, rendering it possible to make inferences regarding the population as a whole (Powell &
Hermann, 2000). The objects of the study are usually individuals, groups, organizations or
communities, but can also be projects, applications or systems (Pinsonneault & Kraemer, 1993). For
Powell and Hermann (2000), the use of the survey method is best recommended when the questions to
be assessed are answered by the people themselves; whether because some aspects cannot be directly
observed or because it would be impossible or impractical for the researcher to observe the behavior of
various people in relation to certain situations, such as eating habits.
Unit of analysis
IIO’s were considered best suited for the execution of this survey, since they invest heavily in
IT and information is the basic input of their value chains. The target population consisted of
organizations with three different types of financial activity: banks belonging to the National
Federation of Banks (FEBRABAN), securities brokers belonging to the National Brokers Association
(ANCOR) and insurance companies belonging to the National Federation of Insurers (FENASEG).
The survey respondents were executives responsible for management in the IT area and
managers from the business areas. Managers from the IT area were chosen because they have a
profound knowledge of the characteristics of IS and have a broad view of the business process, since
IT tends to permeate throughout the IIO. Managers from the business areas, such as financial services,
operations, and strategy, were selected because they are directly involved with the processes that bring
value to the organization. It was also considered interesting to capture the perception of executives
from business areas and verify whether they perceive the IT Business Value for their organization in
the same way as the executives that work specifically with IS.
Pre-test survey
The research instrument is the result of a pre-test stage, in which the original research
instrument (Gregor et al., 2006) was modified to include a fifth dimension, infrastructure. The
modified instrument was thus composed of 5 dimensions and 27 items, with a 5 point Likert-like scale
varying from Completely disagree to Completely agree. This instrument was translated to
Portuguese, and later back translated to English to test for congruence. It was given to 40 executives
attending continuing education courses in Administration and 13 executives from large industrial and
service organizations, for a total of 53 respondents. Respondents were asked if they agree or disagree
that over the last 18 months, the use of IT has contributed to achievement of the business benefits
listed in the research instrument. The result of this stage was an instrument with 5 dimensions and 26
items, and the item Tran_6. Savings in Supply Chain Management was eliminated because in banks
and financial institutions the SCM plays little or no role in their activities. The instrument was
subsequently applied within the population of interest, having first undergone this refining process.
The statistical techniques employed were Exploratory Factorial Analysis with the SPSS statistical
software and Confirmatory Factor Analysis using Structural Equation Modeling assisted by AMOS
statistical software.
The framework proposed by Hair, Anderson, Tatham and Black (2005) was used as a guide to
capture the technique of Structural Equation Modeling. The first stage involved the definition of the
theoretical model to be tested, which in this case is the combination of the models proposed by Weill
and Broadbent (1998) and Gregor et al. (2006). After that, the path diagram representing causal
relations among the variables in the model (Figure 1) was used and converted into a set of structured
equations, thus specifying the model. In order to achieve this, the facilities found in the software
package AMOS were utilized. The next stage was the evaluation of the model identification phase, in
which some adjustments were made to the model. Traditional measures Goodness of Fit Index (GFI),
IT Business Value Model 51
BAR, Rio de Janeiro, v. 9, n. 1, art. 3, pp. 44-65, Jan./Mar. 2012 www.anpad.org.br/bar
Adjusted Goodness of Fit Index (AGFI), Normed Fit Index (NFI), Non-Normed Fit Index (NNFI),
Comparative Fit Index (CFI) and Root Mean Square Error of Approximation (RMSEA) were
dedicated to that purpose. At last, as a final stage, the second order model was evaluated, resulting in
an interpretation and analysis of the final model.
As a result of this step, the research instrument was validated, and ended up containing four
dimensions distributed in 15 items. The entire refining process followed the stages described by
Koufteros (1999). Analysis of the mean scores and t-tests were used to measure the perceptions
executives held regarding the IT Business Value.
Final survey sample composition
The final survey sample was composed of a total of 143 questionnaires, with responses from 69
different financial organizations in Brazil. Regarding the insurance companies, out of the 99 firms
affiliated to FENASEG, 14 responded to the questionnaire. This represents a response rate of 14.14%.
With regard to the security brokers, 25 out of the 96 firms affiliated to ANCOR responded to the
questionnaire, which gives a response rate of 25%. And for banks, data was collected from 30 out of
the 115 banks affiliated to FEBRABAN, which represents a response rate of 26%. Table 2 shows the
data synthetically.
Table 2
Representativeness of the Sample
Industries N Members %
Insurance 14 99 14.14%
Security Brokers 24 96 25
Banks 30 115 26
Those questionnaires in which only one value was attributed to all items as well as those with
20% or more items not answered (blank responses) were considered outliers and eliminated from the
sample. The remaining sample was composed of 125 respondents (52 from IT area and 73 from
business area).
Results
Refinement of the research instrument
Exploratory factorial analysis (EFA)
To begin with, Exploratory Factorial Analysis (EFA) was performed in order to define the
underlying structure in a data matrix (Hair, Anderson, Tatham, & Black, 2005). EFA looks for
correlations between the dimensions in order to form a set of dimensions with common characteristics,
known as factors. The method of principal components analysis was used to get the initial factors
solution, which was then rotated using the varimax criterion. The KMO test (0.851), which indicates
the fit of the sample, and Bartlett sphericity test (0.00), which evaluates the presence of correlations
between the dimensions, exhibited values within those recommended by Hair et al. (2005). Also, as
recommended by Hair et al. (2005), the minimum of 5 questionnaires necessary for each variable was
obtained.
A. C. G. Maçada, M. M. Beltrame, P. C. Dolci, J. L. Becker 52
BAR, Rio de Janeiro, v. 9, n. 1, art. 3, pp. 44-65, Jan./Mar. 2012 www.anpad.org.br/bar
EFA made it possible to discriminate four out of the five initially proposed dimensions of
benefits arising from IT: Strategic, Informational, Transactional and Transformational. The
dimension Infrastructure was not confirmed as a category of distinct benefits arising from the IT
infrastructure. With the completion of Discriminant EFA, 10 items were eliminated because of their
low correlation with others within their factor or for a lack of conceptual coherence. Table 3 shows the
extracted factors, items and their factor loads.
Table 3
Exploratory Factorial Analysis
Dimensions Factor Load Explained Variance
Transformational 0.783 to 0.564 18,24%
Strategic 0.807 to 0.499 16,04%
Transactional 0.854 to 0.587 13,85%
Informational 0.808 to 0.605 13,06%
All factor loads remained within the interval from 0.5 to 0.85. For this interval, the size of the
sample obtained is considered good for the significance of the factor loads (Hair et al., 2005). Taken
together, the four factors explain 61% of the total variance associated with the IT Business Value in
the surveyed sample.
Later, convergent EFA was carried out in order to check whether the factors were really one-
dimensional, that is, whether all the benefits of a determined dimension converge in one direction,
which proved to be the case. This finding is very important, since it shows that the benefits present in
each of the factors have a meaning in common for the respondents, facilitating the analytical work of
the researcher.
Cronbach’s Alpha showed that the factors were also internally consistent. Cronbach’s α varies
from 0 to 1 and the closer to 1 the greater the internal consistency. The lowest value normally accepted
is 0.70, but this can be as low as 0.60 in exploratory studies (Robinson as cited in Hair et al., 2005).
All the values were considered adequate, varying from 0.71 to 0.79, in the case of the factors, and 0.88
in the instrument as a whole.
Confirmatory factorial analysis (CFA)
Confirmatory Factorial Analysis was carried out with the purpose of analyzing the different
relationships within the measurement model. Structural equation techniques refer to an extension of
several multivariate analysis techniques, which combine elements related to multiple regression with
factorial analysis, in order to simultaneously estimate a series of dependent relationships. Structural
equations facilitate a transition from exploratory factorial analysis to confirmatory factorial analysis
(Hair et al., 2005).
According to Ullman (2000), structural equation modeling is characterized as a set of statistical
procedures which permit the analysis of the relationships between one or more independent
dimensions and one or more dependent dimensions. Accordingly, in order to validate the pre-
established model, CFA was carried out. The exogenous constructs (independent dimensions) are the
items in the instrument resulting from the EFA, and the endogenous constructs (dependent
dimensions) are the four dimensions of benefits, whose relationships are previously established
through application of CFA. As a result of this process, a definitive instrument for measuring the IT
Business Value for IIO was obtained.
IT Business Value Model 53
BAR, Rio de Janeiro, v. 9, n. 1, art. 3, pp. 44-65, Jan./Mar. 2012 www.anpad.org.br/bar
The data base conforms to the conditions recommended by Hair et al. (2005), where there is a
quantity of responses five times greater than the quantity of items. A total of 125 valid questionnaires
were included. The Maximum Likelihood (ML) method was chosen because, as Thompson (as cited in
Hair et al., 2005) explain, it is quite robust and is the most widely used CFA modeling method.
Moreover, according to Hair et al. (2005), it is recommended that the size of the sample for the
performance of CFA should be between 100 and 200 elements, which is a condition satisfied in the
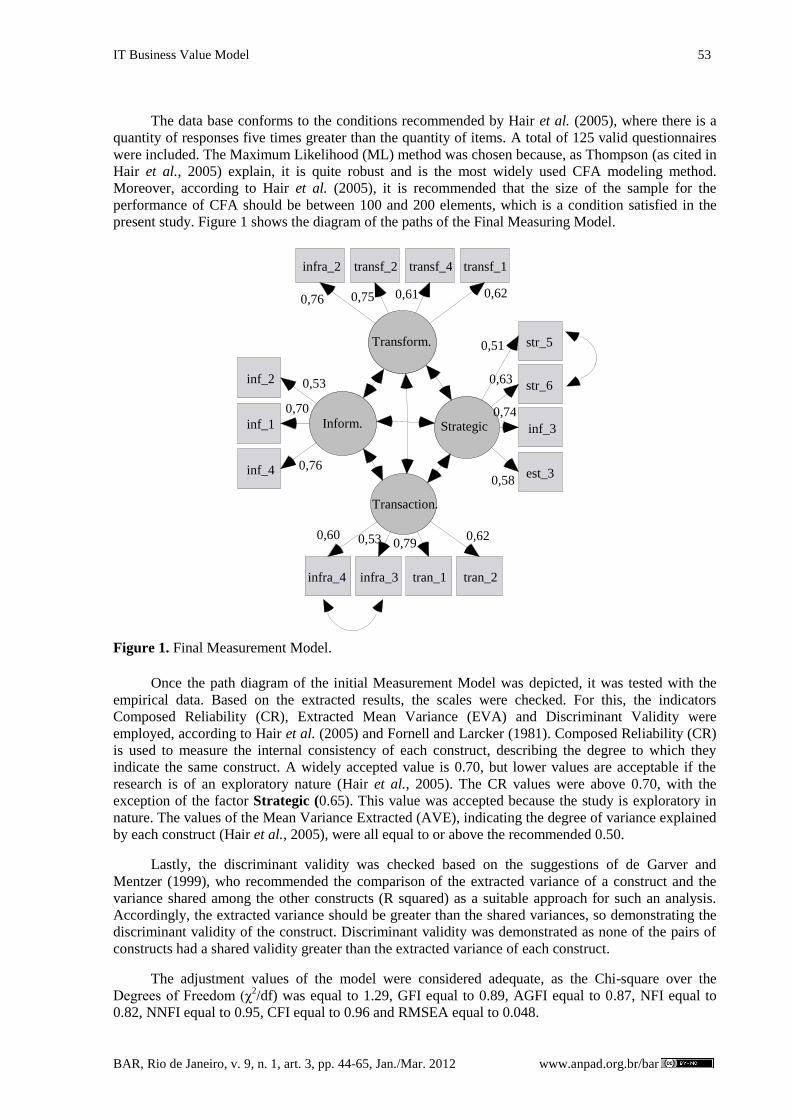
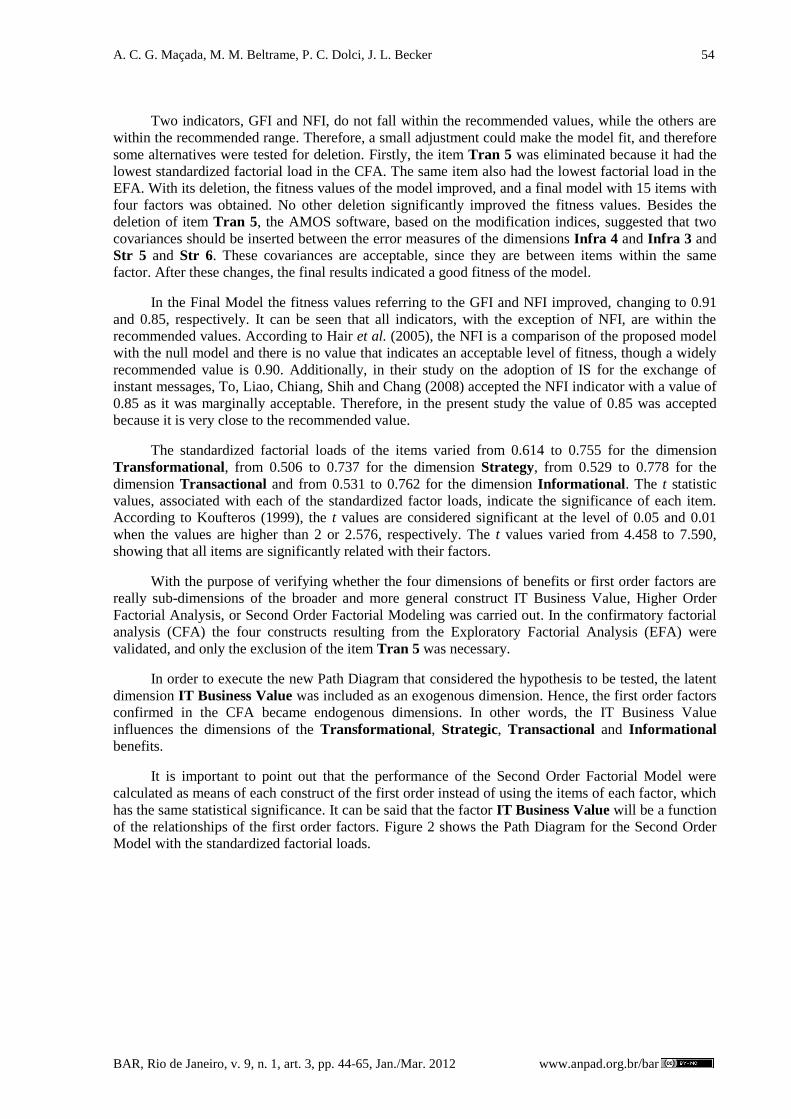
present study. Figure 1 shows the diagram of the paths of the Final Measuring Model.
Figure 1. Final Measurement Model.
Once the path diagram of the initial Measurement Model was depicted, it was tested with the
empirical data. Based on the extracted results, the scales were checked. For this, the indicators
Composed Reliability (CR), Extracted Mean Variance (EVA) and Discriminant Validity were
employed, according to Hair et al. (2005) and Fornell and Larcker (1981). Composed Reliability (CR)
is used to measure the internal consistency of each construct, describing the degree to which they
indicate the same construct. A widely accepted value is 0.70, but lower values are acceptable if the
research is of an exploratory nature (Hair et al., 2005). The CR values were above 0.70, with the
exception of the factor Strategic (0.65). This value was accepted because the study is exploratory in
nature. The values of the Mean Variance Extracted (AVE), indicating the degree of variance explained
by each construct (Hair et al., 2005), were all equal to or above the recommended 0.50.
Lastly, the discriminant validity was checked based on the suggestions of de Garver and
Mentzer (1999), who recommended the comparison of the extracted variance of a construct and the
variance shared among the other constructs (R squared) as a suitable approach for such an analysis.
Accordingly, the extracted variance should be greater than the shared variances, so demonstrating the
discriminant validity of the construct. Discriminant validity was demonstrated as none of the pairs of
constructs had a shared validity greater than the extracted variance of each construct.
The adjustment values of the model were considered adequate, as the Chi-square over the
Degrees of Freedom (χ2/df) was equal to 1.29, GFI equal to 0.89, AGFI equal to 0.87, NFI equal to
0.82, NNFI equal to 0.95, CFI equal to 0.96 and RMSEA equal to 0.048.
Transform.
infra_2 transf_2 transf_4 transf_1
Strategic
str_5
str_6
inf_3
est_3
Transaction.
tran_2 tran_1 infra_3 infra_4
Inform.
inf_4
inf_1
inf_2 0,53
0,70
0,76
0,76 0,75
0,51
0,63
0,74
0,58
0,61 0,62
0,60 0,53 0,79 0,62
A. C. G. Maçada, M. M. Beltrame, P. C. Dolci, J. L. Becker 54
BAR, Rio de Janeiro, v. 9, n. 1, art. 3, pp. 44-65, Jan./Mar. 2012 www.anpad.org.br/bar
Two indicators, GFI and NFI, do not fall within the recommended values, while the others are
within the recommended range. Therefore, a small adjustment could make the model fit, and therefore
some alternatives were tested for deletion. Firstly, the item Tran 5 was eliminated because it had the
lowest standardized factorial load in the CFA. The same item also had the lowest factorial load in the
EFA. With its deletion, the fitness values of the model improved, and a final model with 15 items with
four factors was obtained. No other deletion significantly improved the fitness values. Besides the
deletion of item Tran 5, the AMOS software, based on the modification indices, suggested that two
covariances should be inserted between the error measures of the dimensions Infra 4 and Infra 3 and
Str 5 and Str 6. These covariances are acceptable, since they are between items within the same
factor. After these changes, the final results indicated a good fitness of the model.
In the Final Model the fitness values referring to the GFI and NFI improved, changing to 0.91
and 0.85, respectively. It can be seen that all indicators, with the exception of NFI, are within the
recommended values. According to Hair et al. (2005), the NFI is a comparison of the proposed model
with the null model and there is no value that indicates an acceptable level of fitness, though a widely
recommended value is 0.90. Additionally, in their study on the adoption of IS for the exchange of
instant messages, To, Liao, Chiang, Shih and Chang (2008) accepted the NFI indicator with a value of
0.85 as it was marginally acceptable. Therefore, in the present study the value of 0.85 was accepted
because it is very close to the recommended value.
The standardized factorial loads of the items varied from 0.614 to 0.755 for the dimension
Transformational, from 0.506 to 0.737 for the dimension Strategy, from 0.529 to 0.778 for the
dimension Transactional and from 0.531 to 0.762 for the dimension Informational. The t statistic
values, associated with each of the standardized factor loads, indicate the significance of each item.
According to Koufteros (1999), the t values are considered significant at the level of 0.05 and 0.01
when the values are higher than 2 or 2.576, respectively. The t values varied from 4.458 to 7.590,
showing that all items are significantly related with their factors.
With the purpose of verifying whether the four dimensions of benefits or first order factors are
really sub-dimensions of the broader and more general construct IT Business Value, Higher Order
Factorial Analysis, or Second Order Factorial Modeling was carried out. In the confirmatory factorial
analysis (CFA) the four constructs resulting from the Exploratory Factorial Analysis (EFA) were
validated, and only the exclusion of the item Tran 5 was necessary.
In order to execute the new Path Diagram that considered the hypothesis to be tested, the latent
dimension IT Business Value was included as an exogenous dimension. Hence, the first order factors
confirmed in the CFA became endogenous dimensions. In other words, the IT Business Value
influences the dimensions of the Transformational, Strategic, Transactional and Informational
benefits.
It is important to point out that the performance of the Second Order Factorial Model were
calculated as means of each construct of the first order instead of using the items of each factor, which
has the same statistical significance. It can be said that the factor IT Business Value will be a function
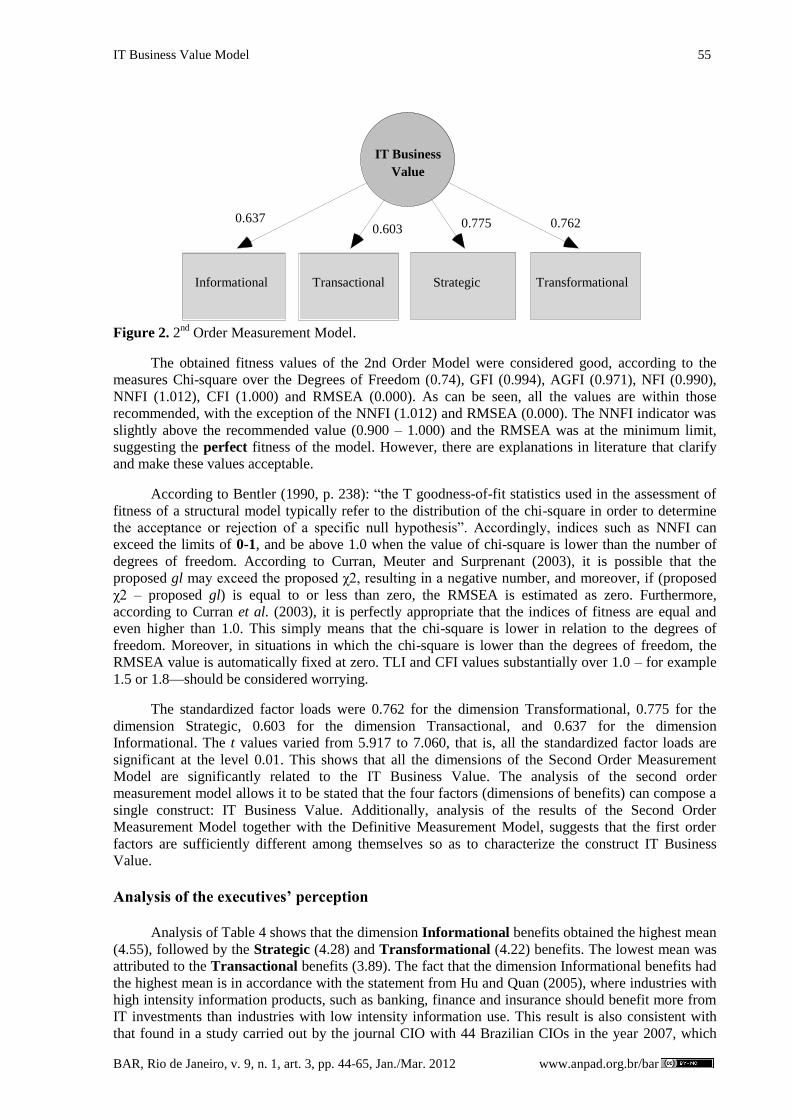
of the relationships of the first order factors. Figure 2 shows the Path Diagram for the Second Order
Model with the standardized factorial loads.
IT Business Value Model 55
BAR, Rio de Janeiro, v. 9, n. 1, art. 3, pp. 44-65, Jan./Mar. 2012 www.anpad.org.br/bar
Figure 2. 2
nd Order Measurement Model.
The obtained fitness values of the 2nd Order Model were considered good, according to the
measures Chi-square over the Degrees of Freedom (0.74), GFI (0.994), AGFI (0.971), NFI (0.990),
NNFI (1.012), CFI (1.000) and RMSEA (0.000). As can be seen, all the values are within those
recommended, with the exception of the NNFI (1.012) and RMSEA (0.000). The NNFI indicator was
slightly above the recommended value (0.900 – 1.000) and the RMSEA was at the minimum limit,
suggesting the perfect fitness of the model. However, there are explanations in literature that clarify
and make these values acceptable.
According to Bentler (1990, p. 238): ―the T goodness-of-fit statistics used in the assessment of
fitness of a structural model typically refer to the distribution of the chi-square in order to determine
the acceptance or rejection of a specific null hypothesis‖. Accordingly, indices such as NNFI can
exceed the limits of 0-1, and be above 1.0 when the value of chi-square is lower than the number of
degrees of freedom. According to Curran, Meuter and Surprenant (2003), it is possible that the
proposed gl may exceed the proposed χ2, resulting in a negative number, and moreover, if (proposed
χ2 – proposed gl) is equal to or less than zero, the RMSEA is estimated as zero. Furthermore,
according to Curran et al. (2003), it is perfectly appropriate that the indices of fitness are equal and
even higher than 1.0. This simply means that the chi-square is lower in relation to the degrees of
freedom. Moreover, in situations in which the chi-square is lower than the degrees of freedom, the
RMSEA value is automatically fixed at zero. TLI and CFI values substantially over 1.0 – for example
1.5 or 1.8—should be considered worrying.
The standardized factor loads were 0.762 for the dimension Transformational, 0.775 for the
dimension Strategic, 0.603 for the dimension Transactional, and 0.637 for the dimension
Informational. The t values varied from 5.917 to 7.060, that is, all the standardized factor loads are
significant at the level 0.01. This shows that all the dimensions of the Second Order Measurement
Model are significantly related to the IT Business Value. The analysis of the second order
measurement model allows it to be stated that the four factors (dimensions of benefits) can compose a
single construct: IT Business Value. Additionally, analysis of the results of the Second Order
Measurement Model together with the Definitive Measurement Model, suggests that the first order
factors are sufficiently different among themselves so as to characterize the construct IT Business
Value.
Analysis of the executives’ perception
Analysis of Table 4 shows that the dimension Informational benefits obtained the highest mean
(4.55), followed by the Strategic (4.28) and Transformational (4.22) benefits. The lowest mean was
attributed to the Transactional benefits (3.89). The fact that the dimension Informational benefits had
the highest mean is in accordance with the statement from Hu and Quan (2005), where industries with
high intensity information products, such as banking, finance and insurance should benefit more from
IT investments than industries with low intensity information use. This result is also consistent with
that found in a study carried out by the journal CIO with 44 Brazilian CIOs in the year 2007, which
IT Business
Value
Transformational Strategic Transactional Informational
0.762 0.637 0.603 0.775
A. C. G. Maçada, M. M. Beltrame, P. C. Dolci, J. L. Becker 56
BAR, Rio de Janeiro, v. 9, n. 1, art. 3, pp. 44-65, Jan./Mar. 2012 www.anpad.org.br/bar
indicated that the investment priorities are in Enterprise Resource Planning (ERP) and Business
Intelligence (BI) software. These investments are aimed at helping organizations manage the increase
in the flow and integration of information.
Table 4
Means of the Dimensions
Dimension Mean S.D.
Transformational 4.22 0.68
Strategic 4.28 0.59
Transactional 3.89 0.81
Informational 4.55 0.57
The fact that Transactional benefits had the lowest mean is also consistent with what was
proposed by Hu and Quan (2005), that financial service organizations, being the first to believe in the
operational and strategic benefits of IT, are today the biggest users of IT and operate in an
information-intensive activity where heavy investments in IT are required to maintain the business.
Below, there follows a detailed analysis of the results obtained in each dimension.
The Transformational dimension obtained the third highest mean (Table 4). The items
Transf_4. Improving business models and Infra_2. Improving business flexibility have higher
means than the construct (4.40 and 4.24, respectively). The item Transf_2. Developing new business
plans obtained a mean of (4.22), equal to that of the construct and the item Trans_1. Better skills
level of the employees had the lowest mean, as shown in Table 5.
Table 5
Means of the Items in the Transformational Dimension
Items Mean S.D.
Infra_2. Improving business flexibility 4,24 0,87
Transf_1. Na improved skill level for employess 3,99 0,89
Transf_2. Developing new business plans 4,22 0,95
Transf_4. Improving business models 4,40 0,76
Dimension 4,22 0,68
The improvement in the business model, like the flexibility, may refer primarily to the
increasing use of tools offered by IT. In the case of banks, the Internet Banking tool is increasingly
exploited. According to Yiu, Grant and Edgar (2007), its use allows the banks to think and operate in
new geographical zones with new markets and product scope. New charges/rates generated through
new and better services, like advertising, payments, reminders, notifications and customized
information are attractive to modern banks. These activities provide value to the client and
opportunities for the banks to improve their revenue and ensure the loyalty of clients, through
management of the relationships.
For the securities brokers, the IT tool that is altering and making their business models more
flexible is the use of Home Broker. This can be seen in the increase in the deals completed using this
tool, passing from R$39 billion in the whole year of 2006 to R$72 billion (R$6 billion per month) in
the year 2007 (Bolsa de Valores de São Paulo [Bovespa], 2007). With regards to the insurance
companies, a study carried out by FENASEG with 27 insurance companies in the year 2006 showed
IT Business Value Model 57
BAR, Rio de Janeiro, v. 9, n. 1, art. 3, pp. 44-65, Jan./Mar. 2012 www.anpad.org.br/bar
that the main change provided by IT is improved operational efficiency regarding the processing of
subscriptions, claim reports and policies, risk management and product distribution, as well as
facilitating cooperation with other companies and economic agents.
Table 6 shows the results for the Strategic dimension, which obtained the second highest mean
(4.28). The items Str_6. Providing better products or services to costumers (4.47) and Inf_3.
Improving information for strategic planning (4.46) had higher means than the construct. While the
items Str 5. Improving costumer relations (4.20) and Str_3. Establishing useful links with other
organizations (4.00) had lower means than the dimension.
Table 6
Means of the Items in the Strategic Dimension
Items Mean S.D.
Est_3. Establishing useful links with other organizations 4,00 0,92
Est_5. Improving costumers relations 4,20 0,84
Est_6. Providing better products or services to costumers 4,47 0,68
Inf_3. Improving information for strategic planing 4,46 0,71
Dimension 4,28 0,59
Many of the managers agreed that IT provides better products or services for their clients.
Additionally, according to Love, Irani, Standing, Lin and Burn (2005) in a study with small and
medium Australian enterprises from various sectors, the strategic benefit ―better relationships with
clients and other organizations‖ (p. 954) was considered the second most important in a list of nine.
This result adds weight to the argument that ―better relationships with the clients‖ (p. 954) and
―establishment of relationships with other organizations‖ (p. 954) are strategic benefits provided by
IT.
According to Maçada and Becker (2001), in their study on the impact of IT investments on
strategic dimensions and the efficiency of Brazilian banks, IT is the main strategic resource used by
the banks in the search for competitive advantages. These advantages are seen in strategic dimensions
such as competitiveness, products and services, and prices, among others. Advances in IT allow
financial service supply organizations to innovate their services and improve delivery to clients by
means of automation (Krishnan, Ramaswamy, Meyer, & Damien, 1999). The benefit Inf_3. Improving
information for strategic planning, in the view of the managers, is more closely associated with the
strategic benefits than the informational benefits. Perhaps the managers understand that whatever
factor that contributes towards better Strategic Planning is considered a strategic benefit.
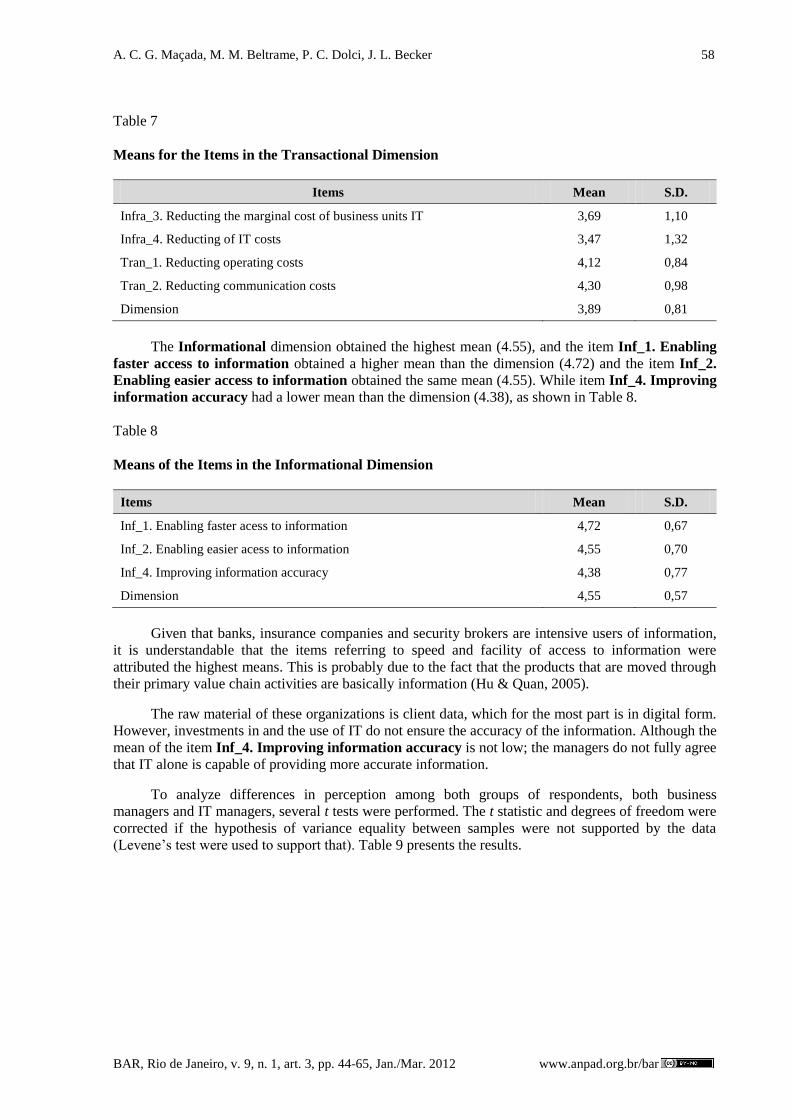
Table 7 shows the results obtained for the Transactional dimension, which obtained a mean
equal to 3.89, the lowest among all the dimensions. The items Tran_2. Reducing communication
costs (4.30) and Tran_1. Reducing operating costs (4.12) have higher means than the construct.
Means lower than the construct were attributed to the items Infra_3. Reducing the marginal IT cost
of business units (3.69) and Infra_4. Reduction of IT costs (3.47). It can be noted that IT offers a
reduction in operational and communication costs to IIO. According to Yiu et al. (2007), besides
benefits like sustainable competitive advantage and new markets, IT helps banks reduce their
operational and administrative costs. This was previously highlighted by Zhu (2004), who argued that
complementarities between the IT infrastructure and the IT potentialities, expressed through electronic
business, contribute towards the performance of organizations in terms of sales per employee, stock
turnover and operational cost reduction. Although the tools Home Banking and Home Broker are,
strictly speaking, not electronic commerce/business, they are quite similar, explaining to some degree
why the cost reduction benefits offered by the IT infrastructure are grouped with the transactional
benefits. For the respondents, the transactional benefits are associated with cost reduction.
A. C. G. Maçada, M. M. Beltrame, P. C. Dolci, J. L. Becker 58
BAR, Rio de Janeiro, v. 9, n. 1, art. 3, pp. 44-65, Jan./Mar. 2012 www.anpad.org.br/bar
Table 7
Means for the Items in the Transactional Dimension
Items Mean S.D.
Infra_3. Reducting the marginal cost of business units IT 3,69 1,10
Infra_4. Reducting of IT costs 3,47 1,32
Tran_1. Reducting operating costs 4,12 0,84
Tran_2. Reducting communication costs 4,30 0,98
Dimension 3,89 0,81
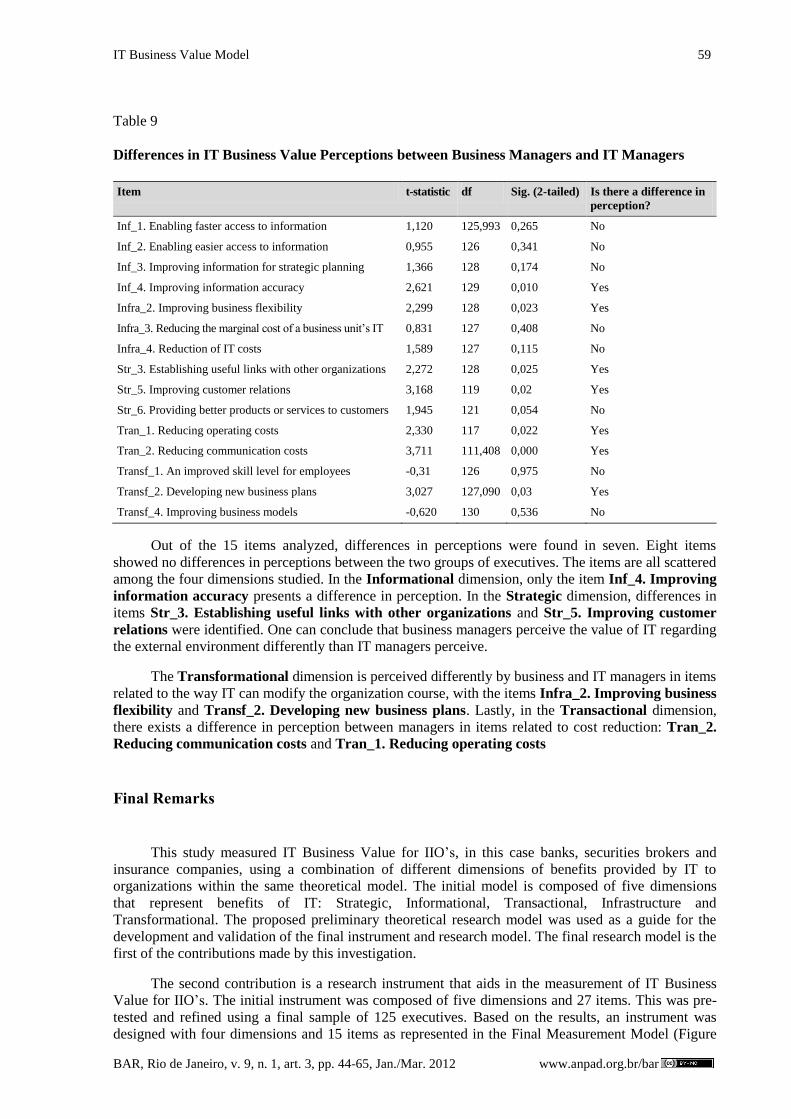
The Informational dimension obtained the highest mean (4.55), and the item Inf_1. Enabling
faster access to information obtained a higher mean than the dimension (4.72) and the item Inf_2.
Enabling easier access to information obtained the same mean (4.55). While item Inf_4. Improving
information accuracy had a lower mean than the dimension (4.38), as shown in Table 8.
Table 8
Means of the Items in the Informational Dimension
Items Mean S.D.
Inf_1. Enabling faster acess to information 4,72 0,67
Inf_2. Enabling easier acess to information 4,55 0,70
Inf_4. Improving information accuracy 4,38 0,77
Dimension 4,55 0,57
Given that banks, insurance companies and security brokers are intensive users of information,
it is understandable that the items referring to speed and facility of access to information were
attributed the highest means. This is probably due to the fact that the products that are moved through
their primary value chain activities are basically information (Hu & Quan, 2005).
The raw material of these organizations is client data, which for the most part is in digital form.
However, investments in and the use of IT do not ensure the accuracy of the information. Although the
mean of the item Inf_4. Improving information accuracy is not low; the managers do not fully agree
that IT alone is capable of providing more accurate information.
To analyze differences in perception among both groups of respondents, both business
managers and IT managers, several t tests were performed. The t statistic and degrees of freedom were
corrected if the hypothesis of variance equality between samples were not supported by the data
(Levene’s test were used to support that). Table 9 presents the results.
IT Business Value Model 59
BAR, Rio de Janeiro, v. 9, n. 1, art. 3, pp. 44-65, Jan./Mar. 2012 www.anpad.org.br/bar
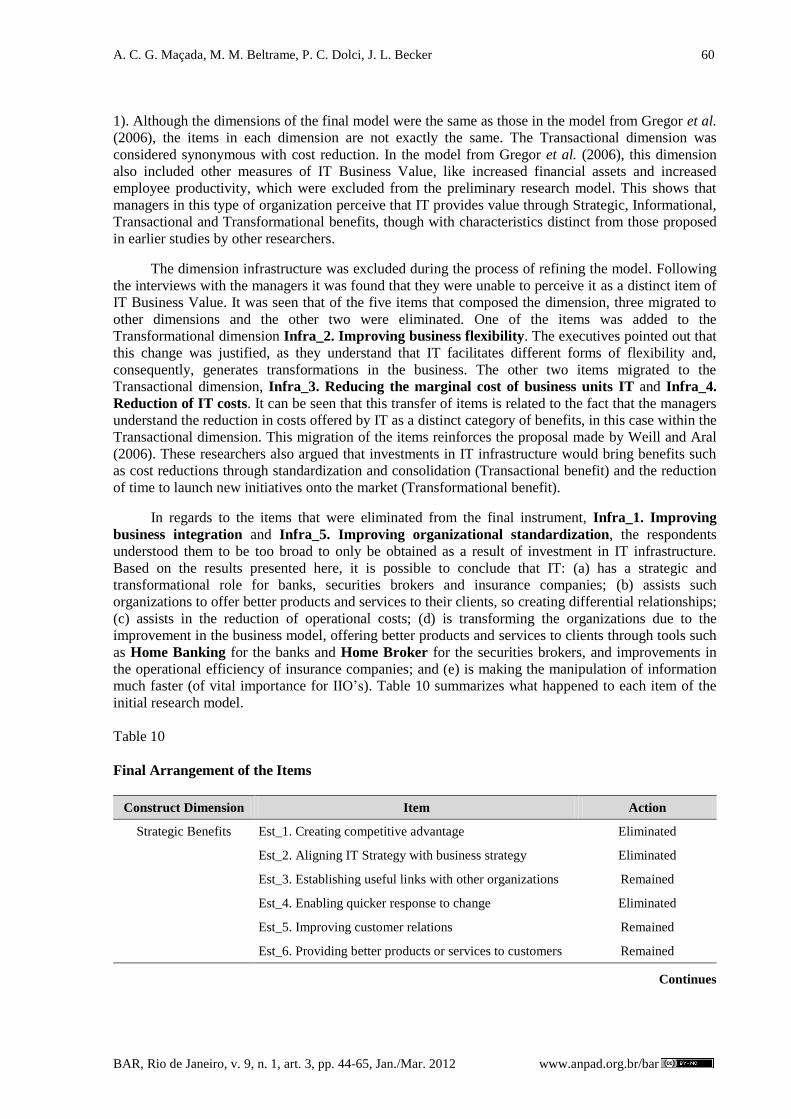
Table 9
Differences in IT Business Value Perceptions between Business Managers and IT Managers
Item t-statistic df Sig. (2-tailed) Is there a difference in
perception?
Inf_1. Enabling faster access to information 1,120 125,993 0,265 No
Inf_2. Enabling easier access to information 0,955 126 0,341 No
Inf_3. Improving information for strategic planning 1,366 128 0,174 No
Inf_4. Improving information accuracy 2,621 129 0,010 Yes
Infra_2. Improving business flexibility 2,299 128 0,023 Yes
Infra_3. Reducing the marginal cost of a business unit’s IT 0,831 127 0,408 No
Infra_4. Reduction of IT costs 1,589 127 0,115 No
Str_3. Establishing useful links with other organizations 2,272 128 0,025 Yes
Str_5. Improving customer relations 3,168 119 0,02 Yes
Str_6. Providing better products or services to customers 1,945 121 0,054 No
Tran_1. Reducing operating costs 2,330 117 0,022 Yes
Tran_2. Reducing communication costs 3,711 111,408 0,000 Yes
Transf_1. An improved skill level for employees -0,31 126 0,975 No
Transf_2. Developing new business plans 3,027 127,090 0,03 Yes
Transf_4. Improving business models -0,620 130 0,536 No
Out of the 15 items analyzed, differences in perceptions were found in seven. Eight items
showed no differences in perceptions between the two groups of executives. The items are all scattered
among the four dimensions studied. In the Informational dimension, only the item Inf_4. Improving
information accuracy presents a difference in perception. In the Strategic dimension, differences in
items Str_3. Establishing useful links with other organizations and Str_5. Improving customer
relations were identified. One can conclude that business managers perceive the value of IT regarding
the external environment differently than IT managers perceive.
The Transformational dimension is perceived differently by business and IT managers in items
related to the way IT can modify the organization course, with the items Infra_2. Improving business
flexibility and Transf_2. Developing new business plans. Lastly, in the Transactional dimension,
there exists a difference in perception between managers in items related to cost reduction: Tran_2.
Reducing communication costs and Tran_1. Reducing operating costs
Final Remarks
This study measured IT Business Value for IIO’s, in this case banks, securities brokers and
insurance companies, using a combination of different dimensions of benefits provided by IT to
organizations within the same theoretical model. The initial model is composed of five dimensions
that represent benefits of IT: Strategic, Informational, Transactional, Infrastructure and
Transformational. The proposed preliminary theoretical research model was used as a guide for the
development and validation of the final instrument and research model. The final research model is the
first of the contributions made by this investigation.
The second contribution is a research instrument that aids in the measurement of IT Business
Value for IIO’s. The initial instrument was composed of five dimensions and 27 items. This was pre-
tested and refined using a final sample of 125 executives. Based on the results, an instrument was
designed with four dimensions and 15 items as represented in the Final Measurement Model (Figure
A. C. G. Maçada, M. M. Beltrame, P. C. Dolci, J. L. Becker 60
BAR, Rio de Janeiro, v. 9, n. 1, art. 3, pp. 44-65, Jan./Mar. 2012 www.anpad.org.br/bar
1). Although the dimensions of the final model were the same as those in the model from Gregor et al.
(2006), the items in each dimension are not exactly the same. The Transactional dimension was
considered synonymous with cost reduction. In the model from Gregor et al. (2006), this dimension
also included other measures of IT Business Value, like increased financial assets and increased
employee productivity, which were excluded from the preliminary research model. This shows that
managers in this type of organization perceive that IT provides value through Strategic, Informational,
Transactional and Transformational benefits, though with characteristics distinct from those proposed
in earlier studies by other researchers.
The dimension infrastructure was excluded during the process of refining the model. Following
the interviews with the managers it was found that they were unable to perceive it as a distinct item of
IT Business Value. It was seen that of the five items that composed the dimension, three migrated to
other dimensions and the other two were eliminated. One of the items was added to the
Transformational dimension Infra_2. Improving business flexibility. The executives pointed out that
this change was justified, as they understand that IT facilitates different forms of flexibility and,
consequently, generates transformations in the business. The other two items migrated to the
Transactional dimension, Infra_3. Reducing the marginal cost of business units IT and Infra_4.
Reduction of IT costs. It can be seen that this transfer of items is related to the fact that the managers
understand the reduction in costs offered by IT as a distinct category of benefits, in this case within the
Transactional dimension. This migration of the items reinforces the proposal made by Weill and Aral
(2006). These researchers also argued that investments in IT infrastructure would bring benefits such
as cost reductions through standardization and consolidation (Transactional benefit) and the reduction
of time to launch new initiatives onto the market (Transformational benefit).
In regards to the items that were eliminated from the final instrument, Infra_1. Improving
business integration and Infra_5. Improving organizational standardization, the respondents
understood them to be too broad to only be obtained as a result of investment in IT infrastructure.
Based on the results presented here, it is possible to conclude that IT: (a) has a strategic and
transformational role for banks, securities brokers and insurance companies; (b) assists such
organizations to offer better products and services to their clients, so creating differential relationships;
(c) assists in the reduction of operational costs; (d) is transforming the organizations due to the
improvement in the business model, offering better products and services to clients through tools such
as Home Banking for the banks and Home Broker for the securities brokers, and improvements in
the operational efficiency of insurance companies; and (e) is making the manipulation of information
much faster (of vital importance for IIO’s). Table 10 summarizes what happened to each item of the
initial research model.
Table 10
Final Arrangement of the Items
Construct Dimension Item Action
Strategic Benefits Est_1. Creating competitive advantage Eliminated
Est_2. Aligning IT Strategy with business strategy Eliminated
Est_3. Establishing useful links with other organizations Remained
Est_4. Enabling quicker response to change Eliminated
Est_5. Improving customer relations Remained
Est_6. Providing better products or services to customers Remained
Continues
IT Business Value Model 61
BAR, Rio de Janeiro, v. 9, n. 1, art. 3, pp. 44-65, Jan./Mar. 2012 www.anpad.org.br/bar
Table 10 (continued)
Construct Dimension Item Action
Informational Benefits Inf_1. Enabling faster access to information Remained
Inf_2. Enabling easier access to information Remained
Inf_3. Improving information for strategic planning Moved to Strategic
Inf_4. Improving information accuracy Remained
Inf_5. Providing information in different formats Eliminated
Transactional Benefits Tran_1. Reducing operating costs Remained
Tran_2. Reducing communication costs Remained
Tran_3. Avoiding the need to increase the workforce Eliminated
Tran_4. Increasing return on financial assets Eliminated
Tran_5. Enhancing employee productivity Eliminated
Tran_6. Savings in Supply Chain Management Eliminated
Infrastructure Benefits Infra_1. Improving business integration Eliminated
Infra_2. Improving business flexibility Moved to Transformational
Infra_3. Reducing the marginal cost of business unit’s IT Moved to Transactional
Infra_4. Reduction of IT costs Moved to Transactional
Infra_5. Improving organizational standardization Eliminated
Transformational
Benefits
Transf_1. An improved skill level for employees Remained
Transf_2. Developing new business plans Remained
Transf_3. Expanding organizational capabilities Eliminated
Transf_4. Improving business models Remained
Transf_5. Improving organizational structure and process Eliminated
As can be seen in Table 10, the infrastructure dimension was eliminated from the model
originally proposed. It is observed that financial institutions in Brazil are the segment that invest more
in IT, led by banks (TI Inside, 2009). Thus, the executives of these companies do not realize the
benefits of infrastructure, because it can be assumed that this dimension is already consolidated in
such a company. This resulted in the perceived benefits of this dimension being eliminated or moved
to other dimensions, such as transformational and transactional.
In terms of managerial practice, the main contribution of this study is to demonstrate that IT can
deliver value to the business. This value can be perceived in such benefits as transforming the
organization, improving its products and relationships, and reducing costs. According to Tallon (2007)
IT business value is highest in firms with a multi-focused business strategy and lowest in those with a
single focus. Also, it offers executives an instrument that is of use in the process of justifying and
managing IT investments based on the value that they provide to the business. Considering that the
volume of investments in IT have increased annually and that, in Brazil, the financial sector is the
biggest investor, around 20% of the total expenditure (Setor financeiro, 2007), understanding that IT
can offer different types of benefits is of use in justifying such expenditures.
One of the limitations of this study needs to be addressed, namely that the variables used in the
analysis do not follow a Normal multivariate distribution. The literature suggests larger samples than
that used in this study to perform the analysis in the absence of the Normal distribution assumption.
A. C. G. Maçada, M. M. Beltrame, P. C. Dolci, J. L. Becker 62
BAR, Rio de Janeiro, v. 9, n. 1, art. 3, pp. 44-65, Jan./Mar. 2012 www.anpad.org.br/bar
Received 11 December 2009; received in revised form 21 September 2010.
Acknowledgements
We acknowledge financial support from Capes and CNPq.
References
Albertin, A. L. (2001). Valor estratégico dos projetos de tecnologia de informação. Revista de
Administração de Empresas, 41(3), 42-50.
Aral, S., & Weill, P. (2007). IT assets, organizational capabilities, and firm performance: how resource
allocations and organizational differences explain performance variation. Organization Science,
18(5), 763-780. doi: 10.1287/orsc.1070.0306
Avison, D. (2007, December). The status of the discipline of information systems. Proceedings of the
International Conference on Information Systems, Montreal, Quebec, Canada, 28. Retrieved
November 20, 2009, from
http://aisel.aisnet.org/cgi/viewcontent.cgi?article=1241&context=icis2007
Bentler, P. M. (1990). Comparative fit indexes in structural models. Psychological Bulletin, 107(2),
238-246. doi: 10.1037/0033-2909.107.2.238
Bharadwaj, A. (2000). A resource-based perspective on information technology capability and firm
performance: an empirical investigation. MIS Quarterly, 24(1), 169-196. doi: 10.2307/3250983.
Bolsa de Valores de São Paulo. (2007, janeiro 4). Bovespa encerra 2006 com destaques em
pontuação, volume, número de negócios, valor de mercado, Home Broker e ingresso de novas
empresas. Retrieved October 10, 2009, from
http://www.acionista.com.br/bovespa/040107_balanco_2006.htm
Brynjolfsson, E., & Hitt, L. (1996). Productivity, business profitability, and consumer surplus: three
different measures of information technology value. MIS Quarterly, 20(2), 121-142. doi:
10.2307/249475
Cao, G. (2010). A four-dimensional view of IT business value. Research and Behavioral Science,
27(3), 267-284. doi: 10.1002/sres.1015
Cha, K. J., Gregor, S., & Fernandez, W. (2008, December). Towards a deeper understanding of it-
enabled transformation. Proceedings of the Australasian Conference on Information Systems, Christchurch, Canterbury, New Zeland, 19. Retrieved October, 29, 2009, from
http://aisel.aisnet.org/acis2008/71
Chatterjee, D., Pacini, C., & Sambamurthy, V. (2002). The shareholder wealth and trading volume
effect of it infrastructure investments. Journal of Management Information Systems, 19(2), 7-43.
Chuang, S. (2004). A resource-based perspective on knowledge management capability and
competitive advantage: an empirical investigation. Expert Systems with Applications, 27(3),
459-465. doi: 10.1016/j.eswa.2004.05.008
Crane, D. B., & Bodie, Z. (1996). Form follows function: the transformation of banking. Harvard
Business Review, 74(2), 109-117.
IT Business Value Model 63
BAR, Rio de Janeiro, v. 9, n. 1, art. 3, pp. 44-65, Jan./Mar. 2012 www.anpad.org.br/bar
Curran, J. M., Meuter, M. L., & Surprenant, C. F. (2003). Intentions to use self-service technologies: a
confluence of multiple attitudes. Journal of Service Research, 5(3), 209-224. doi:
10.1177/1094670502238916
Dedrick, J., Gurbaxani, V., & Kraemer, K. L. (2003). Information technology and economic
performance: a critical review of the empirical evidence. ACM Computing Surveys, 35(1), 1-28.
doi: 10.1145/641865.641866
Dehning, B., Richardson, V. J., & Zmud, R. W. (2003). The value relevance of announcements of
transformational information technology investments. MIS Quarterly, 27(4), 637-656.
Dehning, B., Richardson, V. J., & Zmud, R. W. (2007). The financial performance effects of it-based
supply chain management systems in manufacturing firms. Journal of Operations Management,
25(4), 806-824. doi: 10.1016/j.jom.2006.09.001
Fornell, C., & Larcker, D. F. (1981). Evaluating structural equations models with unobservable
dimensions and measurement error. Journal of Marketing, 18(1), 39-50.
Freedman, R. (2003). Helping clients value IT investments. Consulting to Management, 14(3), 33-39.
Garver, M. S., & Mentzer, J. T. (1999). Logistics research methods: employing structural equation
modeling to test for construct validity. Journal of Business Logistics, 20(1), 33-57.
Glazer, R. (1991). Marketing in an information intensive environment: strategic implications of
knowledge as an asset. Journal of Marketing, 55(4), 1-19.
Gregor, S., Martin, M., Fernandez, W., Stern, S., & Vitale, M. (2006). The transformational dimension
in the realization of business value from information technology. The Journal of Strategic
Information Systems, 15(3), 249-270. doi: 10.1016/j.jsis.2006.04.001
Hair, J. F., Anderson, R. E., Tatham, R. L., & Black, W. C. (2005). Análise multivariada de dados.
Porto Alegre: Bookman.
Hu, Q., & Quan, J. J. (2005). Evaluating the impact of IT investments on productivity: a causal
analysis at industry level. International Journal of Information Management, 25(1), 39-53. doi:
10.1016/j.ijinfomgt.2004.10.006
Koufteros, X. A. (1999). Testing a model of pull production: a paradigm for manufacturing research
using structural equation modeling. Journal of Operations Management, 17(4), 467-488. doi:
10.1016/S0272-6963(99)00002-9
Krishnan, M. S., Ramaswamy, V., Meyer, M. C., & Damien, P. (1999). Customer satisfaction for
financial services: the role of products, services, and information technology. Management
Science, 45(9), 1194-1209. doi: 10.1287/mnsc.45.9.1194
Lin, W. T. (2009). The business value of information technology as measured by technical efficiency:
evidence from country-level data. Decision Support Systems, 46(4), 865-874. doi:
10.1016/j.dss.2008.11.017
Love, P., Irani, Z., Standing, C., Lin, C., & Burn, J. (2005). The enigma of evaluation: benefits, costs
and risks of IT in Australian small-medium-sized enterprises. Information & Management,
42(7), 947-964. doi: 10.1016/j.im.2004.10.004
Loveman, G. (1994). An Assessment of the productivity impact of information technologies. In T. J.
Allen & M. S. S. Morton (Eds.), Information Technology and The Corporation of the 1990s:
Research Studies (pp. 84-110). Cambridge: Oxford University Press.
A. C. G. Maçada, M. M. Beltrame, P. C. Dolci, J. L. Becker 64
BAR, Rio de Janeiro, v. 9, n. 1, art. 3, pp. 44-65, Jan./Mar. 2012 www.anpad.org.br/bar
Lucas, H. C., Jr. (2005). Information technology: strategic decision making for managers. Hoboken:
John Wiley & Sons Inc.
Maçada, A. C. G., & Becker, J. L. (2001). O impacto da tecnologia de informação na estratégia dos
bancos. Revista de Administração de Empresas, 41(4), 87-97.
McKenney, J., & McFarlan, F. W. (1982). The information archipelago - maps and bridges. Harvard
Business Review, 60(5), 109-119.
Melville, N., Gurbaxani, V., & Kraemer, K. (2007). The productivity impact of information
technology across competitive regimes: the role of industry concentration and dynamism.
Decision Support Systems, 43(1), 229-242. doi: 10.1016/j.dss.2006.09.009
Melville, N., Kraemer, K., & Gurbaxani, V. (2004). Review: information technology and
organizational performance: an integrative model of IT business value. MIS Quarterly, 28(2),
283-322.
Mirani, R., & Lederer, A. L. (1998). An instrument for assessing the organizational benefits of IS
projects. Decision Science, 29(4), 803-838. doi: 10.1111/j.1540-5915.1998.tb00878.x
Mittal, N., & Nault, B. R. (2009). Investments in information technology: indirect effects and
information technology intensity. Information Systems Research, 20(1), 140-154. doi:
10.1287/isre.1080.0186
Mooney, J. G., Gurbaxani, V., & Kraemer, K. L. (1996). A process oriented framework for assessing
the business value of information technology. The DATA BASE for Advances in Information
Systems, 27(2), 69-81. doi: 10.1145/243350.243363
Neirotti, P., & Paolucci, E. (2007). Assessing the strategic value of information technology: an
analysis on the insurance sector. Information & Management, 44(6), 568-582.
doi:10.1016/j.im.2007.05.005
Oh, W., & Pinsonneault, A. (2007). On the assesment of the strategic value of information
technologies: conceptual and analytical approaches. MIS Quarterly, 31(2), 239-265.
Phang C. W., Kankanhalli, A., & Ang, C. (2008). Investigating organizational learning in
eGovernment projects: a multi-theoretic approach source. The Journal of Strategic Information
Systems, 17(2), 99-123. doi: 10.1016/j.jsis.2007.12.006
Pinsonneault, A., & Kraemer, K. L. (1993). Survey research in management information systems.
Journal of Management Information Systems, 10(2), 75-105.
Powell, E. T., & Hermann, C. (2000). Collecting evaluation data. Retrieved August 18, 2009, from
http://learningstore.uwex.edu/pdf/G3658-10.pdf
Radhakrishnan, A., Zu, X., & Grover, V. (2008). A process-oriented perspective on differential
business value creation by information technology: an empirical investigation. Omega, 36(6),
1105-1125. doi: 10.1016/j.omega.2006.06.003
Scheepers, H., & Scheepers, R. (2008). A process-focused decision framework for analyzing the
business value potential of IT investments. Information Systems Frontiers, 10(3), 321-330. doi:
10.1007/s10796-008-9076-5
Setor financeiro aumenta em 14% seus investimentos com tecnologia no Brasil. (2007, May 23). Fator
Brasil. Retrieved September 18, 2009, from
http://www.revistafatorbrasil.com.br/ver_noticia.php?not=10740
IT Business Value Model 65
BAR, Rio de Janeiro, v. 9, n. 1, art. 3, pp. 44-65, Jan./Mar. 2012 www.anpad.org.br/bar
Shang, S., & Seddon, P. B. (2002). Assessing and managing the benefits of enterprise systems: the
business manager's perspective. Information Systems Journal, 12(4), 271-299.
doi: 10.1046/j.1365-2575.2002.00132.x
Sobol, M. G., & Klein, G. (2009). Relation of CIO background, IT infrastructure, and economic
performance. Information and Management, 46(5), 271-278. doi: 10.1016/j.im.2009.05.001
Strassmann, P. (2004). Six rules for finding IT value. Cutter IT Journal, 17(8), 5-9.
Tallon, P. (2007). Does IT pay to focus? An analysis of IT business value under single and multi-
focused business strategies. The Journal of Strategic Information Systems, 16(3), 278-300. doi:
10.1016/j.jsis.2007.04.001
Tallon, P. P., Kraemer, K. L., & Gurbaxani, V. (2001). Executives’ perceptions of the business value
of information technology: a process-oriented approach [Working Paper nº #ITR-148].
University of California, Irvine, CA, USA.
TI Inside (2009). Bancos devem aumentar orçamento de TI em 2010. Retrieved August 29, 2010, from
http://www.tiinside.com.br/News.aspx?ID=153395&C=265
To, P.-L., Liao, C., Chiang, J. C., Shih, M.-L., & Chang, C.-Y. (2008). An empirical investigation of
the factors affecting the adoption of instant messaging in organizations. Computer Standards &
Interfaces, 30(3), 148-156. doi: 10.1016/j.csi.2007.08.019
Turner, J., & Lucas, H. (1985). Developing strategic information systems. In W. Guth (Ed.),
Handbook of business strategy (pp. 1-35). Boston: Warren, Gorham and Lamont.
Ullman, J. (2000). Structural equation modeling. In B. Tabachnick & L. Fidell (Eds.), Using
multivariate statistics (pp. 653-771). Boston: Allyn & Bacon.
Venkatraman, N. (1994). IT-enabled business transformation: from automation to business scope
redefinition. Sloan Management Review, 35(2), 73-87.
Weill, P. (1992). The relationship between investment in information technology and firm
performance: a study of the valve manufacturing sector. Information Systems Research, 3(4),
307-333. doi: 10.1287/isre.3.4.307
Weill, P., & Aral, S. (2006). Generating premium returns on your IT investments. MIT Sloan
Management Review, 47(2), 39-48.
Weill, P., & Broadbent, M. (1998). Leveraging the new infrastructure: how market leaders capitalize
on IT. Boston: Harvard Business School Press.
Weill, P., & Broadbent, M. (2000). Managing IT infrastructure: a strategic choice. In R. Zmud (Ed.),
Framing the domains of it management (pp. 329-353). Cincinnati, OH: Pinnaflex Educational
Resources, Inc.
Yiu, C. S., Grant, K., & Edgar, D. (2007). Factors affecting the adoption of internet banking in Hong
Kong – implications for the banking sector. International Journal of Information Management,
27(5), 336-351. doi: 10.1016/j.ijinfomgt.2007.03.002
Zhu, K. (2004). The complementarity of information technology infrastructure and e-commerce
capability: a resource-based assessment of their business value. Journal of Management
Information Systems, 21(1), 167-202.
Zwicker, R., Souza, C. A., Vidal, A. G. R., & Siqueira, J. O. (2007). Grau de informatização de
empresas: um modelo estrutural aplicado ao setor industrial do estado de São Paulo. RAE
Electronica, 6(2). Retrieved from http://www.scielo.br/pdf/raeel/v6n2/v6n2a04.pdf. doi:
10.1590/S1676-56482007000200004