Embed Size (px)
Citation preview

ADRON Anne van Dijk Rijst Onderzoekscentrum Nickerie
Rapport no. 12
RICE RESEARCHPapers and summaries
September 1996 - March 2001
Ir. Jeroen WildschutARCADIS Euroconsult
Jerry R Tjoe Awie MSc.ADRON
M R Khodabaks MSc.ADRON
I Baumgart MSc.ADRON
Ir. Kardie kartosoewitoADRON
Stichting Nationaal Rijstonderzoeks Instituut (SNRI)(Foundation for Rice Research in Suriname)
April 2001

RICE RESEARCH papers and summariesSeptember 1996 - March 2001 Report nr 12
CONTENTS
1 Main Factors Determining Yield Differences between Farmers’ Fields in the NickerieDistrict . . . . . . . . . . . . . . . . . . . . . . . . . . . . . . . . . . . . . . . . . . . . . . . . . . . . . . . . . . . . . . . . . . . . . . 11.0 Abstract1.1 Introduction1.2 Methods1.3 Results and discussion1.4 Conclusions
2 Research on nitrogen fertilisation in the Nickerie rice polders . . . . . . . . . . . . . . . . . . . . . 92.1 Introduction2.2 Findings of earlier research (1954 - 1994)2.3 Actual farmers’ practices2.4 Recent results (1996 - 1999)2.5 Discussion and conclusions
references
3 Research on phosphate fertilization in the Nickerie rice polders, Suriname . . . . . . . . 163.1 Introduction3.2 Findings of earlier research (1954 - 1992)3.3 Actual farmers’ practices3.4 Recent results (1996 - 1999)3.5 Discussion and conclusions
references
4 Summary of results of trials with red (weedy) rice . . . . . . . . . . . . . . . . . . . . . . . . . . . . . . . 224.2 Introduction4.2 Results4.3 Conclusions
5 Summary Minimum Tillage . . . . . . . . . . . . . . . . . . . . . . . . . . . . . . . . . . . . . . . . . . . . . . . . . . . 245.1 Introduction5.2 Minimum Tillage trials5.3 Results and recommendations
6 Paddy Production Analyses through conceptual models . . . . . . . . . . . . . . . . . . . . . . . . . 286.1 Introduction6.2 Increasing Profitability6.3 Increasing Yields6.4 Increasing Quality
7 IPM Oriented Research at ADRON . . . . . . . . . . . . . . . . . . . . . . . . . . . . . . . . . . . . . . . . . . . . . 327.1 Introduction

7.2 Results from earlier research7.3 Farmers’ perceptions and pesticide application behaviour7.4 IPM-trials7.5 Future IPM Research
Literature
8 Summary IPM Strategy development . . . . . . . . . . . . . . . . . . . . . . . . . . . . . . . . . . . . . . . 39
9 The role of a 100-days variety versus the current 120-day variety Eloni . . . . . . . . . . . . 409.1 Introduction9.2 ADRON-1029.3 Profitability9.4 Conclusions and recommendations
10 Weed control in field ditches and irrigation- and drainage canals . . . . . . . . . . . . . . . . . 43

Paper presented at the International Symposium on Mechanised Rice Production and 1
Marketing, 13-16 September 1999, Georgetown, Guyana
Agronomist at the ‘Anne van Dijk’ Rice Research Centre Nickerie (ADRON), Suriname2
Plant Breeder at the ‘Anne van Dijk’ Rice Research Centre Nickerie (ADRON), Suriname 3
1
1 Main Factors Determining Yield Differences between Farmers’ Fields in theNickerie District1
Jeroen Wildschut and Jerry R. Tjoe-Awie2 3
ABSTRACT
The results of a crop production survey, which was conducted in 1996 and 1997 by the‘Anne van Dijk’ Rice Research Centre Nickerie (ADRON) showed that the variation inyields across the farmers’ fields in the Nickerie district is very high. The average yieldof the 30% least productive fields was 2.4 ton/ha whereas an average yield of 5.5ton/ha was reached by 30% of the highest yielding fields. This variation in yieldsindicates the possibility that with an optimal application of current cultural practicesand varieties the average yield could increase from the actual 4.0 ton/ha up to 5.5ton/ha.Soil tillage is intensive and costs are high, indicating that research on minimum tillagecould be beneficial.The sowing period lasts for 12 weeks. The last plantings and the first harvests areonly one month apart. The timing of the cultural practices relative to the date of sowingis highly dispersed as well. Relatively late sown fields (more than 6-7 weeks after thefirst field) yield clearly less. Thus, new varieties which mature earlier (in ± 100 days)could be a solution for 30-40% of the fields.Due to a poor wet infrastructure, the optimal water management scheme for varieties,which mature in 125 days cannot be realised on most of the fields.Red rice (Oryza sativa) is the most widely spread and economically important weed.Approximately every 1% of red rice reduces the yield with 6 %. In importance it isfollowed by Maraina grass (Ischaemum rugosum).Chronologically, the most frequent pests are: water weevils (Lissorhoptrusfoveolatus), bibit fly (Hydrellia sp.), stemborer (Rupela albinella) and seed bugs(Oebalus poecilus). The order of economical interest is not clear.Fungus diseases (Helminthosporium oryzae, Pyricularia oryzae, Cercospora oryzaeand Rhizoctonia solani) are rarely of economical interest.Analyses showed that apart from nitrogen and phosphate, the soils in Nickerie are veryfertile and homogeneous. Urea is used by all farmers, but efficiency could beimproved. Phosphate fertilisers are rarely used.A conceptual model for increasing the average yield with agronomic measures wasconstructed from which the order of priority of urgent research topics, to beaddressed to with On-Farm and On-Station experiments, was depicted.

2
1.1 INTRODUCTION
Suriname has some 50,000 ha of wet rice, most of it in the Nickerie district. Significantproduction also exist in the districts of Coronie and Saramacca and upland rice is grown atscattered locations inland, in a shifting cultivation system.From 1950 up to 1980, a highly mechanised and efficient rice production system was built upthrough research on high yielding varieties at the Foundation for the Development ofMechanised Agriculture in Suriname (SML). Since 1985, however, various problems caused a sharp decline in research activities, includingthe development of new varieties. To re-invigorate the rice research, the ‘Anne van Dijk’ RiceResearch Centre Nickerie (ADRON) was established in 1994. Research at ADRON is typicallyapplied research, of which the main objective is to develop technology which increases theprofitability of the paddy production through increasing yields and quality and reducing costs,and which is safe for our farmers and environment.A Crop Production Survey was carried out in order to generate a research agenda whichaddresses to the most urgent topic’s, as well as to involve farmers more directly in research &development,
1.2 METHODS
The crop production survey is based on random crop cuts (5x5m) from a random sample offields in the Nickerian rice polders. Red rice was harvested separately, insects and weedswere monitored and the water layer was measured. In most cases a soil sample has beentaken as well. In addition, the farmer was interviewed on rates and timing of all his culturalpractices. Thus, data are collected from which the cropping system can be analysed,bottlenecks in crop production can be identified, and priority research topics can bedetermined.The crop production survey was implemented for three consecutive seasons (starting in July1996) and involved 430 farmers’ fields. Main method for analyses, was “contrast analyses”, which compares the 30% of the fieldswith the highest value of a parameter to the 30%with the lowest value of that parameter, e.g.yield, the number of red rice panicles or time of planting (for continuous variables). Othercontrasts are varieties, phosphate class of the soil, etc. (for discontinuous variables).
1.3 RESULTS AND DISCUSSION
High variation in yields
Table 1 shows the variation in yields for the 3 seasons. This variation in yields indicates thepossibility that with an optimal application of current cultural practices and varieties the averageyield could increase from the actual 4.0 ton/ha up to 5.5 ton/ha.Main factors related to high yields are: 1) early sowing, 2) maintenance of the water layer (bothfactors imply a good wet infrastructure), 3) low percentage of red rice and 4) timely and highurea applications.
Table 1: Variation in yields in Nickerie
Season least 30 % average highest 30 % number of fields
main-1996 2.6 4.5 6 83
short-1996 2.3 3.8 5.2 144
main-1997 2.4 3.9 5.4 203
average 2.4 4 5.5 430

1
2
3
4
5
6
7
8
max
imal
yie
ld (
ton
pad
dy/
ha)
0 20 40 60 80 100
relative date of sowing (days)
Figure 1
3
Production costs are high
The profitability of the current paddy production is low. On one hand because the paddy price islow, on the other hand because the production costs per ton paddy are high. In order to reducethe production costs per ton, it is much more effective to increase yields than to reduce costsper hectare. The highest production costs are for soil tillage.
Long sowing period and poor timing of cultural practices
The sowing period lasts up to 12 weeks and the interval between the last plantings and thefirst harvests is only one month. This gives rise to a build up of pest populations. The timing ofthe cultural practices relative to the date of sowing is highly dispersed, indicating that good cropmanagement is a weak point in the current production system. This is mainly due to the poorwet infrastructure. The timely availability of machinery and credits also plays a role.
Intensive soil tillage
Dry soil tillage is carried out with the 3-disc-plough and/or the offset-plough. The wet tillage(puddling) is carried out with the chipper and the weedcutter drawn by a tractor with cage-wheels after which the fields are smoothened with a wooden beam. Four to five soil tillagescenario’s can be distinguished, which have their background in the soil humidity andavailability of machinery, water and time. Between the scenario’s are no significant differencesin yields, indicating that the more intensive scenario’s are probably not necessary. Fieldsworked with the 3-disc plough had remarkably more red rice than other fields. In heavilyinfested fields, repeated puddling as a measure against red rice is not effective. Most likelybecause though killing red rice seedlings, puddling also brings up new seeds to the soilsurface.
Late sown fields have low yields
Relatively late sown fields (more than 6-7weeks after the first field) yield clearly less(Figure 1). The panicle weight is lower, whichindicates stress conditions during the latergrowth of the plant: less irrigation wateravailable, unfavourable weather conditions(less solar radiation), insects (paddy bug) andweed competition.
New rice varieties are necessary
Eloni is the most popular variety (75% of thefields). The new variety Groveni (released in1994) has not been adopted by the farmers. Itis grown on less than 10% of the fields. Clearly a demand, and a niche, exist for earliermaturing varieties (e.g. 100 days in stead of 125 days).Such varieties could escape from most of the effects of late sowing. In the present situationthis would benefit the production for 30-40% of the fields.However, as lower production costs per ton are first of all based on higher yields per hectare,breeding activities should continue to focus on higher yielding 125-days-varieties (potentially 8-10 tons/ha, compared to Eloni which yields potentially 6-7 tons/ha) as well.
On most fields the ideal water management cannot be realised
Due to a poor wet infrastructure, the optimal water management scheme for varieties which

2
3
4
5
6
7
8
max
imu
m y
ield
(to
n p
add
y/h
a)
5 10 15 20 25
number of days flooded of the first 25
Figure 2
1
2
3
4
5
6
7
8
max
imal
yie
ld (
ton
wet
pad
dy/
ha)
0% 5% 10% 15% 20% 25%
percentage red rice (panicles)
Figure 3
4
mature in 125 days cannot be realised on mostof the fields. Thus, the farmer is deprived of anessential tool for: 1) stimulating seedlingestablishment, 2) controlling red rice and otherweeds, 3) fertilising efficiently with urea, 4)controlling pests and 5) avoid high costs forharvesting.Fields which are drained within 3 days aftersowing (32% of the fields) have almost 40%more red rice and a 20% (700 kg/ha) loweryield, compared to fields which are drainedwithin 8 tot 20 days after sowing (12% of thefields). However, this type of watermanagement is only possible on properly levelled fields. The longer a field is keptflooded, especially during the period fromsowing up to the first urea application, the higher the yields, Figure 2.
Red rice reduces yields more than expected
C the average per percentage of red rice is 2.7%, while 10% of the fields have more than 6%of red rice.
C every 1% red rice reduces the yield with 6%, Figure 3.C though red rice originates from
contaminated seed, it is only thered rice germinating from the soilwhich is of economical interest.
C with a higher seed rate thepercentage of red rice is lower.
C the number of red rice paniclesis especially high on fields whichare ploughed with the 3-discplough.
C repeated puddling as ameasurement against red rice inheavily infested fields is noteffective.
C high urea rates on fields whichare heavily contaminated withred rice is disadvantageous.
C not draining the field immediatelyafter sowing, but 8-20 days later,reduces the number of red ricespanicles.
Other weeds
After red rice, Maraina grass (Ischaeum rugosum) is the most important weed. This weed isabundant especially in late sown fields, due to poor water management. Propanil is used forits control. Most frequent weed is Fimbristylis, but it appears to be controlled easily with 2,4D.Minor weeds are Speanoclea zeylanica, Cyperus articulatus, Luziola spruceana andNymphea amazonum.The applied rates of 2,4D (which is used on 62% of the fields) and more so of propanil (whichis used on 22% of the fields) are often far under the recommended rate. Most farmers applyherbicides spotwise. On almost 30% of the fields no herbicides are applied.
Insects

0%
5%
10%
15%
20%
25%
freq
uen
cy
0 20 40 60 80 100 120 days after sowing
Monocrotophos
Timing of the application of Karate and monocrotophos.
Karate
Figure 4
5
Chronologically, the most frequent pests are: water weevils (Lissorhopterus foveolatus), bibitfly (Hydrellia), stemborer (Rupela albinella) and seed bugs (Oebalus poecilus). The order ofeconomical interest is not clear. Minor pests are armyworm (Spodoptera frugiperda),Conodephalus spp., thrips (Baliothrips biformis) and delphacids (Sogatodes oryzicola). Peststypical on late sown fields are bibit fly and seed bug.A frequently applied method for controlling water weevils, is dripping a mixture of Brestan(Fentin acetate, against snails) and Karate or Twin in field ditches just before sowing. The effectiveness of this method is not clear, but such fields are later on less sprayed, withoutnegative effects on the yield.Most frequently usedinsecticides aremonocrotophos (for allinsects) and Karate (allinsects except seed bugs),Figure 4. Rates perapplication formonocrotophos are verylow: on 90% of the fieldsless than 500 ml/ha and on30% of the fields less than200 ml/ha. On 40% of thefields the application isrepeated within 20 days.Riscs of too a lowapplication rate are the buildup of resistant populations.However, on many fields, despite very low rates, high yields are achieved. This indicatesample possibilities for Integrated Pest Management.
Diseases
Fungus diseases (Helminthosporium oryzae, Pyricularia oryzae, Cercospora oryzae andRhizoctonia solani) are rarely of economical interest.On some fields nutritional disorders are observed, related to a combination of excess of Fe ,2+
phosphate deficiency, low pH and poor draining. Farmers refer to it as the “red disease”. Inmost cases the symptoms disappear 5-7 weeks after sowing and yields appear not to beaffected.
Soil fertility of the rice polders in Nickerie
Apart from nitrogen, phosphate appears to be low in most fields, Figure 5. A response topotash, however, is expected only on a few fields. All other nutrients are plenty available. Theanalyses show that apart from nitrogen and phosphate, the soils in Nickerie are very fertile andhomogeneous.Yield differences between fields or soil types are therefore attributed to differences in cropmanagement (including fertilisation with nitrogen and phosphate) only.Experimental fields at ADRON have been sampled as well and appear to have a significantlyhigher phosphate content than farmers’ fields, due to phosphate fertilisation in the 1980's. Thisexplains why phosphate trials in 1994 did not show any response. It also demonstrates theimperativeness of on-farm trials.

0%
20%
40%
60%
80%
100%
Per
cen
tag
e o
f fi
eld
s
Ca Mg K N P S B Cu Fe Mn ZnNutrients
< critical value < 1.5 X critical value
n = 259Figure 5
2
3
4
5
6
7
8 m
axim
um
yie
ld (
ton
/ha)
0 100 200 300 400 500
kg ureum per hectare
Figure 6
6
Table 2: Fertiliser application scheme’s
urea/ha perapplication
(kg)
percentageof fields
(%)
date of application (days after
sowing)
1 st 2nd 3rd
2-splits 120 45 36 66 --
3-splits 100 55 32 52 72
Fertilisation with urea
Results from the crop production surveyconfirm earlier experimental research inNickerie: for the current varieties the optimumrate of urea is ± 300 kg/ha, Figure 6. Underoptimal conditions, the response to urea ishigh: the nutrient efficiency is 20.6 kg paddy/kgnutrient (or one 50 kg bag of urea can result ina yield increase up to 450 kg paddy).Urea is exclusively applied as top-dressings. Ideally it is applied in 3 splits, but on 45% ofthe fields it is applied in 2 splits (Table 2). Theperfect water management at fertilisation is todrain the field completely, then apply the ureaand subsequently flood. This way, the urea is brought close to theroots and nitrogen losses are less. Nitrogenuptake is faster the more the root mat isdeveloped, so draining before fertilising might not be necessary for the second or thirdapplications.
At present, the agronomicimplications hereof are part ofADRON’s research program.For varieties which mature in125 days, the highest yieldsare realised with theapplication in 3 splits at 28, 50and 70 days after sowing. For earlier maturing varietiesthe best scheme’s and timing

3
4
5
6
7
8
max
imu
m y
ield
(to
n p
add
y/h
a)
20 25 30 35 40 45 50
date 1st urea split application (das)
Figure 7
contaminatedseed
POOR WETINFRASTRUCTURE
Latesowing
maintainingwater layer
Red rice
Minimumtillage
Weeds andinsects
Low Phosphatecontents soils
Phosphatefertilizers
Correct rates &alternative pesticides
Restore chanals andconstructions
Precisionleveling
Higher precisioncultural practices
non-levelfields
Low average yield:4.0 t/ha
Poor timing of culturalpractices
Better timing ofcultural practices
High average yield:5.5 t/ha
Inefficient useof Urea
Wrongpesticide
rates
PROBLEM
BOTTLENECKS
SOLUTIONS
RESULT
CONCEPTUAL MODEL FOR INCREASING PADDY YIELDS IN THE NICKERIAN CROPPING SYSTEM
Use of3-disqueplough
7
are subject of research. Early application ofthe first split (not later than 28 days aftersowing) is important for obtaining high yields,Figure 7. On 40% of the fields the first split islater than 35 days after sowing, which canreduce the maximum yield with up to 800kg/ha.
. 1.4 CONCLUSIONS: A conceptual model for
increasing the paddy production
Based on these analyses, a conceptual modelto increase the average yield of the Nickeriancropping system with agronomic measureswas constructed (see diagram below).
The restoration of the wet and dryinfrastructure plays a key role in increasing thepaddy production in the Nickerie district.
Important improvements on field level are the control of red rice (and other weeds), reducingcosts of soil tillage (by replacing one or more runs of tillage by glyfosate), laser guided levellingof fields, increased efficiency of fertilisation with urea, fertilisation with phosphate and IPM. It isestimated that these improvements will increase the average yield from 4.0 to about 5.5ton/ha. With new varieties included, average yields can even be higher than 6 ton/ha. Bothagronomic measures and new varieties will increase the paddy quality as well, so that alsohigher prices can be realised on the world market. Thus, the profitability of the Nickerian

8
PRIORITY RESEARCH TOPICS for AGRONOMY
1. Red rice and other weeds.
2. Soil tillage (incl. laser guided field levelling).
3. Nitrogen and Phosphate fertilisation.
4. Water management at field level.
5. Integrated Pest Management.
production system could increase.
From the above, we depicted the order of priority of research topics for agronomy, to beaddressed to with On-Farm and On-Station experiments, as follows:

9
2 RESEARCH ON NITROGEN FERTILISATION IN THE NICKERIE RICEPOLDERS, SURINAM
2.1 INTRODUCTION
Nitrogen is one of the most important inputs for increasing paddy yields. For the last 45 yearsresearch in Nickerie on nitrogen was focussed on the optimum fertilisation for newly developedvarieties for mechanized paddy production. It dealt mostly with:
C type and rate of nitrogen fertilizerC the number of split applicationsC the timing of the split applicationsC the distribution of nitrogen over split applicationsC the way of application (on a drained or on a flooded soil)
An overview of the type of research, treatments and institutes involved, is given in Table 1.
Table 1. An overview of Nitrogen related research in Nickerie, Surinam, for the last 45 years.
Year Institute*Experimental Design
Type of research Treatments N-rate (kg/ha) number1957 On-farm trials NxP 0, 30 110
1958 On-farm trials NxP 0, 30, 50 27 1
1959 On-farm trials NxPxVar 0, 20 1100
1961- 67 On-station trials NxType of fertlzr 0, 40 224
1954-61 On-station trials NxTiming 0, up to 50 239
1958-63 On-station trials NxWay of appl. 0, up to 50 15 2
1969-70 On-station trials NxTillagexTimingxDist. 0, 125 8 2
1978-79 Survey - farmers’ rate 372 3
1980 On-sation trials NxWay of appl. ? 31
1986-87 On-station trials NxTimingxNr of Splits 120 32
1986-87 On-station trials NxWay of appl. 0 up to 250 3119
1988-89 Survey - farmers’ rate 354 4
1993-94 On-station trials N 0 up to 240 52
1996-97 Crop Production survey - farmers’ rate 414 5
1997-99 On-station trials NxTimingxDist. 138 3 5
1997-99 On-station trials NxNr of Splits 100 to 150 54
* 1 = Agricultural Experimental Station, 2 = Foundation for the Mechanized Agriculture, Wageningen (SML), 3 = Practical Rice Research (POR), 4 = Multipurpose Corantijn Project (MCP), 5 = Anne van Dijk Rice Research Station Nickerie (ADRON)
2.2 FINDINGS OF EARLIER RESEARCH (1954 - 1994)
In On-Farm trials in 1957 to 1959, the variety Dima showed a very small and insignificant averageresponse to ammonium sulphate, whereas the traditional variety Skrivimankoti showed a smallinsignificant negative response ( Raktoe & Federer 1965 and 1966). Variation across fields was very high,but there was no correlation between yield increase and the yield of not fertilised plots. It was concludedthat:
C Only when new varieties become available, it is possible that they will respond to fertilisation withnitrogen.
Some results of on-station research conducted by Ten Have (1967) with varieties as Dima and early

0
200
400
600
800
1000
1200
Yie
ld in
crea
se (
kg p
addy
/ha)
1958A 1958B 1959A 1959B 1960 1960B
drained soil in water Figure 1
3000
3500
4000
4500
5000
5500
6000
6500
pad
dy
(kg
/ha)
100 200 300 400 500 600 urea (kg/ha)
Figure 2
1978
1980
10
developed SML lines (which mature in 130-145 days), can be summarised as follows:
C The use of urea is more practical than ammonium sulphate (due to it’s higher N-contents) and bothfertilizers are more efficient than nitrate fertilizers.
C A basal dressing of urea is ineffective, only top dressings are increasing yields.C The best way to apply urea is to drain the field completely, apply the urea and reflood after two days.
If urea is applied directly into the water, the yield increase is only half as much, Figure 1.
C If more than 65 kg urea is to be applied, best results are when applied in two equal portions at 48 and68 (that is at panicle initiation) days after sowing. When more than 130 kg of urea has to be applied,the first portion should be higher than the second.
C On the linear part of the response curve the average response was 23 kg paddy/kg N.
Scheltema (1974) investigated the interaction between soil tillage and N-fertilisation. Various ureaapplication scheme’s, urea rates and distributions of urea over split applications were tested on soilswhich were tilled only dry, only wet (puddled), tilled dry followed by wet and with zero tillage. Someconclusions are:
C Urea nitrogen, applied to a temporarily drained soil, is transported into the root zone when the soil isreflooded and thus nitrification followed by denitrification is avoided.
C On a soil which is tilled dry, this downwards transportation of nitrogen when reflooded is faster thanon a soil which is puddled. However, when temporarily drained, nitrogen losses through volatilizationare faster as well.
C Up to mid tillering, the N-supplying capacity of the soil is sufficient when soils are tilled, with zero-tillageavailability of soil nitrogen is lower.
C For the (than current) variety Apura (140 days), the best distribution of urea over split applications was0 - 60 - 100 urea kg/ha (at active tillering, 30 days after sowing, at panicle initiation, 65 days aftersowing and at panicle differentiation, 80 days after sowing respectively) when the soil was tilled onlydry or if tilled dry followed by puddling. When the soil was only puddled, the best distribution of ureawas 40 - 60 - 60 urea kg/ha.
C Optimum total urea rates were between 100 and 180 kg/ha.
Van Midde (1981), using data from the department ofagricultural statistics on the major season 1978 and theminor season 1980, found that farmers used far higherurea rates than the 200 kg/ha recommended bySoerokarso et al (1976). These farmers grew the 120-days varieties Diwani (released in 1976) or Eloni(released in 1979) with an average rate of 300 kgurea/ha. For both seasons the response to urea wasestimated by plotting the moving average (period = 12) ofthe data of 1978 (n=132) and of 1980 (n=240) against theurea rate, Figure 2. It shows that at least up to 300-350kg urea/ha, the response was linear. A survey held in thewestern polders in 1988 confirmed that the mean farmers’ rate was ± 300 kg urea/ha (MCP, 1989).

2
3
4
5
6
7
8
max
imu
m y
ield
(to
n/h
a)
0 100 200 300 400 500 Total urea (kg/ha)
Figure 3
11
Table 2: Fertilizer application scheme’s
urea/appl.
(kg/ha)
date of application (days after sowing)
yield(ton/ha
)
1 st 2nd 3rd
2-splits 120 38 66 -- 4.1
3-splits 100 31 52 74 4.5
p-value 0.000 0.000 0.000 -- 0.003
In a trial to compare the application of urea directly into the water to an application on a drained soil afterwhich the soil is reflooded 2 days later, no yield differences were found (van Midde, 1981).
Keisers (1987a) repeated twice a nitrogen response trial with the variety Eloni, in which urea was appliedon a drained soil which was then reflooded, compared to urea applied directly into a continuously floodedsoil. It was concluded that:
C A different response to urea when applied directly in water compared to an application on a drainedsoil, was not detectable.
C Unless a known problem exists that can be controlled by draining the soil (such as the control of algae,rice water weevil or the removal of anaerobic toxins), applying urea directly in water seems to befarmers’ best choice.
C The rate at which maximum yields were obtained varied from 317 kg urea/ha in the minor season of1986, to 393 kg in the major season of 1986.
An other repeated trial was set up to determine the optimum timings of various split applications in equalportions at a total rate of 260 kg urea/ha (Keisers, 1987b). The timings were: at mid tillering (28-30 daysafter sowing), at panicle initiation (52-54 days), at panicle differentiation (60-62 days) and at pollen mothercell differentiation (68-70 days). For the 2 split applications a timing at 52 and 72 days gave the lowestyields, whereas for 3 split applications a timing at 30 - 60 - 72 and 52 - 62 - 72 gave the lowest yields.Best yields were found at a timing at 30 - 52 for 2 splits and 30 - 52 - 72 for 3 splits. The differencebetween the best 2 split and the best 3 split application was not significant. It was concluded that:
C A nitrogen top-dressing at mid-tillering (28-30 days after sowing) is a prerequisite for obtaining highyields
C The best 2 split application is at 30 - 52 days after sowing.
Rees at all (1994) carried out a nitrogen response trial for two seasons with various varieties, amongwhich Eloni and Groveni (released in 1994). Urea was applied in 3 splits of equal portions on a drainedsoil. For Eloni it was found that the rate at which a maximum yield is found varied from 388 kg urea/hain the main season to 483 kg urea/ha in the minor season (see also Figure 8), for Groveni these figureswere 324 and 483 kg urea/ha respectively.
2.3 ACTUAL FARMERS’ PRACTICES
A crop production survey, carried out during 3seasons in 1996 to 1997 (Wildschut, 1998),concluded that the averaged urea rate which farmersapply is 275 kg/ha, while for 10% of the fields rateswere higher than 375 kg/ha. The highest yields werefound at urea rates of 300 to 350 kg/ha, Figure 3.On 45% of the fields urea was applied in 2 splits, on55% in 3 splits. When applied in 2 splits, the timingof the first as well as the second application is
delayed and the total urea rate is lower. Yielddifferences between fields on which urea wasapplied in 2-splits and in 3-splits were significant(Table 2), and are explained both by differences inrate and in dates of application.In a 3 split scheme, earlier application of the firstsplit is significantly related to higher yields (R =0.460, p = 0.000, n= 177, Figure 4). This wasfound for the second split application as well
(varying between 42 and 61 days after sowing), but for the third split (varying between 65 and 83 daysafter sowing) there was no difference in yields between late and early application.

1000
2000
3000
4000
5000
6000
7000
8000
9000 p
add
y yi
eld
(kg
/ha)
20 25 30 35 40 45 50 first urea application (das)
3N 2NFigure 4
12
This relation between timing and yield is notsignificant for 2 split schemes. Comparing for the first, the second and the thirdapplication the differences between the 30%lowest and the 30% highest urea rates, revealsthat for the 3 split application the correspondingdifference in yield is small and not significant forthe first application only (Table 3).For the secondand the third application the differences areincreasing in size and significance. This suggeststhat the highest portion of the urea should beapplied in the later applications. For applications in2 splits differences in urea rates between thelowest 30% and the highest 30% were higher andyield differences are for both splits significant.
Table 3: Relation between yield and the rate of the split applications in 2 and in 3 splits (between brackets),comparing the 30% lowest rates vs the 30% highest rates.
2 Splits yields (ton/ha) 3 Splits yields (ton/ha)
Application 30% lowest 30% Difference p-value 30% lowest 30% highesturea rates highest (ton/ha) urea rates urea rates p-value
urea rates
Difference(ton/ha)
1st 3.7 (85) 4.4 (162) 0.7 0.007 4.4 (74) 4.8 (137) 0.4 0.075
2nd 3.7 (85) 4.4 (152) 0.7 0.014 4.2 (76) 4.9 (139) 0.7 0.0083rd - - - 4.1 (70) 4.9 (134) 0.8 0.002Total 3.5 (175) 4.4 (309) 0.9 0.001 4.1 (210) 4.8 (395) 0.7 0.007
Regarding the way of applying urea, it was found that on 65% of the fields the first urea application isapplied to a drained soil, for the second and for third application, 54% and 45% of the fields were drainedrespectively. Differences between fields to which urea was applied directly in water and those which weredrained first and subsequently reflooded, are small and not significant, Table 4.
Table 4: Yields (ton/ha) and percentage of fields to which urea is applied on a drained soil.
Application applied in on p-value number % on
1st 4.3 4.2 0.696 174 63%
2nd 4.1 4.4 0.092 173 51%
3rd 4.3 4.7 0.210 84 40%
From the above results of observational research it could be depicted that:
C The highest yields are found on farmers’ fields on which 300-350 kg urea/ha is applied.C The best timing is around 25-30, 45-50 and 70-75 days after sowing.C Probably, the best distribution is such that portions increase from the first to the latest split.C Yield differences due to urea application directly into the water compared to application onto a drained
and subsequently reflooded soil could not be detected.
Data could suggest however, that farmers judge it more important to drain the field before the first ureaapplication than for the second or the third. This is in accordance with the theory that the more developedthe root mat, the faster is urea uptake and the less important it is to bring urea nitrogen towards the rootsthrough draining before fertilization followed by reflooding.

4.0
4.5
5.0
5.5
Yie
ld p
addy
(to
n/ha
)
Eloni ADRON 102
3N
3N
2N
2N
var p=0.00053var x split p=0.00038
Figure 5
4
4.5
5
5.5 Y
ield
pad
dy (t
on/h
a)
27-70 36-70 41-76 16-56 27-56 39-56Two-split urea applications (das)
Eloni
ADRON 102
var x 2-split: p=0.020 Figure 6
13
Other farmers practices regarding fertilisation with urea:
C Late sown fields are fertilised more often in 3 splits, with higher and earlier urea applications.C The third urea application is higher when paddy is grown for seed.C If fields are heavily infested with red rice, farmers cut back on the third urea application.
2.4 RECENT RESULTS (1996 - 1999)
During four seasons a trial was carried out at ADRON to determine wether a 2 split application is asefficient as a 3 split application and to determine what is the best timing of the applications, for both thecurrent variety Eloni (120 days) and one of our new lines (ADRON 102, a 100-day variety).It was found that for the 100-day variety no difference in yields is observed between the average of the2 split applications and the 3 split application (at 25, 44 and 56 days after sowing). For Eloni, the averageyield of 2 split applications is lower than the 3 split application at 30, 56 and 76 days after sowing, Figure5. The best timing of the 2 split application for the 100-day variety was at 27 and 56 days after sowing. Boththe earlier first application at 16 days after sowing and the late first application at 39 days after sowinggave lower yields.
The best 2 split application for Eloni was at 27 and 70 days after sowing, and did not differ significantlywith the 3 split application. Late first split applications ( at 36 and 41 days after sowing) reduced the yieldof Eloni significantly, Figure 6.
For the same varieties, an other trial repeated over 3 seasons, investigated the effect of earlier timing ofthe first and second urea application in a 3 split scheme, as well as increasing portions for the secondor the third application. It was found that:
C For both varieties, increasing the portions of the 2 or the 3 split application increases yieldnd rd
significantly, Figure 7.

3500
4000
4500
5000
5500
6000
6500
Pad
dy Y
ield
(kg
/ha)
0 100 200 300 400 500 600 Urea (kg/ha)
Eloni
ADRON 102
Figure 8
4.0
4.5
5.0 Y
ield
pad
dy (t
on/h
a)
100-100-100 75-150-75 75-75-150Portions of urea (kg/ha)
Figure 7p = 0.0086
14
C A timing as early as 14 days after sowing of the first and as early as 44 for Eloni, or 34 days forADRON 102 of the second application, does not increases yield.
Wether increasing portions in a 2 split scheme increases yields as well, is subject to further research.
From response trials it appears that the response of ADRON 102 to urea is less than for Eloni, Figure8. The response to urea of Eloni was determined in both seasons of 1993 (from Rees et al ,1994), theresponse of ADRON 102 was determined in the minor season of 1997 and the major seasons of 1998and 1999 (Wildschut et al, 1999).
2.5 DISCUSSION AND CONCLUSIONS
Overlooking the research on nitrogen for the last 45 years, the following trends could be depicted:
C The urea rate at which maximum yields are obtained has increased from 60 kg urea/ha for the firstSML varieties to up to 200 kg for varieties as Apura, to more than 300 kg urea/ha for the current varietyEloni.
C As the time to maturation decreases from 155 days for Dima to 140 for Apura to 120-125 days forEloni to 100-105 days for ADRON 102, optimum timing of the application of the last split was alteredaccordingly. However, for the first split application, 25-30 days after sowing is still considered optimal.
C For the first SML varieties one split application was sufficient, later varieties with a higher response tonitrogen were fertilised in 2 splits and for Eloni 3 splits is the most efficient. For 100-days varieties 2splits are sufficient.
C Initially, if a 2 split application was considered, it was recommended to give the highest portion in thefirst split. Later, for 3 splits applications, increasing portions towards the third split were recommendedfor varieties as Apura. For Eloni, initially equal portions were recommended, but at present ADRONrecommends increasing portions.
C Concerning the way of application, the very consistent and positive effect of applying urea on atemporarily drained soil which is reflooded after 2 days, is later not found in experimental conditions,nor under farmers conditions. Possibly, conditions of newly reclaimed land in Wageningen, as a veryhigh organic matter content, influenced the earlier results. Further research on this topic is needed.
C At present the best recommendations to farmers are:1) Total rate: 300-350 kg/ha for Eloni, around 250 kg/ha for ADRON 102.2) Number of splits: 3 for Eloni, 2 for ADRON 102.3) Timing: at 25-30, 45-50 and 70-75 days after sowing for Eloni,
at 25 and 50-55 days for ADRON 102.4) Portions: Increasing portions, par example 75, 100 and 150 kg/ha.5) Way of application: At least the first application on a drained and subsequently reflooded soil.
This topic needs further research.Portions at 2 split applications and the way of application need further research.

15
C On-farm trials on fertilisation with urea is an under-exploited research tool.
In Surinam, up to now, timing of the split applications of urea is determined by the physiological growthstage of the crop, e.g. at mid-tillering, panicle initiation, panicle differentiation or pollen mother celldifferentiation. Which in turn are estimated on a calender basis. Actual crop nitrogen needs aredetermined by soil nitrogen supply and fertiliser nitrogen release as well and are probably not so strictlyrelated to the physiological growth stage as suggested. Using at least for experimental purposes themethod of measuring chlorophyll intensity could improve fertiliser recommendations.
References
S Have, H. ten (1967). Research and breeding for mechanical culture of rice in Suriname. Centrumvoor landbouwpublicaties en landbouwdocumentatie (Pudoc), Wageningen, the Netherlands.
S Keisers, J. T. (1987a). The effect of timing of nitrogen top-dressings on yield components of directseeded wet land rice. De Surinaamse Landbouw, 35, 3-13.
S Keisers, J. T. (1987b). Response of wetland rice to nitrogen fertilizer in relation to watermanagement during application. De Surinaamse Landbouw, 35, 19-28.
S MCP, 1989. Van Wouw Rehabilitation Feasibility Study. Multiple-Purpose Corantijn Project Authority.Vol. 3, Appendix II. General Secr. Of the Organization of American States, Dept. Of RegionalDevelopment.
S Midde van, R. (1981). Jaarverslag 1980 P.O.R. Praktijk Onderzoek Rijst. L.V.V.
S Raktoe, B. L. & Federer, W. T. (1965). Statistical analyses of fertilizer response for rice yields inNickerie, Suriname - II. De Surinaamse Landbouw, 13, 250-260.
S Raktoe, B. L. & Federer, W. T. (1966). Statistical analyses of fertilizer response for rice yields inNickerie, Suriname - III. De Surinaamse Landbouw, 14, 104-112.
S Rees, D.J. , Khodabaks, M. R. & van den Bogaert, C. L. M. (1994), Response of rice varieties tonitrogen and phosphate fertilizer on Europolder clay soil. Reports of the Anne van Dijk RiceResearch Centre Nickerie (ADRON), 2, 3-14.
S Soerokarso, H. G. , editor (1976) . Handleiding voor de Rijstteelt in Suriname. Ministerie vanLandbouw, Veeteelt en Visserij.
S Wildschut, J. (1998). Vergelijkend Veldonderzoek. Reports of the Anne van Dijk Rice ResearchCentre Nickerie (ADRON), 6, 3-37.
S Wildschut, J., Khodabaks, R.M. & Soerdjan, L. (1999). Proeven op ADRON. Reports of the Annevan Dijk Rice Research Centre Nickerie (ADRON), 10, 3-6.

16
3 RESEARCH ON PHOSPHATE FERTILIZATION IN THE NICKERIE RICE POLDERS
3.1 INTRODUCTION
During the last 45 years (that is since the introduction of direct seeded rice), there have beenseveral waves of interest in research on fertilization with phosphate, in which variousinstitutes have been involved. An overview is given in Table 1.
Table 1. Phosphate (P) related research in Nickerie, Surinam, since 1955.
Year Institute*Experimental Design Observations
Type of research Treatments P O -rate (kg/ha) n Yields P-soil Cult.2 5
pract.1957 On-farm trials NxP 0, 75 10 LPV1958 On-farm trials NxP 0, 60 27 LPV V1958 On-farm trials NxP 0, 30, 60 9 LPV1959 On-farm trials NxPx Var 0, 30 10 LPV1954-58 On-station trials NxP 0, up to 87 15 SMLV V1954-61 On-station trials NxPxK 0, up to 174 22 SMLV V1954-64 On-station trials NxPxKxCa 0, up to 87 5 SMLV V1954-64 On-station trials NxPxCa 0, up to 78 4 SMLV V1982 On-farm trials P 0, 46 39 PORV V1982 On-station trials P 0, 23, 46, 69 3 PORV V1984 Soil survey - - 11 DBKV1993-94 On-station NxP 0, 45, 90, 180 2 ADRONV1996-97 Crop Production survey - farmers’ rate 25 ADRONV V V1997 On-farm trials PxN 0, 40, 80, 120 21 ADRONfarmer
V V V1998-99 On-farm trials PxKxN 0, 40, 80 62 ADRONfarmer V V V1999 On-station trial Px tillage 0, 46 1 ADRONV V* LP = Agricultural Experimental Station, SML = Foundation for the Mechanized Agriculture, Wageningen, POR = Practical Rice
Research , DBK = Dept. of Soil Survey, Min. of Natural Resources, ADRON = Anne van Dijk Rice Research Station Nickerie.
Lowland irrigated rice shows variable response to phosphate, which is only rarely the mainfactor limiting crop production. At least three conditions could be distinguished under whichrice, depending on variety as well, responds to phosphate:C An absolute deficiency of the soil (phosphate is the main factor limiting crop production.
A response to other production factors as fertilization with nitrogen can be expected onlyif phosphate has been applied)
C A relative deficiency of the soil (only at high levels of crop management, e.g. fertilizationwith nitrogen, a yield increase due to phosphate fertilization is observed)
C A reduced P-availability, or inhibited P-uptake, induced by extreme or special soilconditions: very low pH, Fe-toxicity, H S, drying soils, toxic organic acids due to imperfect2
decomposition of fresh organic materials, salt, etc. Wether the response to phosphate is high enough to be economical, depends on the costsof the fertilizer and the value of the paddy yield increase. The latter dropped strongly duringthe last years.
3.2 FINDINGS OF EARLIER RESEARCH (1954-1992)
Raktoe & Federer (1965 and 1966) analysed 127 on-farm trials which had been conducted

0%
20%
40%
60%
80%
100%
cum
ula
tive
fre
qu
en
cy
<160 <275 <400 <500 <960
Total-P class (ppm)
1984 (n=113)
1958 (n=27)
Figure 1
17
by E. Ubels in 1958 and 1959 with the variety Dima (one of the first varieties selected formechanised rice culture). They concluded:C Though significant, the average yield response in farmers fields in Nickerie is low: 90 kg
paddy/30 kg P O (which is 3.02 kg paddy/kg P O ).2 5 2 5
C No relation was found between Total-P (HCl 25%) and yield increase.
Ten Have (1967) carried out at least 46 on-station trials over a period of 10 years andconcluded:C “On the whole, phosphate had no effect on grain yield. This is probably because these
soils contain a moderate amount of readily available P O and that availability usually2 5
increases when the soil is submerged and reduction occurs”C Per ton of paddy ± 5.5 kg P O /ha is removed from the soil.2 5
Veltkamp (1975) summarized the results of some trials from the late fifties as:C Renophosphate (a rock phosphate ) is as good a P-fertilizer as double superphosphate.C Residual effects, if any, were found only during the first year after application.C The P-extraction method “Total-P (HCl 25%)” correlates better with yield increase due to
P-fertilizer applications (r = -0.41), than 2% citric acid (r = -0.14). If the soil has a TotalP(HCl 25%) < 330 ppm, a response to P-fertilization might be expected (26% of the fieldsin Nickerie), whereas the minimum response to balance fertilizer costs of 60 kg P2O5 was360 kg/ha (6 kg paddy/kg P O ), which is expected when Total P (HCl 25%) < 230 ppm2 5
(0% of the fields in Nickerie).
Keisers (1983) found the response to P O in 39 on-farm trials highly variable (from 0 to 1312 5
kg paddy/kg P O ). In addition:2 5
C Grain yields of plots not-fertilized with P O were not correlated with one of the 5 P-2 5
extraction methods Total P, Bray p1, Bray p2, Olsen P and Truog P. The yield increase toP-fertilization was correlated to Total-P only (r = 0.325).
C On-station trials showed no response.C On a site with a pseudo-sulphate acid soil (less than 3% of the rice area) a very strong
response was found.
A soil survey in the Nickerie rice poldersshowed Total-P to range from 160 toabove 500 ppm (Noordam & Bliek, 1985).Based on data from soil pits it wasconcluded:C that older rice polders have in general
a lower Total-P than younger polders.Comparing the soil survey data to datafrom Raktoe & Federer (1965a), taken in1958, suggest that indeed Total-P isdiminishing, Figure 1.
Rees et al (1994) carried out twophosphate response trials at ADRONwhich showed no response to P O . It2 5
was concluded that:
C “.. continuous rice cropping since 1975 has not resulted in significant loss in thephosphate-supply potential of the soil when flooded.”

0%
20%
40%
60%
80%
100%C
umul
ativ
e fr
eque
ncy
-60 -40 -20 0 20 40 60 80 Phosphate response (kg paddy/ kg P2O5)
1997, n= 50
1959, n=100
Figure 2
-60
-40
-20
0
20
40
60
80
Res
pons
e (k
g pa
ddy/
kg P
2O5
)
0 1000 2000 3000 4000 5000 6000 Yield without P-fertiliser (kg/ha)
1959 1997
Figure 3 R = 0.423, p= 0.000, n=150
18
3.3 ACTUAL FARMERS’ PRACTICES
A crop production survey, carried out during 3 seasons in 1996 to 1997 (Wildschut, 1998),concluded that on 20% of the fields farmers apply P O in the form of TSP at an average rate2 5
of 33 kg/ha TSP. Contrary to the practices in either on-farm or on-station trials, farmers applyP O mixed with urea at the first or the second split application, at 30 or 55 days after sowing,2 5
such that a portion of the urea is replaced by TSP.
Some farmers claimed that the application of TSP softens the soil, such that at harvest thesoil is not in condition for the combine. This was also stated during interviews in a survey oninformation flow among rice farmers in Nickerie (Jalloh, 1999).
3.4 RECENT RESULTS (1996-1999)
On-farm responseSince 1997, ADRON harvested some 83 superimposed trials on farmers fields throughoutNickerie. Red rice has been harvested separately. Data on rates and timing of all culturalpractices were collected through interviews with the farmer. During the first four seasons,52 trials have been harvested. Analysesof the P-response of these trials showedthat the estimated average yield increaseat 30 kg P O /ha was 140 kg/ha paddy (=2 5
4.66 kg paddy/kg P O ). These figures do2 5
not differ significantly from the results ofthe 127 trials in 1958 (p=0.612, t-test).
In addition, for both data sets thecumulative frequency of the response toP O is practically the same, Figure 2.2 5
For both sets on ± 35% of the fields aresponse to P O > 10 kg paddy/kg P O2 5 2 5
is observed.
Comparing the 30% of the fields whichshowed the lowest response to the 30%of the fields which showed the highest response revealed that the response to phosphate issignificantly higher when:
C Yields from the plots without P O fertilization are low (p=0.011, n=50).2 5
C The innundation period before sowing is short (p=0.038, n=42)C Fields are sprayed with very low herbicide rates (p=0.011, n=29)
C The field is kept flooded whenapplying the urea top dressings(± 30 and 55 days aftersowing)(p= 0.032, n=17).
A higher response to P O when not-2 5
fertilized yields are low is also observedfor the data from 1959, Figure 3.Variation around this trend, however, isvery high.
From the crop production survey it wasfound that low yields of farmers fieldswere due to:
C A high percentage of red rice paniclesC A low and/or late urea
application

-60
-40
-20
0
20
40
60
80
Kg
padd
y /
kg P
2O5
0 5 10 15 20 Days submerged before sowing
Figure 4
-60
-40
-20
0
20
40
60
80
Kg
padd
y /
kg P
2O5
10% 30% 50% 70% 90%Relative rate of herbicides
Figure 5
19
C Late date of sowing, andC Keeping the field flooded for only a short period during the first 30 days.
The first two factors do not relate to the response to P O . The percentage of red rice was2 5
found not to decrease with P O fertilization, nor could any interaction of P O with the effect2 5 2 5
of urea be detected.The last two factors relate to water management, which in turn relates to weed control andto processes which increase P-availability during innundation. Latesowing happens if the farmers’ access towater is limited and provokes crop growthand harvest during unfavourable weatherconditions as well as population build upof harmful insects, reasons for whichfarmers who receive water late, will cutback on pre-sowing soil submergence forpuddling. A shorter submergence periodbefore sowing will reduce the availabilityof soil phosphate and increase theresponse to fertilizer phosphate, Figure 4.
In some of the fields where thesubmergence period before sowing wasextremely short, the yield of the plot without P-fertilizer was very low and the response tophosphate was very high. This might be explained by an additional inhibition of P-uptakecaused by toxic organic acids (imperfect decomposition of weeds) and/or Fe-toxicity relatedto a low pH.
That the average response to P-fertilizer is higher when the fields are not drained for the 2nd
urea top dressings (± 28 kg paddy/kg P O versus -5), might suggest that sorption of fertilizer2 5
P O in a drying soil is faster than2 5
desorption following reflooding.
As the response of rice to P O was2 5
significantly lower at increasing herbiciderates, Figure 5, it follows that a stronginteraction exists between weeds andphosphate fertilization. Possibly, underconditions of low phosphate availability torice, the response to phosphate by theweed vegetation (in general dominatedby Fimbristylis miliacea and Ischaemumrugosum) is very low and/or that theresponse of rice to phosphate is muchstronger, thus favouring it’s competitiveposition in weedy conditions.
Soil analysesDuring the crop production survey, a total of 259 farmers’ fields have been sampled for soilanalyses as well. The samples have been analysed (by AGRO Services International Inc.,USA) using an extraction method in which P-available is determined colorimetrically(molybdenum bleu) in an extract of ammonium fluoride, sodium bicarbonate and Na-EDTA(“P-ASI”), results of which correlate very well (R = 0.900, p < 0.01) to P-Olsen (Noordam,1998). P-ASI, however, does not correlate at all to crop cut yields (R = 0.042, p = 0.532,n=259). And from the 19 out of the 52 phosphate response trials which have been sampledfor soil analyses it was impossible to correlate P-ASI to yield increase due to P O (R =2 5
0.0136, p = 0.956). Apparently this extraction method does not deal with that portion of soil-P

0
1000
2000
3000
4000
5000
6000
Pad
dy y
ield
(kg
/ha)
no herbicide Nominee
No P2O5
with P2O5
Interaction of P2O5-fertilizer and weeds after dry tillage only
p = 0.0424
Figure 6
20
which is limiting paddy production on fields where a clear P O -response has been found.2 5
In order to verify if phosphate application softens the soil, the shear strength and soil humidityat the time of harvest was measured in 12 trials, on a depth of 10, 20 and 30 cm on 4 spotsper plot, for not fertilized plots and on the plots which received 80 kg P O . It was found that2 5
shear strength was clearly related to soil humidity, but neither of them was related tophosphate.On-station trialIn a trial at ADRON in 1999 (Wildschut & Khodabaks, 2000), in which rice was sown aftervarious types of dry tillage followed by a pre-planting glyphosate treatment instead of puddling,phosphate fertilizer and various types of post-emergence herbicides were compared to zeroherbicide treatment. It confirmed some ofthe results of the on-farm trials:
C When soil submergence beforesowing is only a short period (or as inthis trial even absent) available soil-Pis low and the crop shows a strongresponse to TSP.
C There is a strong interaction betweenweeds and phosphate fertilizer underthe conditions of no soil submergencebefore sowing, Figure 6, such that thepaddy yield reduction due to weeds isstronger in the absence of phosphatefertilizer.
3.5 DISCUSSION & CONCLUSIONS
C On-Station research, in general carried out under good cropping conditions as good watercontrol, has not been able to detect a response to P O , whereas with superimposed on-2 5
farm trials it was found that on 35% of the farmers fields an economical response tophosphate can be observed.
C In the Nickerie rice polders a response to phosphate is due to neither an absolute, nor arelative P-deficiency of the soil, but due to extreme or special soil conditions which reduceP-availability and/or inhibit P-uptake through toxic organic acids and/or Fe-toxicity.
C A response to phosphate is observed when water control is poor. When the periodbetween the first water intake for puddling and sowing is shorter, the response tophosphate is stronger. Phosphate application can therefor partly compensate for poorwater control, or stated inversely: with good water control fertilization with phosphate isgenerally not necessary.
C It is recommended to the farmers that a phosphate application of about 100 kg TSP within10 days after sowing, is worth trying, if:C despite good red rice control, timely and sufficient urea application and other good
cultural practices the yields are less 3.5 - 4 ton/ha, or,C submergence before sowing is less than 10 days,
. Keeping the field flooded will increase the efficiency of the phosphate fertilizer.
C For the soils of the Nickerie rice polders, traditional methods for P-extraction as P-Olsenand Bray, are useless to predict phosphate response.
C From all soil samples taken, a subsample has been stored at ADRON. If better P-availablesoil test on dried soil samples exist, it might be useful to try them. However, just trying abag of TSP might be the cheapest and the best test.
C Comparing the results of trials from the late fifties with the trials of the mid nineties, it is

21
remarkable how similar the outcomes are. After almost 40 years, and more than 60 cropsby which an amount of at least 60 x 15 = 990 kg P O has been removed from the soil, the2 5
P-supplying capacity of the soil has hardly changed. It is not expected to change in thenear future.
C Fertilization with phosphate can play a positive role when puddling is replaced by a pre-planting glyphosate treatment in a minimum tillage system.
C In conditions as reduced P-availability due to the absence or too short a period of soilsubmergence before sowing, applying P-fertilizer makes rice more competitive to weedslike Fimbristylis, so that less herbicide is necessary.
C It is not clear how to explain the negative response to P O when not fertilized yields are2 5
high. An interaction with the growth of algae, or an effect on Helmintosporium, could be anexplanation.
C Farmers’ claims that phosphate application softens the soil, could not be confirmed andremain mysterious.
C Several topics need further research, e.g. the fate of fertilizer P2O5 after draining the soilfor the application of urea top dressings, in which the use of the resin technique might behelpful.
References
Have, H. ten (1967). Research and breeding for mechanical culture of rice in Suriname.Centrum voor landbouwpublicaties en landbouwdocumentatie (Pudoc), Wageningen, theNetherlands.
Jalloh, A.K. (1999). Sources of agricultural information in rice farming in a district in Suriname.MSc Thesis, Larenstein International Agricultural College Velp, The Netherlands.
Keisers, J. T. (1985). Phosphorous response of rice in coastal clay soils. De SurinaamseLandbouw, 33, 44-55.
Noordam, D & Bliek, D. (1985). The soils of the Nickerie polders. Ministry of NaturalResources and Energy, Paramaribo, Rep. of Suriname.
Noordam, D. (1998). Report on a study to selected soil chemical characteristics of rice soilsin Suriname and their relation with yield. SNRI, Paramaribo.
Raktoe, B. L. & Federer, W. T. (1965). Statistical analyses of fertilizer response for rice yieldsin Nickerie, Suriname - II. De Surinaamse Landbouw, 13, 250-260.
Raktoe, B. L. & Federer, W. T. (1966). Statistical analyses of fertilizer response for rice yieldsin Nickerie, Suriname - III. De Surinaamse Landbouw, 14, 104-112.
Rees, D.J. , Khodabaks M. R. & van den Bogaert C. L. M. (1994), Response of rice varietiesto nitrogen and phosphate fertilizer on Europolder clay soil. Reports of the Anne van Dijk RiceResearch Centre Nickerie (ADRON), 2, 3-14.
Veltkamp, H. J. (1975). Phosphate fertilizing of rice in Surinam; a summary of results, DeSurinaamse Landbouw, 23, 10-18.
Wildschut, J. (1998). Vergelijkend Veldonderzoek. Reports of the Anne van Dijk RiceResearch Centre Nickerie (ADRON), 6, 3-37.
Wildschut, J. , Khodabaks M.R. (2000). Rijstonderzoek. Reports of the Anne van Dijk RiceResearch Centre Nickerie (ADRON), 11.
4 SUMMARY OF RESULTS OF TRIALS WITH RED (WEEDY) RICE
4.1 Introduction
Red rice is one of the most important factors limiting rice production in Nickerie. Red rice

2.5
3
3.5
4
4.5
5
Yie
ld (
ton
pady
/ha)
0 10 20 30 40 50 60 number of red rice seeds/m2
100 kg/ha200 kg/ha
300 kg/ha
Figure 2
3
3.5
4
4.5
5
Yie
ld (
ton
padi
e/ha
)
0 10 20 30 40 50 60 number of red rice seeds/m2
120-days
100-days
Figure 1
22
populations are very heterogeneous and cross easily with cultivated rice.
A trial was set up in order to answer the following questions:C is a 100-day variety as sensitive to red rice competition as a 120-day varietyC by how much can we increase competitiveness of rice by increasing the seed densityC do the two rice varieties have a different effect on red rice
Factors in the trial were Variety (a 120-days variety and a 100-days variety), Seed density (100, 200and 300 kg/ha) and Number of red rice seeds/m2 (0, 20, 40 and 60). The trial was set up in 4 blocksof 12 plots each, the three factor interaction being confounded with the block effect. The trial wasrepeated over 3 seasons.
4.2 Results
Results show that yield reduction due to an increasing number of red rice seeds is more ore lessthe same for both varieties, Figure 1. Increasing the seed density from 100 to 200 kg/ha reducesyield loss due to red rice for both varieties. Increasing the seed density from 200 to 300 kg/ha hasno use, Figure 2. Yield component analyses showed that yield reduction due to red rice competitionis through the reduction of the number of panicles/m2. Panicle weight is not influenced by red rice.
It was expected that when harvest is at 100 days, the number of shattered (ripen) red rice panicleswould be smaller than if harvest is at 120 days. Thus, a 100-day variety could be of use in anintegrated approach to control red rice. The percentage of shattered red rice panicles indeed islower when harvest is at 100 days, however, this is compensated by a higher total number of redrice panicles, figure 3.An explanation could be that at the end of the growth cycle, competition for growth factors slowsdown (after all, only the number of panicles/m2 and not the panicle weight is reduced by red ricecompetition). Red rice has a growth cycle which is adapted to competition with 120-days varieties.When competition from the 100-days variety slows down, red rice continues to produce tillers. This

0
5
10
15
20
25 n
um
be
r o
f re
d r
ice
pa
nic
les/
m2
10%
20%
30%
40%
50%
60%
70%
120-days 100-days
shattered
green
not-shattered
Total
% shattered
Figure 3
23
explains also why the higher number of red rice panicles in the harvested 100-days variety does notreduces it’s yield proportionally: the extra number of red rice panicles is formed after the yield of the100-days variety was already determined. The extra number of red rice panicles in the 100-dayharvest are green and not-shattered, Figure 3.
4.3 Conclusions:
C Yield reduction due to red rice is for 100-days and 120-days more or less the same.C This Yield reduction can be decreased by a higher seed density up to 200 kg/ha.C The percentage mature red rice panicles at harvest time is lower for a 100-days variety.C However, because the total number of red rice panicles is higher for the 100-days variety the
total number of shattered red rice panicles is the same for both varieties.C More red rice panicles are harvested while harvesting a 100-days variety from a red rice
infested field, than while harvesting a 120-days variety.
A 100-days variety is not useful in an integrated approach to control red rice. In addition, it is knownthat on the long term red rice will be adapted to a growth cycle of 100 days through natural crossingwith 100-days varieties.

0%
20%
40%
60%
80%
100%
perc
enta
ge o
f fie
lds
0 10 20 30 40 50 60 70 80 90 100
days after harvest
sowing
1st wettillage
1st drytillage
Figure 1
0
5
10
15
20
25
30
nu
mb
er
of r
ed
ric
e p
an
icle
s/m
2
2 3 4 5 7number of runs wet tillage
Figure 2
24
5 Summary MINIMUM TILLAGE
5.1 Introduction
On the very heavy clay soils of Nickerie, costs for the mechanised tillage have the highest sharein the total production costs of paddy (up to 30%). If allowed for by wether conditions, farmersperform both dry tillage and wet tillage, if not they practice only wet tillage. Dry tillage is done witha 3-disk plough and/or a Rome-type plough. Directly after water for flooding is available, the first runof field wet tillage is done with a chipper. 5-20 days later the field is puddled with a weed cutter ormud roll followed by levelling with a wooden beam. For the three consecutive seasons 1996A, 96Band 97A, the 5 most frequent soil tillage scenario’s were:
C Only wet tillage (17% of the fields), C one run with the Rome-type plough followed by wet tillage (22%), C two runs with the Rome-type plough followed by wet tillage (20%), C one run with the 3-disc plough followed by wet tillage (19%) andC one run with the 3-disc plough followed by one run with the Rome-type plough followed by wet
tillage (10%).
Timing of the tillage operations is determined bysoil humidity and the availability of machinery.Normally, the soil is drained 2-3 weeks beforeharvest with the combine. Subsequently straw isburned and within 20 days after harvest 85% ofthe fields are dry tilled. As soon as water isavailable the wet tillage starts. As the wetinfrastructure is very poor, the period during whichfields are wet tilled is long: the first 10% of thefields are wet tilled within 30 days after harvest,the last 10% not before 70 days after harvest,Figure 1.In too wet seasons, or for late sown andconsequently late harvested fields the soilhumidity is too high for dry tillage.
It was found that fields prepared with the 3-discplough had twice as much red rice than fieldsprepared with the Rome-type ploughs. In order to exhaust the red rice seed bank in the soil, farmers
often repeat several runs of wet tillage. Thisappears not to be effective, Figure 2, becausewhile killing red rice seedlings, new red riceseeds are worked up to the soil surface.
Other backgrounds of soil tillage practices inNickerie are that dry tillage directly after harvestdestroys stemborers pupa in the stubble.Puddling prepares a weed free muddy seedbed, but often causes deep tracs as well.Through levelling with a wooden beam thesetracks, if not too deep and wide, are filled withmud.
In this context of the above mentionedpractices ADRON started a research projecton Minimum Tillage, to reduce costs andimprove timing, red rice control and waterefficiency.

0
1000
2000
3000
4000
5000
6000
Yie
ld p
addy
(kg
/ha)
without wet tillage with wet tillage
97A
97B (El Ninjo)
LSD (5%) = 380 kg/ha Figure 3
2.5
3
3.5
4
4.5
5
5.5
6
Yie
ld p
addy
(to
n/ha
)
1xChipper 2xChipper
puddling
Glyphosate
Figure 4
25
5.2 Minimum Tillage trials
In a first trial on minimum tillage, main season 1997, several types of dry tillage including zero tillagewith and without a following wet tillage, were compared. Dry tillage was done directly after harvest,wet tillage as soon as water was available. During this period between dry tillage and wet tillage aweed vegetation developed which consists mainly out of volunteer rice, Fimbristylis andIschaemum rugosum. At the time the plots with a scenario which includes wet tillage were flooded,the plots with a scenario without wet tillage weretreated with glyphosate. Yields were high for allscenario’s and yields of plots with only dry tillage+ glyphosate and plots with both dry and wettillage were equal. But the next season, due tosevere drought (El Niño), yield were very low forall scenario’s, Figure 3.Yield component analyses showed that for thescenario’s without wet tillage the number ofpanicles/m2 was lower, but this wascompensated by a higher panicle weight.
Some seasons (e.g. La Niña) dry tillage is notpossible. A trial in a split plot design was set up tosee if puddling and beaming can be replaced by aglyphosate treatment after one or two runs withthe chipper. On top of these four scenario’s ofseed bed preparation without dry tillage, 5 post-planting herbicide treatments, including the farmers practice of 2,5D + Propanil, were compared
to non treated plots. Yields of non treated plotswere very low: an average of 2,6 ton/ha.However, yields were high from plots which werechippered twice (33 and 20 days before sowing),treated with glyphosate 2 days before sowingand treated with an efficient herbicide at 33 daysafter sowing. Plots which were chippered onlyonce (33 days before sowing) or which arepuddled and levelled in stead of treated withGlyphosate (2 days before sowing) yielded atleast one ton/ha less, even when treated with anefficient herbicide (33 days after sowing), Figure4. Yield differences are strongly related tointeractions of the treatments with the weedpopulation dynamics before and after sowing.In a similar trial 4 types of seedbed preparationwithout dry tillage were compared: 1) soil onlytreated with glyphosate on 12 and 2 days before
sowing (zero-tillage), 2) treated with glyphosate 12 days before sowing and puddled and levelledwith a wooden beam 2 days before sowing, 3) chippered 12 days before sowing and treated withglyphosate 2 days before sowing and 4) chippered 12 days before sowing and puddled and levelled2 days before sowing (farmers’ practice). The highest yield was found for chippering followed bya glyphosate treatment: 4.5 ton/ha, which out yielded farmers’ practice with 0.8 ton/ha. Yield fromthe zero-tillage plots was 3.5 ton/ha and from the plots treated with glyphosate followed by puddlingand levelling was 2.5 ton/ha. As the LSD(5%)=1.24 ton/ha, yield differences between the farmers’practice and the alternatives are not significant. Replacing chippering by glyphosate followed bypuddling and levelling gives a 2 ton/ha lower yield than replacing puddling and levelling byglyphosate. These results indicate clearly that puddling and levelling (costs of which are ± US$50,-/ha) can be replaced by a treatment with glyphosate (US$ 25,-/ha).

0
1
2
3
4
5
6
Yie
ld p
add
y (t
on
/ha)
R1 R1H1 R2 R2H1dry tillage scenario's
no herbicide
Nominee
Figure 5
0
1
2
3
4
5
6
Op
bre
ng
st (
ton
/ha)
no herbicide Nominee
No TSP
TSP
Figure 6
0
1
2
3
4
5
6
Wee
d s
core
no herbicide Nominee
No TSP
TSP
Figure 7
26
From previous trials it was not clear how many runs of dry tillage are optimal for replacing the wettillage by a glyphosate treatment. On-farm trials with phosphate showed that there is a stronginteraction between soil-phosphate availability, the innundation time before sowing and weed growth(see Chapter 3). Hence, a trial which combines these factors was designed: A field was tilled oncewith the Rome-type plough. One monthlater it was divided in 6 strips of which 3were ploughed again. Subsequently oneweek later the field was divided in four stripsat right angels to the 6 other strips of which2 are disc-harrowed once. Thus, 4 types ofdry tillage plots were created: Rome-ploughed once (R1), Rome-ploughed andharrowed once (R1H1), Rome-ploughedtwice (R2) and Rome-ploughed twice andharrowed once (R2H1). 32 Days afterharrowing the entire field was treated withglyphosate, flooded the next day and sown3 days later. The in total 24 plots weregrouped in 3 blocks of 2x4 plots of whichhalf were fertilized with phosphate (TSP) 6days after sowing. Superimposed on theseplots 5 post-planting herbicides (applied 20-40 days after sowing) were compared to no-herbicide.Yields were equal for all types of dry tillage, with or without post-planting herbicide treatment, Figure5.The effect of phosphate, however, depends strongly on the post-planting herbicide treatment. In theabsence of such a treatment TSP fertilizer doubled the yield from 2 to 4 ton/ha. If treated well witha post-planting herbicide as Nominee, the effect of phosphate was negligible, Figure 6. Weedsscores (0= no weeds, 9 is extremely weedy) were taken just before harvest and correlate well toyields (R =0.621). The effect of phosphate is reflected in the weed scores, in that without a post-2
planting herbicide phosphate reduces the weed score (increase the competitiveness of rice to
weeds). When treated with Nominee, the weed score is stronger reduced, Figure 7.An other observation from this trial was that the number of Jussiaea plants per plot was twice ashigh for plots ploughed twice followed by disc-harrowing. On yields this had no effect.

27
5.3 Conclusions and Recommendations
All trials show that puddling and levelling is not necessary. When dry tillage is possible one ore tworuns with a Rome-type plough or disc-harrowing is sufficient for seedbed preparation if followed bya glyphosate treatment 2 days before sowing. Apart from cost saving in seedbed preparation, thispractice requires less water, saves time as one can sow as soon as water is available and one canexpect less red rice and other weeds as the soil is not touched after killing weeds by glyphosate.Essential is that after the dry tillage and before the glyphosate as much as possible weed seedsgerminate from the soil top layer, eighter triggered by rains or by pre-irrigation. Deep tracks caused by puddling with too heavy tractors are avoided.
Also when dry tillage is not possible, chippering followed by a glyphosate treatment is sufficient toprepare a seedbed. In how far these two types of minimum tillage are a remedy for red rice infested fields is still subjectto research in farmers fields.

28

29

30

31

32

33

34

35

0
50
100
150
200
250
300
cost
s (U
S$/
ton
pad
dy)
0 2 4 6 8 paddy yield (ton/ha)
Figure 6.1
150
200
250
300
350
400
450
pri
ce o
f w
hit
e ri
ce (
US
$/to
n)
15/06/95 14/06/96 14/06/97 15/06/98 15/06/99 15/06/2000
Figure 6.2White rice Thai 100% B Second grade
36
6 PADDY PRODUCTION ANALYSES through conceptual models
6.1 Introduction
As a result of among others the crop production survey, the survey’s on machineries and soil tillagepractices and on post harvest technologies, three conceptual models could be constructed on 1)increasing profitability, 2) increasing quantity and 3) improving quality of the rice production inNickerie. The models serve as a tool for diagnoses of problems and solutions and as such forsetting the research agenda of ADRON.
6.2 Increasing Profitability
Model 1 on increasing the profitability of rice production, see diagram on the next page, shows theproblem of high costs and low price per ton, bottlenecks, solutions and the anticipated result.Components of the model which are outside the influence of rice research at the Centre and whichare a matter of organisation of the rice sector itself and/or a matter of government policies, are leftwhite, the other components are shaded grey.
Soil tillage costs were found to have the highest share in the total production costs/ha, followed byfertilizer costs. Research is focussing on reducingthese costs, hence increasing profitability.However, it was also found that costs/ton are bestreduced by focussing on high yields/ha, Figure6.1, e.g. indicating that farmers should noteconomize on fertilizer, but focus on increasingit’s efficiency.
Across farmer fields the variation around theaverage yield of ± 4.0 ton/ha is high (CV = 29.0%), whereas the variation in production costs/hais much lower (CV = 11.4%), indicating seriousmanagement problems for many farmers, e.g.timing of operations.
The steady dropping of the world market prices ofwhite rice (shown for White rice Thai 100% Bsecond grade, Figure 6.2, to which comparedSurinam rice has a 10-15% higher price) and the
high share in production costs of the interest rate (which is up to 40%/year), have a strongimpact on profitability. If, inaddition, the street rate of the US$is much higher than the officialrate and rice export dollars have tobe exchanged for this official rate,whereas dollars for inputs are onlyavailable at the street rate,profitability will turn into heavylosses, even with very high yieldsper hectare. Also the quality of the riceproducts, processing as well asconsumption quality, affects theprice.

Model 1: Conceptual Model to increase the profitability of paddy production and processing
PROBLEM
BOTTLENECKS
SOLUTIONS
RESULTS
low profitabilitypaddy
production
high costsper ton
low priceper ton
low worldmarketprice
high costsand marginsmillers andexporters
improvequality rice
product
lowyield
per Ha
highcosts
per Ha
increaseyield per Ha
highertechnicalefficiencysoil tillage
minimumtillage
highinterest
rates
adverseexchange
rates
improvepost harvestprocedures
higher priceper ton
lower costsper ton
increasedprofitability rice
production
improvedurea
efficiency
lowerseed rate
IPM
low qualityrice
product
high costsand margins
importers
reducecosts
per Ha
see model 2
liberalizeimport
regulations
reduceinterest
rates
improvemarketingstrategies
see model 3
freeexchange
rates
37

Model 2: Conceptual Model to increase paddy yields
impure seed
3-diskplough
latesowing
Minimum tillage
weeds &insects
optimumrates
pesticidesand urea
restore chanals& constructions
precisionleveling
non-levelfields
low averageyield:
< 4.0 ton/ha
poor timing ofcultural practices
high averageyield:
> 5.5 ton/ha
inefficientuse of urea
improved varieties
pureseed
poor watermanagementat field level
IPM &alternativepesticides
improved timingcultural practices
phosphate fertilizers
medium to lowsoil phosphate
efficientwater
management
PROBLEM
BOTTLENECKS
SOLUTIONS
RESULT
POOR DRY and WETINFRASTRUCTURE
maintainingwater layer
wrong ureaand pesticide
rates
redrice
38
6.3 Increasing Yields
Model 2, see diagram to the right,on increasing paddy yields,shows bottlenecks, solutions andthe anticipated result. It showsthe infrastructure to be a keyfactor in increasing the riceproduction: If properly restoredand managed, the average yieldcould increase with 1.5 tons/hawith optimal application of thecurrent varieties and culturalpractices. In addition, the yearlycultivated area (for the year 2000estimated to be below 100%)could increase to 180% or more.Proper timing of culturalpractices within the season aswell as after sowing is stronglyaffected by the infrastructure. Butalso timely delivering of creditsand inputs (urea, pesticides,spare parts) as well as theprofessionalism of the farmerplay an important role. The role of improved varieties inincreasing the average yield liesboth in a better fit in the croppingcalendar (short durationvarieties: 100-105 days) and ahigher response to improved cropping conditions (long duration varieties: 120-125 days).

Model 3: Conceptual Model to improve the rice quality
Low qualitypaddy
low processingquality
low consumptionquality
low brownrice yield
low whiterice yield
poor taste& flavour
poorsettingsmilling
poor transport,drying andstorage
Redrice
control
variable grainlength
poor varietiesand impure
seeds
pooragronomicpractices
timelysowing
betterweed
control
discolours:- red- yellow- greenchalkinesspaddy bugcrack
high 3rdureuasplit
improvedPost HarvestTechnology
improvedvarieties
improved seeds
improved culturalpractices
high quality riceproduct
optimumharvest
date
PROBLEMS
BOTTLENECKS
poor cookingquality
SOLUTIONS
RESULT
improvedinfra-structure
lack ofstandards
39
6.4 Increasing Quality
Model 3, see diagramme to theright, on improving the quality ofpaddy and the rice products,shows quality to have multipleaspects, which are related tovariety, seed quality andagronomic practices on one handand to post harvest technology onthe other.High consumption qualities andprocessing qualities are notalways found in the same variety.A good variety (grain length, taste,flavour and cooking quality) andpure seeds are the starting pointfor high quality. Proper culturalpractices create the conditionsfor high quality yields, avoid redrice and green discolours andreduce chalkiness. Fortunatelythese conditions coincide withthose for high quantitative yields.Improved post harvest technologycan avoid yellow discolouring andcrack and can increase headyields and thus increaseprofitability of paddy processing.The lack of quality standards isalso a reason for a highly variablerice quality.

PESTS AND DISEASES OF RICE
paddy bugs
spidermites
grasshoppers
stemborers
planthoppers
fungi
slugs
caterpillars
bibitfly
thrips
larveainsectswaterweevils
snails
181716151413121110987654321 weeks: HarvestHeadingSowing
Figure 1: Pests and diseases of rice in Suriname. The coloured bar indicates the periodduring which rice is succeptible to the pest, especially during the darker coloured periods.(After P. van Halteren, 1972, SML.)
40
7 IPM ORIENTED RESEARCH AT ADRON, SURINAME
7.1 IntroductionIntegrated Pest Management (IPM) is a pest management approach by which the farmer controlsthe size of pest populations through a combination of cultural practices, such that applyingpesticides is considered as last option only.The goal of IPM is to reduce the use of pesticides. Reasons for reducing pesticide use are:
C reduction of the production costsC protection of the health of the farmer and the other members of the rural communityC environmental safety, protection of the flora and fauna and maintenance of bio diversityC to avoid possible pesticide residues in the product.
In Suriname, the costs of the use of insecticides plus fentin acetate to control snails average ±US$ 43 per hectare, which is only ± 7% of the total production costs of US$ 600/ha. Thoughacross fields the variation in these costs is high (CV = 54% for insecticides), so that costs canbe considerably higher for an individual farmer, the arguments for the development of an IPMstrategy are not primarily to reduce production costs. More important arguments lay in the fieldof environmental safety. However, in the long run, it will have serious economical consequences,if these arguments are not taken seriously as well.
7.2 Results from earlier researchEarlier research focussed on identifying and controlling economically important pests anddiseases. Up to the eighties, extremely toxic pesticides have been used as Endrin, Dieldrin andMethyl-parathion. Nowadays, the main pesticides used are monocrotophos, synthetic pyrethroidsand fentin-acetate.Pests and diseases, as well as the periods during which the rice crop in Nickerie is susceptibleto them, are summarized in Figure 1. Weather conditions and cultural practices affecting pestsare summarised in Table 1, those affecting diseases are summarised in Table 2. Both tablesshow our knowledge to be still incomplete with regard to some pests and diseases.
Table 1: Weather conditions and cultural practices affecting rice pests in Suriname (After Van Halteren, 1972,

Soerokarso et al, 1976, Anonymous, 1982)
Rank English and Scientific Weather conditions Cultural practices stimulating the pest Cultural practices suppressing the Current chemical control Efficacy chemicalname stimulating the pest pest practices control
1 Bibitfly, leafminer (= C heavy rains C keeping the field flooded after sowing C early draining the field after sowing spraying Monocrotophos or good?larvae) C high water level in the field C early sowing* KarateHydrellia deonierie C late sowing C high seed rateRambajan. C deep tracs and spots
1? Water weevils C heavy rains C keeping the field flooded after sowing C draining the field after sowing dripping Karate into the field good?Lissorhoptrus oryzophilus C pumping water from the drainage canal? drain and other low spots
before sowing
1? Stemborers C heavy rains C high Nitrogen fertilisation in 2 splits C burning straw directly after harvest, spraying with poorRupella albinella C staggered planting* C followed by dry soil tillage monocrotophosDiatraea saccharalus C synchronous planting(rare) C nitrogen in 3 splits
1 Snails C heavy rains C keeping the field flooded after sowing C early draining the field after sowing dripping Brestan (fentin goodPomacea doliodes C high water level in the field C wire mesh in the water inlet acetate) into field drain andPomacea glauca C deep tracs and spots low spots before sowing
1 Paddy bug ? C late sowing C synchronous planting spraying with good, except for lateOebalus poecilus C keeping dams etc. weed free monocrotophos or sown fields
pyrethroids
2 Long-horned grasshopper ? ? ? spraying Malathion or goodCaulopsis cuspidata monocrotophos
3 Planthoppers C high temperatures C continuous high water table C synchronous planting spraying with Malathion poor(Delphacides) Sogatodes C no winds C high plant density C N-fertilisation in 3 splits oryzicola C high air humidity C heavy N-fertilisation C normal seed density (120-150 kg/ha)
C staggered planting C drain the fieldC early use of heavy broad spectrum pesticides C avoid early pesticide applications
(e.g. curacron)
3 Armyworm C dry sunny periods C draining the field directly after sowing C flooding the field spraying Malathion or goodSpodoptera frugiperda C dry soil monocrotophos
3 Thrips C dry weather C draining the field directly after sowing C submerge the crop for 2-3 days spraying monocrotophos ?Stencheatothrips biformis
3 Leafhopper (Jassides) C more or less like C heavy grass infestation C synchronous planting spraying Malathion ?Draeculacephala clypeata planthoppers
3 Slugs C high air humidity C if in early stage: flooding the field ? ?Omalonyx felina C rainy periods C proper weed control
3 Spidermites C hot dry weather ? ? ? ?Acarina spp
3 Stembugs ? ? C synchronous planting ? ?Tibraca Limbativentris C increasing the water level in the field
* A long sowing season in an area smaller than 5x5 km often means strong population built up.

Table 2: Weather conditions and cultural practices affecting fungus diseases (After Van Halteren, 1972, Soerokarso et al, 1976, Anonymous, 1982, Webster & Gunnell, 1992).
Rank English and Scientific Weather conditions Cultural practices stimulating Cultural practices suppressing Remark Chemical controlname stimulating the fungus the fungus the fungus
2 Brown spot ? C sub-optimal urea rates C optimal urea rates more an indicator of nutritional or doubtfulHelminthosporium oryzea C excess of P-fertiliser C dry soil tillage physiological disorders than a
C root maggots C stubble burning pathological diseaseC recycling of drainage water C seed treatment?
C resistant varieties
2 Narrow brown spot ? ? C optimal urea rates id nonCercospora spp. C dry soil tillage
C stubble burningC resistant varieties
2 Sheath blight hot dry weather C high seed density C stubble burning id difficultRhizoctonia solani C high nitrogen levels C wet fallow
C weed free
? ? Hot & humid weather C high urea rates ? id doubtfulFusarium spp.
3 ? ? C seed treatment id doubtfulAlternaria padwickii
3 ? ? ? ?Curvularia spp.
3 False smut ? ? ? id doubtfulUstilaginoidea virens
3 Rice blast humid weather C high nitrogen levels C limit weed growth during fallow pathogen doubtfulPyricularia oryzea C optimal urea rates
C dry soil tillage C stubble burningC seed treatmentC resistant varieties

0%
10%
20%
30%
40%
50%
Per
cen
tag
e o
f fa
rmer
s
waterinsects
diseasesred rice
weedspaddy price
costs ureacosts pesticides
Farmers' ranking of field problems
Results from a survey, n = 470,
Beeny et al, 1996.
figure 2
0%
20%
40%
60%
80%
100%
Per
cen
tag
e o
f fa
rmer
s
Pest & diseasesWater
Weeds
Farmers' ranking of field problems
Results from a survey, n=101,Jalloh, 1999.
Figure 3
35
The economical importance of the pests may vary with the seasons and is also affected bychanges in the cropping system. Until the late seventies fields were always drained directly aftersowing and reflooded 2 weeks later. Bibitfly and waterweevils were of minor importance whereasarmyworm was one of the most serious pests at that time. Stemborers too were a minor pestand easily controlled by proper soil tillage. In the eighties many farmers shifted to keeping thefields flooded after sowing in order to control red rice. This resulted in an increased importanceof waterweevils and bibitfly, whereas armyworm practically disappeared as a pest.
7.3 Farmers’ perceptions and pesticide application behaviourSeveral surveys carried out in the nineties showed contradictory results as far as it concernsfarmers’ perceptions of the economical importance of pests and diseases, as well as of theefficacy of chemical control.
Asked to indicate the most serious field problems (Beeny et al, 1996), about 40% of the farmersmentioned insects (Figure 2). The costs of pesticides, however, was for only 5% of the farmersa problem.
C Are pesticides not effective, or do farmers not know how and when to apply?
The only rice diseases which have been observed in Suriname are fungi, which are rarely ofeconomic importance. Still, 25% of the farmers regard diseases as a serious field problem.
C Don’t farmers make any difference between diseases and insects?
Though water control is the main field problemfor 50% of the farmers, still the weed problemis considered a problem by only a few percentof the farmers. A survey by Jalloh (1999) gavesimilar results, Figure 3.
Farmers interviewed during a crop productionsurvey (Wildschut, 1998) claimed that themost frequently observed and chemicallycontrolled pests are paddy bug (on 40% of thefields) and stemborers (also on 40% of thefields), followed by waterweevils (30%) andbibitfly (25%), see Figure 4. According to VanHalteren (1972), however, “Chemical control isnot necessary; climatic conditions, dry soil

0%
10%
20%
30%
40%
50%
Per
cen
tag
e o
f fi
eld
s
paddy bugstemborer
waterweevilbibitfly
insectscaterpillars
grasshopperred disease
planthopper
pest
Figure 4
Results from asurvey, n = 184
0%
5%
10%
15%
20%
25%
30%
35%
Per
cen
tag
e o
f fi
eld
s
-2 -1 0 1 2 3 4 5 6 7 8 9 10 11 12 13 14 15 16 17 18
karate
monocrotophos
Sowing Heading Harvest
Dripping
Spraying
Figure 5
Weeks after sowing
Results from asurvey, n=390
36
tillage, burning of the stubble, and parasites keep stemborer populations below the threshold ofeconomic importance”.On almost 20% of the fields farmers spray against insects which are not known to them. Thementioned “red disease” sometimes observed in the early stages of plant growth, is in fact anutritional disorder by which phosphate uptake is temporarily inhibited on fields where thesubmergence period before sowing was extremely short, related to toxic organic acids (imperfectdecomposition of weeds) and/or Fe-toxicity.
The timing of the application of the most frequently used insecticides is presented in Figure 5.Farmers claim to control waterweevils effectively by dripping Karate (a pyrethroid) in the field
drain and other low spots, several days around sowing. Does this practice indeed preventwaterweevils and subsequently rootmaggots? Fact is that rootmaggots damage is seen only veryrarely.
Early pests are controlled by both monocrotophos (Luxafos, Azodrin or Nuvacron) and Karate,late pests mainly by monocrotophos.
Other findings of the survey regarding the actual use of pesticides:
C Brestan (fentin acetate) is used on all fields.C 13% of the fields are not sprayed at all, 28% are sprayed only once, 32% are sprayed twice,

37
17% are sprayed trice and 11% are sprayed four or more times.C Other used insecticides are Twin (Endosulfan + Dimethoate) on 15% of the fields, and
Malathion on 9% of the fields.C 56% of the fields are sprayed against only one pest, 44% against two ore more.C On 90% of the fields the rate of monocrotophos is less than the recommended rate of 500 ml
Luxafos, Azodrin or Nuvacron/ha per application, on 30% the rate is less than 200 ml/ha.Differences in yield were not observed.
C Often, farmers try first a low rate (in order to “chase the insects away”), and if the insects arestill there, subsequently apply a higher rate (“to kill the insects”).
7.4 IPM-trialsIn the second season of 1997 (97B, Table 3) ADRON started with IPM trials in farmers’ fields inorder to monitoring pest populations and economical damage. Later, also the damage of fungusdiseases was monitored. In 2000 the IPM programme has been extended with the installation ofinsect/spider traps for monitoring the total insect/spider populations (e.g. pest, predator, parasiteand detrifore populations).
Table 3: IPM trials
Factors Levels Treatmentsnumber of farmer fields per season
97B 98A 98B 99A 99B 0 total
furadan 2 2 5 10 15
furadanfungicide
22 4 7 10 - 7 24
While the analyses of the IPM trials is still in progress, yields did not differ significantly so far.
7.5 Future IPM ResearchThe various surveys tell us that often farmers’ spraying behaviour is unrealistic. Most spraypreventively and against anything that flies. For some insects one can ask if they are not animaginary pest (e.g. bibitfly) and for some pesticide applications if it is really effective (e.g.dripping of Karate against water weevils).Farmers avoid risks and as the costs of pesticides relative to the total production costs are lowthey choose for the easy way. However, future developments on the world market should forcethem to reduce the use of pesticides, especially the use of monocrotophos and fentin acetate.Before that time, ADRON has to be ready with the development of suitable IPM procedures andstrategies. In Asian countries like Indonesia successful IPM approaches have been developed. These arenow, with the help of FAO,being adopted in manycountries worldwide. Thesuccessful IPM strategiesare: the Ecology BasedApproach (EBA) andFarmers Field Schools(FFS). Basic principle of theEBA is “conserving naturalpredators and alternativeprey”, see diagram below(FAO, 2000). FFS is aparticipatory (research)approach which could be ofparticular value forSuriname.

38
Literature
Anonymous, 1982. POR, Bestrijding van ziekten en plagen, Suriname.
Beeny, J., A in 't Veld, K. Kartosoewito, K. Raghoebarsing, A.L. Zalmijn and V. Mol, 1996.Suriname; Agricultural Mechanization Sub-sector Review and Investment Requirements.Part II: Main Report and Annexes. Rome, FAO, Agricultural Engineering Branch, DraftReport TCP/SUR/4452, 29 pp. + annexes.
FAO, 2000. FAO Community IPM:”Concepts and Cases”,http://www.comunityipm.org/ecology01.html
Jalloh, A.K. (1999). Sources of agricultural information in rice farming in a district in Suriname.Msc Thesis, Larenstein International Agricultural College Velp, The Netherlands.
Van Halteren, P., 1972. “Pests and diseases of rice in Suriname”. SML/LVV, Suriname
Webster, R. K. &. Gunnell, P. S, 1992. “Compendium of Rice Diseases”. Univ. of Calnifornia,Davis.
Wildschut, J., 1998. “Vergelijkend Veldonderzoek”, Technisch Rapport Agronomie. ADRONRap. no. 6, SNRI.

39
Summary IPM Strategy Development(Ir. K E Neering, short term consultant IPM)
Crop protection in Suriname is still based almost exclusively on pesticide application. As far asknown, no research on pests in rice has been conducted since 1974. Developments in the fieldof rice crop protection in other areas of the world, especially regarding development of IPM andits extension to farmers by the farmers' field school approach, have not or hardly reachedSuriname. Since 1974, rice cultivation methods in Suriname changed, resulting in a reported shiftin relative importance of different pests. As information available from the sixties and seventiesmay not be applicable anymore, the economic impact of yield reducing organisms at presentshould be assessed again. A number of suggestions for research were given to the IPMspecialist of ADRON. It was advised to focus research more on performance of the plant or cropthan on that of the pest populations. The research may lead to a better understanding of rice-fieldecology and result in a more ecologically oriented crop protection as alternative for the presentcalendar-based chemical control. For easy reference, a literature database with bibliographicinformation and abstracts on crop protection in rice in the America's, published over the last 30years, was compiled and left with ADRON.As information and knowledge of (potential) yield reducing biotic factors was found to beincomplete, a rather large part of the consultancy was used to compile an overview of these andtheir natural enemies or control mechanisms.Natural enemies were found to be numerous. The types of organisms were found to be highlycomparable to the S-E Asian ones. For that reason, the extensive information on natural controlprocesses, developed in Asia could be applied in Suriname after making some minoradjustments only. Inventory and impact assessment of natural enemies in Suriname will beincluded in the work programme of ADRON.In order to achieve more ecologically and less calendar-based chemically oriented cropprotection in rice production in Suriname (and maybe in Guyana), it will be tried to find donorfunding for an adult training programme for rice producers. For small scale producers, thisprogramme could best focus on the "farmers' field school" approach. For large scale producers,the system of pest-scouting could be more appropriate under condition that the scouts are ableto relate their advise also to the presence of natural enemies.

40
9 The role of a 100-days variety versus the current 120-day variety Eloni
9.1 Introduction
One of ADRON’s breeding objectives is to develop a short duration variety (100-105 days) withat least the same yield potential as the current variety Eloni (120-125 days).Theoretically, such a 100-day variety could have the following advantages:
C Reduced water useC Correction of the cropping calendar. With two crops per year, each of 120-125 days, about 55-
60 days for soil tillage are left between crops. Normally this should be enough, but due to apoor dry and wet infrastructure, it is found that 40% of the fields are sown more than 60 daysafter harvest (see also chapter 5). Late sown fields have a lower yield (chapter 1), but sowinga 100-days variety should result in:S increased chance that the harvest of late sown fields is in the dry period.S increased chance that the harvest can be followed by dry tillage with the rome-type disc
ploughs.S reduced exposure to pady bug through escaping high population build up (however, not to
bibitfly).S higher total solar radiation during the generative phase.
C Two in stead of three urea top-dressings will be sufficient.C Stem boorers have less time to complete their life cycle.
A possible disadvantage is a lower potential yield than for Eloni and reduced recuperation frominsect leave damage during the vegetative stage.Other characteristics as chalkiness, head yield or resistance to blast are not typically related togrowth duration.
9.2 ADRON-102
Through selection ADRON came to several lines with a growth duration of 100-105 days whichsince 1996 are compared to Eloni in on-farm variety trials. Most often tested varieties areADRON-101, -102 and -107, see Table 1.
Table 1: Number of harvested plots per season from on-farm variety trials.
Season Varieties ADRON's lines:
Eloni Groveni 101 102 107 108 110 19 216 220
96B 4 4 5 4 - - - 3 - 4 97A 7 7 9 9 - - - 10 - 10 97B 11 11 14 14 12 - - 15 14 14 98A 8 - 9 9 9 8 9 - - -98B 7 - 6 7 8 8 7 - - -99A 14 - 13 13 14 - - - - -
Total 51 22 56 56 43 16 16 28 14 28
The average padie yields of these varieties compared to Eloni are summarised in Figure 1. Yielddifferences with Eloni are not significant. Variation in yields across farmers fields is high. Thesame questionnaire used for data collection on cultural practices in the Crop Production Surveywas used for the on-farm trials. From these data it could be depicted that the yield differencebetween ADRON-102 and Eloni was positive on late sown fields, Figure 2.

2.5
3
3.5
4 A
vera
ge p
addy
yie
ld (
ton/
ha)
Eloni 101 102 107
season 96B to 99A season 97B to 99A
Figure 1
-3000
-2000
-1000
0
1000
2000
3000
diff
eren
ce A
DR
ON
102
- E
loni
(kg
/ha)
14/05 24/05 03/06 13/06 23/06 03/07 13/07 date of sowing
R = 0.425, p = 0.004, n = 45 Figure 2
41
9.3 Profitability
Compared to Eloni, ADRON-102 yields at best 1.5 ton/ha more on very late sown fields. Ontimely sown fields Eloni yields at best 1 ton/ha more than ADRON-102, Figure 2. Based on thisrelation, as well as on the relation between yields/ha and costs/ton (Figure 2, Chapter 6), anestimation can be made of the profits or losses for the entire rice area in Nickerie if all fields aresown with ADRON-102. Other estimations are 1) if Eloni is replaced by “Eloni+”, a future 120-125days variety giving higher yields than Eloni on fields where Eloni yields > 4 tons/ha (ADRON’ssecond breeding objective) and 2) if Eloni is replaced by ADRON-102 only on late sown fieldsand replaced by Eloni+ on timely sown fields. These estimations are repeated for the conditionthat the infrastructure is repaired and maintained (which increases the crop index up to 1.8 andreduces the number of late sown fields), Table 2.These estimations show that in any scenario Eloni+ gives higher profits than ADRON-102. Onlythe combination of ADRON-102 on late sown fields and Eloni+ on timely sown fields avoidslosses in the current condition. The interest of a 100-day variety like ADRON-102 is therefor inthe field of reducing risks to losses, rather than increasing total profitability.
Table 2: Estimated profits or losses ( x US$ 1.000.000,-) at different paddy prices, for the entire rice areain Nickerie of 50.000 ha, depending variety, infrastructure and reduced costs through minimum tillage.
Conditions VarietyPaddy price (US$/ton)
US$ 100,- US$ 140,- US$ 175,-
Current conditions(Crop Index = 1.4)
Eloni -4,8 7,1 17,2
100-days variety -3,4 8,8 19,2
Eloni\ -2,3 11,3 22,7
100-d & Eloni\ 3 17,6 29,5
Improved infrastructure(Crop Index = 1.8)
Eloni 5,7 25,4 42,6
100-days variety -2 17,3 32,2
Eloni\ 19,9 45,2 65,4
Incl. Minnimum tillage Eloni\ 29,9 55,2 72,7
The effect of decreasing paddy prices on the percentage of fields producing at a loss, undercurrent (white lines) and improved (black lines) cropping conditions, is also demonstrated byFigure 3.
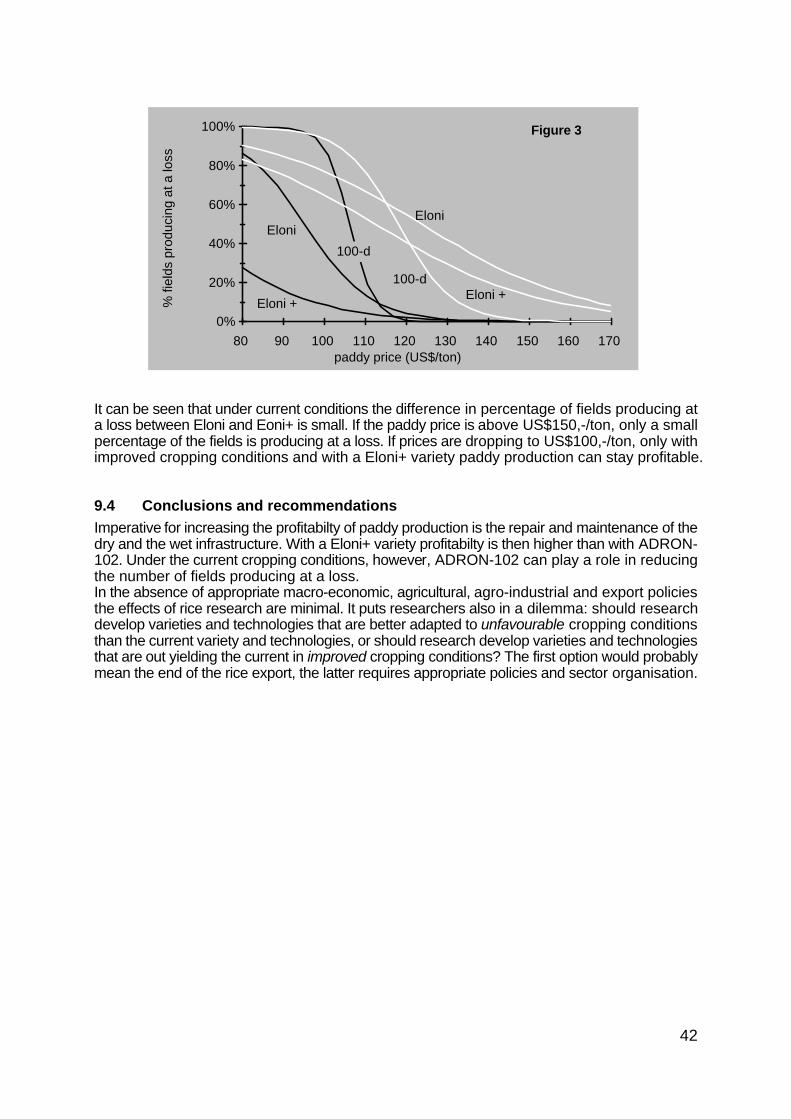
0%
20%
40%
60%
80%
100%
% fi
elds
pro
duci
ng a
t a lo
ss
80 90 100 110 120 130 140 150 160 170 paddy price (US$/ton)
Eloni +
Eloni
100-d
Eloni
Eloni +
100-d
Figure 3
42
It can be seen that under current conditions the difference in percentage of fields producing ata loss between Eloni and Eoni+ is small. If the paddy price is above US$150,-/ton, only a smallpercentage of the fields is producing at a loss. If prices are dropping to US$100,-/ton, only withimproved cropping conditions and with a Eloni+ variety paddy production can stay profitable.
9.4 Conclusions and recommendations
Imperative for increasing the profitabilty of paddy production is the repair and maintenance of thedry and the wet infrastructure. With a Eloni+ variety profitabilty is then higher than with ADRON-102. Under the current cropping conditions, however, ADRON-102 can play a role in reducingthe number of fields producing at a loss.In the absence of appropriate macro-economic, agricultural, agro-industrial and export policiesthe effects of rice research are minimal. It puts researchers also in a dilemma: should researchdevelop varieties and technologies that are better adapted to unfavourable cropping conditionsthan the current variety and technologies, or should research develop varieties and technologiesthat are out yielding the current in improved cropping conditions? The first option would probablymean the end of the rice export, the latter requires appropriate policies and sector organisation.

43
10 Weed control in field ditches and irrigation- and drainage canals
One of the main problems in the rice production in Nickerie is the poor wet infrastructure. Fieldditches and irrigation- and drainage canals are most of the time full of weeds. The high costs ofweed mechanical control with a drag line,± US$ 430/km, single bank, are the major bottleneck,reason for which research on cheaper methods are important.
An alternative is weed control with the herbicide Glyphosate. This herbicide is relatively safe andbio-degradation is fast. ADRON tested chemical control first on a small scale (see first picture). Subsequently this method was applied, in cooperation with MCP, in the Van Wouw canal (12,5km length, 25 litres of glyphosate, both banks). The costs were around US$15/km, single bank.More than 55 days after the application Glyphosate the canal was still completely free of weeds(see 2nd picture).
Mechanical weed control should be done twice a year, whereas chemical maintenance 3-4 timesa year keeps the canals weed free. Costs per year are around US$ 800/km and US$ 45-60/km(single bank) respectively. At present, chemical weed control in canals and field ditches is beingadopted by Public Works and farmers.