Embed Size (px)
Citation preview

8/4/2019 Tavares_563_p1287
http://slidepdf.com/reader/full/tavares563p1287 1/11

8/4/2019 Tavares_563_p1287
http://slidepdf.com/reader/full/tavares563p1287 2/11
L TAVARES AND R CARVALHO
XXV INTERNATIONAL MINERAL PROCESSING CONGRESS (IMPC) 2010 PROCEEDINGS / BRISBANE, QLD, AUSTRALIA / 6 - 10 SEPTEMBER 2010 1288
the relatively crude models, available at the time, that were used to describe single particle andparticle bed breakage. Nevertheless, this important work set the background for the development of a mechanistic description of ball mills, which is believed will be the basis of a robust mill scale-upapproach in the future.
The paper describes a model of grinding in a batch mill that combines data from single-particle breakage tests to results from simulations of media motion using the discrete element method.
While also based on the population balance model, the model allows describing explicitly a numberof variables such as ball size, mill hold-up and diameter, as well as liner configuration with no fittingto batch grinding data required. The model attempts to overcome the limitations of the ‘conceptualmodel’ proposed by King and Bourgeois (1993) by taking into account the distribution of stressingenergies in the mill, the distribution of fracture energies of particles in the charge, describing breakage by impacts from media elements producing catastrophic (body) breakage, surface breakageand weakening that particles undergo due to repeated impacts.
A MICROSCALE LOOK AT BALL MILLING
Although the traditional population balance model describes what happens in a mill as a continuum, with the breakage processes taking place continuously, breakage of particles is essentially discrete
(King and Bourgeois, 1993). In a ball mill, these breakage events occur when particles are stressed between media elements which are in relative motion to each other. Several particles may be involvedin a single stressing event, and a particle may break or not, depending on the amount of energy thatit absorbs during this event. If the amount of energy available for the particle in a stressing eventis insuf ficient to cause fracture (body breakage), it may only suffer surface breakage (abrasion) and become damaged, requiring a smaller amount of energy to break in a future stressing event. If theamount of energy available is suf ficient to cause fracture, a distribution of progeny fragments will beproduced, which may or may not be further broken, depending on the stressing energy.
From this brief description it is evident that a quantitative description of ball milling at a microscalelevel requires detailed knowledge of the mechanical environment in the mill, as well as the response of the particulate material contained in assemblies to the applied stresses. The mechanical environment
is characterised by the magnitude and frequency of the collision events between grinding media andalso by the geometry of the contacts, which determines the volume of material captured in eachstressing event. Relevant material properties that determine the outcome of breakage events includethe minimum amount of energy required to produce primary body fracture (also called particlefracture energy), the material response to stresses that have insuf ficient magnitude to produce body breakage, the degree of multiple breakage when parent particles and their progeny are stressed as aresult of a collision event of a given magnitude, and surface breakage.
In order to predict grinding results using this microscale approach it is necessary to combine thequantitative description of the mechanical environment in the mill to models that describe thematerial response to the stresses. In the case of continuous mills, an additional description of thesolids or slurry transport through the vessel also becomes necessary. These different componentsmust be appropriately combined in the form of a process model, which will allow establishing alink between the microscale phenomena that occur in the ball mill to measurable outcomes of thecomminution process, such as product size distribution, product specific surface area and specificenergy consumption.
MECHANICAL ENVIRONMENT
Breakage events occur as the results of the linear and angular motion of balls in relation to eachother, resulting in contacts that vary from head-on collisions to the shearing action of balls rollingover each other inside the charge. In this context, information of the mechanical environment that isrelevant to describing ball milling at a microscale level include the type, frequency and magnitude of collision events involving grinding media. In the past, insights into these could only be gained throughextremely careful and tedious experiments (Yashima et al , 1988; Powell and Nurick, 1996), through
which the history of collisions of individual balls was followed over a period of time. Fortunately, sincethe 1990s it has been possible to simulate the motion of media in ball mills through the application of the discrete element method – DEM (Mishra and Rajamani, 1992). DEM is a simulation tool whichuses Newtonian physics with appropriate contact models coupled to powerful computational tools

8/4/2019 Tavares_563_p1287
http://slidepdf.com/reader/full/tavares563p1287 3/11
XXV INTERNATIONAL MINERAL PROCESSING CONGRESS (IMPC) 2010 PROCEEDINGS / BRISBANE, QLD, AUSTRALIA / 6 - 10 SEPTEMBER 2010
A MECHANISTIC MODEL OF BATCH GRINDING IN BALL MILLS
1289
that allows predicting the magnitude and frequency of collisions that occur in the mill of a givengeometry that is operating under certain conditions.
In spite of its wide recognition as a tool for describing media motion in mills, with applicationssuch as the analysis of charge motion for improved plant operation, power draw prediction (Mishra,
2003) and estimating liner wear (Cleary, 1998), controversy still exists on how DEM can be moreappropriately used to predict breakage in mills (Powell and McBride, 2006). In one extreme, someresearchers have suggested that, when coupled to tools such as the discrete grain breakage model(DGB), DEM could be used in the complete description of comminution in media mills, with both
particles and grinding media described in the discrete simulations (Herbst, 2004; Herbst and Potapov,
2004). Although promising, this approach is not yet realistic, given the enormous computing powerrequired to keep track of the large population of particles generated in each breakage event, andalso due to the uncertainties associated to the fidelity of the DGB model in describing quantitatively
particle breakage. An alternative and more realistic approach is to use DEM just to estimate thedistribution of collision energies in the mill, leaving the simulation of breakage to be conductedusing an appropriate model that integrates both particle breakage models and the collision energy
distribution. Although it requires considerably less computing power, this approach has challengesof its own. For instance, in this approach DEM considers the particulate phase as a continuum inthe mill and their presence is only account for indirectly, through the use of appropriate contactparameter values, which are certainly different from those used to describe steel-on-steel contacts.
Further, since particles do not appear explicitly in the DEM simulations, it becomes necessary to
estimate the amount of material that is captured in each stressing event and also how the collisionenergy is shared among particles involved in each impact. This later approach is the one chosen inthe present work to simulate the ball mill.
Typical results from DEM media motion simulations of a batch laboratory ball mill conducted usingthe software EDEM (DEM Solutions, Edinburgh, UK) are presented in Figure 1. The no slip Hertz-Mindlin contact law (DEM Solutions, 2009) has been used to describe the contacts among grindingmedia and between them and the mill shell. A summary of the constants used to describe ball-ball and ball-wall contacts in DEM is presented in Table 1. The figure shows that, for the conditions studied,the shear component has a lower magnitude than the normal component. It also shows that theproportion of collision events of magnitude above a few millijoules is comparatively small. Figure 1also shows that the frequency of collision events of negligible magnitude (below about 0.01 mJ) is
significant, in particular when considering the shear component. In the present work it is consideredthat the shear component has a negligible contribution to grinding in a ball mill and also that normalcollisions with magnitude below 0.1 mJ can be neglected, since they may be considered an artefact of the DEM simulations. With these assumptions, the average number of collisions (ω) in the test mill
10-5 10-4 10-3 10-2 10-1 100 101 02
Collision energy (mJ)
0
100
200
300
400
500
C u m u l a t i v e n u m b e r o f c o l l i s i o
n s p e r s e c o n d ( x 1 0 ³
Normal component
Shear comp nent
FIG 1 - DEM simulations o a batch mill (0.3 m diameter, 0.3 m length, operating at 67 per cent o critical speed with 25 mm alloy steel balls
at 30 per cent mill flling).

8/4/2019 Tavares_563_p1287
http://slidepdf.com/reader/full/tavares563p1287 4/11
L TAVARES AND R CARVALHO
XXV INTERNATIONAL MINERAL PROCESSING CONGRESS (IMPC) 2010 PROCEEDINGS / BRISBANE, QLD, AUSTRALIA / 6 - 10 SEPTEMBER 2010 1290
simulated in Figure 1 becomes about 230 000 and the cumulative distribution of collision energiesmay be described by a lower-truncated Rosin-Rammler distribution, given by:
P E
) E exp.
= − −−⎛
⎝
⎞
⎠
⎡
⎣⎢
⎤
⎦⎥⎥
0 0001
0 004
7. 7
(1)
where E is the collision energy, given in Joules.
PARTICLE BREAKAGE CHARACTERISTICS
Once the mechanical environment has been appropriately described, in order to model the ball millit then becomes necessary to understand how the energy available from the collisions between mediaelements and between them and the mill liners produce breakage. Recognising that particles are notstressed individually, but nearly always in assemblies inside the mill, it is evident that a microscalemodel of the ball mill will require some description of the response of particles to stresses when they are in a bed. The response of material to stressing in a bed will be co-determined by the materialcharacteristics and by the nature of the contact. For instance, the shape and size of the grinding mediaand the slurry viscosity will directly influence the amount of material caught in each stressing eventand also how the available kinetic energy from each collision will be shared among particles containedin the bed. Probably overwhelmed by the complexity in describing the details of modelling breakage
of particle beds, some researchers (Datta and Rajamani, 2002) tackled the problem by consideringthat the amount of material broken and the energy-specific size distribution are material propertiesand should be characterised experimentally. Recognising that it would not be feasible to cover withexperiments all possible combinations encountered when particles are stressed in a bed, the present work proposes to describe the material response in a particle bed as a function of more fundamentalsingle-particle breakage characteristics. This approach inevitably requires that descriptions of theinteraction of particles in assemblies and grinding media, and that detailed descriptions of theresponse of individual particles to stressing, are also available. Quantitative descriptions of theresponse of individual particles to different modes of application of stresses are described as follows.
It has been widely demonstrated (Tavares and King, 1998) that particles require a minimumamount of energy in order to break catastrophically. This mode of breakage, more appropriately called body breakage, is characterised by this energy, called particle fracture energy, which varies
from particle to particle, depending on their individual size, shape, flaw structure and composition. A great deal of data exists that demonstrates that the distribution of fracture energies of particles of a given material contained in a narrow size fraction can be well described using the upper-truncatedlognormal distribution, given by (Tavares and King, 2002):
F E E
i
i , E )
,0
1
2 2
50
2= +1
⎞
⎠
⎡
⎣
⎤
⎦
⎥rf ln
σ ⎥⎥ (2)
where:
E E E
E E i
*ax,
max,
= (3)
where E 50,i
is the median particle fracture energy, σ i 2 is the variance and E
max ,i is the upper truncation
value of the distribution. A comparison between data from single-particle impact-breakage tests
Poisson’s ratio 0.3
Shear modulus 7 x 10¹⁰ Pa
Density 7800 kg/m3
Coe cient o restitution 0.5
Coe cient o static riction 0.5
Coe cient o rolling riction 0.01
TABLE 1
Parameters used in the 3D-DEM simulations.
8/4/2019 Tavares_563_p1287
http://slidepdf.com/reader/full/tavares563p1287 5/11
XXV INTERNATIONAL MINERAL PROCESSING CONGRESS (IMPC) 2010 PROCEEDINGS / BRISBANE, QLD, AUSTRALIA / 6 - 10 SEPTEMBER 2010
A MECHANISTIC MODEL OF BATCH GRINDING IN BALL MILLS
1291
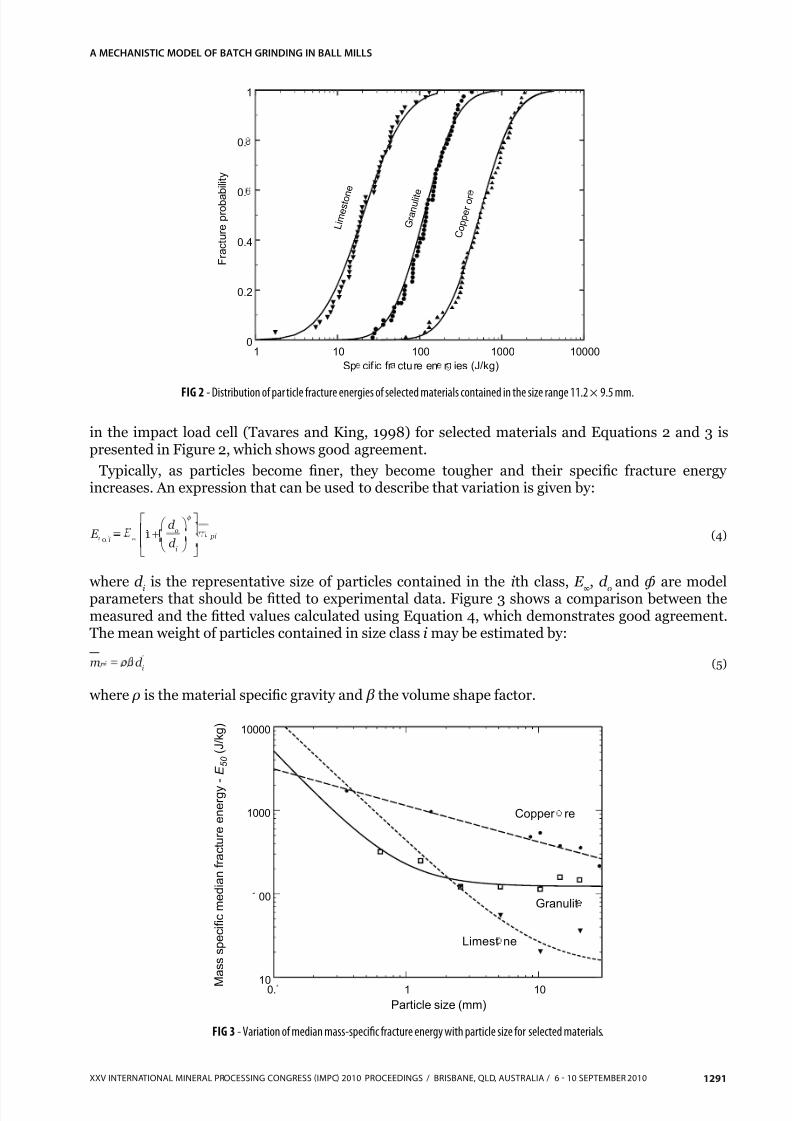
in the impact load cell (Tavares and King, 1998) for selected materials and Equations 2 and 3 ispresented in Figure 2, which shows good agreement.
Typically, as particles become finer, they become tougher and their specific fracture energy increases. An expression that can be used to describe that variation is given by:
E d
d i
o
i
pi 0,
+1⎛
⎝
⎞
⎠
⎡
⎣
⎤
⎦
⎥φ
(4)
where d i is the representative size of particles contained in the i th class, E ∞, d o and ф are modelparameters that should be fitted to experimental data. Figure 3 shows a comparison between themeasured and the fitted values calculated using Equation 4, which demonstrates good agreement.The mean weight of particles contained in size class i may be estimated by:
m d i (5)
where ρ is the material specific gravity and β the volume shape factor.
0. 1 10
Particle size (mm)
10
00
1000
10000
M
a s s s p e c i f i c m e d i a n f r a c t u r e e n e r g y
- E 5 0
( J / k g )
Granulit
Copper re
Limest ne
FIG 3 - Variation o median mass-specifc racture energy with particle size or selected materials.
1 10 100 1000 10000
Sp cif ic fr cture en r ies (J/kg)
0
0.2
0.4
0.
0.
1
F r a c t u r e p r o b a
b i l i t y
G r a n u l i t
e
L i m
e s t o n
e
C o p p e r o r
FIG 2 - Distribution o particle racture energies o selected materials contained in the size range 11.2 × 9.5 mm.

8/4/2019 Tavares_563_p1287
http://slidepdf.com/reader/full/tavares563p1287 6/11
L TAVARES AND R CARVALHO
XXV INTERNATIONAL MINERAL PROCESSING CONGRESS (IMPC) 2010 PROCEEDINGS / BRISBANE, QLD, AUSTRALIA / 6 - 10 SEPTEMBER 2010 1292
The upper truncation parameter E max ,i
of the distribution of particle fracture energies (Equation 2)also varies with size and may also be fitted to an expression analogous to Equation 4. For simplicity,in the present work it has been calculated by E
max ,i = η E
50,i , where η is a constant that should be
determined using impact-fracture data. In addition, σ i 2 is often relatively constant with particle size,
so that it is here considered equal to σ 2.
The importance of Equations 2 and 3 lie in the fact that an equivalence exists between the distribution
of particle fracture energies and the fracture probability. As a result, they allow to determine theproportion of particles that will break when all particles in the population are stressed with an energy E . Whenever particles are stressed with an insuf ficient amount of energy to cause body breakage, they will remain unbroken, but their fracture energies will be reduced, due to accrued damage. A model thatdescribes this phenomenon has been proposed by Tavares and King (2002) and is given by:
F F E
F n
n n
n
+ =−
⎡
⎣⎢
⎤
⎦⎥1 1
) E E ( D−1 ( F )
) E (6)
and:
D E
E k=
⎡
⎣⎢
⎤
⎦⎥2
2
5
γ
) D−1( )+2 − (7)
where F n( E
k) is the proportion of particles broken in the nth impact from the application of an impact
energy E k
and E is the fracture energy of the particle that remained unbroken after the nth impact. D is the amount of damage sustained by that particle and γ is the damage accumulation coef ficient, which characterises the amenability of the material to damage by repeated impacts.
When the collision energy is higher than the fracture energy of the particle, then the particle will break, generating progeny fragments. This distribution of fragments is described using the single-particle cumulative breakage (appearance) function, which is well characterised using the incomplete beta function, given by:
t
x dx
x
n
n,t
1
1
1100α , =
−
−−
∫ 1
0
1010
dx /
∫ (8)
where each t n
is the percentage passing in a d 0/n size, in which d
0is particle original size. α
n, e and β
n
are parameters that must be fit to experimental data. The agreement between Equation 8 and single-particle breakage data is demonstrated in Figure 4.
0 20 40 60t10
(%)
40
0
0
100
t n ( % )
t1.2
t1.5
t2
t4
t25
t50
t75
FIG 4 - Comparison o appearance unction values to the ft to the incomplete beta unction or copper ore (Equation 8).

8/4/2019 Tavares_563_p1287
http://slidepdf.com/reader/full/tavares563p1287 7/11
XXV INTERNATIONAL MINERAL PROCESSING CONGRESS (IMPC) 2010 PROCEEDINGS / BRISBANE, QLD, AUSTRALIA / 6 - 10 SEPTEMBER 2010
A MECHANISTIC MODEL OF BATCH GRINDING IN BALL MILLS
1293
The single-particle breakage function is then calculated in its cumulative form ( Bij ) by interpolating
the t 10
versus t n
data. The relationship of the parameter t 10
for particles contained in size class j withimpact and fracture energy is calculated by:
t bE
E j
10
50
+1 − ′⎞
⎠
⎡
⎣
⎤
⎦⎥exp (9)
where A and b΄ are model parameters and E 50b, j is the median particle fracture energy of the particlesthat are broken as a result of the impact of magnitude E . When the magnitude of the impacts ishigher than the strength of the toughest particle, then E
50b, j = E
50, j , otherwise it should be calculated
numerically (Tavares and Carvalho, 2009).
Finally, surface breakage is modelled using data from the JKMRC tumbling test (Napier-Munn et al , 1996) considering a simple approach, by assuming that it follows first-order kinetics. Its breakagefunction in the cumulative form is given by A
ij = (d
i /d
A) λ .The set of parameters that characterise the
breakage behaviour of the materials studied is presented in Table 2. For the materials studied thesurface breakage distribution function parameters values were set to d
A = 0.25 mm and λ = 0.31.
BATCH GRINDING MODEL
The batch grinding process equation can be derived from a more general formulation of the traditionalpopulation balance model applied to the microscale description of size reduction processes (Carvalhoand Tavares, 2009). The equation that describes the rates of changes in mass of particles containedin size class i is:
dw
t M D A Ai
s s
( )t )t )t )t = − − +t +
ω (10)
where M is the mill hold-up. wi (t ) is the mass fraction of particles contained in class i in the mill and
ω is the frequency of stressing events in the comminution machine. Functions A and D represent therate of appearance and disappearance of material in class i due to fracture, being defined in Table 3, whereas subscripts b and s stand for body and surface breakage mechanisms, respectively.
In the equations listed in Table 3, p( E ) is the distribution of stressing energies E in the mill, m j
is the
mass of particles contained in size class j captured in each stressing event and p(e) is the function thatrepresents the energy split among these particles. a
ij and b
ij are the breakage functions in density form,
corresponding to the mechanisms of surface and body breakage, respectively, the later dependent onstressing energy (Tavares and Carvalho, 2009). κ is the first order surface breakage rate. The density distribution of stressing energies in the p( E ) is calculated from the cumulative distribution, from p( E ) = dP ( E )/dE . The product eE is the fraction of the impact energy that is absorbed by each particlecaptured in an impact event.
Equation 10 should be solved simultaneously with the equation that describes how the fractureprobability distribution of particles contained in each size class varies with time, which may becalculated by:
F t t
G F E E
G i
i i
i , E
* ( t t ( I F )t
= + I H i
(11)
where the fracture probability distribution of the original material F i ( E , 0) is well described using the
upper-truncated lognormal distribution, given in Equations 2 and 3.
Materialρ
(g/cm3)
Impact breakage Abrasion
E ∞
(J/kg)d
o
(mm)ф(-)
σ (-)
η(-)
A(%)
b´ (-)
γ (-)
κ (%/s)
Limestone 2.73 13.4 10.0 1.50 0.80 4.0 56.0 0.023 5.4 0.037
Granulite 2.80 123.0 0.91 1.68 0.89 4.0 47.5 0.027 5.0 0.004
Copper ore 2.93 12.38 26 730 0.44 0.80 4.0 51.5 0.028 4.5 0.011
TABLE 2
Summary o parameters determined experimentally and used in the simulations.

8/4/2019 Tavares_563_p1287
http://slidepdf.com/reader/full/tavares563p1287 8/11
L TAVARES AND R CARVALHO
XXV INTERNATIONAL MINERAL PROCESSING CONGRESS (IMPC) 2010 PROCEEDINGS / BRISBANE, QLD, AUSTRALIA / 6 - 10 SEPTEMBER 2010 1294
F i ( E , t ) is the distribution of fracture energies of the material that did not suffer any impact event
during the time interval, whereas F i *( E ,t + ∆t ) is the distribution of fracture energies of the particles
that were captured in an impact event, but which did not fracture, being given by:
F t t
p F F t
F eE i
* , E
) E E D eE
=
−
−1k
E
k
k
E
p edE
p E
i
i
, )t )e
E
*
*
⎡
⎣∫ ∫
∫
1
0 (12)
and:
DeE
E k= ⎡
⎣⎢ ⎤
⎦⎥
2 5
γ
) D−1
( )+2 −(13)
where E i * is the maximum fracture energy of particles contained in class i , which is equal to E
max,i
in the first time interval and F i ( E
i *) = 1 as comminution progresses (Tavares and Carvalho, 2009).
The model is able to account for the fact that particles that are stressed but that do not fracture in a
stressing event, may become progressively weaker. The various terms in Equation 11 are given by:
G t
w eE t )t ( F )t =∞
ω m e e E
0
1
(14)
which is the fraction of material in the class that has been damaged but remained in the original size
range, and:
H t
m t eE p ei j j ij
=∞
∫ ω )t E E eE F )t )) e dE A
s
j
i
+⎡
⎣
⎢⎤
⎦
⎥= 0
1
1
(15)
which is the fraction of material that appeared due to body and surface breakage, and:
I M
t m p dei
)t )t
)t ( E ( E −=
⎞
⎠ ω
0
(16)
which is the fraction of material that was not captured in the time interval.
Unfortunately, no generally well-accepted functions are available to calculate mi ( E ) and p(e).
The mass of material captured mi ( E ) in the active breakage zone in each collision event is probably
Breakage mode Rate o appearance ( A)
Body (b) A w m eE j
i
)t )t ,==
− ∞
∑1
0
t t e e E ) )
0
Surace (s) A s j
j
i
)t −==
−1
0
j j t p d d ( ,eE (
0
Rate o disappearance (D)
Body (b) D j
i
)t =
−
1 0
,(( (t e d d
0
1
Surace (s) D eE e edE s j )t )t ] )
∞
0
1
TABLE 3
Defnition o terms in Equation 10.

8/4/2019 Tavares_563_p1287
http://slidepdf.com/reader/full/tavares563p1287 9/11
XXV INTERNATIONAL MINERAL PROCESSING CONGRESS (IMPC) 2010 PROCEEDINGS / BRISBANE, QLD, AUSTRALIA / 6 - 10 SEPTEMBER 2010
A MECHANISTIC MODEL OF BATCH GRINDING IN BALL MILLS
1295
influenced by contact geometry, size distribution of particles inside the mill and the friction coef ficient between balls and particles (Schönert, 1979). This mass may be calculated by m
i = N
cap,i m—
p,i . The
number of particles captured in a stressing event, N cap,i
, may be estimated by considering that thefiner the size of particles in comparison to balls, the larger their number. A relationship of this type is:
N cap,i
= 1 + a(d b/d
p)b (17)
where parameters a and b have been fitted to experimental data as 0.0021 and 1.7, respectively (Tavares and Carvalho, 2009). p(e) allows to consider that particles involved in each collision insidea mill absorb different proportions of the stressing energy, depending on their radial position withinthe bed. A simplifying assumption found to be reasonably valid (Tavares and Carvalho, 2009) is thatthe stressing energy is split equally among particles positioned within the active breakage zone in themill. In this case the energy distribution function may be given by:
p(e) = δ (e–1/ N cap,i
) (18)
where δ is the Dirac delta function.
RESULTS
Batch grinding experiments have been conducted in a 0.3 by 0.3 m ball mill, operating dry at 67 percent of critical speed with 30 per cent filling of 25 mm steel balls and at 100 per cent of interstitialpowder filling. Samples ground in the tests were contained in narrow size ranges and the products atdifferent grinding times were collected and analysed by wet sieving. Figure 5 compares the measuredfraction remaining in the size range 9.5 × 6.3 mm of selected materials to simulations. It shows thatthe proposed model can describe the data with reasonable accuracy in this size range, appropriately describing the non-first order breakage rates observed, which are typical of the significant role of surface breakage of such coarse particles. A generally good agreement has also been observed forfiner size ranges (Tavares and Carvalho, 2009), which demonstrates the validity of the model, as well as of the assumptions considered in the model development. In some cases, however, it has been shown that simulations predicted a greater departure from first-order breakage rates for finerparticles than is usually observed experimentally. This is probably associated to the relatively crudemodels (Equations 17 and 18) used to describe the mass of material captured in each stressing eventas well as the energy split among particles in the bed. This is the subject of ongoing research in theauthors’ laboratory.
Figure 6 compares the measured to the predicted size distributions of the product from batchgrinding tests with granulite and copper ore samples. It shows that the model predicted reasonably well the variation of the size distributions with time for grinding of the two materials. Indeed, in
0 10 20 30 40 50Gr n ng me (m n)
. 1
0.
w 1
( t ) / w 1
( 0 )
Limest ne
Copper re
Granulite
FIG 5 - Comparison between experimental disappearance plots and simulations using the microscale model or selected materialscontained in size range 9.5 × 6.3 mm.

8/4/2019 Tavares_563_p1287
http://slidepdf.com/reader/full/tavares563p1287 10/11
L TAVARES AND R CARVALHO
XXV INTERNATIONAL MINERAL PROCESSING CONGRESS (IMPC) 2010 PROCEEDINGS / BRISBANE, QLD, AUSTRALIA / 6 - 10 SEPTEMBER 2010 1296
the case of predictions of grinding the minus 4.75 mm granulite sample, the model even describedthe abnormal size distributions of the product, that resemble predominance of surface breakage(abrasion), which is expected from grinding such coarse-sized material in such mild grindingconditions in the batch mill.
DISCUSSION
The great potential of the mechanistic approach to ball milling lies in the fact that the influence of a number of variables can be described explicitly, with no empiricism. For instance, the influenceof mill diameter, liner material and profile and mill speed can be accounted for directly in theDEM simulations of media motion giving the impact energy spectrum as output. In the presently proposed approach to simulate the ball mill, the effect of mill hold-up ( M ) and powder interstitialfilling is accounted for in different parts of the model. While it appears explicitly in Equation 10 of the materials balance, it will also influence the time step used in the numerical integration of the
same equation. Further, it will also appear indirectly in the form of the contact parameters used inthe DEM simulations (Table 1), given the greater cushioning effect produced by a larger proportionof particles in relation to media. However, the nature of these relationships is not yet clear. Theeffect of ball diameter and ball size distribution can also be taken into account by DEM, but its effectin grinding will also depend on the fidelity of the description of the functions that account for theinteraction between grinding media and particles assembled in beds. The solids concentration in thefeed and its impact on slurry rheology in the mill will also influence both the contact parameters usedin the DEM simulations and the functions describing the interaction of particles and grinding media, with a secondary effect on single-particle breakage properties.
When all relationships are well-known and established and when appropriate descriptions of milltransport are available, then it would have been reached a fully predictive ball mill scale-up approach,
through which industrial mills will be designed using solely data from single-particle breakage testsand a few particle bed breakage tests conducted under controlled laboratory conditions. However,there is still a long path of model development and validation to be followed until this goal is achieved.
CONCLUSIONS
A model has been proposed that separates entirely the contributions of material and process, whichallows predicting grinding rates and product size distributions in a ball mill with no fitting to batchgrinding data.
The model has demonstrated to be able to predict non-first order rates in breakage of coarseparticles in a batch mill with good agreement to experimental data. The validity of the model has also been demonstrated by the good correspondence between measured and simulated size distributions
from grinding samples of a copper ore and a granulite in the batch laboratory ball mill.The model proposed will allow, in combination with DEM simulations of media motion, to predict
the influence of mill filling, length and diameter, powder filling, liner design and ball size distribution
0. 1 .1 1 10
Particle ize (mm)
0.1
1
10
100
C u m u l a
t i v e p a s s i n g ( % )
Initial
1 min.
4 min.
8 min.
15 min.
Co p r Ore -1.6 mm
(a).01 0.1 1 10
Particle size (mm)
1
10
00
C u m u l a
t i v e p a s s i n g ( % )
Initial
min.
5 min.
0 min.
2 min.
Granulite -4.75 mm
(b)
FIG 6 - Comparison o measured and simulated results o batch grinding o a) -1.68 mm copper ore and b) -4.75 mm granulite.

8/4/2019 Tavares_563_p1287
http://slidepdf.com/reader/full/tavares563p1287 11/11
XXV INTERNATIONAL MINERAL PROCESSING CONGRESS (IMPC) 2010 PROCEEDINGS / BRISBANE QLD AUSTRALIA / 6 - 10 SEPTEMBER 2010
A MECHANISTIC MODEL OF BATCH GRINDING IN BALL MILLS
1297
on the breakage of particles in mills. This model will serve as the basis of a fully predicting model of the mill, which hopefully will represent a breakthrough in ball mill scale-up in the future.
ACKNOWLEDGEMENTS
The authors would like to thank the financial support from the Brazilian research agencies CNPq andCAPES, as well as from VALE and AMIRA, through the P9O project. The authors are also indebted
to Prof Malcolm Powell and Dr Nirmal Weerasekara from the JKMRC for conducting the DEMsimulations.
REFERENCES
Carvalho, R M and Tavares, L M, 2009. Dynamic modeling of comminution using a general microscale breakage model, Computer-Aided Chem Eng, 27:519 - 524.
Cleary, P W, 1998. Predicting charge motion, power draw, segregation and wear in ball mills using discreteelement methods, Miner Eng, 11:1061 - 1080.
Datta, A and Rajamani, R K, 2002. A direct approach of modeling batch grinding in ball mills using population balance principles and impact energy distribution, Int J Min Process, 64:181 - 200.
DEM Solutions, 2009, EDEM User Guide, DEM Solutions, Edinburgh, UK.
Herbst, J A, 2004. A microscale look at tumbling mill scale-up using high fidelity simulation, Int J Min Process, 74:s299 - s306.
Herbst, J A and Potapov, A V, 2004. Making a Discrete Grain Breakage model practical for comminutionequipment performance simulation, Powder Technol , 143 - 144:144 - 150.
King,R P and Bourgeois, F, 1993. A new conceptual model for ball milling, in Proceedings XVIII International Mineral Processing Congress, vol 1, pp 81 - 86 (The Australasian Institute of Mining and Metallurgy,Sydney).
Mishra B K, 2003. A review of computer simulation of tumbling mills by the discrete element method: PartII - Practical applications, Int J Miner Process, 71:95 - 112.
Mishra, B K and Rajamani, R K, 1992. The discrete element method for the simulation of ball mills, Appl Math Model , 12:598 - 604.
Napier-Munn,T J, Morrell, S, Morrison, R D, Kojovic, T, 1996. Mineral comminution circuits: their operationand optimization, in JKMRC Monograph Series in Mining and Mineral Processing, vol. 2, University of Queensland, Brisbane, 413 p.
Powell, M S, McBride, A T, 2006. What is required from DEM simulation to model breakage in mills? Miner Eng, 19(10):1013 - 1021.
Powell, M S and Nurick, G N, 1996. A study of charge motion in rotary mills part 2 – experimental work,Miner Eng, 9(3):343 - 350.
Schönert, K, 1979. Aspects of physics of breakage relevant to comminution, in Proceedings 4th Tewksbury Symposium, Melbourne, pp 3.1 - 3.9.
Tavares, L M and Carvalho, R M, 2009. Modeling breakage rates of coarse particles in ball mills, Miner Eng,22:650 - 659.
Tavares,L M and King, R P, 1998. Single particle fracture under impact loading, Int J Miner Process , 54:1 - 28.
Tavares, L M and King, R P, 2002. Modeling particle breakage by repeated impacts using continuum damagemechanics, Powder Tecnol , 123:138 - 146.
Yashima, S, Hashimoto H, Kanda, Y and Sano, S, 1988. Measurement of kinetic energy of grinding in atumbling ball mill, in Proceedings XVI International Mineral Processing Congress, pp 299 - 309 (ElsevierScience).