Embed Size (px)
Citation preview

Title: U-Th dating of carbonate crusts reveals Neanderthal origin of Iberian
cave art
Authors: D. L. Hoffmann1,*
, C. D. Standish2,*
, M. García-Diez3, P. B. Pettitt
4, J. A. Milton
5,
J. Zilhão6,7
, J.J. Alcolea-González8, P. Cantalejo-Duarte
9, H. Collado
10, R. de Balbín
8, M.
Lorblanchet11
, J. Ramos-Muñoz12
, G.-Ch. Weniger13,14
, A. W. G. Pike2,¥
Affiliations:
1Max Planck Institute for Evolutionary Anthropology, Department of Human Evolution, Deutscher Platz 6,
04103 Leipzig, Germany
2Department of Archaeology, University of Southampton, Avenue Campus, Highfield Road, Southampton,
SO17 1BF, UK.
3Faculty of Humanities and Social Sciences, University of Isabel I, c/ Fernán González 76, 09003 Burgos, Spain
4Department of Archaeology, Durham University, South Road, Durham, DH1 3LE, UK.
5Ocean and Earth Science, University of Southampton Waterfront Campus, National Oceanography Centre
Southampton, European Way, Southampton SO14 3ZH, UK.
6University of Barcelona, Departament d‘Història i Arqueologia (SERP), c/ Montalegre 6, 08001 Barcelona,
Spain.
7Institució Catalana de Recerca i Estudis Avançats (ICREA), Passeig Lluís Companys 23, 08010 Barcelona,
Spain
8Prehistory Section, University of Alcalá de Henares, c/ Colegios 2, 28801 Alcalá de Henares, Madrid, Spain
9Centro de la Prehistoria/Cueva de Ardales. Avda. de Málaga, nº 1. 29550 Ardales (Málaga), Spain.
10Quaternary-Prehistory Research Group, I-PAT Research Group, D.G. Bibliotecas, Museos y Patrimonio
Cultural, Junta de Extremadura, Spain
11Directeur de recherches au CNRS-Retraité, Roc des Monges, 46200 St Sozy, France
12Departamento de Historia, Geografía y Filosofia, Universidad de Cádiz, Avda. Gómez Ulla s.n, Cádiz, Spain
13Neanderthal Museum, Talstraße 300, 40822 Mettmann
14Institute of Prehistory, University of Cologne, Germany
*These authors contributed equally to this study
¥Corresponding author: [email protected]

One sentence summary: U-Th dates on carbonate crusts overlying pigment at three sites in
Spain demonstrate that Neanderthals were making cave paintings at least 64,800 years ago.
Abstract: The extent and nature of symbolic behaviour among Neanderthals is obscure.
While evidence for Neanderthal body ornamentation has been proposed, all cave painting has
been attributed to modern humans. Here we present dating results for three sites in Spain
which show that cave art emerged in Iberia significantly earlier than previously known. U-Th
dates on carbonate crusts overlying paintings provide minimum ages for a red linear motif in
La Pasiega (Cantabria), a hand stencil in Maltravieso (Extremadura), and red-painted
speleothems in Ardales (Andalusia). Collectively, these results show that cave art in Iberia is
older than 64.8 ka. The earliest dated so far, this cave art pre-dates by at least 20 ka the arrival
of modern humans in Europe, which implies Neanderthal authorship.
Main text: The origin of human symbolism is a central concern of modern
Palaeoanthropology (1). For the European Middle Palaeolithic and the African Middle Stone
Age, symbolic behaviour has been inferred from the use, presumably for body adornment, of
mineral pigments, shell beads, eagle talons, and feathers (2-7). Cave and rock art constitutes
particularly impressive and important evidence for symbolic behaviour (8), but little is known
about the chronology of its emergence due to difficulties in dating it precisely and accurately
(9).
Claims for Neanderthal authorship of cave art have been made (10, 11). However, ambiguities
of indirect dating and uncertainty in distinguishing between natural and intentional
modification (12, 13) leave these claims unresolved. Recent technical developments provide
the possibility to obtain age constraints for cave art by U-Th dating of associated carbonate
precipitates (14). This dating approach can provide robust age constraints while keeping the
art itself intact. It is a destructive technique, in that a carbonate sample is required, although
the sample is very small, typically less than 10 mg, and is taken not from the art itself, but
from the carbonates associated with it. The key condition is demonstrating an unambiguous
stratigraphic relationship between the sample and the art whose age we wish to constrain.
Dating of carbonate crusts formed on top of the art provides a minimum age (15). When the
art was painted on top of carbonates (e.g. on flowstone walls, stalagmites or stalactites),
dating the underlying ‘canvas’ provides a maximum age (15).

Using this approach, the earliest results so far are for a hand stencil from Leang Timpuseng,
Sulawesi (Indonesia), with a minimum age of 39.9 ka (16), and a red disc on the Panel of
Hands in El Castillo, Cantabria (Spain), with a minimum age of 40.8 ka (17). While the art in
Sulawesi has been attributed to modern humans, the minimum age for the red disc in El
Castillo relates to a point in time when it could be attributed either to Cantabria’s first modern
humans or to the region's earlier Neanderthal populations (18, 19).
Here, we report U-Th dating results of carbonate formations associated with rock art in three
Spanish caves: La Pasiega (Cantabria), Maltravieso (Extremadura), and Doña Trinidad, or
Ardales (Andalucía), see Fig. S1 (20). Our criteria for sample selection and subsequent
sampling strategy strictly followed previously described methods (14). The reliability of the
U-Th dating results is controlled by quality criteria for the carbonate (14) as well as by the
collection and analysis of multiple subsamples of a given crust.
La Pasiega is part of the Monte Castillo cave art complex, a World Heritage site that also
includes the caves of El Castillo, Las Chimeneas and Las Monedas. Together, these caves
show continued human occupation through the last 100,000 years. At La Pasiega, the rock art
comprises mainly red and black paintings, including groups of animals, linear signs,
claviform signs, dots, and possible anthropomorphs (21). Maltravieso was episodically used
by hominin groups during the last 180,000 years (22); it contains an important set of red hand
stencils (~60), which form part of a larger body of art that includes both geometric designs
(e.g., dots and triangles) and painted and engraved figures (23). Ongoing excavations have
shown that Ardales was occupied in the Middle and the Upper Palaeolithic; its walls feature
an impressive number (>1000) of paintings and engravings in a vast array of forms, including
hand stencils and prints, numerous dots, discs, lines and other geometric shapes, as well as
figurative representations of animals, including horse, deer and birds (24).
We obtained U-Th ages for 53 samples removed from 25 carbonate formations
stratigraphically related to paintings in these caves. Full methods and dataset are presented in
(20). Here we present and discuss the results most significant for the antiquity of the art.
In La Pasiega C (Fig. S2), a cauliflower type carbonate formation on top of a red scalariform
sign (Panel 78 of Hall XI, Fig. 1 and (20)) yielded U-Th dates for three subsamples (outer,
middle and inner) that increase in age with depth, i.e. towards the pigment layer. They provide
a minimum age of 64.8 ka (PAS 34) (Table 1 and (20)) for the sign.
In Maltravieso (Fig. S7), we dated samples from five locations on various carbonate
formations overlying the same red hand stencil (motif GS3b, Fig. 2 and (20)). Carbonate
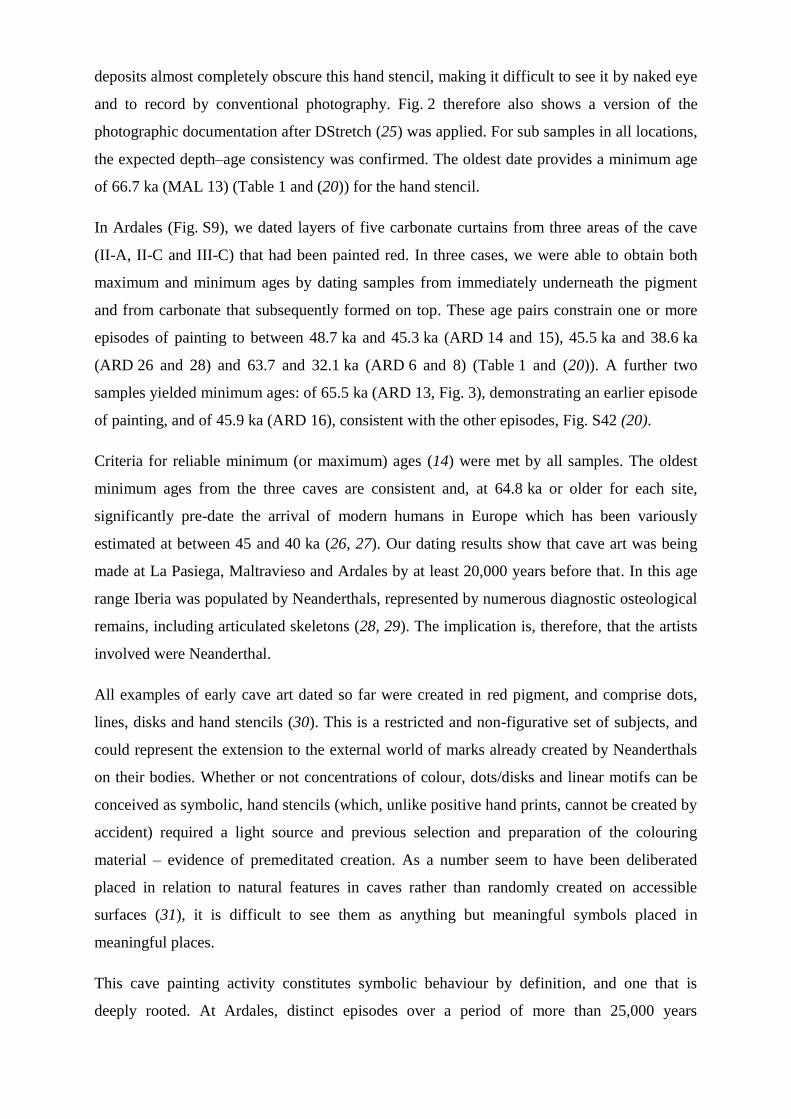
deposits almost completely obscure this hand stencil, making it difficult to see it by naked eye
and to record by conventional photography. Fig. 2 therefore also shows a version of the
photographic documentation after DStretch (25) was applied. For sub samples in all locations,
the expected depth–age consistency was confirmed. The oldest date provides a minimum age
of 66.7 ka (MAL 13) (Table 1 and (20)) for the hand stencil.
In Ardales (Fig. S9), we dated layers of five carbonate curtains from three areas of the cave
(II-A, II-C and III-C) that had been painted red. In three cases, we were able to obtain both
maximum and minimum ages by dating samples from immediately underneath the pigment
and from carbonate that subsequently formed on top. These age pairs constrain one or more
episodes of painting to between 48.7 ka and 45.3 ka (ARD 14 and 15), 45.5 ka and 38.6 ka
(ARD 26 and 28) and 63.7 and 32.1 ka (ARD 6 and 8) (Table 1 and (20)). A further two
samples yielded minimum ages: of 65.5 ka (ARD 13, Fig. 3), demonstrating an earlier episode
of painting, and of 45.9 ka (ARD 16), consistent with the other episodes, Fig. S42 (20).
Criteria for reliable minimum (or maximum) ages (14) were met by all samples. The oldest
minimum ages from the three caves are consistent and, at 64.8 ka or older for each site,
significantly pre-date the arrival of modern humans in Europe which has been variously
estimated at between 45 and 40 ka (26, 27). Our dating results show that cave art was being
made at La Pasiega, Maltravieso and Ardales by at least 20,000 years before that. In this age
range Iberia was populated by Neanderthals, represented by numerous diagnostic osteological
remains, including articulated skeletons (28, 29). The implication is, therefore, that the artists
involved were Neanderthal.
All examples of early cave art dated so far were created in red pigment, and comprise dots,
lines, disks and hand stencils (30). This is a restricted and non-figurative set of subjects, and
could represent the extension to the external world of marks already created by Neanderthals
on their bodies. Whether or not concentrations of colour, dots/disks and linear motifs can be
conceived as symbolic, hand stencils (which, unlike positive hand prints, cannot be created by
accident) required a light source and previous selection and preparation of the colouring
material ‒ evidence of premeditated creation. As a number seem to have been deliberated
placed in relation to natural features in caves rather than randomly created on accessible
surfaces (31), it is difficult to see them as anything but meaningful symbols placed in
meaningful places.
This cave painting activity constitutes symbolic behaviour by definition, and one that is
deeply rooted. At Ardales, distinct episodes over a period of more than 25,000 years

corroborate that we are not dealing with a one-off burst but with a long tradition that may well
stretch back to the time of the annular construction found in Bruniquel Cave, France (32),
dated to 176.5 ± 2.1 ka. Dating results for the excavation site at Cueva de los Aviones (Spain)
(2), which place symbolic use of marine shells and mineral pigments by Neanderthals at
>120 ka (33), further support the antiquity of Neanderthal symbolism.
Cave art like that dated here exists in other caves of western Europe and could potentially be
of Neanderthal origin as well. Red-painted draperies are found at Les Merveilles (France;
Panel VII) (34) and at El Castillo (Spain), while hand stencils and linear symbols are
ubiquitous and, when part of complex superimpositions, always form the base of pictorial
stratigraphies. We therefore expect that cave art of Neanderthal origin will eventually be
revealed in other areas with Neanderthal presence elsewhere in Europe. We also see no reason
to exclude that the behaviour will be equally ancient among coeval non-Neanderthal
populations of Africa and Asia.
The authorship of the so-called “transitional” techno-complexes of Europe that, like the
Châtelperronian, feature abundant pigments and objects of personal ornamentation, has long
been the subject of much debate (35, 36). Direct or indirect (via acculturation) assignment to
modern humans has been based on an “impossible coincidence” argument ‒ the implausibility
that Neanderthals would independently evolve the behaviour just at the time when modern
humans were already in or at the gates of Europe. By showing that the Châtelperronian is but
a late manifestation of a long-term indigenous tradition of Neanderthal symbolic activity, our
results bring closure to this debate.
References and Notes
1. C. Henshilwood, F. d´Errico, Homo symbolicus. The dawn of language, imagination
and spirituality. (John Benjamins Publishing Company, Amsterdam, 2011).
2. J. Zilhão et al., Symbolic use of marine shells and mineral pigments by Iberian
Neandertals. Proceedings of the National Academy of Sciences of the United States of
America 107, 1023-1028 (2010).
3. M. Peresani, I. Fiore, M. Gala, M. Romandini, A. Tagliacozzo, Late Neandertals and
the intentional removal of feathers as evidenced from bird bone taphonomy at Fumane
Cave 44 ky B.P., Italy. Proceedings of the National Academy of Sciences of the United
States of America 108, 3888-3893 (2011).
4. D. Radovčić, A. O. Sršen, J. Radovčić, D. W. Frayer, Evidence for neandertal jewelry:
Modified white-tailed eagle claws at krapina. PLoS ONE 10, (2015).
5. C. S. Henshilwood, F. d'Errico, I. Watts, Engraved ochres from the Middle Stone Age
levels at Blombos Cave, South Africa. J. Hum. Evol. 57, 27-47 (2009).
6. C. S. Henshilwood et al., A 100,000-year-old ochre-processing workshop at Blombos
Cave, South Africa. Science 334, 219-222 (2011).

7. F. d'Errico, C. Henshilwood, M. Vanhaeren, K. van Niekerk, Nassarius kraussianus
shell beads from Blombos Cave: Evidence for symbolic behaviour in the Middle Stone
Age. J. Hum. Evol. 48, 3-24 (2005).
8. A. Leroi-Gourhan, B. Delluc, G. Delluc, Préhistorie de l´art occidental. (Citadelles &
Mazenod, Paris, 1995).
9. P. Pettitt, A. Pike, Dating European Palaeolithic cave art: Progress, prospects,
problems. J. Archaeol. Method Theory 14, 27-47 (2007).
10. J. C. Marquet, M. Lorblanchet, A Neanderthal face? The proto-figurine from La
Roche-Cotard, Langeais (Indreet-Loire, France). Antiquity 77, 661-670 (2003).
11. J. Rodríguez-Vidal et al., A rock engraving made by Neanderthals in Gibraltar.
Proceedings of the National Academy of Sciences of the United States of America 111,
13301-13306 (2014).
12. P. Pettitt, Is this the infancy of art? Or the art of an infant? A possible Neanderthal
face from La Roche-Cotard, France. Before Farming 2003, 1-3 (2003).
13. E. Camarós et al., Bears in the scene: Pleistocene complex interactions with
implications concerning the study of Neanderthal behavior. Quat. Int. 435, 237-246
(2017).
14. D. L. Hoffmann, A. W. G. Pike, M. García-Diez, P. B. Pettitt, J. Zilhão, Methods for
U-series dating of CaCO3 crusts associated with Palaeolithic cave art and application
to Iberian sites. Quat. Geochronol. 36, 104-119 (2016).
15. Note: Minimum ages are calculated by subtracting the 95 % uncertainty from the
mean; maximum ages are calculated by adding the 95 % uncertainty to the mean.
16. M. Aubert et al., Pleistocene cave art from Sulawesi, Indonesia. Nature 514, 223-227
(2014).
17. A. W. G. Pike et al., U-Series Dating of Paleolithic Art in 11 Caves in Spain. Science
336, 1409-1413 (2012).
18. J. J. Hublin, The modern human colonization of western Eurasia: when and where?
Quat. Sci. Rev. 118, 194-210 (2015).
19. J. Zilhão, Chronostratigraphy of the Middle-to-Upper Paleolithic transition in the
Iberian Peninsula. Pyrenae 37, 7-84 (2006).
20. Supplementary Materials
21. H. Breuil, H. Obermaier, H. Alcalde del Río, La Pasiega à Puente Viesgo (Santander,
Espagne). (Institut de Paléontologie Humaine, Chêne, Mónaco, 1913).
22. N. Barrero et al., in O Paleolitico, Actas do IV Congreso de Arqueología Peninsular,
N. Bicho, Ed. (Universidade do Algarve: Faro, 2005), pp. 265–284.
23. H. Collado, J. J. García, Handprints in Matravieso Cave (Cáceres, Spain): Typology,
Distribution, Techniques and Chronological Context. IFRAO 2013 Proceedings
American Indian Rock Art 40, 383-440 (2013).
24. P. Cantalejo et al., La cueva de Ardales: arte prehistórico y ocupación en el
Paleolítico. (Diputación de Málaga, Málaga, 2006).
25. P. Clogg, M. Díaz-Andreu, B. Larkman, Digital image processing and the recording of
rock art. J. Archaeol. Sci. 27, 837-843 (2000).
26. J. Zilhão, F. D'Errico, The chronology and taphonomy of the earliest Aurignacian and
its implications for the understanding of Neandertal extinction. J. World Prehist. 13,
1-68 (1999).
27. T. Higham et al., The timing and spatiotemporal patterning of Neanderthal
disappearance. Nature 512, 306-309 (2014).
28. M. J. Walker et al., Late Neandertals in Southeastern Iberia: Sima de las Palomas del
Cabezo Gordo, Murcia, Spain. Proceedings of the National Academy of Sciences of
the United States of America 105, 20631-20636 (2008).
29. R. E. Wood et al., A new date for the neanderthals from el sidrón cave (asturias,
northern spain). Archaeometry 55, 148-158 (2013).

30. M. García-Diez et al., The chronology of hand stencils in European Palaeolithic rock
art: Implications of new u-series results from el Castillo cave (Cantabria, Spain). J.
Anthropol. Sci. 93, 135-152 (2015).
31. P. Pettitt, A. M. Castillejo, P. Arias, R. O. Peredo, R. Harrison, New views on old
hands: The context of stencils in El Castillo and la Garma caves (Cantabria, Spain).
Antiquity 88, 47-63 (2014).
32. J. Jaubert et al., Early Neanderthal constructions deep in Bruniquel Cave in
southwestern France. Nature 534, 111-114 (2016).
33. D. L. Hoffmann, D. E. Angelucci, V. Villaverde, J. Zapata, J. Zilhão, Symbolic Use of
Marine Shells and Mineral Pigments by Iberian Neanderthals 115,000 years ago.
(submitted).
34. M. Lorblanchet, Art Pariétal - Grottes ornées du Quercy. (Edition Rouergue, Rodez,
2010), pp. 446.
35. P. Mellars, Neanderthal symbolism and ornament manufacture: The bursting of a
bubble? Proceedings of the National Academy of Sciences of the United States of
America 107, 20147-20148 (2010).
36. F. Caron, F. d'Errico, P. Del Moral, F. Santos, J. Zilhão, The reality of neandertal
symbolic behavior at the grotte du renne, arcy-sur-cure, france. PLoS ONE 6, (2011).
37. D. L. Hoffmann et al., Procedures for accurate U and Th isotope measurements by
high precision MC-ICPMS. Int. J. Mass Spectrom. 264, 97-109 (2007).
38. K. Mathew, P. Mason, A. Voeks, U. Narayanan, Uranium isotope abundance ratios in
natural uranium metal certified reference material 112-A. Int. J. Mass Spectrom. 315,
8-14 (2012).
39. S. Richter et al., "REIMEP 18: Inter-laboratory comparison for the measurement of
uranium isotopic ratios in nitric acid solution," (Institute for Reference Materials and
Measurements, Luxembourg, 2006).
40. S. Richter et al., Re-certification of a series of uranium isotope reference materials:
IRMM-183, IRMM-184, IRMM-185, IRMM-186 and IRMM-187. Int. J. Mass
Spectrom. 247, 37-39 (2005).
41. K. W. W. Sims et al., An inter-laboratory assessment of the thorium isotopic
composition of synthetic and rock reference materials. Geostand. Geoanal. Res. 32,
65-91 (2008).
42. A. H. Jaffey, K. F. Flynn, L. E. Glendenin, W. C. Bentley, A. M. Essling, Precision
Measurement of Half-Lives and Specific Activities of U-235 and U-238. Phys. Rev. C
4, 1889-& (1971).
43. H. Cheng et al., The half-lives of uranium-234 and thorium-230. Chem. Geol. 169, 17-
33 (2000).
44. N. E. Holden, Total Half-Lives for Selected Nuclides. Pure Appl. Chem. 62, 941-958
(1990).
45. S. J. Goldstein, M. T. Murrell, D. R. Janecky, Th and U isotopic systematics of basalts
from the Juan de Fuca and Gorda Ridges by mass spectrometry. Earth Planet. Sci.
Lett. 96, 134-146 (1989).
46. J. Prytulak, T. Elliott, D. L. Hoffmann, C. D. Coath, Assessment of USGS BCR-2 as a
reference material for silicate rock U-Pa disequilibrium measurements. Geostand.
Geoanal. Res. 32, 55-63 (2008).
47. E. P. Horwitz et al., Separation and preconcentration of uranium from acidic media by
extraction chromatography. Anal. Chim. Acta 266, 25-37 (1992).
48. D. L. Hoffmann et al., Characterisation of secondary electron multiplier nonlinearity
using MC-ICPMS. Int. J. Mass Spectrom. 244, 97-108 (2005).
49. M. García-Diez, Palaeolithic caves of northern Spain: World Heritage Site. Rock Art
Res. 26, 99-101 (2009).
50. A. W. G. Pike, D. L. Hoffmann, P. B. Pettitt, M. García-Diez, J. Zilhão, Dating
Palaeolithic cave art: Why U–Th is the way to go. Quat. Int. 432, 41-49 (2017).

51. K. H. Wedepohl, The Composition of the Continental-Crust. Geochim. Cosmochim.
Acta 59, 1217-1232 (1995).
Acknowledgments: This research was financially supported by the Natural Environment
Research Council (UK) (Grant NE/K015184/1), the National Geographic Society (USA)
(Grant EC0603-12) and the Max Planck Society (Germany) and a Royal Society Wolfson
Research Merit Award (to AWGP). The work of MGD was supported by the Research Group
IT622-13 of the Basque Government. We thank the governments of Andalucía, Cantabria and
Extremadura for sampling permissions. We are grateful for fieldwork support by Juan Carlos
Aguilar, Mireille Batut, José Ramón Bello, Daniel Garrido, Raúl Gutiérrez and Carola
Hoffmann. The data described are presented in the supplementary materials.
Figure legends
Fig. 1: Red scalariform sign, Panel 78 ('La Trampa' (21) in Hall XI, La Pasiega C. The insert
shows the crust sampled and analyzed for a minimum age (64.8 ka) constraining the age of
the red line. See (20) for details.
Fig. 2: Hand stencil GS3b in Maltravieso cave (minimum age 66.7 ka). The upper picture
shows the original photo, the lower image is the same picture after application of DStretch
(25) (Correlation LRE 15%, auto contrast) to enhance colour contrast. The inset shows where
the overlying carbonate was sampled for MAL 13. See (20) for details
Fig. 3: Speleothem curtain 8 in section II-A-3 in Ardales cave with red pigment, painted prior
to at least 65.5 ka ago. Left: the series of curtains with red paint on top, partly covered with
later speleothem growth. The white rectangle denotes the area shown on the right. Right:
Detail of curtain 8, the black rectangle denotes where carbonate, overlying the red paint, was
sampled for ARD 13. See (20) for details.
Supplementary materials
Materials and methods
1. Analytical methods: U-series dating of carbonate crusts
2. Cave sites and cave art

3. Carbonate samples
Supplementary text
1. U-series results
Figures S1 - S42
Table S1 - S4
References (37-51)

Fig. 1

Fig. 2

Fig. 3

Table 1.
U-series results of samples discussed in the text. More details and additional results can be
found in Table S4 (20).
Spl ID Site and description
238U
[ng/g]
230Th/
232Th
230Th/
238U
uncorrected
234U/
238U
uncorrected
Age
uncorrected
[ka]
Age
corrected
[ka]
PAS 34a Pasiega C, No. 78, cauliflower
type carbonate on top of red line
of scalariform motif, minimum
age
289.29
± 9.06
32.82
± 0.21
1.5149
± 0.0106
3.7694
± 0.0082
52.52
± 0.47
51.56
± 1.09
PAS 34b as above 215.56
± 7.43
28.28
± 0.19
1.5453
± 0.0121
3.6744
± 0.0094
55.53
± 0.56
54.36
± 1.39
PAS 34c as above 178.31
± 8.31
7.25
± 0.07
2.0348
± 0.0213
3.4591
± 0.0092
85.79
± 1.28
79.66
± 14.90
MAL 13
surface
cleaning
fraction
Maltravieso, cauliflower type
carbonate layer overlying hand
stencil GS3b, minimum age
117.2
± 1.99
12.47
± 0.16
0.4639 ±
0.0068
1.1872
± 0.0328
53.3185
+ 2.30
- 2.13
41.68
+ 2.44 -
2.29
MAL 13A as above 142.69
± 3.39
37.50
± 0.57
0.6067
± 0.0123
1.2024
± 0.0305
74.8553
+ 3.78
- 3.41
70.08
+ 3.82
- 3.37
ARD 06 Ardales, red paint on curtain
formation, II-C-8, carbonate
from underlying curtain,
maximum age
511.42
± 6.38
34.95
± 0.14
0.4661
± 0.0021
1.0459
± 0.0021
64.09
± 0.44
62.97
± 0.69
ARD 08 Ardales, red paint on curtain
formation, II-C-8, carbonate
from overlying curtain, minimum
age
297.21
± 2.89
145.58
± 1.06
0.2703
± 0.0018
1.0477
± 0.0024
32.51
± 0.26
32.35
± 0.27
ARD 13A Ardales, red paint on curtain
formation, II-A-3 curtain 8,
minimum age
1229.61
± 25.84
152.83
± 1.14
0.3661
± 0.0033
1.0385
± 0.0033
47.3312
+ 0.57
- 0.56
47.13
+ 0.56
- 0.57
ARD 13B as above 331.54
± 13.53
42.59
± 0.58
0.4878
± 0.0073
1.0369
± 0.0234
69.093
+ 2.93
- 2.62
68.13
+ 2.96
- 2.62

ARD 14A Ardales, red paint on curtain
formation, II-A-3 curtain 6,
carbonate from underlying
curtain, maximum age
684.76
± 13.29
395.03
± 4.91
0.3683
± 0.0063
1.0379
± 0.0029
47.72
+ 1.05
- 1.02
47.64
+ 1.07
- 1.03
ARD 15A Ardales, red paint on curtain
formation, II-A-3 curtain 6,
carbonate from overlying curtain,
minimum age
1696.03
± 53.88
337.14
± 3.63
0.3584
± 0.0050
1.0374
± 0.0025
46.15
+ 0.81
- 0.82
46.06
+ 0.81
- 0.77
ARD 15B as above 667.98
± 37.85
152.07
± 3.27
0.3467
± 0.0110
1.0347
± 0.0061
44.45
+ 1.79
- 1.82
44.25
+ 1.78
- 1.77
ARD 16A Ardales, red paint on curtain
formation, II-A-3 curtain 5,
carbonate from overlying curtain,
minimum age
313.84
± 5.88
58.92
± 0.74
0.3317
± 0.0044
1.0323
± 0.0051
42.23
+ 0.74
- 0.72
41.75
± 0.77
ARD 16B as above 250.2
± 4.29
84.25
± 0.84
0.3628
± 0.0050
1.0314
± 0.0051
47.23
+ 0.85
- 0.83
46.86
+ 0.85
- 0.92
ARD 16C as above 227.59
± 28.55
56.70
± 2.84
0.3690
± 0.0213
1.0227
± 0.0342
48.79
+ 4.26
- 4.00
48.23
+ 4.43
- 4.10
ARD 26A Ardales, red paint visible as a
line on cross section of a broken
curtain, between III-C-3 and III-
C-2, carbonate from overlying
curtain, minimum age
564.64
± 13.56
1004.53
± 20.81
0.3243
± 0.0099
1.0502
± 0.0203
40.20
+ 1.84
- 1.69
40.17
+ 1.73
- 1.77
ARD 26B as above 532.37
± 14.02
985.93
± 24.33
0.3258
± 0.0112
1.0496
± 0.0113
40.45
+ 1.82
- 1.70
40.42
+ 1.79
- 1.78
ARD 28A Ardales, red paint visible as a
line on cross section of a broken
curtain, between III-C-3 and III-
C-2, carbonate from underlying
curtain, maximum age
520.54
± 8.11
4626.61
± 188.57
0.3379 ±
0.0192
1.0458
± 0.0124
42.48
+ 3.09
- 2.91
42.47
+ 3.07
- 2.97
All ratios are activity ratios. Analytical errors are at 95 % confidence level.

Supplementary Materials for
U-Th dating of carbonate crusts reveals Neanderthal origin of Iberian cave art
D. L. Hoffmann, C. D. Standish, M. García-Diez, P. B. Pettitt, J. A. Milton, J. Zilhão, J.
Alcolea, P. Cantalejo-Duarte, H. Collado, R. de Balbín, M. Lorblanchet, J. Ramos-Muñoz,
G.-Ch. Weniger, A. W. G. Pike
This PDF file includes:
Materials and Methods
Supplementary Text
Figs. S1 to S42
Tables S1 to S4

Materials and Methods
1. Analytical methods: U-series dating of carbonate crusts
Two U-series laboratories are involved in this study, one housed at the Department of
Human Evolution, Max Planck Institute for Evolutionary Anthropology, Leipzig (Germany)
and one housed at the Ocean and Earth Science analytical geochemistry facilities, University
of Southampton (UK). While both laboratories have similar setups, generally following
protocols outlined in (37) and (14), we report in detail procedures for sample preparation and
mass spectrometry for both laboratories.
1.1 U-series methods at the U-series laboratory of the Max Planck Institute for Evolutionary
Anthropology (MPI EVA), Leipzig
Samples taken from carbonate crusts associated with cave art are typically collected in
pre-cleaned 15 ml plastic tubes. Before further chemical separation and purification, the
samples are inspected for detrital particles. In cases where such particles are found, they are
removed from the sample powders before they are transferred into Savillex PFA containers as
described in detail in (14). Separation and purification of U and Th from the sample matrix
follows protocols also outlined in (14). In brief, the samples are dissolved by adding sufficient
7 M HNO3, a mixed, accurately calibrated 229
Th-236
U spike is added and the solution refluxed
for equilibration. The spike was gravimetrically prepared from a pure 229
Th solution,
calibrated against NIST SRM 3159, and IRMM 3600. The mixed spike was then further
calibrated following procedures outlined in (37). A double resin isotope dilution procedure is
used to separate U and Th and then purify each fraction. BioRad AG 1x8 is used to separate U
and Th followed by a first purification of the Th fraction also using AG 1x8. Final
purification of U and Th fractions is done using Eichrom UTEVA resin. The final U and Th
fractions are dissolved in 0.5 M HCl, U and Th isotope compositions of the solutions are
separately measured by multi-collector (MC) inductively-coupled plasma mass spectrometry
(ICPMS) following (37). Procedural chemistry blank values are typically less than 1 pg 238
U,
1 fg 235
U, 0.1 fg 234
U, 1 pg 232
Th and 0.1 fg 230
Th, respectively.
Mass spectrometry analyses are done with a ThermoFinnigan Neptune MC-ICPMS. The
Neptune is equipped with the Neptune plus interface, an energy filter (RPQ) for small ion
beams measured on the central ion counter, which is a MasCom SEM. For sample
introduction a setup including a Cetac Aridus II with Quickwash and a Savillex PFA nebuliser
tip with 35 µl/min uptake rate is used.

A sample - standard bracketing protocol is used for U isotope ratio measurements. U
samples are analysed vs. a NBL-112a solution (37) employing the certified isotope ratio
values from (38) with 234
U/238
U = (5.2841 ± 0.0082)∙10-5
and 235
U/238
U =
(7.2543 ± 0.0040)∙10-3
. At least two additional U isotope standard solutions are routinely
measured along with samples, run with identical setup and similar intensities as sample
solutions. These standards include the REIMEP 18 solutions A and B (39), the certified
reference solution IRMM 183 (40) and a purified U fraction of the uraninite solution
URAN 84.5 (37). The URAN 84.5 U solution has a natural secular equilibrium U isotope
composition, Reimep 18 A has an isotopic composition similar to natural U but this standard
contains a small amount of 236
U. Reimep 18 B and IRMM 183 have 236
U/238
U ratios
comparable to spiked samples and non-natural 235
U/238
U. This suite of standards is
representative of typical U solutions analysed for isotopic compositions. For routine analyses
we obtain the isotopic ratios presented in Table S1.
A sample - standard bracketing protocol is also used for Th isotope ratio measurements.
However, there is no certified 229
Th-230
Th-232
Th isotope solution available. Hoffmann et al.
(2007) (37) prepared and calibrated an in-house Th standard (TEDDi), but only small
quantities of this solution are left, so it is no longer used as bracketing standard for Th isotope
analyses. Instead, a new suite of Th standard solutions has been prepared, one solution
(TEDDii) is the replacement solution for TEDDi with similar isotopic composition. This
solution is now routinely used as bracketing standard and TEDDi serves as standard which is
run as a sample to check accuracy and reproducibility. Two additional Th solutions were
prepared, one with 230
Th/232
Th around 0.06 (Thoca), one with 230
Th/232
Th of 1.14∙10-5
(Thosi).
Thoca and TEDDii were gravimetrically prepared using a calibrated in-house 229
Th spike, the
IRMM 61 230
Th spike and NIST SRM 3159 232
Th standard. Thosi was gravimetrically
prepared adding a known quantity of the calibrated 229
Th spike to a (concentration-) calibrated
IRMM 35 solution with a consensus value for 230
Th/232
Th ratio (41). All solutions, especially
the 230
Th/229
Th ratios, were then additionally calibrated by MC-TIMS and MC-ICPMS as
outlined in (37). This suite of standards is representative of typical Th solutions analysed for
isotopic compositions. During a sequence, we always measure TEDDi and one or two other
Th standards, depending on the isotopic range of the measured samples, which is checked by
intensity screening prior to analyses. For routine analyses we obtain the isotopic ratios
presented in Table S2.
U-Th ratios are calculated from the measured isotopic compositions of the spiked U and
Th fractions of a sample using the known 229
Th/236
U ratio of the spike solution. The following

decay constants are then used to calculate activity ratios: λ238 = (1.55125 ± 0.0017)·10-10
a-1
(42), λ234 = (2.826 ± 0.0056)·10-6
a-1
(43), λ232 = (4.95 ± 0.035)·10-11
a-1
(44),
λ230 = (9.1577 ± 0.028)·10-6
a-1
(43). We routinely prepare a fraction of the URAN 84.5 as
part of a set of samples. 34 individually prepared samples of this uraninite solution give
activity ratios of 234
U/238
U = 0.9995 ± 0.0005 and 230
Th/238
U = 1.0021 ± 0.0008. We also
analysed a sample of the silicate secular equilibrium sample TML (45) which yielded
234U/
238U of 1.0003 ± 0.0015 and
230Th/
238U of 0.9995 ± 0.0027. For the basaltic reference
material USGS BCR-2, analysis of a sample yielded 234
U/238
U of 1.0028 ± 0.0015 and
230Th/
238U of 1.0058 ± 0.0033, which confirms previously found elevated
230Th/
238U and
234U/
238U activity ratios (37, 46). U-Th ages are calculated iteratively from the activity ratios
and using above decay constants. Uncertainties are calculated using a Monte-Carlo approach
(37), all uncertainties of the Leipzig laboratory quoted in this study are at 95 % (2σ)
confidence level. Minimum ages are calculated as the mean minus 2σ and maximum ages as
the mean plus 2σ.
1.2 U-series methods at the Ocean and Earth Science analytical geochemistry facilities,
University of Southampton
Carbonate samples, typically between 1 mg and 50 mg in mass and collected in pre-
cleaned 15 ml plastic tubes, are first inspected under a low power microscope and detrital
particles removed where possible. The samples are then weighed into pre-cleaned Savillex
PFA vials, 1.5 ml of 18.2 MΩ·cm (ultrapure) water added, and the samples are dissolved by
stepwise addition of concentrated (~15.5 N) HNO3. A mixed 229
Th/236
U spike (37) is added
and left to equilibrate for a few hours, after which the sample solutions are evaporated to
dryness then re-dissolved in 0.5 ml concentrated HNO3 and 0.5 ml H2O2 and refluxed at
150°C. Finally, the samples are evaporated to dryness and re-dissolved in 6 ml 3 N HNO3
ready for the ion exchange columns.
Ion exchange chromatography for the separation of U and Th from the sample matrix
employ 0.6 ml columns and 100 – 150 μm UTEVA Spec (Eichrom) resin (47). After loading
into the columns, the resin is cleaned by elution of 4 ml 0.05 N HCl, 5 ml 3 N HCl, then 4 ml
ultrapure water. The resin is conditioned with 7 ml 3 N HNO3 before the samples are loaded
in 6 ml 3 N HNO3. Matrix is eluted in 9 ml 3 N HNO3, then Th is eluted in 3 ml 3 N HCl
followed by U in 8 ml 0.05 N HCl. The Th and U fractions are evaporated to dryness then re-
dissolved in 0.5 ml concentrated HNO3 and 0.5 ml H2O2 and refluxed at 150°C before being
evaporated to dryness and re-dissolved in 1.8 ml 0.6 N HCl for analysis by mass

spectrometer. Procedural chemistry blank values are always less than 0.01 ng 238
U, 0.1 pg
235U, 0.01 pg
234U, 0.01 ng
232Th and 1 fg
230Th, respectively.
Sediment samples (~200 mg) are first dissolved following the procedure detailed above.
The soluble and insoluble fractions are then separated by centrifuge. The soluble fractions are
spiked with the mixed 229
Th/236
U spike, refluxed for equilibration, then evaporated to dryness
before being dissolved in 6 ml 3 N HNO3 ready for ion exchange chromatography. The
insoluble fractions are weighed into pre-cleaned Savillex PFA vials before being dissolved in
1 ml 7 N HNO3 and 0.5 ml concentrated HF on a hotplate then evaporated to dryness. They
are then dissolved in 2 ml 6 N HCl and refluxed before being evaporated to dryness and
dissolved in 1 ml 7 N HNO3 and refluxed. Finally, the samples are spiked with the mixed
229Th/
236U spike, refluxed for equilibration, then evaporated to dryness and dissolved in 6 ml
3 N HNO3 ready for the ion exchange chromatography. Ion exchange chromatography
follows the same procedure outlined above. The isotopic composition of the total sediment
(i.e. combined soluble and insoluble) is calculated using the isotopic composition and mass of
both fractions.
U and Th isotope measurements are undertaken using a Thermo Scientific Neptune Plus
MC-ICPMS equipped with an energy filter (RPQ) on the central ion counter and housed at the
Ocean and Earth Science analytical geochemistry facilities at the University of Southampton.
Sample introduction employs a Cetac Aridus II and 75 or 100 µl/min Savillex C-flow PFA
nebulisers with typical uptake rates of ~80 µl/min. Analytical procedures follow those
outlined in (37). The secondary electron multiplier was shown to have a linear response so a
correction for nonlinearity (48) is not necessary. For Th analyses the H1 and H2 Faraday cup
amplifiers are connected to 1012
Ω resistors. Instrumental biases (e.g. mass fractionation) are
corrected by sample - standard bracketing procedures; CRM-145 is used for U isotope
measurements and the Bristol/Leipzig in-house 229
Th-230
Th-232
Th standard solution TEDDii
(further details in section 1.1) is used for Th isotope measurements.
For the calculation of activity ratios we use the following decay constants:
λ230 = (9.1577 ± 0.028)·10-6
a-1
(43), λ232 = (4.94752 ± 0.035)·10-11
a-1
(44),
λ234 = (2.826 ± 0.0056)·10-6
a-1
(43), and λ238 = (1.55125 ± 0.0017)·10-10
a-1
(42). U-Th ages
are calculated iteratively from the activity ratios and using the above half-lives. Uncertainties,
including those for blank correction, are fully propagated, are quoted at 95 % confidence
level, and are calculated using a Monte-Carlo approach (37). Minimum ages are calculated as
the mean minus 2σ and maximum ages as the mean plus 2σ. A secular equilibrium standard,
uraninite URAN 84.5, was repeatedly analysed for the duration of the period of data

collection as a demonstration of both accuracy and external reproducibility. A single aliquot
of the uraninite solution was spiked and prepared following the methods detailed above before
being analysed multiple times with every sequence of unknown samples. Our analyses gave
the following activity ratios: (230
Th/238
U) = 1.0026 ± 0.0007 and
(234
U/238
U) = 1.0001 ± 0.0002 (errors are given as 2σ standard errors of the mean, n = 50 over
a ~1.5 year period). This is comparable to the values published for the same solution (37).
Analyses of a dissolved pristine speleothem sample, which serves as an internal standard
solution, were also performed as a further demonstration of external reproducibility. Each
analysis of a fraction of the solution equates to a sample size of 18 – 37 mg carbonate. Each
was spiked and processed through ion exchange chromatography independently, and was
analysed at comparable intensities to other, unknown, carbonate samples. Analyses gave the
following: (230
Th/238
U) = 0.4335 ± 0.0082, (234
U/238
U) = 1.0462 ± 0.0053,
age = 58.15 ± 1.45 ka (errors are given as 2σ standard deviations of the mean, n = 14 over a
~1 year period).
2. Cave sites and cave art
2.1 Locations of cave sites
Our study includes cave art from three different sites in Spain. They are located in
Puente Viesgo, Cantabria (La Pasiega cave), Cáceres, Extremadura (Maltravieso cave) and
Ardales, Andalusia (Doña Trinidad, or Ardales cave). Fig. S1 shows the locations of the three
sites in northern, central-western and southern Spain.
2.2 La Pasiega C
La Pasiega is one of five caves in the Monte Castillo, located in Puente Viesgo
(Cantabria, Spain) in northern Spain (Fig. S1). Five of the caves (El Castillo, Las Monedas,
La Pasiega, Las Chimeneas and La Cantera) contain Palaeolithic cave art and, excluding La
Cantera, are included in the UNESCO World Heritage site 'Cave of Altamira and Paleolithic
Cave Art of Northern Spain' (49). La Pasiega has three main galleries (A, B and C, Fig. S2).
The art mainly consists of red and black paintings - including groups of animals, linear signs,
claviform signs, dots and possible anthropomorphs – but there are also engravings, of animals
and of linear forms.
Pike et al. (17, 50) published 18 results on carbonate crusts collected in La Pasiega. Nine
of these samples were from gallery C, which we revisited in 2013 and where we collected
twelve new samples (PAS 28 to PAS 39). Details and results of the first five of them (PAS 28
- PAS 32) have already been presented in (14), including demonstration of reliability of our
methods in general and robustness of the results for this gallery in particular. Here we focus

on sample PAS 34, sampled on Panel 78, but also give details for the other samples (PAS 33
and PAS 35 - PAS 39).
On top of a rectangular motif in Panel 78 (21) (Figs. S3 and S4), we sampled three
carbonate crusts. Breuil et al. named the motif 'La Trampa' (The Trap), but it is better
described as a scalariform associated with incomplete zoomorphs, red dots and a symbol
(Fig. S4). A parietal stratigraphy - the zoomorphs earlier than the red lines - is described by
(21), but we could not observe any superimposition of lines. Samples PAS 33, PAS 34 and
PAS 38 (Fig. S5) were taken from crusts found on top of red pigment of different parts of this
Panel. PAS 33 and PAS 34 are associated with the red lines forming a rectangular shape,
PAS 38 is associated with a series of red dots above the rectangular drawing. A sample
previously collected from a carbonate crust associated with one of these dots (PAS 3 / BIG-O-
99 (17)) had returned an age of 12.6 ± 0.1 ka.
Sample PAS 35 (Fig. S6a) was collected from a crust that formed on top of a red deer
located in Panel 78 (21), left to the series of red dots above the scalariform motif (Fig. S3).
Sample PAS 36 (Fig. S6b) was collected from a carbonate formation on top of a red
zoomorph, identified as a hind by Breuil et al. (Panel 82, (21)). Sample PAS 37 (Fig. S6c)
was collected from a crust which formed on top of a red tectiform (‘hut’ shape) (Panel 76,
(21). Sample PAS 39 (Fig. S6d) was collected from a crust associated with another red
tectiform (Panel 72; (21)). These samples were all collected in the same sector of the cave,
Breuil et al.’s (21) Hall XI.
2.3 Maltravieso
The Cueva de Maltravieso is located in the city of Cáceres, Extremadura, in central-
western Spain (Fig. S1). Re-discovered in 1951 during quarrying operations, it was found to
contain a rich set of Palaeolithic parietal art. Animal paintings and engravings, including
horses, bulls and ibex, are found alongside dots, triangles, red-painted speleothems, red discs
and lines and an impressive collection of over 60 red hand stencils. For this study we
collected samples from a carbonate crust overlying hand stencil GS3b in the cave’s Galería de
la Serpiente (Fig. S7). The stencil is covered by thick carbonate formations rendering it
difficult to see today. DStretch software is therefore used to enhance digital photography and
help view this panel (Fig. S8).
2.4 Ardales
The Cueva de Ardales, Andalusia, is located in southern Spain (Fig. S1). Fig. S9 shows a
map of the site. It is rich in speleothem formation including numerous curtain-type

formations. It also contains over 1000 artistic images (24). These include paintings and
engravings, both figurative and non-figurative, such as horse, deer, birds, dots, discs, lines and
hand stencils. Zones with red pigment with no defined form or shape can be found on many of
the curtain formations in Ardales. In many cases the speleothem growth continued after a
surface had been painted on. Therefore the red pigment, typically used for paintings in the
cave, was included inside the speleothem formation as a layer. In other cases, the pigment was
only partly overgrown by speleothem. This process is best observed in the several instances
where curtain formations have been broken, possibly due to seismic activities or human
impact in the past. In some cases, the breakage has exposed cross sections of speleothems
where red paint appears as an interstratified layer. Fig. S10 shows a prominent example of
such a case (Panel II-C-8). On the right, above the break, a red painted area without
overgrowth is apparent. To the left, the red pigment is covered by a thick carbonate
overgrowth, and the red layer extends to join the painted surface to the right. The previous
surface of the red painted area underneath the speleothem layer can be seen as a red line
inside the speleothem. Similar configurations were found on many curtain formations in
Ardales (Figs. S11, S12, S13). In some cases the painting was completely included into the
speleothem and only appears as a red line in cross-section where breakage has occurred
(Fig. S14) though in most cases the pigment is only partially obscured by carbonate growth.
We sampled carbonates from curtain or stalactite formations with red painted areas in Panels
II-C-8, II-A-3 and between III-C-2 and III-C-3 (Fig. S9).
3. Carbonate samples
Carbonate deposits with a direct association to pigment, i.e. formations either directly
overlying or underlying art, were selected for sampling. Samples were taken using either a
hand-drill and carbide drill bits or by scraping with a scalpel, with carbonate collected directly
into pre-cleaned plastic sample tubes. The sample locations were first documented and
mechanically cleaned to remove surface contamination or altered material. Carbonate was
then collected in spits to provide a sequence of sub-samples for each sampling location,
offering a test for the internal consistency of each dated formation.
The material removed during the surface cleaning of the crusts (the 'cleaning' sub-
sample) was sometimes collected. This fraction was usually not taken for the purpose of
dating. However, some were analysed when only one further sub-sample could be collected
from a sample location. Further details of our sampling procedures are presented in (14).

3.1 La Pasiega C
3.1.1 Sampling on Panel 78
All samples were removed by scraping with a scalpel and the carbonate collected
directly into the pre-cleaned plastic sample tubes. Prior to sample collection, the surface of the
carbonate crust was first cleaned to minimise impact of surface contamination/alteration, but
the crusts were thick enough so the cleaning fractions were not collected. PAS 34 was
collected from a small cauliflower type carbonate crust, which formed in the lower section on
the left vertical red line which is part of the scalariform painting. The front part of an animal
is painted right to the red line. Appearance of the carbonate crust was slightly greyish, but
after removal of the surface layer, white, crystalline carbonate was exposed. The crust was a
few mm thick, so three subsequent sub-samples with masses between 4 – 6 mg could be
scraped off. The crust started to fragment when the sub-sample PAS 34c was scraped, so
sampling was stopped to avoid any damage to the painting. Pigment was clearly revealed
underlying the carbonate crust (Fig. S15).
3.2 Maltravieso
Two sampling trips were made to la Cueva de Maltravieso in 2014 and 2016. Here we
present U-Th dating of carbonates associated with a newly discovered red hand stencil (Panel
GS3b) located in la Galería de la Serpiente. An overhang of the cave wall creates a small cove
extending from the current cave floor to approximately 1 m in height, and the stencil is on the
‘ceiling’ of this cove. All samples were removed by scraping with a scalpel, with carbonate
collected directly into pre-cleaned plastic sample tubes. Prior to sample collection, the sample
locations were first documented and cleaned to remove surface contamination/alteration.
3.2.1 Sampling hand stencil GS3b
Five sampling locations, associated with a hand stencil near Panel 3, now termed Panel
3b, were targeted: MAL 13, MAL 14, MAL 15, MAL 17 and MAL 19 (Fig. S16). All
samples are in association with pigment adjacent to the thumb of the stencil. Before sampling,
pigment was clearly visible in the valleys and cracks between carbonate growths.
MAL 13 (Figs. S16, S17, S18) consists of two sequential sub-samples (including the
surface cleaning fraction) of a crystalline cauliflower formation. MAL 14 (Figs. S16, S19) is
located approximately 30 mm 'above' MAL 13, and consists of three sequential sub-samples
of a large cauliflower formation (Figs. S18 and S19). MAL 15 (Figs. S16, S20, S21) is
located immediately next to MAL 14. It consists of six sequential sub-samples scraped from a
solid, agglomerated cauliflower formation. The sampling area had to be widened during
collection of sub-samples B and C, therefore mixing with younger carbonate may have

occurred. During collection of sub-sample E a new, paler, carbonate layer appeared. MAL 17
(Figs. S22 and S23) is located approximately 100 mm nearer the wrist of the stencil than the
previous samples (Fig. S16). It consists of four sub-samples taken from a cream-coloured,
crystalline, cauliflower formation. A similar stratigraphy to MAL 15 was noticed, with a
paler, whiter, lower layer underlying the creamy-coloured surface carbonate. This paler layer
became visible during the collection of sub-sample B, and was directly sampled by sub-
samples C and D. The sample area was enlarged during collection of sub-sample B, which
may affect the stratigraphy of the sample sequence. MAL 19 (Figs. S16, S24, S25) is located
approximately 30 mm towards the stencil’s thumb from MAL 13. It consists of two sub-
samples (including the surface cleaning fraction) sampled from a pale/translucent cauliflower
formation.
3.2.3 Maltravieso Sediment Samples
Three samples of cave sediment (MAL Sed 1 – 3) were collected from the cave floor
near to Panels III and IV in the Sala de las Pinturas. These were taken to provide a proxy for
the composition of detrital thorium incorporated within the carbonate samples.
3.2.4 Maltravieso Stalagmitic Column
A small ~30 mm section of a stalagmitic formation, that was probably formerly part of a
column broken in antiquity, was removed using a chisel from a platform above Panel IV in
the Sala de las Pinturas (MAL 24). It was collected to provide a series of stratigraphically
ordered samples that could be dated to assess validity of our detrital thorium corrections. For
this purpose, six carbonate layers were sampled in a laboratory environment using a hand-drill
to obtain powder samples for dating.
3.3. Ardales
La Cueva de Ardales was sampled in September 2016. Here we present U-Th dating of
carbonates associated with red pigment from three panels: II-A-3, an area between Panels III-
C-2 and III-C-3 and Panel II-C-8. Samples were taken using either a hand-drill and carbide
drill bits or by scraping with a scalpel, with carbonate collected directly into pre-cleaned
plastic sample tubes. Prior to sample collection, the sample locations were first cleaned to
remove any surface contamination/alteration.
3.3.1 Sampling on Panel II-A-3
Panel II-A-3 consists of a series of painted curtain formations which have formed
radiating from a large free standing stalagmitic boss (i.e. not connected to the cave wall).
These curtains have fractured at some point during antiquity revealing pigment in section,
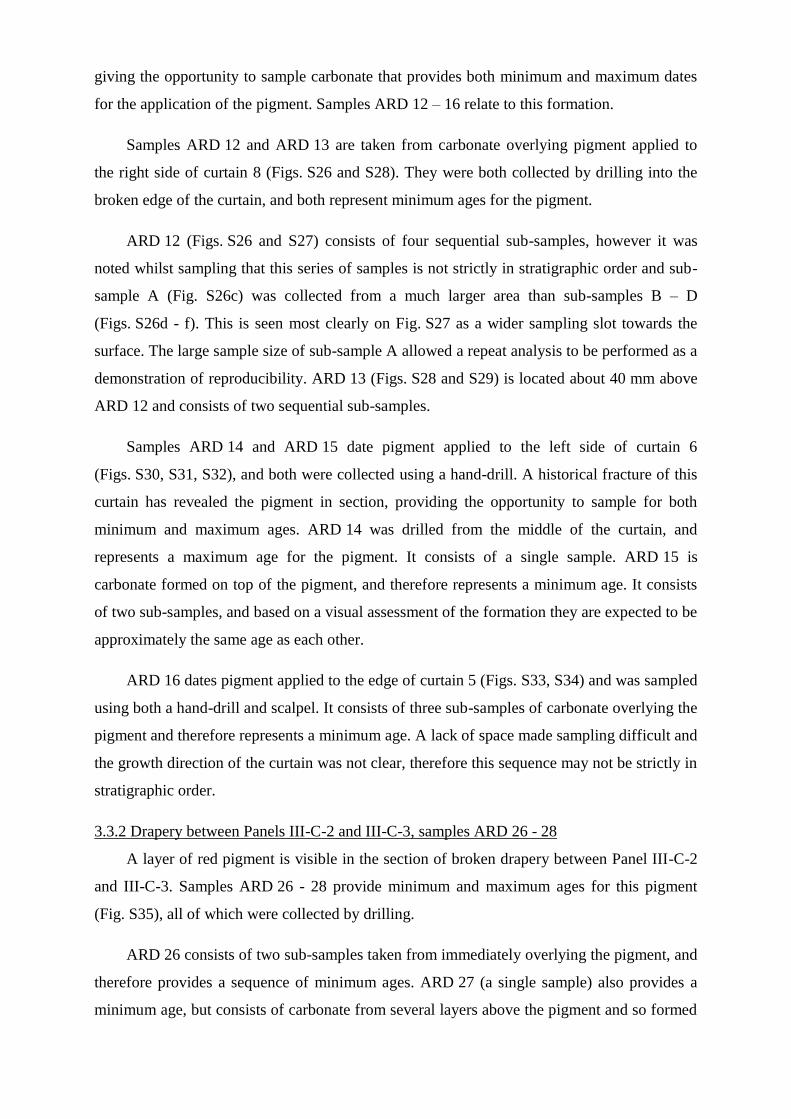
giving the opportunity to sample carbonate that provides both minimum and maximum dates
for the application of the pigment. Samples ARD 12 – 16 relate to this formation.
Samples ARD 12 and ARD 13 are taken from carbonate overlying pigment applied to
the right side of curtain 8 (Figs. S26 and S28). They were both collected by drilling into the
broken edge of the curtain, and both represent minimum ages for the pigment.
ARD 12 (Figs. S26 and S27) consists of four sequential sub-samples, however it was
noted whilst sampling that this series of samples is not strictly in stratigraphic order and sub-
sample A (Fig. S26c) was collected from a much larger area than sub-samples B – D
(Figs. S26d - f). This is seen most clearly on Fig. S27 as a wider sampling slot towards the
surface. The large sample size of sub-sample A allowed a repeat analysis to be performed as a
demonstration of reproducibility. ARD 13 (Figs. S28 and S29) is located about 40 mm above
ARD 12 and consists of two sequential sub-samples.
Samples ARD 14 and ARD 15 date pigment applied to the left side of curtain 6
(Figs. S30, S31, S32), and both were collected using a hand-drill. A historical fracture of this
curtain has revealed the pigment in section, providing the opportunity to sample for both
minimum and maximum ages. ARD 14 was drilled from the middle of the curtain, and
represents a maximum age for the pigment. It consists of a single sample. ARD 15 is
carbonate formed on top of the pigment, and therefore represents a minimum age. It consists
of two sub-samples, and based on a visual assessment of the formation they are expected to be
approximately the same age as each other.
ARD 16 dates pigment applied to the edge of curtain 5 (Figs. S33, S34) and was sampled
using both a hand-drill and scalpel. It consists of three sub-samples of carbonate overlying the
pigment and therefore represents a minimum age. A lack of space made sampling difficult and
the growth direction of the curtain was not clear, therefore this sequence may not be strictly in
stratigraphic order.
3.3.2 Drapery between Panels III-C-2 and III-C-3, samples ARD 26 - 28
A layer of red pigment is visible in the section of broken drapery between Panel III-C-2
and III-C-3. Samples ARD 26 - 28 provide minimum and maximum ages for this pigment
(Fig. S35), all of which were collected by drilling.
ARD 26 consists of two sub-samples taken from immediately overlying the pigment, and
therefore provides a sequence of minimum ages. ARD 27 (a single sample) also provides a
minimum age, but consists of carbonate from several layers above the pigment and so formed

after ARD 26. ARD 28 (a single sample) was taken from ~2 mm beneath the pigment and
therefore represents a maximum age for its application.
3.3.3 Red pigment line in cross section of a curtain Panel II-C-8, samples ARD 6 to 10
Red paint on this curtain was partly covered by later continued growth of the formation
situated in Panel II-C-8. A breakage exposed the cross section and the red paint on the surface
extends as a clearly visible red layer interstratified with the carbonate formation (Fig. S10 and
S37) Fig. S36 shows the cross section of the curtain, exposed by the breakage, before
sampling and Fig. S38 shows details and the positions of samples ARD 6 to 10. Samples
ARD 6, 7 and 10 are drilled from the curtain underlying the red paint and yield maximum
ages for the painting. ARD 8 and 9 are drilled from the curtain formation above the paint and
yield minimum ages for the painting.

Supplementary Text
1. U-series results
1.1 La Pasiega
A total of 21 carbonate crusts from La Pasiega C have been analysed so far. Fourteen
results were previously published, nine in Pike et al (17) and five in Hoffmann et al. (14). For
this study, we analysed another seven crusts. All analytical results are provided in Table S4.
The quality of the dated material from La Pasiega is generally very good. The carbonate
crusts were pristine and visibly clean. There were no indications of alteration. For all samples
presented here, no residuals were found after dissolution and chemical sample preparation and
purification, and MC-ICPMS analyses were all successful. The U concentration of the
samples presented in this study ranges between 0.1 and 1.8 µg/g. This range is a bit wider but
similar to the previously reported range between 0.4 and 1.5 µg/g (14). The 234
U/238
U activity
ratios are generally elevated, with values between 2.28 and 4.25, confirming the previously
described elevated ratios for this cave.
For most samples the 232
Th/238
U activity ratio is below 0.01 and detrital contribution not
significant. However, the sample PAS 34, most relevant for this study, has elevated 232
Th/238
U
activity ratios. We were able to take three sequential samples (PAS 34 a, b, c). The dense and
pristine carbonate had some dust on the surface and appeared greyish, but the surface cleaning
revealed white carbonate. No indication of pigment was found on top of the carbonate. The
surface was cleaned, three visibly clean sub-samples were taken, and pigment was then
clearly revealed underlying the sampling spot.
There are slightly elevated levels of detrital 232
Th in samples a and b with 232
Th/238
U
activity ratios of 0.05 (230
Th/232
Th of 33 and 28, respectively). Sample PAS 34c has a
significant degree of detrital contamination with 232
Th/238
U activity ratios of 0.28 (230
Th/232
Th
of 7.3). A bulk earth value of the upper crust (238
U/232
Thact = 0.8 ± 0.4) is used for detrital
correction (see below). The dating results for the three sub samples are in strict stratigraphic
order. The outermost sample PAS 34a returned an age of 51.6 ± 1.1 ka and the subsequent
sample PAS 34b returned an age of 54.4 ± 1.4 ka. Uncorrected and corrected U-Th ages of the
two samples PAS 34a and PAS 34b overlap within uncertainty. Even based on just these two
results, obtained on samples with no significant detrital correction, the underlying art pre-
dates arrival of modern humans in the Iberian Peninsula with a minimum age of 53 ka based
on PAS 34b. Detrital correction for PAS 34c yields a corrected age of 79.7 ± 14.9 ka. This
sample, which is closest to the pigment, has a high degree of detrital components and thus a

significant uncertainty for the corrected age. The minimum age for the painting based on
PAS 34c is 64.8 ka. Uncorrected and corrected U-Th ages also overlap within uncertainty for
PAS 34c, albeit the uncertainty of the corrected age is large due to propagated uncertainties of
the detrital correction.
In most cases for samples from La Pasiega C a detrital correction is small and not
significant. For all PAS samples we apply a detrital corection using the conventional bulk
earth value, i.e. we assume a detrital 238
U/232
Th activity ratio (correction factor) of 0.8 with
50% uncertainty and a 238
U decay chain in the detrital component in secular equilibrium. This
value is used because we do not have isochron-based initial 230
Th/232
Th activity ratios for
carbonates in La Pasiega. Furthermore, there were no residuals left after sample digestion to
assess a residual detritus-based correction factor.
For this study, the most relevant sample from La Pasiega is PAS 34. While PAS 34a and
PAS 34b have relatively low detrital contamination, PAS 34c has a significant detrital
component with 232
Th concentration of 153 ± 7 ng/g compared to 238
U concentration of
178 ± 8 ng/g and a 230
Th/232
Th activity ratio of 7.3 ± 0.1. Here, the correction is significant.
This sub-sample can be used to constrain the maximum upper range of the detrital correction
factor to 3.57 (the measured 238
U/232
Th activity ratio is 3.57). In case of this value, all U in the
sample would be a result of detritus, a quite unrealistic scenario. Thus, the correction factor
for La Pasiega samples has to be significantly smaller than 3.57 and we use the conventional
bulk earth value of 0.8 ± 0.4.
To demonstrate that this correction factor is appropriate, we compare corrected results
for PAS 34 using two different correction factors of 0.8 ± 0.4 and 2.0 ± 0.4. For PAS 34a this
yields corrected ages of 51.6 ± 1.1 ka and 50.1 ± 1.1 ka, respectively. For PAS 34b this yields
corrected ages of 54.4 ± 1.4 ka and 52.6 ± 1.5 ka. For PAS 34c we obtain corrected ages of
79.7 ± 14.9 ka and 69.9 ± 25.2 ka. The 234
U/238
U isotope ratio is also affected by detrital
correction. The measured, uncorrected initial and corrected initial 234
U/238
U activity ratios are
used to assess how realistic a correction factor higher than 0.8 would be. The values for all
samples from Pasiega C are shown in Fig. S39. The measured 234
U/238
U for PAS 34 range
between 3.467 and 3.8 (Fig. S40). Using a correction factor of 0.8, the corrected 234
U/238
U
activity ratios for the three sub-samples of PAS 34 fall between 3.8 and 4.2, the resulting
calculated initial 234
U/238
U activity ratios are between 4.26 and 4.9. For all other samples from
La Pasiega C, where a detrital correction is not significant, the initial 234
U/238
U activity ratios,
derived from the corrected 234
U/238
U activity ratios, range between 2.16 and 5.12, so the
correction value of 0.8 yields initial 234
U/238
U activity ratios for PAS 34 within the range of

all results from this part of the cave. A higher correction factor, e.g. > 2 yields an initial
234U/
238U activity ratio > 10 for PAS 34c, well outside any other value for the cave and
unrealistic different to all other samples.
1.2 Maltravieso
Samples from Maltravieso can have significant levels of detrital contamination with
230Th/
232Th activity ratios as low as ~5 (Table S4), meaning that in some cases the detrital
correction is significant. No insoluble residues from the carbonate samples were present after
dissolution, so it was not possible to characterise the composition of the detrital component
through direct analyses of insoluble fractions. Instead, three sediment samples were collected
from within the cave. These were analysed following the methodologies detailed above, with
soluble and insoluble fractions processed separately. The mean measured 232
Th/238
U activity
ratio, regarded as a good proxy for the detrital component of the carbonate samples, was then
used for the detrital correction of samples from this cave: 238
U/232
Th = 3.3 ± 0.2 (errors are
given as 2σ standard errors of the mean, n = 3). This value represents the combined, mass-
balanced, soluble and insoluble fractions. Due to the dominance of the soluble fraction
(>95 % total mass of each sample) this value would be the same if only the 238
U/232
Th activity
ratios of the soluble fractions were used. Activity ratios for the 230
Th/238
U and 234
U/238
U are
again assumed to be = 1.0.
To test the applicability of this correction, a section of a fractured stalagmitic column
(MAL 24, Fig S41) was sampled from the Sala de las Pinturas. Six carbonate layers,
representing a stratigraphic sequence through the stalagmite, were hand-drilled to produce
powders for dating (MAL 24A–F). 230
Th/232
Th activity ratios ranged from 5 to 120
highlighting differing degrees of detrital contamination for different layers. When detrital
corrections employ an assumed detrital activity ratio of 238
U/232
Th = 0.8 ± 0.4, typical of
upper crustal silicates (51), sample MAL 24F (third from the core, 230
Th/232
Th activity ratio of
5.25) falls out of stratigraphic order. When detrital corrections employ the (sediment)
measured detrital activity ratio of 238
U/232
Th = 3.3 ± 0.2, all samples fall in stratigraphic order
within error (Fig. S41). This suggests that: 1) the assumed 238
U/232
Th activity ratio is not
appropriate for detrital corrections on samples from this cave, and 2) the measured 238
U/232
Th
activity ratio of the cave sediments is a better estimate of detrital values of the dating samples.
All carbonate samples from Maltravieso are therefore corrected using the measured sediment
detrital activity ratio of 238
U/232
Th = 3.3 ± 0.2. Note that this has the effect of making our
corrected ages younger than if they were corrected using 238
U/232
Th = 0.8 ± 0.4.

The age of hand stencil GS3b has been constrained by dating five sample sequences:
MAL 13, MAL 14, MAL 15, MAL 17 and MAL 19 (Table S4). MAL 13 consists of a pair of
samples, with the inner most sample dating to 70.1 (+ 3.8 - 3.4) ka. This gives a minimum age
of 66.7 ka for the stencil. The sample pair contains the surface cleaning sample in order to
demonstrate that results are stratigraphically consistent. The remaining sample sequences are
all stratigraphically consistent within error except for MAL 15A, however this case can be
explained by the widening of the sampling area during collection of sub-samples B and C
(Fig. S20) which would have incorporated increasing amounts of younger material from the
outer layers of the cauliflower formation. The inner most sample of MAL 15, in total a
sequence of six sub-samples, dates to 39.5 (+ 4.4 - 4.2) ka, giving a minimum age of 35.3 ka.
MAL 14 is a set of three sub-samples, and provides a minimum age of 23.1 ka, whilst
MAL 19, a set of two sequential sub-samples (once again including a surface cleaning sub-
sample) provides a minimum age of 14.7 ka. MAL 17 is a sequence of four sub-samples, with
the inner most sample dating to 63.6 (+ 9.6 - 8.4) ka. This gives a minimum age of 55.2 ka,
and supports the Neanderthal attribution of hand stencil GS3b implied by the date by
MAL 13.
The higher 238
U/232
Th activity ratio of 3.3 ± 0.2, derived from analysis of local sediment,
is preferred for the detrital correction of samples from Maltravieso. Table S3 shows corrected
ages for all samples from this cave for two scenarios of correction factors: i) the bulk earth
value of the upper crust (238
U/232
Th activity ratio = 0.8 ± 0.4) and ii) the mean value of the
sediment analyses (238
U/232
Th activity ratio of 3.3 ± 0.2). The data demonstrate that the choice
of detrital value makes no difference to the stratigraphic consistency of any of the sample sets.
It also does not affect any of our conclusions relating to Neanderthal authorship of the art
even though using our preferred detrital correction (238
U/232
Th activity ratio of 3.3 ± 0.2)
yields younger corrected ages than if the bulk earth value is used.
1.3 Ardales
Samples from Ardales are characterised by minor levels of detrital contamination, as
demonstrated by 230
Th/232
Th activity ratios >34 (Table S4). Following typical procedures, we
therefore correct for detrital contamination using an assumed detrital activity ratio of
238U/
232Th = 0.8 ± 0.4, typical of upper crustal silicates (51), and
230Th/
238U and
234U/
238U = 1.0 (i.e.
230Th,
234U and
238U isotopes are in secular activity equilibrium).
However, the correction is minor and, except for ARD 06, all corrected and uncorrected ages
overlap within their analytical uncertainties.

II-A-3 consists of a series of red painted curtain formations which have formed radiating
from a large stalagmitic boss. The pigment is about 40 to 140 cm above the present day
ground surface. The boss is free standing and not connected to the cave wall and so isolated
from possible sources of natural red oxide seeps. No red clays or minerals that could have
been ‘accidently’ transferred to the drapery are visible on the present surface, nor were they
present in layers excavated down to and including the Mousterian in the archaeological
trenches a few meters away (Fig. S9).
These curtains have fractured at some point during antiquity revealing pigment in
section, giving the opportunity to sample carbonate that provides both minimum and
maximum dates for art. ARD 16 dates carbonate overlying pigment on curtain 5. Three sub-
samples are stratigraphically consistent and provide a minimum age of 45.9 ka, indicating
Neanderthal authorship. ARD 14 dates carbonate underlying pigment on curtain 6. A single
date of 47.6 (+ 1.1 - 1.0) ka provides a maximum age for the art of 48.7 ka. ARD 15 dates
carbonate that overlies this pigment. A pair of samples, stratigraphically consistent within
error, provides a minimum age of 45.3 ka. The art on curtain 6 can therefore be constrained to
between 48.7 and 45.3 ka, again predating the arrival of modern humans to Iberia. ARD 12
and ARD 13 both date carbonate overlying pigment on curtain 8. ARD 12 consists of a
sequence of four sub-samples, however the outer sub-sample (46.4 ± 0.6 ka) is not
stratigraphically consistent with the inner three, which range from 42.6 ± 0.6 ka to
43.8 (+ 1.9 - 1.8) ka. It was noted during sampling that sub-samples were not being taken in a
strictly stratigraphic manner and the outer sample was removed from a much larger area
(Fig. S26), so it is likely that these factors are behind the stratigraphic inconsistency outlined
above. Bearing this in mind, and considering the outer sub-sample also overlies the pigment,
it is this outer sample that actually gives the best approximation to the age of the art. As a
result, a minimum age of 45.8 ka can be proposed. A further pair of sub-samples, ARD 13,
provides a further minimum age for this pigment. The outer sample, 47.1 ± 0.6 ka, is broadly
consistent with the dates from ARD 12. However, the inner sample indicates much older
antiquity: 68.1 (+ 3.0 - 2.6) ka. Pigment on curtain 8 is therefore older than 65.5 ka. Two
phases of art can be identified on this formation: one between 48.7 and 45.3 ka, as evidenced
from the dating of curtain 6, and one prior to 65.5 ka as evidenced from the dating of curtain 8
(Fig. S42). Both predate the arrival of modern humans.
A layer of red pigment is visible in the section of broken drapery between III-C-2 and
III-C-3. ARD 28 dates carbonate underlying this pigment and therefore provides a maximum
age for the art: 42.5 (+ 3.1 - 3.0) ka. ARD 26 and ARD 27 date carbonate overlying the

pigment and therefore provide minimum ages for the art. ARD 27 is located furthest from the
pigment, consists of a single sample, and dates to 37.3 ± 1.3 ka. ARD 26 is located nearer to
the pigment and consists of two sub-samples. These are stratigraphically consistent with each
other and with ARD 27 and ARD 28, with the inner of the two sub-samples dating to
40.4 ± 1.3 ka. The pigment on this formation can therefore be constrained to between 45.5
and 38.6 ka. This overlaps with the dating range of curtain 6 from II-A-3, so it is possible that
both were applied at the same time (45.3 to 45.5 ka).
Red paint can be seen on a curtain in Panel II-C-8, which continues as a red layer
interstratified between carbonate layers of the curtain, visible due to breakage. Samples were
obtained from both overlying and underlying carbonate layers and constrain minimum and
maximum age of the painting. The youngest sample of underlying carbonate yields a
maximum age of 63.7 ka (ARD 06) and both samples taken from the overlying carbonate
layer yield an identical minimum age of 32.1 ka (ARD 08 and ARD 09).

Fig. S1.
Map of the Iberian Peninsula. The dots indicate the locations of the three cave sites (1: La
Pasiega, 2: Maltravieso, 3: Ardales).
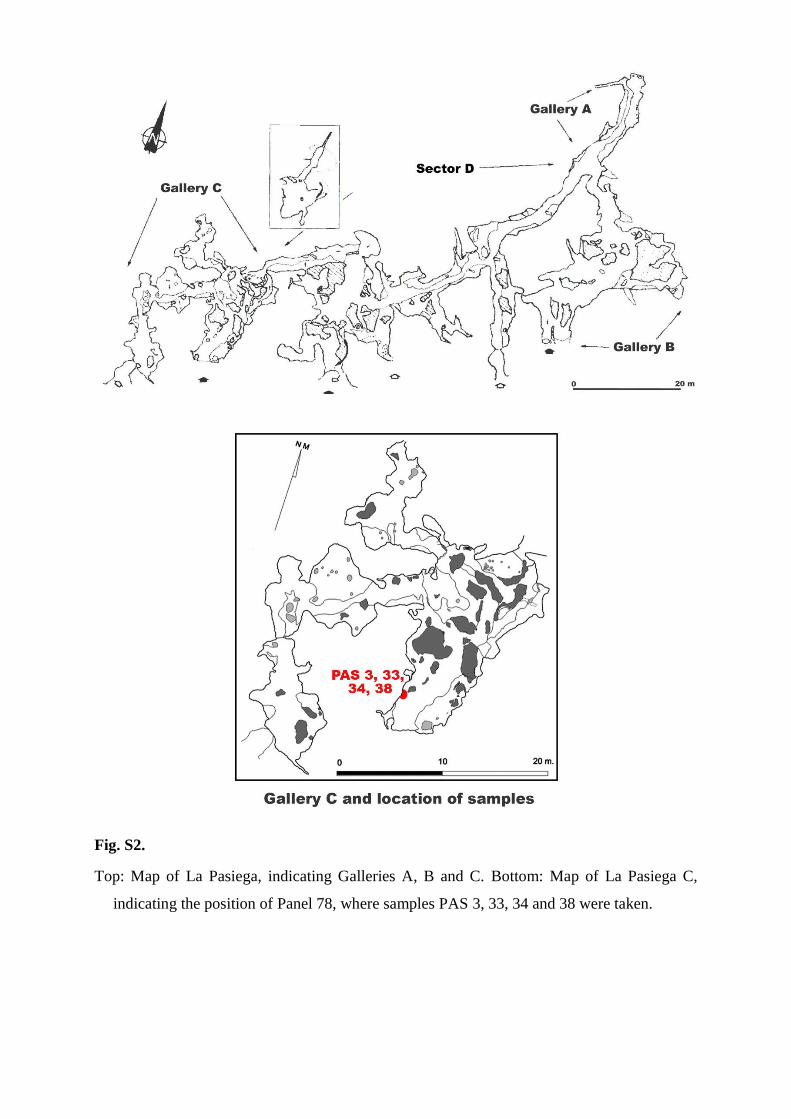
Fig. S2.
Top: Map of La Pasiega, indicating Galleries A, B and C. Bottom: Map of La Pasiega C,
indicating the position of Panel 78, where samples PAS 3, 33, 34 and 38 were taken.

Fig S3.
Panel 78, La Pasiega C.

Fig. S4.
La Pasiega C, rectangular, scalariform motif with incomplete zoomorphs and red dots on
Panel 78. Left: photo of the motif. Right: drawing by Breuil (taken from (21)).
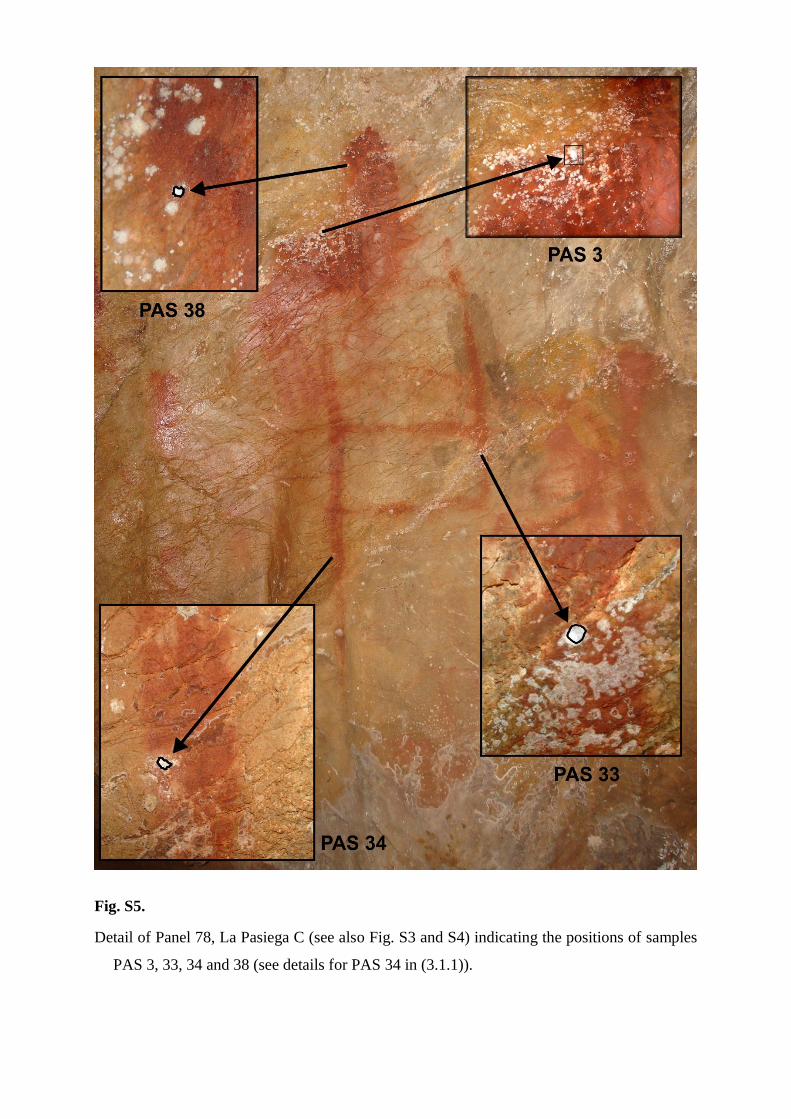
Fig. S5.
Detail of Panel 78, La Pasiega C (see also Fig. S3 and S4) indicating the positions of samples
PAS 3, 33, 34 and 38 (see details for PAS 34 in (3.1.1)).

Fig. S6.
(a) incomplete red deer located in Panel 78. (b) carbonate-covered red zoomorph, classified as
a hind by Breuil et al. (21) (Panel 82). (c) red tectiform (Panel 76). (d) red tectiform (Panel
72). Positions of samples PAS 35, 36, 38 and 39 are indicated.

Fig. S7.
Map of Maltravieso cave. In green are the painted panels. Hand stencil GS3b is located in the
Galería de la Serpiente.

Fig. S8.
Hand stencil GS3b, Maltravieso cave, prior to sampling. The upper picture shows the original
photo, the lower is the same picture after application of DStretch (25) (Correlation LRE
15%, auto contrast).

Fig. S9.
Map of Ardales cave. Positions are indicated of samples ARD 6 to 10 (Panel II-C-8); ARD 12
to 16 (Panel II-A-3) and ARD 26 to 28 (Panel III-C-2).
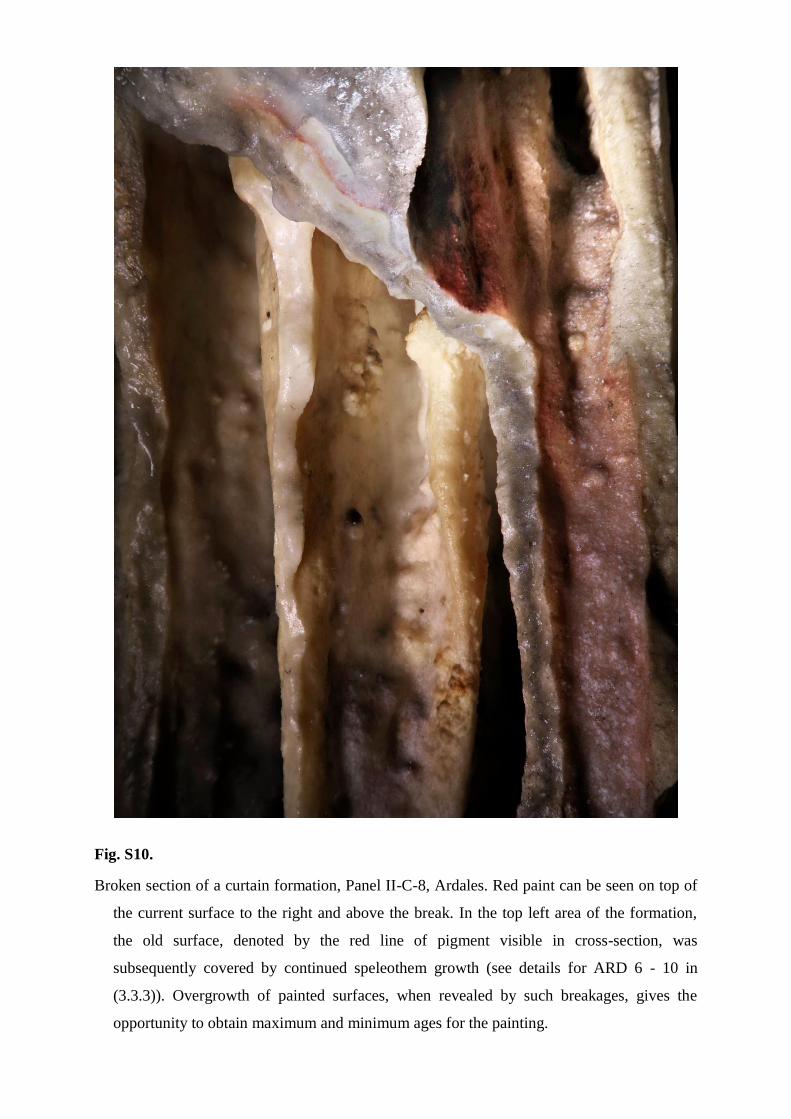
Fig. S10.
Broken section of a curtain formation, Panel II-C-8, Ardales. Red paint can be seen on top of
the current surface to the right and above the break. In the top left area of the formation,
the old surface, denoted by the red line of pigment visible in cross-section, was
subsequently covered by continued speleothem growth (see details for ARD 6 - 10 in
(3.3.3)). Overgrowth of painted surfaces, when revealed by such breakages, gives the
opportunity to obtain maximum and minimum ages for the painting.

Fig. S11.
Curtain formation, Panel II-A-3, Ardales. Red paint can be seen on the curtain in the middle
(see details for ARD 14 and 15 in (3.3.1)) and to the left.

Fig. S12.
Detail of a curtain formation, Panel II-A-3, Ardales. Note the red-painted old surface,
incompletely covered by the subsequent accumulation of new carbonate layers (see details
for ARD 16 in section 3.3.1).

Fig. S13.
Curtain formation, Panel II-A-3, Ardales. Red paint can be seen on the curtains in the middle
and on the right (see details for ARD 12 and 13 (3.3.1)).

Fig. S14.
Broken curtain formation close to Panel III-C-2, Ardales. Red paint applied on a surface now
completely covered by subsequent speleothem growth can be seen in cross-section as a
thin red line (see details for ARD 26, 27 and 28 in (3.3.2)).

Fig. S15.
Sampling details for PAS 34. (a) Scalariform motif; the black rectangle denotes the area
enlarged in (b). (b) The scalpel points onto the carbonate crust before sampling. (c) The
carbonate crust after the surface was scraped for initial cleaning. (d) The carbonate crust
after sampling, red pigment is visible in the centre, clearly underlying the remaining
carbonate.

Fig. S16.
Sampling of hand stencil GS3b, Maltravieso. The upper picture shows the original photo with
labelled sample locations, the lower is the same picture after application of DStretch
(Correlation CRGB 15 %, auto contrast). Pigment is clearly visible in the valleys and
cracks between carbonate growths.

Fig. S17.
Details of sampling for MAL 13: (a) prior to sampling, (b) after surface cleaning, (c) after
collection of MAL 13A.

Fig. S18.
Detail of MAL 13 after sampling. Pigment has become apparent in the bottom left of the
sampling area.
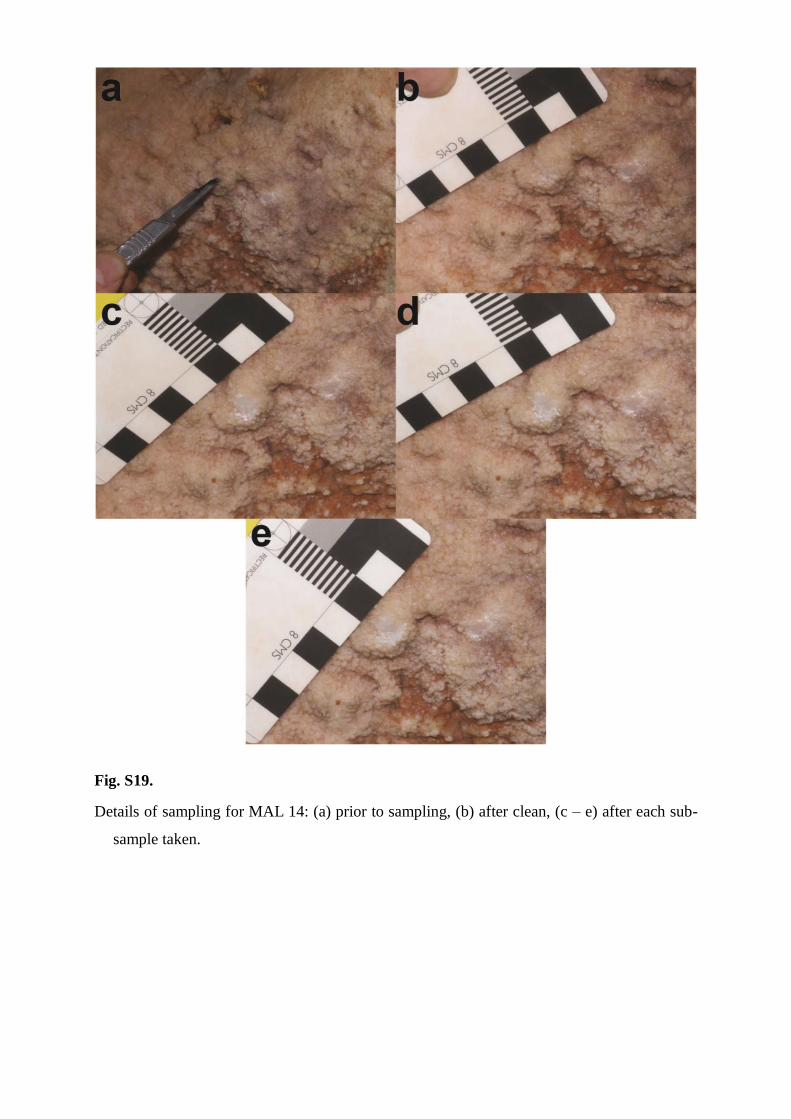
Fig. S19.
Details of sampling for MAL 14: (a) prior to sampling, (b) after clean, (c – e) after each sub-
sample taken.

Fig. S20.
Details of sampling for MAL 15: (a) prior to sampling, (b) after clean, (c – h) after each sub-
sample taken, (i) after final clean to confirm presence of underlying pigment. Note that the
enlargement of the sample area during collection of sub-samples MAL 15B and MAL 15C
(images d and e) explains the slight age inversion in this sequence.

Fig. S21.
Detail of MAL 14 and MAL 15 after sampling. Pigment is showing through the layers of
carbonate in the centre of the sampling area.

Fig. S22.
Details of sampling for MAL 17: (a) prior to sampling, (b) after cleaning, (c – f) after each
sub-sample taken.

Fig. S23.
Detail of MAL 17 after sampling with pigment apparent below the carbonate in the centre of
the sampling area.

Fig. S24.
Details of sampling for MAL 19: (a) prior to sampling, (b) after cleaning, (c) after collection
of MAL 19A.

Fig. S25.
Detail of MAL 19 after sampling. Sampling stopped when pigment became apparent below
the lowest layers of carbonate.

Fig. S26.
Details of sampling for ARD 12: (a) prior to sampling, (b) after cleaning, (c – f) after each
sub-sample taken.

Fig. S27.
Detail of ARD 12 after sampling. Pigment is clearly visible towards the base of the sample
area.

Fig. S28.
Details of sampling for ARD 13: (a) prior to sampling, (b) after clean, (c – d) after each sub-
sample taken.

Fig. S29.
Detail of ARD 13 after sampling. Pigment is clearly visible towards the base of the sample
area.

Fig. S30.
Details of sampling for ARD 14: (a) prior to sampling, (b) after cleaning, (c) after collecting
sample ARD 14A.

Fig. S31.
Details of ARD 14 and ARD 15 after sampling. The painted surface is seen as a line of
pigment to the left of ARD 14 and to the right of ARD 15.

Fig. S32.
Details of sampling for ARD 15: (a) after cleaning, (b) after collecting sample ARD 15A, (c)
after collecting sample ARD 15B. Note sample location of ARD 15 is located below and to
the left of ARD 14, see also Fig. S31.

Fig. S33.
Details of sampling for ARD 16: (a) prior to sampling, (b) after cleaning, (c - e) after each
sub-sample taken.

Fig. S34.
Detail of ARD 16 after sampling with pigment clearly visible under the carbonate.

Fig. S35.
Sampling pigment on drapery between Panels III-C-2 and III-C-3, Ardales (ARD 26–28): (a)
prior to sampling, (b) after sampling.

Fig. S36.
Panel II-C-8, Ardales. Surface of broken section of the curtain before sampling. The red
painted exposed surface continues as a line of pigment visible in the broken drapery where
it has been covered by subsequent calcite formation.
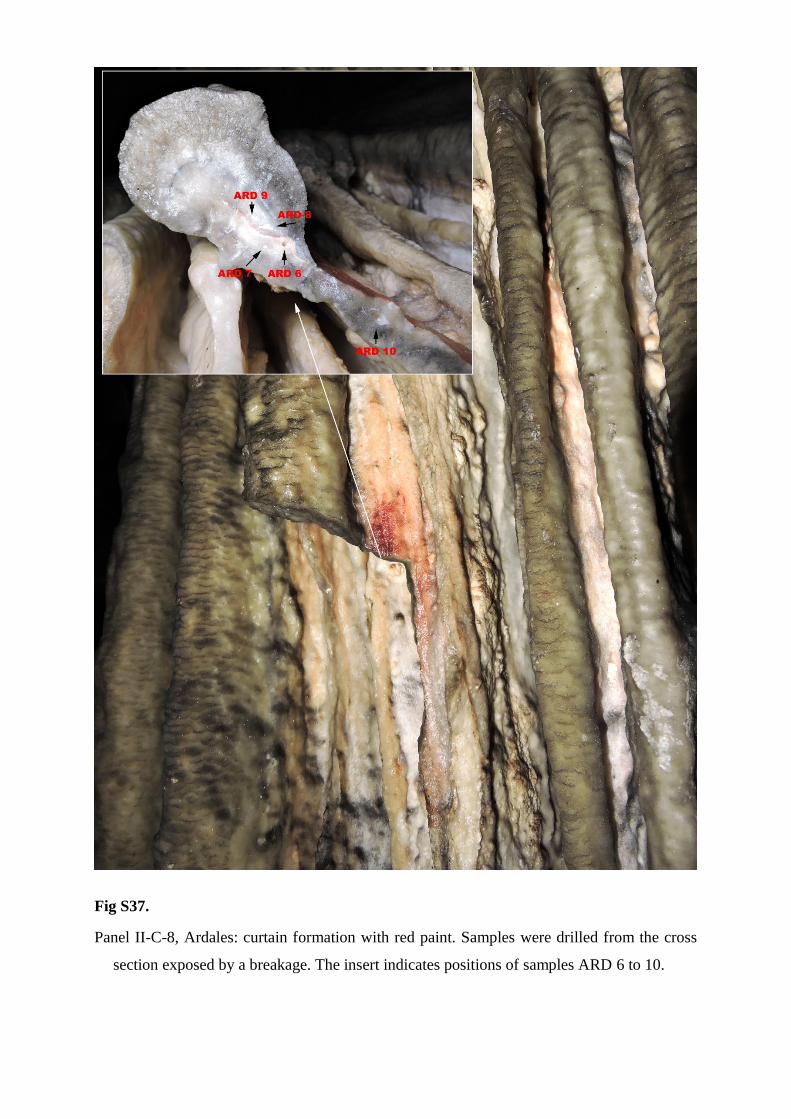
Fig S37.
Panel II-C-8, Ardales: curtain formation with red paint. Samples were drilled from the cross
section exposed by a breakage. The insert indicates positions of samples ARD 6 to 10.

Fig S38.
Panel II-C-8, Ardales. Surface of broken section of the curtain after sampling. Top: Details of
samples ARD 6 to 9. Bottom: Detail of sample ARD 10.
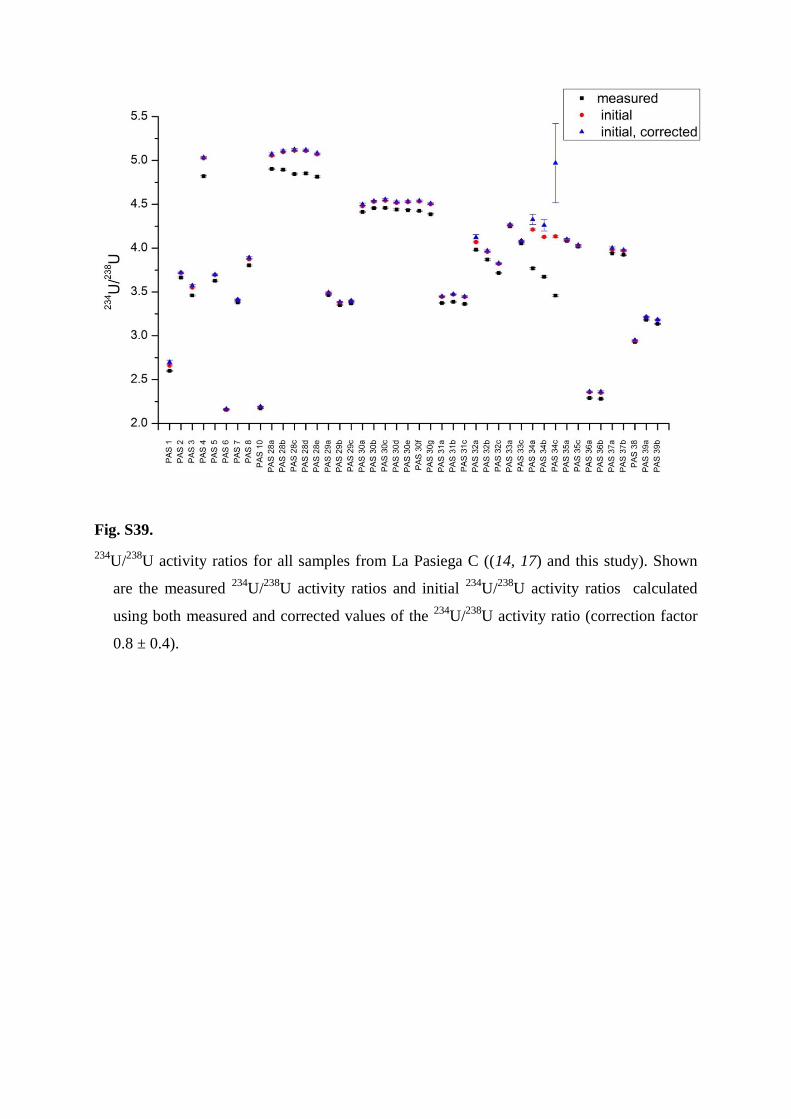
Fig. S39.
234U/
238U activity ratios for all samples from La Pasiega C ((14, 17) and this study). Shown
are the measured 234
U/238
U activity ratios and initial 234
U/238
U activity ratios calculated
using both measured and corrected values of the 234
U/238
U activity ratio (correction factor
0.8 ± 0.4).

Fig. S40.
234U/
238U activity ratios for PAS 34 sub samples. Shown in black are the measured
234U/
238U
activity ratios and the initial 234
U/238
U activity ratios using the measured value to calculate
an age. The same is shown in red for the corrected 234
U/238
U activity ratios, using a
correction factor of 0.8 ± 0.4.

Fig. S41.
Sampling and dating the Maltravieso boss (MAL 24): (a) prior to sampling, (b) after
sampling, (c) locations of the drilled sub-samples A–F (note that powders from multiple
drill holes within each layer were combined to produce one dating sample per layer), (d)
corrected U-Th ages for six carbonate sub-samples using i) an assumed detrital activity
ratio of 238
U/232
Th = 0.8 ± 0.4 (black data labels) and ii) a measured (sediment) detrital
activity ratio of 238
U/232
Th = 3.3 ± 0.2 (grey data labels); errors are fully propagated 2σ
standard errors of the mean.

Fig. S42.
Summary of dating results from Ardales cave. The results show at least two discrete phases of
painting.

Table S1.
U isotopic composition of standard solutions measured in MPI EVA. All ratios are
concentration ratios.
Standard 234
U/238
U 235
U/238
U 236
U/238
U
REIMEP 18 A (5.6545 ± 0.0049)∙10-5
(7.2533 ± 0.0036)∙10-3
(2.9482 ± 0.0133)∙10-8
certified value
(39)
(5.6582 ± 0.0041)∙10-5
(7.2542 ± 0.0036)∙10-3
(3.0579 ± 0.0083)∙10-8
REIMEP 18 B (3.3292 ± 0.0026)∙10-4
3.5469 ± 0.0012)∙10-2
(3.8811 ± 0.0030)∙10-4
certified value
(39)
(3.3271 ± 0.0022)∙10-4
(3.5470 ± 0.0018)∙10-2
(3.8828 ± 0.0013)∙10-4
IRMM 183 (1.9772 ± 0.0020)∙10-5
(3.2127 ± 0.0032)∙10-3
(1.4845 ± 0.0011)∙10-4
certified value
(40)
(1.9755 ± 0.0022)∙10-5
(3.2157 ± 0.0016)∙10-3
(1.4836 ± 0.0005)∙10-4
URAN 84.5 (5.4891 ± 0.0044)∙10-5
(7.2565 ± 0.0025)∙10-3
-
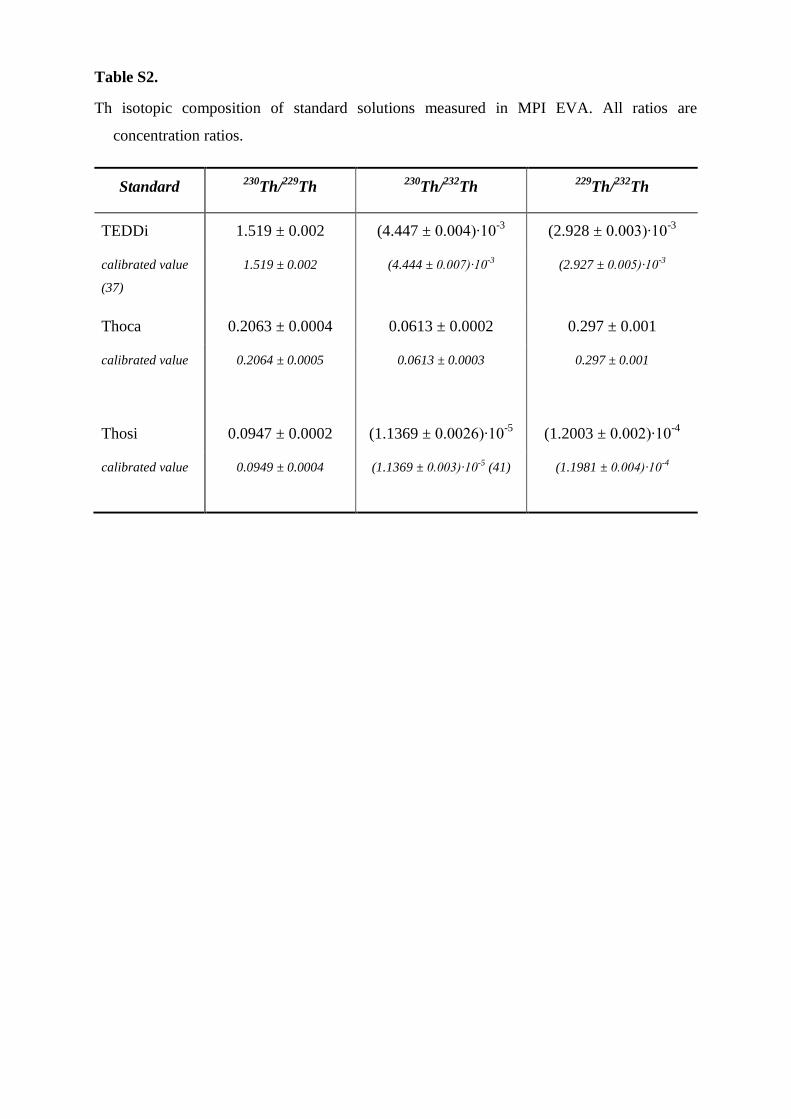
Table S2.
Th isotopic composition of standard solutions measured in MPI EVA. All ratios are
concentration ratios.
Standard 230
Th/229
Th 230
Th/232
Th 229
Th/232
Th
TEDDi 1.519 ± 0.002 (4.447 ± 0.004)∙10-3
(2.928 ± 0.003)∙10-3
calibrated value
(37)
1.519 ± 0.002 (4.444 ± 0.007)∙10-3
(2.927 ± 0.005)∙10-3
Thoca 0.2063 ± 0.0004 0.0613 ± 0.0002 0.297 ± 0.001
calibrated value 0.2064 ± 0.0005 0.0613 ± 0.0003 0.297 ± 0.001
Thosi 0.0947 ± 0.0002 (1.1369 ± 0.0026)∙10-5
(1.2003 ± 0.002)∙10-4
calibrated value 0.0949 ± 0.0004 (1.1369 ± 0.003)∙10-5
(41) (1.1981 ± 0.004)∙10-4

Table S3.
U-Th ages for all Maltravieso speleothem samples using two different correction factors i) a
bulk earth activity ratio of 238
U/232
Th = 0.8 ± 0.4 and ii) a measured (sediment) detrital
activity ratio of 238
U/232
Th = 3.3 ± 0.2.
Sample ID Lab ID
Age corrected [ka] Age corrected [ka]
(238
U/232
Th)A = 0.8 ± 0.4 (238
U/232
Th)A = 3.3 ± 0.2
MAL13 Clean UoS-UTh-A112
50.62 + 3.38 - 3.02 41.68 + 2.44 - 2.29
MAL 13A UoS-UTh-A98
73.72 + 3.99 - 3.67 70.08 + 3.82 - 3.37
MAL 14A UoS-UTh-A79
19.05 + 1.08 - 1.05 16.94 + 0.93 - 0.92
MAL 14B UoS-UTh-A71
24.36 + 0.52 - 0.51 23.59 ± 0.47
MAL 14C UoS-UTh-A80
22.82 + 1.15 - 1.09 22.35 + 1.10 - 1.14
MAL 15A UoS-UTh-A178
23.39 + 2.46 - 2.5 20.66 + 2.46 - 2.44
MAL 15B UoS-UTh-A133
18.53 + 1.75 - 1.69 16.92 + 1.74 - 1.70
MAL 15C UoS-UTh-A179
15.7 + 1.77 - 1.72 15.29 + 1.79 - 1.74
MAL 15D UoS-UTh-A134
17.53 + 0.48 - 0.48 17.15 + 0.45 - 0.46
MAL 15E UoS-UTh-A180
20.01 + 0.57 - 0.57 18.37 + 0.38 - 0.39
MAL 15F UoS-UTh-A135
42.39 + 4.58 - 4.26 39.48 + 4.45 - 4.21
MAL 17A UoS-UTh-A148
15.48 + 1.43 - 1.4 14.18 + 1.38 - 1.40
MAL 17B UoS-UTh-A150
18.79 + 1.49 - 1.54 15.3 + 1.21 - 1.24
MAL 17C UoS-UTh-A171
43.91 + 2.27 - 2.3 37.25 + 1.73 - 1.70
MAL 17D UoS-UTh-A151
68.04 + 9.37 - 8.87 63.63 + 9.60 - 8.39
MAL 19 Clean UoS-UTh-A136 16.39 + 5.44 - 5.13 1.13 + 4.16 - 1.04
MAL 19A UoS-UTh-A137
21.66 + 2.99 - 2.95 17.31 + 2.83 - 2.60
MAL 24A UoS-UTh-A159
188.5 + 10.60 - 9.46 174.37 + 10.34 - 9.50
MAL 24B UoS-UTh-A160
190.62 + 13.68 - 11.74 183.63 + 14.31 - 12.31
MAL 24F UoS-UTh-A161
286.25 + 44.63 - 30.9 212.26 + 70.18 - 39.33
MAL 24C UoS-UTh-A164
72.28 + 3.24 - 3.16 69.98 + 3.26 - 3.11
MAL 24D UoS-UTh-A165
61.37 + 9.01 - 8.5 60.39 + 9.28 - 8.50
MAL 24E UoS-UTh-A166
12.47 + 1.82 - 1.84 6.65 + 1.11 - 1.04

78
Table S4.
U-series results for La Pasiega C, Maltravieso and Ardales.
Spl ID Lab ID
238U
[ng/g]
232Th
[ng/g]
232Th/
238U
230Th/
232Th
230Th/
238U
234U/
238U Age
uncorrected
[ka]
234U/
238Uini
uncorrected
Age
corrected
[ka]
234U/
238Uini
corrected
PAS 33a UEVA 174 1205.36
± 76.53
7.76
± 0.51
0.0021
± 0.00002
28.27
± 0.76
0.0595
± 0.0018
4.2495
± 0.0078
1.54 ± 0.05 4.2636 ± 0.0079 1.49 ± 0.05 4.2687 ± 0.0083
PAS 33c UEVA 175 1799.10
± 377.05
5.03
± 1.01
0.0009
± 0.000008
124.09
± 1.85
0.1134
± 0.0019
4.0552
± 0.0077
3.09 ± 0.05 4.0820 ± 0.0078 3.07 ± 0.05 4.0841 ± 0.0079
PAS 34a UEVA 176 289.29
± 9.06
40.81
± 1.29
0.0461
± 0.0001
32.82
± 0.21
1.5149
± 0.0106
3.7694
± 0.0082
52.52 ± 0.47 4.2126 ± 0.0092 51.56 ± 1.09 4.3266 ± 0.0562
PAS 34b UEVA 309 215.56
± 7.43
36.00
± 1.22
0.0548
± 0.0001
28.28
± 0.19
1.5453
± 0.0121
3.6744
± 0.0094
55.53 ± 0.56 4.1288 ± 0.0105 54.36 ± 1.39 4.2616 ± 0.0654
PAS 34c UEVA 177 178.31
± 8.31
152.93
± 7.10
0.2803
± 0.0006
7.25
± 0.07
2.0348
± 0.0213
3.4591
± 0.0092
85.79 ± 1.28 4.1338 ± 0.0141 79.66 ± 14.90 4.9705 ± 0.4511
PAS 35a BIG-UTh-A 1282 747.99
± 35.55
9.54
± 0.48
0.0042 ±
0.00004
7.51
± 0.27
0.0314
± 0.0012
4.0833
± 0.0077
0.84 ± 0.03 4.0907 ± 0.0078 0.75 ± 0.05 4.1002 ± 0.0094
PAS 35c BIG-UTh-A 1283 508.65
± 11.64
4.62
± 0.13
0.0030
± 0.00003
14.59
± 0.34
0.0434
± 0.0012
4.0177
± 0.0080
1.18 ± 0.03 4.0278 ± 0.0081 1.12 ± 0.04 4.0345 ± 0.0089
PAS 36a UEVA 178 108.99
± 2.88
2.40
± 0.06
0.0072
± 0.00005
48.57
± 0.78
0.3507
± 0.0053
2.2893
± 0.0067
17.88 ± 0.29 2.3562 ± 0.0070 17.61 ± 0.31 2.3630 ± 0.0080
PAS 36b UEVA 179 103.82
± 1.73
4.16
± 0.08
0.0131
± 0.00008
27.08
± 0.41
0.3551
± 0.0049
2.2819
± 0.0063
18.19 ± 0.27 2.3495 ± 0.0065 17.70 ± 0.34 2.3619 ± 0.0096
PAS 37a UEVA 182 504.87
± 11.86
12.87
± 0.31
0.0083
± 0.00004
21.86
± 0.18
0.1823
± 0.0015
3.9407
± 0.0071
5.14 ± 0.04 3.9838 ± 0.0071 4.96 ± 0.09 4.0022 ± 0.0123
PAS 37b UEVA 183 572.25
± 14.24
6.16
± 0.16
0.0035
± 0.00002
54.67
± 0.60
0.1927
± 0.0019
3.9250
± 0.0072
5.46 ± 0.06 3.9706 ± 0.0072 5.39 ± 0.06 3.9783 ± 0.0084
PAS 38 UEVA 184 818.24
± 38.55
13.62
± 0.60
0.0054
± 0.00003
11.36
± 0.19
0.0619
± 0.0010
2.9292
± 0.0060
2.33 ± 0.04 2.9419 ± 0.0060 2.16 ± 0.09 2.9495 ± 0.0074
PAS 39a UEVA 185 947.23
± 16.41
2.57
± 0.05
0.0009
± 0.000005
166.11
± 1.23
0.1476
± 0.0010
3.1821
± 0.0054
5.16 ± 0.04 3.2142 ± 0.0054 5.13 ± 0.04 3.2156 ± 0.0055
PAS 39b UEVA 186 1041.25
± 24.11
0.62
± 0.02
0.0002
± 0.000001
1091.00
± 9.13
0.2110
± 0.0013
3.1364
± 0.0054
7.55 ± 0.05 3.1824 ± 0.0055 7.54 ± 0.05 3.1827 ± 0.0055
ARD 06 UEVA 955 511.42
± 6.38
20.85
± 0.25
0.0134
± 0.00003
34.95
± 0.14
0.4661
± 0.0021
1.0459
± 0.0021
64.09 ± 0.44 1.0551 ± 0.0025 62.97 ± 0.69 1.0555 ± 0.0025
ARD 07 UEVA 956 244.34
± 2.62
1.85
± 0.02
0.0025
± 0.00001
231.17
± 1.60
0.5728
± 0.0029
1.0314
± 0.0023
88.01 ± 0.77 1.0403 ± 0.0030 87.80 ± 0.78 1.0404 ± 0.0030

79
ARD 08 UEVA 957 297.21
± 2.89
1.69
± 0.02
0.0019
± 0.00001
145.58
± 1.06
0.2703
± 0.0018
1.0477
± 0.0024
32.51 ± 0.26 1.0523 ± 0.0026 32.35 ± 0.27 1.0523 ± 0.0026
ARD 09 UEVA 958 298.83
± 2.67
1.78
± 0.02
0.0020
± 0.00001
138.12
± 0.95
0.2690
± 0.0014
1.0430
± 0.0022
32.50 ± 0.22 1.0471 ± 0.0024 32.33 ± 0.23 1.0472 ± 0.0024
ARD 10 UEVA 1005 182.17
± 3.27
1.80
± 0.03
0.0032
± 0.00002
141.85
± 1.42
0.4577
± 0.0039
1.0338
± 0.0036
63.60 ± 0.81 1.0405 ± 0.0042 63.33 ± 0.82 1.0405 ± 0.0043
ARD 12A UoS-UTh-A245 509.8
± 5.04
4.20
± 0.04
0.002698
± 0.000017
134.23
± 0.96
0.3622
± 0.0034
1.0394
± 0.0026
46.64 + 0.57
- 0.55
1.0449 ± 0.0029 46.41 ± 0.59 1.0450 ± 0.0030
ARD 12A
repeat
UoS-UTh-A284 511.25
± 5.43
4.05
± 0.05
0.002592
± 0.000016
139.06
± 0.89
0.3605
± 0.0035
1.0386
± 0.0038
46.41 + 0.63
- 0.58
1.0440 ± 0.0042 46.20 ± 0.60 1.0441 ± 0.0043
ARD 12B UoS-UTh-A246 244.8
± 2.83
3.71
± 0.05
0.004957
± 0.000029
68.27
± 0.6
0.3384
± 0.0033
1.0366
± 0.0039
43.04 ± 0.55 1.0414 ± 0.0044 42.63 ± 0.60 1.0415 ± 0.0044
ARD 12C UoS-UTh-A236 207.5
± 3.32
3.73
± 0.06
0.005877
± 0.000084
57.42
± 1.23
0.3374
± 0.0082
1.0319
± 0.0386
43.15 + 2.68
- 2.37
1.0360 ± 0.0433 42.65 + 2.50
- 2.34
1.0361 ± 0.0435
ARD 12D UoS-UTh-A237 214.88
± 8.90
4.22
± 0.19
0.006427
± 0.000108
53.69
± 1.37
0.3450
± 0.0110
1.0320
± 0.0147
44.33 + 1.92
- 1.89
1.0363 ± 0.0166 43.79 + 1.93
- 1.84
1.0364 ± 0.0166
ARD 13A UoS-UTh-A222 1229.61
± 25.84
9.00
± 0.19
0.002396
± 0.000014
152.83
± 1.14
0.3661
± 0.0033
1.0385
± 0.0033
47.33 + 0.57
- 0.56
1.0440 ± 0.0038 47.13 + 0.56
- 0.57
1.0441 ± 0.0038
ARD 13B UoS-UTh-A223 331.54
± 13.53
11.60
± 0.44
0.011452
± 0.000070
42.59
± 0.58
0.4878
± 0.0073
1.0369
± 0.0234
69.09 + 2.93
- 2.62
1.0449 ± 0.0281 68.13 + 2.96
- 2.62
1.0452 ± 0.0283
ARD 14A UoS-UTh-A231 684.76
± 13.29
1.95
± 0.04
0.000932
± 0.000012
395.03
± 4.91
0.3683
± 0.0063
1.0379
± 0.0029
47.72 + 1.05
- 1.02
1.0434 ± 0.0033 47.64 + 1.07
- 1.03
1.0434 ± 0.0033
ARD 15A UoS-UTh-A232 1696.03
± 53.88
5.51
± 0.20
0.001063
± 0.000011
337.14
± 3.63
0.3584
± 0.0050
1.0374
± 0.0025
46.15 + 0.81
- 0.82
1.0426 ± 0.0029 46.06 + 0.81
- 0.77
1.0427 ± 0.0029
ARD 15B UoS-UTh-A233 667.98
± 37.85
4.65
± 0.29
0.002280
± 0.000043
152.07
± 3.27
0.3467
± 0.0110
1.0347
± 0.0061
44.45 + 1.79
- 1.82
1.0393 ± 0.0068 44.25 + 1.78
- 1.77
1.0394 ± 0.0068
ARD 16A UoS-UTh-A247 313.84
± 5.88
5.40
± 0.11
0.005629
± 0.000031
58.92
± 0.74
0.3317
± 0.0044
1.0323
± 0.0051
42.23 + 0.74
- 0.72
1.0364 ± 0.0057 41.75 ± 0.77 1.0365 ± 0.0057
ARD 16B UoS-UTh-A248 250.2
± 4.29
3.29
± 0.07
0.004306
± 0.000036
84.25
± 0.84
0.3628
± 0.0050
1.0314
± 0.0051
47.23 + 0.85
- 0.83
1.0359 ± 0.0058 46.86 + 0.85
- 0.92
1.0360 ± 0.0058
ARD 16C UoS-UTh-A249 227.59
± 28.55
4.53
± 0.58
0.006509
± 0.000172
56.70
± 2.84
0.3690
± 0.0213
1.0227
± 0.0342
48.79 + 4.26
- 4.00
1.0260 ± 0.0391 48.23 + 4.43
- 4.10
1.0261 ± 0.0392
ARD 26A UoS-UTh-A238 564.64
± 13.56
0.56
± 0.02
0.000323
± 0.000010
1004.53
± 20.81
0.3243
± 0.0099
1.0502
± 0.0203
40.20 + 1.84
- 1.69
1.0563 ± 0.0226 40.17 + 1.73
- 1.77
1.0563 ± 0.0226
ARD 26B UoS-UTh-A239 532.37
± 14.02
0.54
± 0.02
0.000330
± 0.000011
985.93
± 24.33
0.3258
± 0.0112
1.0496
± 0.0113
40.45 + 1.82
- 1.70
1.0556 ± 0.0125 40.42 + 1.79
- 1.78
1.0556 ± 0.0125
ARD 27A UoS-UTh-A240 491.08
± 7.58
0.46
± 0.01
0.000303
± 0.000006
1002.62
± 26.5
0.3040
± 0.0087
1.0481
± 0.0068
37.30 + 1.32
- 1.31
1.0535 ± 0.0075 37.28 ± 1.30 1.0535 ± 0.0075
ARD 28A UoS-UTh-A241 520.54
± 8.11
0.12
± 0.01
0.000073
± 0.000004
4626.61
± 188.57
0.3379 ±
0.0192
1.0458
± 0.0124
42.48 + 3.09
- 2.91
1.0516 ± 0.0138 42.47 + 3.07
- 2.97
1.0516 ± 0.0138
MAL 13 UoS-UTh-A112 117.2 13.32 0.037192 12.47 0.4639 ± 1.1872 53.32 + 2.30 1.2177 ± 0.0369 41.68 + 2.44 1.2401 ± 0.0412

80
Clean ± 1.99 ± 0.21 ± 0.000233 ± 0.16 0.0068 ± 0.0328 - 2.13 - 2.29
MAL 13A UoS-UTh-A98 142.69
± 3.39
7.05
± 0.21
0.016177
± 0.000189
37.50
± 0.57
0.6067
± 0.0123
1.2024
± 0.0305
74.86 + 3.78
- 3.41
1.2501 ± 0.0356 70.08 + 3.82
- 3.37
1.2606 ± 0.0373
MAL 14A UoS-UTh-A79 209.87
± 2.41
5.93
± 0.08
0.009244
± 0.000058
21.65
± 0.88
0.2001
± 0.0078
1.2059
± 0.0067
19.71 + 0.84
- 0.83
1.2177 ± 0.0070 16.94 + 0.93
- 0.92
1.2228 ± 0.0072
MAL 14B UoS-UTh-A71 287.55
± 4.39
3.05
± 0.11
0.003467
± 0.000126
71.64
± 2.33
0.2484
± 0.0037
1.2236
± 0.0088 24.60 ± 0.45
1.2397 ± 0.0093 23.59 ± 0.47 1.2418 ± 0.0094
MAL 14C UoS-UTh-A80 439.04
± 8.30
2.87
± 0.07
0.002142
± 0.000038
109.67
± 4.91
0.2349
± 0.0102
1.2308
± 0.0071
22.97 + 1.11
- 1.14
1.2463 ± 0.0074 22.35 + 1.10
- 1.14
1.2476 ± 0.0075
MAL 15A UoS-UTh-A178 168.69
± 6.85
6.18
± 0.40
0.011997
± 0.000622
20.26
± 1.47
0.2430
± 0.0213
1.2135
± 0.0052
24.24 + 2.48
- 2.32
1.2286 ± 0.0054 20.66 + 2.46
- 2.44
1.2357 ± 0.0058
MAL 15B UoS-UTh-A133 299.61
± 7.02
6.55
± 0.16
0.007157
± 0.000102
27.39
± 2.11
0.1960
± 0.0158
1.2195
± 0.0161
19.04 + 1.71
- 1.66
1.2316 ± 0.0168 16.92 + 1.74
- 1.70
1.2358 ± 0.0172
MAL 15C UoS-UTh-A179 490.44
± 11.16
2.77
± 0.22
0.001849
± 0.000123
89.93
± 6.52
0.1663
± 0.0170
1.2268
± 0.0029
15.83 + 1.71
- 1.70
1.2371 ± 0.0030 15.29 + 1.79
- 1.74
1.2382 ± 0.0030
MAL 15D UoS-UTh-A134 791.42
± 10.52
4.19
± 0.08
0.001730
± 0.000020
106.56
± 2.04
0.1844
± 0.0044
1.2295
± 0.0042
17.65 + 0.45
- 0.46
1.2413 ± 0.0044 17.15 + 0.45
- 0.46
1.2423 ± 0.0044
MAL 15E UoS-UTh-A180 519.3
± 11.49
11.58
± 0.26
0.007299
± 0.000038
28.84
± 0.3
0.2105
± 0.0028
1.2220
± 0.0024
20.53 + 0.30
- 0.29
1.2353 ± 0.0025 18.37 + 0.38
- 0.39
1.2396 ± 0.0027
MAL 15F UoS-UTh-A135 286.89
± 11.69
10.83
± 0.47
0.012350
± 0.000212
31.12
± 2.6
0.3843
± 0.0300
1.1642
± 0.0328
43.30 + 4.65
- 4.23
1.1856 ± 0.0363 39.48 + 4.45
- 4.21
1.1914 ± 0.0375
MAL 17A UoS-UTh-A148 301.46
± 5.79
5.36
± 0.13
0.005814
± 0.000088
28.69
± 2.21
0.1668
± 0.0132
1.2268
± 0.0037
15.89 + 1.36
- 1.35
1.2372 ± 0.0039 14.18 + 1.38
- 1.40
1.2406 ± 0.0040
MAL 17B UoS-UTh-A150 304.45
± 5.37
14.46
± 0.26
0.015545
± 0.000111
13.33
± 0.6
0.2072
± 0.0104
1.2383
± 0.0035
19.88 + 1.09
- 1.08
1.2521 ± 0.0037 15.3 + 1.21
- 1.24
1.2623 ± 0.0044
MAL 17C UoS-UTh-A171 243.68
± 6.90
21.04
± 0.73
0.028253
± 0.000383
14.66
± 0.33
0.4141
± 0.0100
1.1936
± 0.0038
45.95 + 1.37
- 1.35
1.2204 ± 0.0042 37.25 + 1.73
- 1.70
1.2372 ± 0.0059
MAL 17D UoS-UTh-A151 190.44
± 9.22
10.52
± 0.56
0.018068
± 0.000357
29.68
± 2.97
0.5362 ±
0.0496
1.1278
± 0.0075
69.42 + 9.12
- 8.62
1.1555 ± 0.0088 63.63 + 9.60
- 8.39
1.1627 ± 0.0094
MAL 19
Clean
UoS-UTh-A136 109.03
± 1.82
19.96
± 0.36
0.059902
± 0.000375
3.47
± 0.43
0.2079
± 0.0257
1.1916
± 0.0288
20.83 + 2.89
- 2.83
1.2032 ± 0.0303 1.13 + 4.16
- 1.04
1.2395 ± 0.0371
MAL 19A UoS-UTh-A137 199.77
± 4.78
11.56
± 0.29
0.018932
± 0.000174
12.25
± 1.26
0.232
± 0.0237
1.2140
± 0.0239
23.02 + 2.68
- 2.64
1.2283 ± 0.0251 17.31 + 2.83
- 2.60
1.2397 ± 0.0266
MAL 24A UoS-UTh-A159 121.05
± 1.56
19.94
± 0.25
0.053889
± 0.000296
17.11
± 0.29
0.9218
± 0.0169
1.0914
± 0.0032
192.65 + 10.07
- 8.82
1.1575 ± 0.0047 174.37 + 10.34
- 9.50
1.1819 ± 0.0091
MAL 24B UoS-UTh-A160 101.8
± 1.45
8.83
± 0.12
0.028376
± 0.000195
32.74
± 0.73
0.9292
± 0.0228
1.0984
± 0.0040
192.76 + 13.39
- 12.24
1.1696 ± 0.0058 183.63 + 14.31
- 12.31
1.1824 ± 0.0072
MAL 24F UoS-UTh-A161 145.5
± 1.72
87.71
± 1.14
0.197236
± 0.001066
5.25
± 0.07
1.0353
± 0.0148
1.0797
± 0.0031
301.88 + 23.92
- 20.38
1.1871 ± 0.0032 212.26 + 70.18
- 39.33
1.4160 ± 0.0594
MAL 24C UoS-UTh-A164 127.6
± 1.52
3.62
± 0.08
0.009274
± 0.000194
58.22
± 1.33
0.5400
± 0.0167
1.0980
± 0.0028
73 + 3.24
- 3.23
1.1204 ± 0.0034 69.98 + 3.26
- 3.11
1.1231 ± 0.0036

81
MAL 24D UoS-UTh-A165 62.98
± 0.70
0.79
± 0.06
0.004096
± 0.000292
120.16
± 9.03
0.4922
± 0.0526
1.1297
± 0.0039
61.68 + 9.02
- 8.33
1.1544 ± 0.0045 60.39 + 9.28
- 8.50
1.1559 ± 0.0045
MAL 24E UoS-UTh-A166 158.53
± 2.12
11.99
± 0.21
0.024738
± 0.000227
5.99
± 0.18
0.1482
± 0.0044
1.2060
± 0.0028
14.26 + 0.44
- 0.45
1.2144 ± 0.0028 6.65 + 1.11
- 1.04
1.2285 ± 0.0043
MAL Sed1 UoS-UTh-A184
UoS-UTh-A189
0.285538
± 0.001520
n.a. n.a. n.a. n.a.
MAL Sed2 UoS-UTh-A185
UoS-UTh-A190
0.313206
± 0.001536
n.a. n.a. n.a. n.a.
MAL Sed3 UoS-UTh-A186
UoS-UTh-A191
0.304691
± 0.001520
n.a. n.a. n.a. n.a.
All ratios are activity ratios. Analytical errors are at 95 % confidence level.
Age calculation is based on )1(1)()1()()(
234230
230
238
234
238
230
234230230 TTeT
U
UeT
U
Th
where T is the age of the sample.
The degree of detrital 230
Th contamination is indicated by the measured 230
Th/232
Th activity ratio and corrections
were calculated using a 238
U/232
Th activity ratio of 0.8 ± 0.4, except for samples from Maltravieso (MAL) for
which a correction factor of 3.3 ± 0.4 is applied.
234U/
238Uini is the initial
234U/
238U activity ratio.


![Untitled-2 [historiaeatitude.files.wordpress.com] · Dois centros de pesquisa, um americano e outro alemão, ... há 400 mil anos o homem de Neanderthal e o Homo sapiens seguiram](https://img.document.onl/doc/110x75/5be2cbff09d3f284098c56e7/untitled-2-dois-centros-de-pesquisa-um-americano-e-outro-alemao-ha.jpg)